
Abstract
The thermoforming process is a manufacturing method to produce fibre-reinforced thermoplastic components within short cycle times (<2 min). During this process, the anisotropic material behaviour provokes residual stresses which furthermore induce unwanted deformations. Thereby, at the beginning, newly produced geometries have a quite high reject rate and the process parameters have to be adjusted iteratively. Thus, an analysis of the process-induced deformations has been carried out to investigate the connections between process parameters and final geometry. In this case, an L-angle bracket has been observed which shows a spring-in effect after the thermoforming process. For the experimental approach, the semi-crystalline polyphenylenesulphide was used as thermoplastic matrix material. In particular, the crystallisation kinetics of this polymer is described by adjusting Nakamura’s crystallisation model to different cooling rates. And furthermore, a simulation strategy has been developed to include the crystallisation behaviour in a thermal and mechanical analysis. The results of these analyses have been compared and evaluated with the outcomes of the experimental approach. Finally, some opportunities for future studies will be introduced to provide a way for improving the simulation analysis.
Keywords
Introduction
The application of composite materials in the primary load-carrying structures of aerospace components such as the fuselage or wings is the current a ongoing research topic. The advantages of these materials include their specific lightweight properties. However, despite these advantages, the materials’ relatively long manufacturing times lead to high component prices. To accelerate the cycle time, the commonly used thermoset matrix can be replaced by a thermoplastic matrix. Thermoplastic composite materials can be manufactured in a fraction of time by using a thermoforming process, which can be combined with other processes, such as injection moulding. There exists a diverse assortment of different thermoplastic matrix systems, beginning with bulk plastic materials, such as polypropylene (PP), and ending with high-performance systems, such as polyetheretherketone (PEEK). High-performance thermoplastic polymers are durable and can be subjected to temperatures of up to 100℃. However, the relatively high raw material costs are a disadvantage of these polymers. Therefore, a demand exists to understand the thermoforming process in detail and, furthermore, to develop robust processes with lower rejection rates. The general thermoforming process is shown in Figure 1.
Steps of the thermoforming process.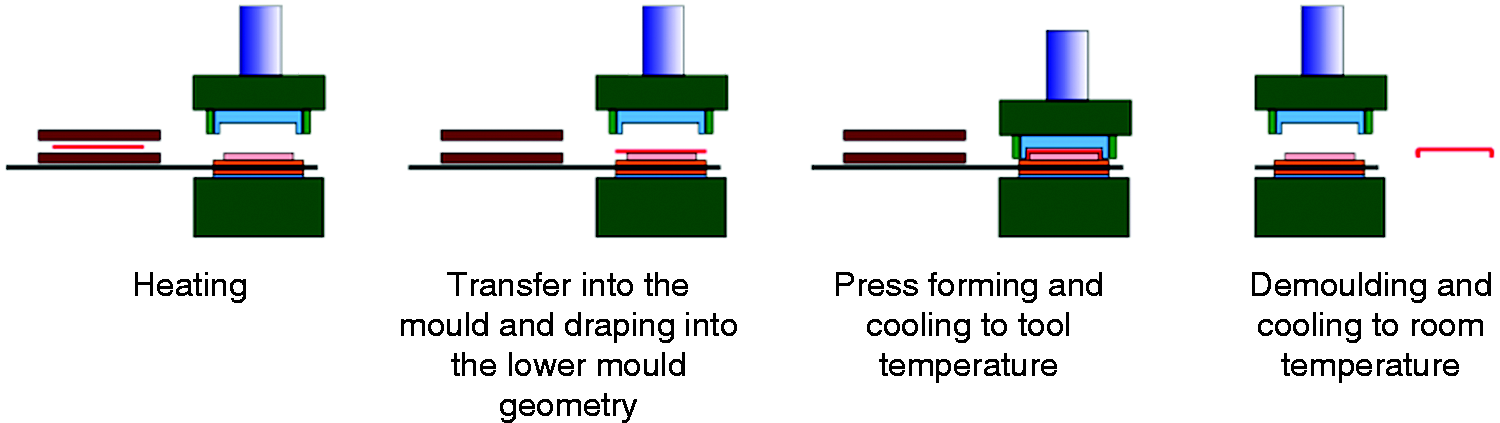
The process starts with a semi-finished part known as a thermoplastic prepreg, which consists of pre-consolidated laminar layers. A pre-cut part from this material is positioned inside a heating field – usually an oven or an infrared heating station – and heated above the melting temperature of the polymer matrix. The melting temperature for high-performance thermoplastic materials such as polyphenylenesulfide (PPS) is approximately 290℃. A rule of thumb states the temperature in the heating field for a semi-crystalline material should be a maximum of 90℃ higher than the melting temperature Tm;
1
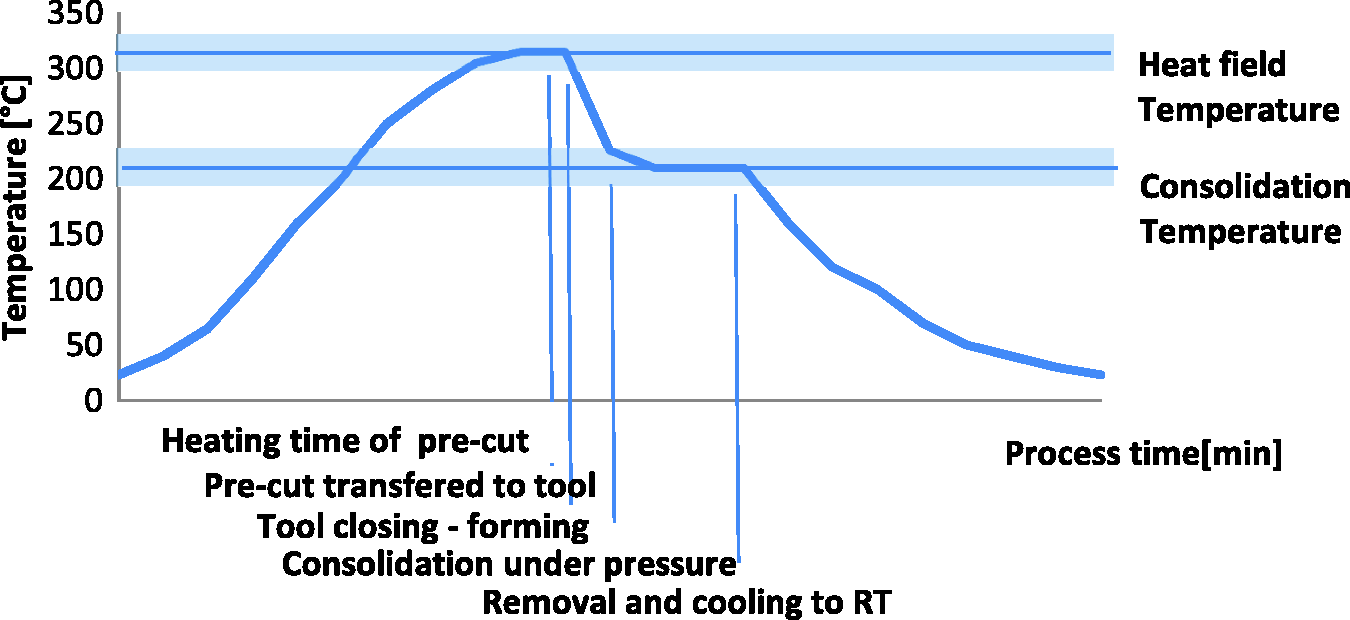
thus, the temperature used in the heating field is approximately 350℃. When the polymer melts, the behaviour of the solid composite sheet changes completely, becoming similar to that of a multilayered flexible textile. This flexible layer package is transferred into the compression mould. In the first step of compression, the textile is draped into the lower mould and begins cooling down immediately when the hot textile contacts the cooler mould surface. In the second step, the consolidation phase starts with the closing of the tool. The textile is pressed into the mould geometry and is consolidated at a high pressure of up to 10 bar to avoid voids and porosities inside the composite part. During this step the part is cooled by the mould to the mould temperature. In the next step, the part is taken out of the mould and cooled to room temperature by free surface convection. Figure 2 shows temperature over the course of processing time across all steps of the thermoforming process.
Temperature profile during the thermoforming process.
1
For most thermoplastic material applications, semi-crystalline materials such as PP, polyamide, PPS or PEEK are used. During cooling these materials begin to develop a crystalline structure based on secondary chemical bonds. The crystallisation can be divided into three phases depending on process parameters such as pressure and cooling rate, and topology parameters such as microstructure and boundary conditions (at the tool). The three phases of crystallisation are as follows:
Nucleation phase Crystalline growth phase Post-crystallisation phase.
During the first phase of crystallisation, nucleation begins. This nucleation can be defined as either homogenous or heterogeneous nucleation. For the composite materials used in this study, which contain a mixture of two components, the fibre and the matrix, there will be heterogeneous nucleation resulting from the fact that the fibres are the initial nuclei.
During the second phase, the crystallisation expands outward from these initial nuclei. The total degree of crystallisation of a semi-crystalline material is based on the cooling rate, melting temperature, chemical configuration, tacticity, molecular weight and pressure.
2
Accordingly, both a total degree of crystallisation,
The third phase of the crystallisation – the post-crystallisation phase – occurs after the manufacturing process, but before the transformation process has finished completely. Post-crystallisation is a long-term process that takes weeks or months and can also influence the part geometry as a result of shrinkage.
The following study focuses on the description of the relative crystallisation behaviour and the formation of process-induced deformations in a carbon-fibre-reinforced composite material with a PPS matrix. In the first part, different crystallisation theories are introduced and compared with differential scanning calorimetry (DSC) experiments. In the second part, shear rheometer experiments are performed and the development of the shear modulus is compared with the degree of crystallisation to identify the relationship between these two quantities.
In the third part, constitutive equations are derived from the experimental investigations and implemented via user subroutines into the implicit finite-element programme SAMCEF/MECANO. This material model is used for an application test case to compute the process-induced deformations, specifically, the spring-in of an L-angle bracket.
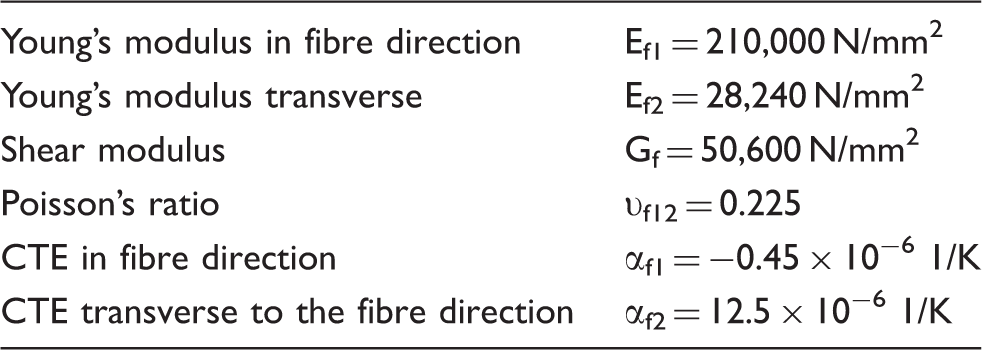
Material characterisation
Composite properties for PPS CF at RT/50%. 4
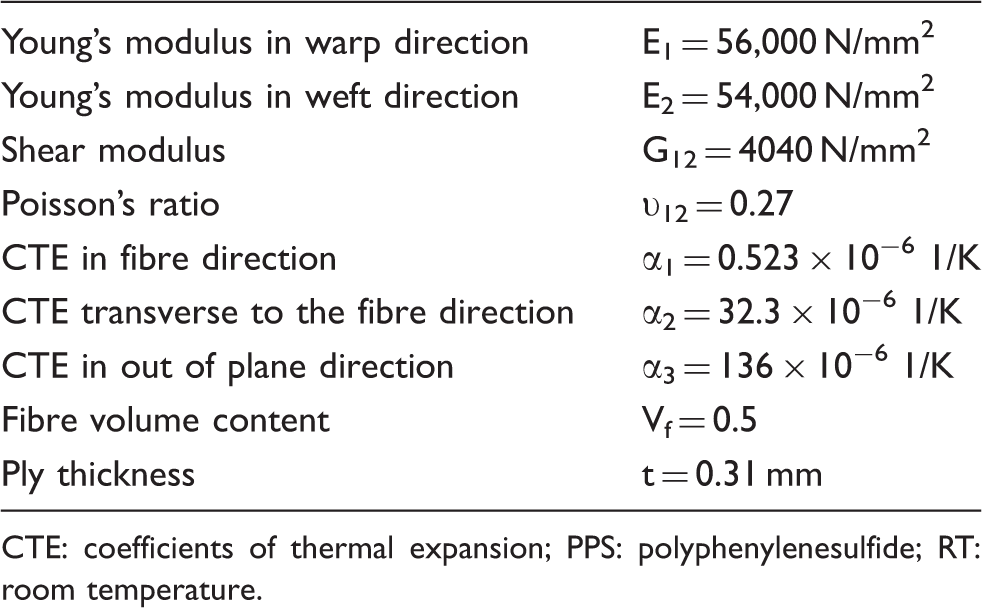
CTE: coefficients of thermal expansion; PPS: polyphenylenesulfide; RT: room temperature.
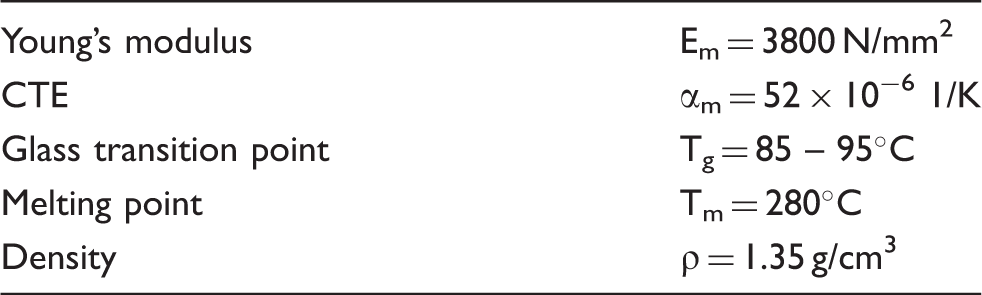
Matrix properties for PPS. 4
Fibre properties for T300 HS. 5
Crystallisation kinetics
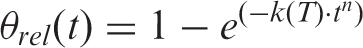
A crystallisation process that occurs during a transition from a liquid into a solid state at an evaluated temperature can be described using generalised empirical rate equations or mechanistic models. Mechanistic models describe the crystallisation process at an atomic scale by examining the growing macromolecules. The empirical rate approach derives a phenomenological mathematical description of the process from the results of experimental studies using DSC. Using this method, the endothermic heat flow is measured and interpreted with respect to the assumption that the heat flow is proportional to the relative crystallisation. The relative crystallisation
In the literature, most approaches are derived from the Avrami equation, which was introduced by Avrami,6–8 for isothermal conditions
In this equation, 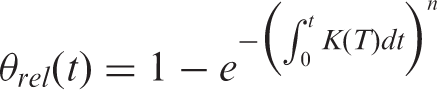
In this equation, 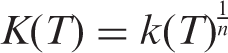
By observing the relations in equations (2) and (3), it can be seen that the constant 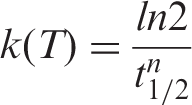
The Nakamura equation is a modification of the Avrami equation under the assumption of ‘isokinetic’ conditions. Therefore, equations (5) and (6) are valid within a temperature range where the ratio between the secondary nucleation growth rate and the primary nuclei activation frequency is constant
12
Analysed crystallisation behaviour
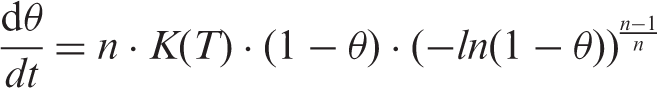
To determine crystallisation kinetic parameters to fit all situations during cooling, DSC experiments were performed using a DSC Q2000 from TA Instruments. A small probe (approximately 13 mg) was taken from the composite material. During crystallisation, the fibres serve as initial nuclei and thereby influence the formation of the crystalline network. The composite material was therefore used directly as the sample material and a mass correction was performed to consider only the matrix component. The material was positioned in the DSC oven and heated to 30℃ above melting temperature (Tm = 280℃), i.e. to a final temperature of Tmax = 310℃, which was realised by a heating rate of 1 K/min. The sample was held for 5 min at isothermal conditions to ensure that it was completely melted. Afterwards, the sample was cooled down at various rates: 1, 10, 25 and 50 K/min. Each measurement was repeated three times and the average values are presented in this work. Figure 3 shows schematically one result of the measured heat flow as a function of temperature.
Schematic diagram of a DSC analysis for a thermoplastic composite.
The exothermal heat flow peak that occurs during the cooling process can be integrated over a sigmoidal baseline. Figure 4 shows the relative degrees of crystallisation as a function of temperature for different cooling rates.
Diagram of relative crystallisation according to different constant cooling rates.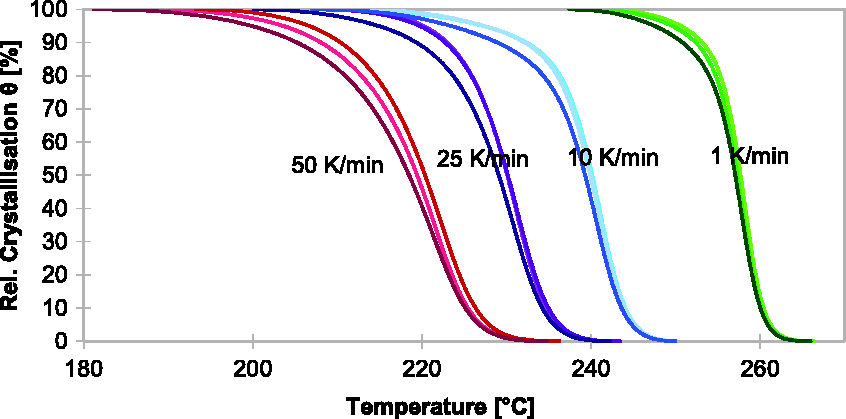
Wijskamp 13 presents the assumption that a material starts to behave as a solid after the relative crystallisation exceeds 50%. This transition point is denoted as the solidification point and is important for the computation of process-induced deformations because after a material passes this point, thermal loads caused by the cooling process can induce deformations. It can be observed that the solidification point shifts to lower temperatures for faster cooling rates (Figure 4). For the examined material, the shift in the solidification point is approximately 37.9℃ as the cooling rate is varied from 1 to 50 K/min. This implies a reduction of approximately 16% in the thermal load as the cooling rate is varied from 1 to 50 K/min. In the industrial process, the cooling rates are much faster, up to 200 K/s, because the thermal mass of the composite is small compared to the thermal mass of the tool. Unfortunately, the DSC method used in this study is limited to a maximum cooling rate of 50 K/min. In the literature, researchers including Wijskamp 13 and Mubarak et al. 2 have also used the DSC method with cooling rates much lower than the industrial process conditions. Thus, it is questionable if the crystallisation kinetics from the slow-cooling-rate experiment (with a maximum cooling rate of 50 K/min) can be extrapolated to describe the real process (with a cooling rate up to 200 K/s). Further research is needed using faster experimental methods such as Flash DSC (FDSC). Recent studies14–16 show the potential of high-speed DSC to detect different effects during polymer crystallisation. At this point, some possibilities for further research using FDSC methods should be mentioned, such as the quantification of small amounts of amorphous fractions in crystalline samples, the representation of ‘real-life’ polymer processes and the detection of nucleation growth during non-isothermal solidification for time-resolved multiphase crystallisations.
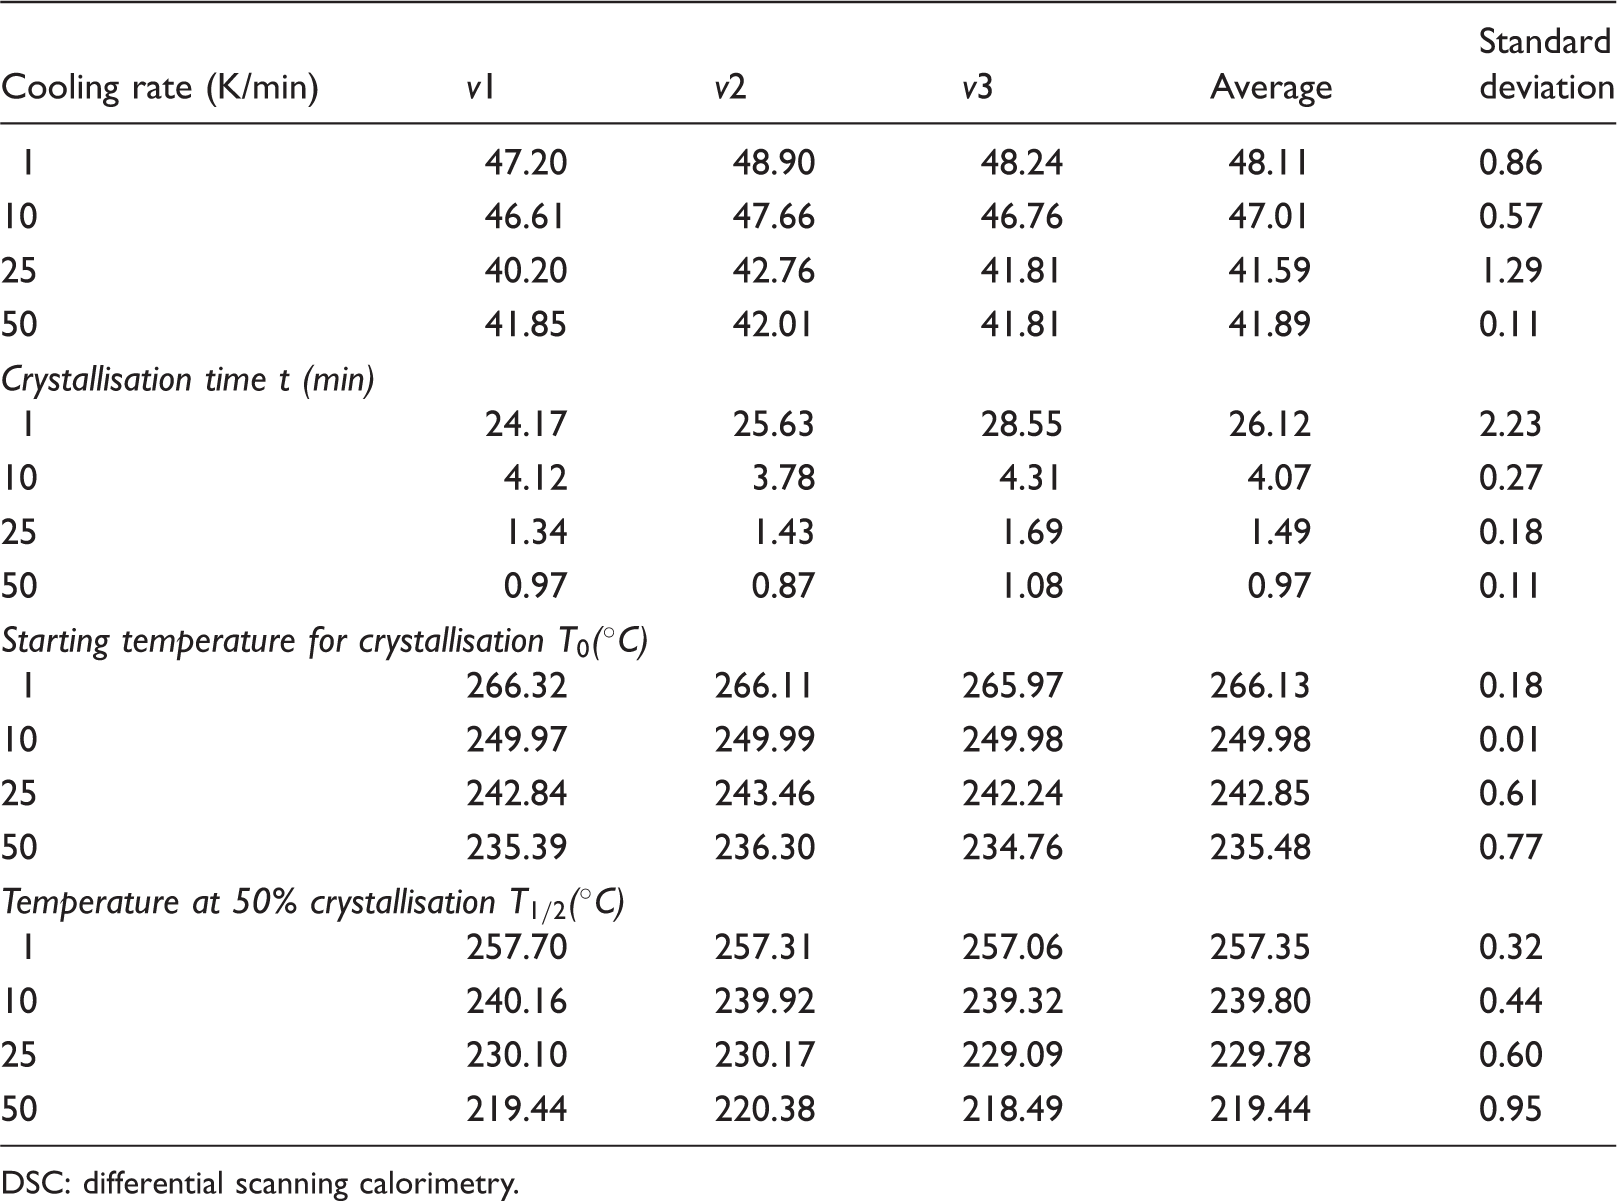
Table 4 summarises for different cooling rates the measured enthalpy, crystallisation time, starting temperature of crystallisation and the temperature at which 50% relative crystallisation was observed. These experimental data can be used to derive the crystallisation half-time. Fitting the experimental data to an exponential function allows the crystallisation half-time for higher cooling rates to be predicted. Figure 5 shows the crystallisation half-time as a function of cooling rate.
Dependence of crystallisation half-time on cooling rate. Results from the DSC analysis for different cooling rates. DSC: differential scanning calorimetry.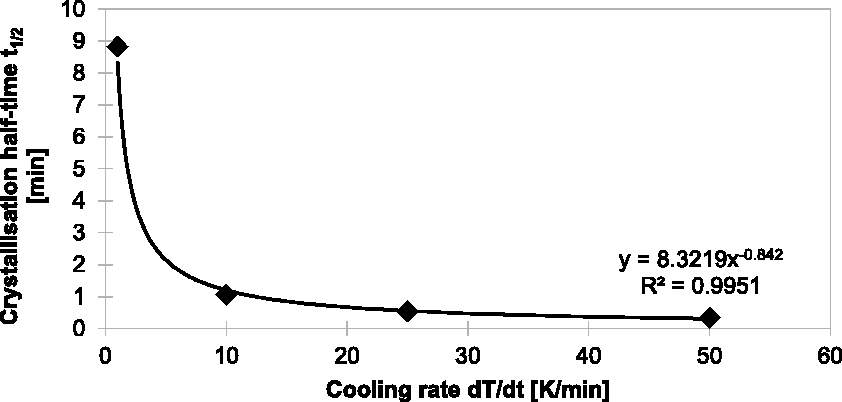
Using this description of the crystallisation half-time and the approach of Nakamura (equations (2) to (6)), a set of parameters was determined to describe the dependence of the crystallisation kinetics on the cooling rate in the range of 1–50 K/min (Figure 6).
Diagram of relative crystallisation growth and crystallisation kinetics.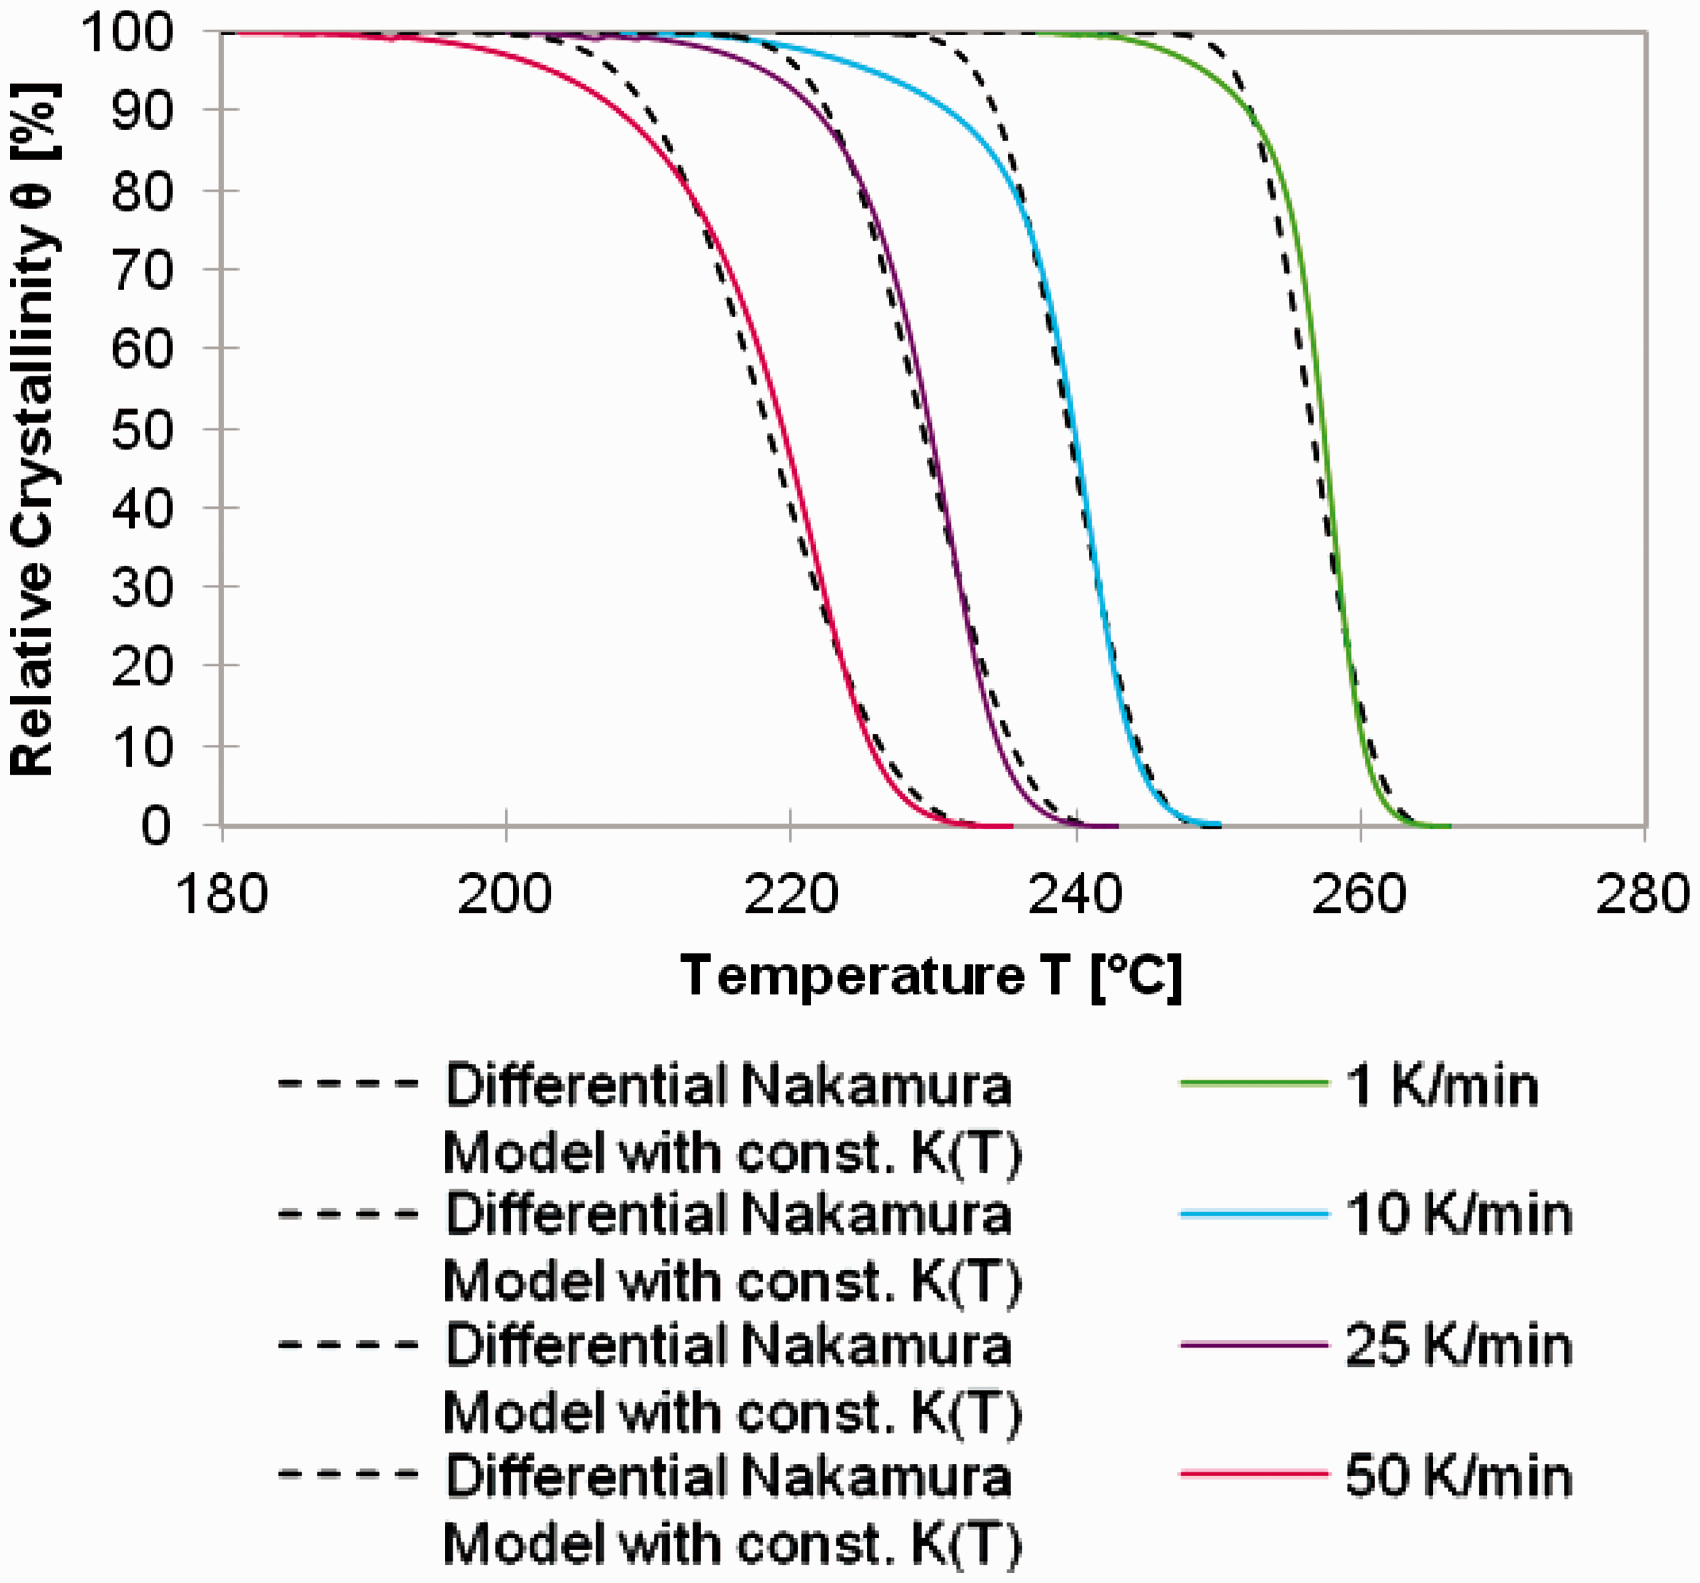
Mechanical behaviour during crystallisation
As has been described, the mechanical behaviour of the matrix changes during crystallisation from a liquid/viscous phase to an elastic solid. To verify the transformation from the liquid state to a solidified state of neat PPS during the crystallisation, the results of DSC and plate-plate rheometer experiments were compared. An important question is the dependence of the matrix modulus development on the relative crystallisation. To answer this question, shear rheological measurements were obtained using a plate-to-plate method with a frequency of 1 Hz and an amplitude of 0.05% strain. Three tests were completed for non-isothermal conditions at constant heating rate of 5 K/min.
Figure 7 shows the relationship between the DSC and rheometer experimental results. The peak of the normalised heat flow characterises the crystallisation process. The upper point identifies the temperature at which a relative crystallisation of 50% is reached. At this temperature, the viscosity increases rapidly, also resulting in the value of stiffness growing rapidly. This effect was reproducible for other cooling rates that were examined. In summary, this analysis verifies that the assumption of Wijskamp,
13
defining the point of 50% relative crystallisation as the solidification point, is sufficient.
Comparison of analysed crystallisation and viscosity growth for the neat polymer (PPS).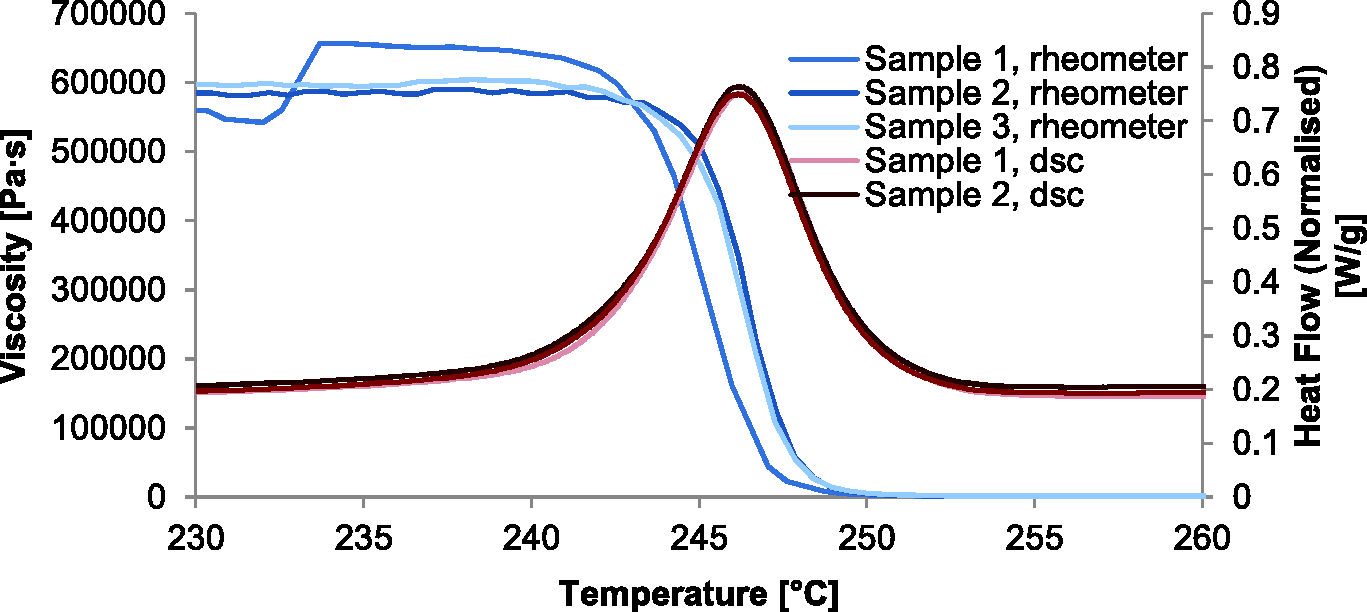
Based on this experiment, the dependence of the matrix modulus on relative crystallisation was derived. Taking together the assumption of Wijskamp and the linear dependency of the matrix modulus on the degree of crystallisation for relative crystallisation values greater than 0.5, the following equations were implemented
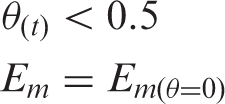
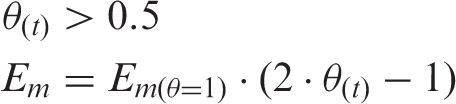
Figure 8 illustrates the dependence of the resin modulus on the relative crystallisation.
Growing thermoplastic matrix modulus according to the relative crystallinity.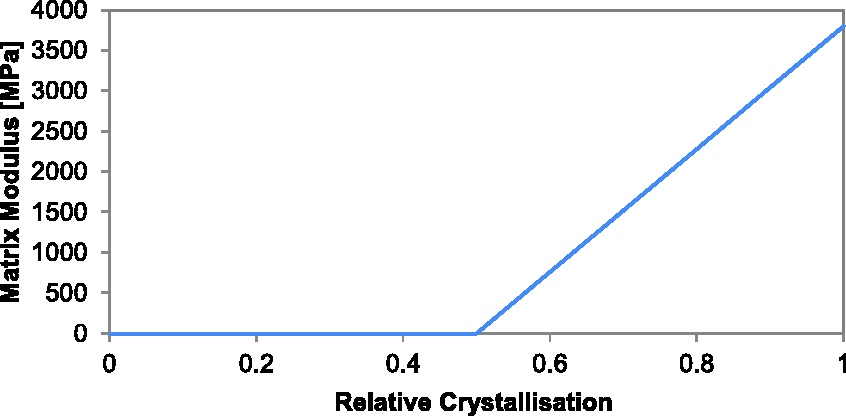
Simulation strategy and material model
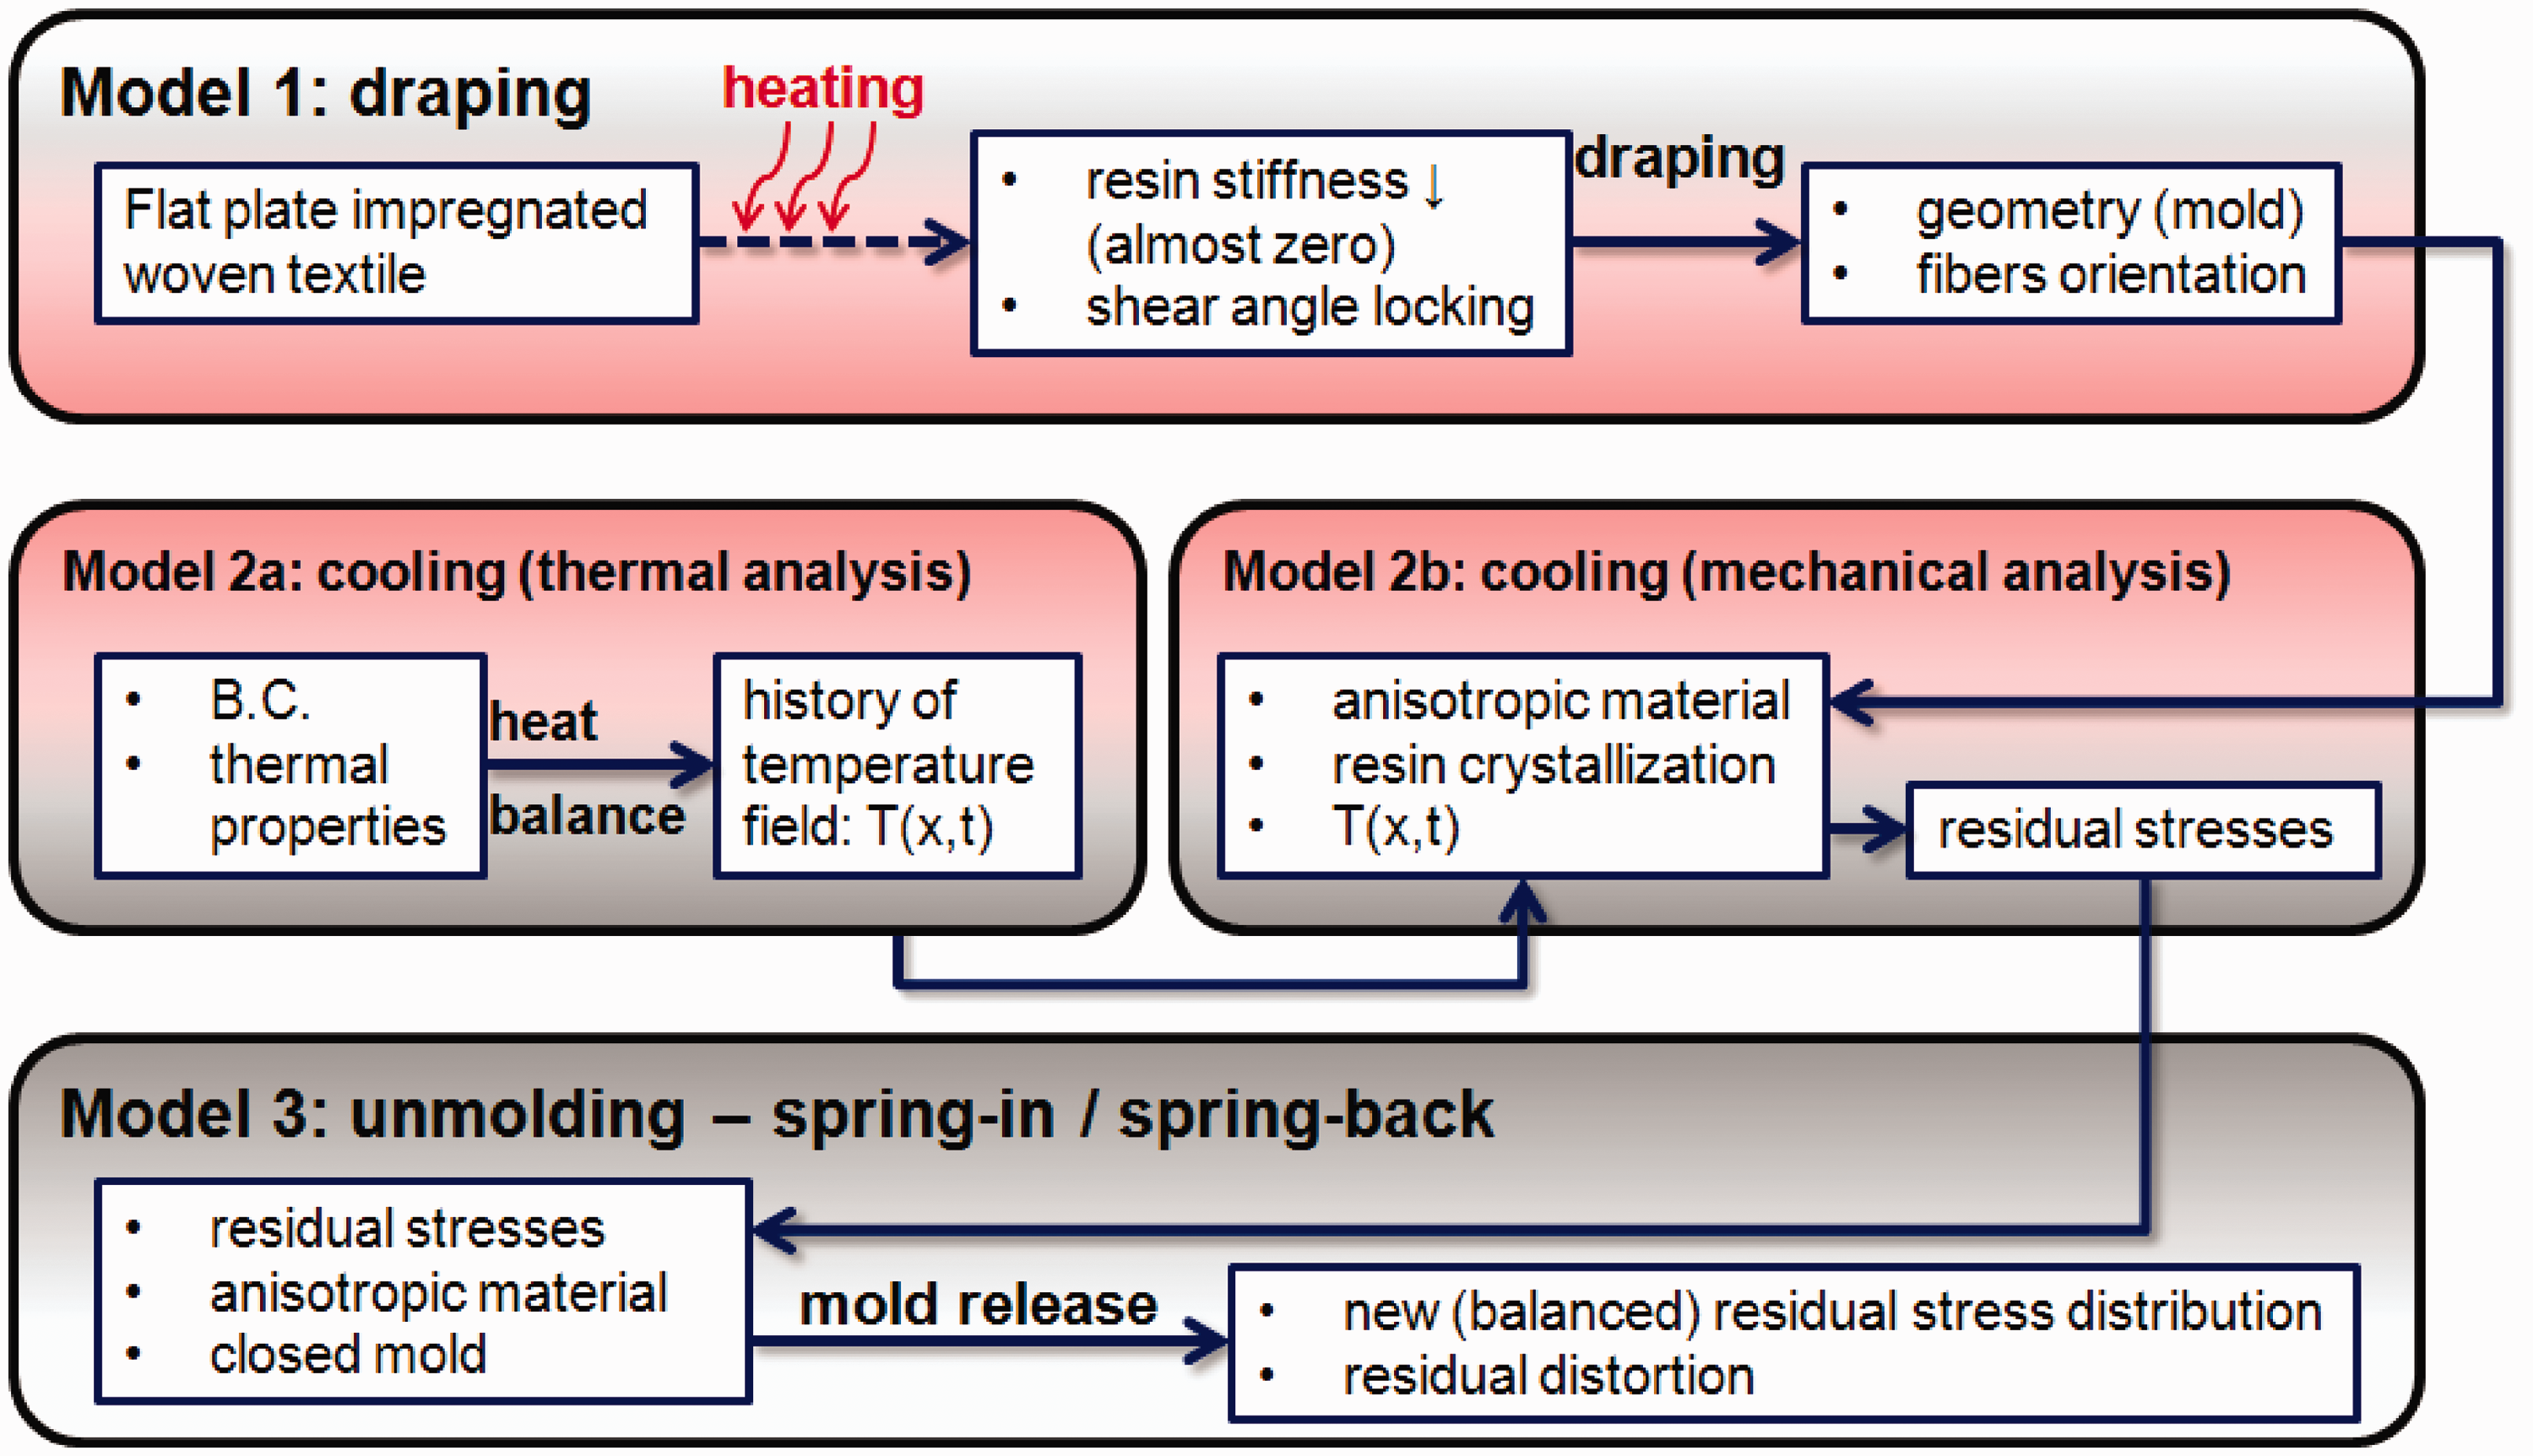
The objective of this study is an approach to compute process-induced deformation based on crystallisation kinetics. This approach is necessary if the point of solidification is unknown, which could result from inhomogeneities such as unknown temperature distributions and cooling rates in the tool itself. Therefore, the following simulation strategy is applied to this problem using a sequentially coupled thermo-mechanical analysis (Figure 9).
Simulation strategy – a sequential coupled thermo-mechanical analysis.
17
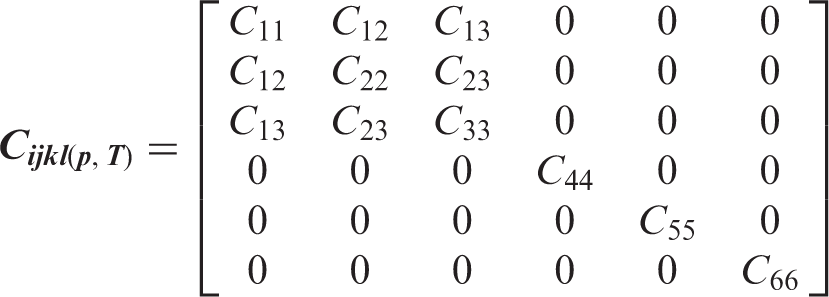
The material model should capture all relevant variations in material parameters to represent the material behaviour. This material can be idealised as a transversely isotropic material with nine relevant material parameters. The second derivative of the deformation energy by the deformation is the material tensor, which can be written as follows
The main factors for process-induced deformations are the chemically and thermally induced strains. Thus, incremental formulations for these strains are defined and added to the mechanical strain

The thermally induced strains, are based on the coefficents of thermal expansions (CTE) determined by the presented homogenisation approach (equations (22) to (23)) and the thermal gradient

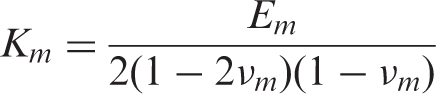
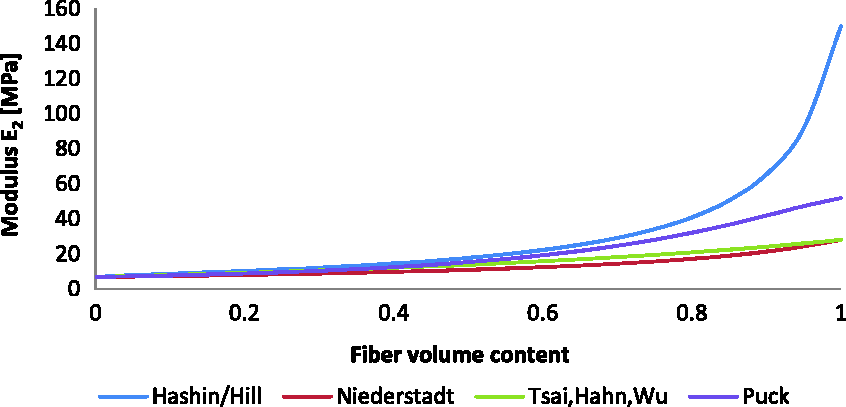
To account for the variations in the matrix properties, homogenisation methods can be applied. Micromechanical approaches for homogenising the Young’s moduli are primarily analytical rules for mixtures based on application of the Voigt model in the fibre direction and the Reuss model transverse to the fibre direction. The Voigt model is derived from the assumption that the fibre and the matrix can be treated as an arrangement of parallel springs. The Reuss model describes serial connections affecting the fibre and matrix stiffness. The following basic restrictions must be fulfilled to apply these approaches. The lamina must be macroscopic, homogeneous, linearly elastic and initially stress free. The fibres must be homogeneous, linearly elastic, isotropic, regularly spaced and perfectly aligned. The matrix must be homogeneous, linearly elastic and isotropic. It is apparent that restrictions such as the absence of initial stresses in the lamina and linearly elastic behaviour for the resin are not fulfilled. Additionally, the fibre-volume fraction changes due to thermal expansion and shrinkage. The magnitude of this change is approximately 2–3%. The solution for this dilemma might be incremental computation of the homogenised properties. As expected, the composite transverse modulus depends strongly on resin behaviour while fibre-direction properties are affected to a much lesser extent. In the literature, different micromechanical approaches for the transverse properties are available.
As shown in Figure 10, the difference between the approaches is quite significant, especially for large fibre-volume fractions. It must be mentioned that the maximum value for squared-fibre packing is approximately 0.785 and that for hexagonal packing is 0.90. By analysing the different approaches it can be observed that the approach of Hashin/Hill estimates the highest values for the transverse Young's modulus, and the values for the plane modulus are also conservatively high. Thus, the theories of Hashin/Hill are chosen. Hashin first defined moduli for the hydrostatic fibres and the matrix
Comparison between different analytical homogenisation approaches for the transverse modulus.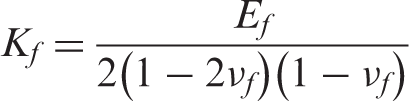
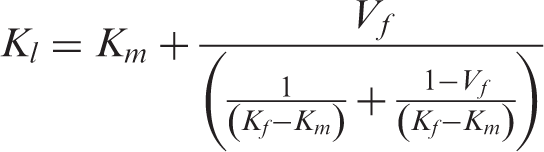
These are used to determine the lateral bulk modulus
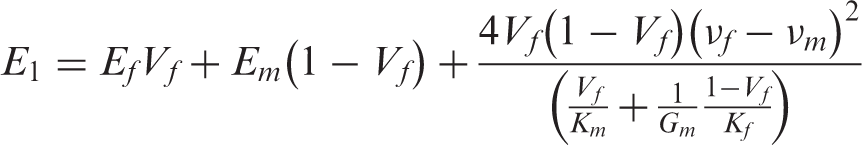
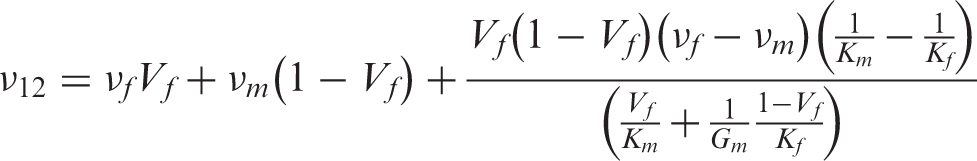
For an orthotropic material idealisation, nine elastic coefficients can be successively derived from the following equations
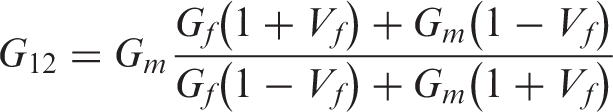
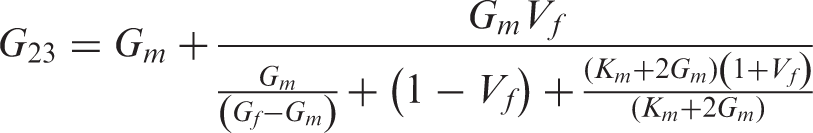
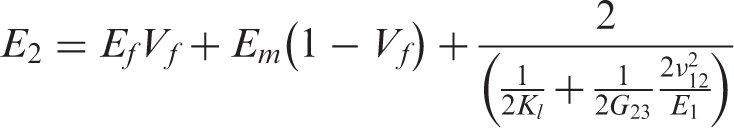
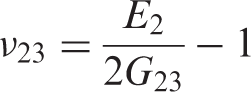
In case of transverse isotropy, the following assumptions can be used

Similar to the engineering constants, the coefficients of thermal expansion (CTE),
In the transverse direction, the thermal expansion of the compound is matrix dominated. The theoretical fundamentals of this system are based on a row-linking connection. Using the assumption that the CTE of the matrix is not crystallisation dependent, the micromechanical model can be defined in the simplest possible way. In the transverse and longitudinal directions, the following equations from Schürmann
5
are chosen
Application test case
Clips that connect the frames and stringers with the fuselage skin on the Airbus A350 XWB are one example application of a thermoplastic-reinforced composite structure. The Faserinstitut Bremen e.V. has been investigating the thermoforming and clip-forming process in particular for several years and has supplied clips for the A350 static test barrel. Thus far, the topics of research have been process automation, process control through temperature-controlled tools and the influence of post-forming on clip geometry. Using this experience, a generic test has been chosen to validate the developed model.
Description of the experimental test
The objective of the present study is to apply the simulation method to analyse the process-induced deformations of an L-angle bracket. The test structure has edge lengths of 200 and 60 mm with a profile depth of 70 mm. The tempered tool consists of steel and has different and flexibly adjustable heating and cooling channels (Figure 11). The tooling angle is 92° and takes into account the spring-in effect because the final angle of the L bracket is intended to be approximately 90°.
Composite part, heated press and tempered mould.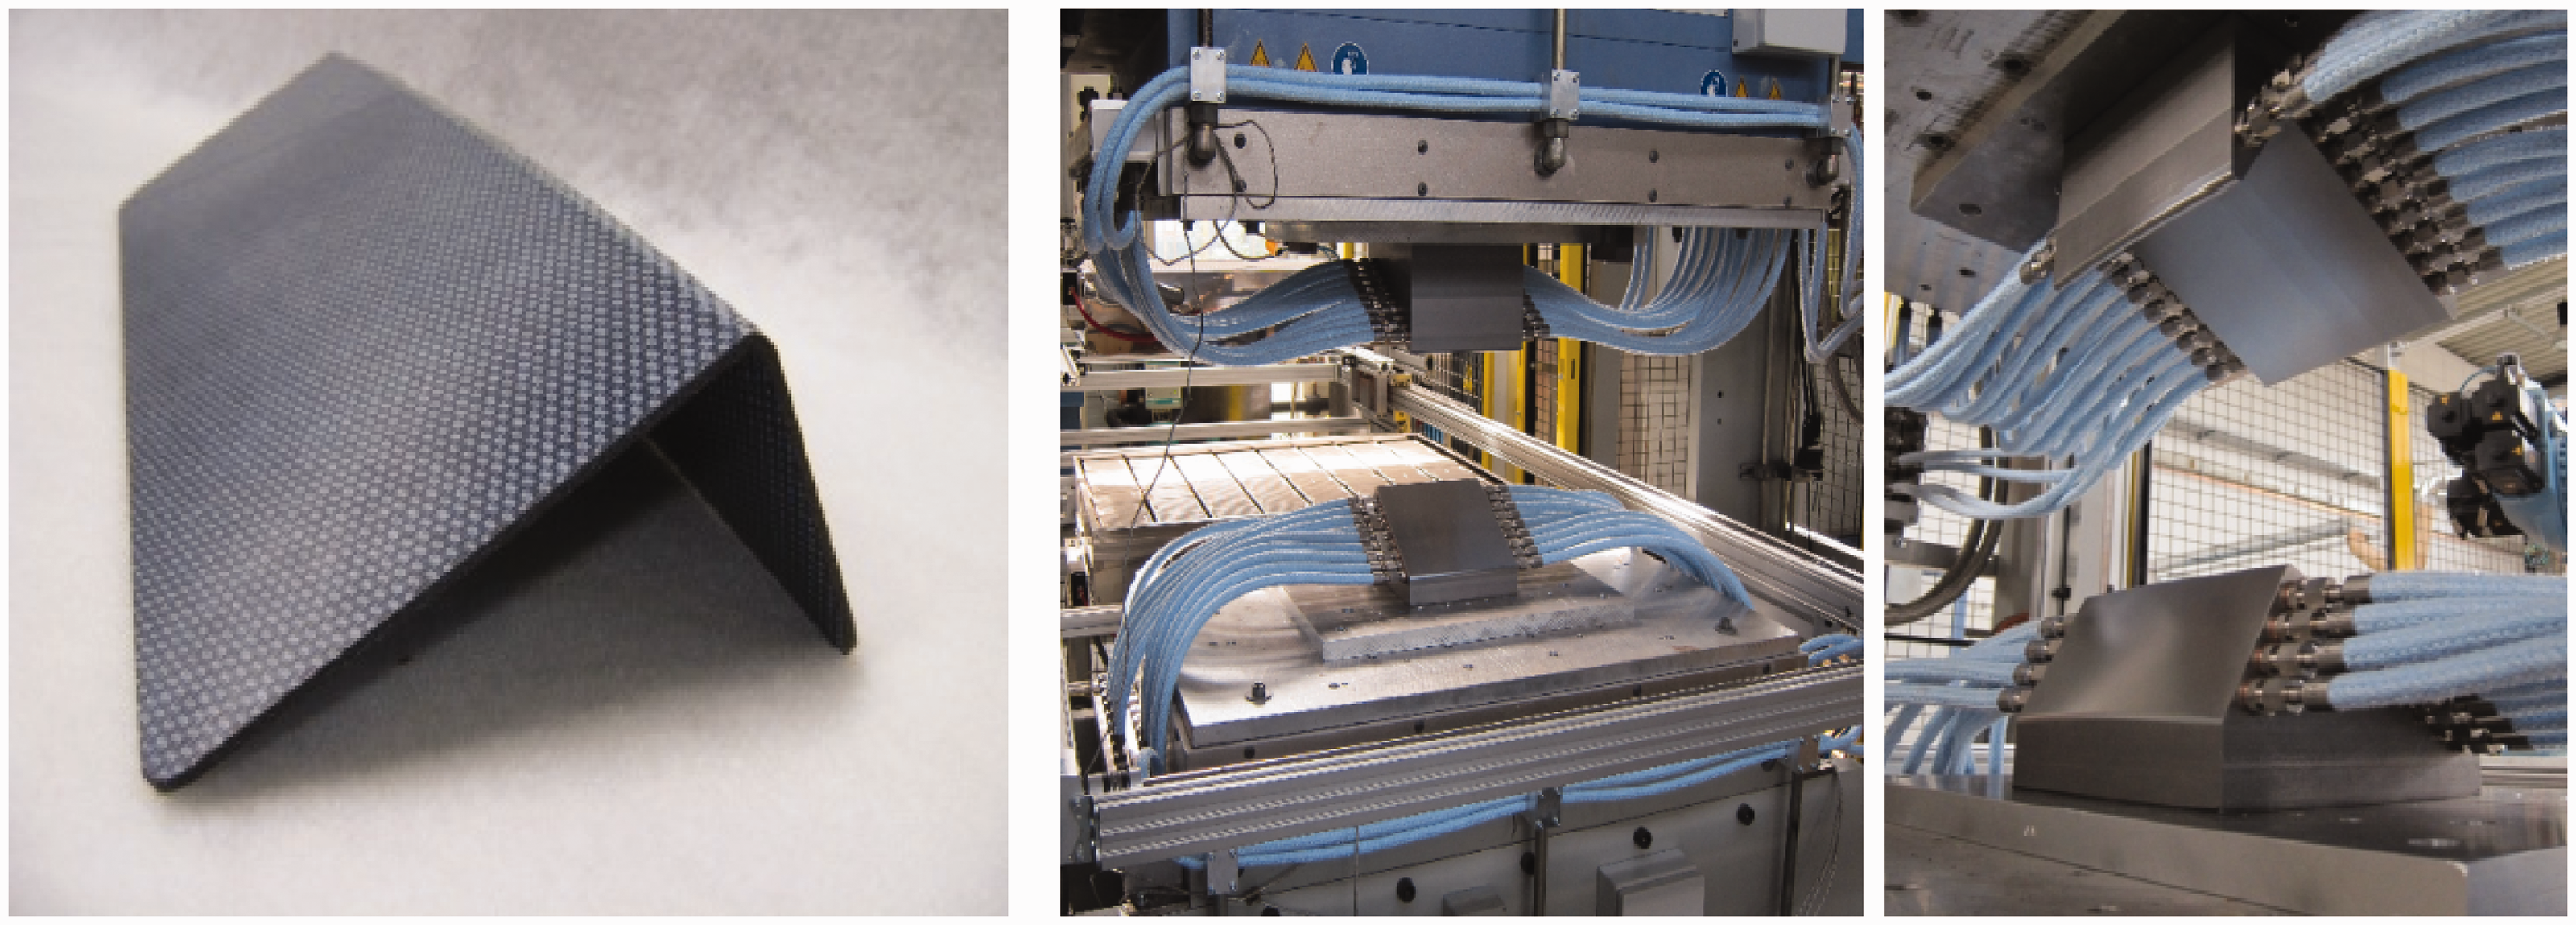
The function of this specially designed tool is to produce brackets with slightly different angles. Therefore, the process – with respect to the temperature control – has been investigated to determine the relationship between the cooling process and the final composite deformation. The results can be used to validate the material model that is to be used for the simulation.
Description of the FE model
Starting from an imported Computer-aided design (CAD) model, the finite element (FE) model was built up with a volume mesh using tetrahedral volume elements for the tool and hexahedral volume elements for the composite part (Figure 12).
Modelled composite part inside the mould.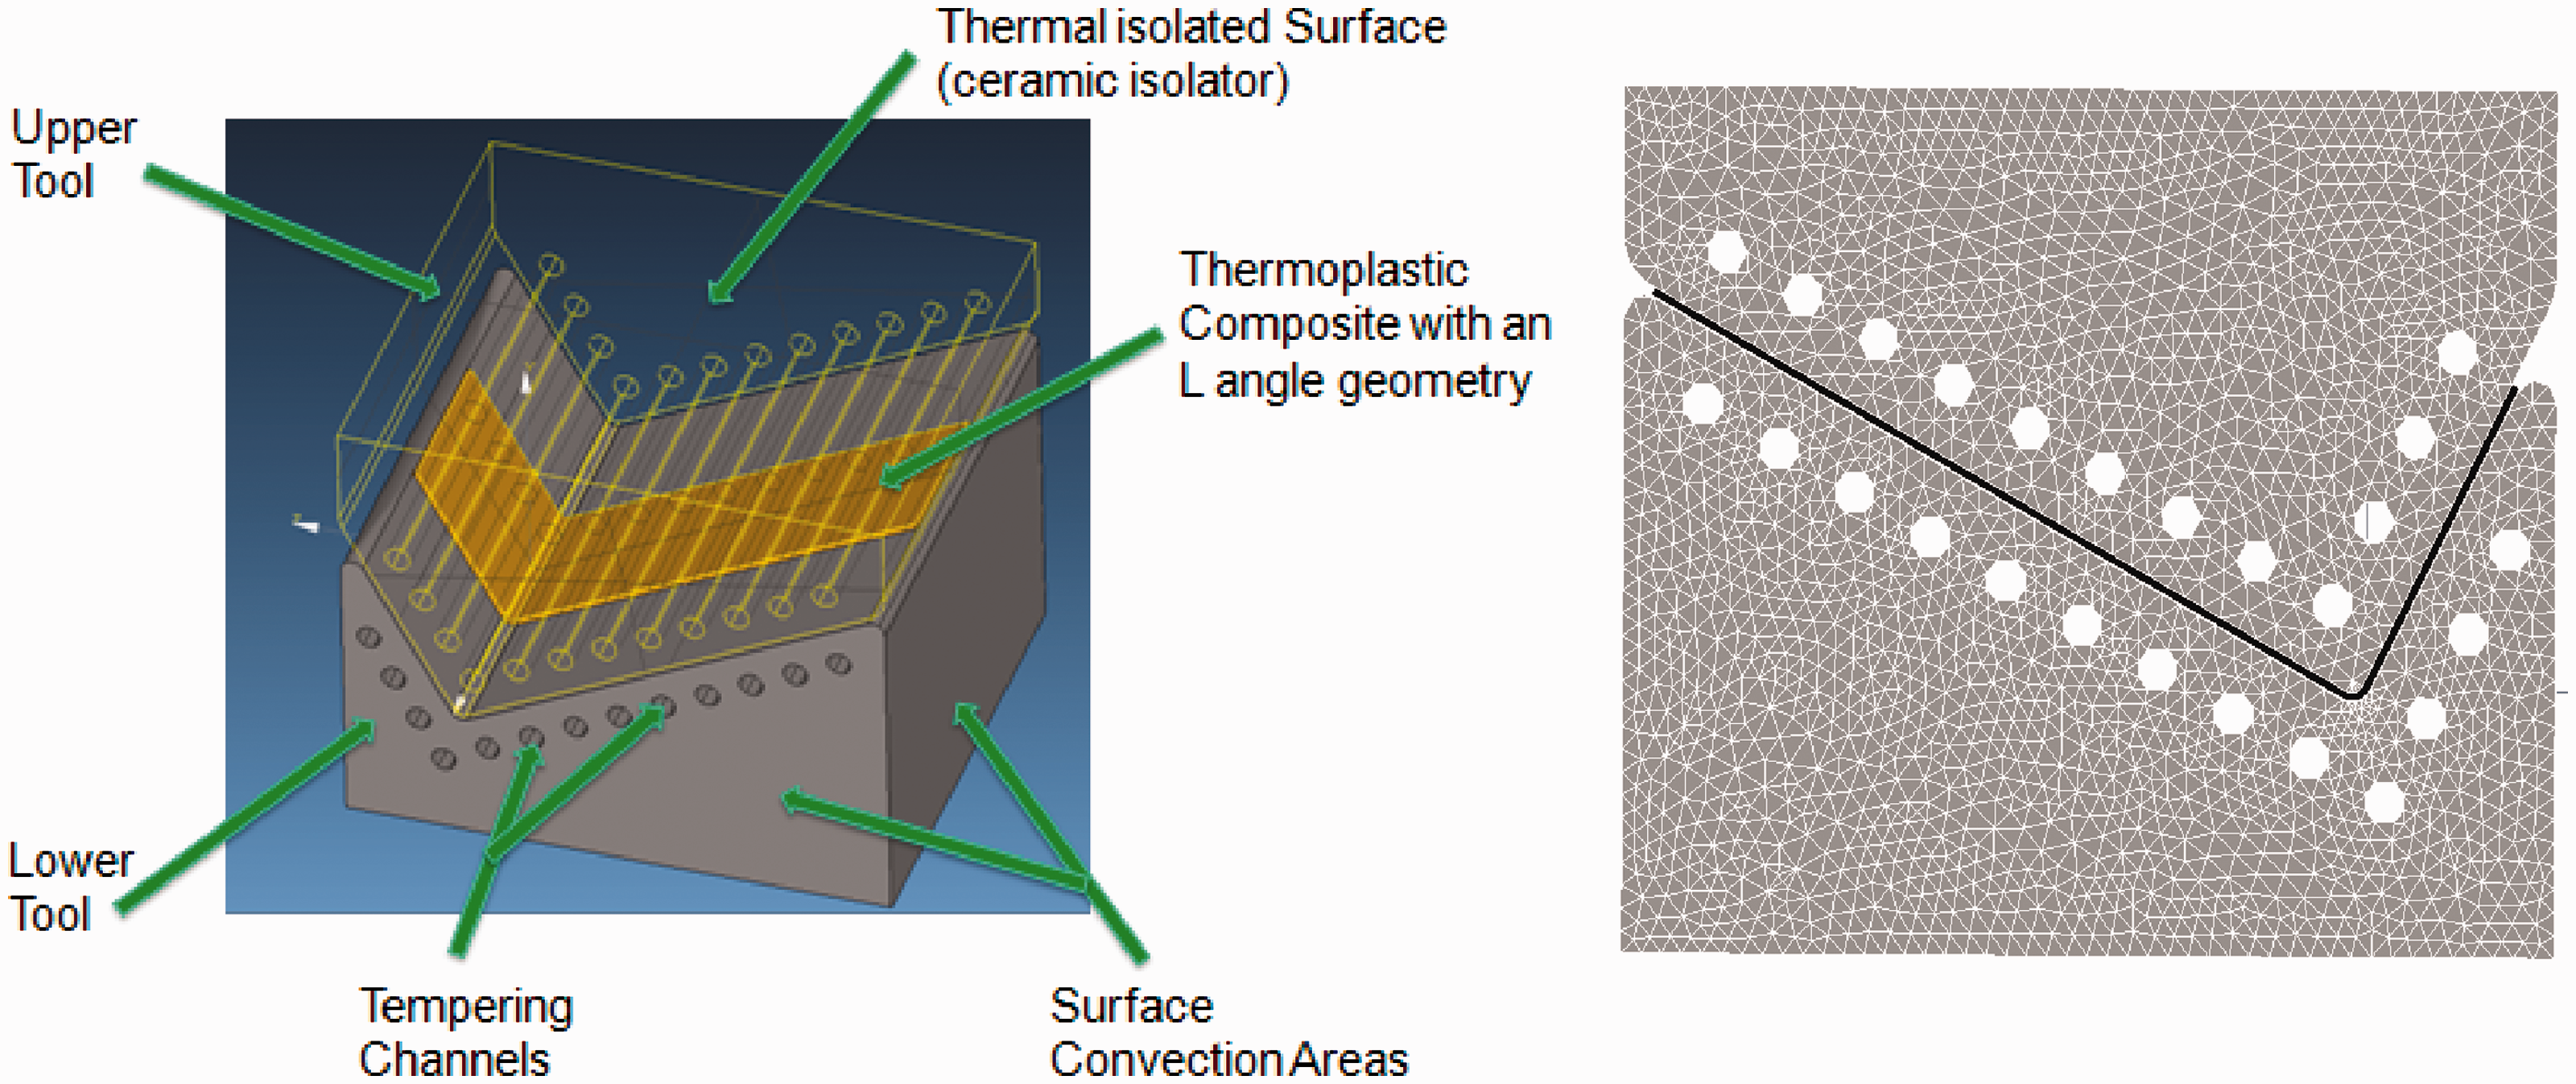
As a boundary condition, a temperature profile (Figure 13) was applied on the thermal oil channels of the mould. In practice, the thermoformed composite part is held for less than 1 min inside the tool at a defined temperature, after which it is demoulded and begins cooling down to room temperature within 10 min. On the outer surfaces of the mould a natural convection was applied with a convection coefficient of 20 W/m2 and a fluid temperature of 20℃. The upper and lower sides of the tool are isolated. Thus, in this area, no convection is assumed for the thermal analysis.
Thermal boundary conditions.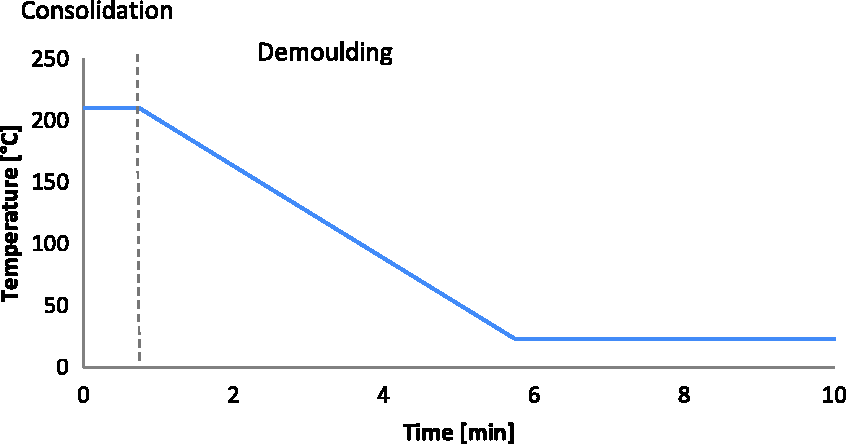
The mechanical FE model was simplified to a composite volume structure without any additional tooling model. The laminate stacking is a quasi-isotropic orientation that consists of a seven-layered woven fabric [(0,90)/(±45)]3/(0,90). The stacking of the laminate is balanced and symmetrical, and there is thus no lay-up induced deformation (Figure 14).
FE discretisation of the composite part for the mechanical analysis.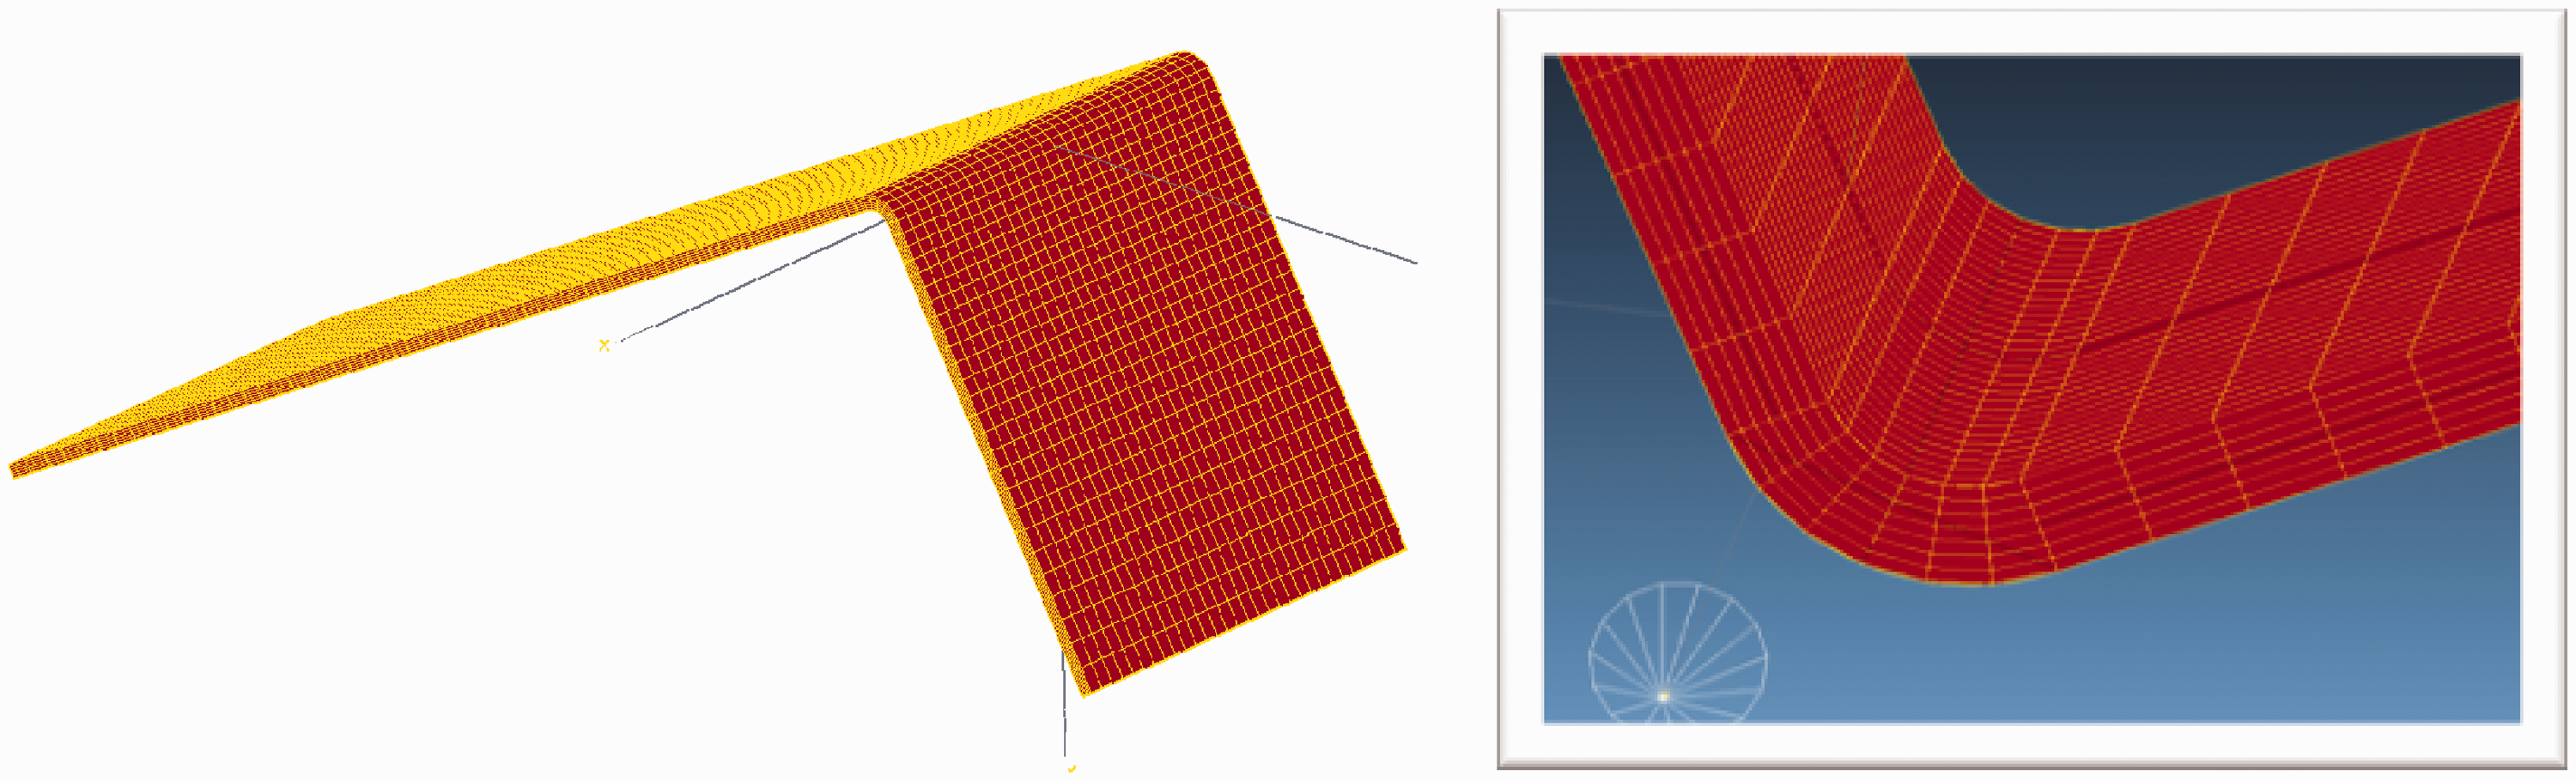
To minimise reaction forces, the model was clamped at one node at the end of the longer side of the L-angle bracket.
Numerical results
The results of the thermal and mechanical analyses are presented below. In the thermal analysis, the initial temperature for the composite part is much higher than the tool temperature. In practice, the composite is heated above the melting temperature to 320℃ and is deposited inside the fast-closing mould. This deposition procedure is carried out within 2 s, and any cooling effects during the mould closing can therefore be neglected, with the thermal analysis starting with the heated composite part inside the closed mould (Figure 15).
Initial thermal condition – temperature difference between the mould and the composite part displayed on a cut in the middle of the mould.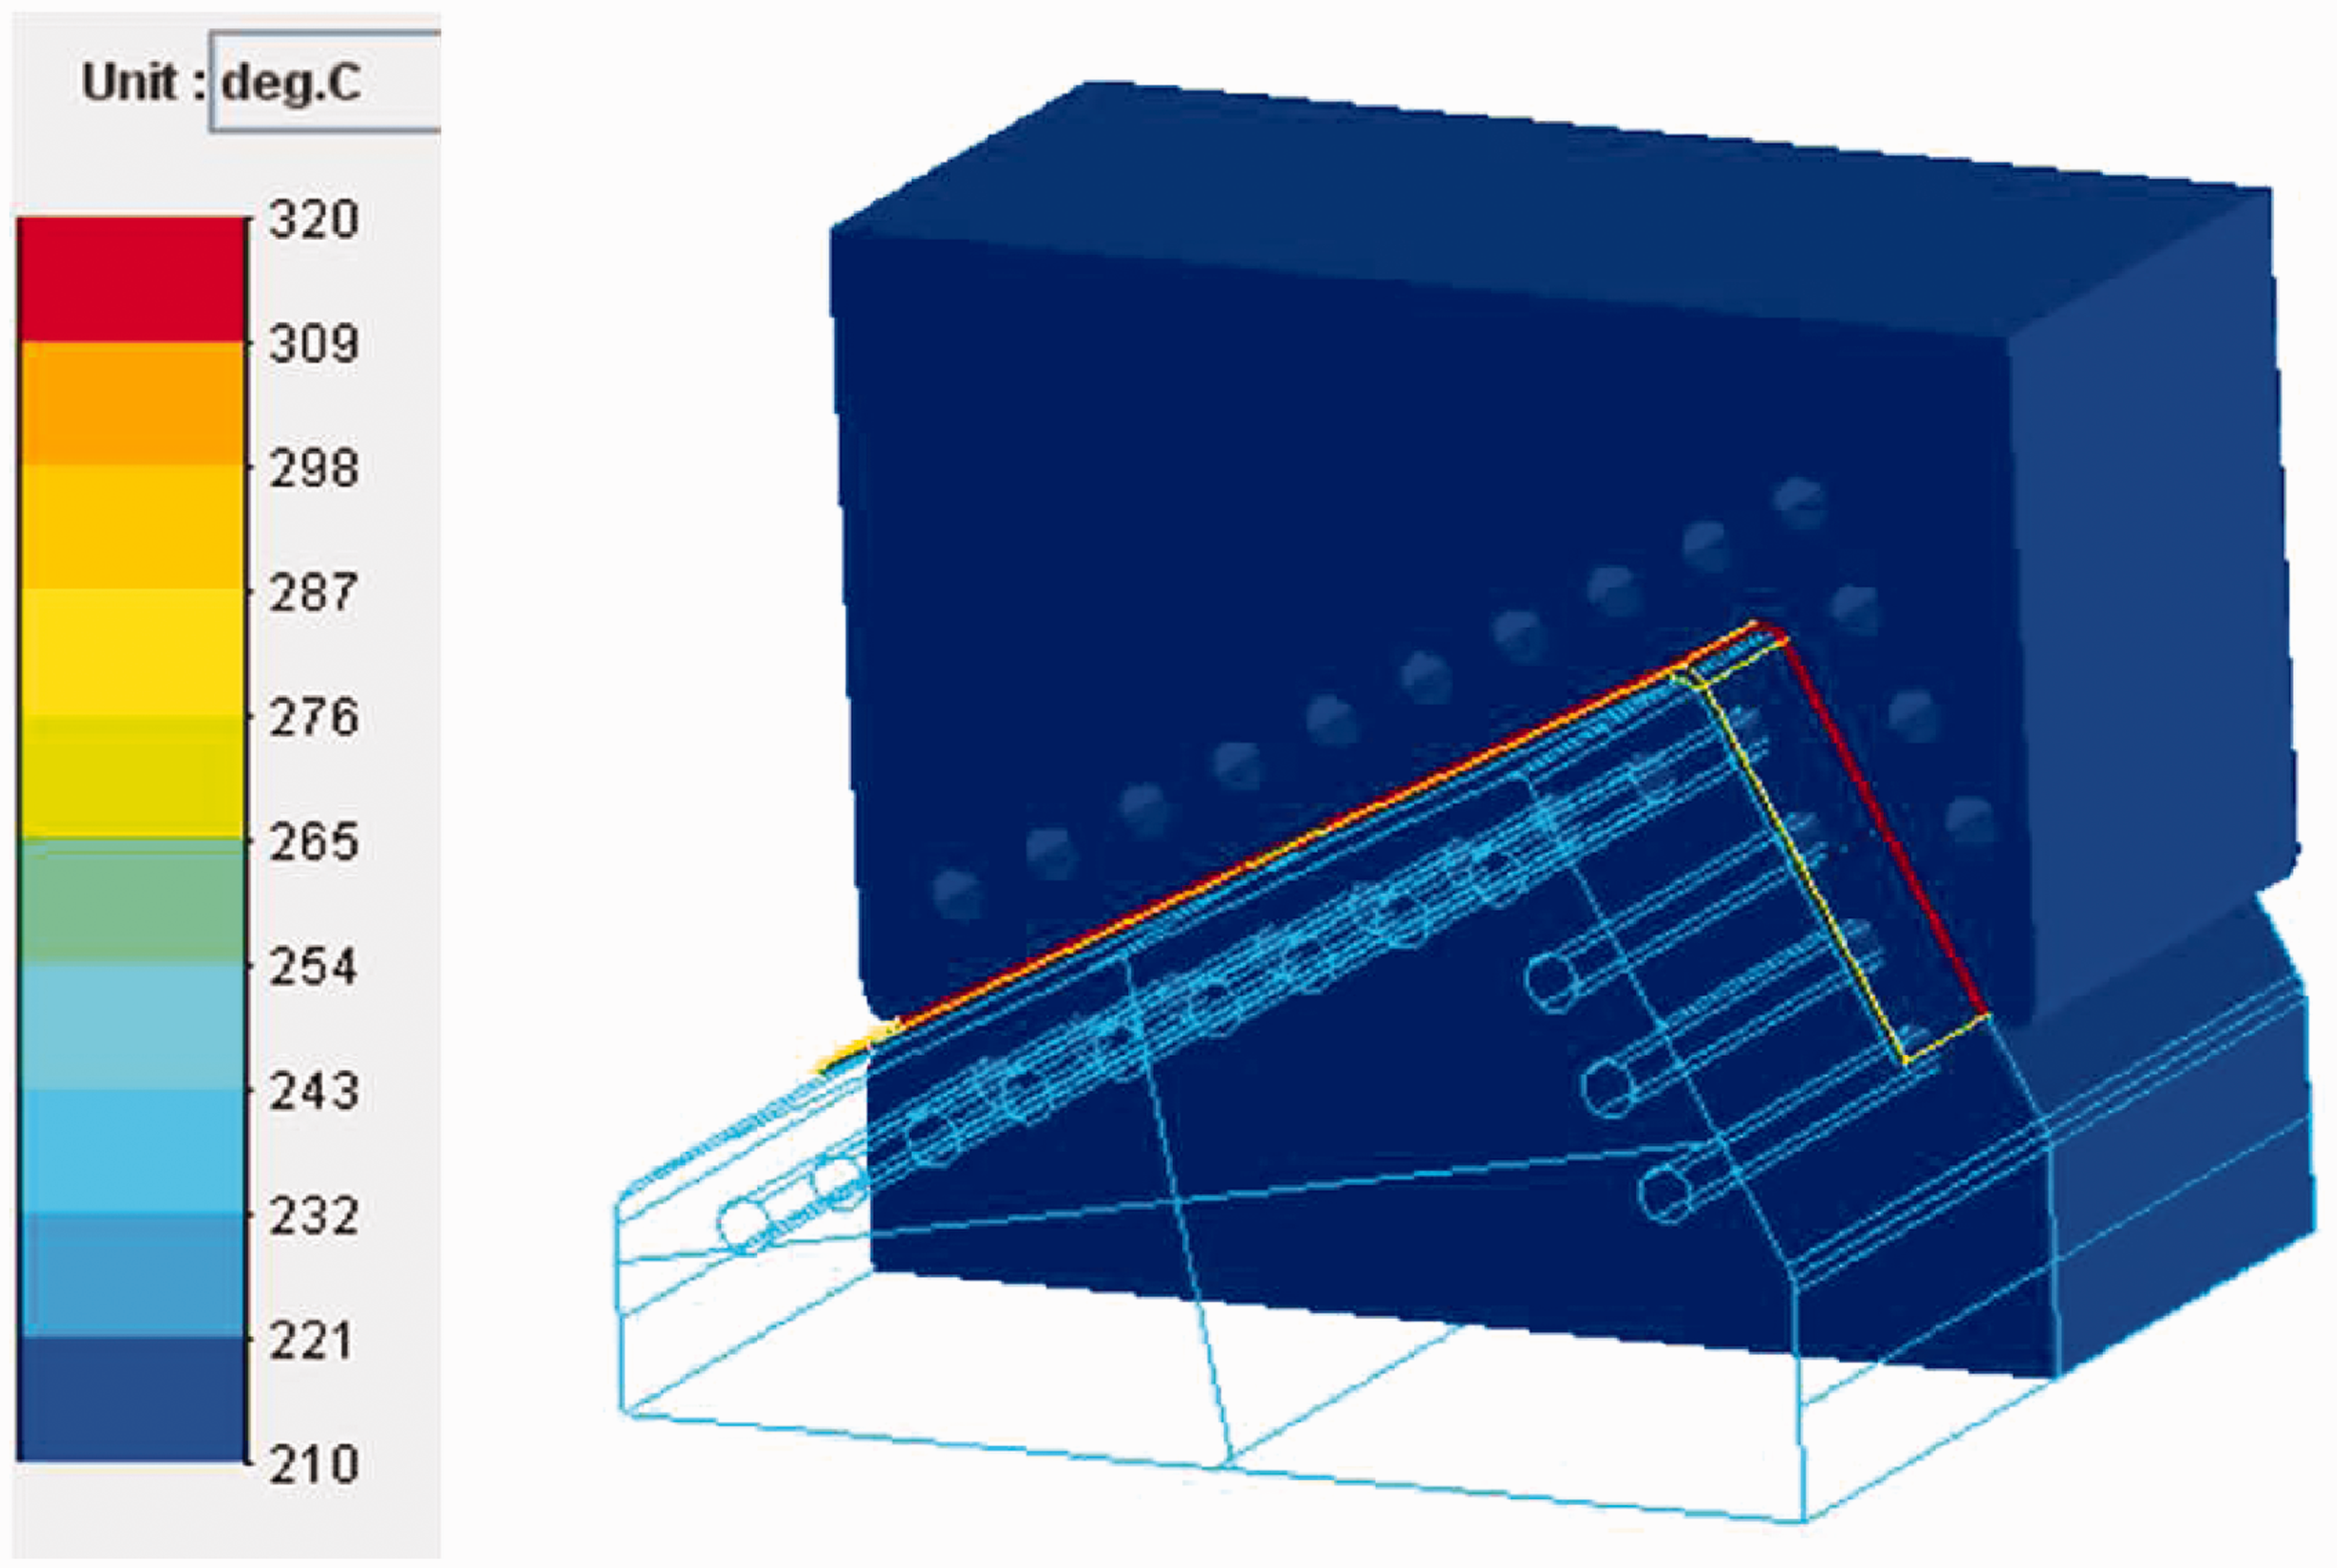
It can be observed that within the first second the outer plies of the composite part have already cooled down to the tool temperature. In comparison, the inner plies reach the tool temperature of 210℃ much later, as shown in Figure 16. For the mechanical analysis, this unsteady temperature distribution results in residual stresses and ultimately induces deformations.
Temperature curves for different plies demonstrating the slower cooling of the middle ply.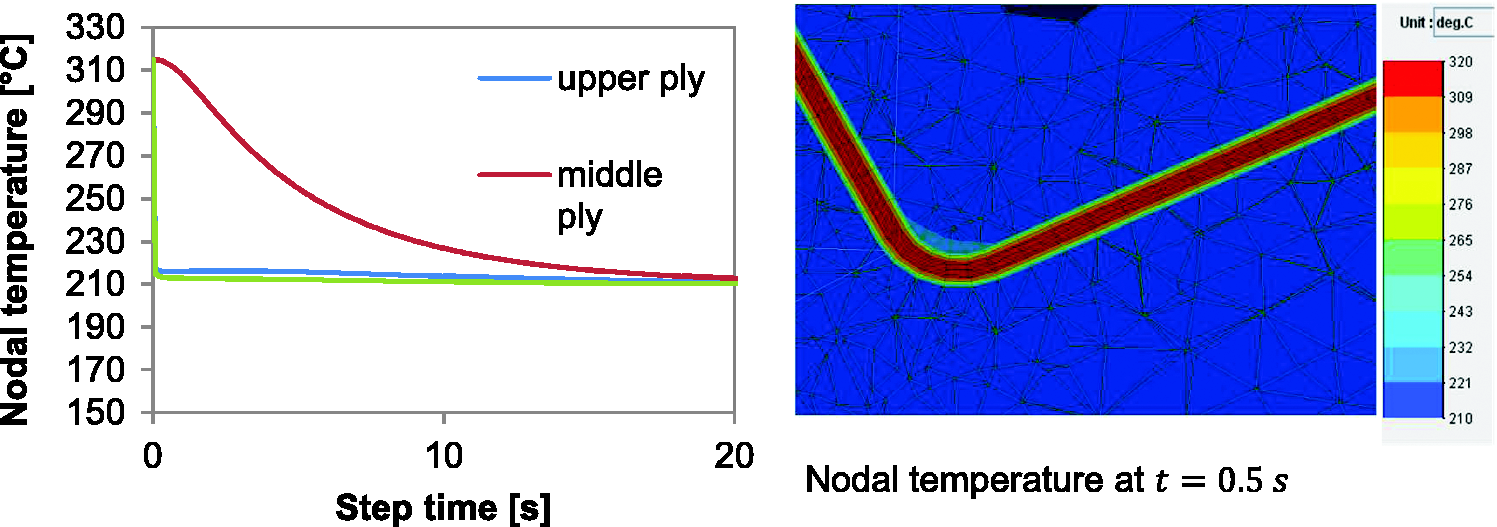
The results of the thermal analysis were mapped onto the FE model of the mechanical analysis. As expected, the increase in the relative crystallinity begins much earlier at the outer nodes than at the inner ones. The reason is that the starting temperature of the crystallisation process is reached earlier at the outer nodes. In addition to these results, Figure 17 shows that the relative crystallisation appears to reach a final value at approximately 40 s, then increases further at 45 s. Given the relationship between the crystallisation half-time and the cooling rate (Figure 5), a cooling rate near zero implies an infinite crystallisation half-time. Observing the thermal conditions in Figure 13, the tool temperature is held constant for 45 s and the composite part is fully cooled down to tooling temperature before this time point is reached; thus, the cooling rate is zero. Taking this condition into account, the crystallisation behaviour can be interpreted as a result of the infinite crystallisation half-time. The crystallisation process is occurring when the tooling temperature begins cooling down to room temperature.
Crystallisation behaviour calculated for various nodes at different points in time. Relative crystallisation at t = 11 s.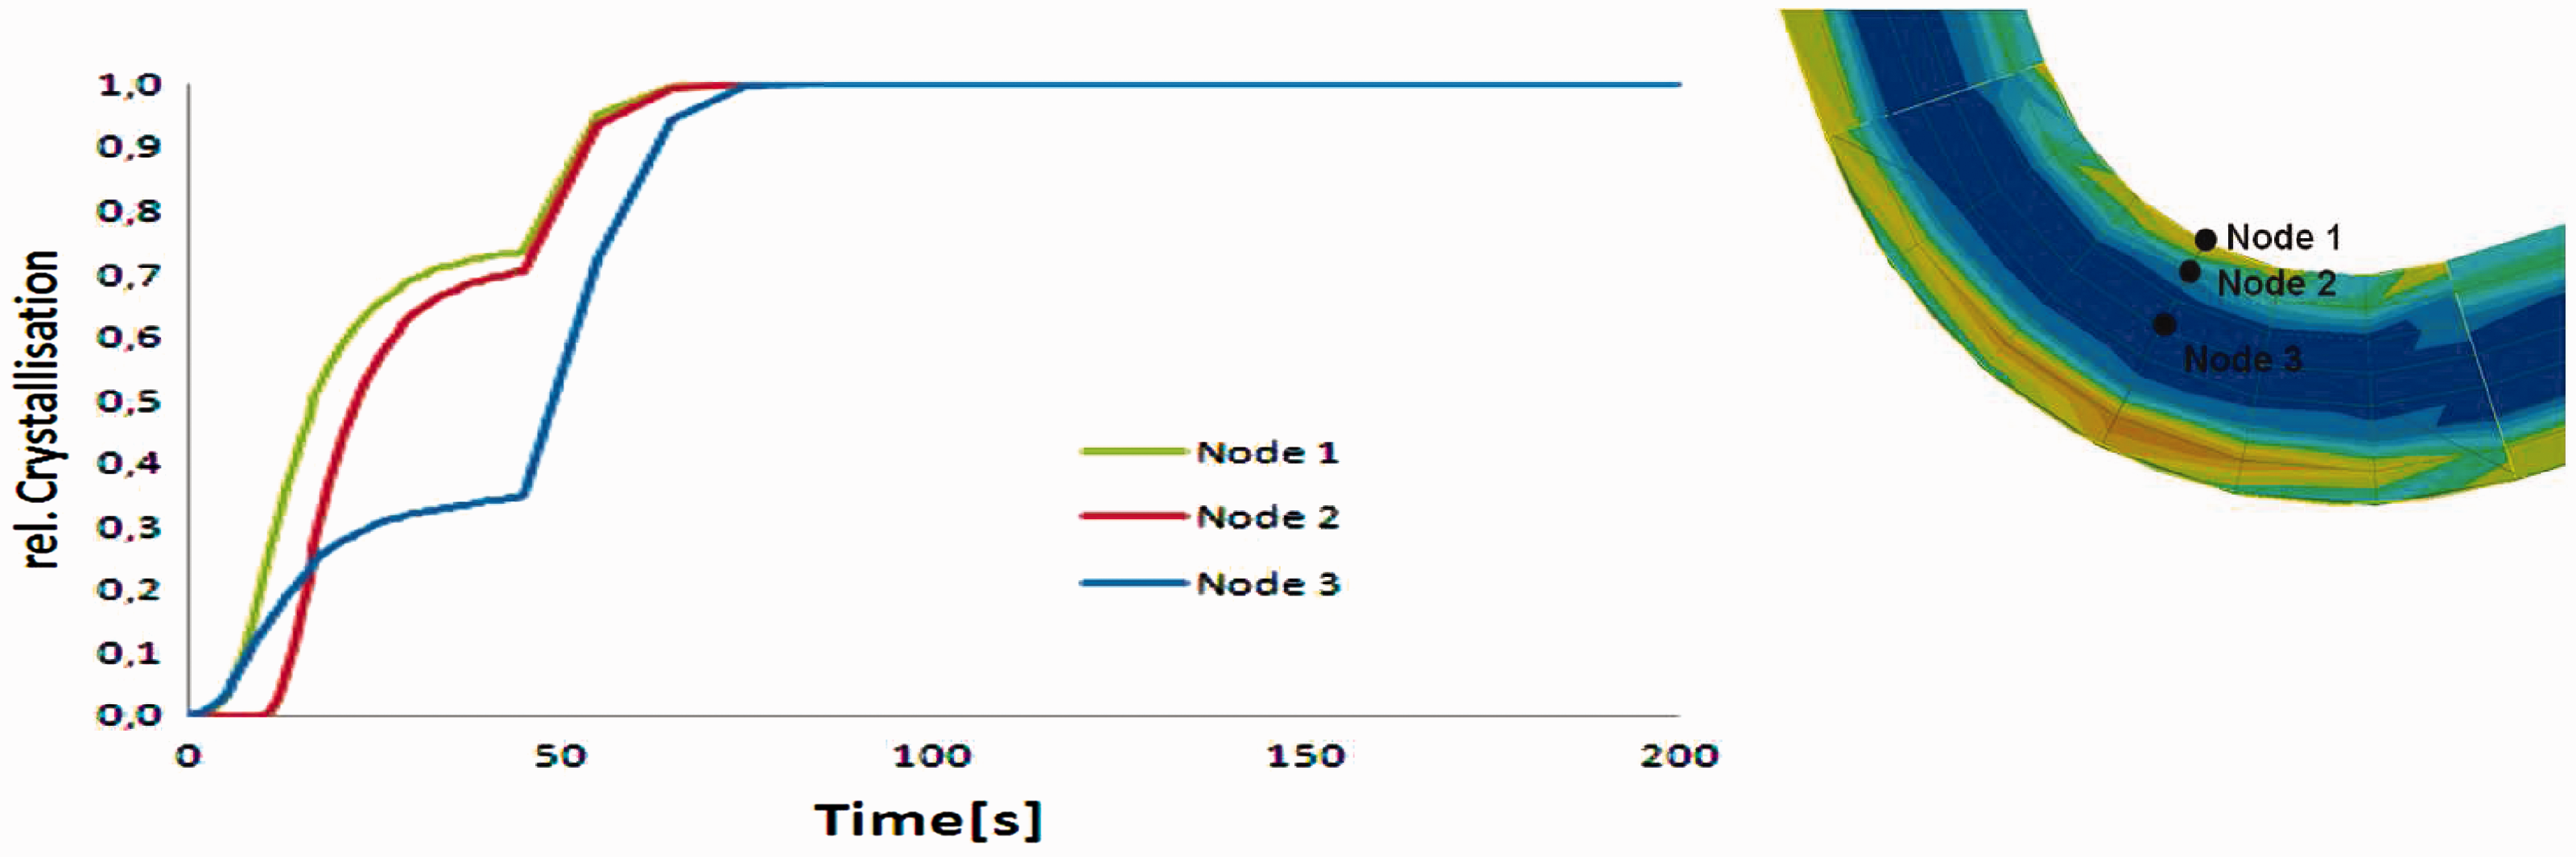
Related to the degree of relative crystallisation, as used as state variable, the change of the modulus in fibre direction (Eh1), in out of plane direction (Eh3) and of the resin (Em) are shown in Figure 18. In dependency on the crystallisation, the matrix modulus starts to increase after reaching the relative degree of crystallisation of 50%. This means close to the tool surface the material is in the solid phase but in the middle the material is still viscous and interlaminar sliding can occur.
Crystallisation behaviour calculated for various nodes at different points in time.
As has already been described, the thermoplastic matrix modulus begins growing once a relative crystallinity of 50% is reached. Different relative crystallinity values on the nodes of the mesh result in various material properties inside the FE model of the composite part, which are followed by residual stresses on the element integration points. Furthermore, those stresses induce deformations which are reflected in the spring-in effect (Figure 19).
Deformation result of the simulation of the L-angle bracket.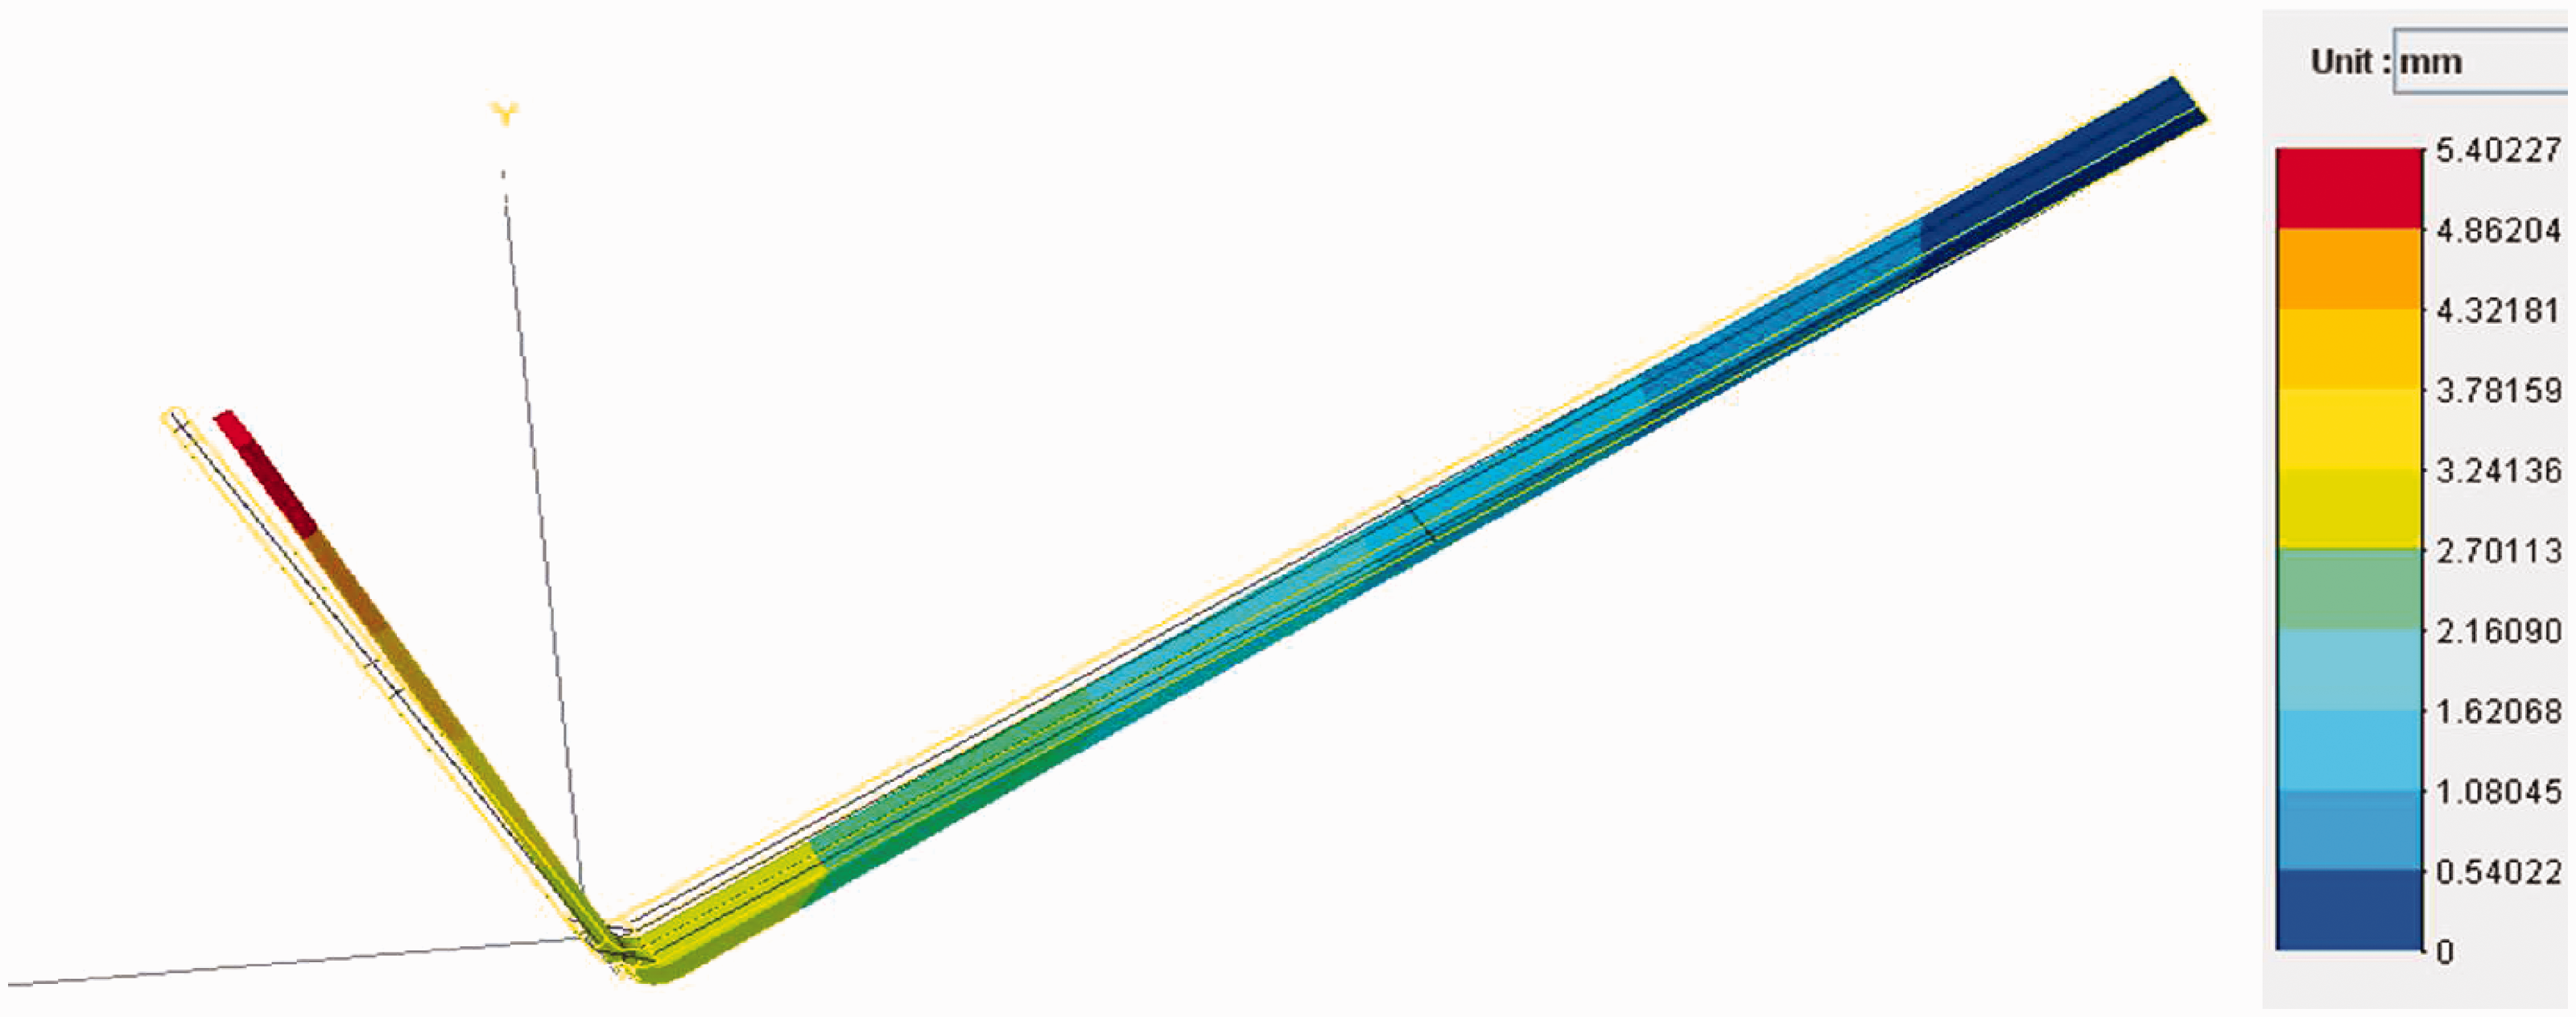
To determine the spring-in angle for the simulated composite part, the coordinates of nodes were evaluated. For the described process constellation, the spring-in angle is 3.6°. In practice, the spring-in effect is much higher. The measured spring-in angle is approximately 3.7°; thus, the current model describes the observed deformation behaviour qualitatively.
On one hand, the difference between the experimental result and the simulation can be explained by experimental uncertainties. Any fibre misalignments or irregular fibre-volume fractions exert a large influence on the sample deformation. Furthermore, the motion of the melted composite layers as they are draped on the mould must be investigated.
Another effect that has not been described thus far is the influence of the total degree of crystallisation on the resin properties. The total degree of crystallisation likely has an influence on the matrix modulus. For the slower cooling rates that can be realised by a typical DSC experiment, up to 50 K/min, the degree of total crystallisation is nearly constant and any deviations can be considered uncertainties in measurement. Therefore, the crystallisation model has a constant matrix modulus for 100% relative crystallisation that does not consider any varying cooling rates. FDSC methods will determine whether this relation can be extrapolated to the faster cooling rates that correspond to real processes.
Conclusions
In this study, a sequential thermo-mechanical approach with a crystallisation-dependent material was used to study process-induced deformations. A detailed volume model of the mould and component was built to analyse the temperature distribution and crystallisation development. After this thermodynamic analysis the temperature profiles were transferred as boundary conditions to a mechanical analysis. For the mechanical part chosen, a multilayer (volume) discretisation was chosen. The lay up of a volume element can be modified without a large pre-processing effort. Thus, this method can be used to perform sensitivity analysis on the lay up, thereby decreasing the computational effort. This simulation method provides the following results over the process time: crystallisation, process-induced deformations and residual stress.
In this study a validation was also completed to verify the accuracy of the method. This comparison shows the limitations of the approach and highlights points for further investigation.
Taken together, these developments and their complete integration within commercially available software packages, such as MECANO/SAMCEF, can provide engineers an advanced analysis and simulation tool to compute process-induced deformations.
Footnotes
Acknowledgments
The authors are grateful for financial support through the German Federal Ministry of Economics and Technology (BMWi) within the framework of the national aeronautical research programme IV (LuFo IV) within the project ‘TP-Closedbox’.
Conflict of interest
None declared.
Funding
This research received no specific grant from any funding agency in the public, commercial, or not-for-profit sectors.