
Abstract
The influence of geometry and structure of different commercial multi-walled carbon nanotubes (MWCNTs) have been analysed. MWCNTs have been characterized by transmission and high-resolution scanning electron microscopy, measurement of specific surface area by nitrogen isotherm and X-ray diffraction. The behaviour of carbon nanotube/epoxy composites has been studied by dynamic mechanical thermal analysis, differential scanning calorimetry, measurements of density and electrical conductivity. Composites manufactured at the same experimental conditions and with the same nanofiller content presented different thermal, mechanical and electrical properties. Despite using MWCNTs with similar aspect ratio, the presence of surface defects on the nanotube structure induces an important decrease in storage modulus and electrical conductivity of composites. The functionalization of MWCNTs leads to composites with lower electrical conductivity due to the breaking of sp2 carbon delocalization and also due to the insulating polymer film wrapping the nanotube. In contrast, resin reinforced with long MWCNTs present higher modulus and electrical conductivity than those filled with shorter nanotubes.
Introduction
Nanocomposites are a novel class of composite materials having at least one dimension of filler in the range between 1 and 100 nm. 1 The load transfer is enhanced with nano-scale fillers, increasing the mechanical properties.2,3 For enhancement of mechanical properties, carbon nanotubes (CNTs) are excellent candidates as nanofillers. They have a high specific surface area and an aspect ratio in the range of several thousands. Also, they present a unique combination of excellent properties: exceptionally high stiffness and strength, high thermal conductivity, elevated electrical conductivity and good chemical stability.4,5 Because of these unique properties they are used to manufacture nanocomposites based on metal 6 and ceramic 7 matrices and on polymer matrices, which is the aim of this research article. The first polymer composite with CNT as filler was reported in 1994 by Ajayan et al. 8 Since then, many researchers have been publishing about these materials.9–11
The main classification of CNTs depends on the number of stacked graphite sheets: single-wall carbon nanotube, double-wall carbon nanotube and multi-wall carbon nanotube (MWCNT). Their intrinsic properties are different and therefore the behaviour of corresponding composites changes. In the past few years, MWCNT has been marketed by different chemical companies, increasing their availability and decreasing their price. 12 Although all products are named with the same nomenclature (MWCNT), there are significant differences between them, depending on their preparation method. 13 Chemical vapour deposition (CVD), the electric arc-discharge method, laser ablation and other catalytic methods are the most common techniques of CNT production. The parameters which can vary between different MWCNTs are the defect density and distribution, chirality, curvature, aspect ratio, length and diameter, density and purity. Nowadays, CVD is the most relevant CNT manufacturing process due to its high production capacity. Also, CNTs manufactured by the floating catalytic technique usually present many large agglomerates and they are difficult to disperse. In contrast, CVD-grown CNT are much easier to disperse without damaging the nanotubes. The external diameter can vary from 10 to 100 nm and their length usually ranges from 0.5 to 30 µm. In addition to their geometries, other differences can be found in the presence of impurities, amorphous carbon and even structural defects. 14 Tessonnier et al. 12 have recently published an interesting analysis of the main differences in the structure and chemical properties of several commercial MWCNT, whose data technical sheets scarcely showed differences. They confirmed that the product supplied by Nanocyl was more homogeneous in size and morphology. These nanotubes had well-aligned walls, parallel to the main axis, although small amounts of amorphous carbon and debris were found on their surfaces.
All these differences between MWCNT lead to differences in the electrical, thermal and mechanical properties. So, the electrical and thermal conductivities of MWCNT depend on atomic arrangements, such as how the graphite sheets are rolled, the diameter and the length of the tubes, the number of structural defects and the morphology, as well as on the presence of impurities. 15 The length of MWCNT plays an important role in the toughening mechanism of composites. 1 Even, for a given volume fraction of MWCNT distributed inside a matrix, the interfacial area is inversely proportional to its diameter, 14 which also affects the effectiveness of stress transfer and therefore the mechanical behaviour of composite. Moreover, smaller diameter and longer length of MWCNT causes an important increase in their aspect ratio and thus extremely large surface area. Larger surface areas of fillers hinder the dispersion processes, obtaining MWCNT bundles and agglomerates. 16
As mentioned earlier, other differences give the idea of a great controversy of results and lack of knowledge, control of processing and reproducibility of composites reinforced with CNTs. These factors slow down their industrial applications. However, this is not right. It is necessary to know and control all the experimental parameters implied in the manufacture of CNT/epoxy composites. The choice of MWCNT is one of the parameter to consider.
In this work, we study the influence of different geometries of MWCNTs on the mechanical, thermal and electrical behaviours of their composites. In order to avoid differences associated with MWCNT manufacturing processes, all the MWCNTs used were manufactured by CVD and supplied by only two different manufacturers in order to avoid differences due to manufacturers and to focus on the scientific criteria. The main differences between them are their length, diameter and functionalization. With their nanofiller content and processing conditions being the same, the goal is to analyse the effect of different MWCNTs on the main behaviour of composites.
Experimental
Materials and sample preparation
Main characteristics of MWCNTs.
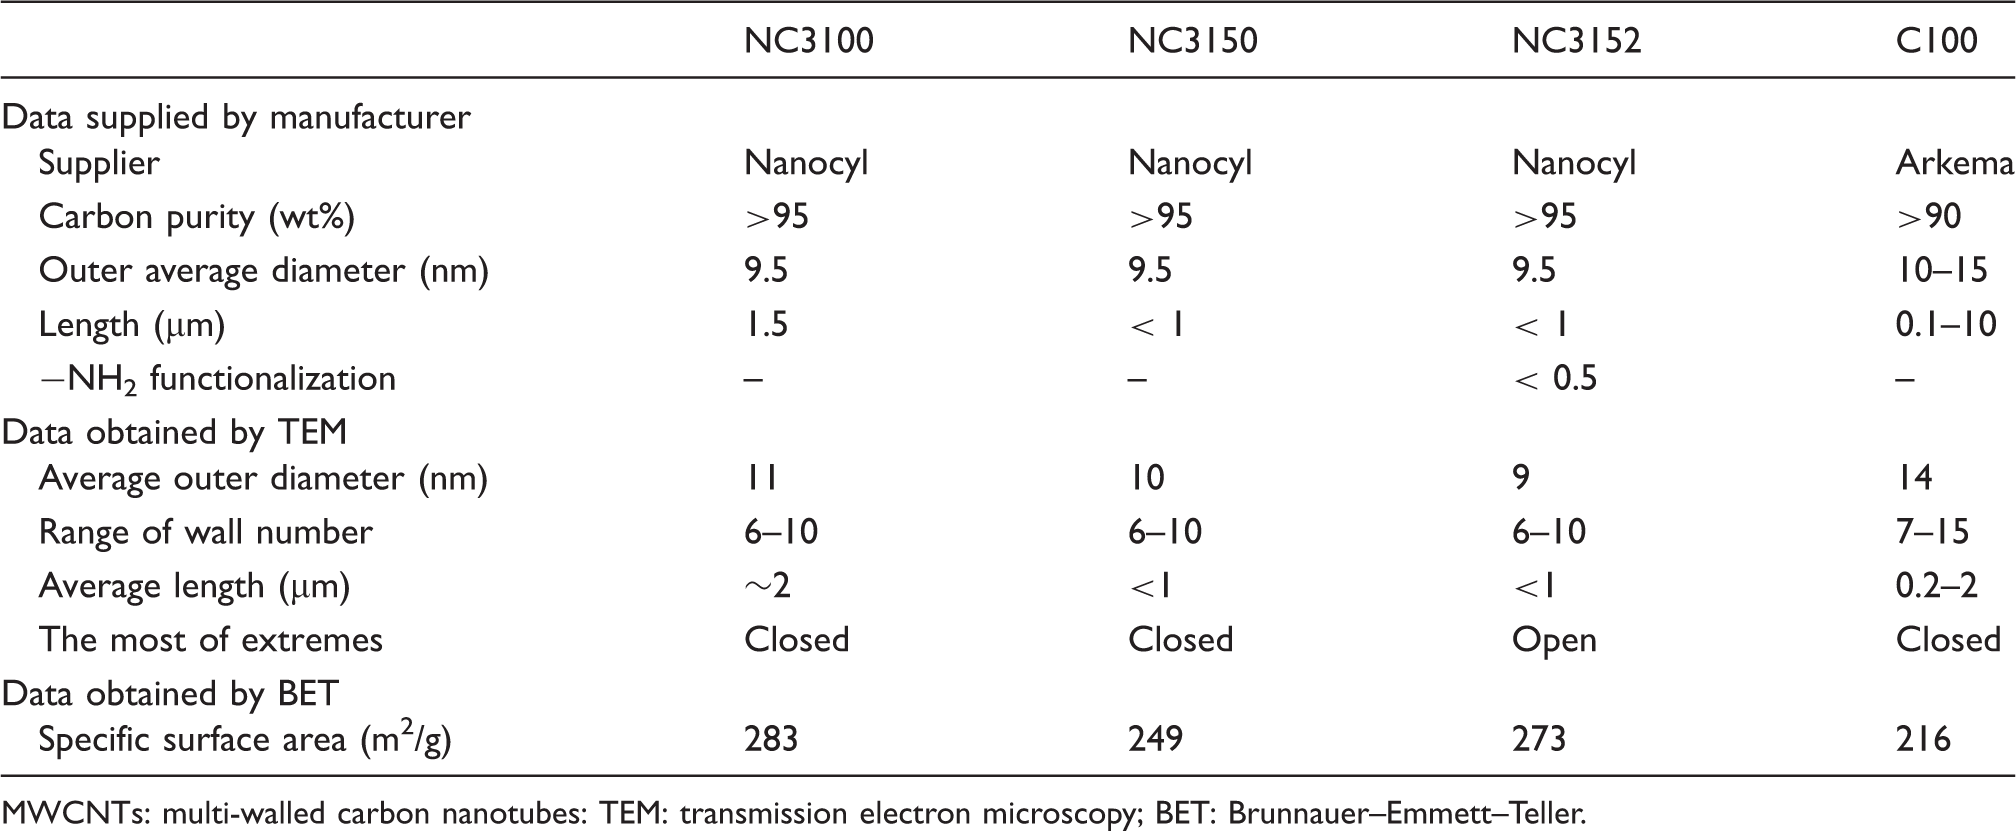
MWCNTs: multi-walled carbon nanotubes: TEM: transmission electron microscopy; BET: Brunnauer–Emmett–Teller.
Characterization
The microstructure of MWCNT was studied using transmission electron microscopy (TEM, Philips Tecnai 20 with a resolution of 0.27 nm) and field emission gun scanning electron microscopy (FEG-SEM, Nova NanoSEM FEI 230). X-ray diffraction (XRD) powder patterns were measured with X’Pert PRO Diffractometer from PANalytical, using Cu Kα (λ = 1.5406 A) radiation source operated at voltage of 45 kV and 300 mA electric current. The scanning was performed from 5° to 90° (2θ). Also, their specific surface area was determined in a Tristar 300 instrument (Atlanta, GA), by measuring the nitrogen isotherm using the Brunnauer–Emmett–Teller (BET) theory.
The glass transition temperature of manufactured composites was measured by differential scanning calorimeter (DSC, Mettler Toledo). Indium, lead and tin were used to calibrate the calorimeter. Two consecutive DSC scans was carried out from 20℃ to 250℃ at 10℃/min. The thermo-mechanical behaviour of manufactured composites was studied by dynamic mechanical thermal analysis (DMTA). It was performed in single cantilever bending mode using a DMTA Q800 V7.1 from TA Instruments. All the experiments were done at 1 Hz frequency, by bending deformation, scanning from 20℃ to 250℃ using a heating rate of 2℃/min. The maximum of tan δ versus temperature plots was used to identify the α-relaxation associated with the glass transition. Two scans were performed for each sample, whose dimensions were 35 × 12 × 1.5 mm3. The theoretical accuracy in the measurements of storage modulus at room temperature was in the range of 0.05–0.2 GPa (ASTM D4065-01). Mettler Toledo balance, with ±0.001 mg, equipped with a density determination kit by means of the buoyancy technique, was used to evaluate the change in density of the studied composites. Seven measurements were done for each specimen and two specimens were measured for each type of sample studied, determining their average value and standard deviation. Finally, the electrical conductivity of these materials was determined according to ASTM D257 using a Source-Meter Unit instrument (KEITHLEY 2410) connected through an interface GPIB to a PC. The electrical resistance was determined by the slope of current–voltage ratio, from which the electrical conductivity can be determined taking into account the geometry of specimens (10 × 10 × 1 mm3).
Results and discussion
Characterization of MWCNT
The initial state of MWCNTs was analysed by FEG-SEM. Figure 1 shows exemplary micrographs of NC3100 and NC3150. Not many differences were observed between studied nanotubes. All of them formed agglomerates, ranging generally from one micrometre to several micrometres. The nanotubes formed rope-like structures with diameters up to 1 µm. The individual ropes were highly entangled. Such structures were observed in all MWCNTs, but they seemed to be more frequent on NC3100, which could be associated with their longer lengths.
12
In order to analyse the structure and morphology of nanotubes, the homogeneity of these products and the presence of amorphous carbon or impurities, MWCNTs were observed by TEM (Figure 2). The nanotubes seemed to exhibit similar narrow tubular morphology. Statistical measurements of the average outer diameter and the range in the number of walls are listed in Table 1. The average length was also determined, although TEM is not the most accurate technique for it. The obtained values are in good agreement with the supplier data. MWCNTs differed in size: NC3100 were the longest ones, NC3150 and NC3152 were the shorter ones while C100 had the largest diameter. As expected, NC3150 and NC3152 present similar morphology and size. The unique difference observed between them was the end of the nanotube. Most of nanotube extremes were closed for NC3150 (Figure 2(f)) and open for NC3152 (Figure 2(i)). This implies that the amino-functionalization process of NC3152 must preferably occur at the ends of nanotubes.
FEG-SEM images at different magnifications of as-received MWCNT: (a) NC3100 and (b) NC3150. TEM micrographs of NC3100 (a)–(c), NC3150 (d)–(f), NC3152 (g)–(i) and C100 (j)–(l).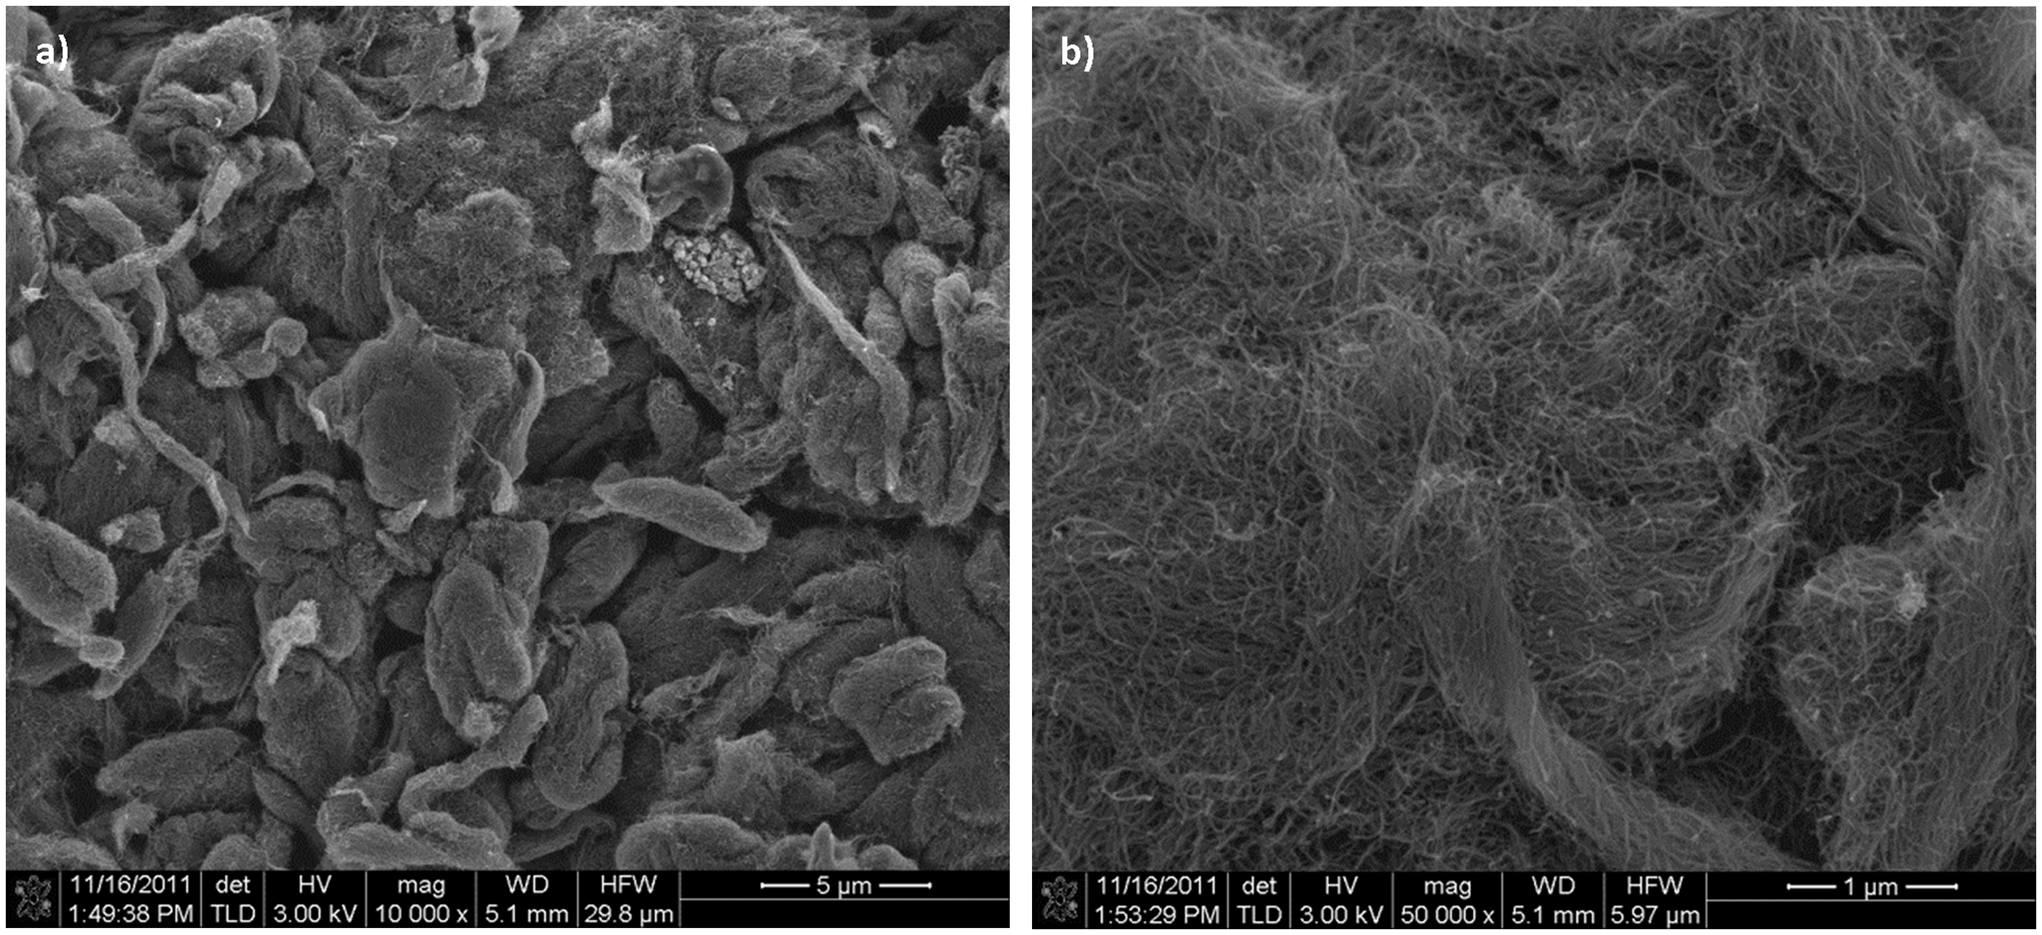

The main differences were found between MWCNTs supplied by Nanocyl (NC3100, NC3150 and NC3152) and the ones provided by Arkema (C100). For Nanocyl samples, the walls are often parallel to main axis of the tube and each single graphene sheet propagates over hundreds of nanometres (Figure 2(b), (e) and (h)). These observations are in agreement with a comparative analysis recently published by Tessonnier. 12 However, asymmetry was often observed in the case of C100 nanotubes from Arkema. While one side of nanotube showed straight walls, the other side presented a defective region where the walls were bent (Figure 2(k)). In fact, different numbers of walls were counted at different sides of the same nanotube. This can be explained by the incomplete growth of some walls. In addition, the graphite sheets of C100 eventually formed closures within the nanotube. These internal enclosures must imply lower accessible internal surface area of these nanotubes. Finally, no clear impurities were found in the studied nanotubes except for the presence of several dark nanoparticles of amorphous carbon (Figure 2(l)).
Specific surface area of MWCNT determined by BET is listed in Table 1. The total surface area ranges from 200 to 300 m2/g. Peigney et al. 17 found a correlation between specific surface area and the CNT diameter and their number of walls. The obtained surface area values of MWCNT are in accordance with predicted values for MWCNT with a number of walls ranging from 5 to 10. The lowest surface area was measured for C100 nanotubes, which were the nanotubes with the highest number of walls. This could be explained by the presence of closures within C100 nanotube that caused a decrease in their specific area. Comparing the surface area of NC3150 and NC3152, it was confirmed that the functionalization process induces an increase in specific area. This may be explained by its effect opening the nanotube extremes. Finally, NC3100 presented the highest specific surface area measured due to its longer length. It is worth noting that the values of specific area measured can be affected by the formation of bundles, which causes a decrease in this property. In the studied samples, the degree of entanglements is similar for all the studied nanotubes.
In order to complete the characterization of MWCNTs, XRD was performed to analyse the structural order of carbon atoms. Pristine nanomaterials typically present weak and rather broad peaks.
10
DRX pattern obtained was characteristic of MWCNT (Figure 3). The most intensity peak, in which 2θ position is close to 26°, was associated with (002) crystal plane of turbostatic crystallites structure while the peaks at 42° and 52°, with low intensity, were attributed to in-plane regularities (100) and (004) of nanotubes. Finally, the peak close to 78° corresponds to two planes diffractions (110) and (220). XRD pattern of C100 shows some differences. In particular, their peaks are broader and new secondary peaks appear, indicating different d-spacings. This implies that nanotubes from Nanocyl present the typical MWCNT structure made of concentric graphene sheets while nanotubes from Arkema show different curvatures and strain for each sheet. As observed in the micrograph of Figure 2(k), the C100 nanotubes present defects, such as zones with different number of walls.
XRD patterns of different MWCNTs studied.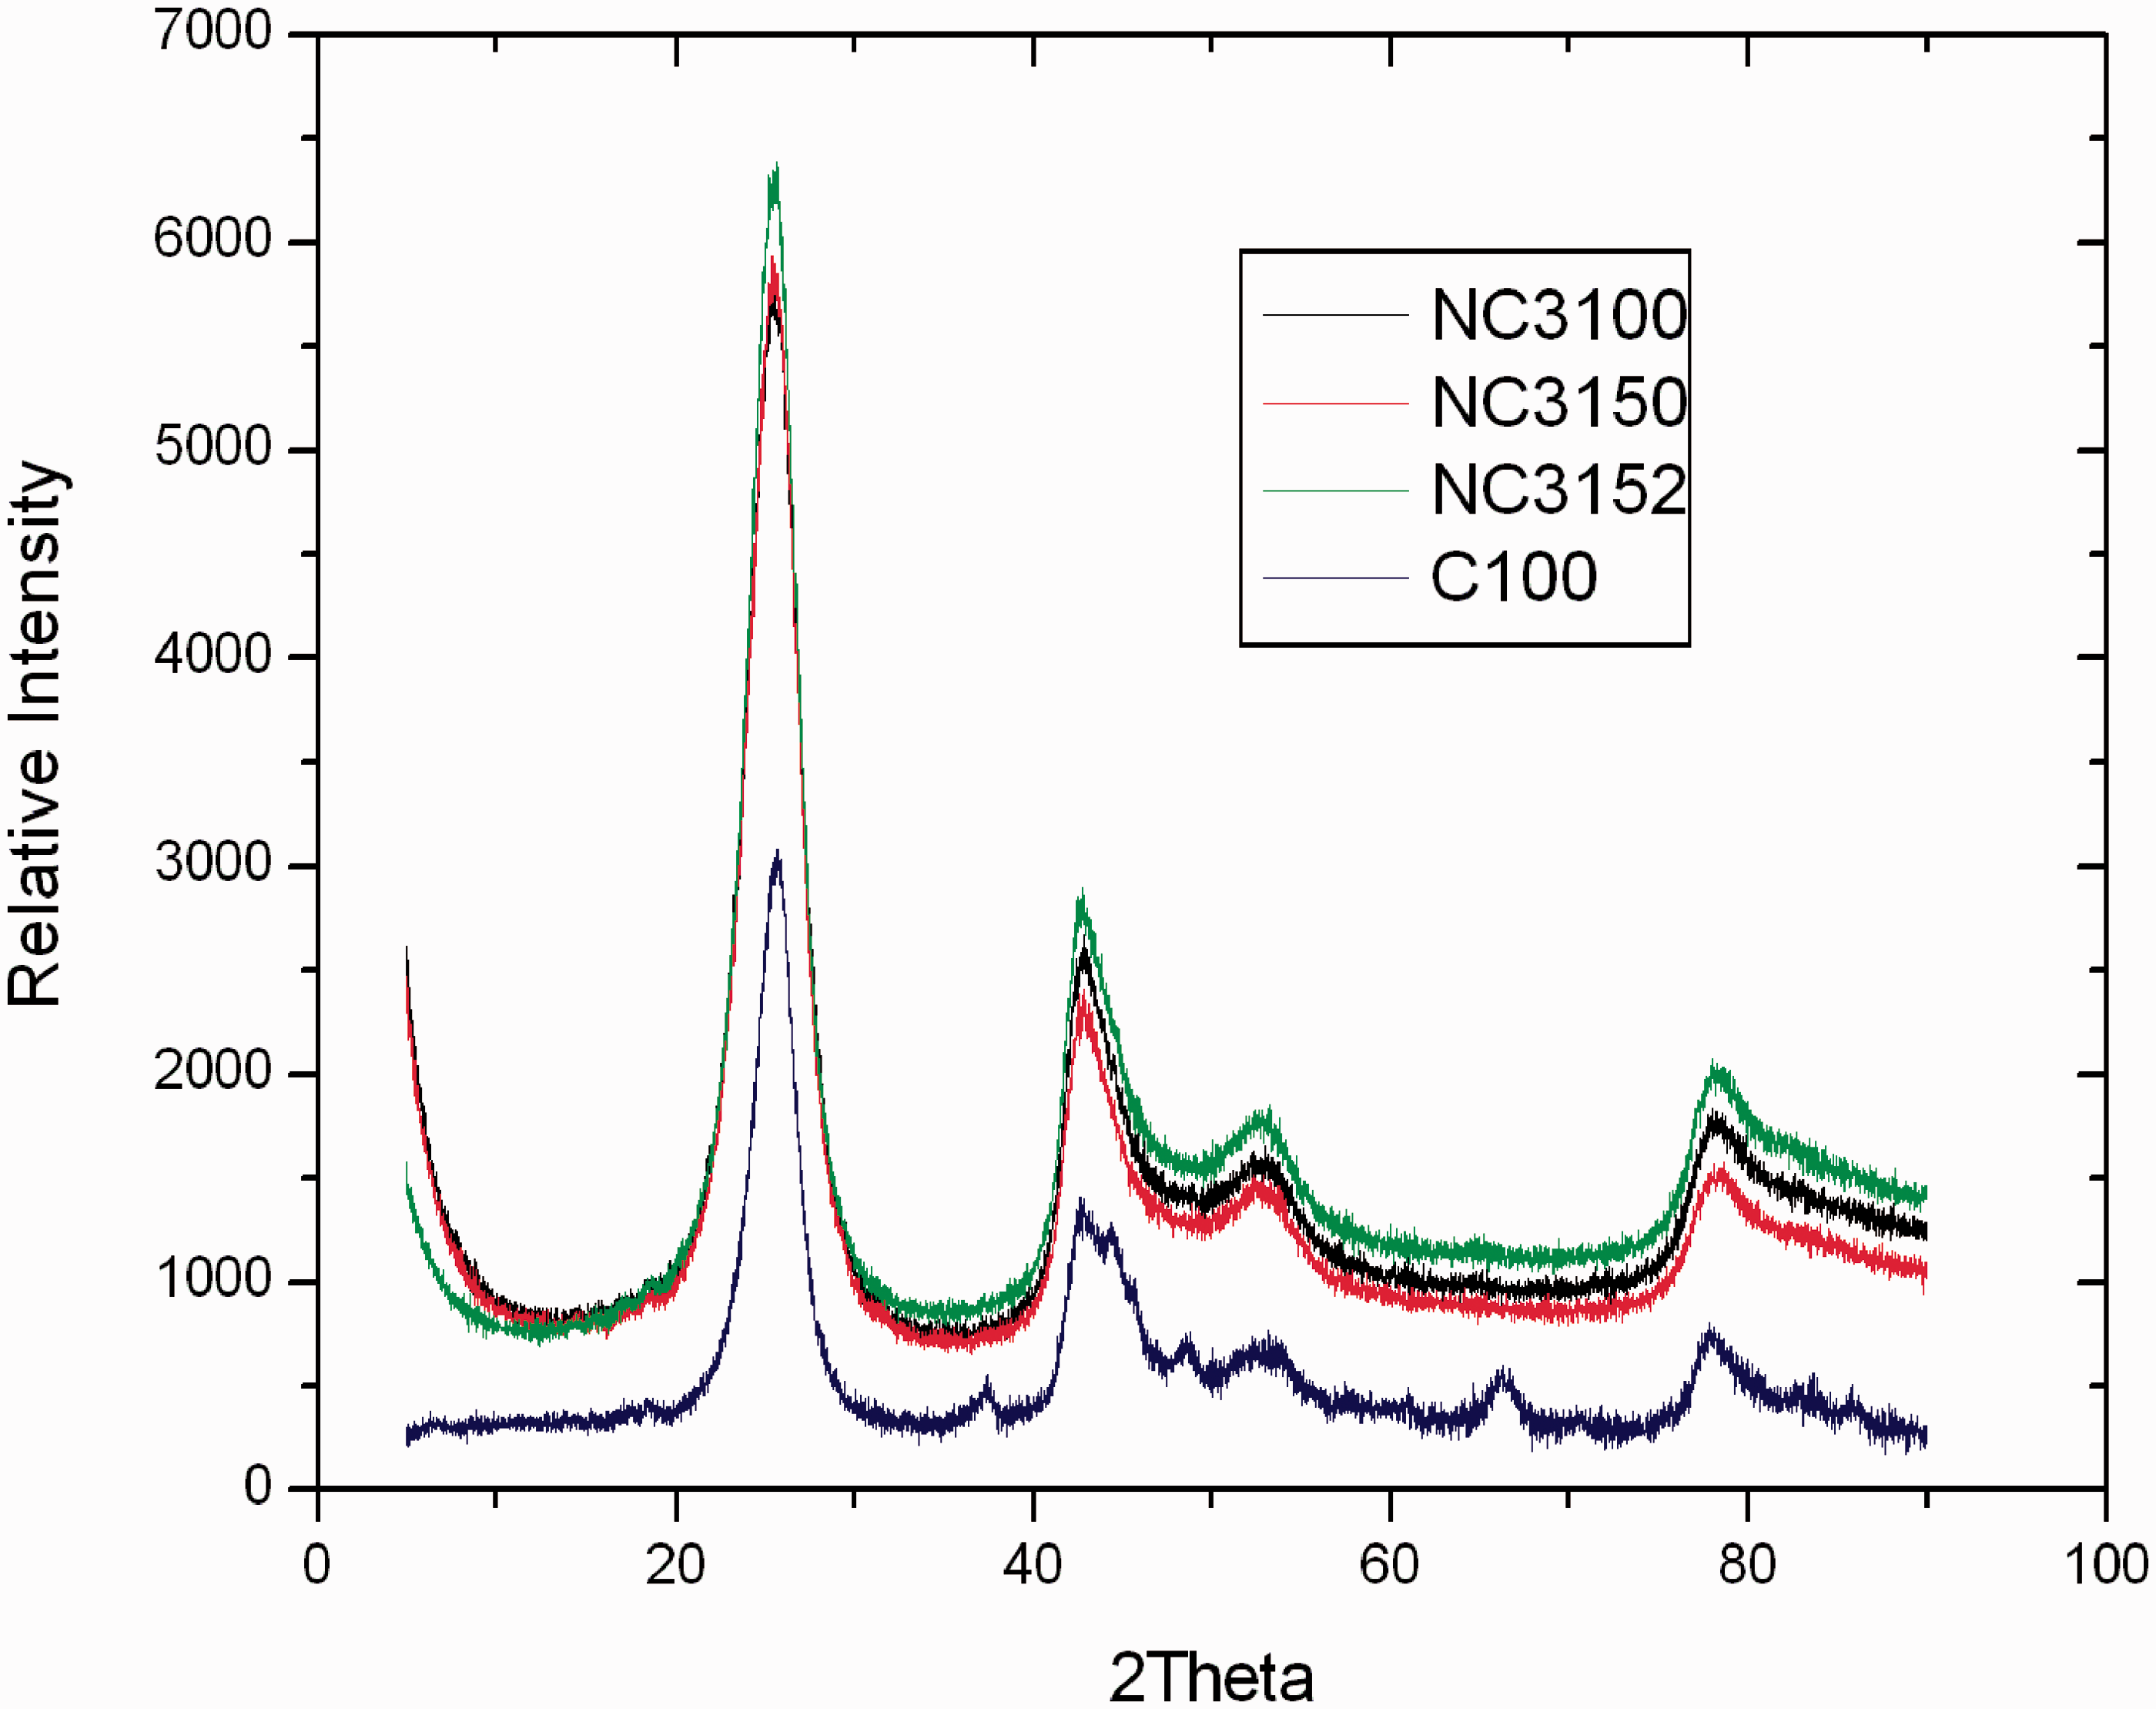
Characterization of MWCNT/epoxy composites
DSC and DMTA results and density measurements of epoxy composites reinforced with 0.5 wt% CNTs.
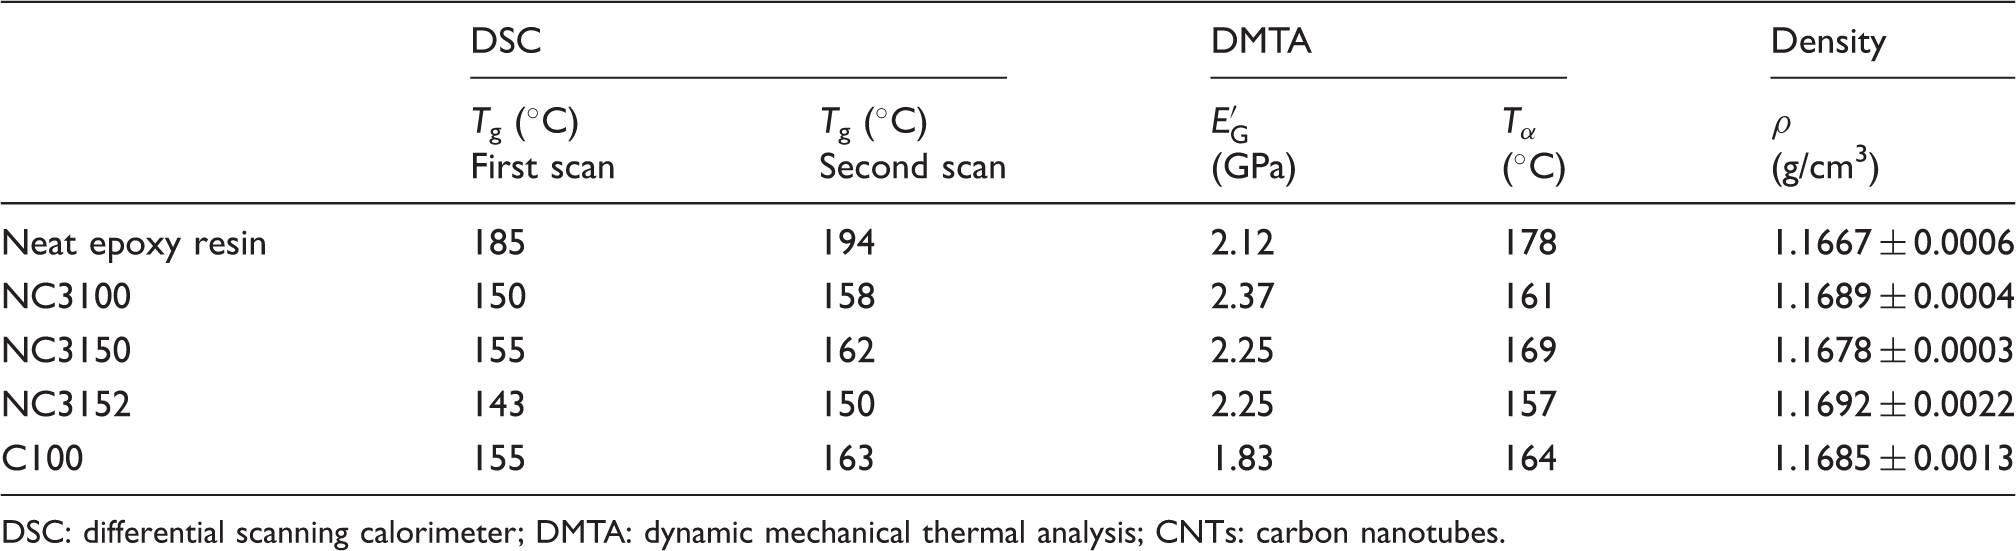
DSC: differential scanning calorimeter; DMTA: dynamic mechanical thermal analysis; CNTs: carbon nanotubes.
The thermo-mechanical behaviour of composites was studied by DMTA. Table 2 shows the values of storage modulus at room temperature and at 200℃, which corresponds to the modulus in glassy and rubbery states, respectively. The α-relaxation temperature was measured as the maximum of the peak of loss tangent. As expected, the tendency of glass transition temperature and α-relaxation temperature is similar because both correspond to the same transition but measuring different properties. In general, the addition of 0.5 wt% MWCNT induces an increase in the stiffness, measured by the storage modulus in glassy state (E′G). Although some differences are not statistically significant, it is possible to affirm that the highest increase in modulus was found for composites reinforced with NC3100, which are the longest MWCNTs studied. The longer length implies the highest aspect ratio and also the highest surface area (Table 1). The efficiency of load transfer in composites directly depends on the area of interface between the matrix and reinforcement. The greater the surface area of nanoreinforcement, more effective is the load transfer in the composites, showing higher mechanical properties. It is worth noting that not many differences are observed in the glassy storage modulus for composites reinforced with NC3150 and NC3152. Both were supplied by the same manufacturer and they have similar geometries. The main difference between them is the functionalization of NC3152. This means that the generation of strong chemical interface between nanotubes and matrix does not imply a higher stiffness of composites. In general, the addition of functionalized MWCNT involves an improvement in mechanical strength but not in modulus. Finally, the addition of C100 implies a decrease in storage modulus with regard to the rest of studied composites and even to the neat epoxy resin. As it was probed in the previous MWCNT characterization, these nanotubes presented numerous defects, which must decrease their stiffness.
On the other hand, the density of studied composites was also measured and the results are listed in Table 2. These measurements did not lead to statistically different values, but average values were slightly different which could be used to corroborate other results such as electrical ones. The composite with amino-functionalized MWCNT (NC3152) had higher density which could be related to stronger interaction between the epoxy matrix and the nanotubes leading to a more compact structure with higher MWCNT–epoxy interfaces. All composites presented an experimental value higher than the theoretical density predicted by the rule of mixtures. This difference between obtained and predicted density values can be associated with good dispersion level of the nanofillers as reported previously. 19
Finally, the electrical conductivity of these composites was determined by their current–voltage (I–V) characteristics from 0.1 to 100 V. It is worth noting that all the obtained I–V graphs show a linear tendency, meaning that these materials follow Ohm’s law. This implies that the main electrical transport mechanism is the formation of conductive paths made of conductive inclusions in direct contact, which occurs at MWCNT concentration higher than the percolation threshold.20,21 Figure 4 shows the obtained electrical conductivity values through the I–V slope and a schematic view of the MWCNT networks. It is worth indicating that at the same MWCNT content, changes in the electrical conductivity up to 16% were observed, depending on the commercial nanotube used. As expected, the highest value is obtained for the longest MWCNT (NC3100) due to the highest conductivity in the z-axis and the highest ability of these nanofillers to form conductive pathways due to their longer length, as can be observed in the schematic view of Figure 4. The lowest conductivity was measured for the nanotubes manufactured by Arkema, which is explained by the presence of defects in the outer walls. The contribution to the total conductivity of the outer shells of MWCNTs is higher than the inner ones.
22
The comparison between the composites manufactured with NC3150 and NC3152 revealed a decrease in the electrical conductivity when composites contained the amine-functionalized nanotubes. This can be explained by two different reasons: (1) functionalization process can generate defects in outer walls of nanotubes where amine groups can attach apart from the open ends of MWCNT,
23
this disorder in the structure can affect the electrical conductivity
22
and (2) the presence of polymer wrapping around dispersed amino-functionalized nanotubes may be responsible for insulating nanotubes from each other, resulting in a decrease in conductivity.
24
This aspect agreed with the tendency observed in density measurements where it was observed that average values of NC3152 MWCNT were slightly higher than that observed for other types of MWCNT.
Graph of the electrical conductivity of the studied composites and scheme explaining the differences.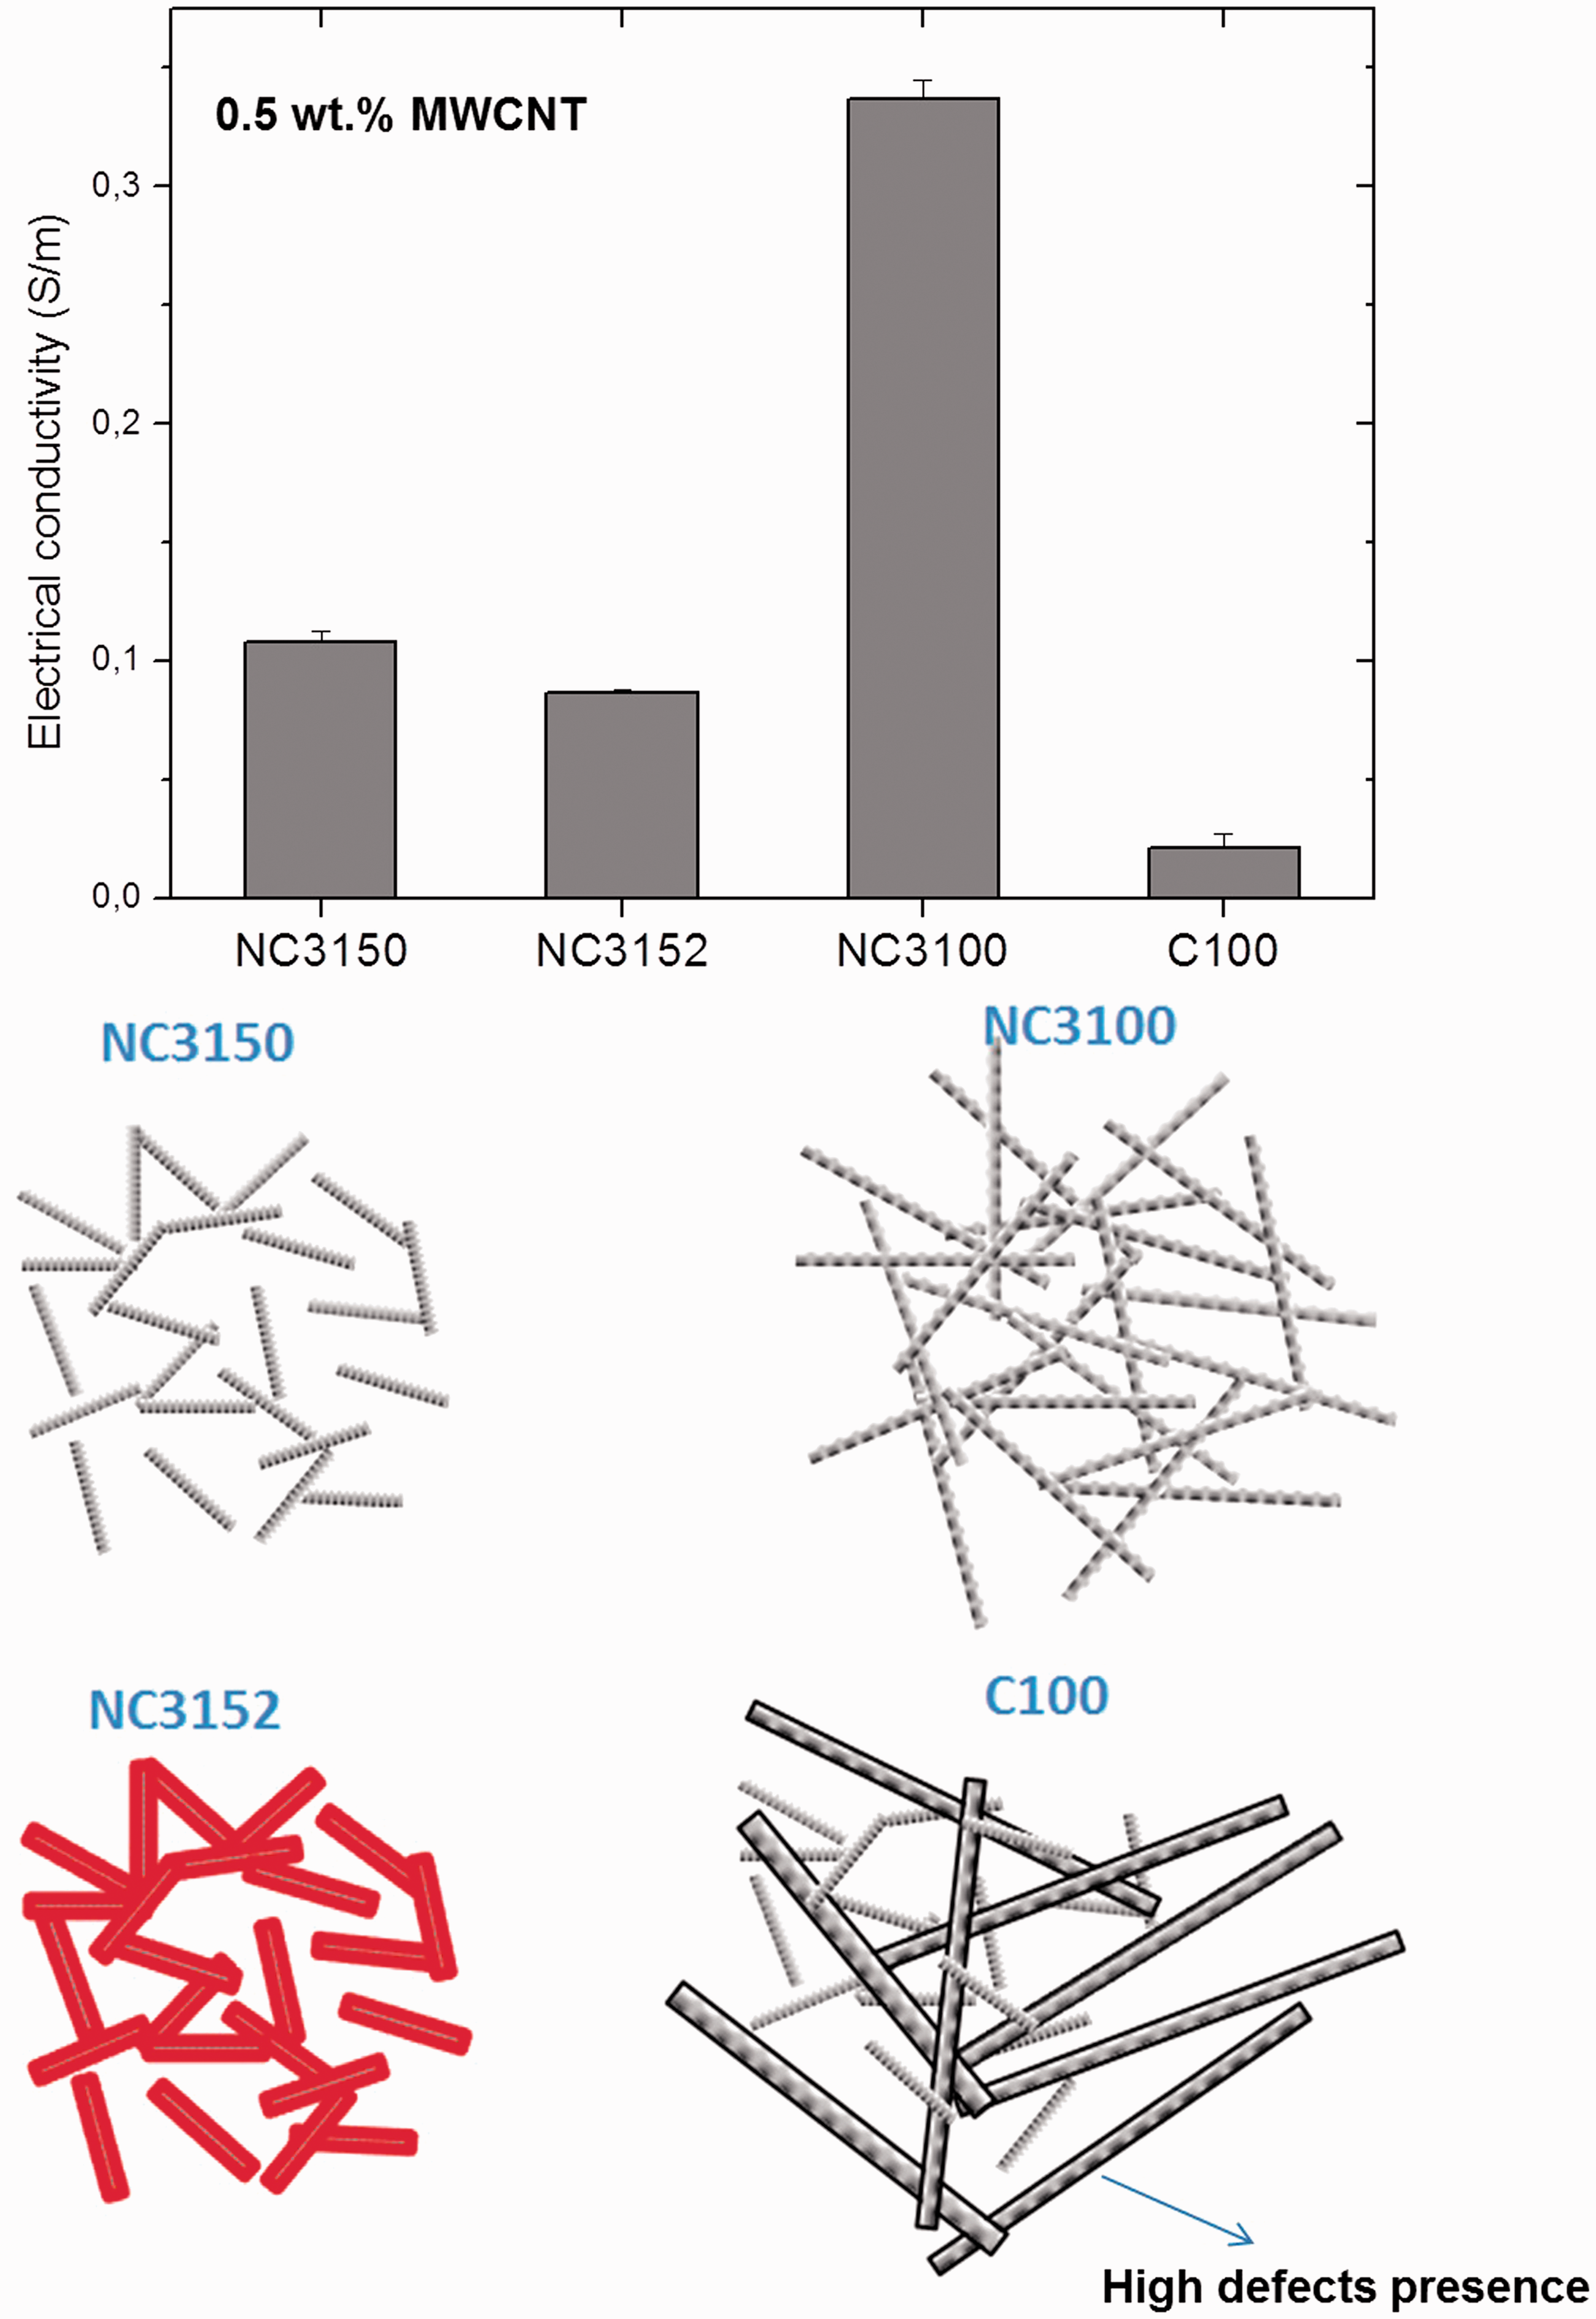
Conclusions
The results presented in this work confirm that the selection of MWCNT plays an important role in the overall behaviour of composite. The composites manufactured on the same experimental conditions and with the same nanofiller content present differences in their thermal, dynamo-mechanical and electrical properties.
Four different MWCNTs with different morphological and chemical characteristics were used (NC3100, NC3150, NC3152 and C100). Their previous characterization confirmed that NC3100 were the longest ones while C100 were the widest ones. The unique difference between NC3150 and NC3152 was the functionalization with amine groups.
Composite reinforced with 0.5 wt% of the longest MWCNTs (NC3100) presented the highest modulus and electrical conductivity towing to the highest aspect ratio and surface area. Composite with amine-functionalized MWCNTs (NC3152) showed higher density and lower glass transition temperature and electrical conductivity when compared with the composite with similar non-functionalized MWCNT (NC3150). This has been associated with the strong interface between epoxy matrix and amine-functionalized MWCNT because of the covalent bonds formed between them.
Finally, the lowest glassy storage modulus and electrical conductivity were measured by the composite reinforced with C100. This nanofiller presented numerous defects on its structure and the presence of amorphous carbon which caused a decrease in the measured properties.
Therefore, the geometry, purity, structure and functionalization of CNTs have an important effect on the main behaviour of the corresponding composites.
Footnotes
Conflict of interest
None declared.
Funding
This research was supported by Ministerio de Ciencia e Innovación of Spain Government (Project MAT2010-207024-C02-01) and Dirección General de Universidades of Madrid Community (Project 2009/MAT-1585).