






Abstract
This investigation explores the manipulation of carbon black particles for tailoring the electrical properties of unidirectional glass fiber reinforced epoxy composites. Carbon black particles were anisotropically networked along the through-thickness direction of glass/epoxy composite plates using an alternating current electric field applied during curing of the composite, with the objective of maximizing the electrical conductivity through the thickness. Anisotropic networking was observed microscopically and was quantified by measuring the DC electrical conductivity of the cured glass/epoxy composite material in the three principal directions. The effects of carbon black amount, electric field strength, and electric field frequency on the anisotropic conductivity are elucidated using a parametric investigation. It is shown that the through-thickness conductivity can be increased by a factor of roughly 104 relative to the case with no conductivity tailoring and can be of the same order of magnitude as the transverse and longitudinal in-plane conductivities, which are improvements well beyond the studies published until now. Moreover, for the first time, it is shown that the through-thickness conductivity of unidirectional glass/epoxy composites containing carbon black can exceed the in-plane transverse conductivity by selecting appropriate electric field parameters during processing.
Introduction
Fiber reinforced polymer (FRP) composites are widely used in marine, wind energy, aeronautics, transportation, construction, and sporting goods industries. Compared to their metal counterparts, they are attractive due to their high specific strength and stiffness properties. For high-value, safety-critical applications, it is worthwhile to develop structural health monitoring (SHM) techniques that allow continuous monitoring for signs of damage in the structure. In the literature, embedded glass fiber optical sensors, 1 embedded piezoelectric sensors, 2 and acoustic emission 3 are among the SHM techniques commonly studied for polymer matrix composites. SHM techniques based on the monitoring of electrical resistance were first developed for conductive (carbon) fiber reinforced polymer composites. 4 Fiber-based techniques are mostly sensitive to fiber damage, and obviously are not applicable to nonconductive (glass, aramid) fiber composites. To overcome these limitations, researchers have dispersed nano-sized conductive fillers such as carbon black (CB) and carbon nanotubes (CNTs) into the matrix material in order to detect matrix damage.5–9
CB, CNTs, and carbon nanofibers have been widely used to introduce electrical conductivity to neat polymers.10–12 These nanocomposites are important candidate materials for antistatic and electromagnetic interference shielding. In order to obtain a high level of electrical conductivity, the concentration of nanofillers should exceed the percolation threshold. At the percolation threshold, conductivity increases many orders of magnitude due to the formation of a conductive network. Percolation thresholds of CNT, CB, and combinations of CNTs and CB in epoxy have been noted by Sumfleth et al. 13 to occur at particle weight concentrations of less than 0.1%.
The electrical conductivity of thermosetting polymers in different directions can be tailored by the use of electric fields to manipulate the position of conductive particles before the polymer cures. The well-known phenomenon of dielectrophoresis, wherein conductive particles suspended in a dielectric liquid such as epoxy become polarized upon the application of sinusoidal electric field, can be used to align elongated particles with the electric field14,15 and to join particles of any shape end-to-end between opposing electrodes. 16 In the study by Martin et al., 15 multiwall carbon nanotubes (MWCNTs) were anisotropically networked in epoxy using alternating current (AC) and direct current (DC) electric fields. It was observed that an AC electric field causes a more uniform and more aligned network compared to a DC electric field, and increasing field strength causes an increase in the electrical conductivity. Felisberto et al. 17 showed that the percolation threshold for anisotropically networked MWCNTs in epoxy is one order of magnitude smaller than that for randomly networked MWCNTs in epoxy.
Methods of manufacturing FRP composites with anisotropically networked conductive nanofillers in the polymer have been developed. Wichmann et al. 18 evaluated the 1 kHz AC conductivity of bidirectionally woven glass preforms impregnated with epoxy by a resin transfer molding process. The epoxy contained various kinds of nano-sized conductive particles such as CB and CNTs in a single concentration of 0.3 wt% of the resin. A 50 Hz AC electric field of 330 V/cm was applied through the thickness to anisotropically network the nanofillers during processing. Glass fiber volume content was varied (37% and 50%), but was determined to be of minor importance, overall. In-plane conductivities did not vary with electric field. The conductivities of the CB composite were roughly 10−7 S/m in the in-plane and through-thickness directions – low values which the authors attributed to a lack of percolation. The through-thickness conductivity in the case of CB did not change with the use of electric field networking. For the several types of CNTs evaluated, the results on as-received and amine-functionalized double wall CNTs are the most comprehensive. For these double wall CNTs, the in-plane and out-of-plane conductivities with random networking were approximately 3 × 10⁻³ S/m and 10−6 S/m, respectively, with the latter increasing to approximately 10−5 S/m with the use of electric field networking. Thus, the through-thickness conductivity with double wall CNTs was increased by a factor of 10 by anisotropic networking, but it was still a factor of 100 less than the in-plane conductivity.
Domingues et al. 19 dispersed 0.1 wt% MWCNTs into an epoxy resin and infiltrated the resin into a bidirectional noncrimp glass cloth using vacuum assisted resin transfer molding. A 1 kHz AC electric field (current density of 15 or 45 A/m2) was applied through the thickness in some cases to achieve anisotropic networking of the filler in this direction. Compared to the case of no electric field during processing (through-thickness 2 × 10⁻⁴ S/m; in-plane 4 × 10⁻³ S/m), the DC conductivity increased by roughly a factor of 5 in the through-thickness direction (approximately 10−3 S/m) with anisotropic networking, while increasing only slightly in the in-plane direction. Thus, with anisotropic networking, the ratio of through-thickness conductivity to in-plane conductivity increased from about 0.05 to about 0.25. The authors concluded that the conductivity increase in the through-thickness direction was mainly due to preferential agglomeration rather than alignment of the individual MWCNTs.
According to an analysis by Tallman et al., 20 the alignment and preferential networking of CNTs along the through-thickness direction of glass FRPs is believed to increase the sensitivity for delamination detection using electrical impedance tomography. In general, the best damage sensitivity was obtained when the direction of highest electrical conductivity is perpendicular to the plane(s) of damage in the material.
The aforementioned brief review indicates that very little systematic investigation of the electrical tailorability of glass FRPs has taken place to-date and that such studies are needed to illuminate the potential of electrical techniques for the monitoring of damage in the material. In the current experimental investigation, the objective is to parametrically investigate the preferential networking of CB particles along the through-thickness direction of unidirectional glass fiber reinforced epoxy composites by using an AC electric field during processing. CB was selected for its small size and presumed ability to move freely between tightly packed glass fibers in the composite. Several unidirectional glass/epoxy composite plates were manufactured using various CB amounts and various electric field strengths and frequencies. The DC conductivities of the materials were measured and compared along three different directions: in-plane, parallel to the glass fibers, σ1; in-plane, transverse to the glass fibers, σ2; and through-thickness, σ3. Moreover, in order to observe the networking behavior of CB particles near nonconductive inclusions in liquid epoxy during exposure to an AC electric field, thin film specimens were analyzed under an optical microscope.
Experimental procedures
Materials
Stitched unidirectional (UD) E-glass preforms with 225 g/m2 areal weight were used as the main reinforcement material. As the matrix material, an epoxy resin consisting of a bisphenol-A based epoxide diluted with alkyl glycidyl ether and a polyetheramine curing agent was used, where the mix ratio of epoxide to curing agent was 100:40 by weight. As the conductive nanofillers, CB particles with a specific surface area of 512 m2/g were used.
CB-filled epoxy
CB particles were dispersed in epoxide using a magnetic stirrer and a sonication bath. The first step was combining proper amounts of CB and epoxide. Afterwards, the CB-epoxide mixture was magnetically stirred for 15 min at a rate of 250 r/min. Following the stirring procedure, specimens were sonicated for 4 h at room temperature by using a sonication bath, which operates at 45 kHz. After sonication was complete, the mixture was stirred for 15 additional minutes by using the magnetic stirrer operating at 250 r/min. Finally, a proper amount of curing agent was added into the dispersed CB–epoxide mixture. Mixing of the curing agent and CB–epoxide mixture was ensured by stirring by hand for 5 min. Specimens with compositions of 0.05 wt%, 0.3 wt%, 0.5 wt%, 1.0 wt%, and 1.5 wt% CB in the epoxy/curative mixture were produced. The 0.05% composition was only used for the CB-filled epoxy thin film experiments, whereas the other compositions were used for CB-filled glass/epoxy composite plate experiments.
CB-filled epoxy thin film
In order to observe the networking of CB particles in epoxy in real time, thin film specimens were produced and the process was monitored using an optical microscope. A small amount of liquid CB-filled epoxy with 0.05 wt% composition was injected in between a glass slide and a cover glass. Intentional air bubbles were introduced in between the glass slide and cover glass to serve as surrogates for nonconductive glass fibers. The growth of the CB network around the bubbles can be expected to be the same as that around glass fibers. A schematic of the specimen and a photograph of a cured thin film of CB-filled epoxy with air bubbles are shown in Figure 1.
(a) Schematic of the thin film specimen and (b) photograph of cured thin film of 0.05 wt% CB-filled epoxy aligned at 400 V/cm peak-to-peak AC voltage and 1 kHz frequency.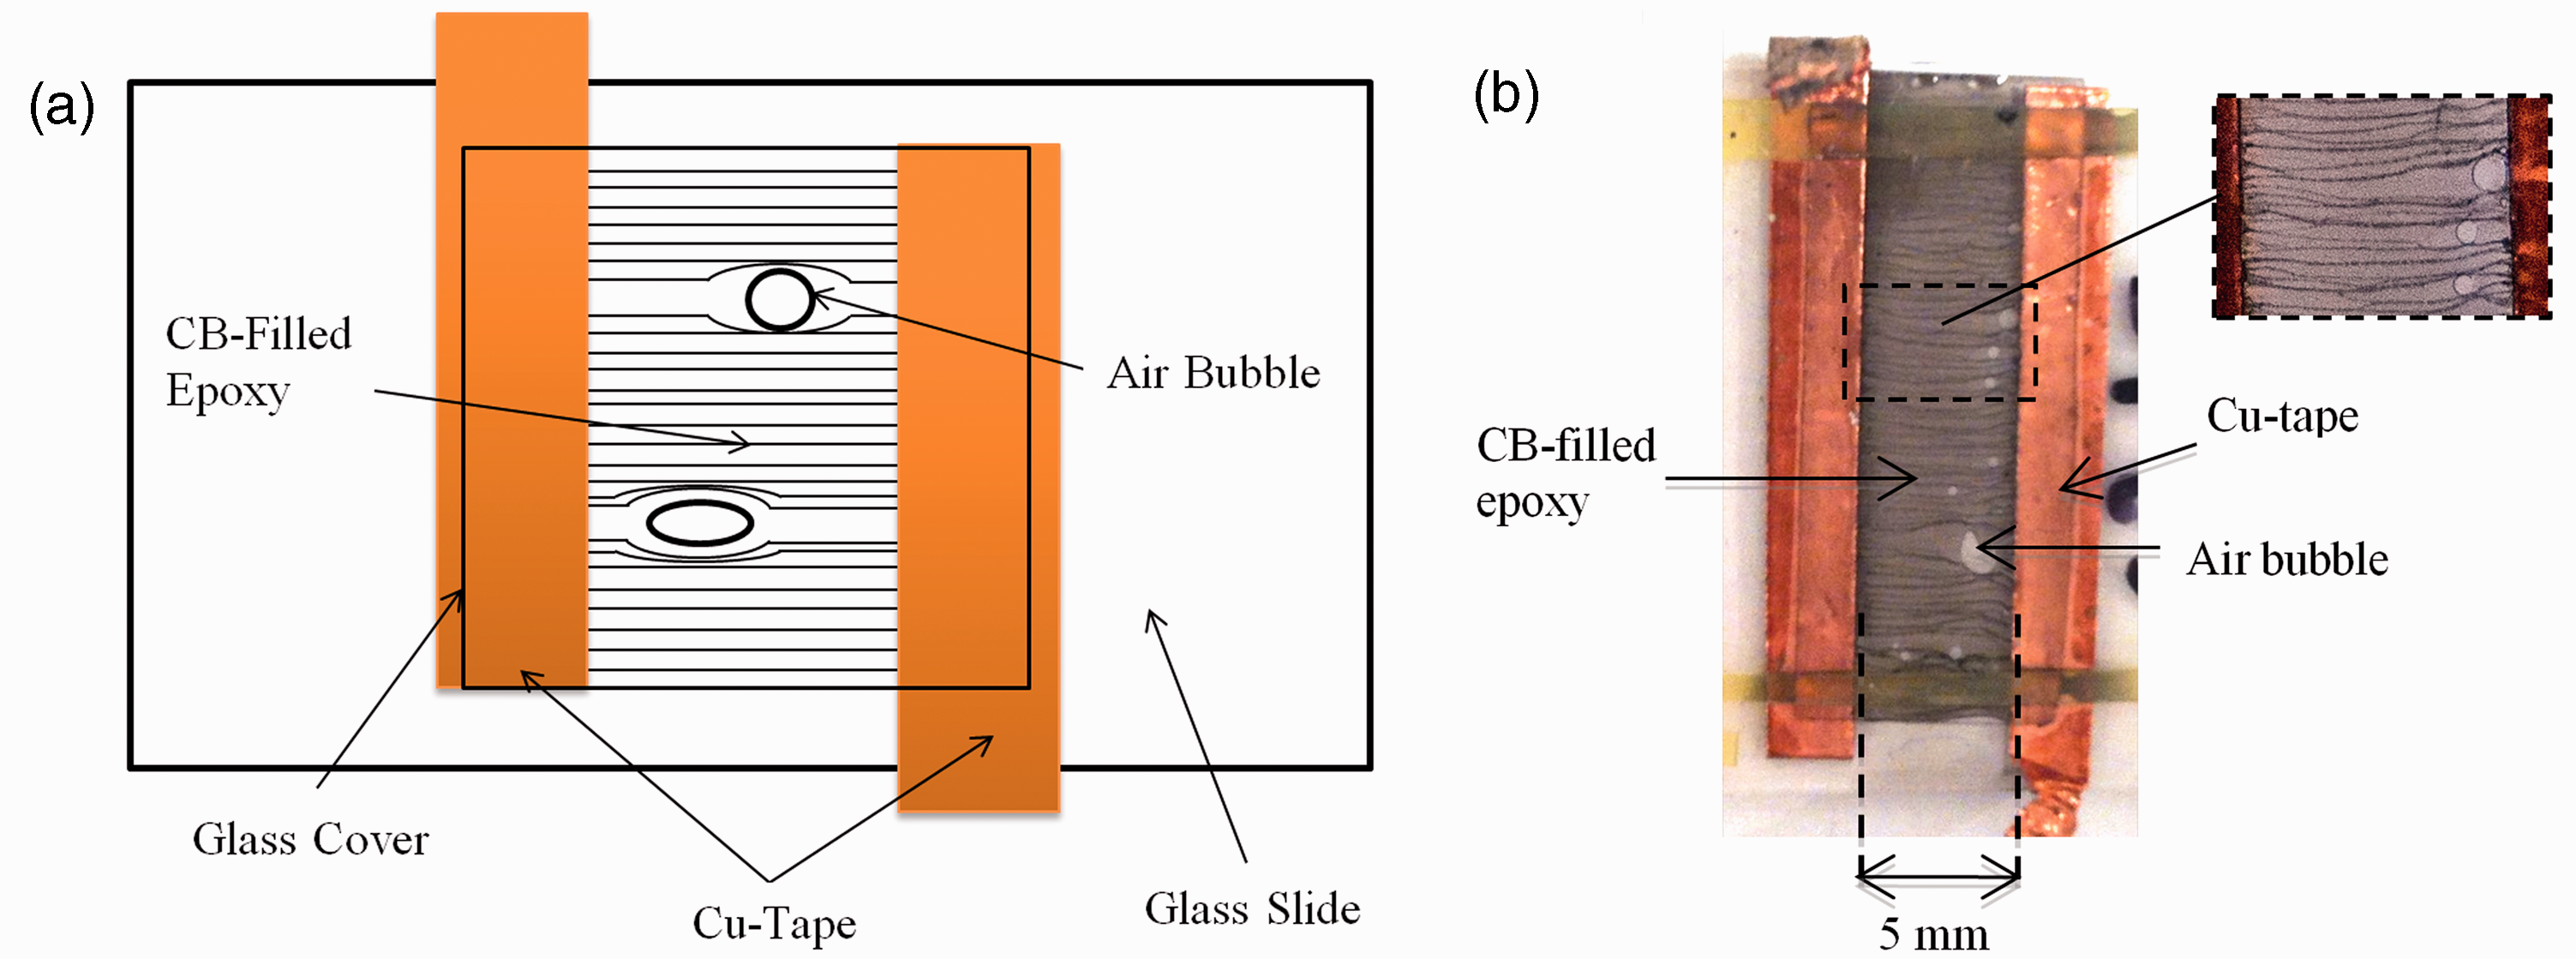
Separation distance between the glass slide and cover glass, as well as the thickness of the thin film, was controlled by two pieces of conductive copper tape that were stuck onto the glass slide 5 mm apart from each other. Dimensions of the thin films were set to 160 µm × 5 mm × 22 mm. An AC electric field of strength of 400 V/cm and frequency of 1 kHz was applied to the thin films using the two pieces of copper tape as electrodes.
A sinusoidal AC field was applied to the specimens using a function/arbitrary waveform generator, and the intensity of the AC field was amplified by using a piezo driver/power amplifier. Stray DC field was minimized by adjusting the polarity and amount of the offset DC voltage of the piezo driver/power amplifier. A constant AC peak-to-peak voltage was used throughout the following curing process: 30 min at 65℃; 2 h at 80℃; and 3 h at 125℃.
CB-filled glass/epoxy composite plates
Composite plates were produced using hand lay-up and vacuum bag consolidation/cure. The production setup is shown in Figure 2. Eighteen layers of stitched UD glass fibers were first impregnated with CB-filled epoxy resin using a roller. The impregnated layers were then stacked on a release-film-covered aluminum tool plate, with aluminum foil electrodes at the top and bottom of the laminate for networking the CB particles through the thickness with an AC field. In order to observe the changes in conductivity due to electric field, control specimens without AC field were also produced. Although the control specimens were not subjected to an electric field during processing, they still had aluminum foil on their top and bottom surfaces. AC peak-to-peak voltages of 400, 600, 800, 1200, and 1600 V/cm, and frequencies of 100 Hz, 1 kHz, and 10 kHz were applied to different specimens. The AC field was provided to the specimens using the waveform generator and power amplifier.
Production of CB-filled glass/epoxy plates: (a) cross-sectional schematic of the vacuum bag and (b) photograph of CB-filled glass/epoxy laminate prior to sealing the vacuum bag.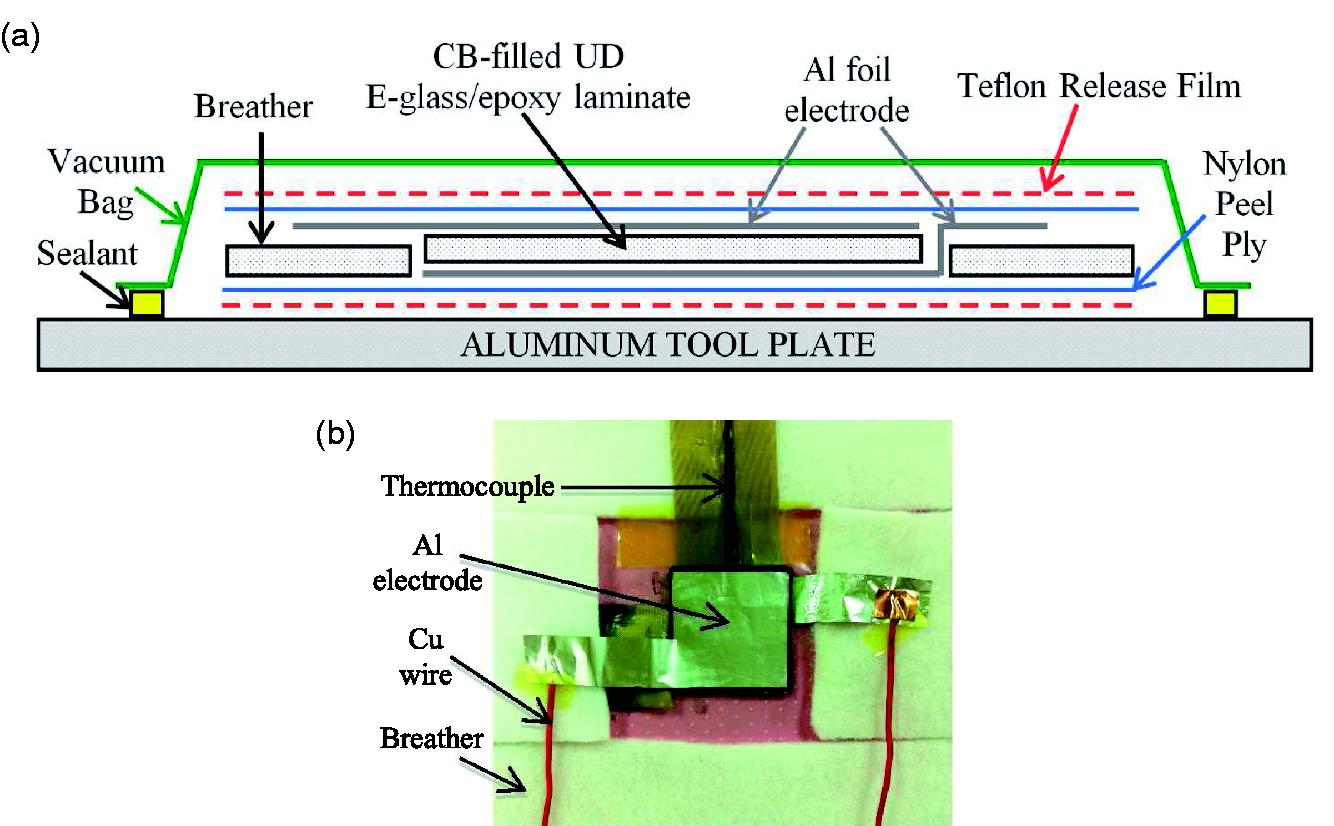
Care was exercised to avoid the contact of aluminum electrodes with each other and with the aluminum tool plate. A thermocouple was placed in contact with the laminate to verify that the laminate was not overheated during the application of electric field. Following the sealing of the bag, approximately 720 mm Hg vacuum was applied to the part. After stabilization of the vacuum, AC electric field was applied and kept on during the whole curing cycle. The curing schedule was as follows: 30 min at 65℃; 2 h at 80℃; and 3 h at 125℃. Overheating was only observed in specimens that contained 1% and 1.5% CB under the applied AC field of 800 V/cm and 1 kHz, with a maximum specimen temperature of 87℃ when the target temperature was 80℃. There was no overheating during the first (65℃) and last (125℃) steps of curing. During demolding of the cured composite plates, it was seen that resin flow occurred mainly along in-plane directions. The cured composite plates had dimensions of 5 cm length × 5 cm width × 0.25 cm thickness and a calculated fiber volume fraction of 0.60 ± 0.02.
DC electrical conductivity measurements
Once the specimens were cured, they were taken out of the mold and cut into a smaller dimension of 3 cm × 3 cm × 0.25 cm using a water-cooled diamond saw to eliminate the tapered thickness near the edge caused by the vacuum bag. Next, the aluminum electrodes were removed from the specimens and all the six surfaces were sanded using 220, 400, and 600 grit abrasive papers in sequence. Following the sanding procedure, each surface was cleaned with acetone. Opposing parallel surfaces were then painted with silver paint and left to cure at room temperature for at least 3 h.
In order to complete the circuit for measuring DC resistance, copper wires were attached to the silver painted surfaces using copper tape that has conductive adhesive. After the first resistance measurement, the silver paint was removed from the previously painted surfaces using acetone and fresh paint was applied to other parallel surfaces to conduct measurements in all three principal directions: in-plane longitudinal (relative to the continuous glass fibers); in-plane transverse; and through-thickness. DC resistance was determined by applying various DC voltages to the cured CB-filled glass/epoxy composites and by measuring the corresponding DC currents using a pico-ammeter. Once the voltage versus current curve was constructed, resistance was calculated from the slope. After obtaining the resistance, DC conductivity was calculated using the relationship in equation (1)
Results and discussion
Networking in CB-filled epoxy thin films
In glass/epoxy composites, glass fibers are not only geometrical obstacles for networks of CB particles but also electrical obstacles due to their much lower conductivity compared to the CB-filled epoxy matrix. Directly observing particle networking transverse to the glass fibers would therefore be of interest in this investigation. However, due to the challenges of designing such an experiment, an easier, indirect approach was chosen: air bubbles were used to simulate the cross-section of glass fibers. It is believed that air can be used to simulate the behavior of E-glass, since the former has a lower dielectric strength than the latter. If air does not transform into a conductive state at a given electric field, E-glass will not undergo this transformation as well. It can be safely assumed that air does not become conductive for the specimen dimensions and the electric field strengths used in this investigation. This behavior can also be seen in Figure 3, where air bubbles act as nonconductive obstacles.
Optical microscope images of a 0.05% CB-filled epoxy thin film showing preferential CB networking around two different air bubbles. Electric field (EF): 400 V/cm peak-to-peak AC voltage, 1 kHz frequency.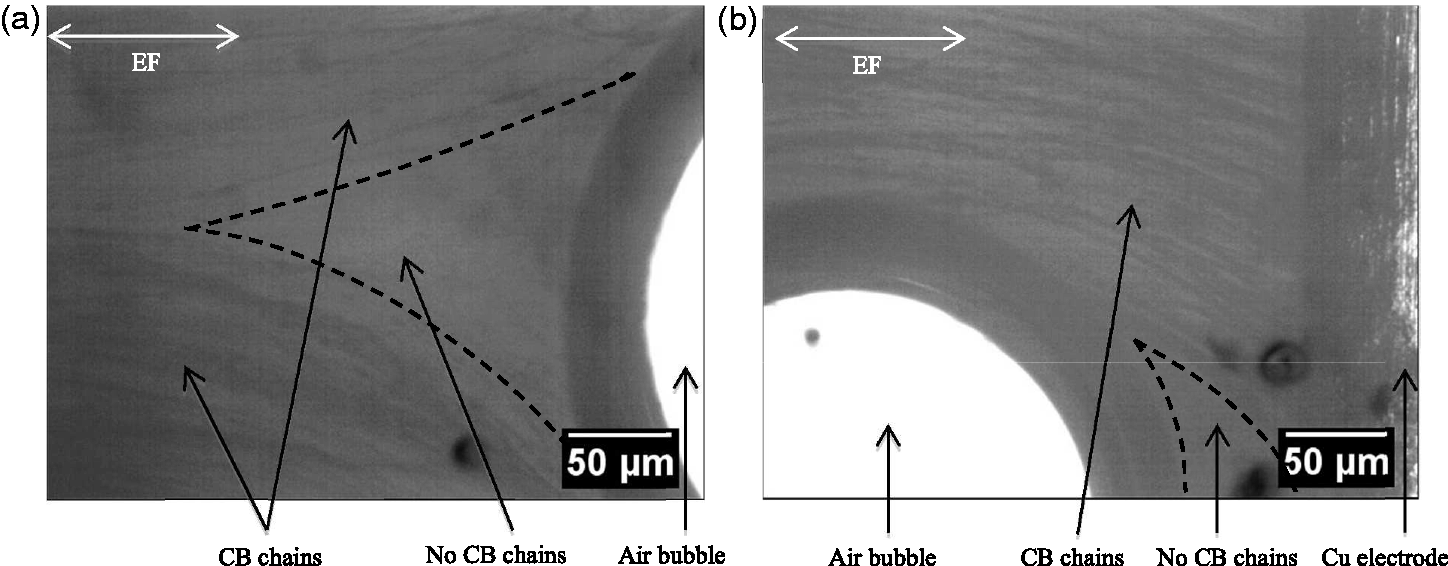
In Figure 3, it is seen that CB chains bend around the nonconductive inclusions, extending between the electrodes. This effect can also be seen by unaided eye, if carefully examined, as in Figure 1(b). Another interesting finding is that there are regions close to the air bubbles containing no CB chains. These regions are present because of the altered electric field due to the presence of nonconductive inclusions. That is, the electric field bends around the inclusions as it connects the two electrodes.
It is believed that the behavior demonstrated in Figure 3 is important for the anisotropic networking of CB in glass/epoxy composites. It shows that with adequate electric field strength, networking can occur between the electrodes, even though obstacles exist for the formation of these networks. Therefore, it is concluded that anisotropic networking can be obtained in glass/epoxy composites once the appropriate manufacturing parameters are identified. The next section deals with the determination of appropriate manufacturing parameters.
CB networking in glass/epoxy composite plates
CB particles were networked in UD glass/epoxy composite plates during processing using different peak-to-peak AC voltages, AC frequencies, and CB amounts. The effects of these three parameters on the anisotropic DC conductivity of the cured material are described in detail next.
Effect of CB amount
Glass/epoxy composite plates were produced with 0.3%, 0.5%, 1.0%, and 1.5% CB by weight at 800 V/cm peak-to-peak AC voltage and 1 kHz AC frequency. DC conductivities of each composition along the through-thickness, in-plane transverse, and in-plane longitudinal directions are given in Figure 4. As the amount of CB increases, DC conductivities in each direction increase. At 0.3% CB, the conductivities are similar to or less than the 10−7 S/m value observed by Wichmann et al.
18
in all directions in cross-ply glass/epoxy with 0.3% CB. Beyond 1.0% CB, the change in conductivity with CB content diminished, suggesting a stabilization of network formation beyond 1.0% CB.
DC conductivities of glass/epoxy composite plates for different CB concentrations. Peak-to-peak AC voltage – 800 V/cm, AC frequency – 1 kHz. In the 0.3% and 1.5% CB cases, the error bars indicate the range of conductivities for three replicate specimens prepared from separate batches of material, while the main bars indicate mean values for the three specimens.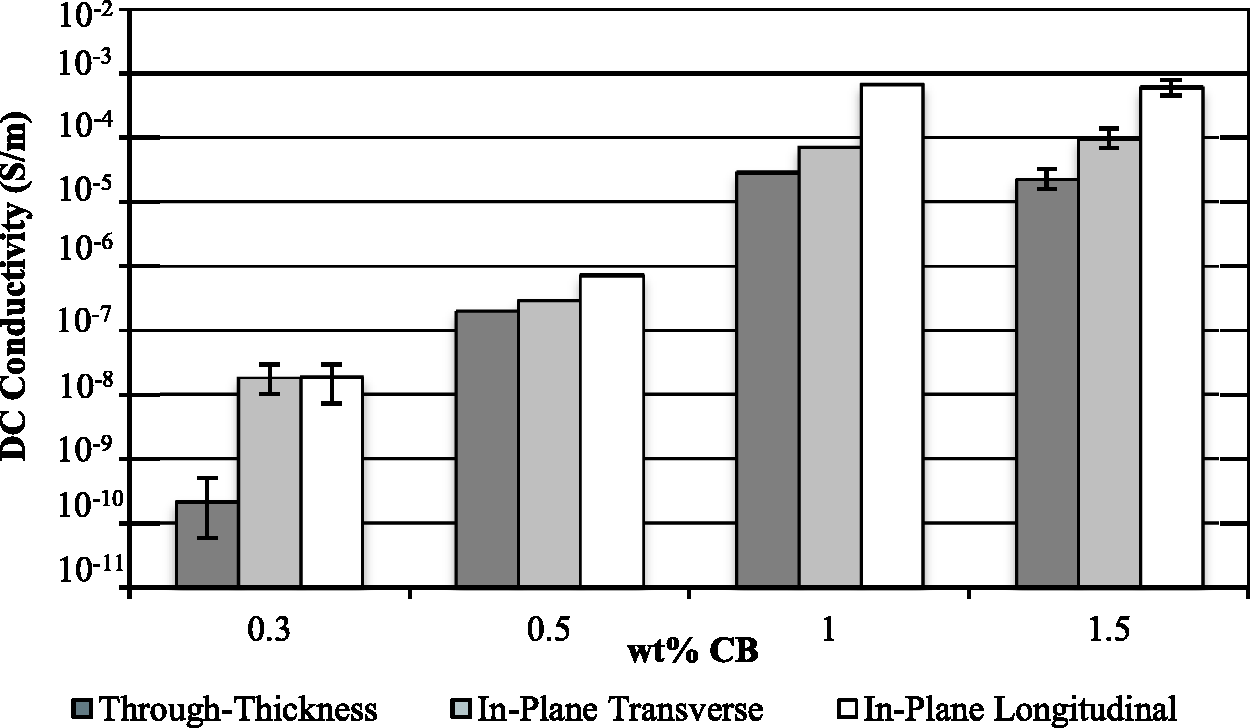
It is also seen in Figure 4 that the highest conductivity is consistently obtained along the in-plane longitudinal direction, whereas the lowest conductivity is consistently obtained along the through-thickness direction. It can be expected that CB networks will form more readily in the in-plane directions since resin flow is predominantly in these directions during processing, as observed during demolding of the plates. In turn, in-plane longitudinal conductivity can be expected to be higher compared to in-plane transverse conductivity due to unhindered conductive pathways in the channels of resin parallel to the UD glass fibers, as observed by Thostenson et al. 21 in the case of CNTs dispersed in UD glass FRP composites.
Variability of the conductivity results was evaluated by producing multiple plates with the lowest (0.3%) and highest (1.5%) concentrations of CB. Variability of the intermediate concentrations can be expected to fall between these extreme cases. For 0.3% and 1.5% compositions, three different CB-filled epoxy mixtures were prepared and sonicated separately. From each batch, one CB-filled UD glass/epoxy plate was manufactured, and electrically tested along each principal direction. The error bars in Figure 4 show the range of conductivities of the three replicate specimens for each CB concentration. It is seen that the variability in relation to the mean increases with decreasing conductivity. The coefficients of variation ranged from 57% to 113% for 0.3% CB and 29% to 42% for 1.5% CB.
Effect of AC voltage
In order to observe the effect of field strength during processing on the DC conductivities after cure, glass/epoxy composite plates were produced with 0.5% CB, using 0, 400, 600, 800, 1200, and 1600 V/cm peak-to-peak AC voltages and 1 kHz AC frequency (Figure 5). Except for the highest voltage evaluated (1600 V/cm), the highest conductivity was obtained along the in-plane longitudinal direction. With increasing applied voltage, an increase in through-thickness and in-plane transverse conductivities was observed, with insignificant changes in the in-plane longitudinal conductivity. This suggests that the geometrical advantage of conductive networks parallel to the fibers is difficult to overcome by applying networking electric field to CB particles transverse to the fibers. It is noteworthy that the in-plane transverse conductivity increases along with the through-thickness conductivity as the networking field strength increases. However, the in-plane transverse conductivity does not increase as much as the through-thickness conductivity. A certain degree of increase in the in-plane transverse conductivity can be expected due to: (a) flow of the resin in this direction during consolidation, as evidenced by the in-plane transverse conductivity being about 100 times greater than the through-thickness conductivity with no networking field applied; and (b) a certain degree of networking of the CB chains in the in-plane transverse direction as the chains are forced to bend around the glass fibers (e.g. Figure 3).
DC conductivities of 0.5% CB-filled glass/epoxy composite plates for different peak-to-peak AC voltages (1 kHz AC frequency).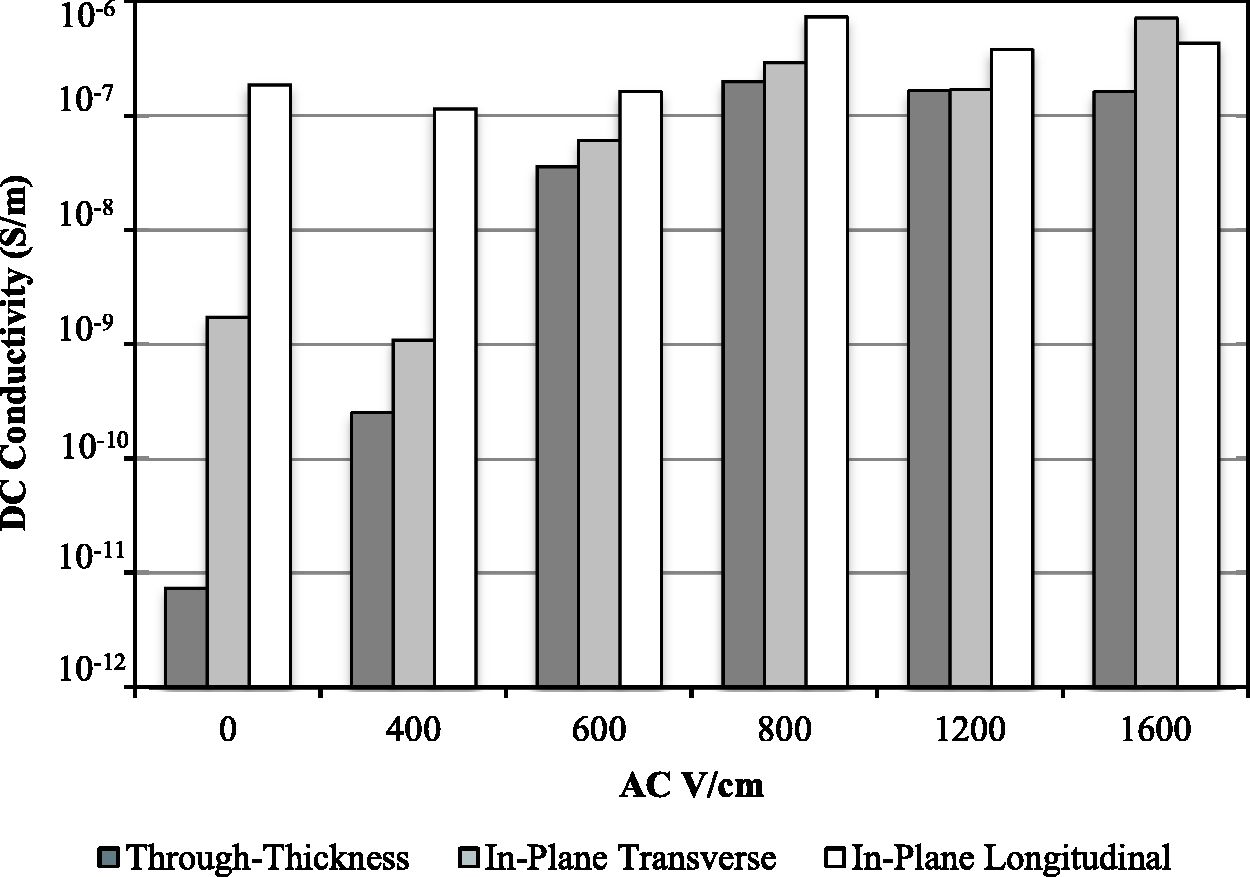
With no applied electric field, the conductivity in the through-thickness direction is less than that in the in-plane longitudinal direction by a factor of 104. With the application of electric field, this factor diminished to as small as 10 due to significant increases in through-thickness conductivity and relatively small changes in the in-plane longitudinal conductivity. For peak-to-peak AC voltages of 800 V/cm and greater, conductivities did not change additionally, suggesting a point of diminishing returns.
For the 0.5% CB-filled glass/epoxy composite plate, the highest DC electrical conductivity along through-thickness direction was obtained when the applied voltage was 800 V/cm. For this case, through-thickness conductivity increased by a factor of 104 with respect to the case where no electric field is applied. The conductivity changes along in-plane directions were considerably smaller compared to through-thickness conductivity change. To the authors’ knowledge, this is the first time such a high increase in through-thickness conductivity has been observed in UD glass/epoxy composites with conductive nanofillers. As mentioned earlier, previous investigations demonstrated about one order of magnitude increase in the through-thickness conductivity of glass FRP composites with CNT fillers by applying an AC electric field curing processing.18,19
The effect of AC voltage on glass FRP plates containing 1.0% and 1.5% CB by weight was also investigated (Figure 6). For 1.0% CB-filled glass/epoxy composites, there is a slight increase in the conductivities along each direction with an increase in networking voltage. Although the increase is not as remarkable as the 0.5% CB-filled glass/epoxy plates shown in Figure 5, the 1.0% composition also gives a similar overall response to AC networking voltage. However, this is not the case for 1.5% CB composition. For the 1.5% CB case, the conductivities in the three directions are relatively unaffected by the change in AC networking voltage. This result suggests that there exists a composition beyond which conductivities do not respond to AC networking voltage. This is attributed to the immediate formation of a three-dimensional network of fillers even before any AC field is applied. The applied field is then routed directly through the network, preventing the formation of preferentially aligned chains of CB.
DC conductivities of: (a) 1.0% and (b) 1.5% CB-filled glass/epoxy composite plates for different peak-to-peak AC voltages (1 kHz AC frequency).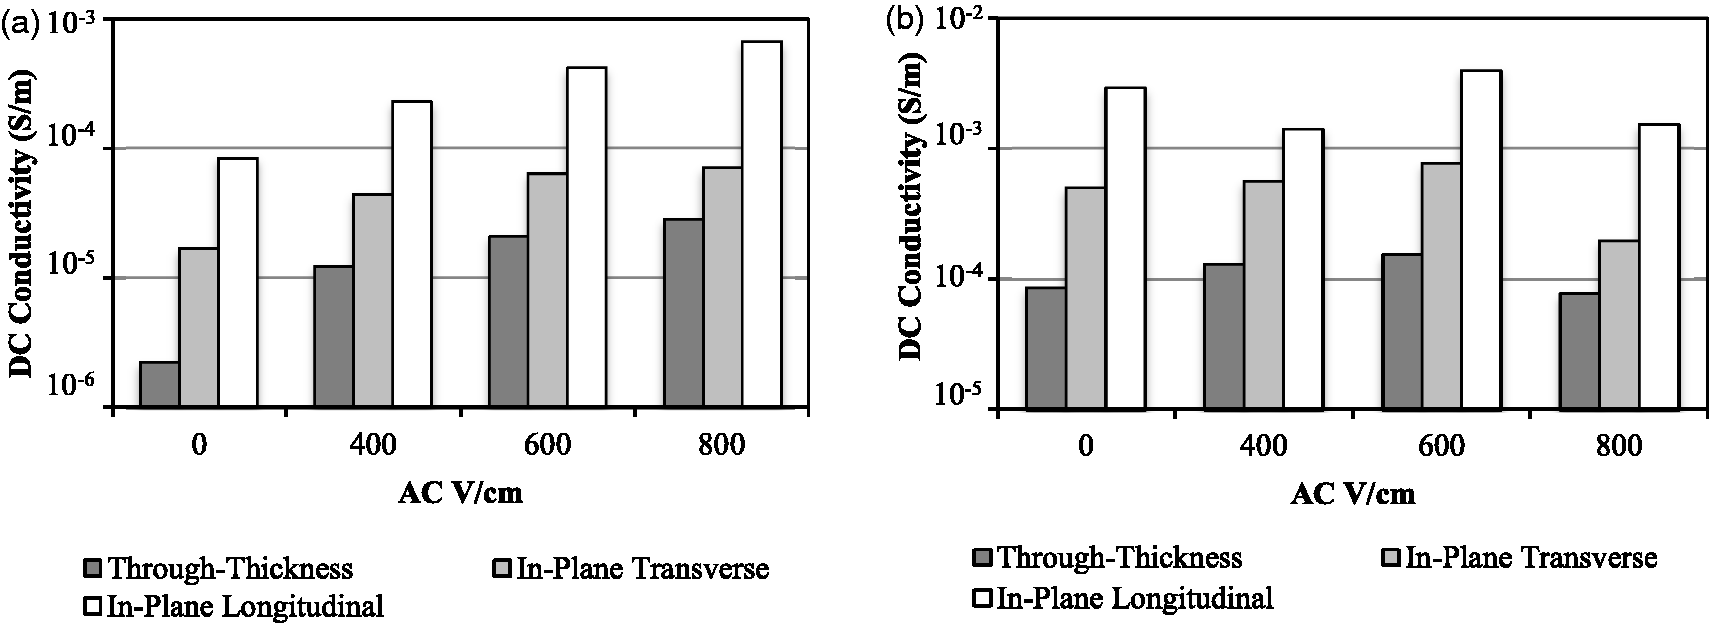
Effect of frequency
The effect of frequency on the anisotropic networking of CB in glass/epoxy composites was investigated for the 0.3% CB composition and 1200 V/cm peak-to-peak AC voltage. These particular composition and voltage parameters were chosen based on their potential to maximize the ratio of through-thickness to in-plane conductivity (as discussed later). Three different frequencies were evaluated: 100 Hz, 1 kHz, and 10 kHz (Figure 7). On average, conductivities along each direction exhibited a maximum at the 100 Hz frequency. However, the effect of frequency is not as remarkable as the effect of voltage and CB amount. Although the frequencies were changed logarithmically, conductivity values did not vary considerably. Overall, these findings suggest that frequency does not have a significant effect on the anisotropic networking of CB chains and, hence, DC conductivities in UD glass/epoxy composites.
DC conductivities of 0.3% CB-filled glass/epoxy composite plates for different AC networking frequencies. Peak-to-peak AC voltage: 1200 V/cm. In the 1000 Hz case, the error bars indicate the range of conductivities for three repeated measurements of the same specimen, where the silver paint was removed and re-applied three times, and the main bars indicate mean values for the three measurements.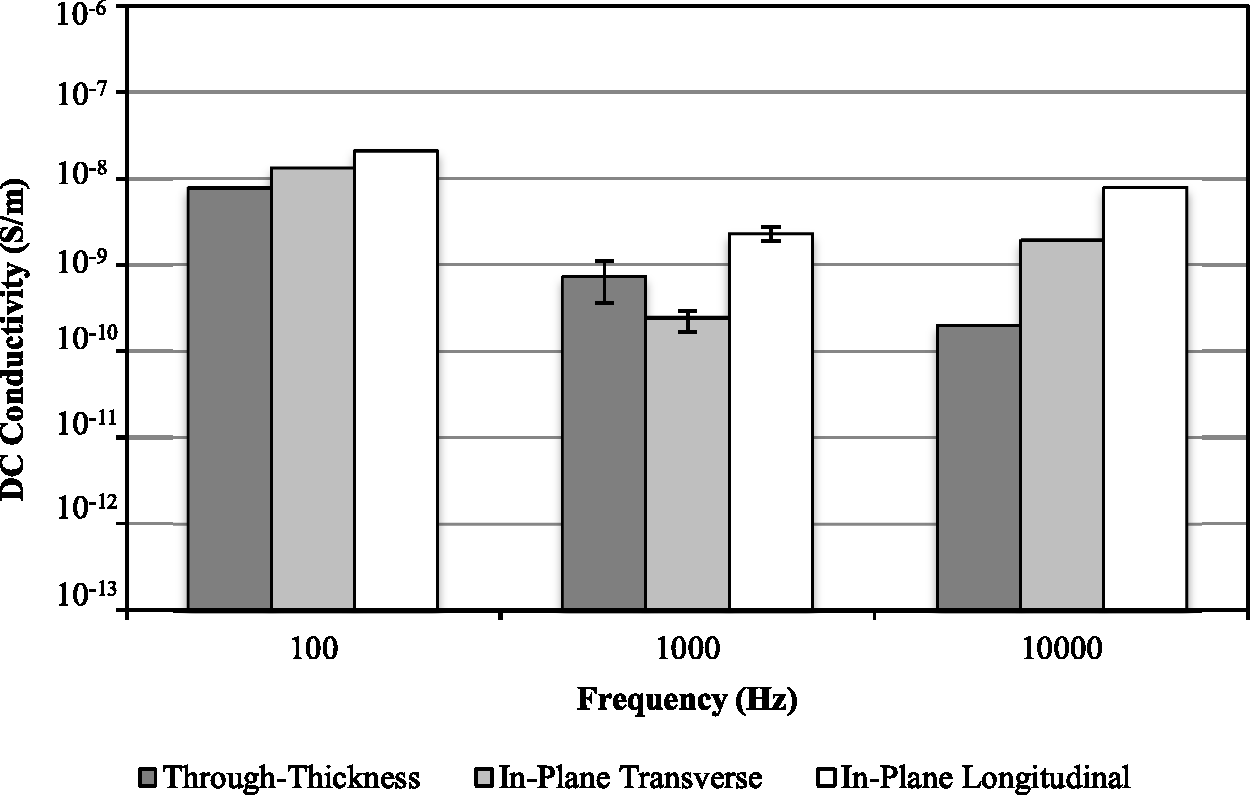
Error bars are shown for the 1000 Hz case in Figure 7 to show the range of conductivity data obtained from a single specimen by repeately removing and re-applying the silver paint and wires three times. The coefficients of variation range from 18% to 51%.
Anisotropy studies
Additional parametric studies were carried out with the aim of maximizing the ratio of through-thickness conductivity to in-plane conductivity. Figure 8(a) shows the ratio of through-thickness conductivity to in-plane transverse conductivity (σ3/σ2) and Figure 8(b) shows the ratio of through-thickness conductivity to in-plane longitudinal conductivity (σ3/σ1), for different material compositions and networking field strengths. Both of the anisotropy ratios exhibited a similar behavior with σ3/σ2 being greater than σ3/σ1 for all the cases. The anisotropy ratio σ3/σ1 was less than 1 for all cases, whereas the anisotropy ratio σ3/σ2 exceeded 1 for a few cases. For the two highest concentrations of CB (1.0 wt% and 1.5 wt%), anisotropy ratios σ3/σ2 were well below 1. This result is attributed to the immediate locking-in of the initial unaligned network upon the application of electric field during cure. For these two concentrations of CB, the experiments were carried out up only to 800 V/cm AC voltage since voltage did not significantly affect the conductivity for these compositions, as shown in Figure 6. For 0.5% CB and 1200 V/cm applied voltage, the anisotropy ratio σ3/σ2 was close to 1. For 0.3% CB at 1200 V/cm and 1600 V/cm, anisotropy ratios σ3/σ2 greater than 1 were obtained. To authors’ knowledge, this is the first study where an anisotropy ratio greater than 1 was obtained in CB-filled UD glass/epoxy composites. For this composition, it is believed that there were enough CB particles to form continuous chains along through-thickness direction, yet not so much as to lead to immediate locking of the initial network upon application of the electric field.
Anisotropy ratios (a) σ3/σ2, and (b) σ3/σ1 of glass/epoxy plates made with different weight percents of CB, with respect to AC voltage applied for networking (σ1 – in-plane longitudinal, σ2 – in-plane transverse, σ3 – through-thickness conductivities). AC frequency – 1 kHz.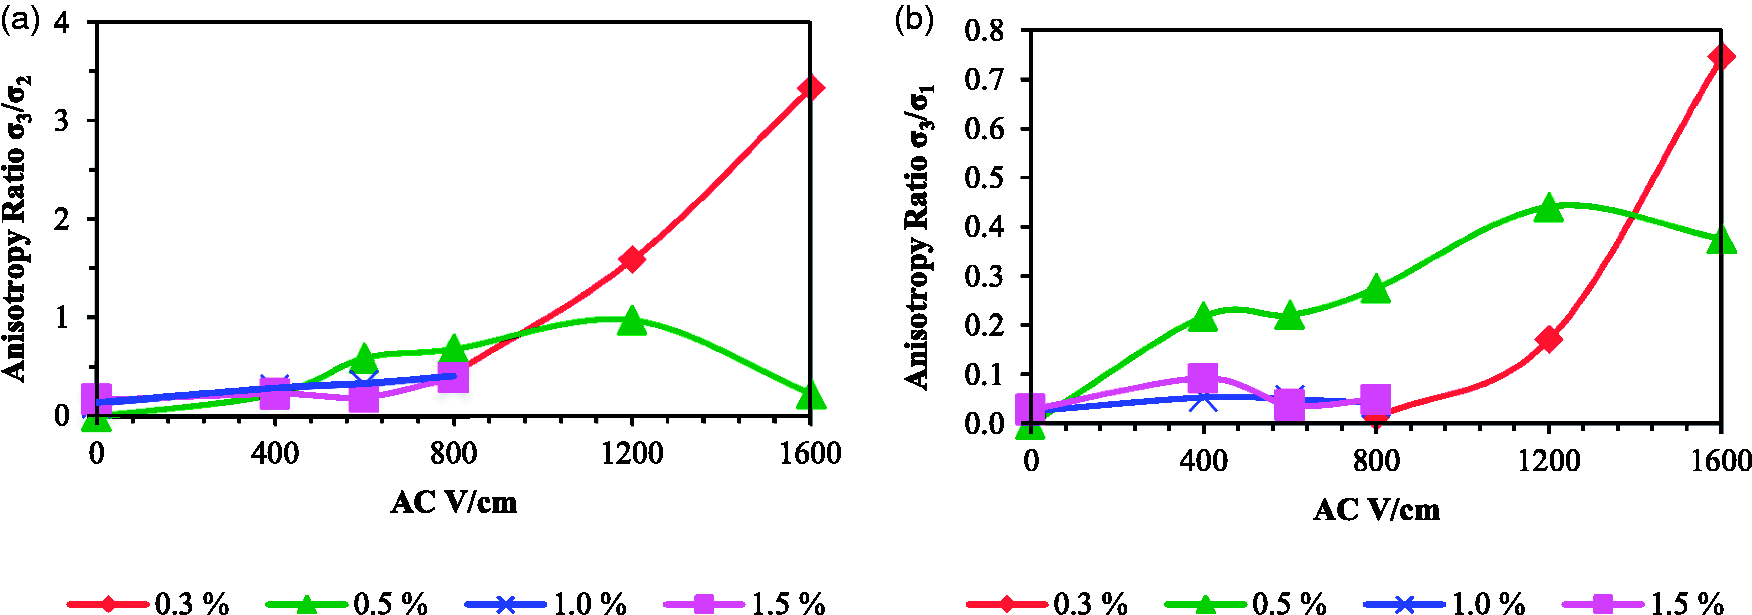
Conclusions
Preferential networking of CB nanoparticles in glass/epoxy composites was investigated by measuring and comparing DC electrical conductivities in three principal directions: through-thickness, in-plane transverse, and in-plane longitudinal. CB particles were anisotropically networked in chains along the through-thickness direction of UD glass/epoxy plates using an AC electric field applied during cure.
In order to directly observe the effect of AC electric field on CB particles near nonconductive inclusions, thin film experiments were devised. The results showed the formation of continuous CB chains around nonconductive inclusions, connecting the AC electrodes. These results visually demonstrated that CB particles can be preferentially networked perpendicular to the fibers of a glass/epoxy composite.
The effects of CB amount and AC field strength and frequency on the post-cure DC conductivities along the three principal material directions of the unidirectional glass/epoxy composite were evaluated. As the CB amount was increased, conductivities in each direction also increased. This effect was less significant for compositions containing CB amount equal to or greater than 1.0%, hypothetically due to the formation of a random network of CB particles prior to the application of electric field, which prevents further manipulation of the particles due to the applied field. Conductivities also increased with an increase in AC networking voltage up to 800 V/cm. For AC voltages equal to or greater than 800 V/cm, there was not any significant change in the conductivities. It was further realized that frequency of the AC networking field has the least effect on preferential networking among the evaluated parameters.
Through-thickness conductivity increased by a factor of 104 when a CB amount of 0.5 wt%, peak-to-peak AC voltage of 800 V/cm, and AC frequency of 1 kHz was used, in comparison to the case with no electric field. Same order of magnitude DC conductivities were obtained in all three directions for 0.5% CB, 1 kHz frequency, and peak-to-peak AC voltages equal to and greater than 800 V/cm. Anisotropy ratio σ3/σ2, or the through-thickness conductivity divided by the in-plane transverse conductivity, was greater than 1 for 0.3% CB-filled glass/epoxy composites produced with 1200 V/cm and 1600 V/cm AC voltages and 1 kHz frequency.
Footnotes
Funding
This research was funded by the US Army Research Office under grant W911NF-10-1-00267.
The views and conclusions contained in this document are those of the authors and should not be interpreted as representing the official policies, either expressed or implied, of the U.S. Government.
Conflict of interest
None declared.