
Abstract
Due to their high specific stiffness, carbon-filled epoxy composites can be used in structural components in aircraft. Graphene nanoplatelets are short stacks of individual layers of graphite that are a newly developed, lower cost material that often increases the composite tensile modulus. In this work, researchers fabricated neat aerospace epoxy (EPON 862 with Curing Agent W) and 1 to 6 wt% of two different types of graphene nanoplatelets (XG Sciences xGnP®-M-5 and xGnP®-C-300) in epoxy composites. These materials were tested for tensile properties using typical macroscopic measurements. In addition, nanoindentation was used to determine modulus and creep compliance. The macroscopic measurements showed that the tensile modulus increased from 2.72 GPa for the neat epoxy to 3.35 GPa for 6 wt% (3.7 vol%) xGnP®-M-5/epoxy composite and 3.10 GPa for 6 wt% (3.7 vol%) xGnP®-C-300/epoxy composite. The modulus results from nanoindentation followed this same trend. xGnP®-C-300/epoxy composites had higher tensile strength and ductility compared to similar loading levels of xGnP®-M-5/epoxy composites. The creep compliance for the neat epoxy, 1 to 6 wt% xGnP®-M-5/epoxy composites, and 1 to 6 wt% xGnP®-C-300/epoxy composites were similar. The two dimensional randomly oriented filler Halpin-Tsai model adjusted for platelet filler shape predicts the tensile modulus well for the xGnP®-M-5/epoxy composites and the three-dimensional randomly oriented filler Halpin-Tsai model works well for the xGnP®-C-300/epoxy composites. Per the authors’ knowledge, mechanical properties and modeling for xGnP®-M-5 and xGnP®-C-300 in this epoxy system has never been reported in the open literature.
Introduction
Due to the relatively high specific (per unit mass) mechanical properties of carbon-filled polymer composites, they are often used as structural components in fuselages and control surfaces in subsonic fixed-wing aircraft. Epoxy is sometimes used as a matrix material in these composites. Graphene nanoplatelets (GNPs) are short stacks of individual layers of graphite (called graphene) that often increase the tensile modulus of a composite material and are available at a lower cost ( ∼ $5 -$20/lb) compared to carbon nanotubes.1–5 Nanostructured materials (defined as a material with at least one constituent whose characteristic length is on the order of tens of nanometers or smaller) can be used in high stiffness (tensile modulus) applications. GNP/epoxy composites are nanostructured materials. The Halpin-Tsai model (which accounts for constituent properties, concentrations of each constituent, as well as aspect ratio and orientation of the filler) has been used to predict the tensile modulus of composites containing GNP.4,6–9
In this work, researchers used EPON 862 with Curing Agent W for the epoxy matrix material. Composites containing two types of GNP (XG Sciences: xGnP®-M-5 with 5 µm average particle diameter and xGnP®-C-300 with 2 µm average particle diameter) in this epoxy were fabricated and tested for tensile properties using typical macroscopic measurements. In addition, nanoindentation was used to determine modulus, hardness, and creep compliance. The first goal of this work was to determine the effects of two different types of GNP on composite mechanical properties as measured by nanoindentation and macroscopic tensile tests. The second goal was to model the composites tensile modulus. Per the authors’ knowledge, material properties and modeling for xGnP®-M-5 and xGnP®-C-300 in this epoxy resin system have never been previously reported in the open literature.
Materials and experimental methods
Materials
In all, 100 g of EPON 862 (diglycidyl ether of bisphenol F, DGEBF) was added to 26.4 g of EPIKURE Curing Agent W (diethyltoluenediamine, DETDA). The viscosity of EPON 862 and EPIKURE Curing Agent W at 25℃ is ∼35 P and ∼200 cP, respectively. EPON 862 is a low-viscosity, liquid epoxy resin manufactured from epichlorohydrin and Bisphenol-F.10,11 This epoxy system is available from Momentive Specialty Chemicals, Inc., and the density of the cured epoxy resin is 1.2 g/mL. 10
Two fillers, both from XG Sciences, were used in this study. The first filler was xGnP®-M-5 graphene nanoplatelets. xGnP®-M-5 has a 5 -µm average particle diameter and a thickness of 7 nm. xGnP®-M-5 has a density of ∼2.0 g/mL and a surface area of 130 m2/g. 1 The second filler was xGnP®-C-300, which has a 2 -µm average particle diameter and a thickness of 2 nm. xGnP®-C-300 has a density of ∼2.0 g/mL and a surface area of 300 m2/g. 1 Since xGnP®-C-300 is smaller and thinner, more edge groups are present and so they have more functional groups as compared to xGnP®-M-5. Photomicrographs of xGnP® are shown elsewhere.1–5
xGnP®-M-5 and xGnP®-C-300 loading levels in epoxy, tensile results obtained from ASTM D638 test method, and hardness and stress exponent from nanoindentation.
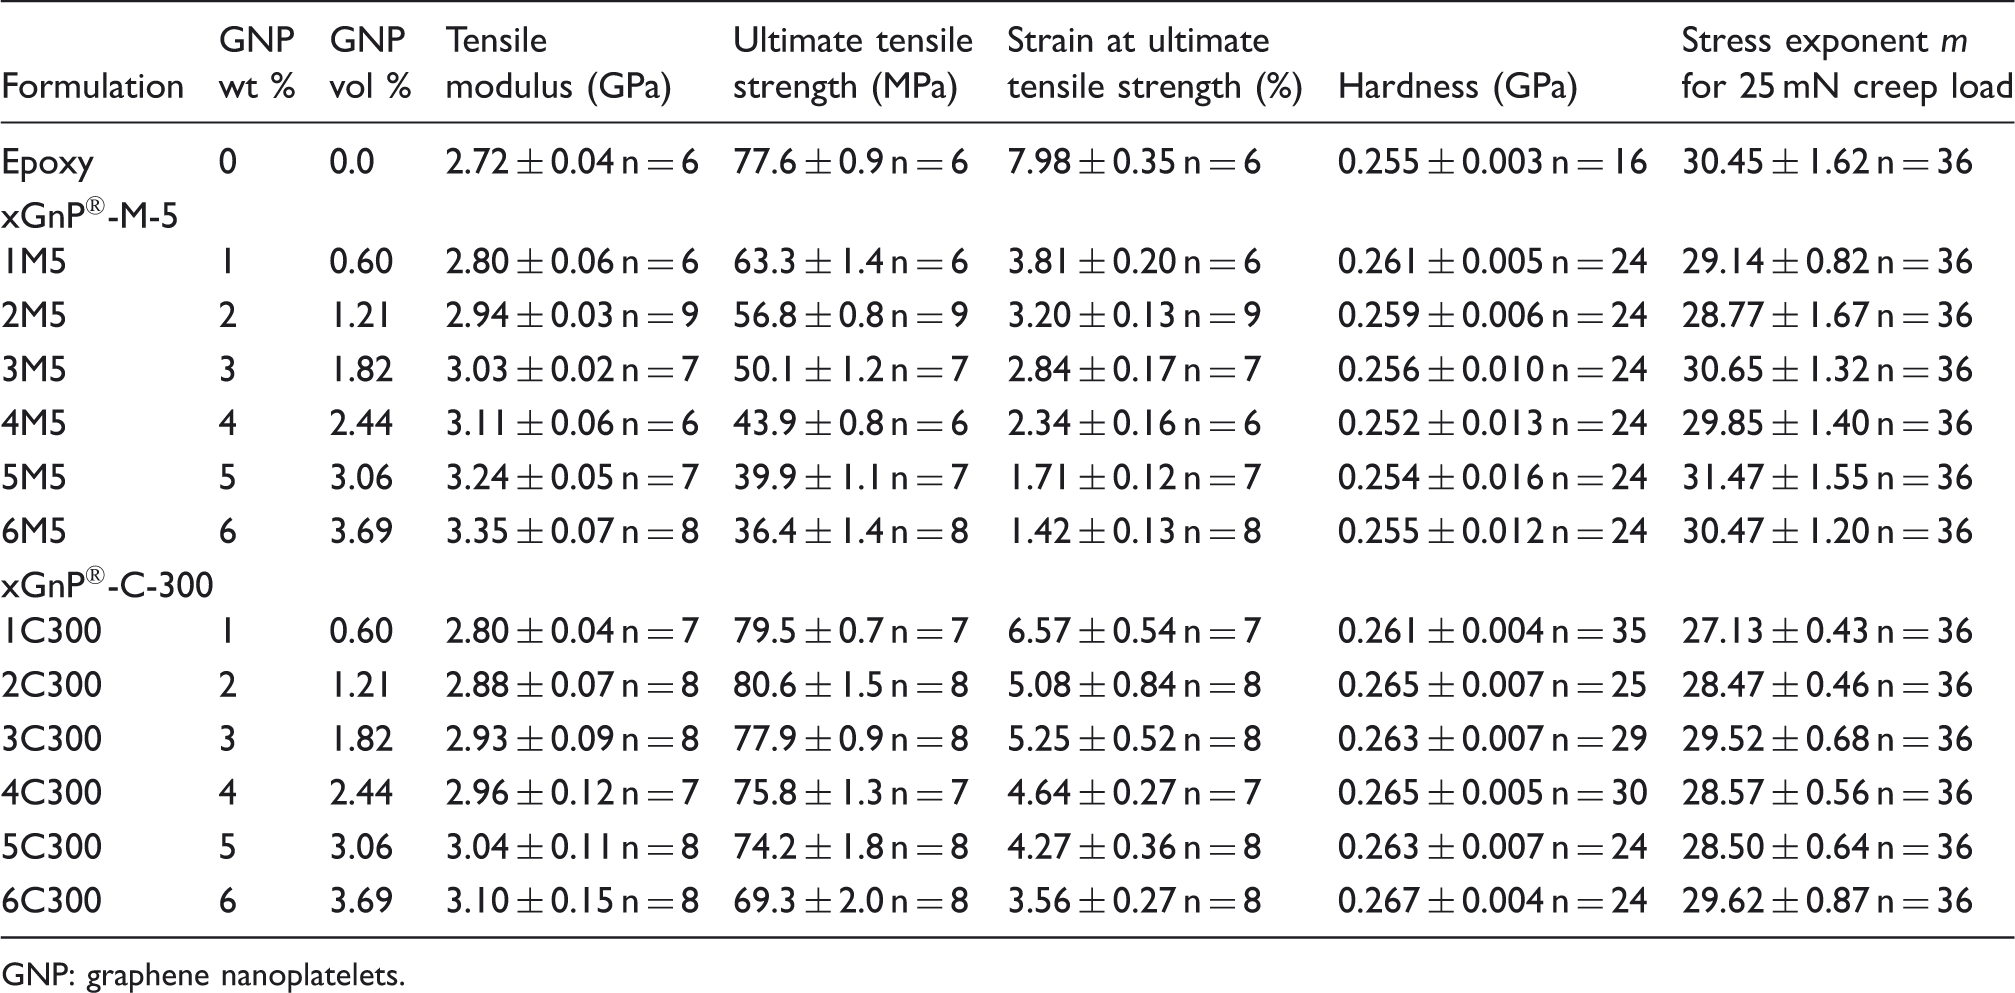
GNP: graphene nanoplatelets.
Test specimen fabrication
To fabricate the neat epoxy, 100 g of EPON 862 was added to 26.4 g of EPIKURE Curing Agent W at 23℃ and mixed by hand for 3 min. Then the mixture was degassed inside an oven at 90℃ and 29 inches Hg vacuum for 30 min and then poured into rectangular molds. The following cure cycle for aerospace epoxy resin was used: heat the cast in the oven to 121℃ over 30 min, hold at 121℃ for 2 h, then heat to 177℃ over 30 min and hold for another 2 h at 177℃, and finally cool to ambient temperature.10,12,13
To produce the xGnP®-M-5/epoxy composites, the appropriate amount of GNP was added to EPON 862. The material was mixed using a 2 in diameter disperser blade in a Ross high shear mixer HSM-100 LSK-I at 2500 r/min for 20 min. Then the mixture was placed in a Branson Bath Sonicator CPX2800H operating at 40 kHz for 60 min at 23℃. Next, the appropriate amount of Curing Agent W (always used 26.4 g Curing Agent W added to 100 g EPON 862) was added to the GNP/EPON 862 and blended in Ross mixer at 1000 r/min at 23℃ for 3 min. A slightly different method was used to fabricate the xGnP®-C-300 composites in order to obtain good dispersion of this smaller GNP. The appropriate amount of xGnP®-C-300 was added to EPIKURE Curing Agent W and mixed using a 2 in diameter disperser blade in a Ross high shear mixer HSM-100 LSK-I at 3500 r/min for 150 min. Next the mixture was placed in a Branson Bath Sonicator CPX2800H operating at 40 kHz for 60 min at 23℃. Then the appropriate amount of EPON 862 was added to the xGnP®-C-300/ Curing Agent W and stirred with the Ross mixer at 1000 r/min for 3 min at 23℃. In all cases, the mixture was degassed inside an oven at 90℃ and 29 inches Hg vacuum for 30 min and then poured into rectangular and disc-shaped molds. The same curing cycle for aerospace epoxy resin was used as described in the paragraph above. For the neat epoxy and the GNP/epoxy systems, the samples fabricated were rectangular bars (165 mm long by 19 mm wide by 3.3 mm thick).
Environmental scanning electron microscope test method
To view the dispersion of xGnP®-M-5 in epoxy, samples were prepared for environmental scanning electron microscope (ESEM) observation by mounting the composite (3 mm thick × 12 mm wide × 13 mm long cut from a tensile specimen) in a cast epoxy puck and the surface was prepared with SiC using the following grits: #400, #600, #800, and #1200. The sample was then polished using 9 -µm diamond suspension and then with 3 -µm diamond suspension on a Buehler Ecomet 4 variable speed grinder-polisher. The surface was finished with a 1 µm alumina/water slurry on the Ecomet 4 and then with a 0.05 µm alumina/water slurry in a Buehler Vibromet 1 vibratory polisher for 2 h. The polished samples were then coated with platinum (2 nm thick) using an Anatech Ltd. Hummer 6.2 Sputtering System. The composites were viewed using a Philips XL 40 Environmental Scanning Microscope at 15 kV accelerating voltage. The xGnP®-C-300 (2 nm thick, 2 µm in diameter) was too small to observe using this method.
Field emission electron microscope test method
In order to see the xGnP®-C-300 and xGnP®-M-5 in the epoxy sample at a higher magnification, the samples were prepared for field emission electron microscopy (FESEM). Thin strips, approximately 2 mm thick × 2 mm wide × 10 mm long were cut so that the tensile fracture surface would be viewed. The samples were sputtered with platinum (5 nm thickness for xGnP®-M-5/epoxy composites, 2 nm thickness for xGnP®-C-300/epoxy composites) using an Anatech Ltd. Hummer 6.2 Sputtering System. A Hitachi S-4700 FE-SEM at 2.0 kV accelerating voltage was used to view the composites.
Tensile test method
To fabricate the 3.3 mm thick ASTM Type I tensile bars, a Tensilkut Engineering router was used. The tensile properties (at ambient conditions, 16.5 cm long, 3.3 mm thick ASTM Type I sample geometry) from all formulations were determined using ASTM D638 at a crosshead rate of 1 mm/min for reinforced plastics. 14 An Instru-Met Sintech screw driven mechanical testing machine was used. Tensile modulus was calculated from the initial linear portion of the stress–strain curve. For each formulation, at least six samples were tested. Prior to testing, the samples were conditioned at 23℃ and 50% relative humidity for 2 days.
Nanoindentation test method
Nanoindentation tests were performed on samples cut from untested tensile specimens for the formulations containing neat epoxy, 1 to 6 wt% xGnP®-M-5/epoxy, and 1 to 6 wt% xGnP®-C-300/epoxy composites. The samples were mounted in an epoxy puck and tested with an Agilent Nano Indenter XP. The typical test was run to a depth of 1500 nm and data were recorded at a rate of 5 Hz.
For each sample, 36 indents were made in a 6 × 6 pattern with 50 µm spacing in both directions. A Berkovich indenter was used for the tests. Data collected included load on the sample, penetration of the indenter, hardness of the sample, and modulus. The modulus (E) and hardness (H) of the sample was calculated using the contact stiffness per Oliver-Pharr method. 15 In general, the modulus was obtained from the slope of the load-displacement curve during unloading. This approach results in the calculation of E and H at the maximum indentation depth. Data collection was also accomplished by the continuous stiffness method (CSM), in which a small oscillation was superimposed on the primary loading. This method allows determination of E and H as a continuous function of the indenter penetration. The frequency of the oscillations was set at 45 Hz for the CSM method.
Creep tests were also conducted on the neat epoxy, 1 to 6 wt% xGnP®-M-5/epoxy, 1 to 6 wt% xGnP®-C-300/epoxy composites. The creep loads were set at 2, 5, 10, 15, 25, 35, and 45 mN. The load was increased to the creep load at a rate of 1 mN/s and held at the creep load for 150 s. The creep data was analyzed following the method proposed by Tehrani et al.
16
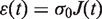
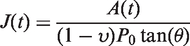
The relation between strain and the creep load is described in equation (1)
Results
Microscopy results
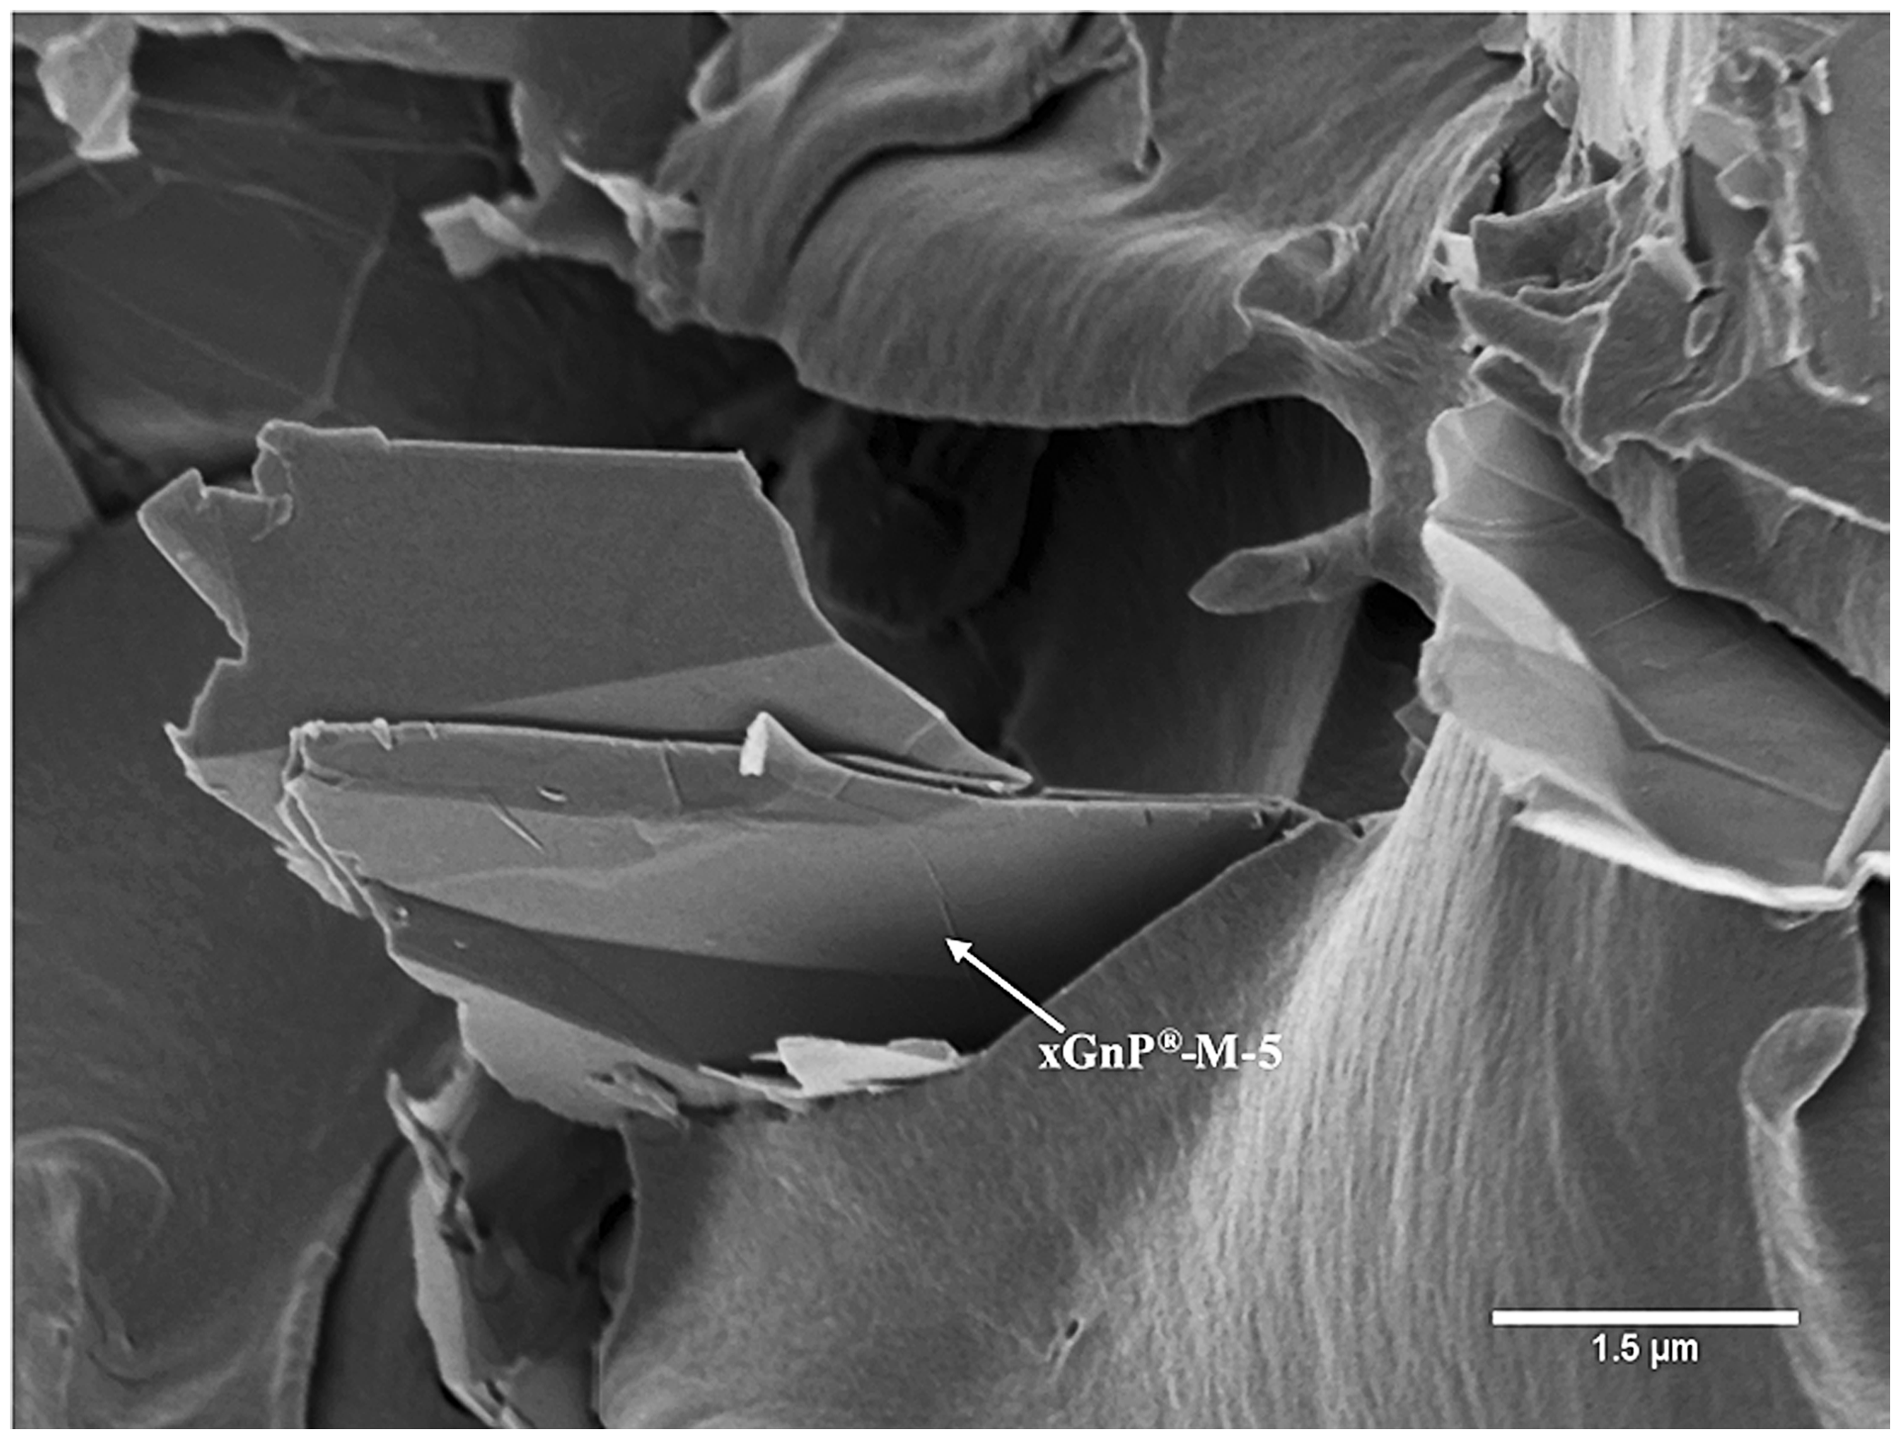
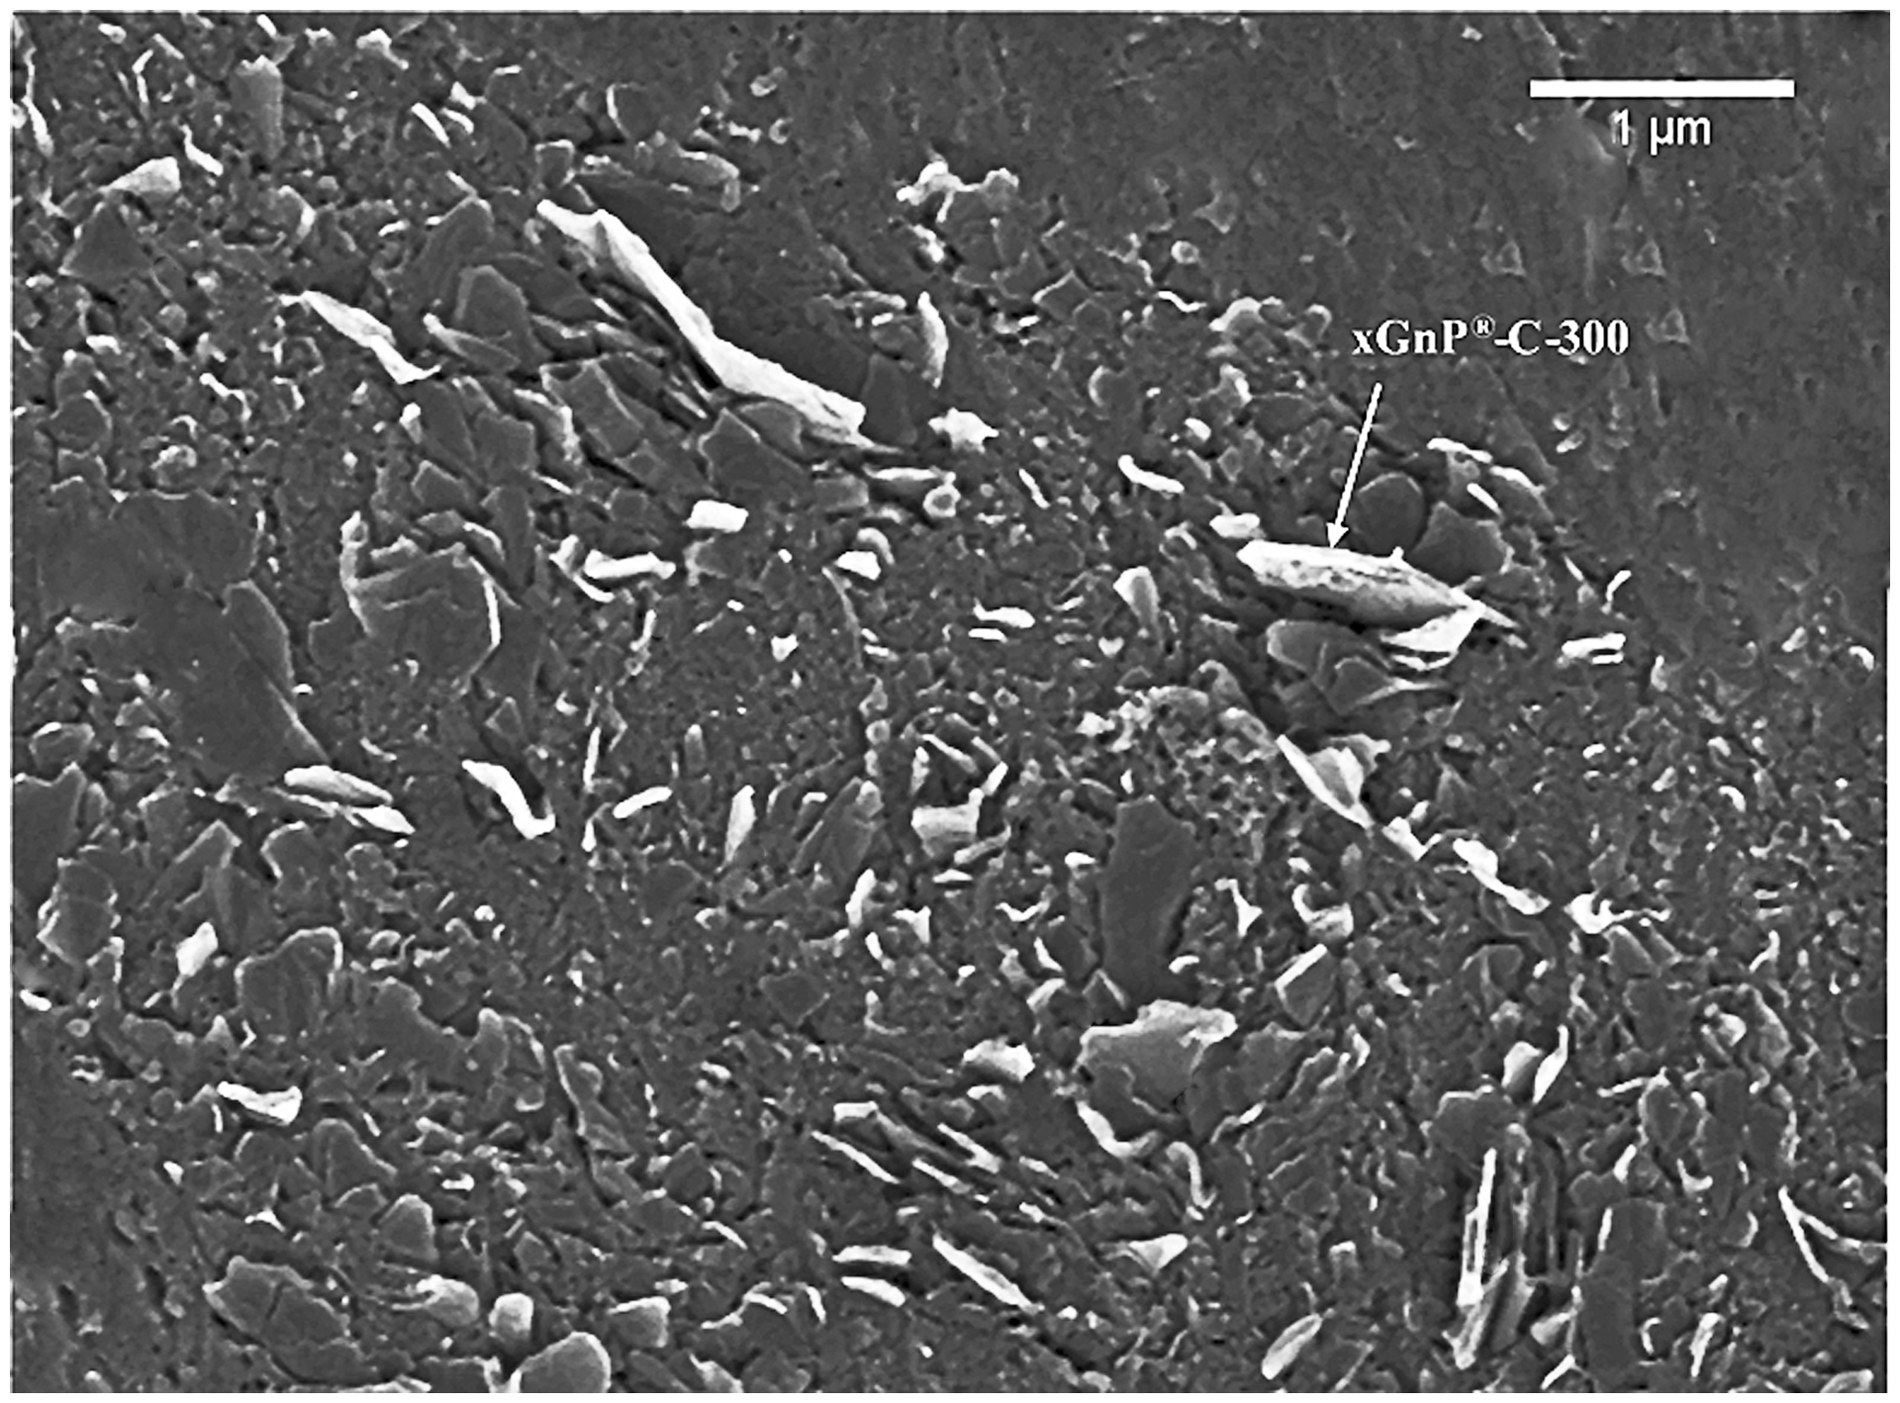
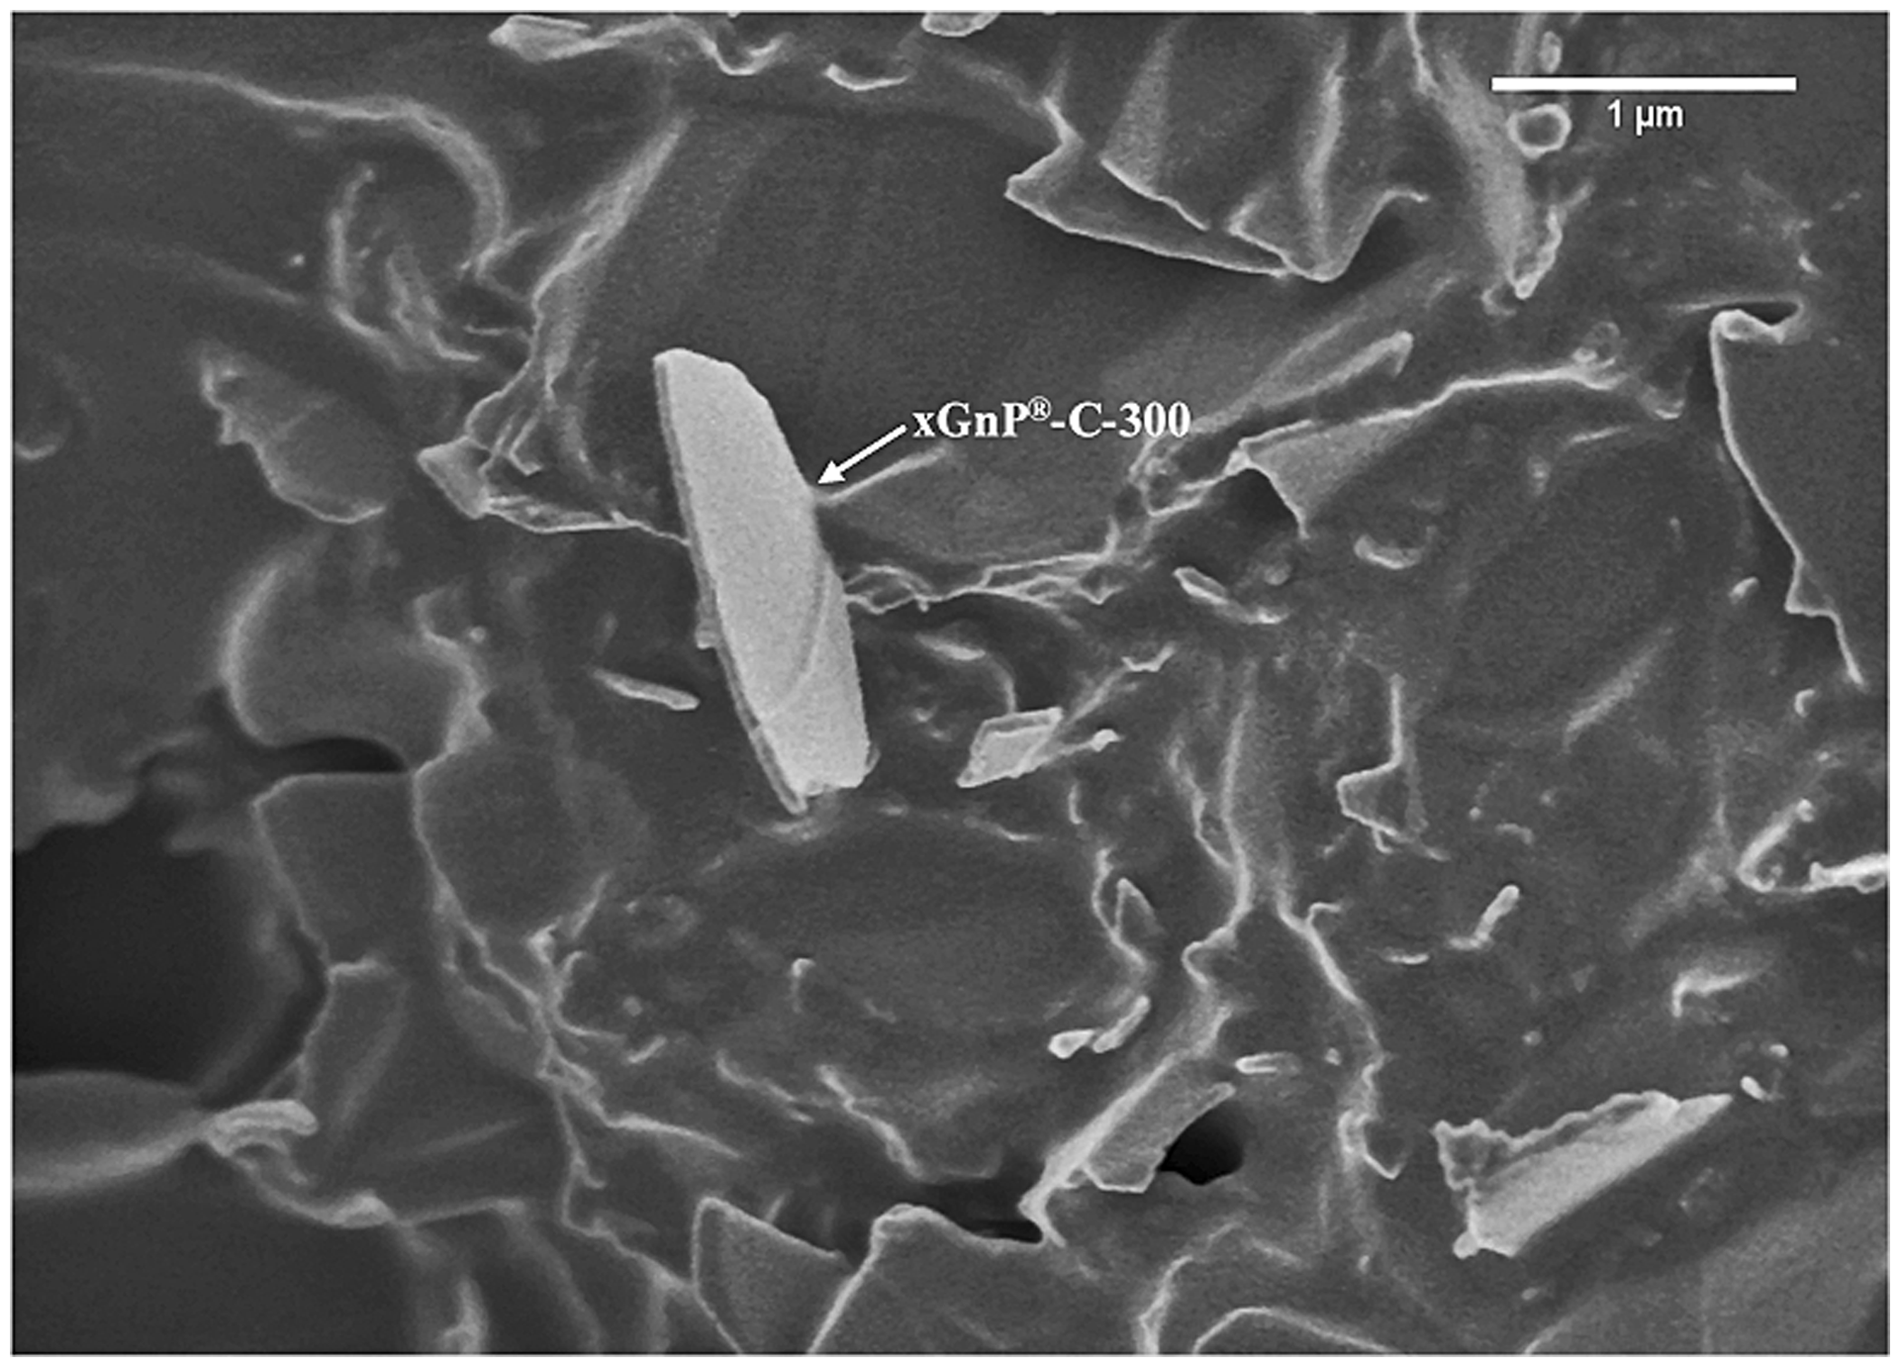
Figure 1 shows the random dispersion of 5 wt% xGnP®-M-5 (see white nanoplatelet geometry) in epoxy. Figure 2 shows the FESEM image of a tensile fracture surface for the 5 wt% xGnP®-M-5 in epoxy composite. This figure clearly shows the platelet shape of the GNP coming out of the fracture surface (z direction). Figure 3 shows the random dispersion of 4 wt% xGnP®-C-300 in epoxy. Figure 4 shows the FESEM image of a tensile fracture surface for the 4 wt% xGnP®-C-300 in epoxy. As expected, the xGnP®-C-300 flake (∼2 µm) is smaller than the xGnP®-M-5 (∼5 µm) flake shown in Figure 2.
Environmental scanning electron microscope micrograph of 5 wt% xGnP®-M-5 in epoxy. Field emission electron microscope micrograph of 5 wt% xGnP®-M-5 in epoxy. Field emission electron microscope micrograph of 4 wt% xGnP®-C-300 in epoxy. Field emission electron microscope micrograph at higher magnification of 4 wt% xGnP®-C-300 in epoxy.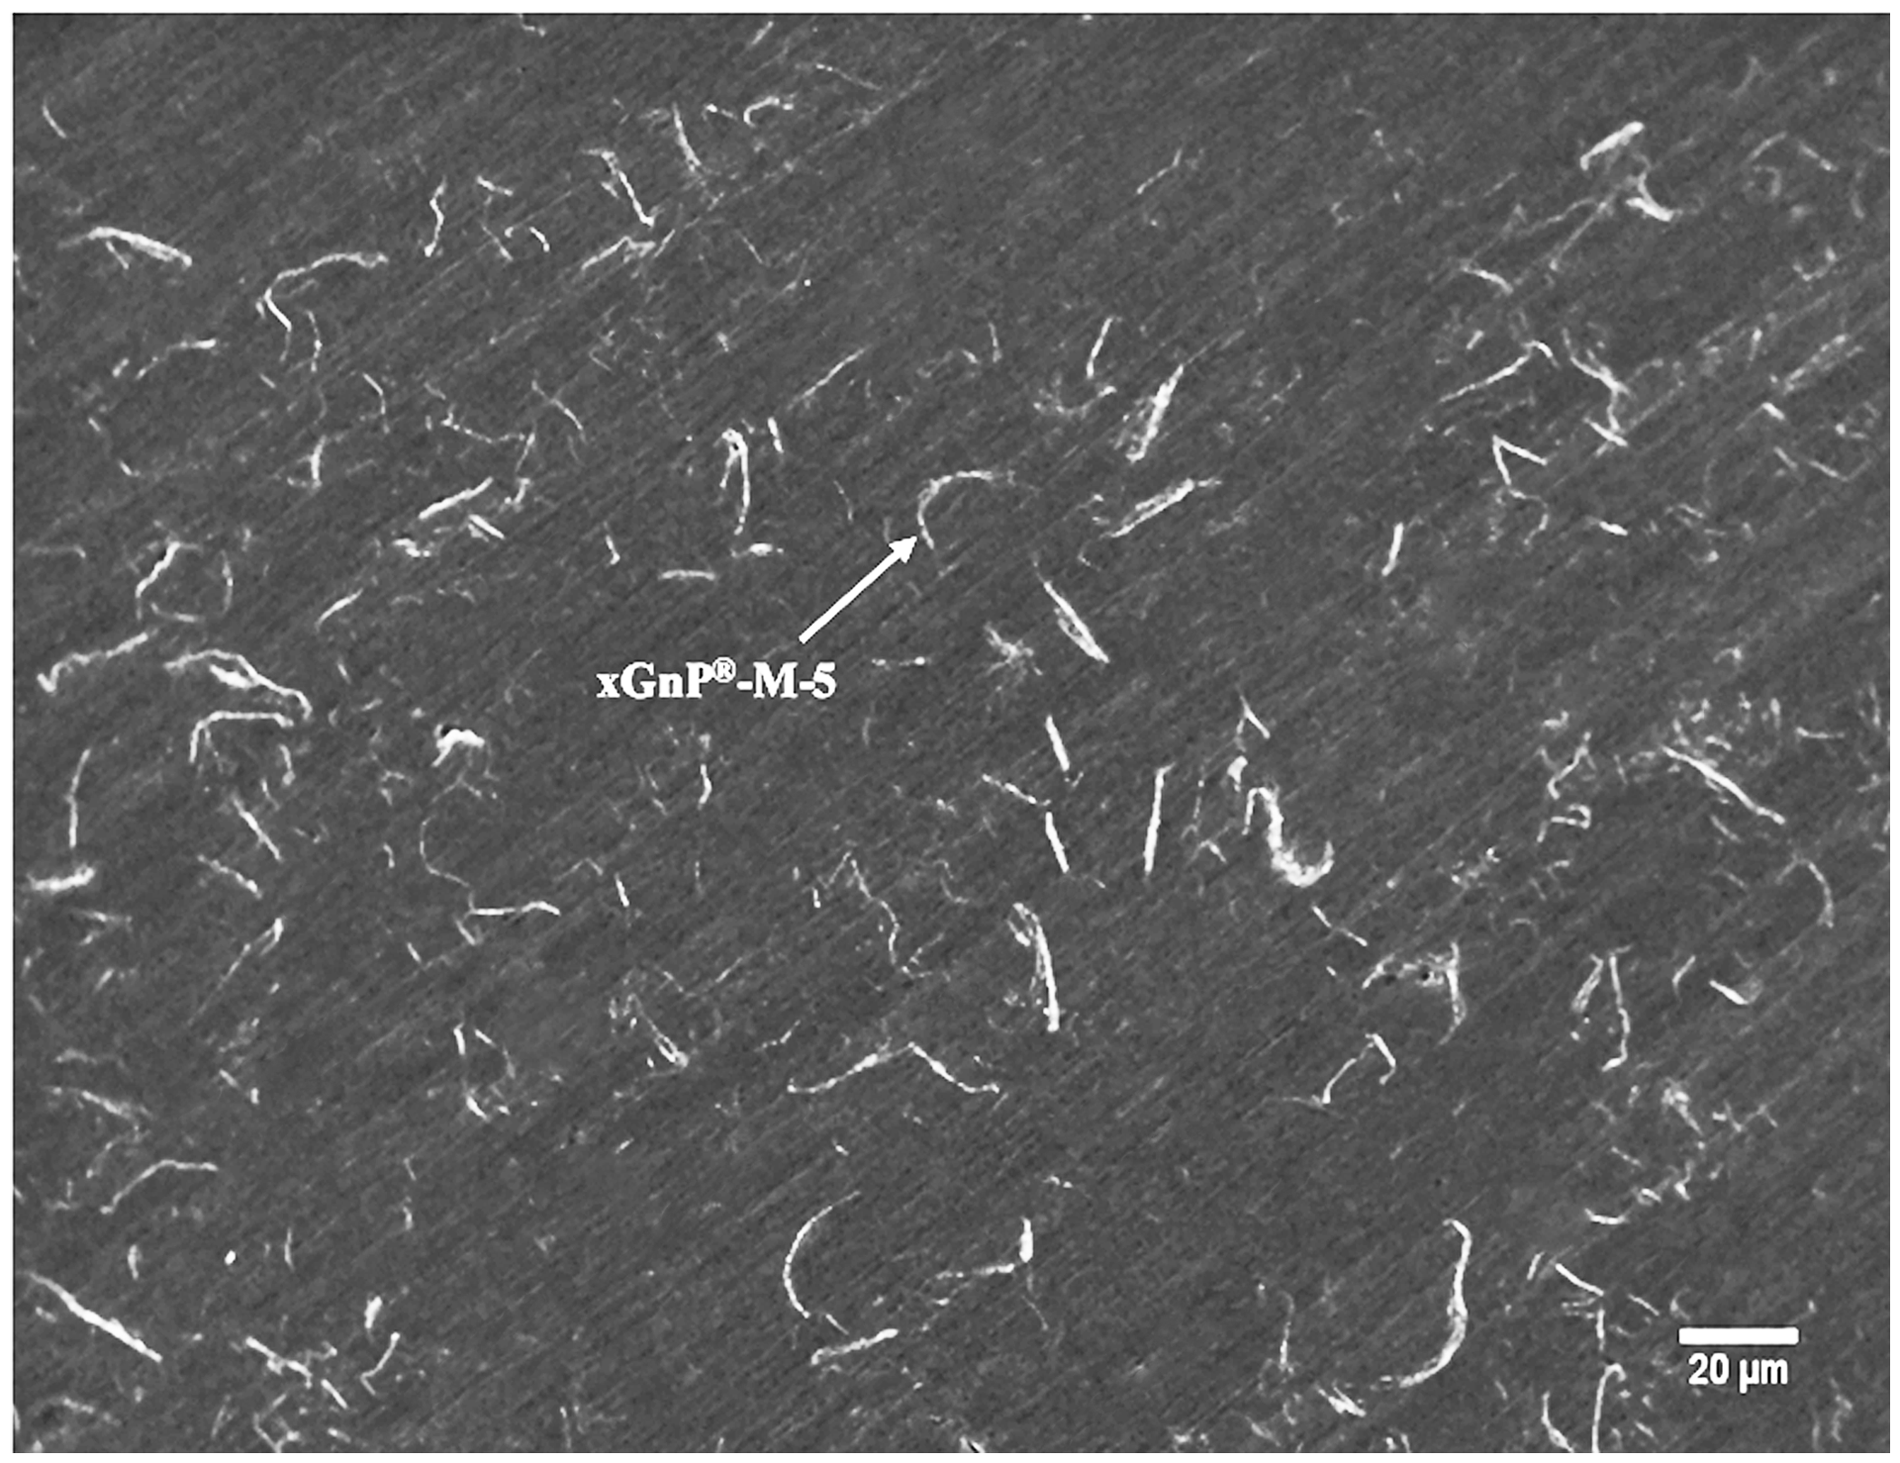
Tensile results
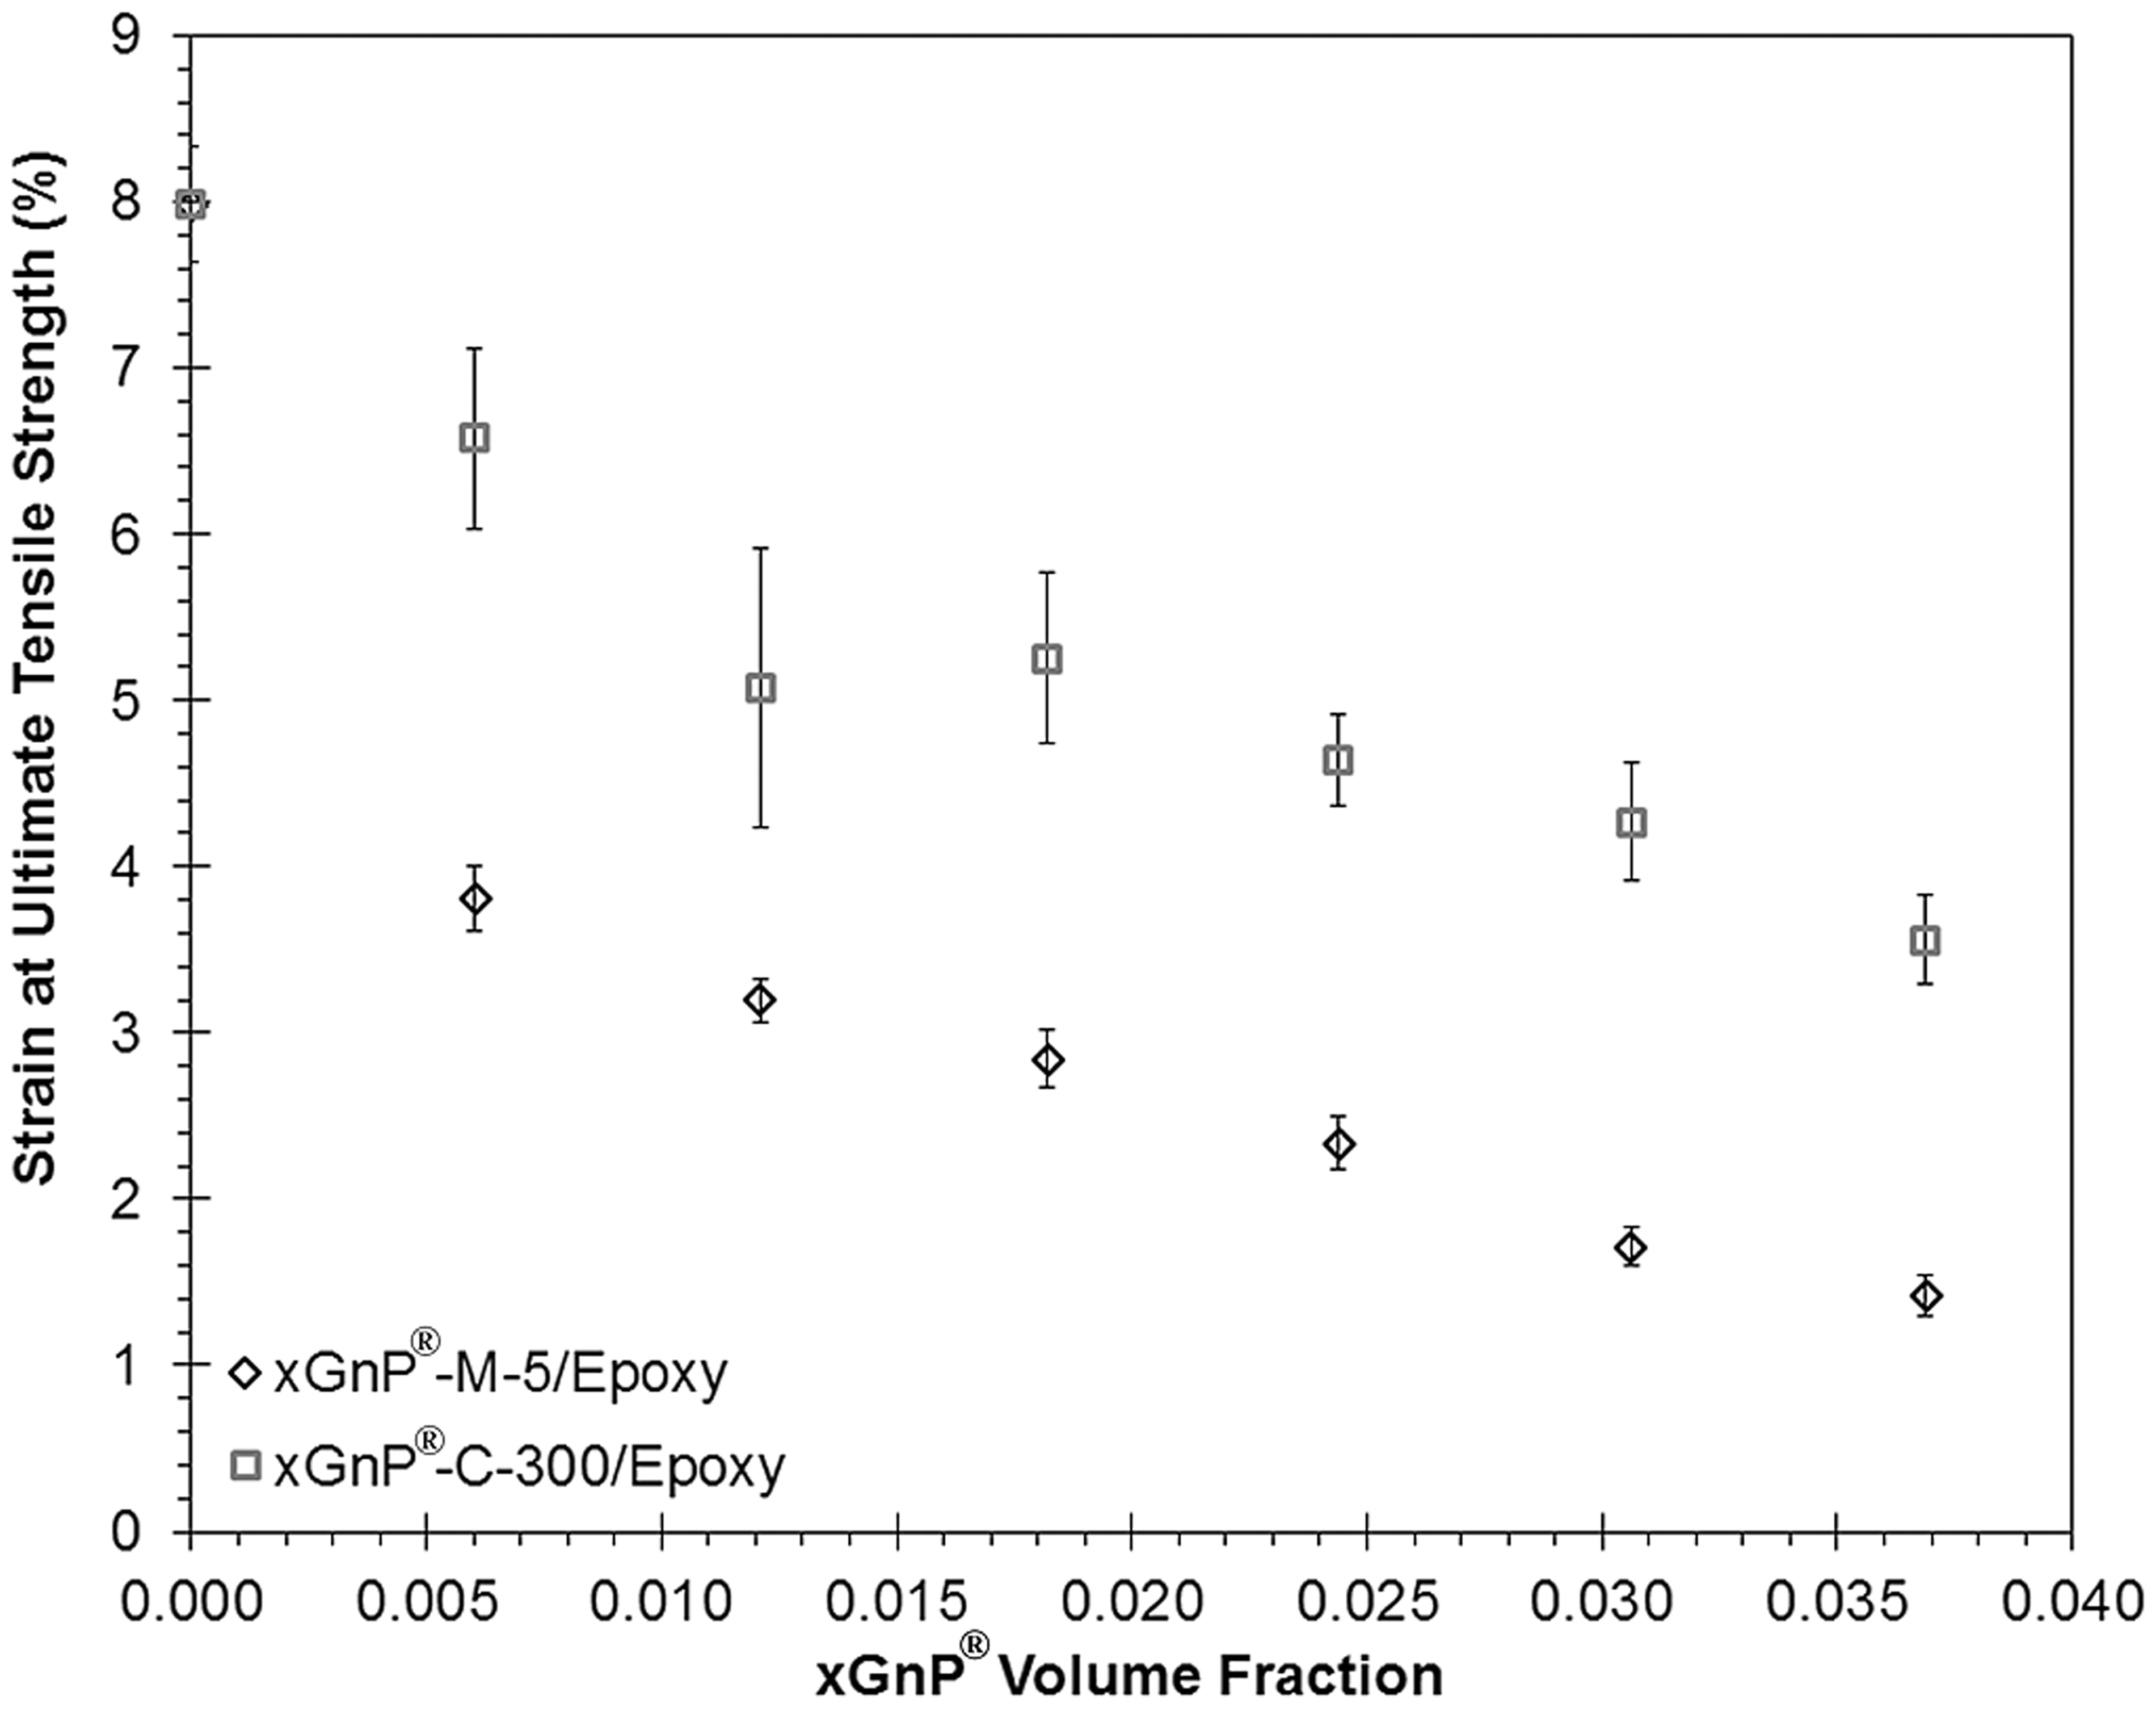
Figures 5–7 show the mean (along with error bars = ± one standard deviation) tensile modulus, ultimate tensile strength, and strain at ultimate tensile strength for the xGnP®-M-5/epoxy and xGnP®-C-300/epoxy composites measured according to ASTM D638. Error bars are not shown for formulations where one standard deviation is less than the marker size. Table 1 also shows these results (mean, standard deviation, and number of samples tested). First, the xGnP®-M-5/epoxy composites will be discussed. As expected adding xGnP®-M-5 causes the tensile modulus to increase, as well as the tensile strength and ductility to decrease. The modulus increases from 2.72 GPa for neat epoxy to 3.35 GPa for the sample containing 6 wt% (3.7 vol%) xGnP®-M-5 in epoxy. The ultimate tensile strength decreases from 77.6 MPa (neat epoxy) to 36.4 MPa for the formulation containing 6 wt% (3.7 vol%) xGnP®-M-5 in epoxy. The strain at ultimate tensile strength decreases from 8.0% (neat epoxy) to 1.4% for the formulation containing 6 wt% (3.7 vol%) GNP in epoxy. These results are almost identical to those obtained previously by our research group for xGnP®-M-15/epoxy composites.
18
xGnP®-M-15 is also produced by XG Sciences and has a 15 µm average particle diameter, a thickness of 7 nm, a surface area of ∼130 m2/g, and a density of ∼2.0 g/mL.
1
These xGnP®-M-5/epoxy and xGnP®-M-15/epoxy results compare well to those of Fukushima for graphene (15 µm average particle diameter) in Shell EPON 828 with curing agent Jeffamine T403 from Hunstman Petrochemical.
19
In Fukushima’s work, he reported an increase in tensile modulus from ∼2.75 GPa (neat epoxy) to ∼3.1 GPa for 3 vol% GNP/97 vol% epoxy (compared to our result of 3.2 GPa for 5 wt% (∼3 vol%) xGnP®-M-5. For tensile strength, Fukushima reported ∼35 MPa for 3 vol% GNP/97 vol% epoxy (compared to our result of 40 MPa for 5 wt% (∼3 vol%) xGnP®-M-5).
Tensile modulus for xGnP®-M-5/epoxy and xGnP®-C-300/epoxy composites. Ultimate tensile strength for xGnP®-M-5/epoxy and xGnP®-C-300/epoxy composites. Strain at ultimate tensile strength for xGnP®-M-5/epoxy and xGnP®-C-300/epoxy composites.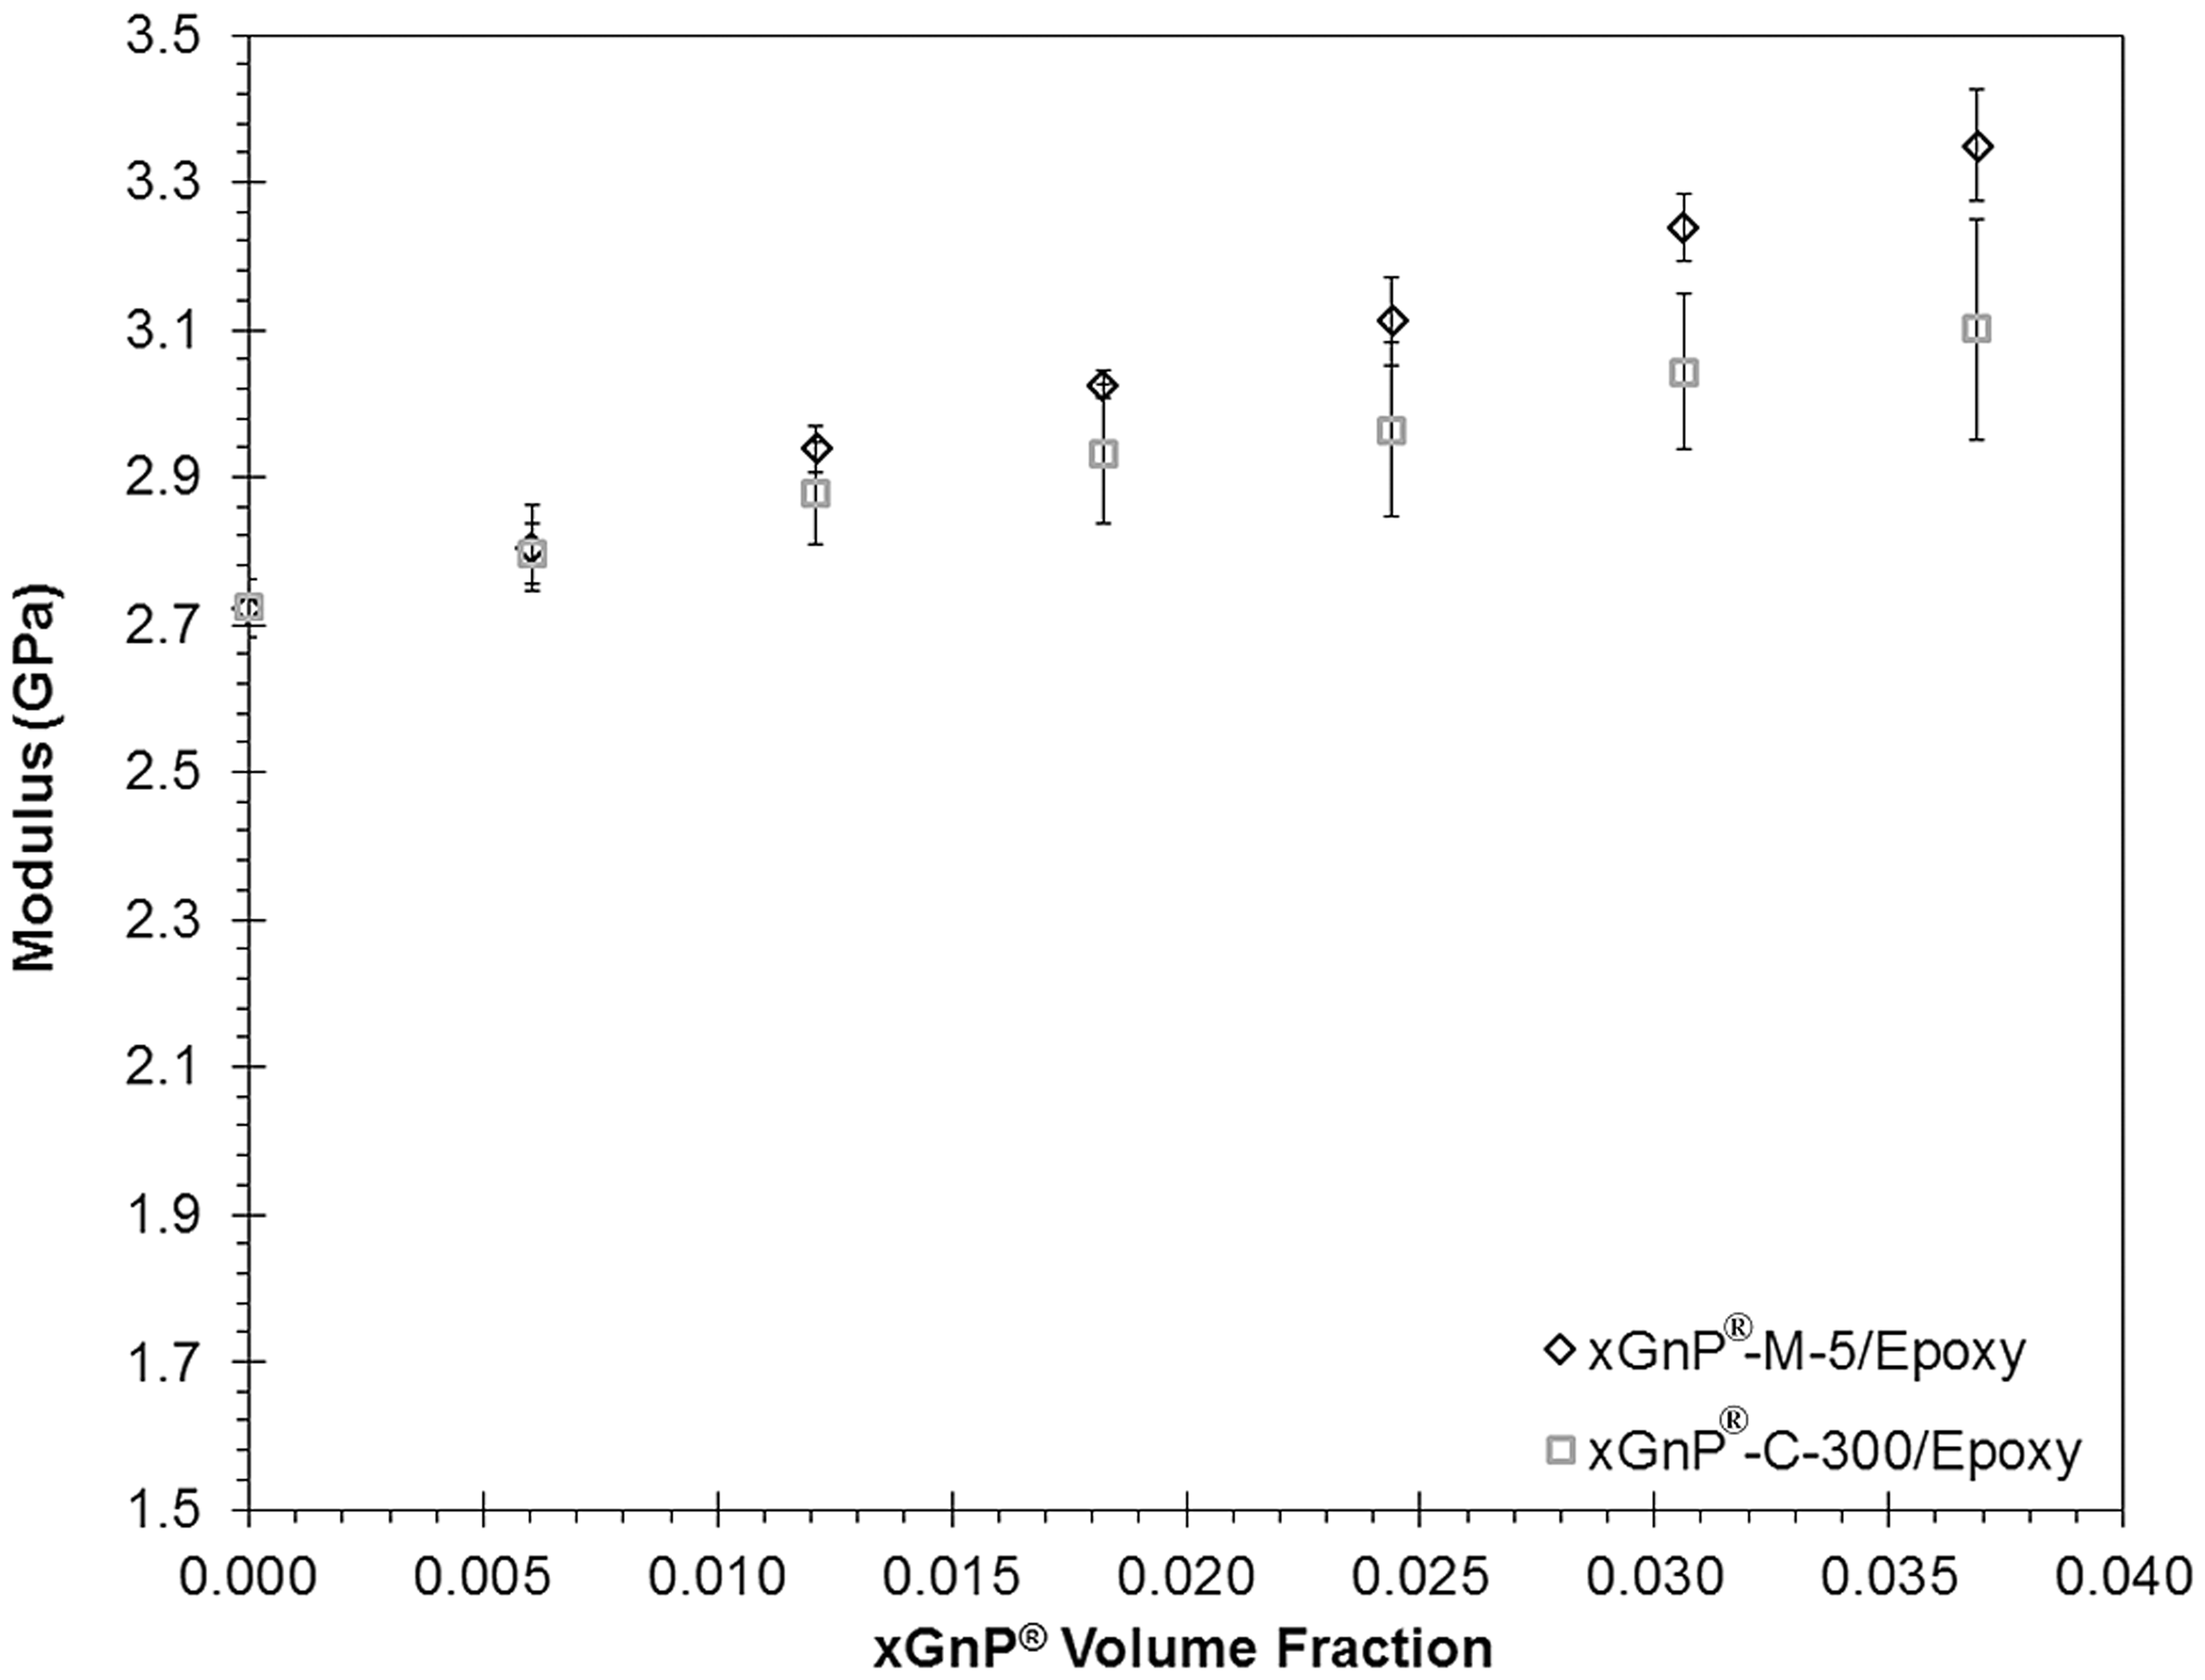
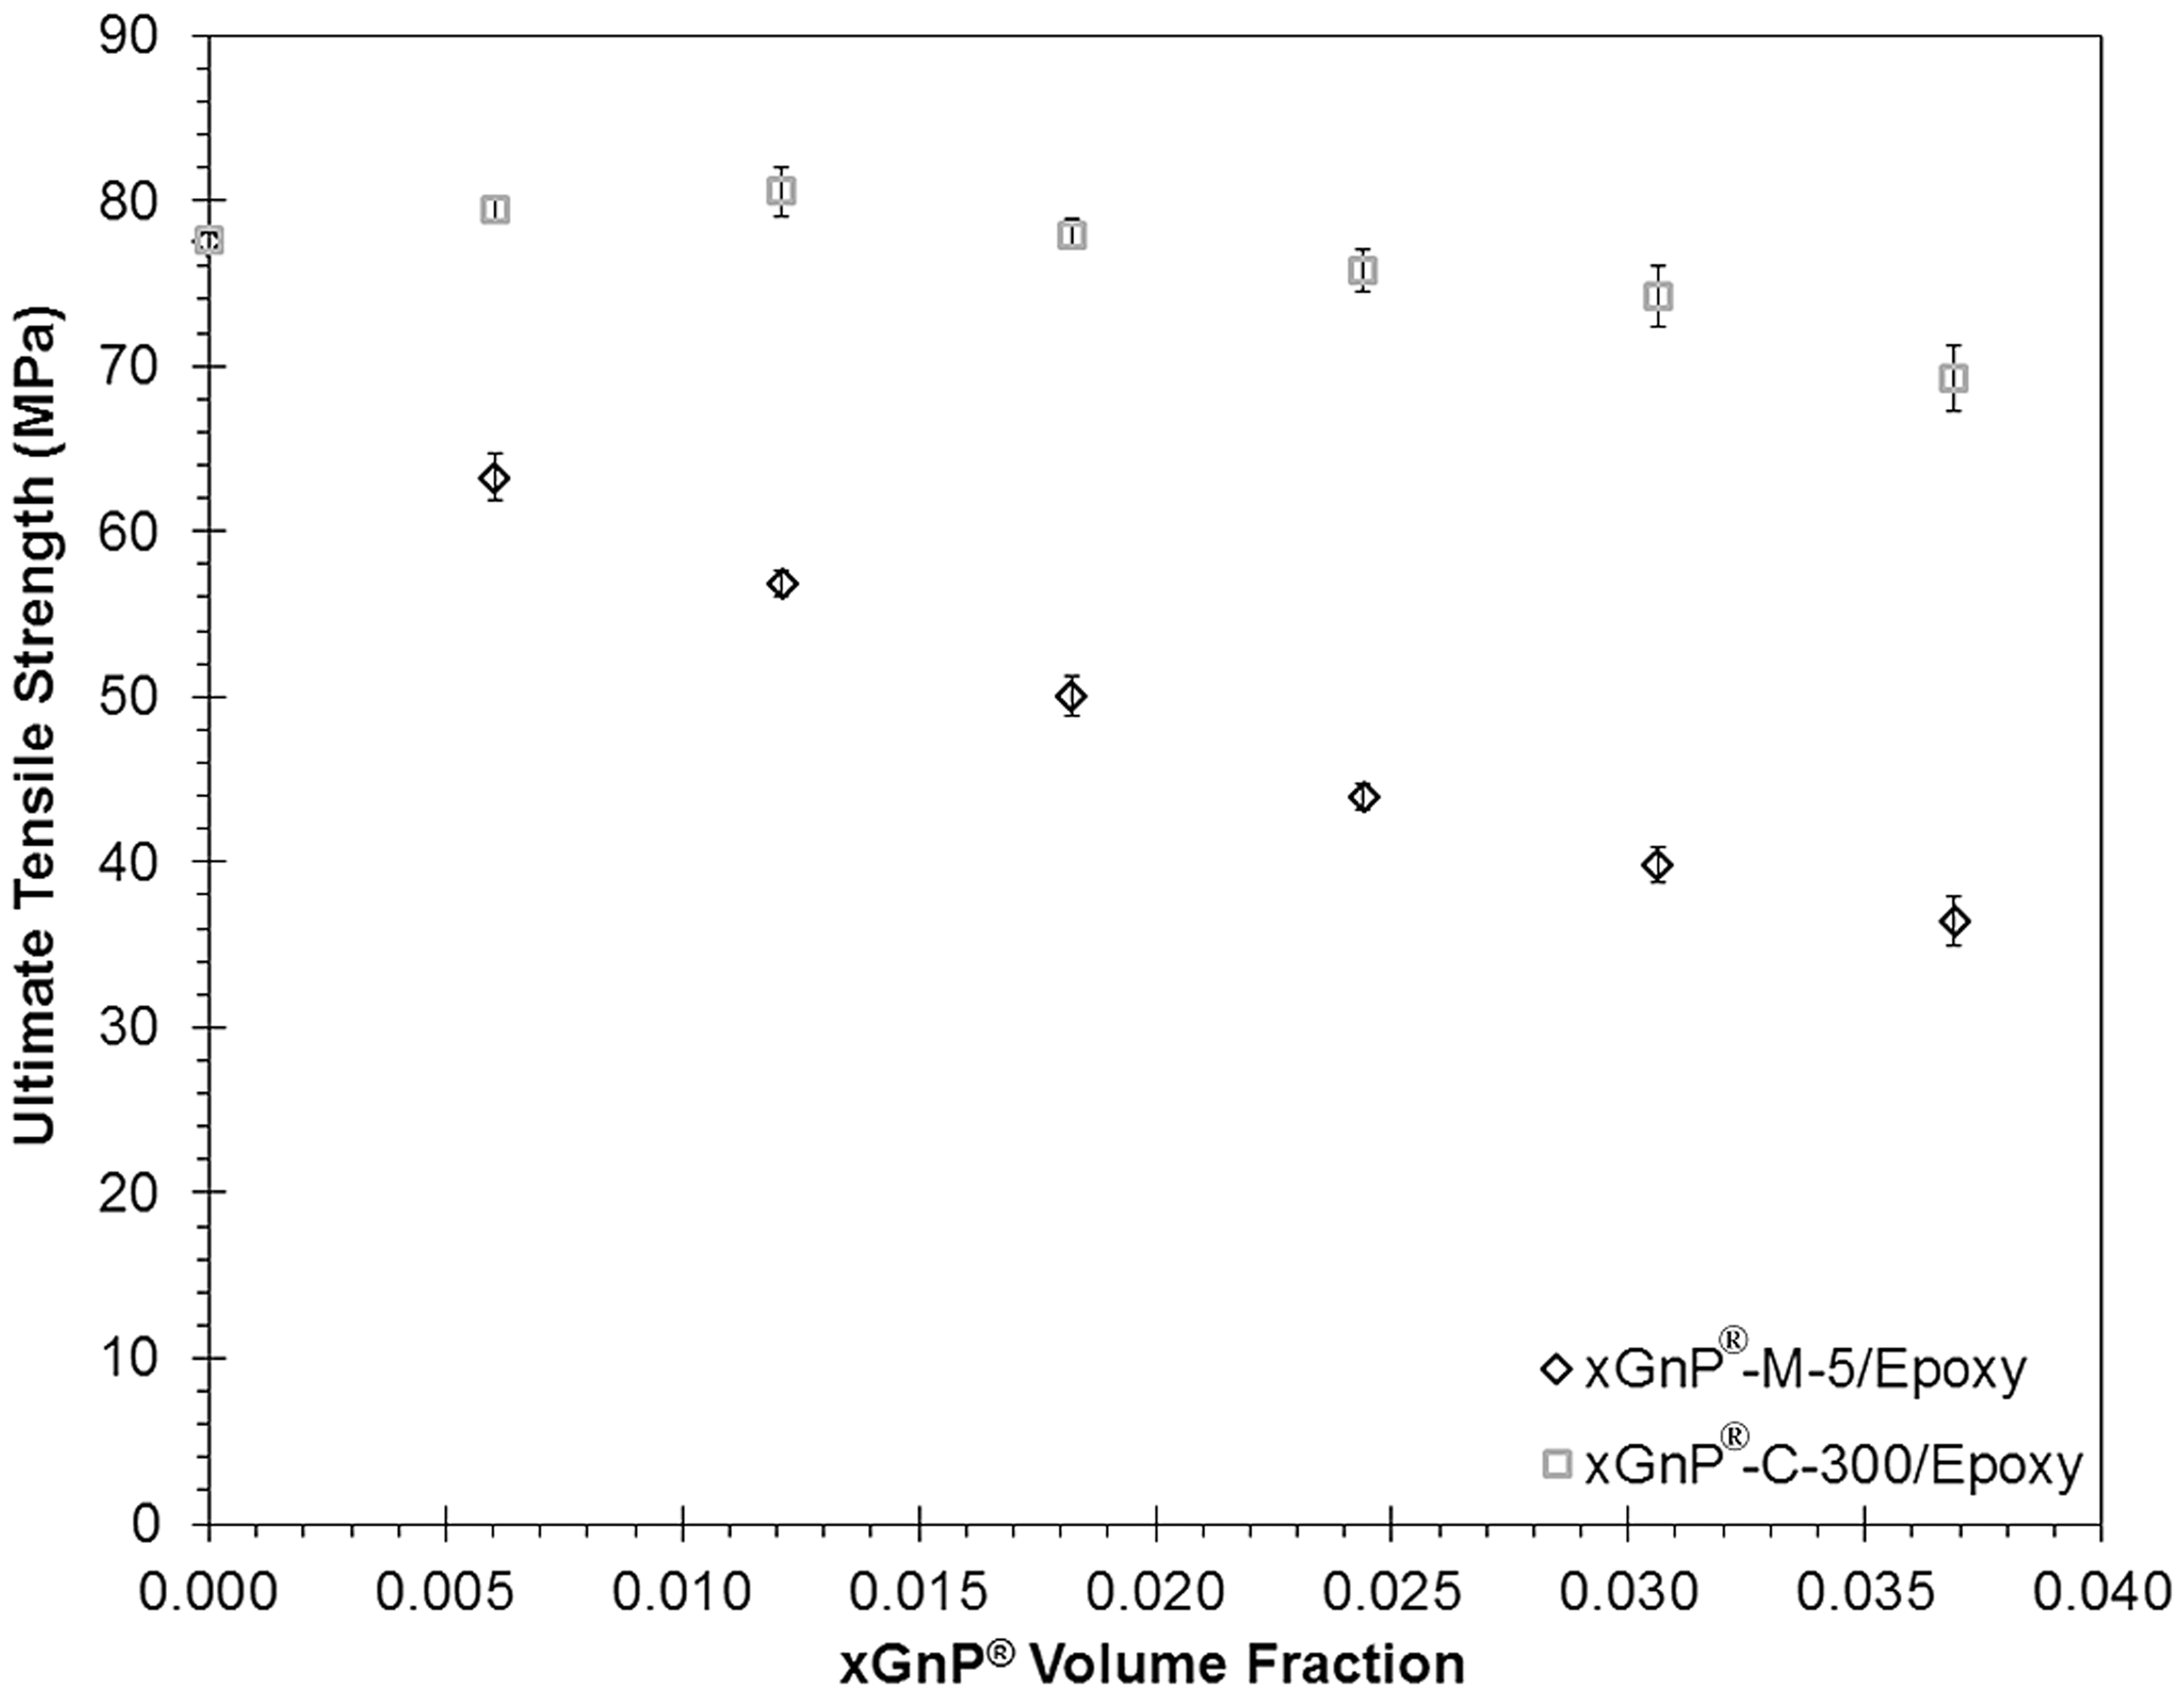
At this point, it is important to address the observed trend of decreasing tensile strength with increasing levels of xGnP®-M-5. Of course, it is desired to design composite materials with increasing strength properties with increasing levels of reinforcement. However, the trends described above suggest that the GNP reinforcement serves to decrease the overall strength of the composite relative to the neat resin. This observation can be physically explained using the results from Molecular Dynamics simulation of this same material system (graphene-reinforced EPON 862 with Curing Agent W). 20 Hadden et al. 20 demonstrated that the molecular structure of the epoxy monomer and hardener molecules at the interface is distinctly different than that in the bulk resin in this particular material system. In fact, this interfacial zone is about 1 nm wide and has a density that varies continuously with respect to the bulk density. As a result, it is anticipated that this structural disturbance may adversely affect the strength properties of the composite system, thus potentially explaining the strength observations described herein.
For the xGnP®-C-300/epoxy composites, the tensile modulus is slightly lower than the xGnP®-M-5/epoxy and xGnP®-M-15/epoxy composites. The ultimate tensile strength (UTS) for the xGnP®-C-300/epoxy composites stays fairly constant between 74 and 81 MPa for those containing ≤5 wt% (3.1 vol%) xGnP®-C-300. This observation is in contrast to the decreasing ultimate tensile strength as xGnP®-M-5 and xGnP®-M-15 is added to epoxy. The strain at UTS also follows this same trend. Apparently, the smaller size of the xGnP®-C-300 in epoxy produces a composite with higher strength and ductility compared to the xGnP®-M-5/epoxy composites.
Nanoindentation test results
The modulus (E) and hardness (H) values reported are the average of E and H determined over the range of indenter penetration from 500 nm to 1500 nm using the CSM method. Table 1 shows a constant hardness value of ∼0.25 to 0.27 GPa for neat epoxy, 1 to 6 wt% xGnP®-M-5/epoxy, and 1-6 wt% xGnP®-C-300/epoxy composites. Typical curves for E and H as a function of indenter penetration have been published previously in King et al. 18
Several researchers have shown for polymers and polymer-based composites that modulus as determined by nanoindentation is higher than that reported by macroscopic tensile tests.21–23 Tranchida et al.
21
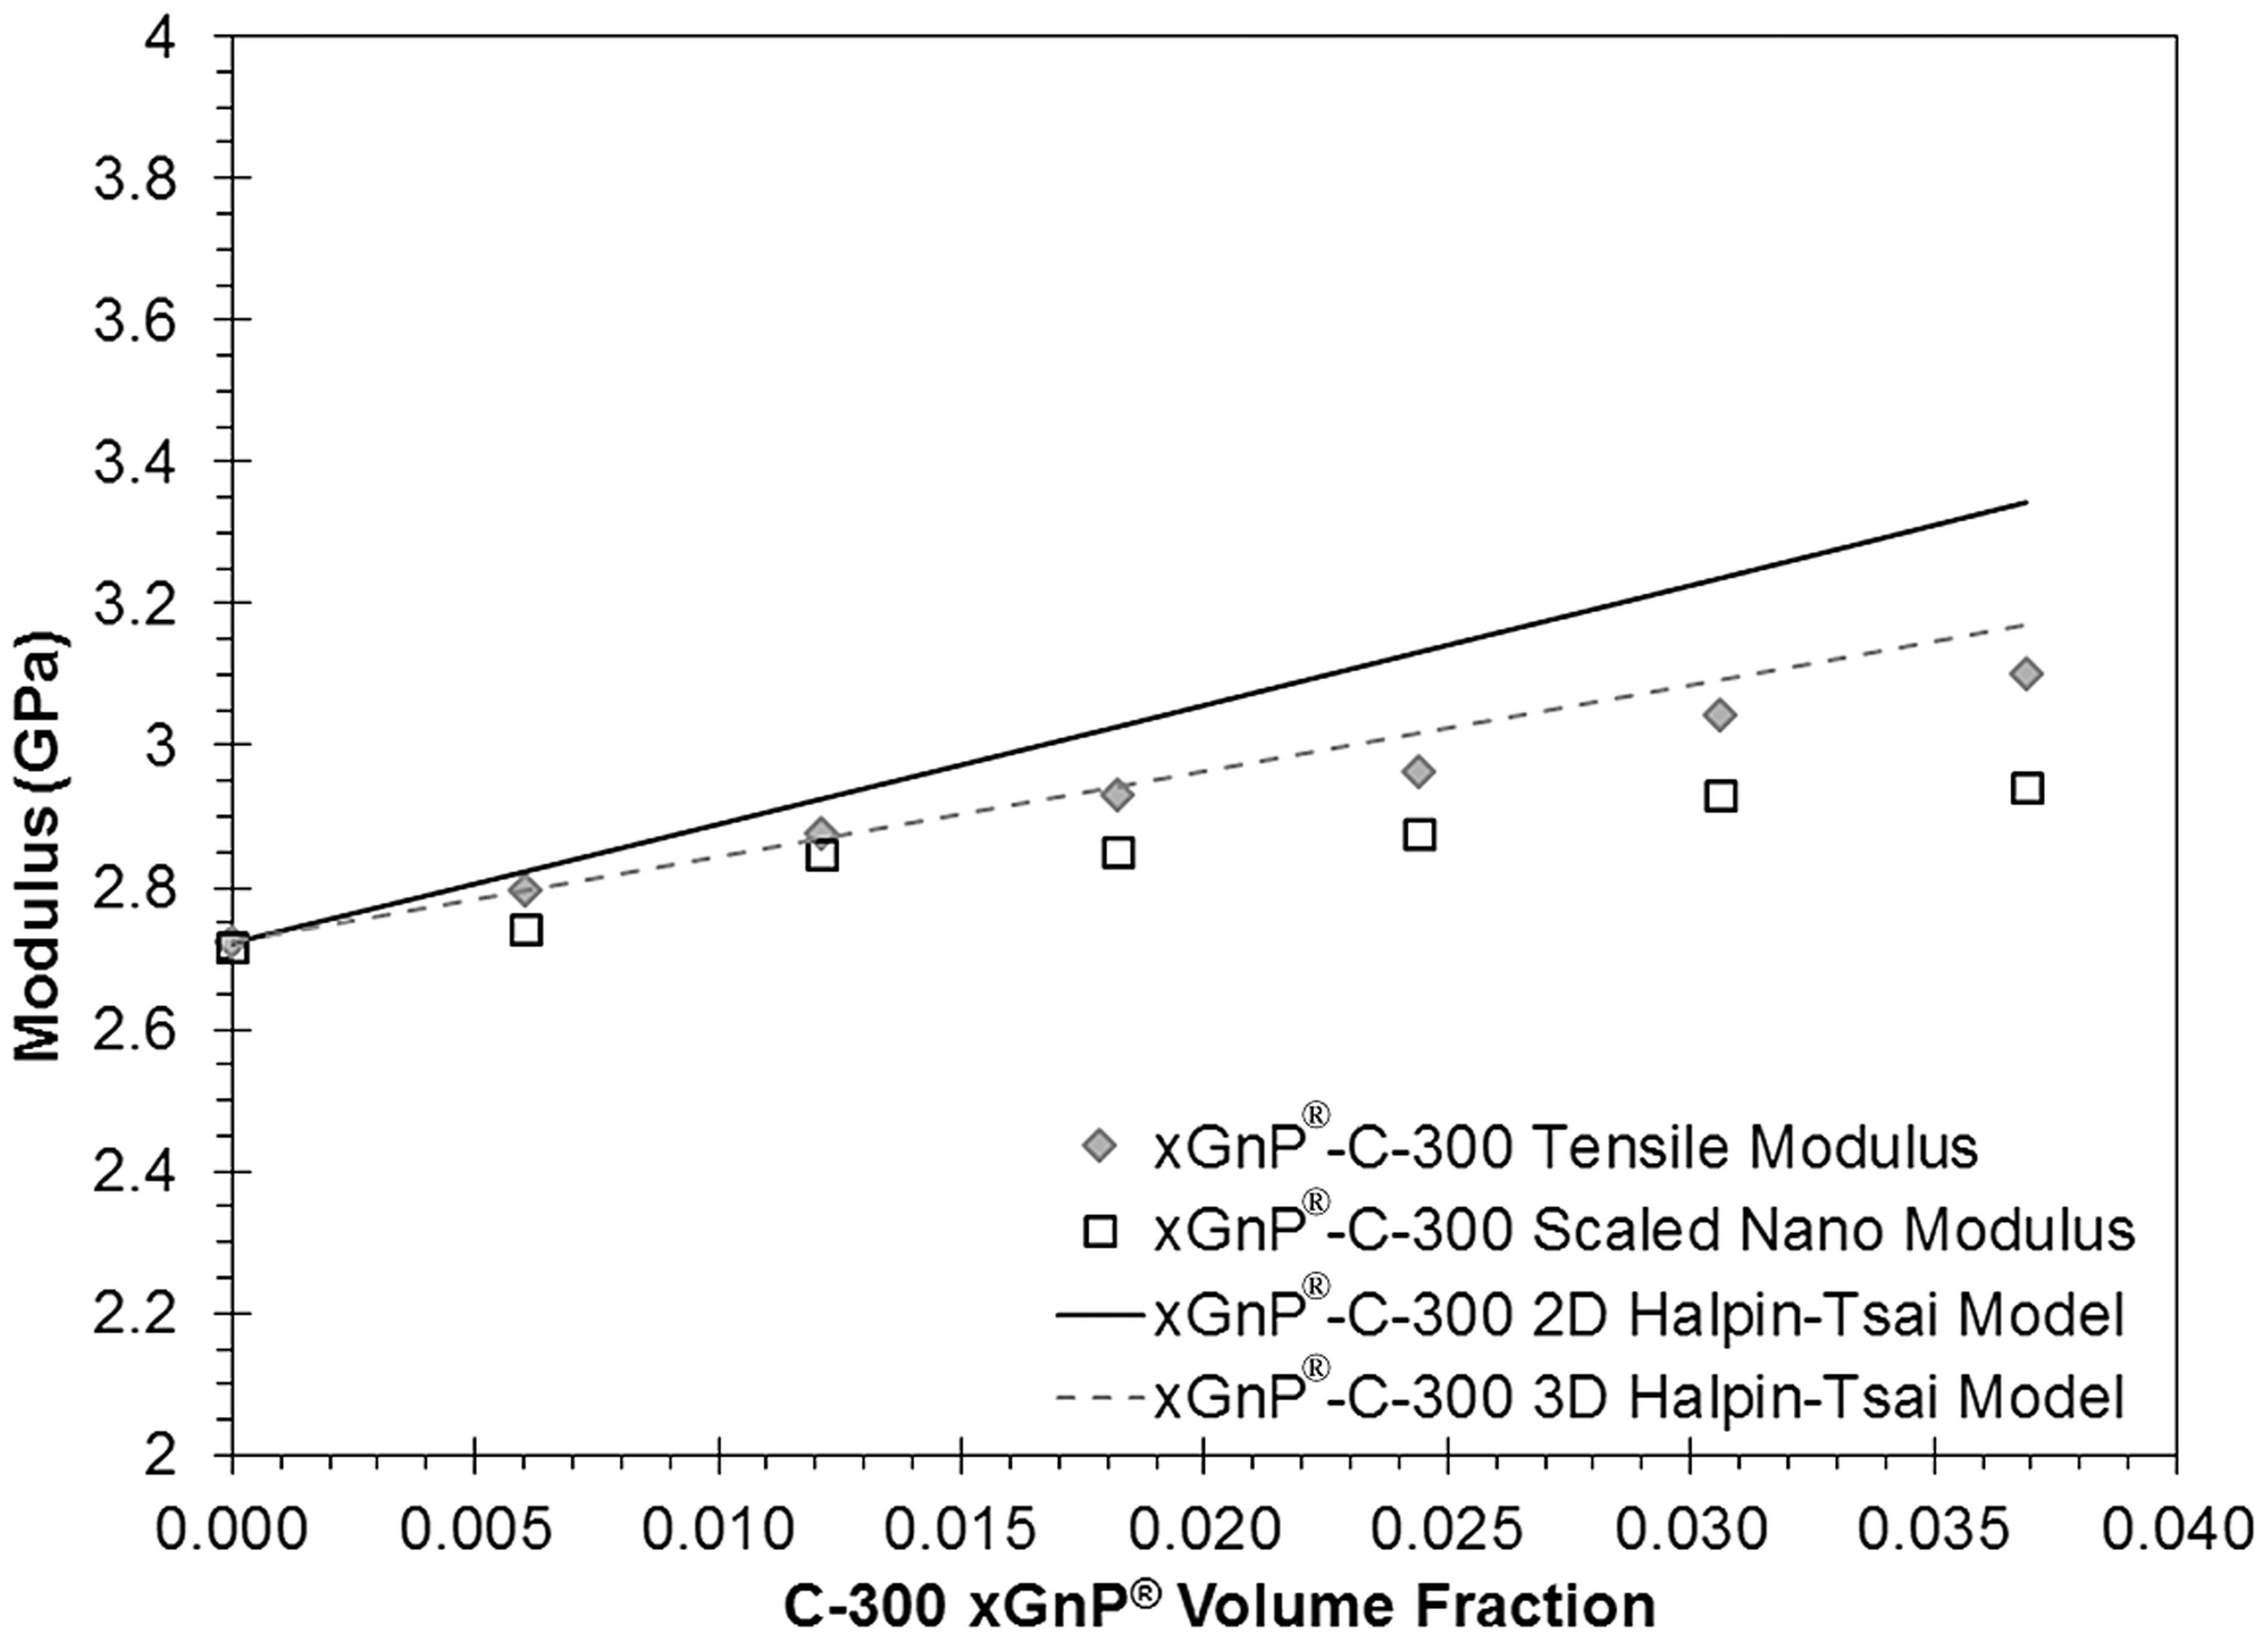
reported that for polystyrene the modulus obtained from nanoindentation was 1.70 times the modulus obtained from macroscopic tensile tests. This difference is likely due to pile-up of material around the contact impression and viscoelasticity of the polymer and polymer-based composites that is not accounted for by the modulus as determined by the Oliver-Pharr method.21–23 The mean modulus from nanoindentation for the neat epoxy was 3.61 GPa as compared to 2.72 GPa from the macroscopic tensile test. Hence, the ratio of nanoindentation to macroscopic tensile modulus was found to be 1.33. This ratio was then used as a scaling factor for all moduli for the xGnP®-M-5/epoxy and xGnP®-C-300/epoxy composites and these mean results are also shown in Figures 8 and 9 (standard deviation for each data point shown ∼0.1 GPa), respectively. The modulus as determined from nanoindentation showed a similar trend to the tensile modulus determined by the macroscopic method for all composite systems.
Modulus and Halpin-Tsai models for xGnP®-M-5/epoxy composites. Modulus and Halpin-Tsai models for xGnP®-C-300/epoxy composites.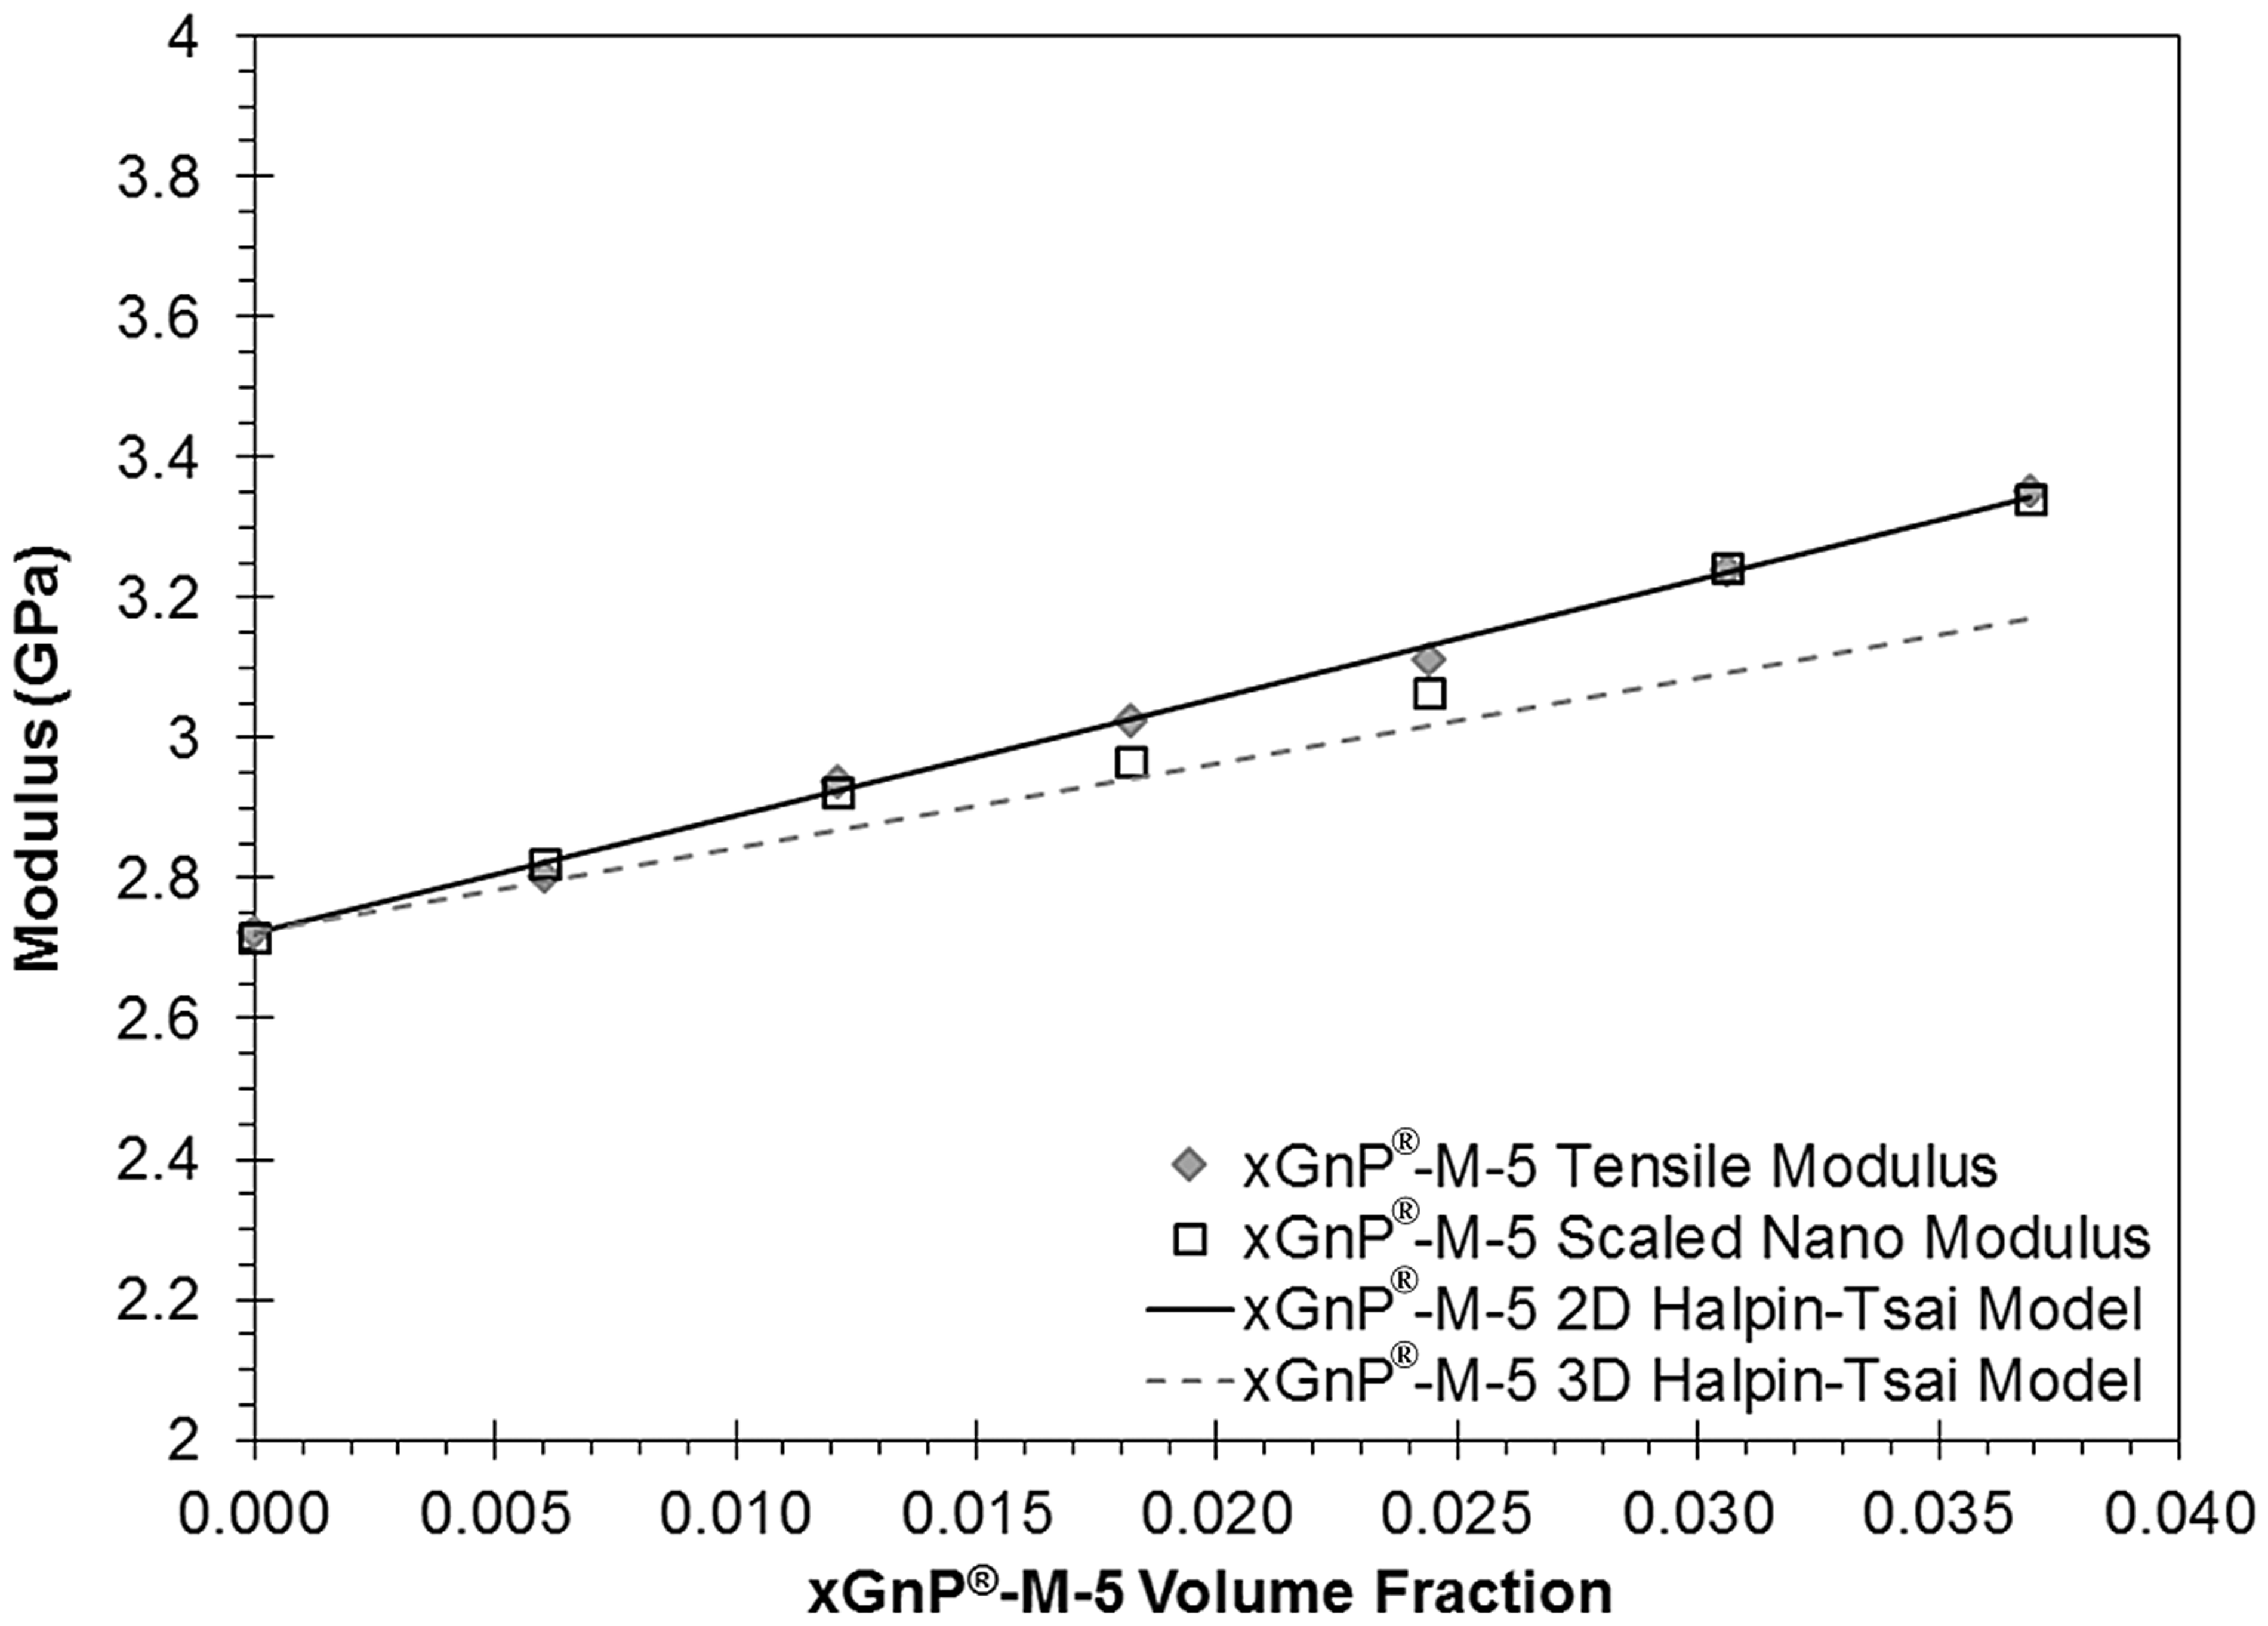
Creep tests were conducted at the following loads: 2, 5, 10, 15, 25, 35, and 45 mN. Typical displacement (also called depth) curves as a function of time were previously shown in King et al. 18 At 2 mN, the maximum depth observed was 740 nm for neat epoxy and 706 nm for 6 wt% xGnP®-M-5/epoxy and 6 wt% xGnP®-C-300/epoxy composites (4.6% decrease in the maximum penetration depth). At the highest load of 45 mN, the maximum depth was 3539 nm for neat epoxy and 3486 nm for 6 wt% xGnP®-M-5/epoxy and 6 wt% xGnP®-C-300/epoxy composites (1.5% decrease in maximum penetration depth).
Figure 10 shows the creep compliance for the 5 wt% xGnP®-C-300/epoxy composite. The creep compliance varies very little with loads between 15 and 45 mN in the steady-state creep range. For loads of 2, 5, and 10 mN, the creep compliance increases with load. A similar creep response was also observed for the neat epoxy, 1 to 4 and 6 wt% xGnP®-C-300/epoxy, and 1 to 6 wt% xGnP®-M-5/epoxy composites. As an example, Figure 11 shows the creep compliance at the 25 mN load for neat epoxy, 2 and 5 wt% xGnP®-M-5/epoxy, and 2 and 5 wt% xGnP®-C-300/epoxy composites. These figures show that the steady-state creep compliance remains constant for neat epoxy, 1-6 wt% wt% xGnP®-C-300/epoxy composites, and 1 to 6 wt% xGnP®-M-5/epoxy composites.
Creep compliance for 5 wt% xGnP®-C-300 in epoxy at various loads. Creep compliance for neat epoxy, 2 and 5 wt% xGnP®-M-5 in epoxy, and 2 and 5 wt% xGnP®-C-300 in epoxy at 25 mN.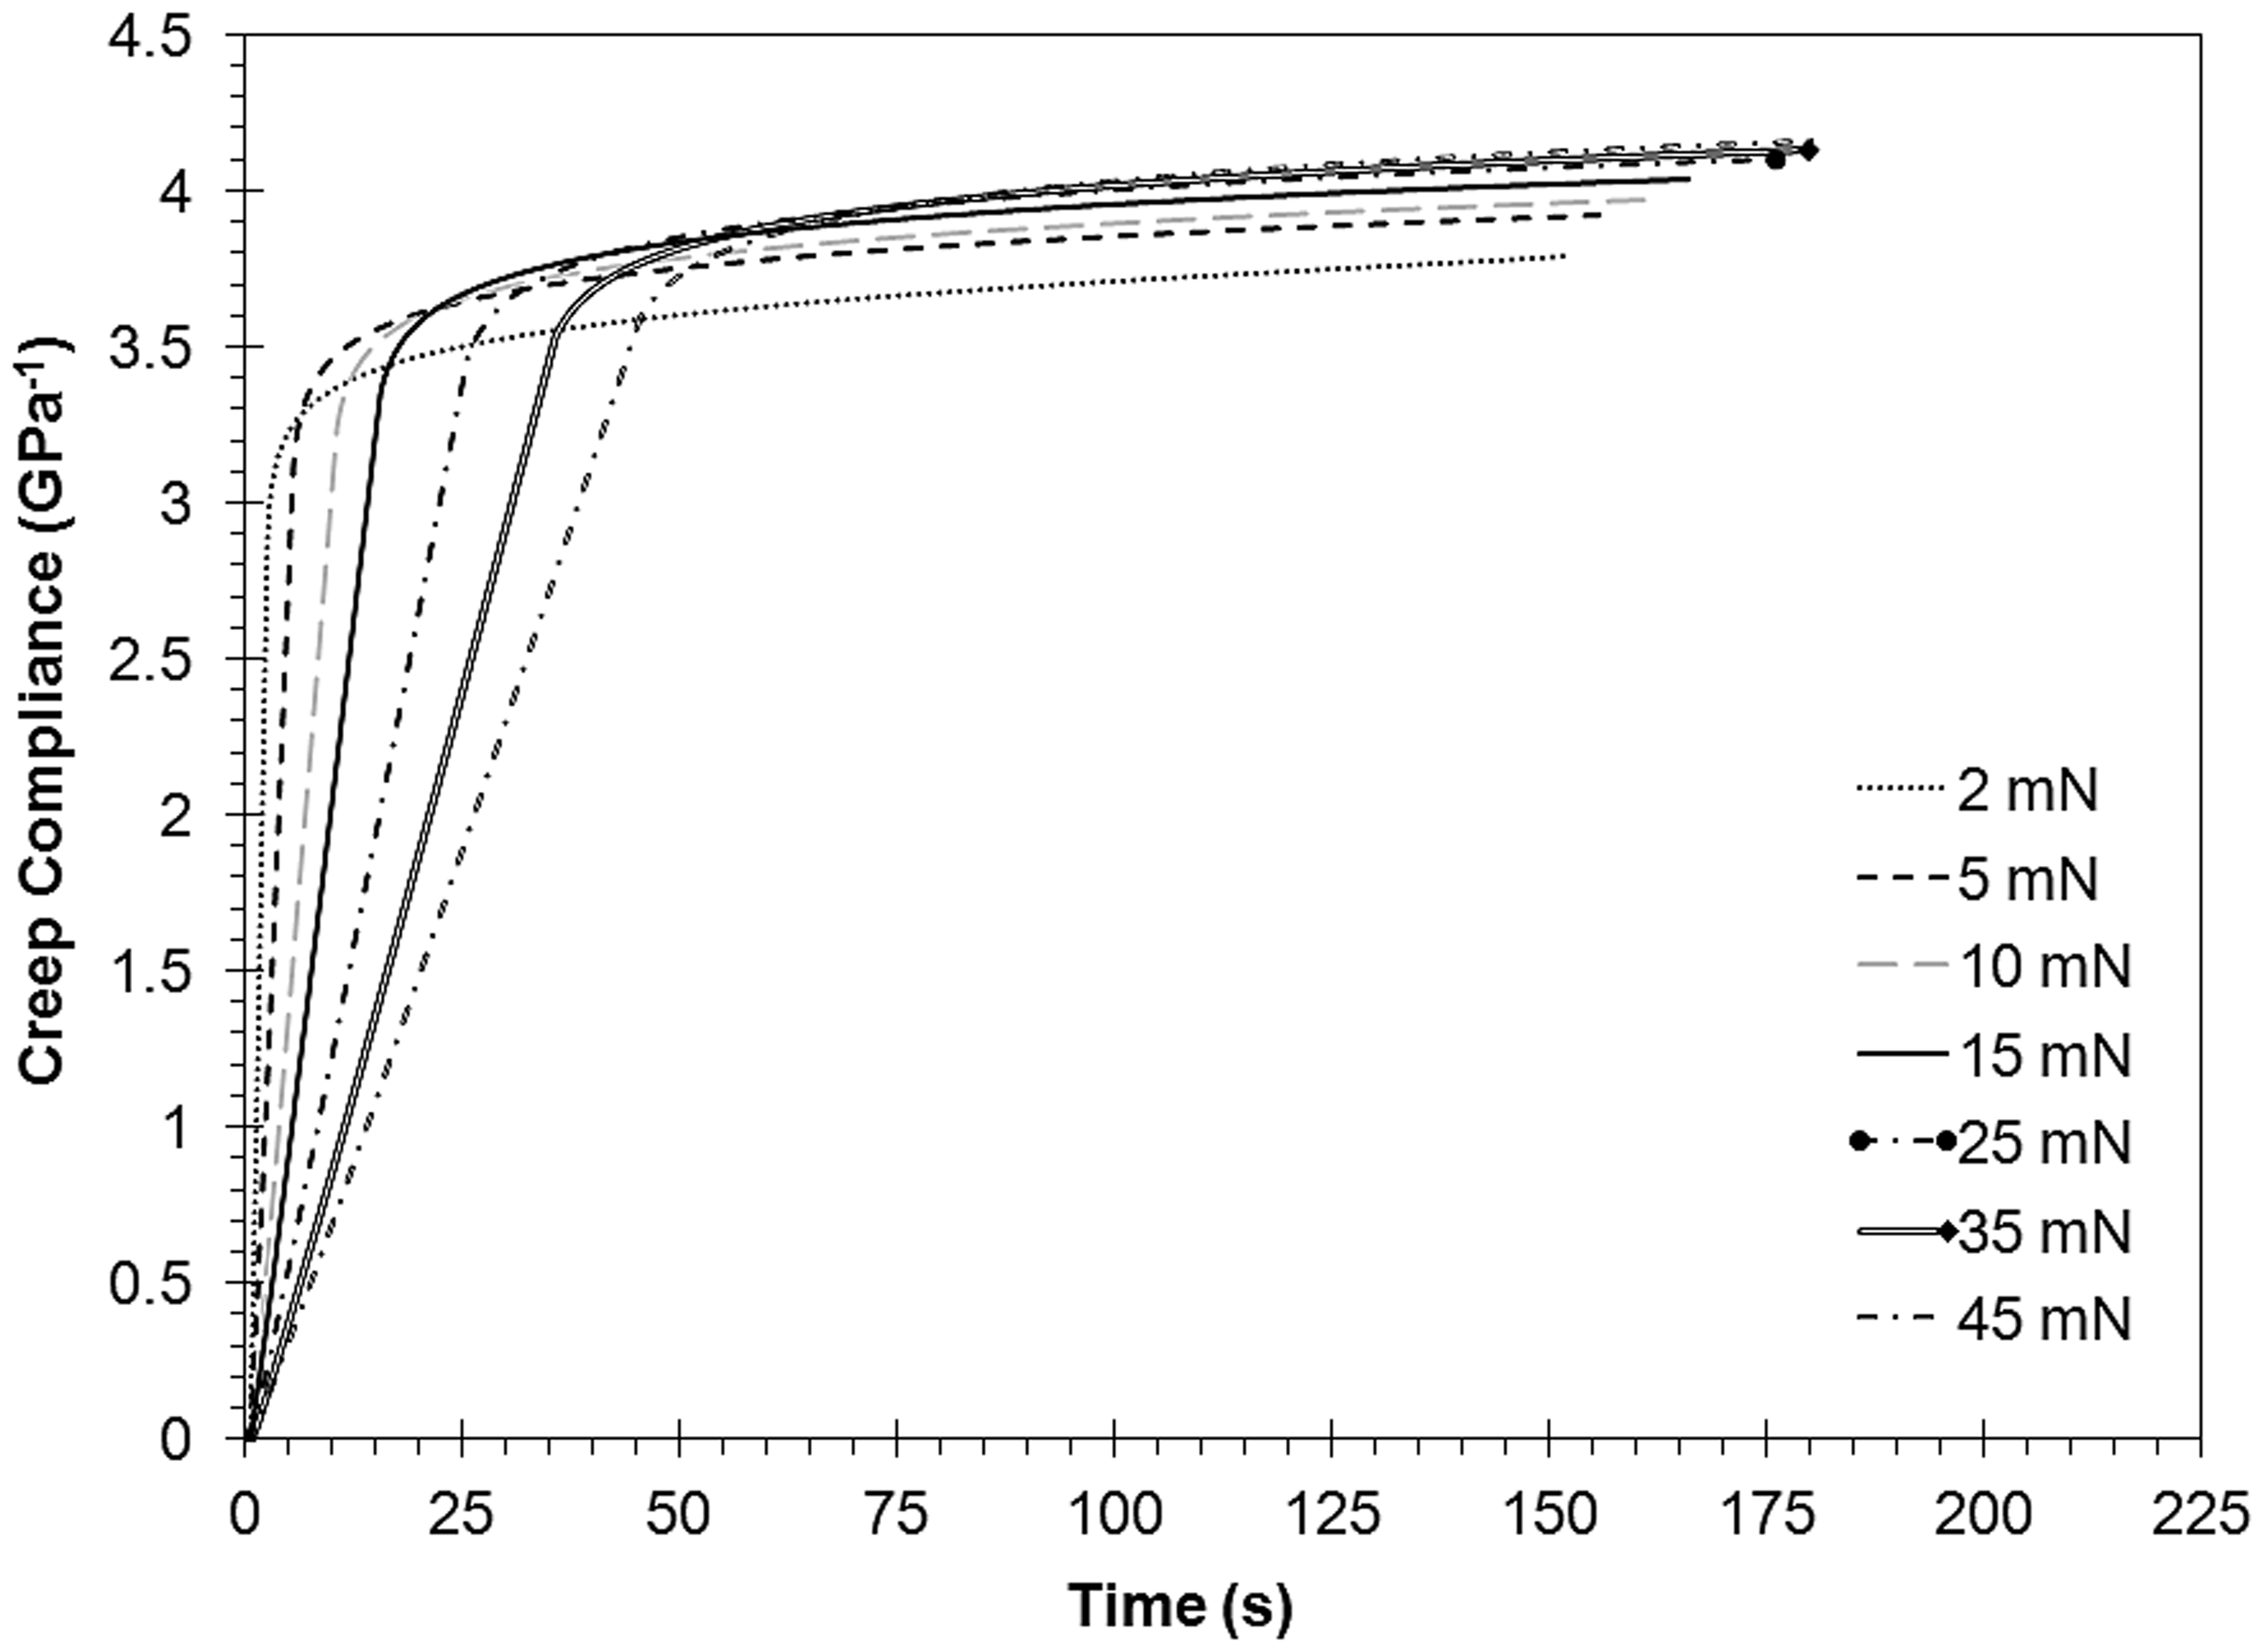

A simplified relationship between the strain rate (

Tensile modulus models
The Halpin-Tsai model predicts the tensile modulus of composite materials using the aspect ratio and volume fraction of the filler, as well as the tensile moduli of the matrix and filler. For unidirectional, discontinuous filler composites, the Halpin-Tsai model predicts the composite tensile modulus in both the longitudinal direction and the transverse direction using equations (6) and (7) shown below
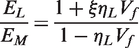
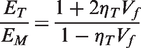

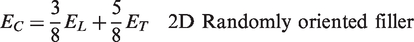
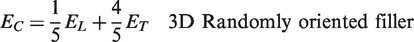
For all formulations, EM, the tensile modulus of the matrix was measured experimentally to be 2.72 GPa. Figures 8 and 9 show the experimental tensile modulus results (shown as data points) for the xGnP®-M-5/epoxy and xGnP®-C-300/epoxy composites, respectively. To model the GNP/epoxy systems, filler information is needed. Graphene sheets have a tensile modulus of approximately 1000 GPa in the plane of the sheet. 1 GNP is made up of multiple sheets stacked on each other. When tensile loads are transferred to the GNP particles from the polymer, the van der Waals dispersion bonding between layers are likely to fail before graphitic carbon-carbon bonding within the sheets fails, leading to further exfoliation of the particle. Hence, for the Halpin-Tsai model, the tensile modulus of xGnP®-C-300 and xGnP®-M-5 was equal to the modulus of exfoliation in the graphite c-axis (through-the-plane) of 36.5 GPa. 26 For platelets the filler shape factor, ξ, is equal to 0.667 (L/d). 27 Figures 8 and 9 show the results for the GNP/epoxy composites with Ef = 36.5 GPa, L/d = 714 (length = 5000 nm and thickness = 7 nm) for xGnP®-M-5, and L/d = 1000 (length = 2000 nm and thickness = 2 nm) for xGnP®-C-300. Figure 8 shows that the 2D Halpin-Tsai model fits the xGnP®-M-5 experimental data well. The 3D Halpin-Tsai model fits the xGnP®-C-300 experimental data well (see Figure 9). It is likely that during composite fabrication, the smaller and thinner xGnP®-C-300 nanoplatelet orients more in the through-plane direction which could cause a more three-dimensional filler orientation. In prior work, Kalaitzidou et al. 4 used the Halpin-Tsai model with ξ equal to 0.667 (L/d) to successfully model the tensile modulus of GNP/polypropylene composites that were produced by extrusion and then injection molding.
Conclusions
In this work, neat epoxy (EPON 862 with Curing Agent W) and composites containing 1 to 6 wt% xGnP®-M-5 or 1 to 6 wt% xGnP®-C-300 were fabricated and tested for the tensile properties via macroscopic methods (ASTM D638) and nanoindentation. Per the authors’ knowledge, properties on these composite materials system have never been previously reported in the open literature. Per ASTM D638, the tensile modulus increased from 2.72 GPa for the neat epoxy to 3.35 GPa for 6 wt% (3.7 vol%) xGnP®-M-5/epoxy composite and 3.10 GPa for 6 wt% (3.7 vol%) xGnP®-C-300/epoxy composite. xGnP®-C-300/epoxy composites had higher tensile strength and ductility compared to similar loading levels of xGnP®-M-5/epoxy composites. For example, composites containing 6 wt% xGnP®-C-300 had a tensile strength of 69 MPa and strain at ultimate strength of 3.6% compared to 36 MPa and 1.4% for 6 wt% xGnP®-M-5/epoxy composites. The composite containing 5 wt% (3.1 vol%) xGnP®-C-300 in epoxy had a good combination of tensile properties (ASTM D638: tensile modulus = 3.0 GPa, ultimate tensile strength = 74 MPa, and strain at ultimate tensile strength of 4.3%).
Modulus measurements by nanoindentation followed the trends reported in the literature for polymers, i.e. the modulus obtained was higher than the results obtained from macroscopic testing. As a simple means to correct the nanoindentation results, a scale factor was used based on the neat epoxy modulus obtained by macroscopic testing. The modulus determined from nanoindentation testing followed the same trend as noticed by the macroscopic testing. For the neat epoxy, 1 to 6 wt% xGnP®-M-5/epoxy, and 1 to 6 wt% xGnP®-C-300/epoxy composites hardness values remained approximately constant at 0.25 to 0.27 GPa.
The creep test by nanoindenation showed that the steady-state creep range was observed for neat epoxy and all GNP/epoxy composites soon after the creep load was reached. The creep compliance curves and calculated stress exponent m were similar for the neat epoxy, 1 to 6 wt% xGnP®-M-5/epoxy, and 1 to 6 wt% xGnP®-C-300/epoxy composites. This finding is similar to that reported by Zandiastashbar et al. 25 for graphene platelet/epoxy nanocomposites.
The 2D and 3D randomly oriented filler Halpin-Tsai models adjusted for platelet filler shape were used to fit the macroscopic tensile modulus results. This model accounts for constituent tensile modulus and volume fraction, as well as aspect ratio and orientation of the filler. The 2D randomly oriented filler Halpin-Tsai model fits the experimental data well for the xGnP®-M-5/epoxy composites. The 3D randomly oriented filler Halpin-Tsai model fits the experimental data well for the xGnP®-C-300/epoxy composites. The smaller, thinner xGnP®-C-300 appears to be more uniformly oriented in all three directions in the composite than the xGnP®-M-5, which tends to primarily orient in a planar manner. Furthermore, this model can be used to predict the tensile modulus of GNP/epoxy composites for the design of composite structures.
Footnotes
Acknowledgements
The authors thank XG Sciences for donating graphene nanoplatelets for this work. The authors would also like to thank the following undergraduate students for their assistance on this project: James A Kenney, Kerry L King, Ryan E McInnis, Andrew N Payton, Elizabeth J Skultety, Stephanie L Tankersley, Dylan G Turpeinen, Lucas D Zoromski.
Funding
This research was funded by NASA under the
Conflict of interest
None declared.