
Abstract
In this experimental study, the performance of injection-molded short flax and hemp fibers in plasticized starch acetate were analyzed in terms of strength. Parameters involved in the analysis are a variable fiber and plasticizer content. The measured strength of the composites varies in the range of 12–51 MPa for flax fibers and 11–42 MPa for hemp fibers, which is significantly higher than the properties of the unreinforced starch acetate matrix. The micro-structural parameters used in modeling of composite strength were obtained from optical observations and indirect measurements. Some of these parameters were qualitatively verified by X-ray microtomography.
Introduction
Bio-based polymers are materials derived from natural and renewable resources (such as plant-based biomass), and as such bio-polymers provide sustainable alternatives to traditional synthetic polymers. However, several bio-based polymers have inferior properties in comparison with the synthetic competitors and suffer from sensitivity to moisture and temperature changes. One of the ways for these materials to reach acceptable performance in terms of mechanical properties is reinforcement with natural fibers, such as wood or agrofibers. The commonly used natural fiber reinforcements are flax, hemp, kenaf, jute, sisal, ramie, and coir. The stiffness of, e.g. bast fibers in the longitudinal direction is comparable to that of glass fibers (for example, flax fibers have a stiffness of 50–100 GPa vs 72 GPa for E-glass fibers).1–4 The direct benefits of use of natural fibers in composites are light weight, reduced wear on the processing equipment, and lower impact on the environment. There are also certain issues with these materials; for example, as they are of natural origin, their mechanical properties are subject to a large variation. Moreover, a common issue with bio-based composite materials is a low chemical compatibility between the fibers and the matrix. This can result in poor performance of the composites due to low fiber/matrix bonding, nonuniform fiber/matrix dispersion, and a high content of porosity.
In order to improve the properties of bio-based composites with regard to processing and performance, miscellaneous additives are used. For example, compatibilizers are used to improve fiber dispersion and fiber/matrix adhesion, and plasticizers are employed to increase toughness of the materials. Sometimes, fire retardants and UV inhibitors are also added to tailor the materials for particular applications.
Common processing methods and products of natural fiber composites include injection molding of packages, extrusion of beams for decking, and compression molding of panels for automotive use. Other methods, such as rotational molding, have also been considered, but so far not widely exploited. The advantage of the good mechanical properties of the natural fibers is perhaps best utilized in compression-molded products. However, this requires additional fiber processing to produce high quality yarns.
Generally speaking, composites based on thermoplastic bio-polymers (lignin, starch, PLA) reinforced with natural fibers are today established as engineering materials used in various industrial branches.5,6
In this study, a bio-based composite system is used where the fibers and the matrix are naturally compatible; both the cellulosic fibers and the matrix consisting of the starch derivative are composed of glucose units. This results in a high level of intermolecular interaction through the hydrogen bonding of the hydroxyl functionalities of the fibers and the starch derivative.
Starch, which is composed of the carbohydrate polymers amylose and amylopectin, is characterized by being highly hygroscopic and with a brittle mechanical behavior. By acetylation of some of the free hydroxyl groups in the starch, the internal hydrogen bonding is strongly reduced and the polymer becomes less brittle and melt processable. In addition, the water sensitivity of acetylated starch is markedly reduced 7 ; the polymer becomes insoluble in water. The brittleness of the polymer can be reduced even further using a plasticizing agent, such as triethyl citrate. The plasticizer content has previously been shown to be directly correlated with the mechanical properties of the starch acetate polymer. 8
This article is addressing bio-based composites of short cellulosic fibers in plasticized starch acetate (PSA) matrix. The composites were produced by compounding and injection molding. This article presents analysis of the tensile strength of these composites. The fiber and the plasticizer contents are used as experimental parameters.
Experimental details
Materials
Hemp and flax fibers were supplied by Ekotex, Poland. Amylose-rich corn starch was supplied by Gargill, USA (Cerestar Amylogel 03003: 65 wt.% amylose, 35 wt.% amylopectin). The length of the flax and hemp fibers was 4 mm and 10–20 mm, respectively. Triethyl citrate (TEC) was used as the plasticizer. Other details of the materials and processes of fiber pelletizing, starch acetylation, and plasticization as well as processing of composites (compounding, post-processing, and injection molding) are described in detail in a previous publication. 8
Tensile tests
Tensile properties of the neat PSA matrix and the composites were measured according to the ISO 527 standard. The tensile specimens were tested on an Instron 4505 Universal Tensile Tester with 10 kN load cell and 5 mm/min cross-head speed. Strain was measured by an Instron 2665 Series High Resolution Digital Automatic Extensometer. Testing was performed at controlled ambient conditions: 23℃ and relative humidity of 50%. Cross-sectional dimensions of the gauge area section of each tensile specimen were measured with a slide gauge (±0.01 mm). Values of Young's modulus (GPa, linear regression between strain of 0.0005 and 0.0025 mm/mm) and maximum stress (MPa) were determined from the average of five stress–strain curves.
Tomography
X-ray microtomography was used to obtain 3D images of the internal structure of the composite. These images were not used for quantitative characterization of parameters of microstructure (which were obtained from optical microscopy) but rather for verification and demonstration of assumptions concerning the fiber orientation, porosity, etc. used in modeling.
The Xradia MicroCT tomograph with 1.2 µm pixel size was used in this work, yielding a maximum sample diameter of approximately 2 mm. No preprocessing of the samples was made, except cutting to the required size to fit the field of view.
Theory
The main objective of this paper was to present data on the mechanical performance of the flax and hemp/PSA composites. Modeling is employed to demonstrate trends in changes of mechanical properties with respect to the parameters of the composite constituents (such as fiber and plasticizer contents). The stiffness modeling has been performed in previous work, 9 whereas the current work is focused on the strength modeling of the composites.
Many strength models for short fiber composites are based on “rule-of-mixtures” expressions.10–13
The strength of composites can be expressed as
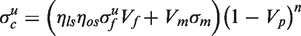
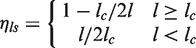
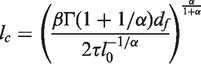
The fiber length efficiency factor is calculated as follows
10
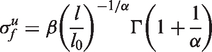
It has been shown previously2,3 that the strength of flax fibers, similarly to synthetic fibers (such as carbon and glass fibers), can be well described by a Weibull distribution. According to this distribution, the average fiber strength is given by
The fiber orientation efficiency factor ηos can be obtained either directly by optical measurements, or by analyzing stress–strain curves of the composite using a rule-of-mixture expression for stiffness. 16 It was shown that both of these approaches rendered the same results for the orientation factor of short glass fiber composites with four different thermoplastic matrices. The same approach (analysis of stress–strain curves) was successfully applied to polypropylene reinforced with flax and hemp fibers.17–19
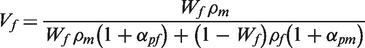
The volumetric composition of composites, Vf, Vm, and Vp, can be shown to be correlated to the fiber weight fraction, Wf, in the whole range from Wf = 0 (only matrix) to Wf = 1.0 (only fibers). In the present study, a previously developed model
20
will be used for the region where Wf is below a transition value given by the maximum fiber volume fraction of the composites
In the present study, most of the input parameters for the models are obtained experimentally; however, some of the characteristics of composite and constituents (e.g. ISS, fiber orientation factor, and fiber stiffness) were not measured directly. Therefore, the following assumptions are made:
Perfect adhesion between fiber and matrix is assumed and ISS is assumed equal to the shear yield stress of the matrix τy which can be calculated from the tensile yield stress σy as The fiber orientation factor will be assumed equal to the values calculated based on experimental results for composite stiffness
9
; The stress in the matrix (σm in equation (1)) at the failure strain of the fiber is assumed to be equal to the matrix strength.
It should be noted that along with the assumption (a), the values of ISS are also found by fitting the model to the experimental data. These values are then compared with data obtained from the yield stress of the matrix.
Results and discussion
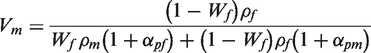
The typical stress–strain curves from tensile tests for unreinforced PSA are presented in Figure 1. These results show that the plasticizer content has a very strong effect on the mechanical properties of the starch acetate matrix. The stiffness and strength of PSA are drastically reduced, whereas the strain at failure is significantly increased with an increase of the plasticizer content. Similar effect of the plasticizer content is observed from the results for the composites (see Figure 2), but the composite properties also very strongly depend on the fiber content. Higher fiber content increases the stiffness and strength, and decreases the strain at failure. A summary of results for the flax and hemp fiber composites is presented in Tables 1 and 2, respectively.
Typical stress–strain curves for unreinforced PSA with variable plasticizer content. Typical stress–strain curves for flax (a) and hemp (b) fiber composites with PSA matrix, and variable fiber and plasticizer contents. Summary of experimental results for flax fiber composites. Summary of experimental results for hemp fiber composites.
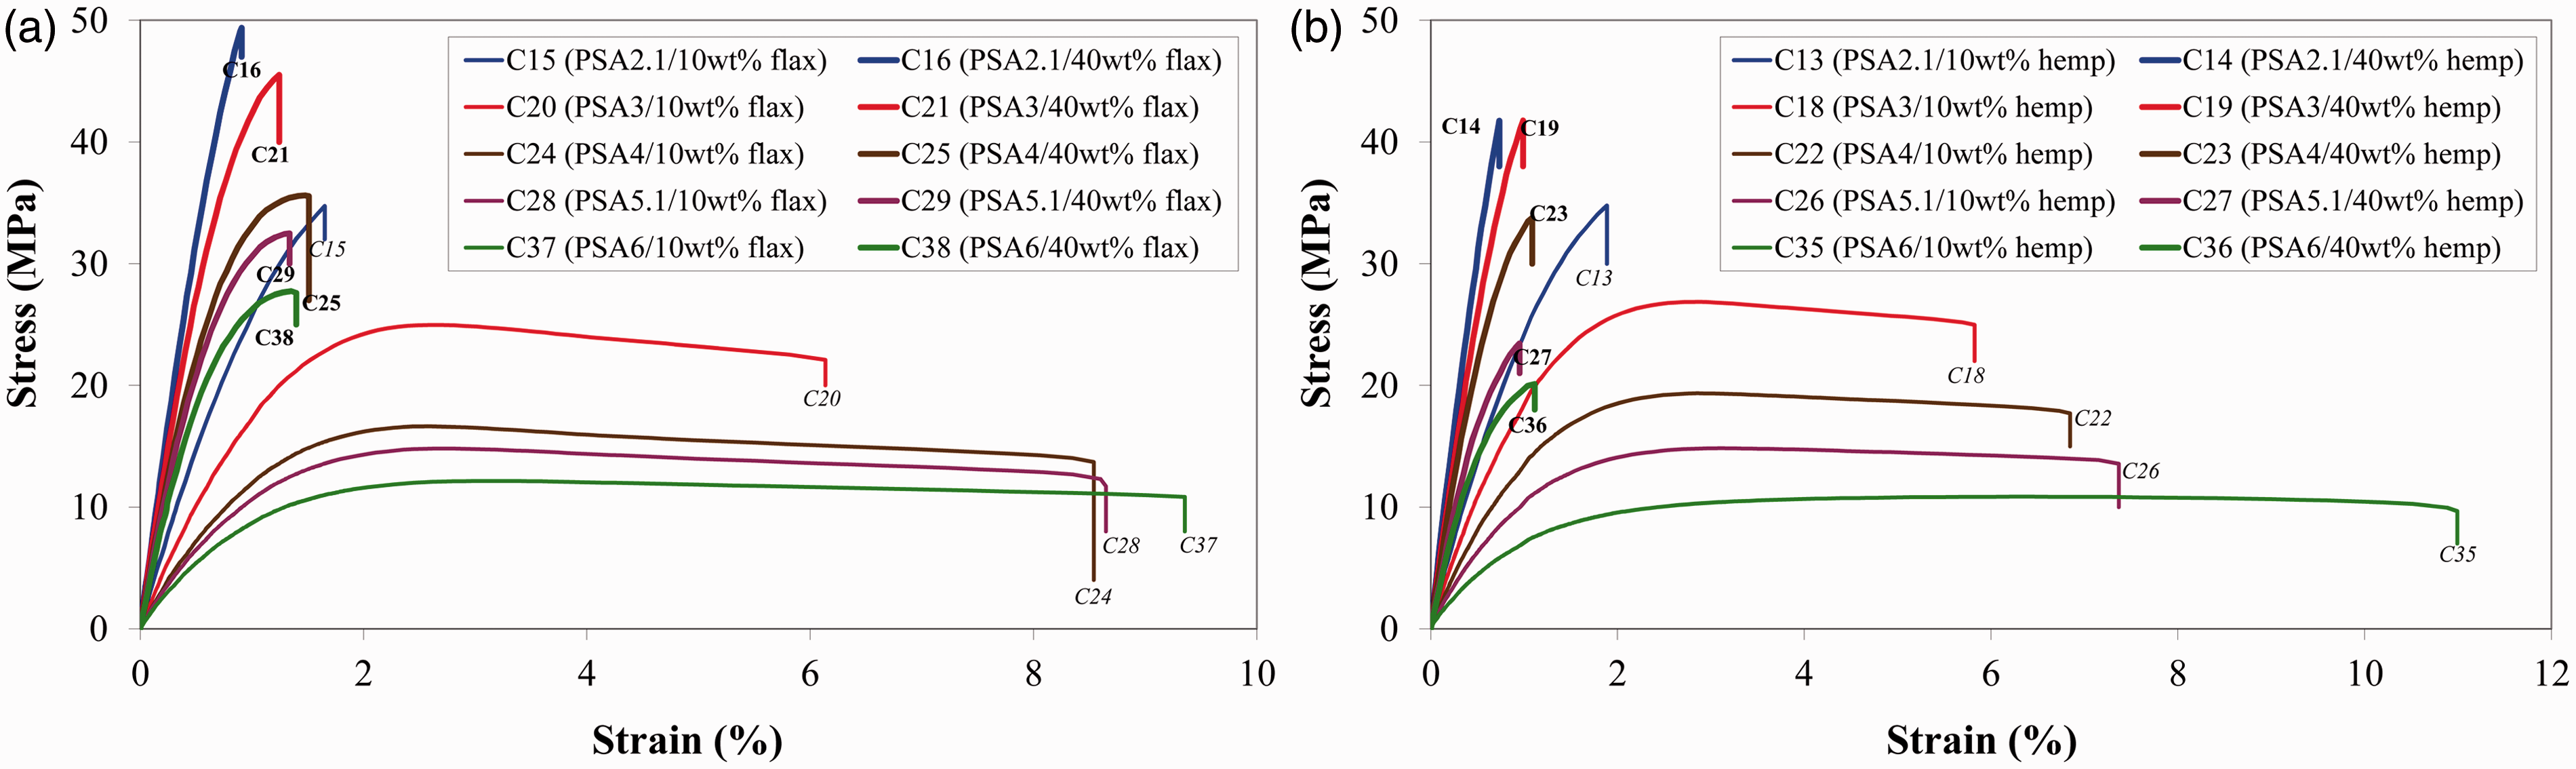
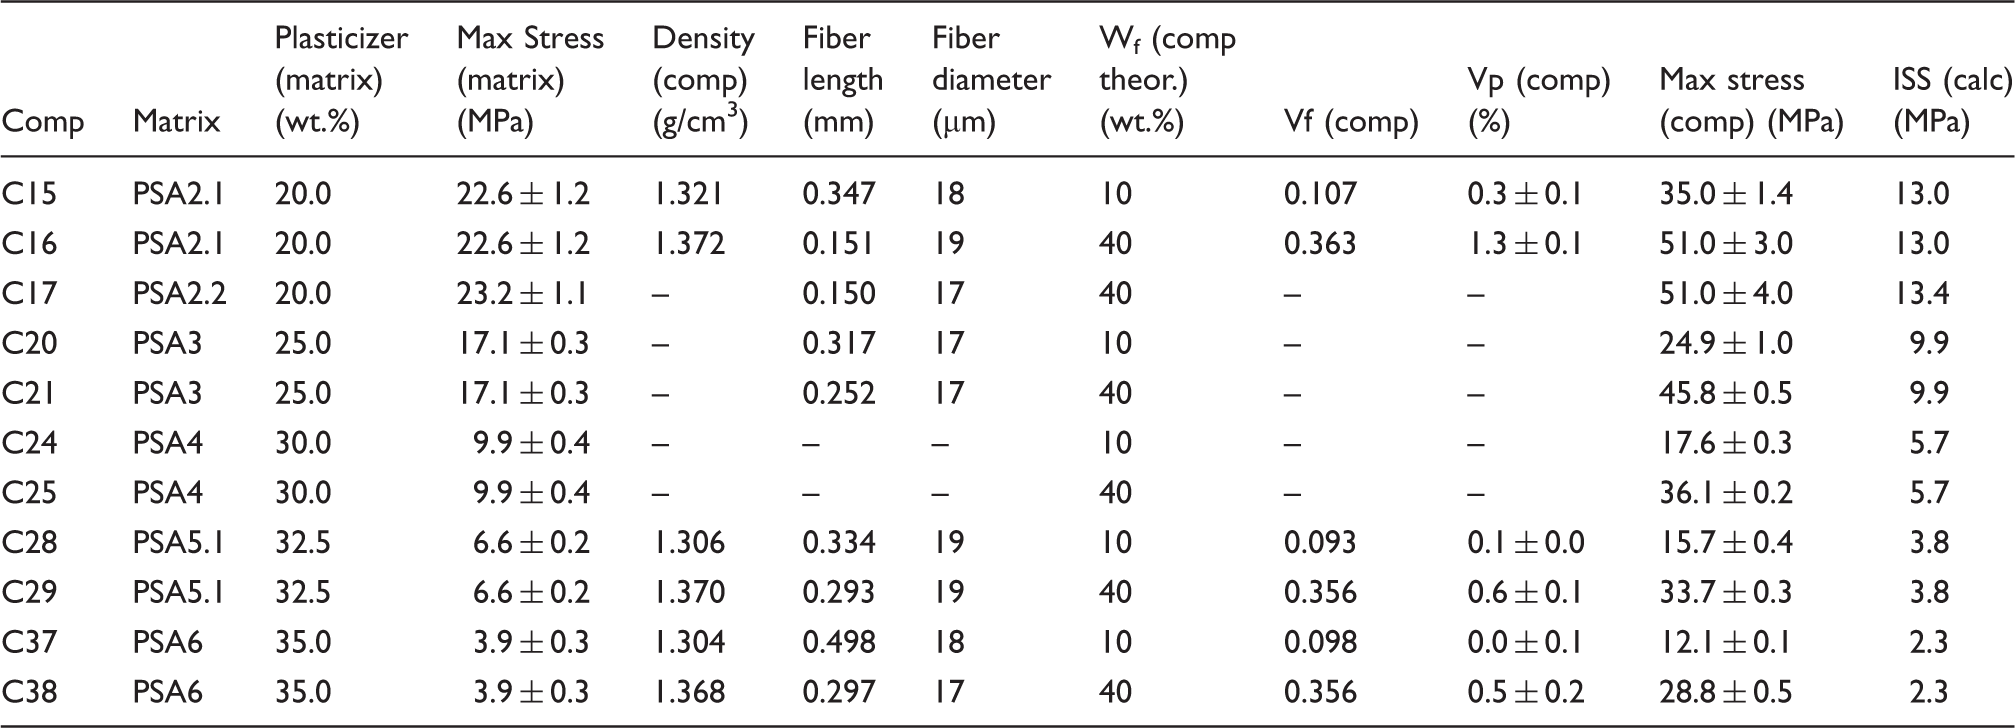
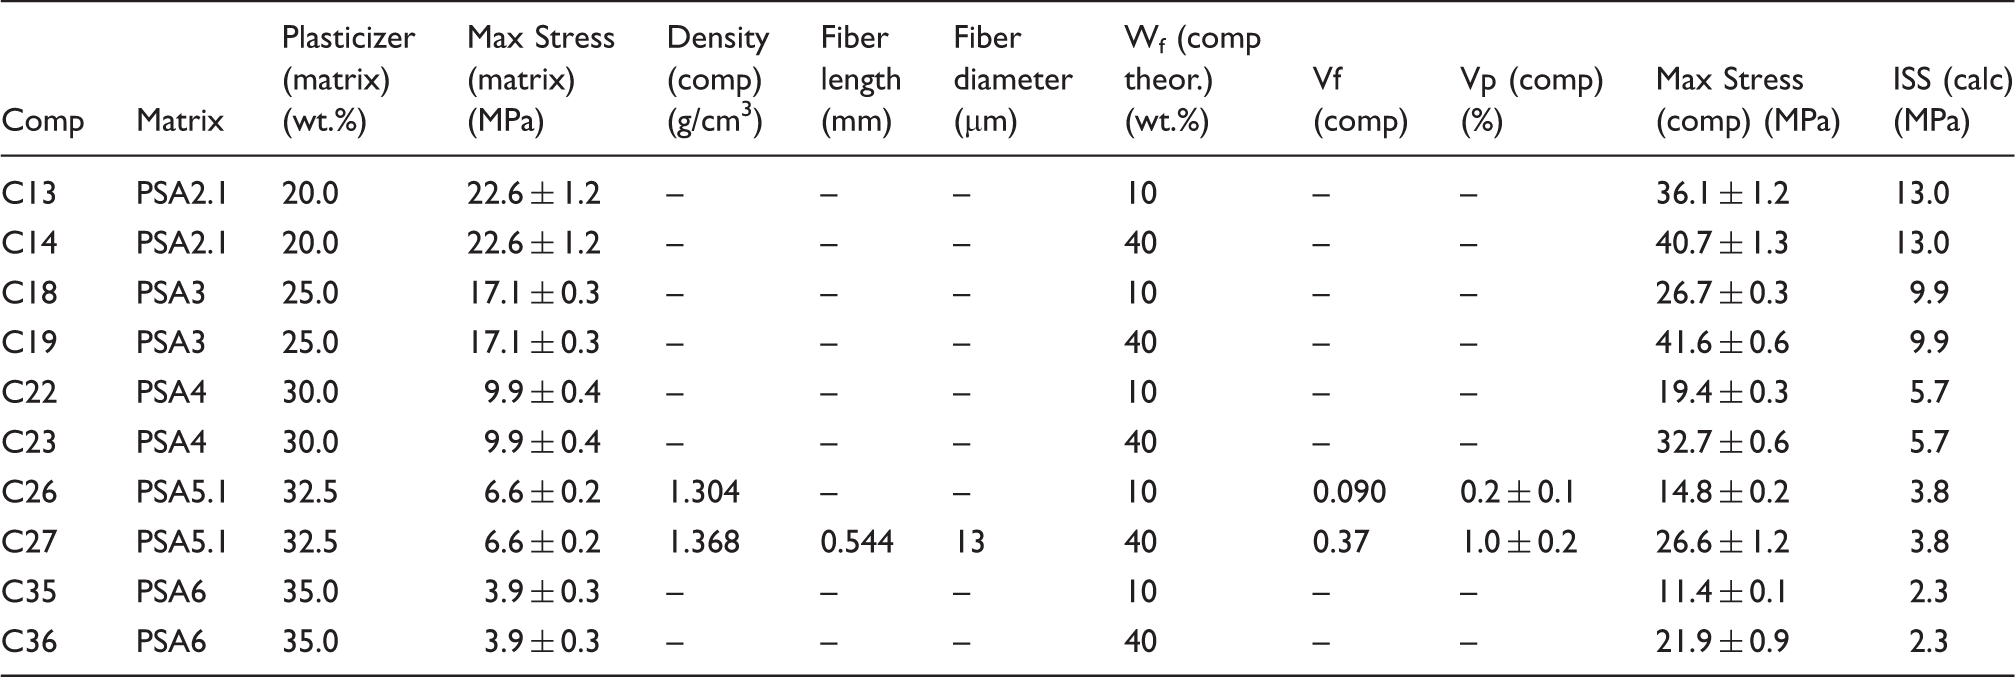
The results in Tables 1 and 2 show that there is a very significant reinforcing effect of flax and hemp even at a low volume content of fibers. The maximum stress of PSA is considerably increased by approximately 50–640% in case of flax fibers and by 60–460% in case of hemp fibers, depending on the materials composition (plasticizer and fiber content).
Based on mechanical testing of single fibers, the probability of failure for similar flax and hemp fibers (from the same supplier) as used in the composites of the present study is shown in Figures 3(a) and 4(a), respectively. These results are obtained from tensile tests of 20 mm long fibers (the detailed experimental procedure and data processing procedure have been described in previous publications2,3).
Probability of failure (a) and average strength (b) of flax fibers: experimental (○,□), prediction (–). Probability of failure (a) and average strength (b) of hemp fibers: experimental (○,□), prediction (–).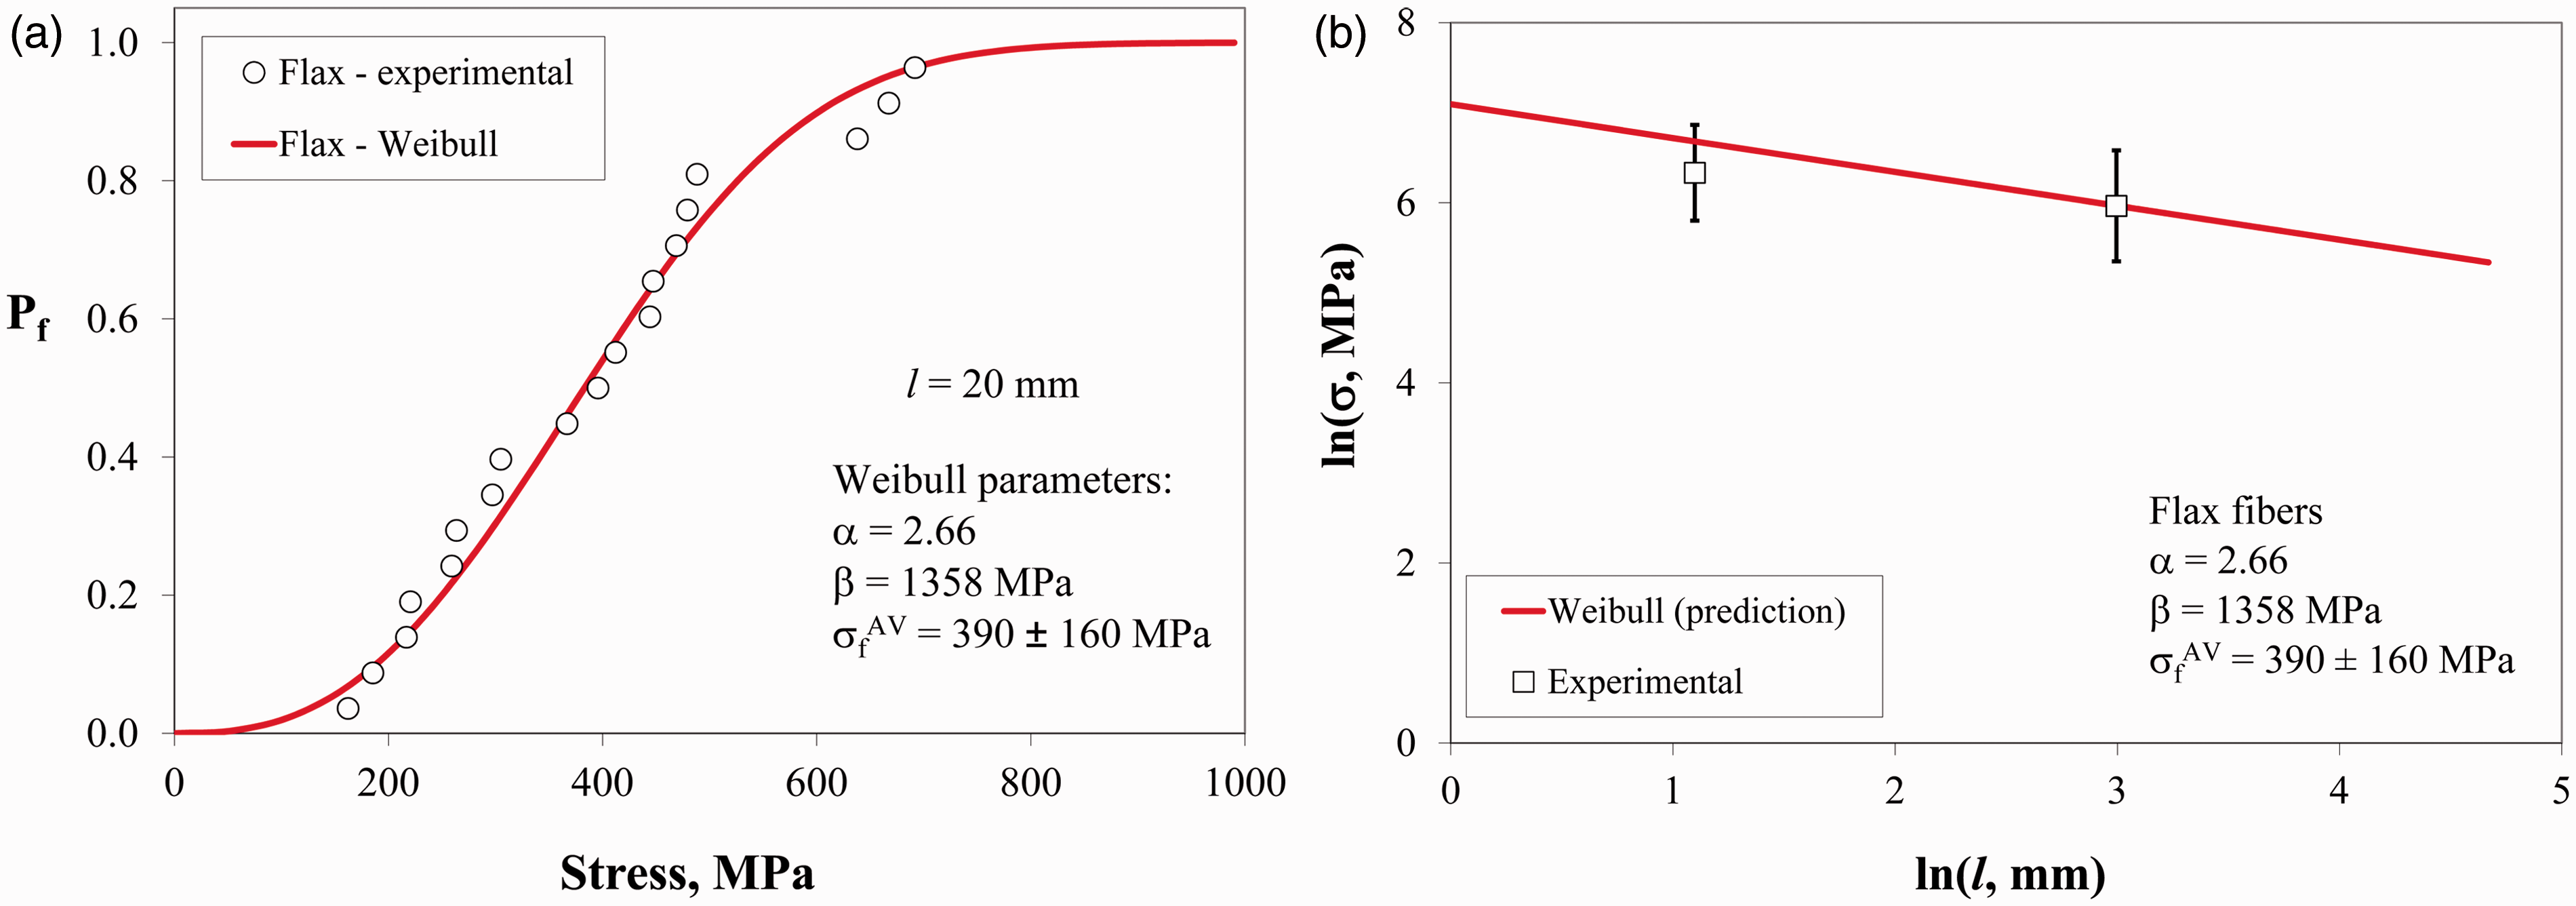
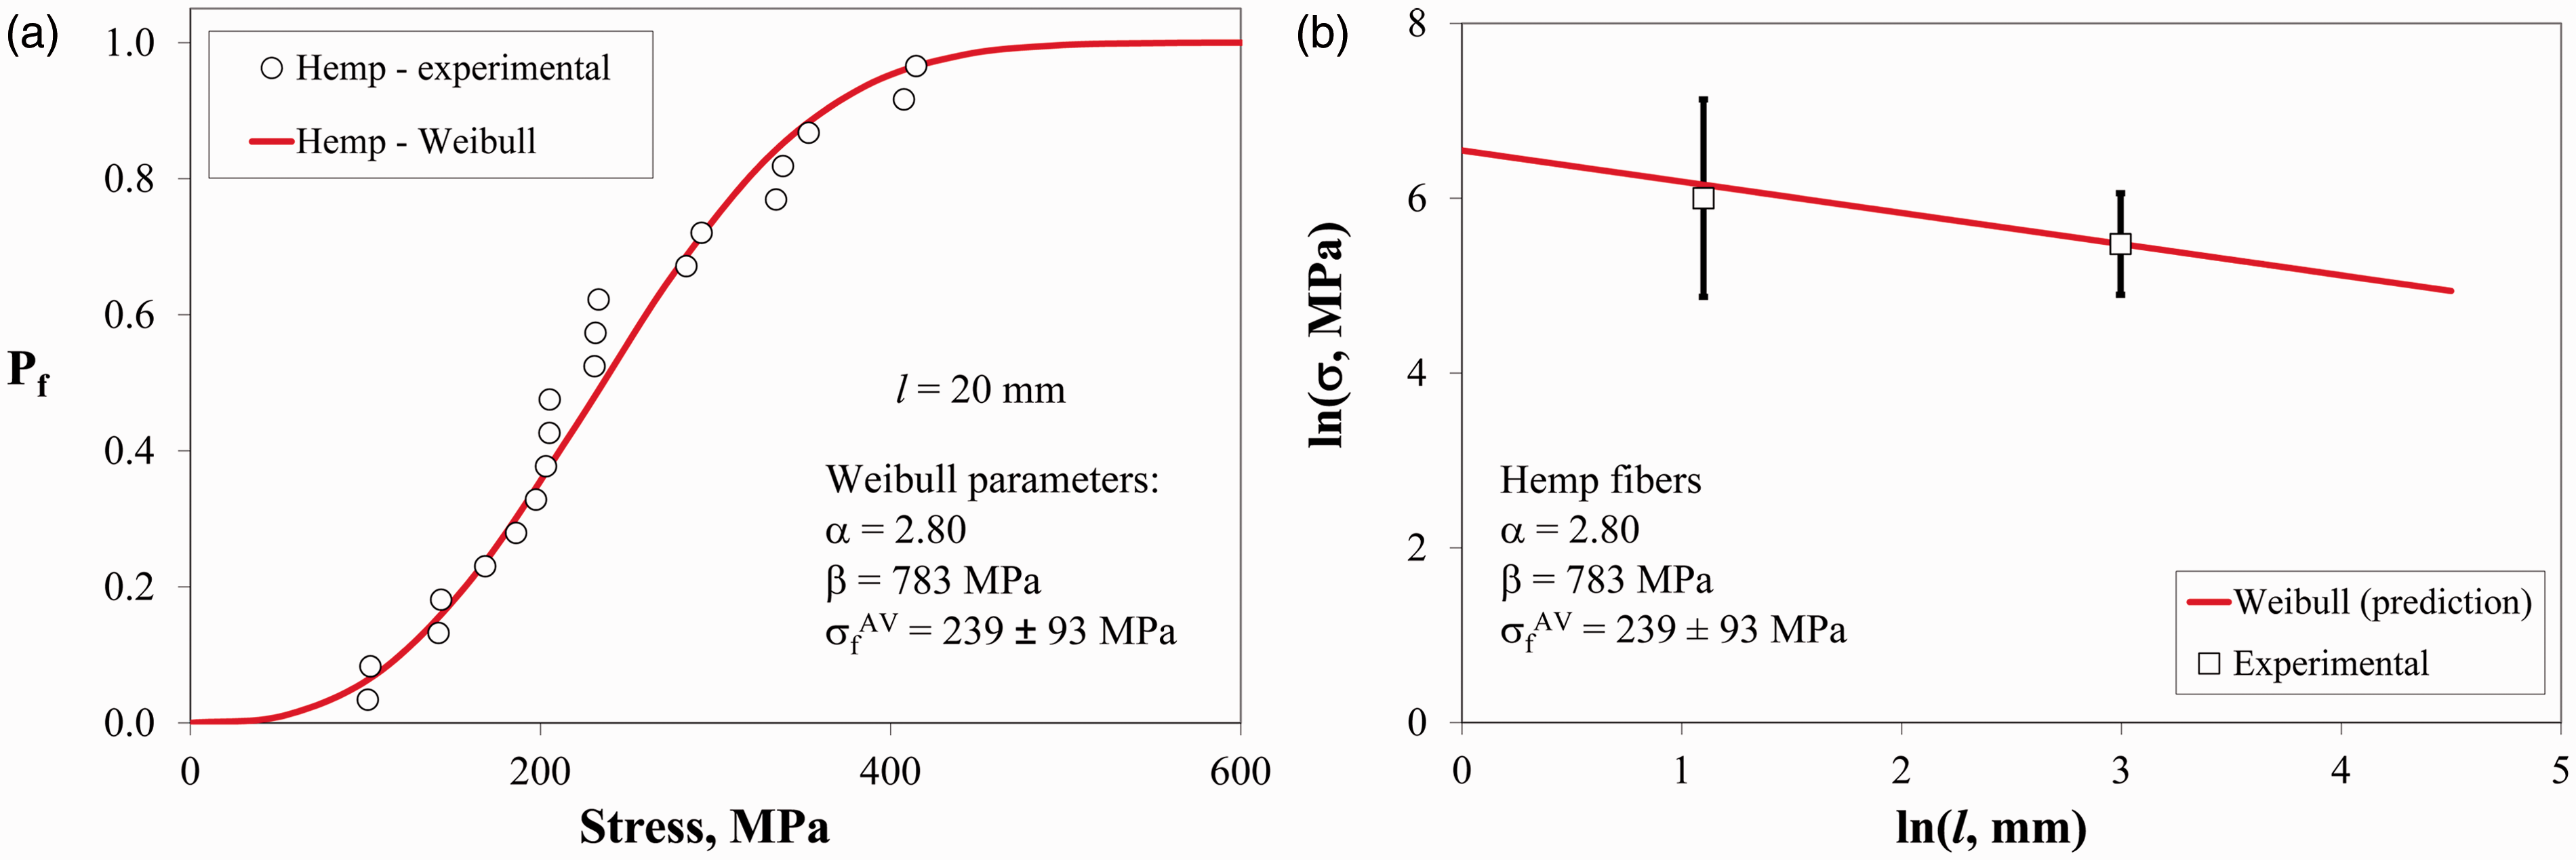
The experimental results presented in Figures 3(a) and 4(a) are approximated by a Weibull distribution and the parameters of the distribution are estimated (flax: α = 2.66, β = 1358 MPa; hemp: α = 2.80, β = 783 MPa). The average fiber strength as a function of the fiber length (equation (3)) is shown in Figures 3(b) and 4(b) for flax and hemp fibers, respectively (the prediction is compared with experimental data for 3 mm long fibers). Thus, it is indicated that the strength of a fiber of any length can be obtained by using equation (3). This is done for composites for which fiber length is measured and the resulting average strength of fibers is further used to predict the composite strength. Comparison between strength distribution for flax and hemp fibers is shown in Figure 5.
Comparison between strength distribution of flax and hemp fibers.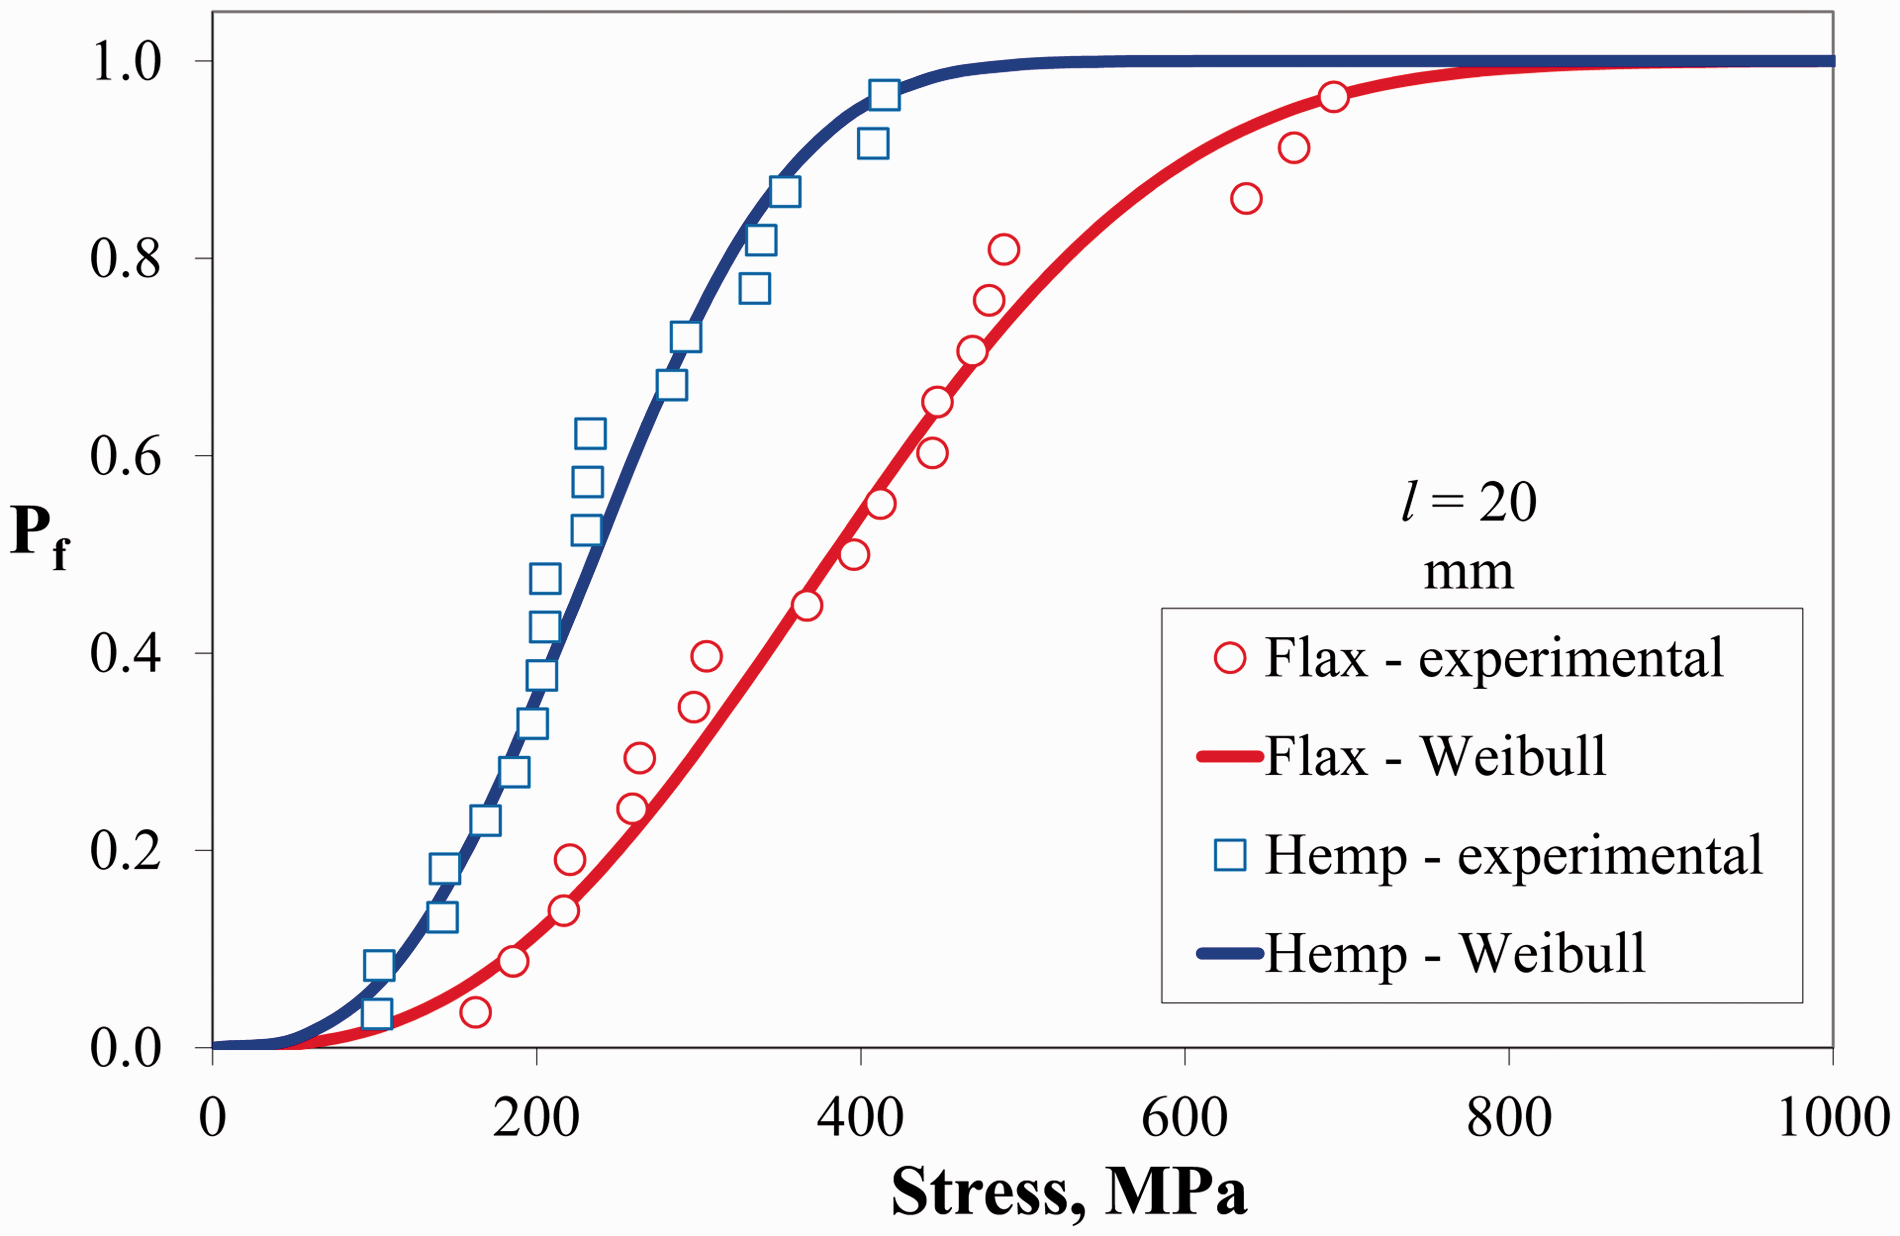
In the previous work on stiffness modeling of the flax and hemp/PSA composites,
9
the fiber orientation factor was estimated to be 0.61 and 0.29, respectively, for the two types of fibers. Even though these results are not further validated here, these values will be used for ηos in the present study. It should be noted that the authors are aware of other, more accurate experimental techniques that allow direct calculation of this parameter, e.g. X-ray microtomography. However, at the time when this work was performed, such experimental setup was not accessible for the authors. For demonstration purposes, a few images with the method recently became accessible are presented here for the flax composites (see Figure 6). These images show that there is a definite preferential orientation of fibers with loading direction, which could be expected to correspond to the value of the fiber orientation factor on 0.61 used in this work. It should be noted, however, that the three images in Figure 6 do not look the same in terms of color distribution which means that there is some difference in fiber orientation. This indicates that there might be some effect of the fiber and plasticizer content on the fibre orientation. This, however, is not verified in the current study.
Microtomographic images of fiber orientation in flax composites. Red color indicates that the local fiber orientation equals the loading direction, as visualized in the legend.
Results of modeling of the flax and hemp composite strength.

Note:
There is no consistent trend for the prediction of the composite strength: in some cases, it overestimates experimental results, whereas in others, experimental results are underestimated. These discrepancies between experimental and predicted strength values might be attributed to possible inaccuracies with respect to the estimation of fiber orientation and ISS. It should be noted that the highest deviation between predicted and measured strength is for the composites with high plasticizer content >30% (materials C28, C29, C37, C38). It is shown further that this may be related to the underestimation of ISS.
Table 3 shows predictions for composites with input parameters (fiber length, strength of matrix, volume fraction of fibers, etc.) that were measured experimentally. In order to perform modeling enabling prediction of strength for composites with any plasticizer and fiber content, it is necessary to know the following dependencies:
Strength of matrix as a function of plasticizer content; Density of matrix as a function of plasticizer content; Fiber length as a function of plasticizer content and fiber content; Porosity in composites as a function plasticizer content and fiber content; and ISS as a function of plasticizer content.
Based on the experimental data and available semi-empirical models for the parameters, mathematical functions for all of the input parameters needed for prediction were obtained.
9
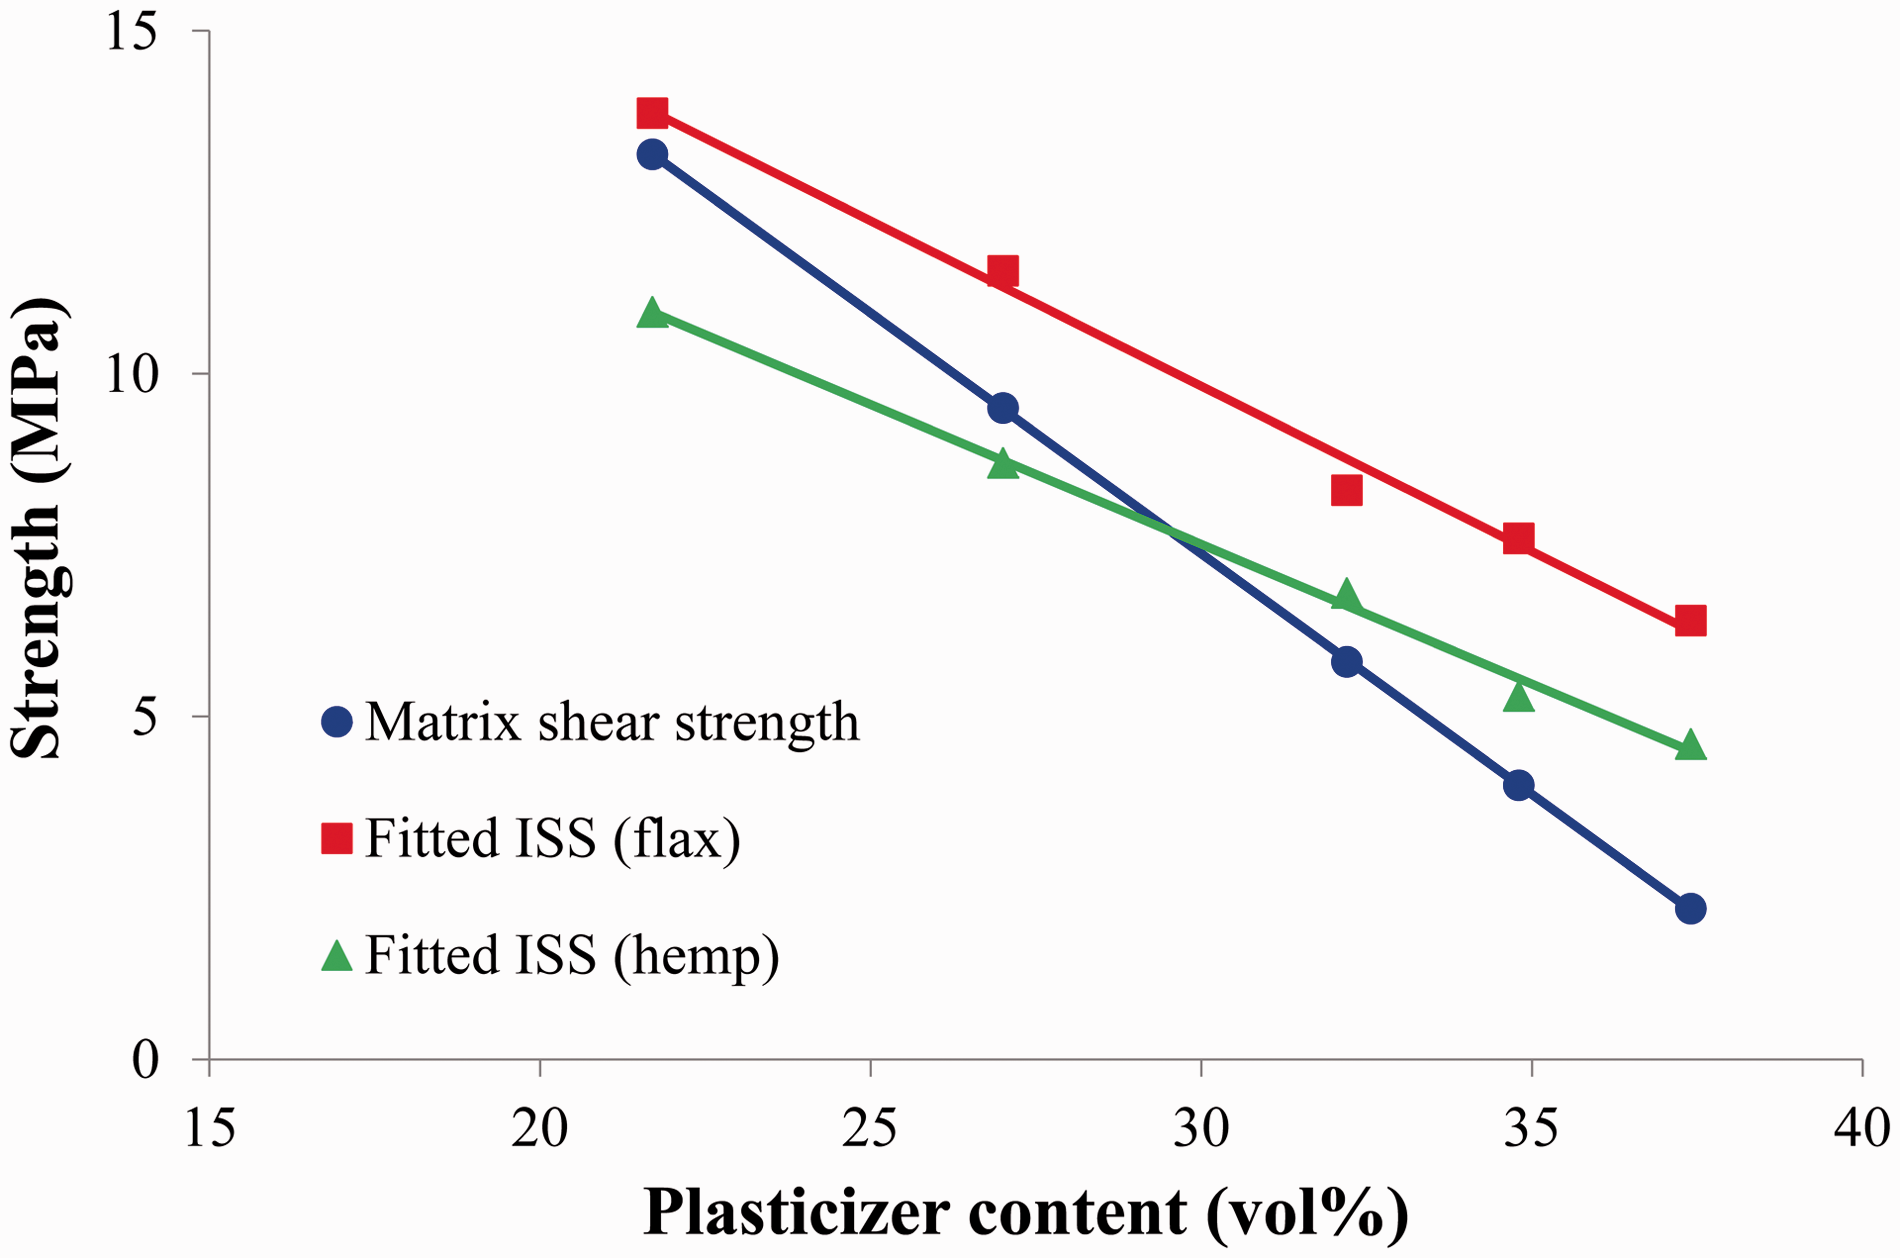
Example of the prediction of flax composite strength as a function of the fiber content, for the different plasticizer contents, is shown in Figure 7(a). It is obvious that the model does not predict composite strength very well. One of the most uncertain input parameters in this case is ISS, since it was not measured, but rather calculated based on the tensile strength of the matrix using the von Mises criteria (case of pure shear). It was decided to obtain ISS by fitting the composite strength predictions to the experimental data. The results of this procedure are shown in Figure 7(b). As seen from this graph, the experimental results are now predicted with very good accuracy. The comparison between the calculated (i.e. the calculated matrix shear strengths) and the fitted ISS values is shown in Figure 8. These results show that the fitted ISS values are consistently larger than the calculated ISS values; however, numerically the difference between them is relatively small (less than 4 MPa). It should be noted that generally it is expected that ISS will be lower than the shear strength of the matrix (or they can be equal in some instances), which, however, is not the case for these materials. It can also be seen from Figure 8 that the difference between ISS and shear strength of matrix increases with an increase of the plasticizer content.
Modeling results showing flax composite strength dependence on fiber and plasticizer contents: (a) using calculated matrix shear strength as ISS values and (b) using fitted ISS values. Comparison between the calculated matrix shear strength and the fitted ISS values for the flax and hemp composites.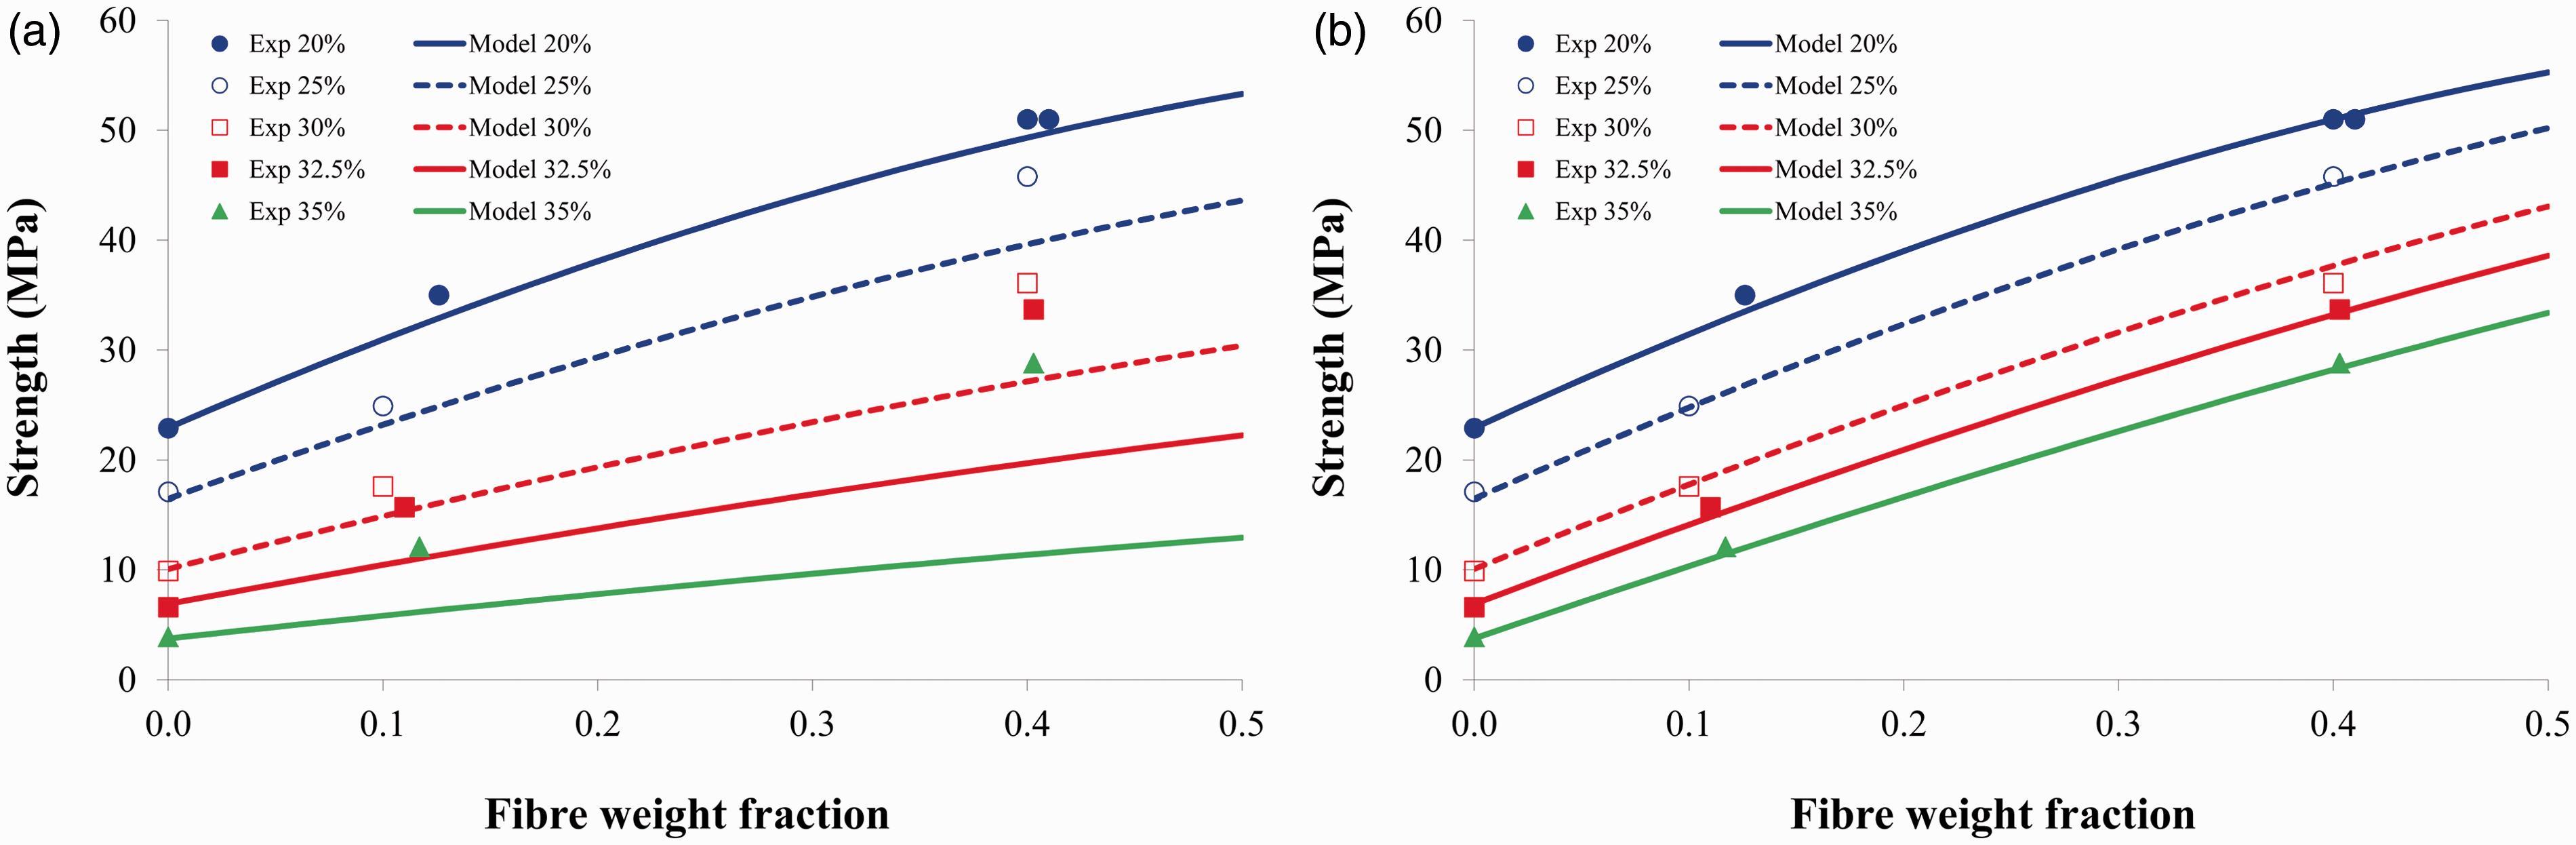
The observed discrepancy between the ISS values determined by the two approaches can be due to the fact that the shear strength of the matrix is obtained (calculated from tensile strength) from tests of the unreinforced polymer, whereas the fitted ISS values are found from tests of the composites. Polymers can perform differently in composites due to the constraining effect of the fibers. In general, the polymer can be expected to be stiffer in composites due to the tri-axial stress state in comparison to the uniaxial stress state in the neat polymer. Thus, it is expected that the polymer will show also higher strength in the composites than the results obtained from tests of the neat polymer.
Once the dependencies of the model input parameters on the plasticizer and fiber content are established, it is possible to make predictions of the strength of composites with any composition. The result of this modeling is shown in Figure 9 as a surface plot for the strength of flax fiber composites as a function of plasticizer content and fiber weight fraction. The experimentally measured strength of the composites is also presented in Figure 9 as single data points (symbols).
Property diagram of strength of flax fiber/PSA composites with variable fiber content and plasticizer content. Symbols represent experimental results (filled circles are above the surface and empty circles below the surface).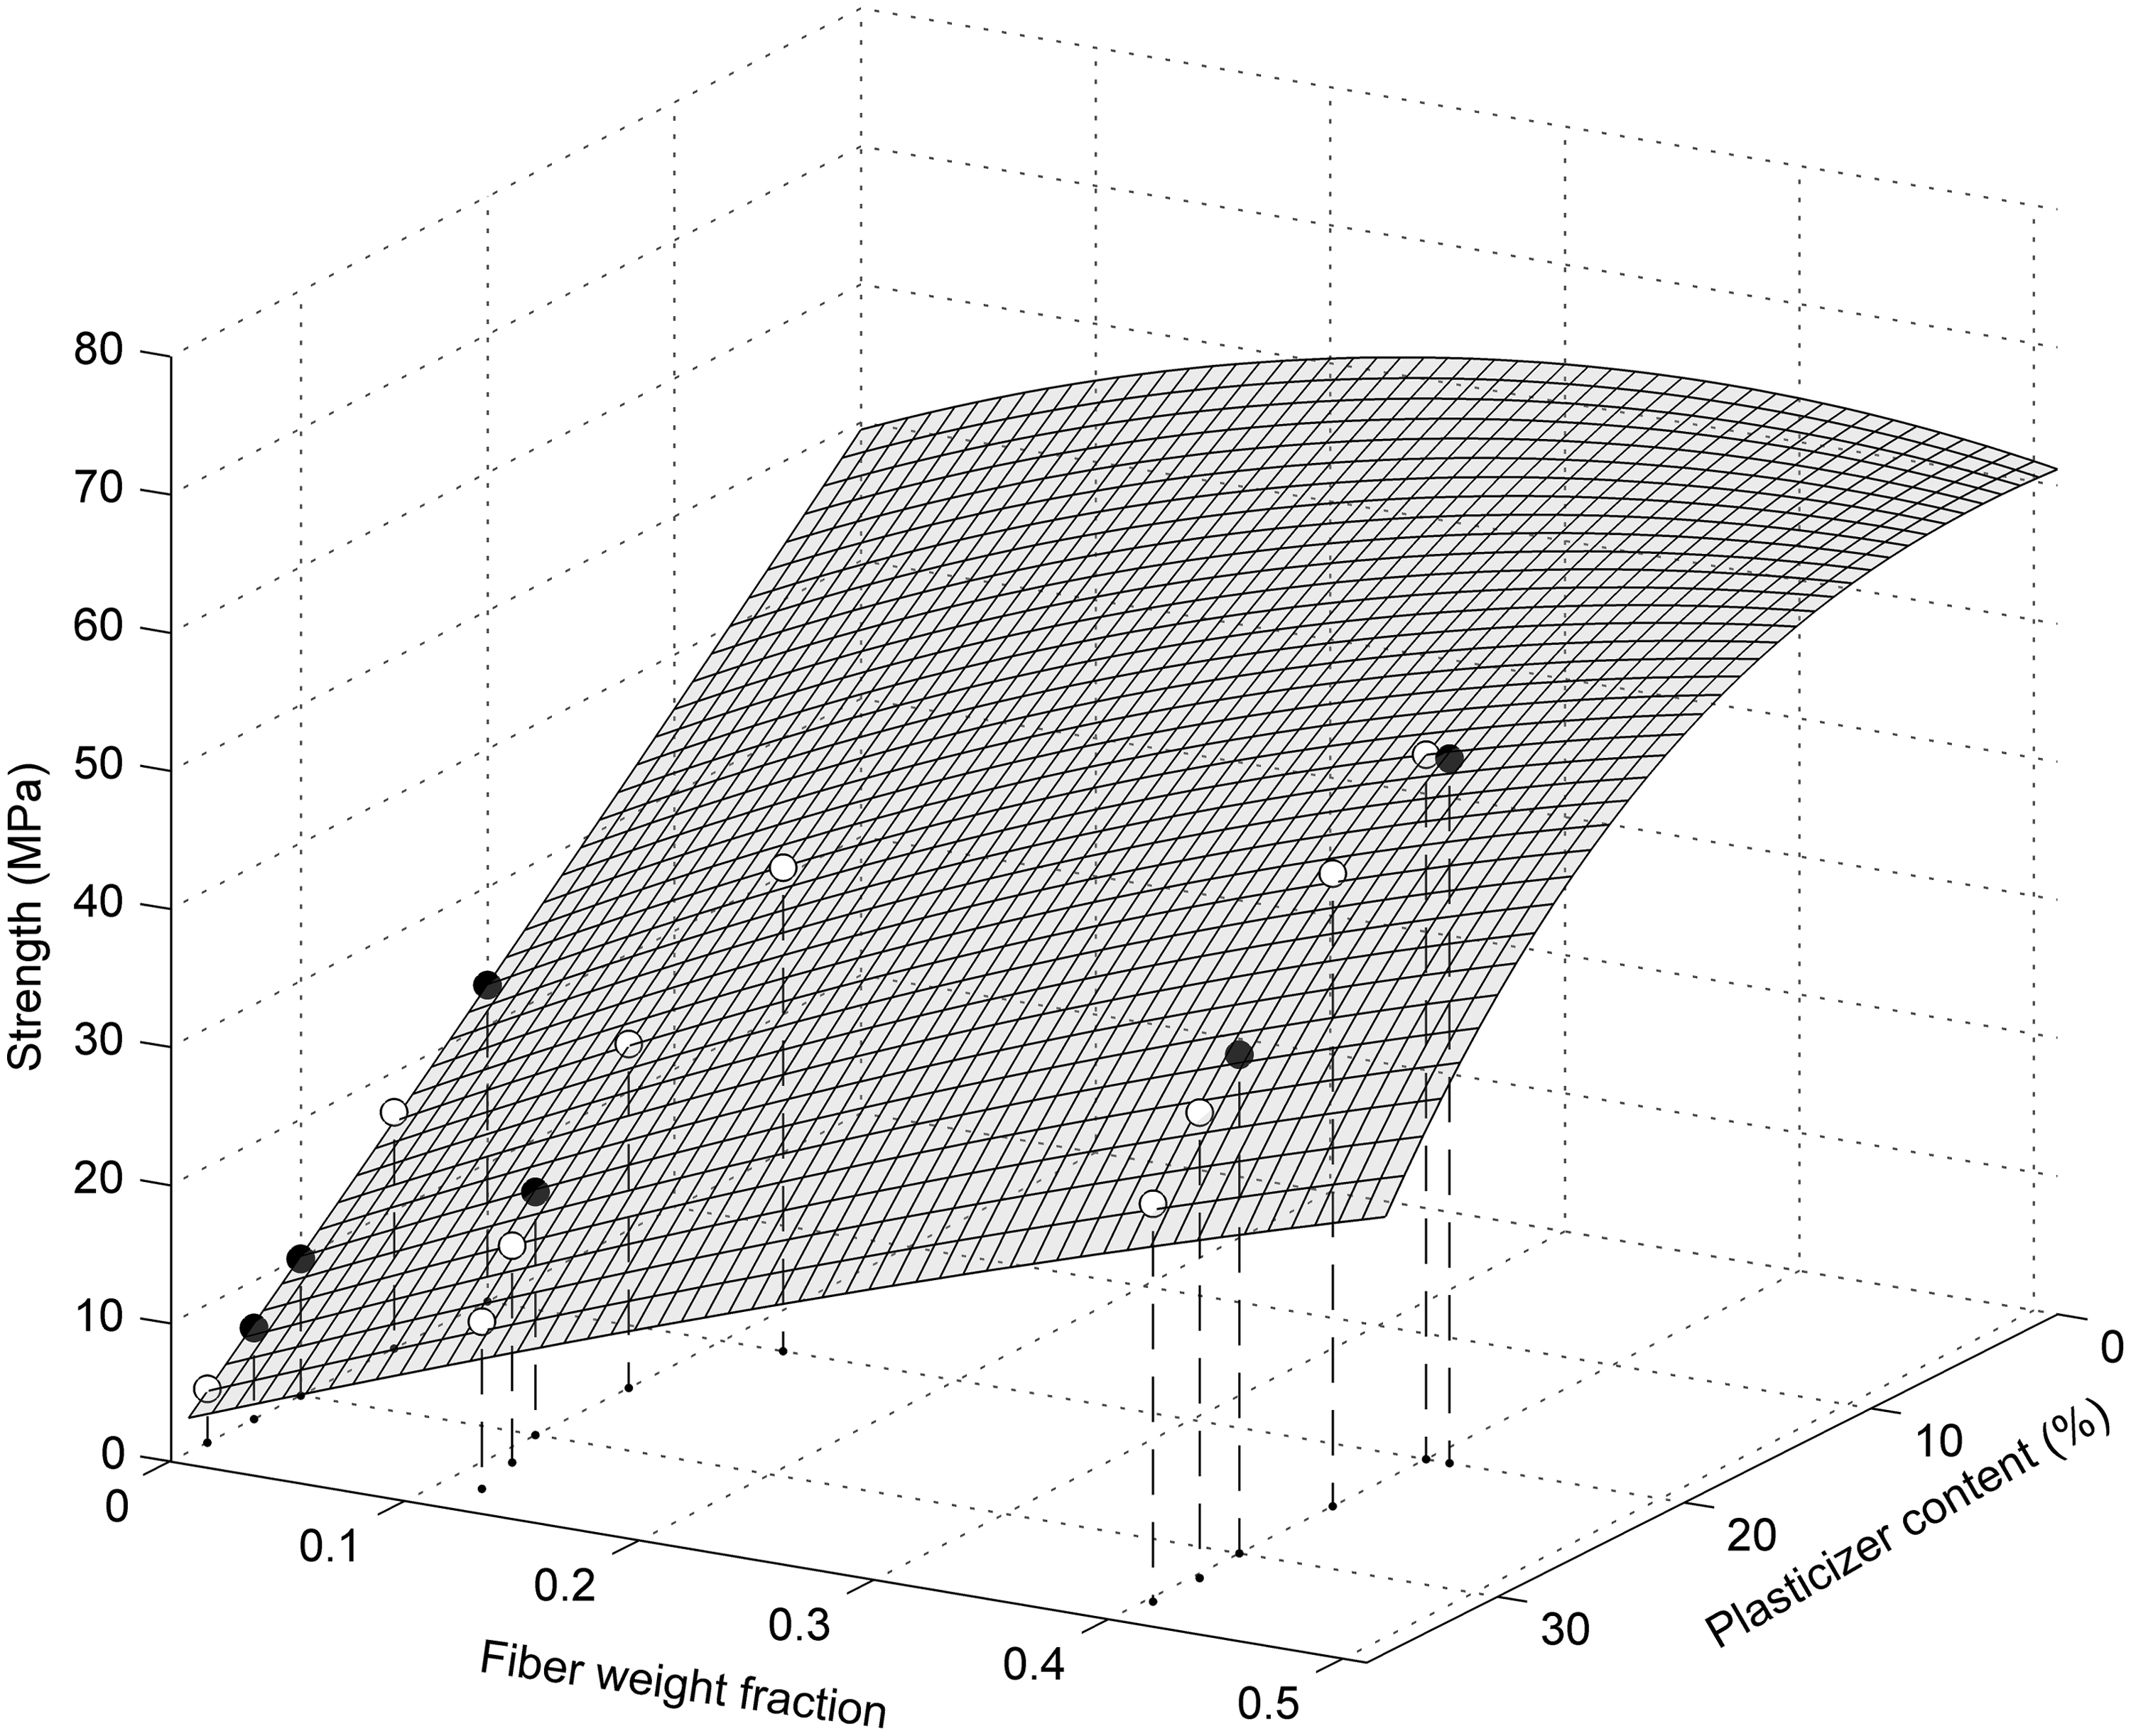
Next follows model predictions made for the strength of the hemp fiber composites. Unfortunately, there are much less experimental data available for these composites and some additional assumptions have to be made. Since the matrix used in the hemp and flax composites is the same, and the properties of the fibers are fairly similar, it is assumed that all trends used for the input parameters for the flax composites are valid also for the hemp composites.
9
The strength predictions of the hemp composites based on these assumptions are presented in Figure 10(a). As can be observed, the accuracy of the modeling is not satisfactory, especially for high fiber contents. Contrary to the flax composite case, the modeling of the hemp composites overestimates the experimental results. It should be noted that the ISS values used in the prediction of the strength of the hemp composites are obtained from the fitted values of the flax composites (Figures 7(b) and 8). However, even though the bulk chemical composition of flax and hemp fibers is rather similar,
23
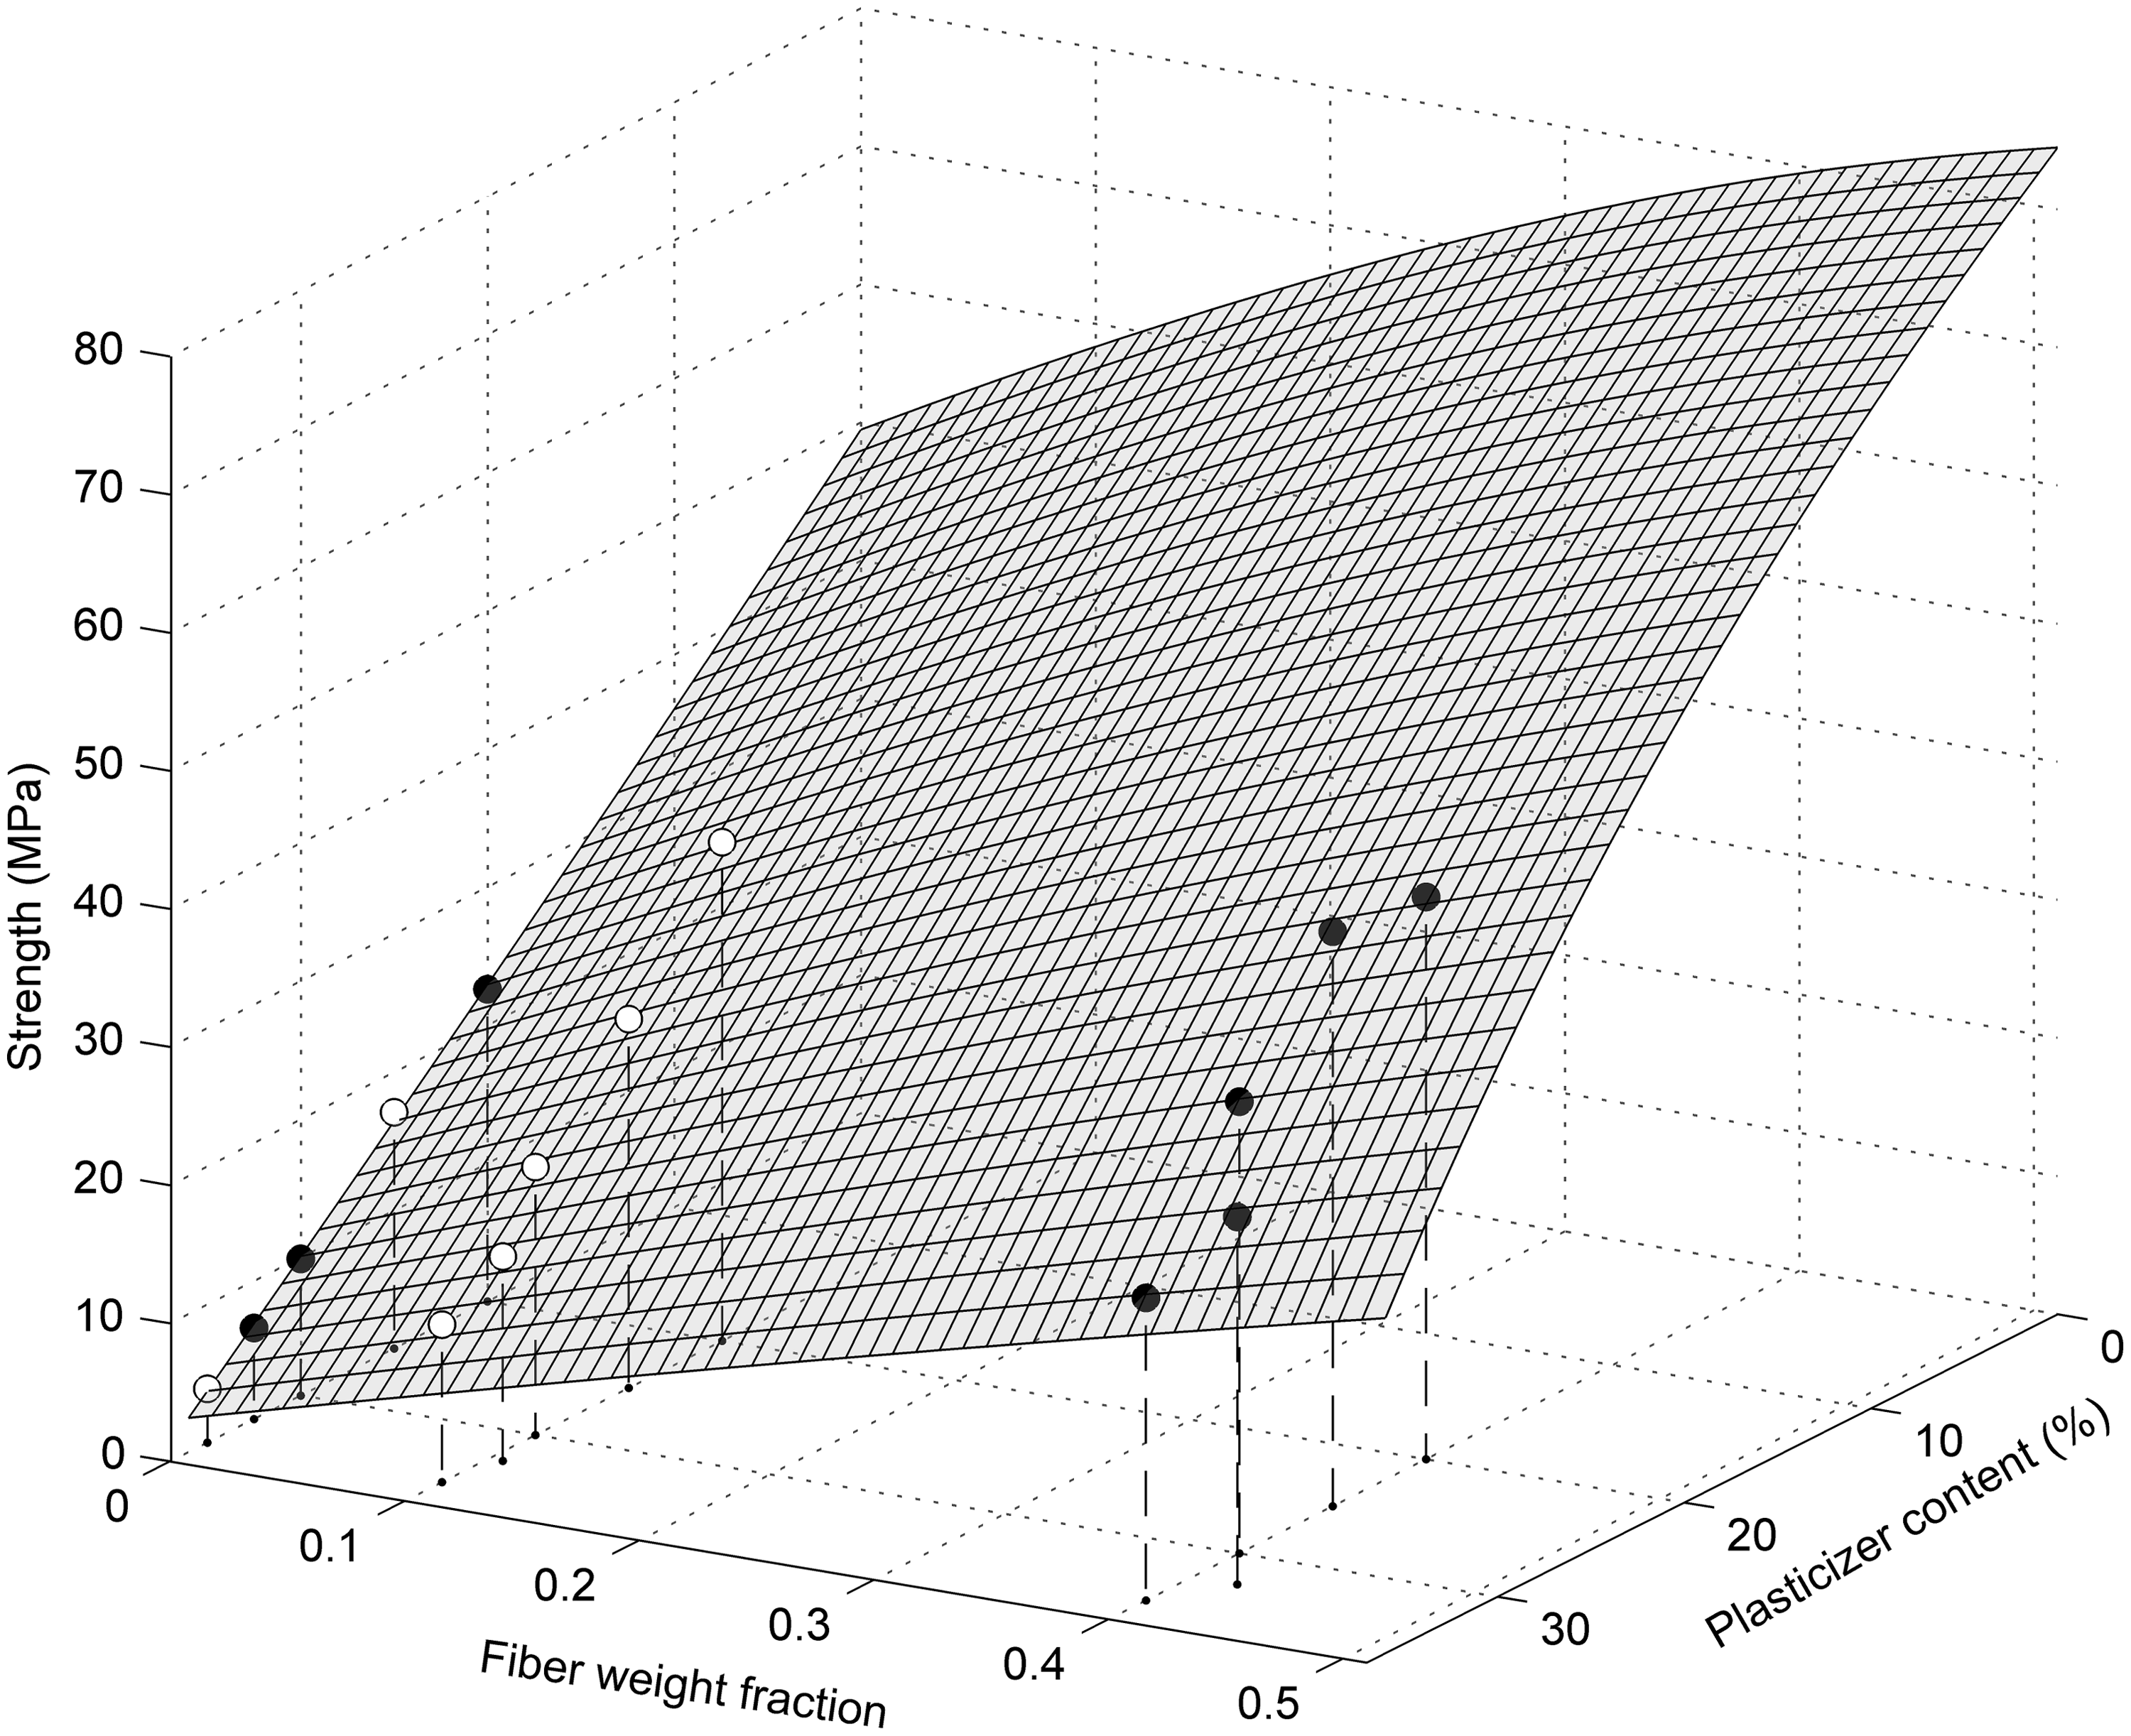
the surface chemistry of the two fibers can differ. There might be a difference in the wax content on the surface of the fibers, which will result in a different fiber/matrix compatibility, and this will influence the ISS for flax and hemp composites. Therefore, in the present study, in the case of the hemp composites, it was decided to obtain ISS values by a fitting approach similar to the one used for the flax composites. The results presented in Figure 10(b) show that the accuracy of the model predictions is significantly improved. Finally, general model predictions of the strength of hemp composites with any given composition were made. The result of this modeling is shown in Figure 11 as a surface plot for the strength of the composites as a function of plasticizer content and fiber weight fraction. The experimentally measured strength of the composites is also presented in Figure 11 as single data points (symbols).
Modeling results showing hemp composite strength dependence on fiber and plasticizer contents: (a) using ISS fitted from flax fiber composite and (b) finding ISS from the best fit for hemp fiber composite. Property diagram of strength of hemp fiber/PSA composites with variable fiber content and plasticizer content. Symbols represent experimental results (filled circles are above the surface and empty circles below the surface).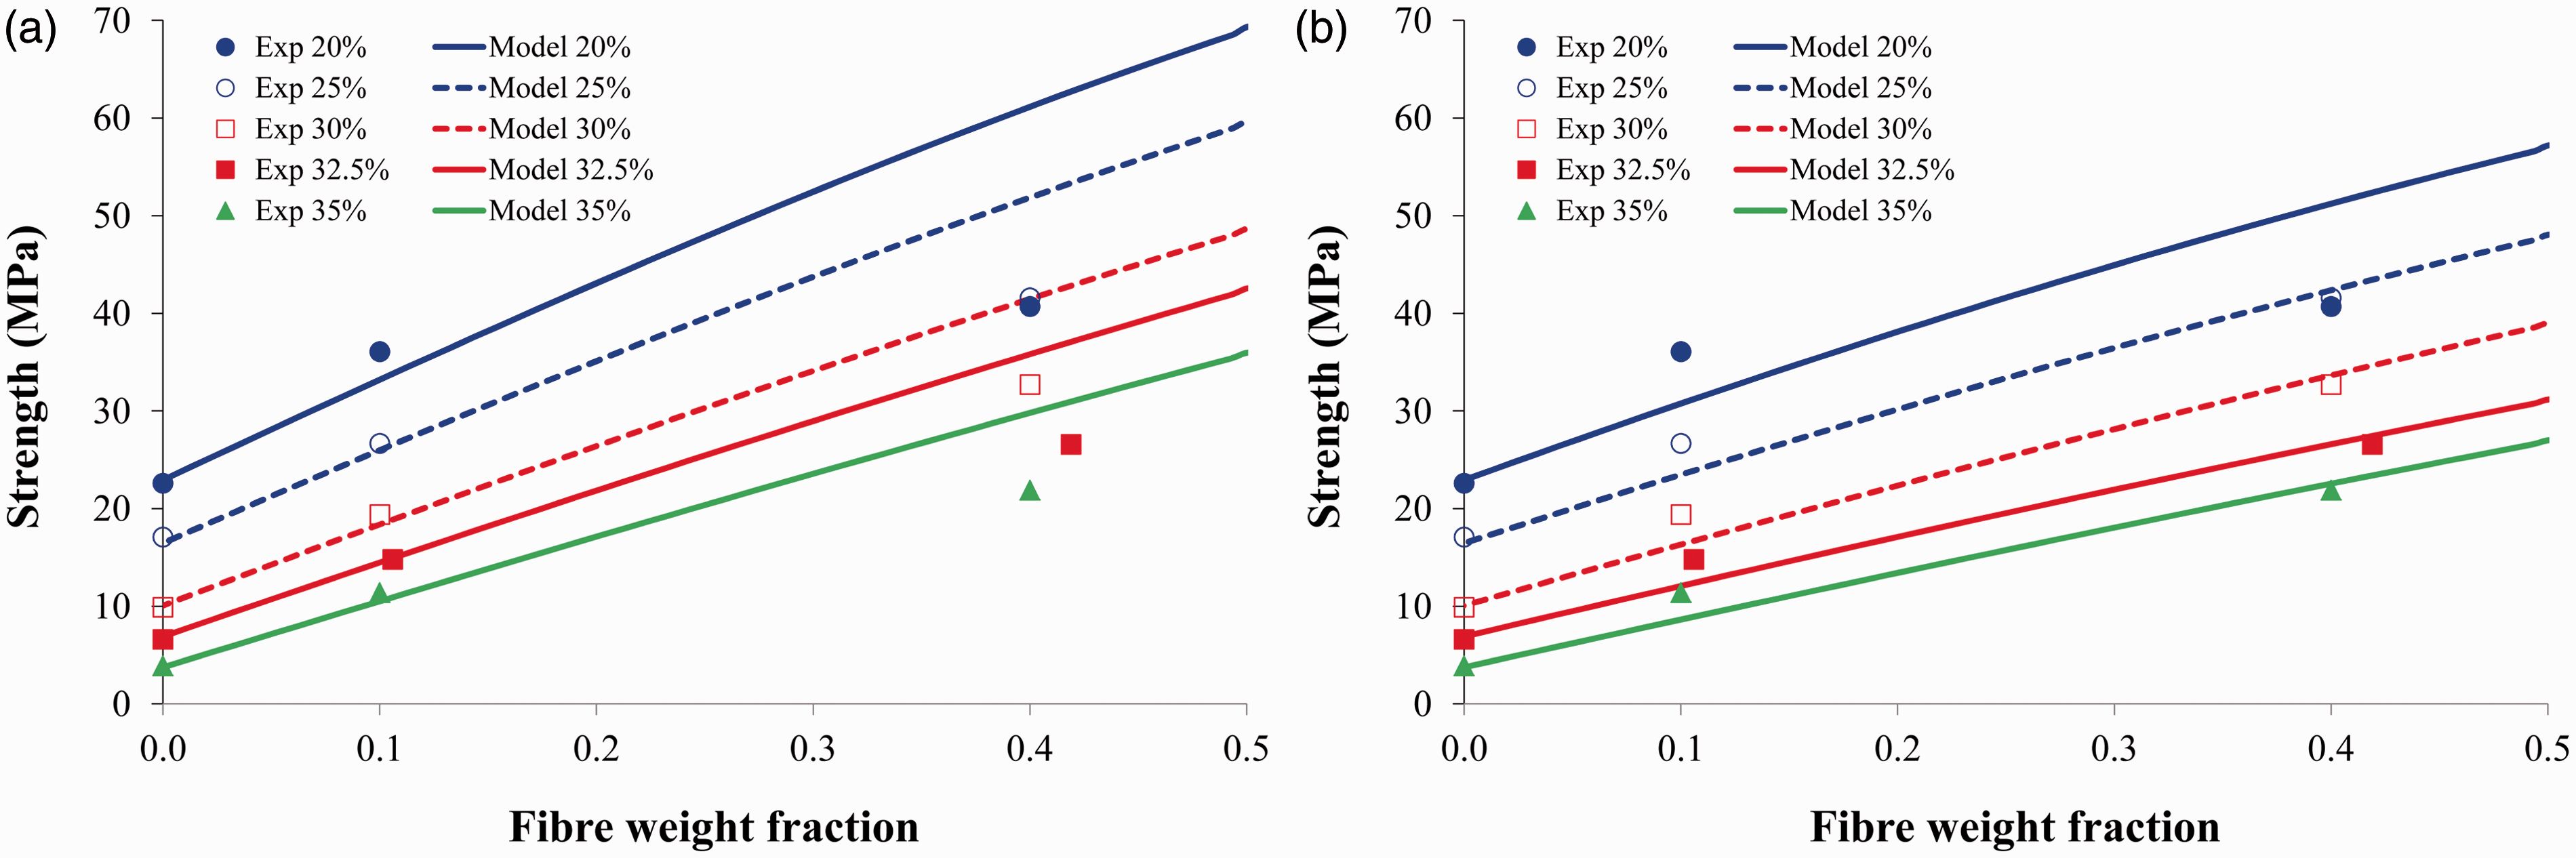
It should be noted that the measured strength of flax fibers is higher than that of hemp fibers (see Figures 3–5 and Table 3). Also, flax composites in general show higher strength than the hemp composites (see Tables 1 and 2). However, the predicted values of strength for hemp composites are higher than those for flax composites, especially at high fiber contents and low plasticizer contents (see Figures 9 and 11). It should also be mentioned that in the case of the flax composites, there is a predicted maximum of strength ∼65 MPa at around 35 wt.% of fibers for a low plasticizer content of 0–5 wt.% (see Figure 9), whereas for the hemp composites such maximum is not observed. The high predicted values of strength for hemp composites might be related to the fact that the measured fiber diameter for the hemp fibers is lower than that for the flax fibers (13 µm vs 18 µm), and the resulting fiber aspect ratio is therefore much higher for hemp fibers than for flax fibers (42 vs 8–28), see Table 3. The higher fiber aspect ratio leads to a more efficient stress transfer in the hemp composites than in the flax fiber composites (assuming that other parameters are the same), and therefore the performance of the reinforcement is utilized to much higher degree. Unfortunately, there is only one experimental measurement for the hemp fiber diameter, and the results are therefore not as reliable as for the flax fibers. There is also a possibility that the hemp fiber diameter is underestimated from the optical measurements (images made from the side of the fibres) because fibers are collapsed and the cross-section of hemp fiber is ellipse rather than circle. It has been reported 24 that the error of measurement of fiber cross-section area by assuming circular shape of filament can be very significant. It can be speculated that the flax fibers were not as damaged as the hemp fibers, and they retained cross-section very close to the circular shape. However, in order to verify this statement, more detailed and accurate investigation of composite morphology is required, for example by means of X-ray microtomography.
Conclusions
This study presents predictions of the tensile strength of injection-molded cellulosic fiber/PSA composites with variable fiber content and plasticizer content. A rule-of-mixtures type of model is employed. The values of the input model parameters are obtained experimentally from studies of the microstructure of the composites and properties of the constituents (fiber and matrix):
the measurements of the volumetric composition of composites were used to obtain exact fiber and plasticizer content; the dimensions of fibers in the composites were measured to obtain fiber lengths (in the range 0.2–0.5 mm) which were numerically correlated with both the fiber content and the plasticizer content; the diameter of reinforcement was also measured: 18 µm and 13 µm for flax and hemp fibers, respectively; the fiber orientation was evaluated to be high with fibers primarily oriented in the injection molding direction; the fiber orientation was assumed not to be affected by either the fiber content or the plasticizer content; some results from the previous study on stiffness of these composites were used
9
; the strength of the matrix was measured in the range 4–23 MPa being numerically correlated with the plasticizer content; the strength distribution of fibers was measured from single fiber tensile tests of 3 and 20 mm long fibers; Weibull strength distribution parameters were obtained and average strength was calculated for the average length in each composite; flax fiber strength is higher than that of hemp.
The ISS values of the flax fiber composites were not known and the shear strength of the matrix was used instead. This, however, produced results with poor accuracy. Therefore, ISS was fitted for these materials based on the best fit to the experimental values. In the case of hemp fiber composites, availability of experimental results was limited and it was assumed that all trends observed for input parameters for flax fiber composites are valid also for hemp fibers.
The measured strength of composites varies in the range 12–51 MPa, and this was fairly well predicted by the model. Based on these calculations, strength surface plots were constructed for both hemp and flax composites. These property diagrams can be used for the tailor-making of starch acetate/cellulosic fiber composites with values of strength in the range from about 3 to 80 MPa.
It should be noted that the model slightly overestimates the strength for hemp composites, possibly due to limited information about the geometrical parameters of fibers (e.g. diameter). More detailed and accurate investigation of composite morphology (e.g. by X-ray microtomography) has to be carried out in the future.
Footnotes
Funding
This study has been partly supported by the EU Sixth Framework Programme project. “New classes of engineering composite materials are from renewable resources,” BIOCOMP; contract grant number: IP 515769-2.
Conflict of interest
None declared.