
Abstract
This study investigates the mechanical behavior and the failure of a composite T-joint with a teardrop-shaped cutout under shear loading numerically and experimentally. By establishing a composite finite element model with continuous shell elements and cohesive interface elements, using the progressive damage algorithms, the shear behavior and the failure mechanisms of the composite T-joint are investigated. The change of the load–displacement curve of the T-joint is correlated with the damage development of the T-joint with the cutout, and the typical damage modes are identified. To validate the numerical results, the samples of composite T-joints were manufactured and the experiments were conducted using a universal testing machine. The curve of the load versus deformation and the failure modes are in good agreement with the numerical prediction. In order to further enhance the load-carrying capacity of the composite T-joints with the teardrop-shaped cutout, three reinforcing schemes are proposed and their efficiencies are compared.
Introduction
Due to high specific stiffness and strength, composite materials have been widely used in modern aircraft structures. Composite T-joint is a typical integration structure, meanwhile it can effectively transfer load. In addition, its extensive use can significantly reduce the number of fasteners and bolts and effectively reduce the weight of the structure and the assembly cost. However, for some applications, it has to be cut on the web due to structure assembly or special requirements. These cutouts may reduce the strength of the structures. Besides, T-joint has weakness in the interface between the filler and the web. Therefore, the performance and failure behavior of T-joints with a cutout under loading are the main concern for structure designer. It is necessary and desirable to investigate the behavior of the composite T-joint under loading.
Many efforts have been made to study the behavior and failure mechanisms of composite T-joints. Trask et al. 1 studied the influence of processing induced defects within the deltoid area of T-joint on the load at failure under pull-off loading. Blake et al. 2 investigated the influence of a viscoelastic insert to the static structural response of a new type of composite T-joint. Zhao et al. 3 used a new modified maximum stress failure criterion and a degradation model to investigate the failure behavior of a π-joint numerically and experimentally. Also, the cohesive elements were successfully used to predict the failure behavior of a woven composite joint. 4 Kesavan et al. 5 investigated the effects of internal defects with different sizes at various locations on the delamination and the mechanical behavior of a glass fiber reinforced plastic T-joint by numerical approach. Stickler and Ramulu 6 investigated the mechanical behavior and failure mechanisms of a type of composite T-joint with transverse stitching under tensile and shear load, but the specimen they used did not have fillet radius which neglected the weakness at the circular arc transitional region. Li et al. 7 investigated the fracture behavior of a glass fiber reinforced polymer T-joint using virtual crack closure technique. Although this technique can be used to predict the ultimate strength and the crack propagation in composites, the crack propagation path must be assumed in advance, and the technique is only applicable in two-dimensional numerical models with one or two cracks. Cohesive zone model provides an alternative solution to overcome these limitations. Cui et al. 8 used cohesive zone model to successfully predict the joint failure behavior under pull-off load.
Due to the inherent weakness of T-joints, some research has been conducted. Using z-pins is one of the approaches in enhancing the mechanical performance of the T-joint.9–11 Their results demonstrated that z-pinning is an effective method in improving the structural properties and damage tolerance under pull-off load. Guo 12 compared the effect of reinforcements around cutouts on the stress concentration and bucking behavior of a carbon/epoxy composite panel under in-plane shear load numerically and experimentally. These researches have been done for T-joint without cutout or composite flat panel with cutout, and the performance and damage analysis of T-joint with cutouts are seldom studied.
This study investigates the mechanical behavior and failure of composite T-joints with a teardrop-shaped cutout under shear load. Taking the delamination and matrix failure into account, the simulation successfully predicts the mechanical behavior and the damage characteristics by using Hashin’s failure criterion for intralaminates and cohesive zone model for interlaminates. Afterwards, the numerical prediction is compared with the experimental results, showing a good agreement in the curve of load versus deformation and the failure modes. Due to the existence of the cutout, the load capacity of T-joint may greatly be decreased. In order to improve the performance of the composite T-joint with a cutout, three reinforcing schemes are proposed, demonstrating their effectiveness in improving the load-carrying capacity of the T-joint.
Numerical model
Criteria of in-plane damage and failure
Criteria for damage initiation
The criteria used here are based on the ABAQUS document. 13 In-plane failure analysis for composites is based on Hashin’s failure criterion. It contains four kinds of damages for a unidirectional laminate, i.e. 13
For fiber’s tension failure
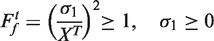
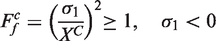
For fiber’s compression failure
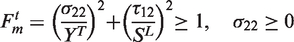
For matrix’s tension failure
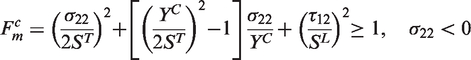
For matrix’s compression failure
Criterion for damage evolution
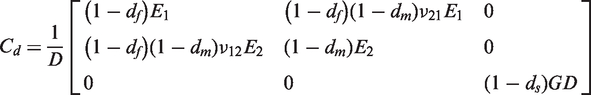
Once damage occurred within the composite structure, it will develop under loading. In establishing the numerical model, material properties should be updated in each increment. If the relationship between the equivalent stress σ and the strain ɛ is linear, i.e.

Delamination and failure criteria
In cohesive zone model, the potential crack propagation path or the bi-material interface has to be idealized as a cohesive zone represented by a nominal traction field. The property of cohesive interface is described through a bilinear constitutive law, as shown in Figure 1, where K0 is material stiffness without damage and (1–D)K0 is the stiffness after damage. Constitutive law of the cohesive element.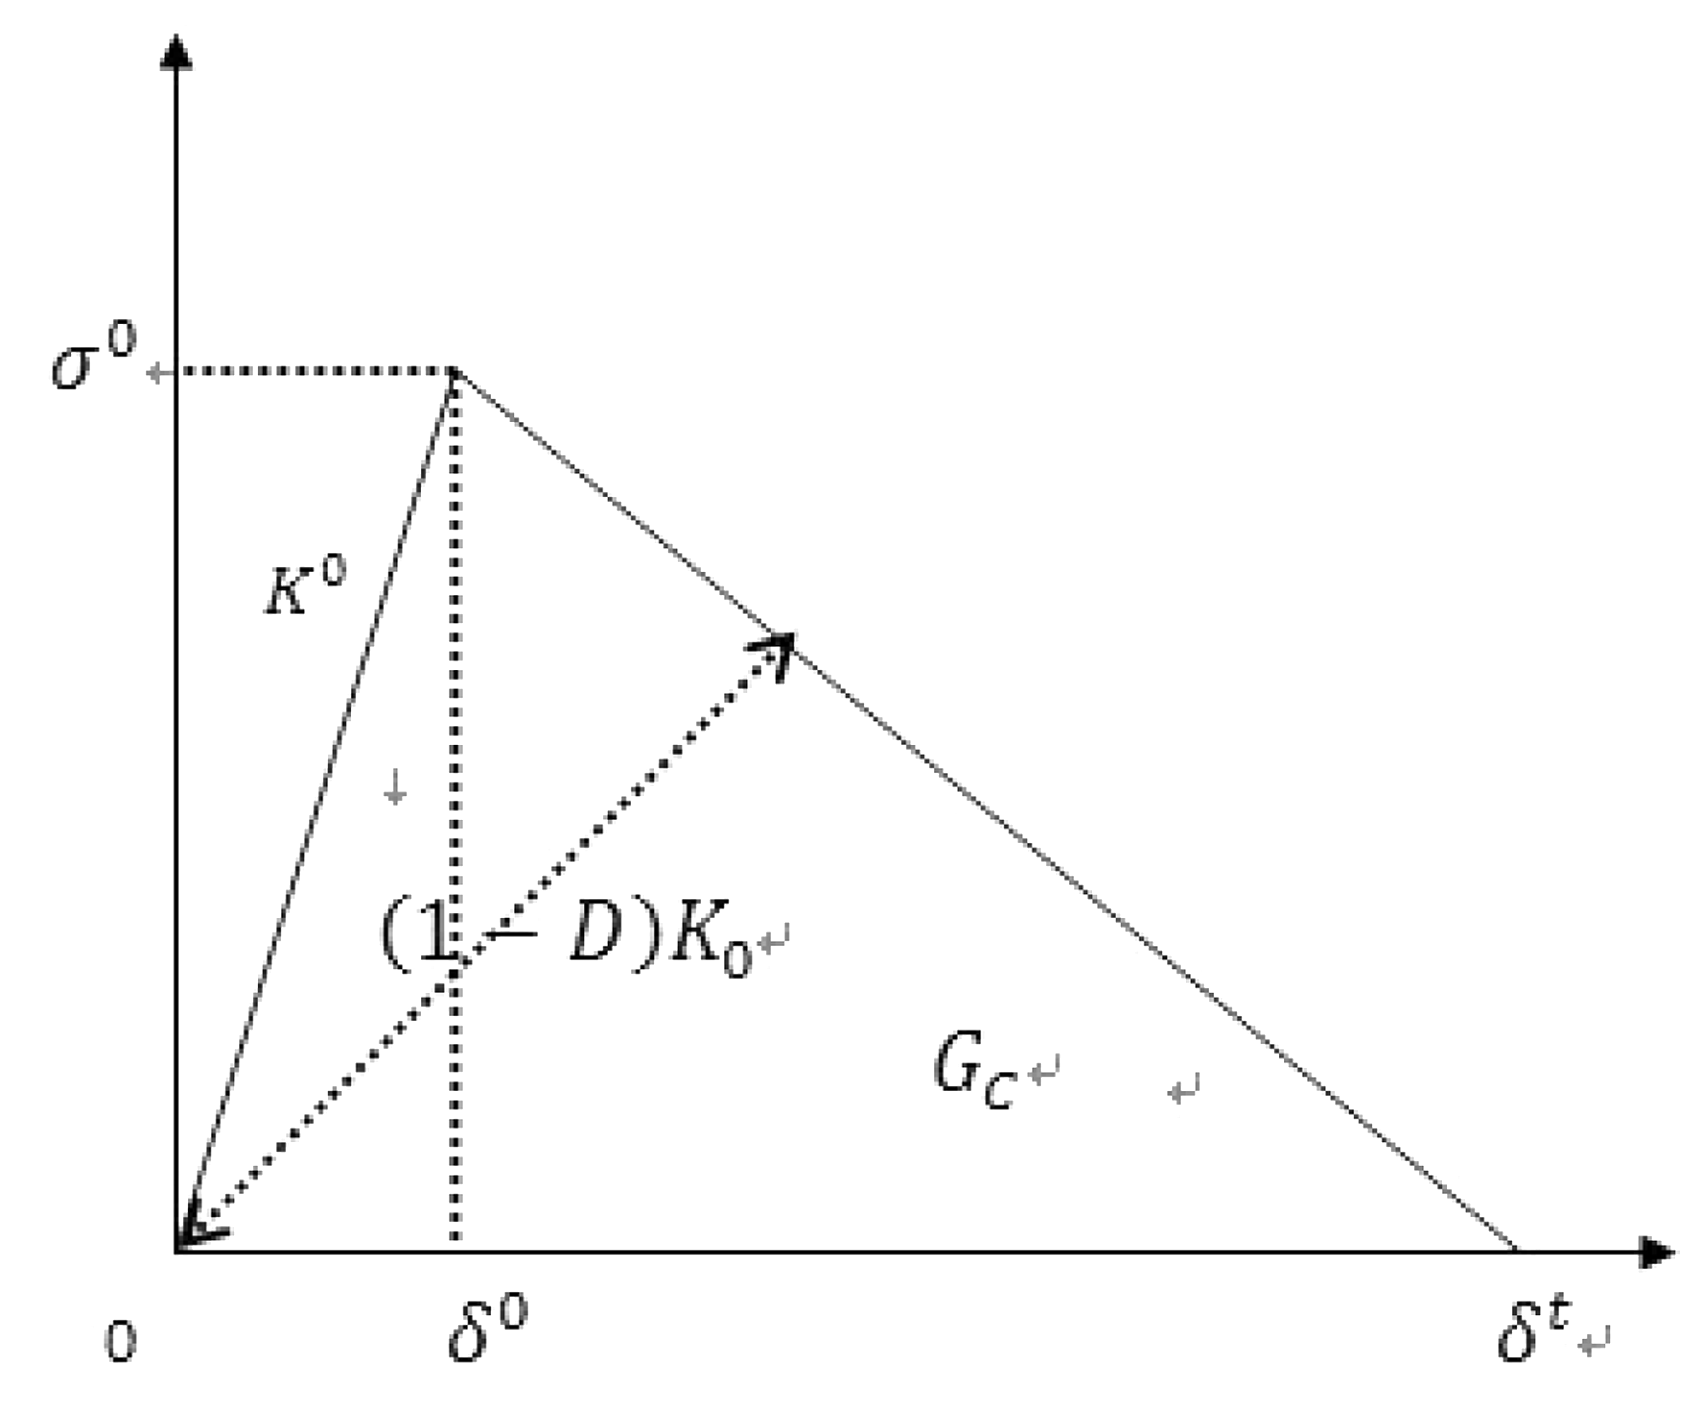
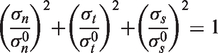
The quadratic stress-based criterion (equation (7)) is used to assess the delamination initiation, i.e.
13
Numerical model
The finite element model is established using commercialized software ABAQUS to analyze the structural property and failure of the composite T-joint subjected to a pair of shear loads acting along the bottom of the web (as shown in Figure 2(a)). The web consists of two laminates, and each stacking sequence is [45/0/−45/90]2s. The stacking sequence of the skin is [45/0/−45/90]10s. The radius of the filler region is 5 mm, and the edge of the cutout is 20 mm. The teardrop-shaped cutout is located at a height of 15 mm.
Schematic of composite T-joint: (a) schematic drawing of shear loading, (b) dimension of the composite T-joint.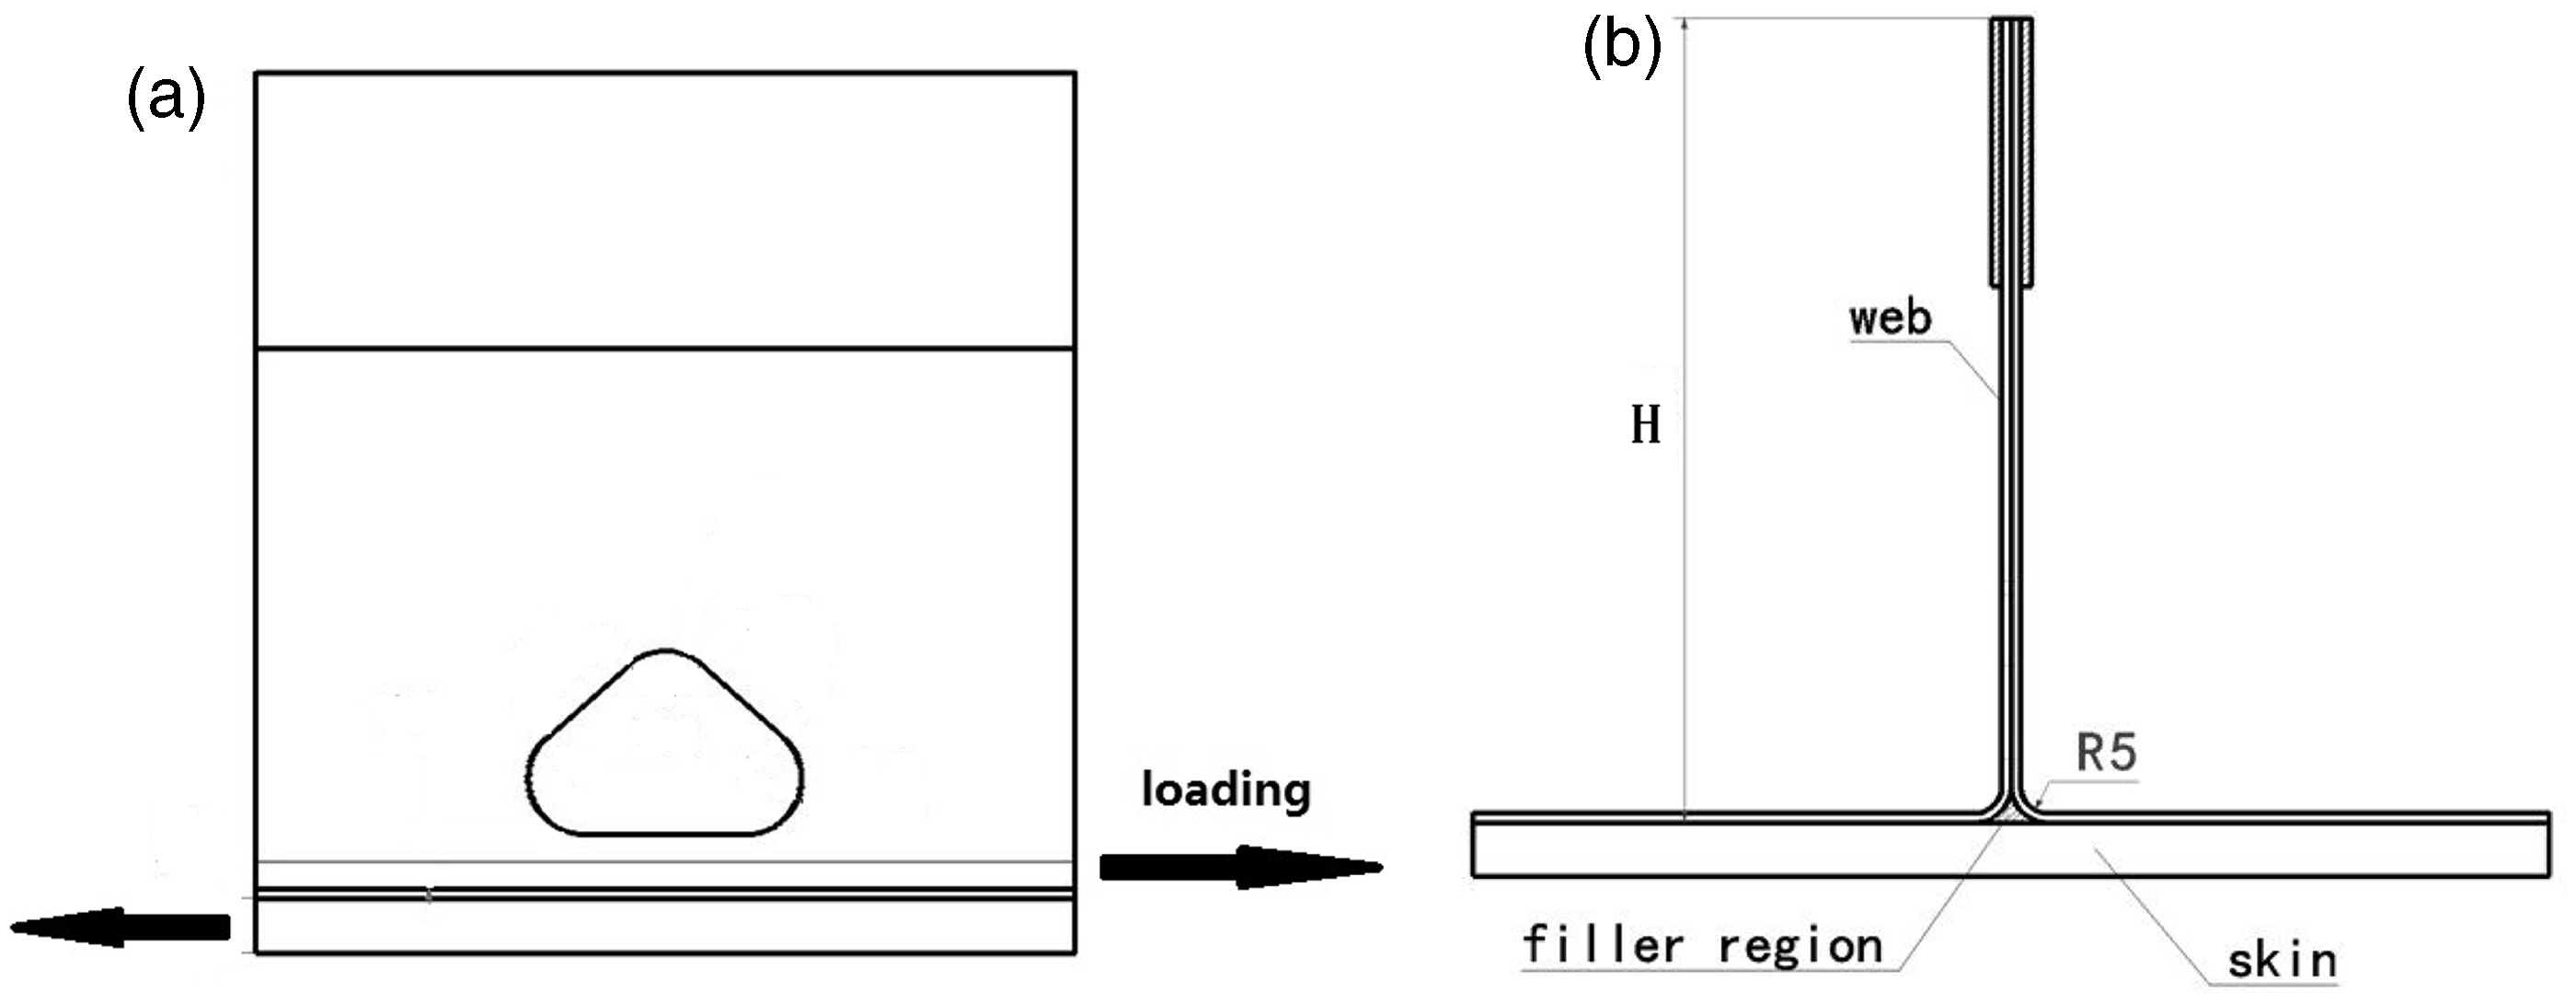
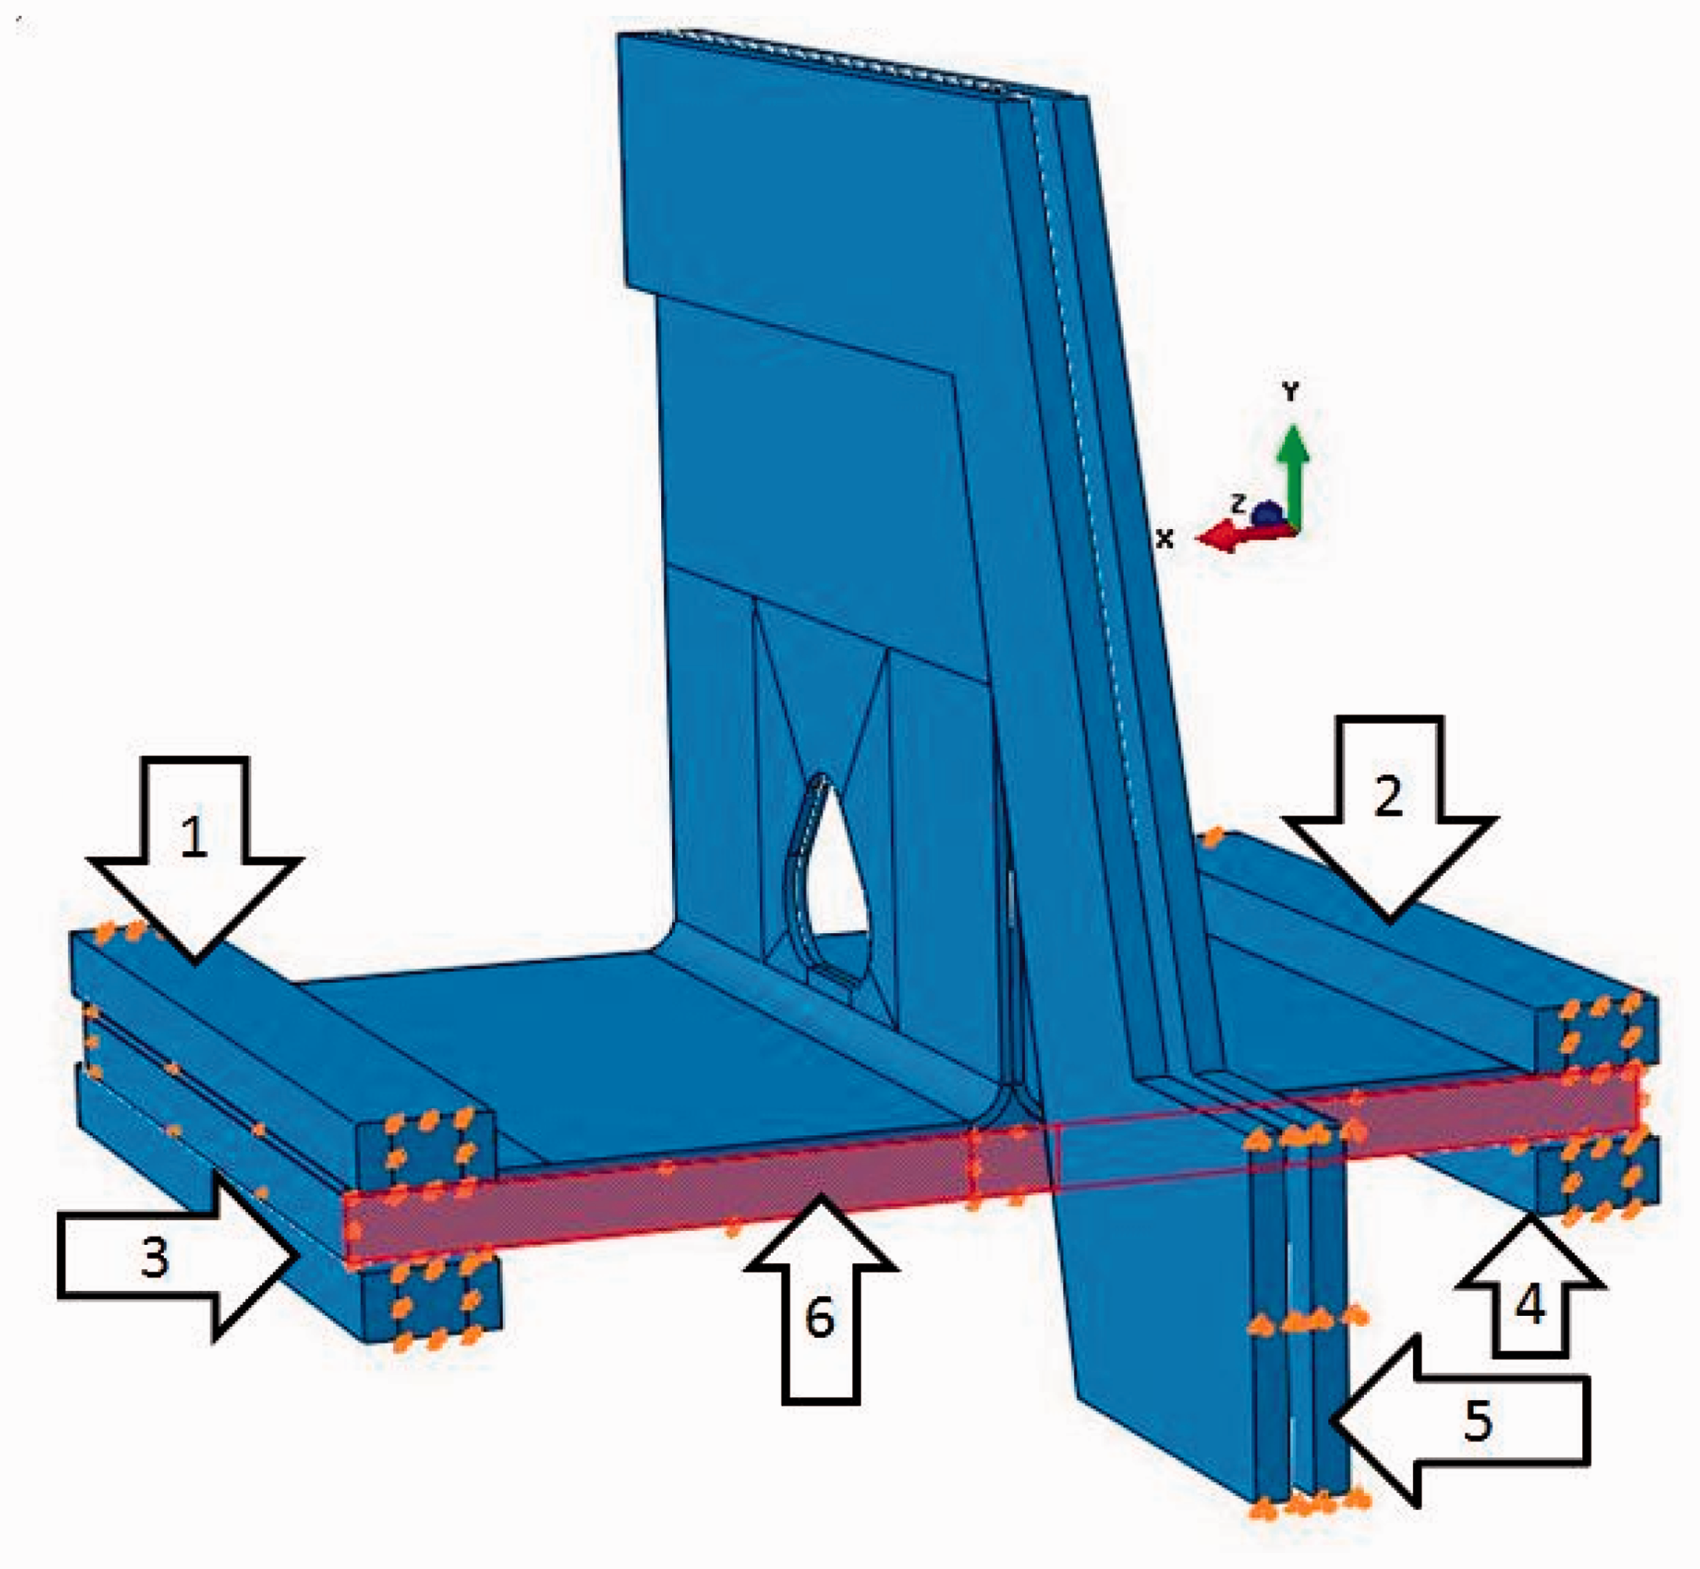
Eight-node continuum shell elements (SC8R) are used in meshing the web and the skin, and 3D solid elements (C3D8R) for the filler region and eight-node cohesive elements for the bond line. Around the circular arc transitional region there is a denser mesh and in the other region sparser mesh to enhance the efficiency of calculation. Cohesive elements are between the laminas in order to simulate the possible delamination of the composite T-joint. The mesh density on the cohesive zone should be determined by the size of the damaged zone, and the number of the cohesive elements in the damaged zone is recommended to be more than 3–5. 14 In this study, the size of cohesive elements in the circular arc transitional region is about 0.25 mm. The ABAQUS/Standard is used to simulate the damage behavior of the T-joint under static shear loading.
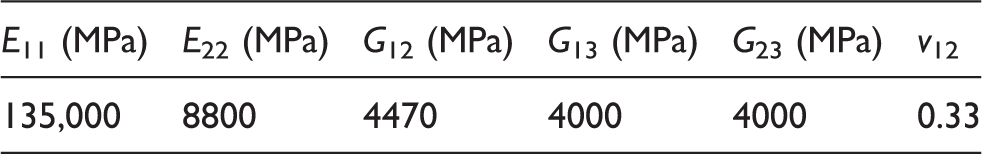
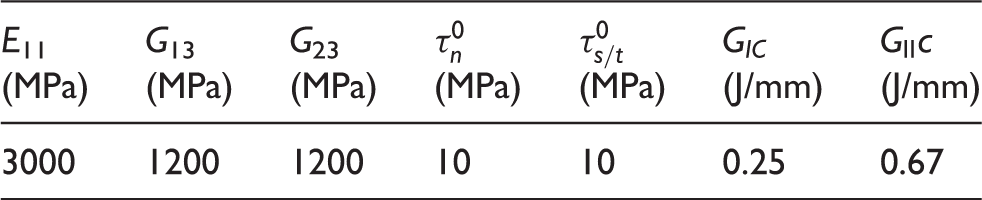
The materials used in this study are T700/QY8911, and their properties are given in Tables 1 and 2. In this paper the value of Finite element model of the T-joint with a teardrop-shaped cutout and corresponding boundary condition. Mechanical properties of T700/QY8911. Material properties of the adhesive QY8911.
15
Simulation results
The load–displacement curve of the T-joint under shear load is given in Figure 4. It can be seen that the load increases linearly at the beginning and then the slope of the load–displacement curve decreases because the crack occurs. In the loading process, five stages can be identified as follows:
Load–displacement curve of the T-joint under shear load.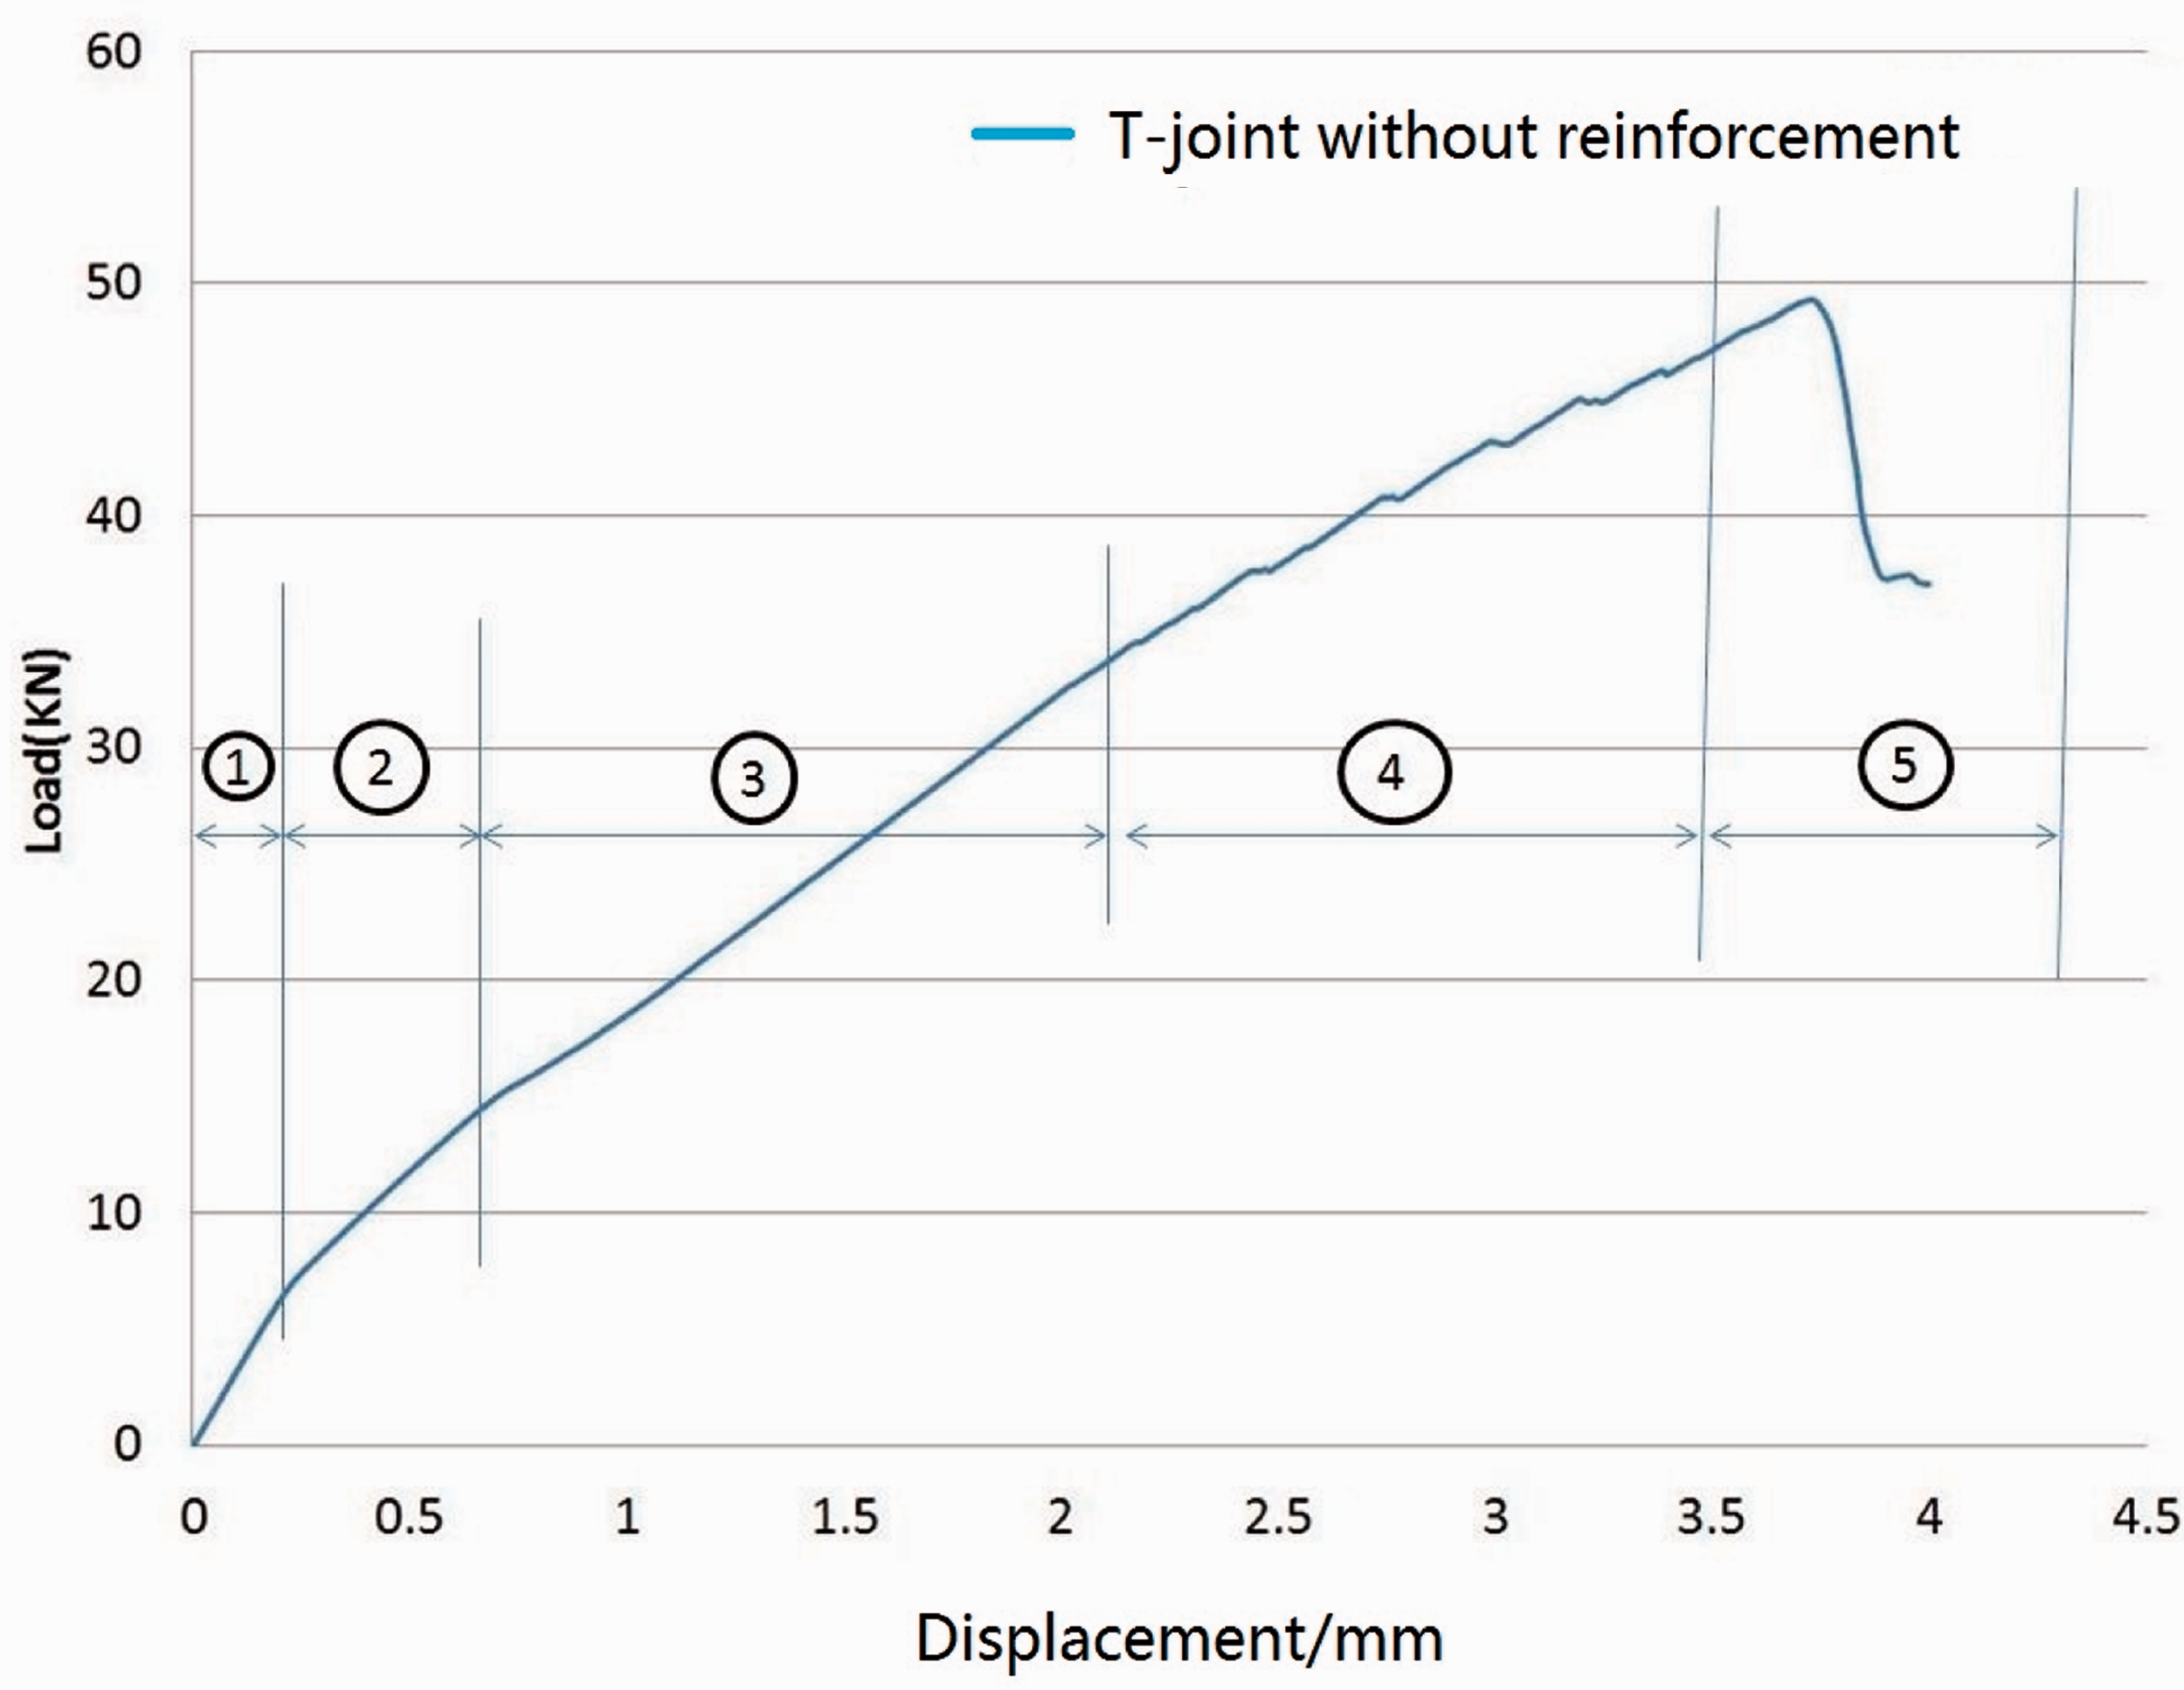
Stage 1: It is before damage occurs. In this stage, the material is in elastic stage (as shown in Figure 5) and the load increases linearly with increasing displacement.
Stress distribution of the T-joint at stage 1.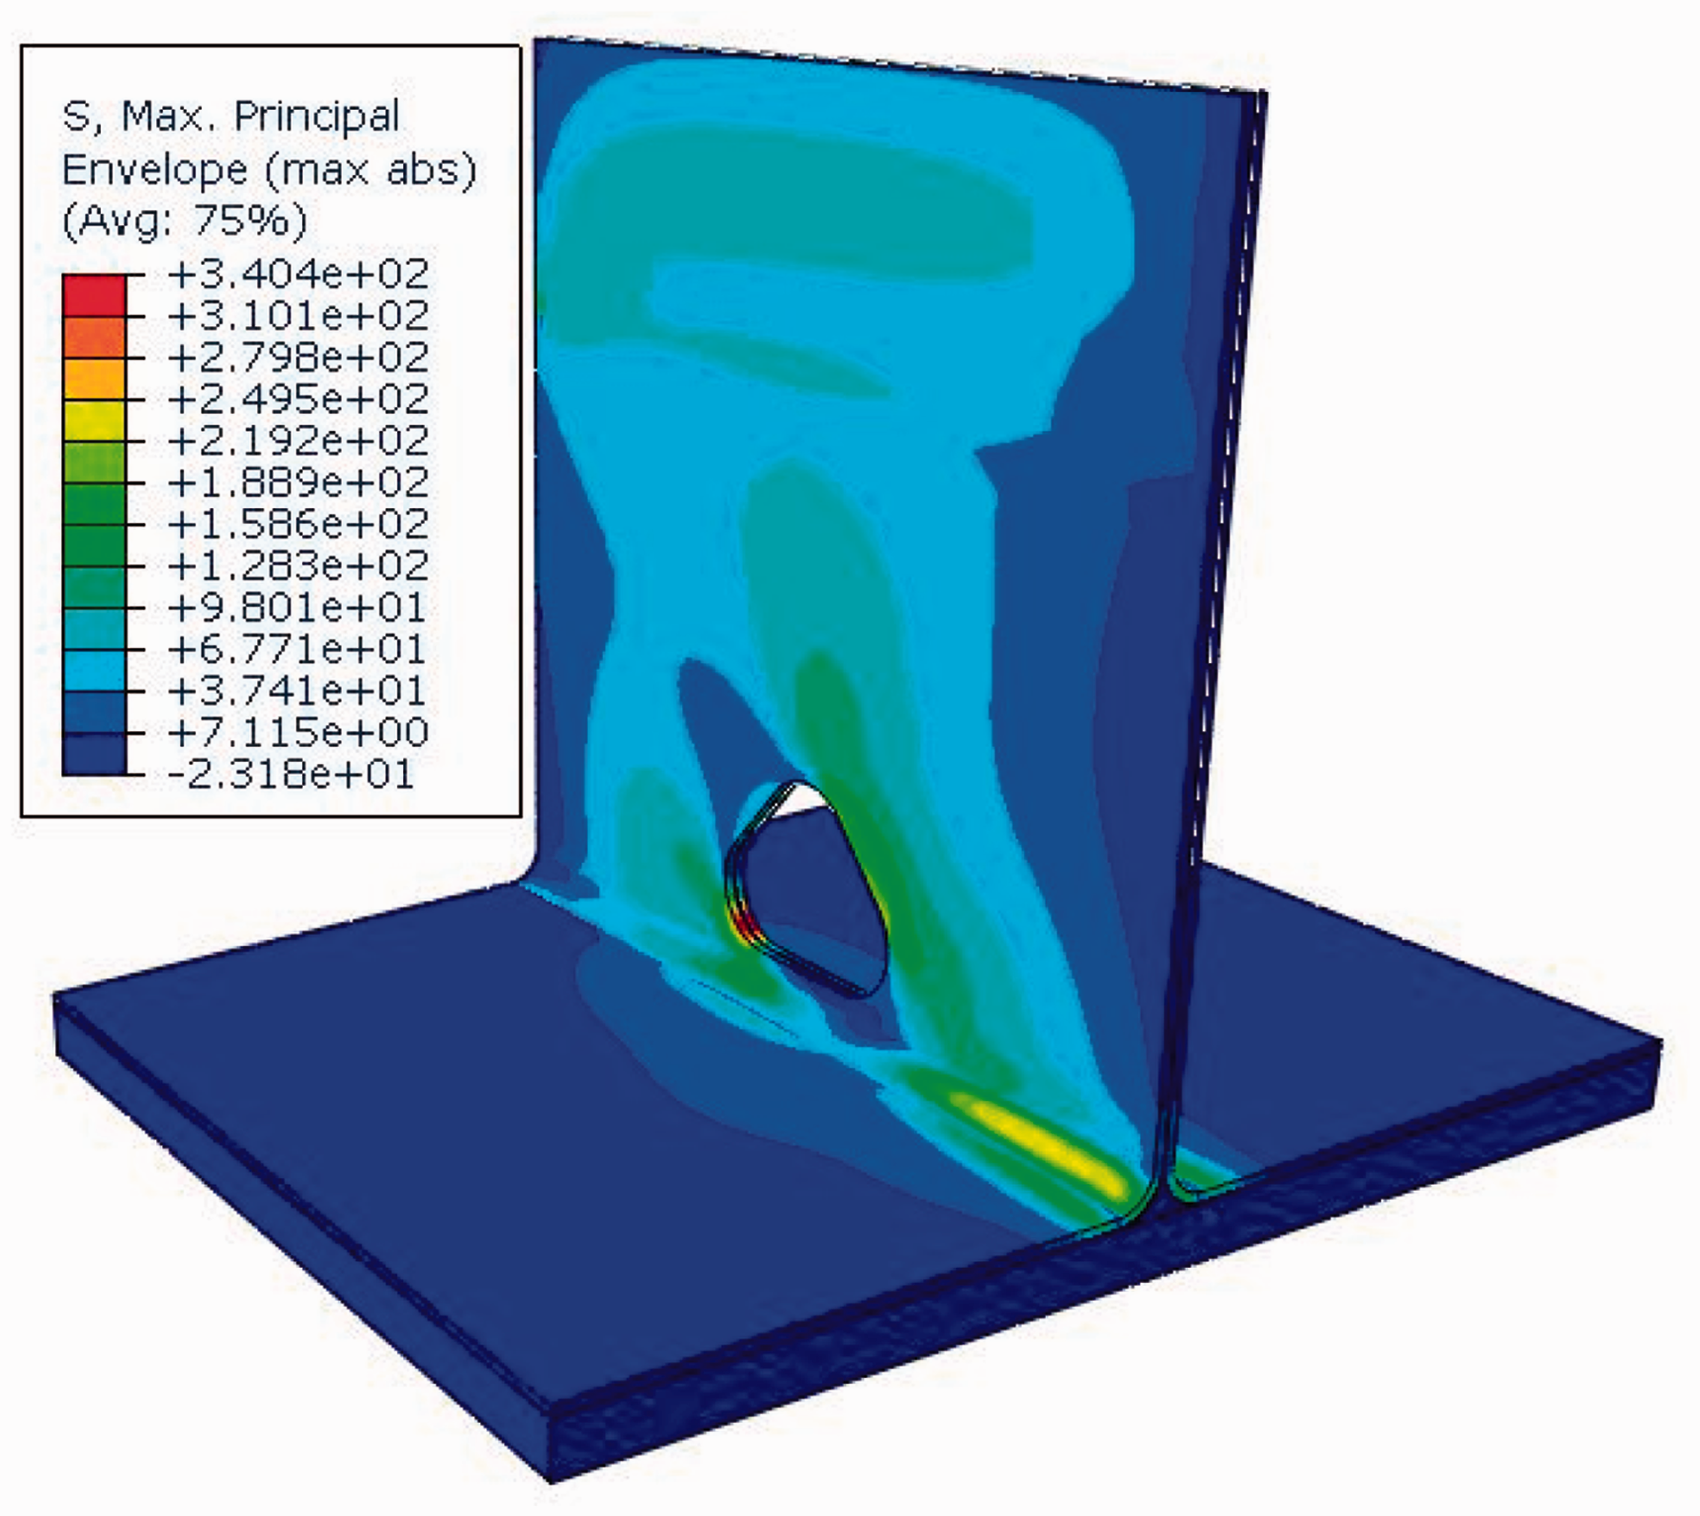
Stage 2: In this stage, the crack occurs at the circular arc transitional region of T-joint (as shown in Figure 6) and then extends upwards and sidewards to the skin and the web, respectively. Because of the damage occurring in this stage, the stiffness of the T-joint decreases.
Damage around the arc transitional region.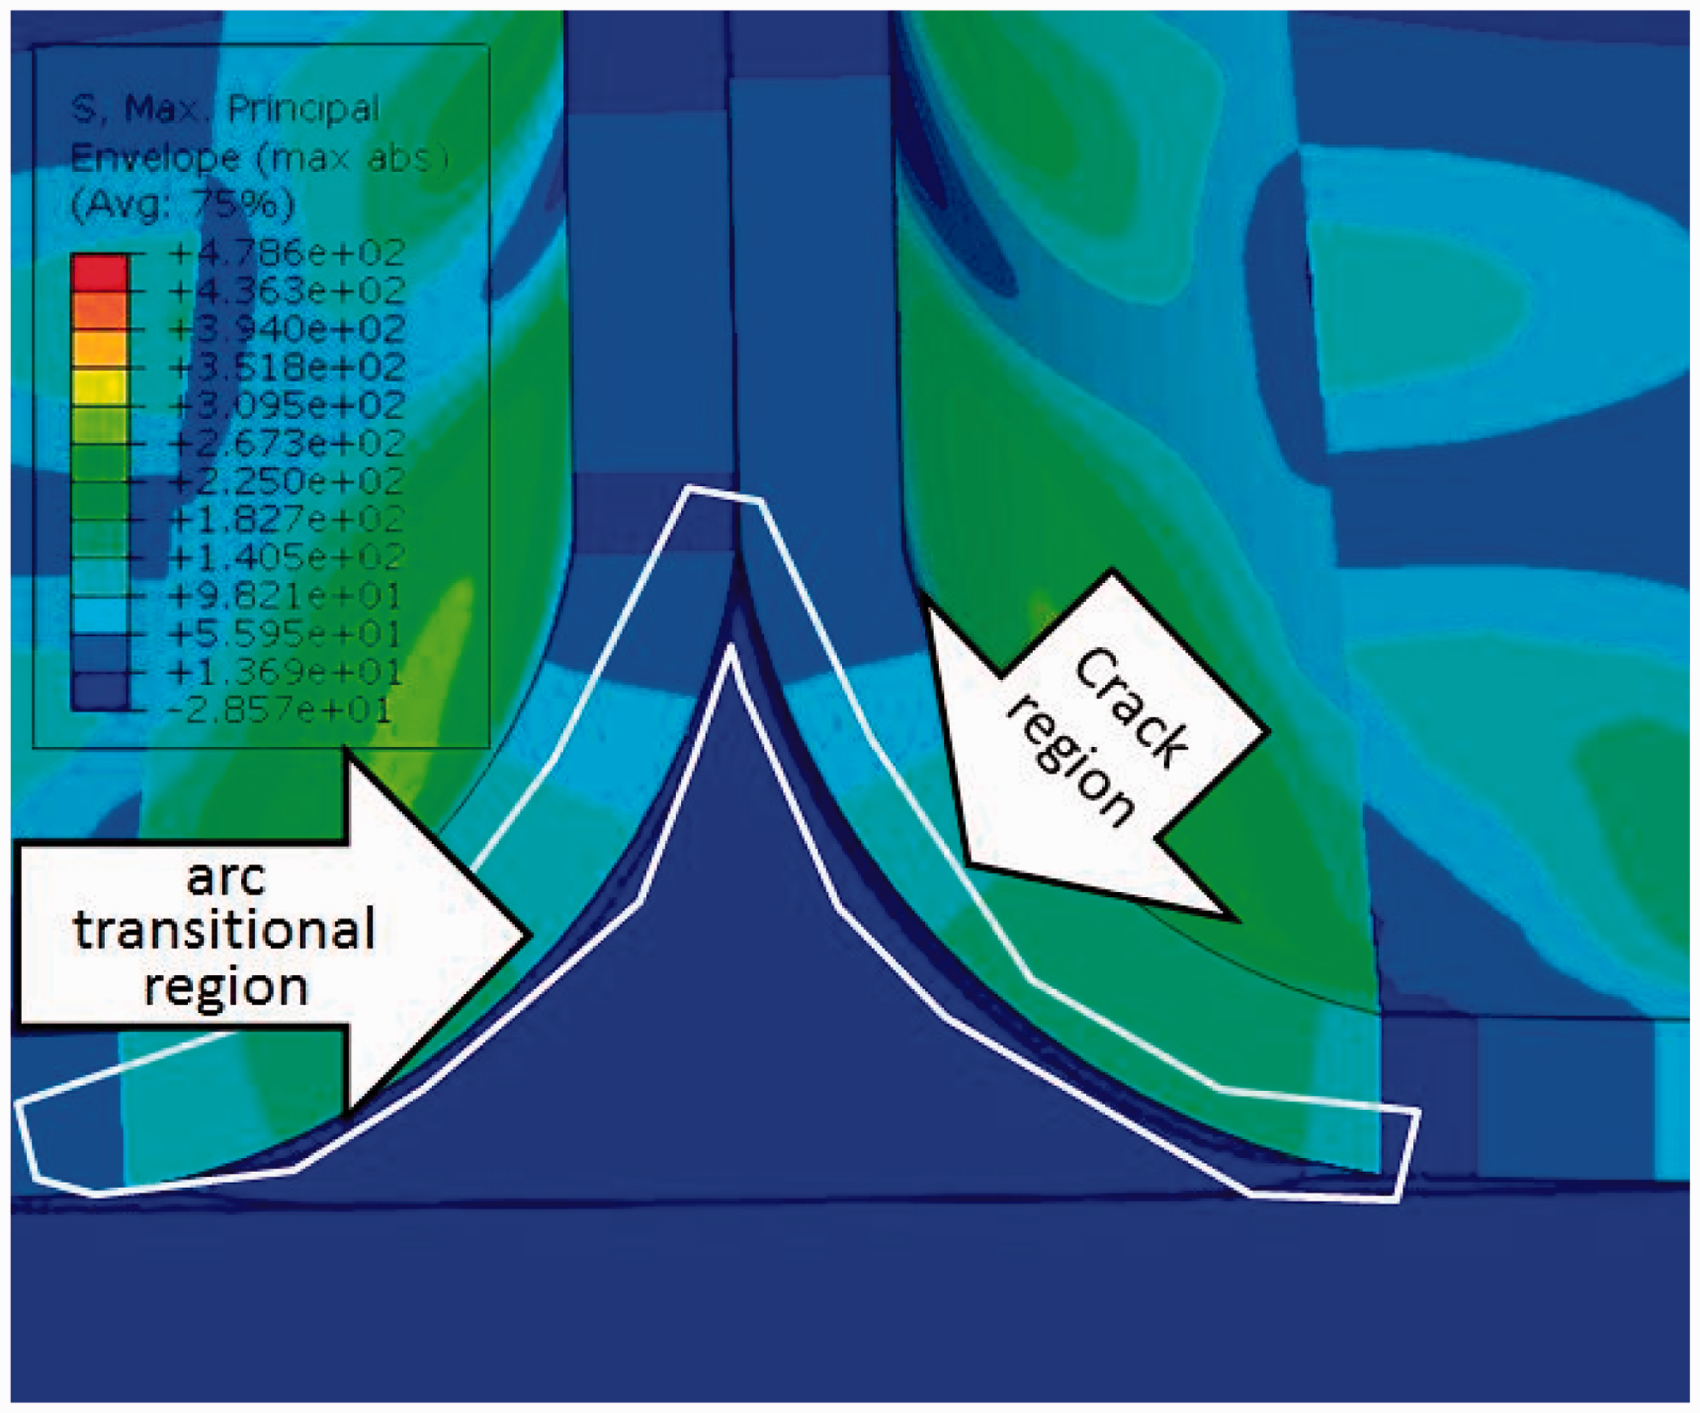
Stage 3: In this stage, the crack in the circular arc transitional region has already extended to the bottom of the cutout on the web and then bottom of the cutout starts to split as shown in Figure 7. When the crack extends to the entire bottom of the cutout, the stiffness of the T-joint further decreases and stage 4 starts.
Crack occurring at the bottom of the cutout.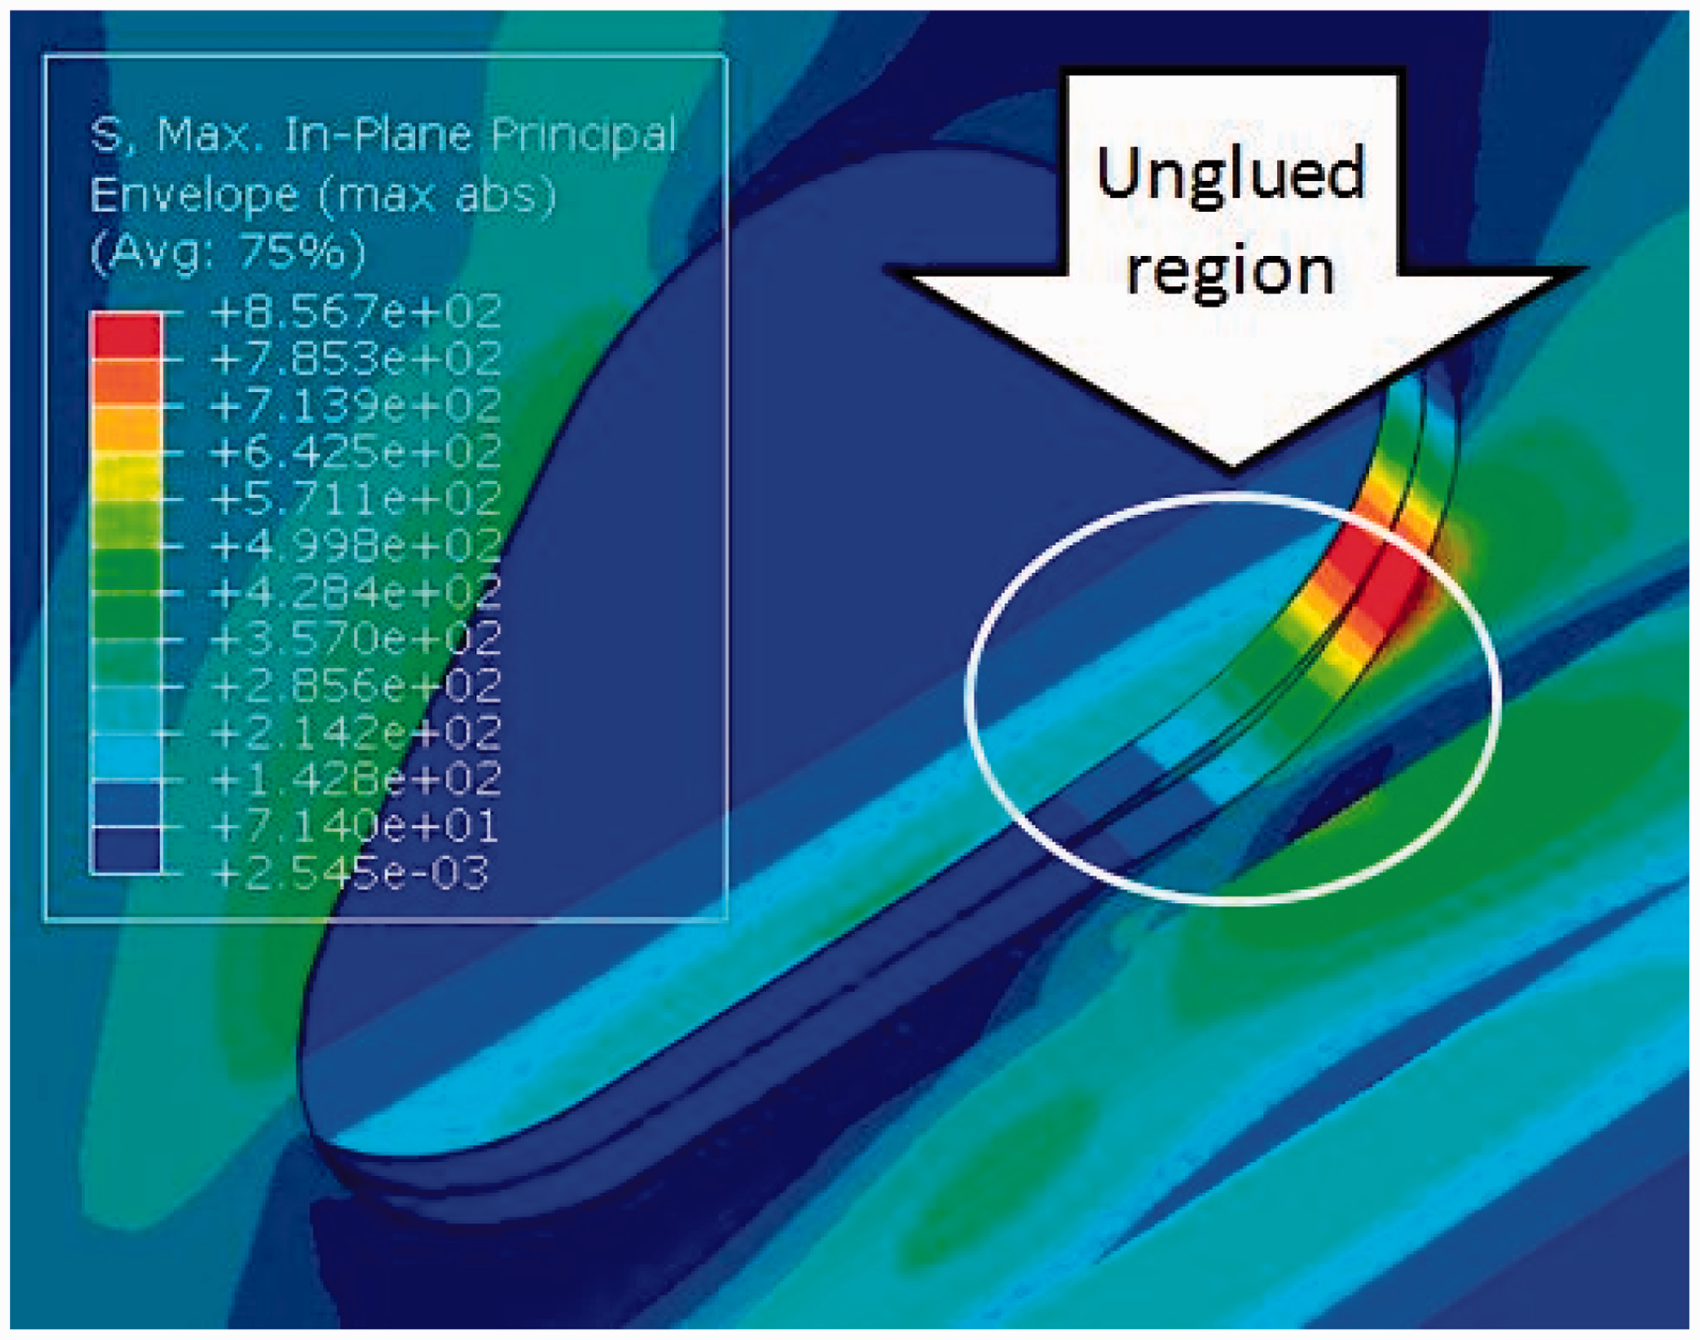
Stage 4: In this stage, additional damages along the direction of 45° appear on the web around the cutout as shown in Figure 8. The damages are mainly caused by the matrix and fiber extrusion. Correspondingly, some small fluctuations appear on the load–displacement curve.
Damages along the direction of 45°on the web.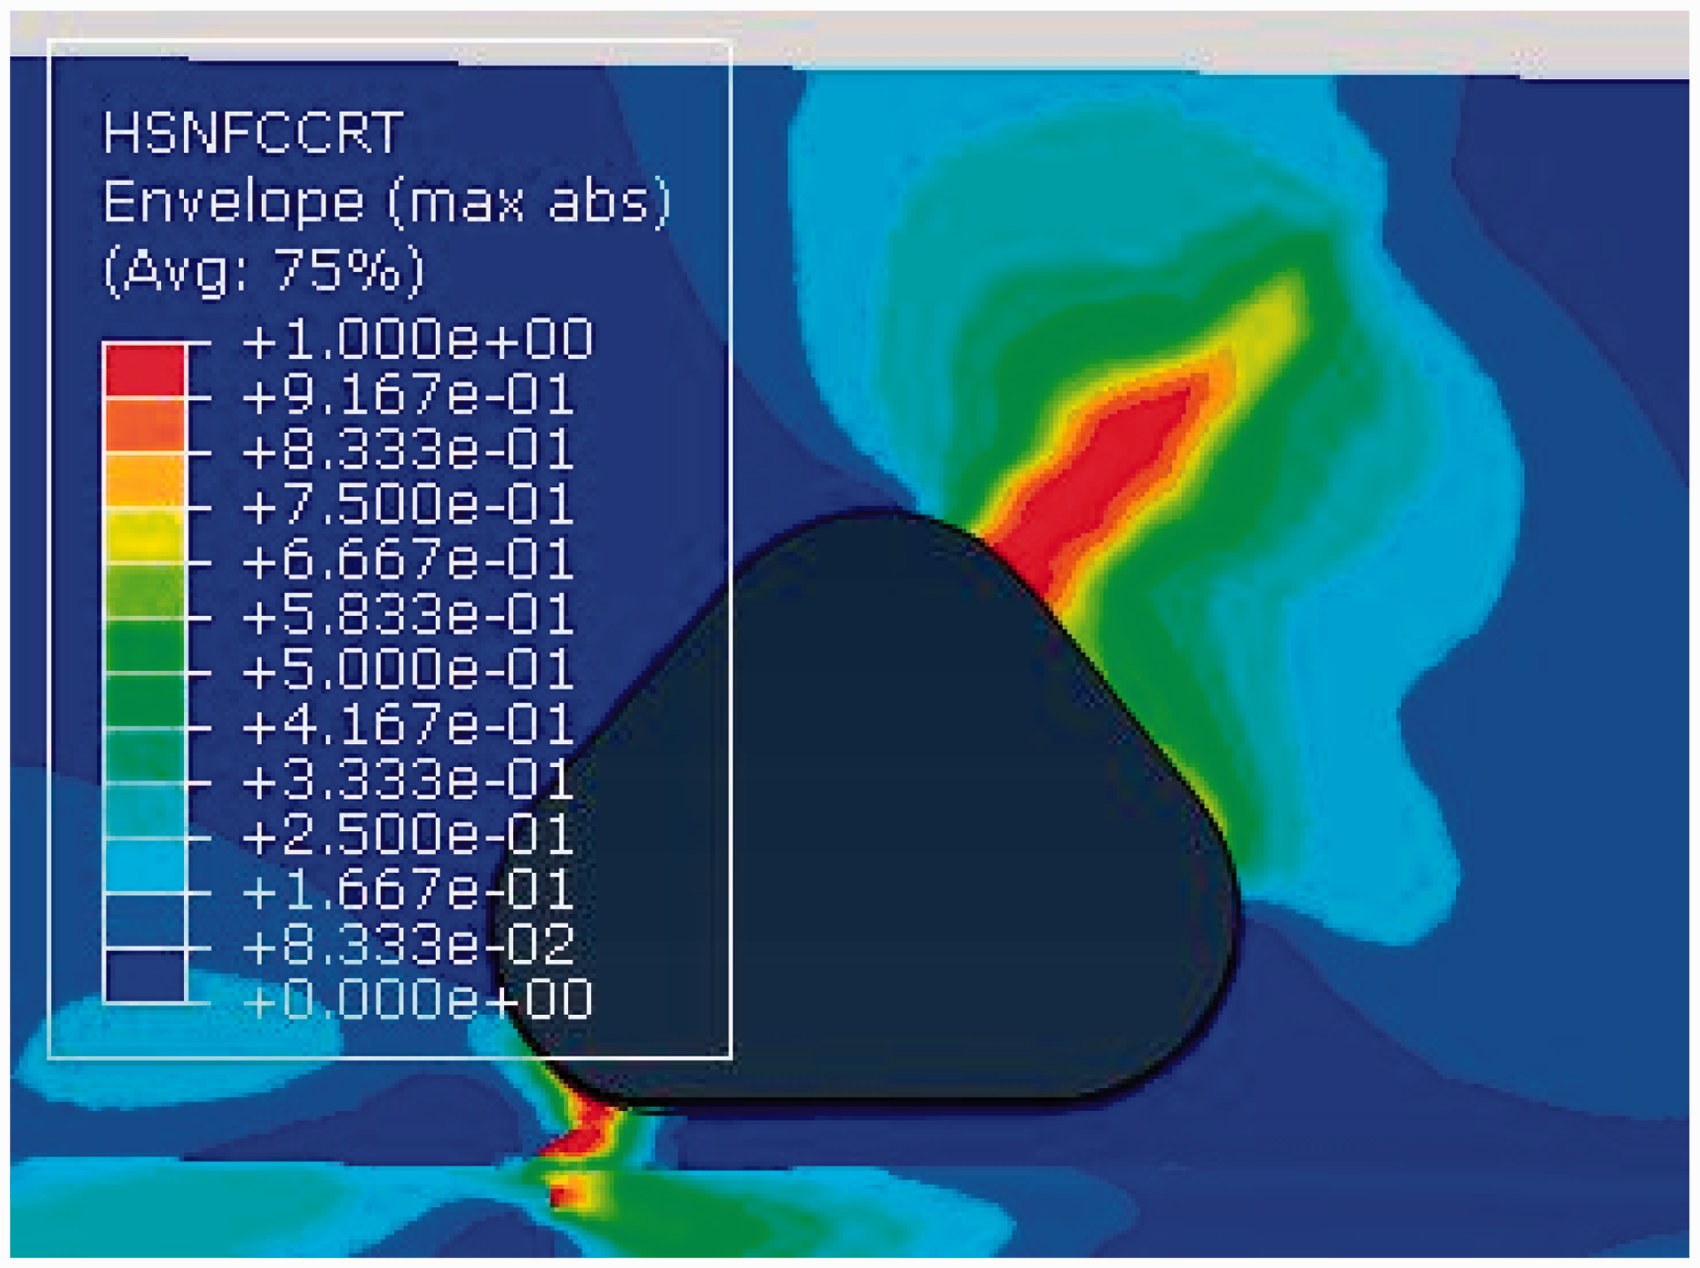
Stage 5: In this stage, the crack on the bottom of the cutout extends to the skin, and the damages on the web along the direction of 45° extend further. The damage on the skin propagates faster than that on the web. Finally, the T-joint fails with a ∧ shape damage, as shown in Figure 9.
Final failure mode of the composite T-joint.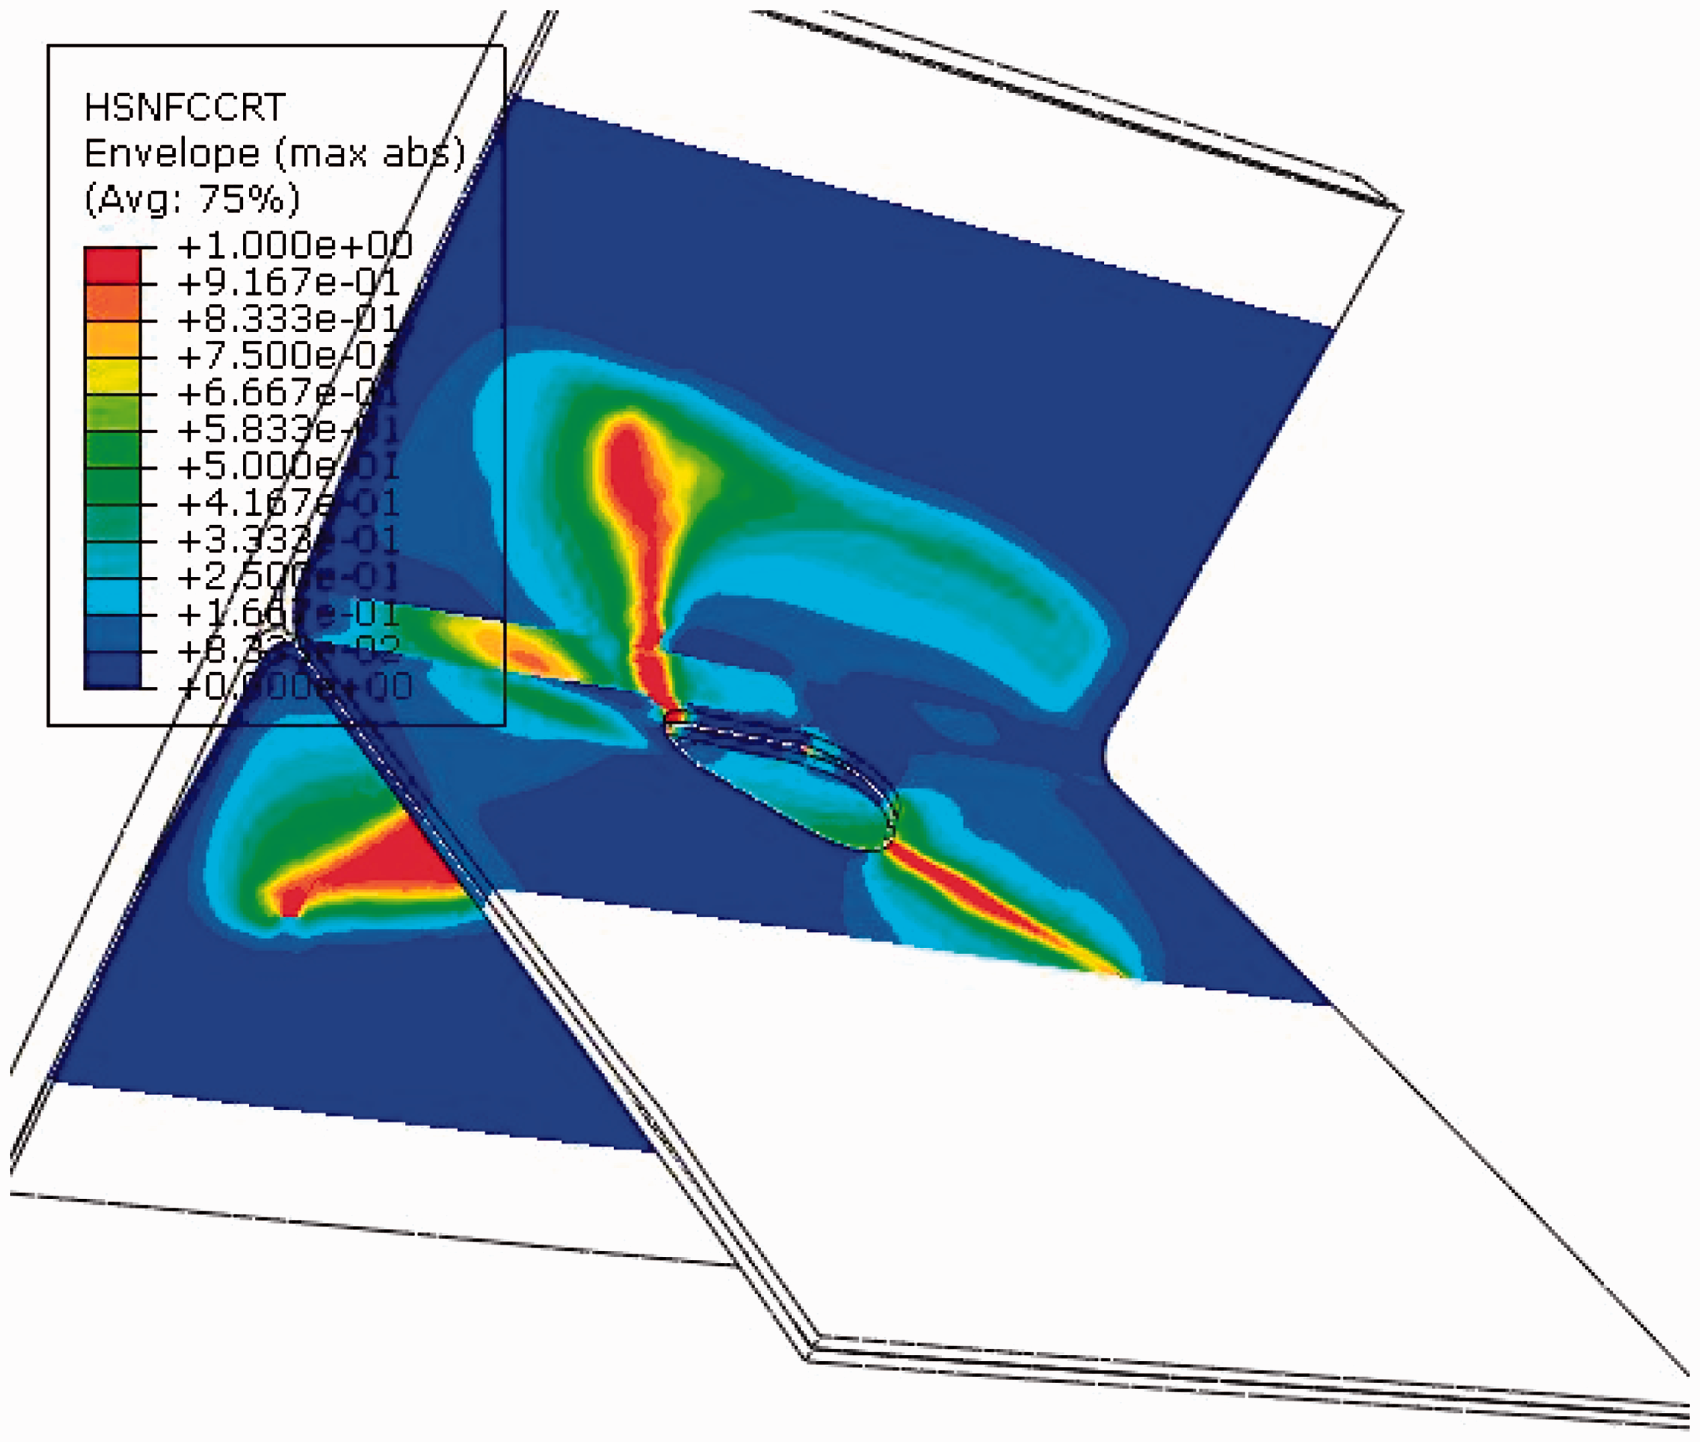
Model validation
To validate the numerical results, the samples of composite T-joints and the fixture were manufactured as shown in Figure 10. The experiments were conducted using a universal testing machine (MTS-810) at a loading speed of 2 mm/min under room temperature. The results obtained by experiments are compared with the numerical simulation and shown as follows.
Sample and the fixture of the composite T-joint.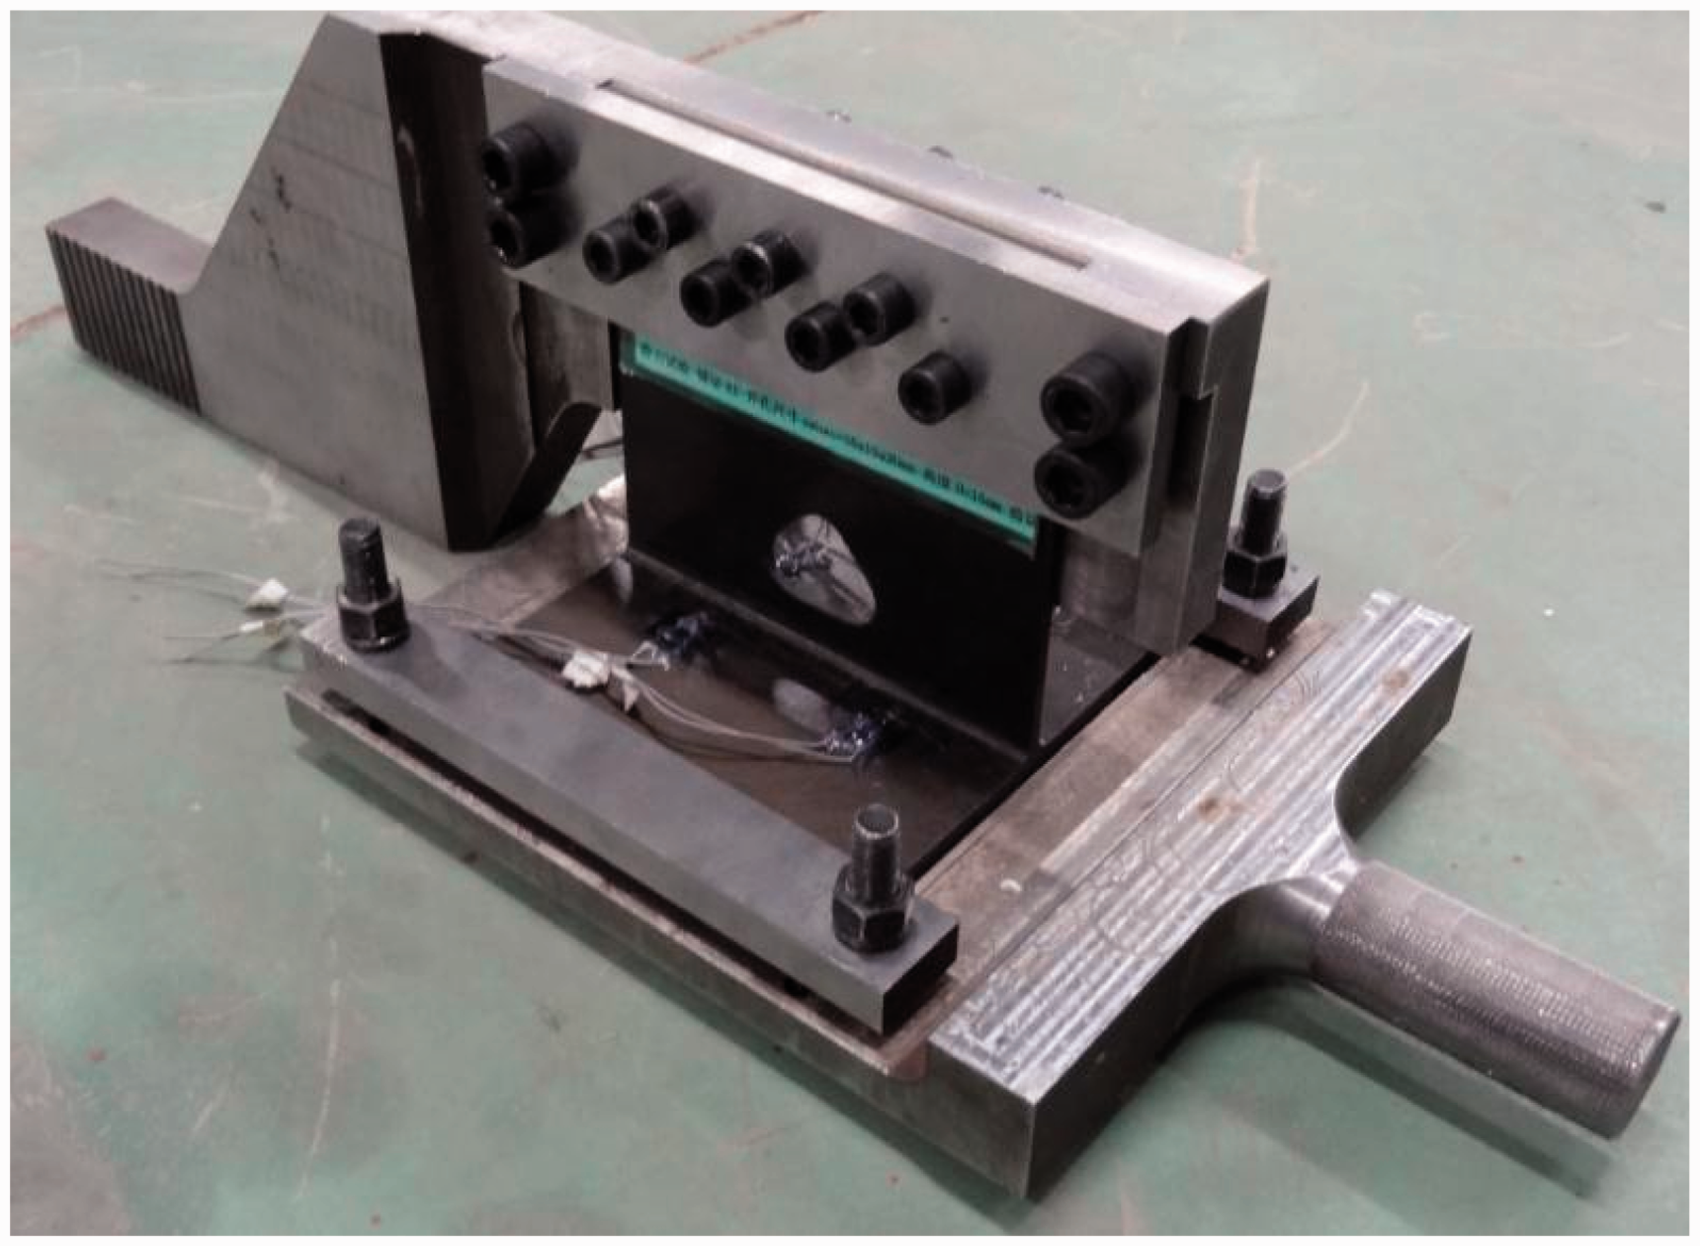
Comparison of load–displacement curve
Figure 11 shows the load–displacement curves of the T-joint obtained by numerical simulation and the experiment. It can be seen that the two curves agree well. However, there shows some differences. In experiment, when the load reaches a certain level, it experiences a load drop and then keeps increasing. However, the numerical simulation does not catch this phenomenon. This may be due to neglecting the fiber bridging force in the simulation.
16
On the other hand, the numerical load–displacement curve in stage 4 is not as smooth as the experimental one. It is mainly because the simulation is based on Hashin criterion which takes into account four kinds of damage mode for the fiber and the matrix; a small local damage may cause a small fluctuation on the curve, while the experiment may not be so sensitive to a small local damage.
Comparison of the simulation result with the experimental data.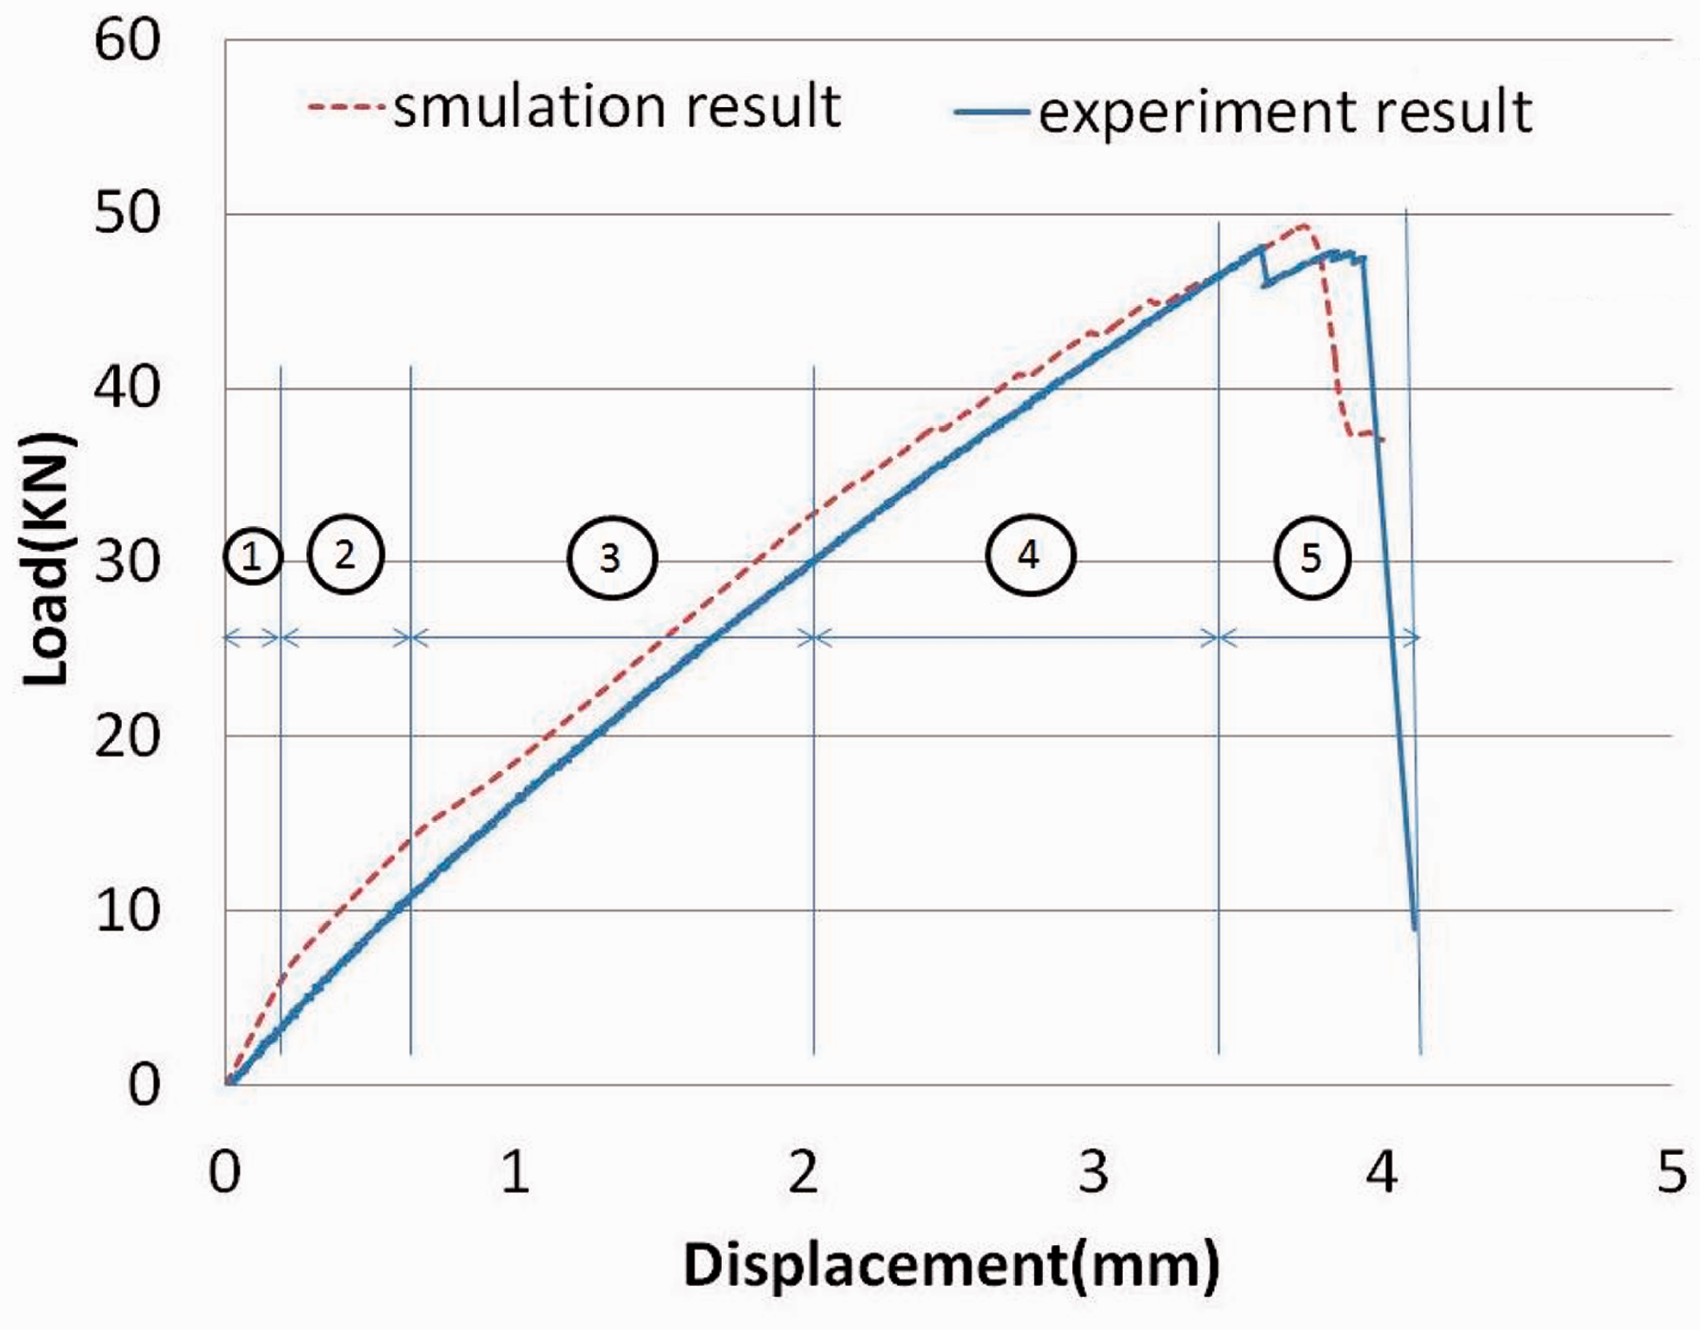
Comparison of damage mode
The typical damage modes of the T-joint under shear load obtained by numerical simulation and experiment are compared in Figure 12, showing that the numerical simulation can catch the failure mechanisms of the composite T-joint under shear loading and well predicts its failure behavior.
Comparison of the simulation damage mode and the experimental result: (a) damage mode by the FE simulation, (b) damage mode by the experiments.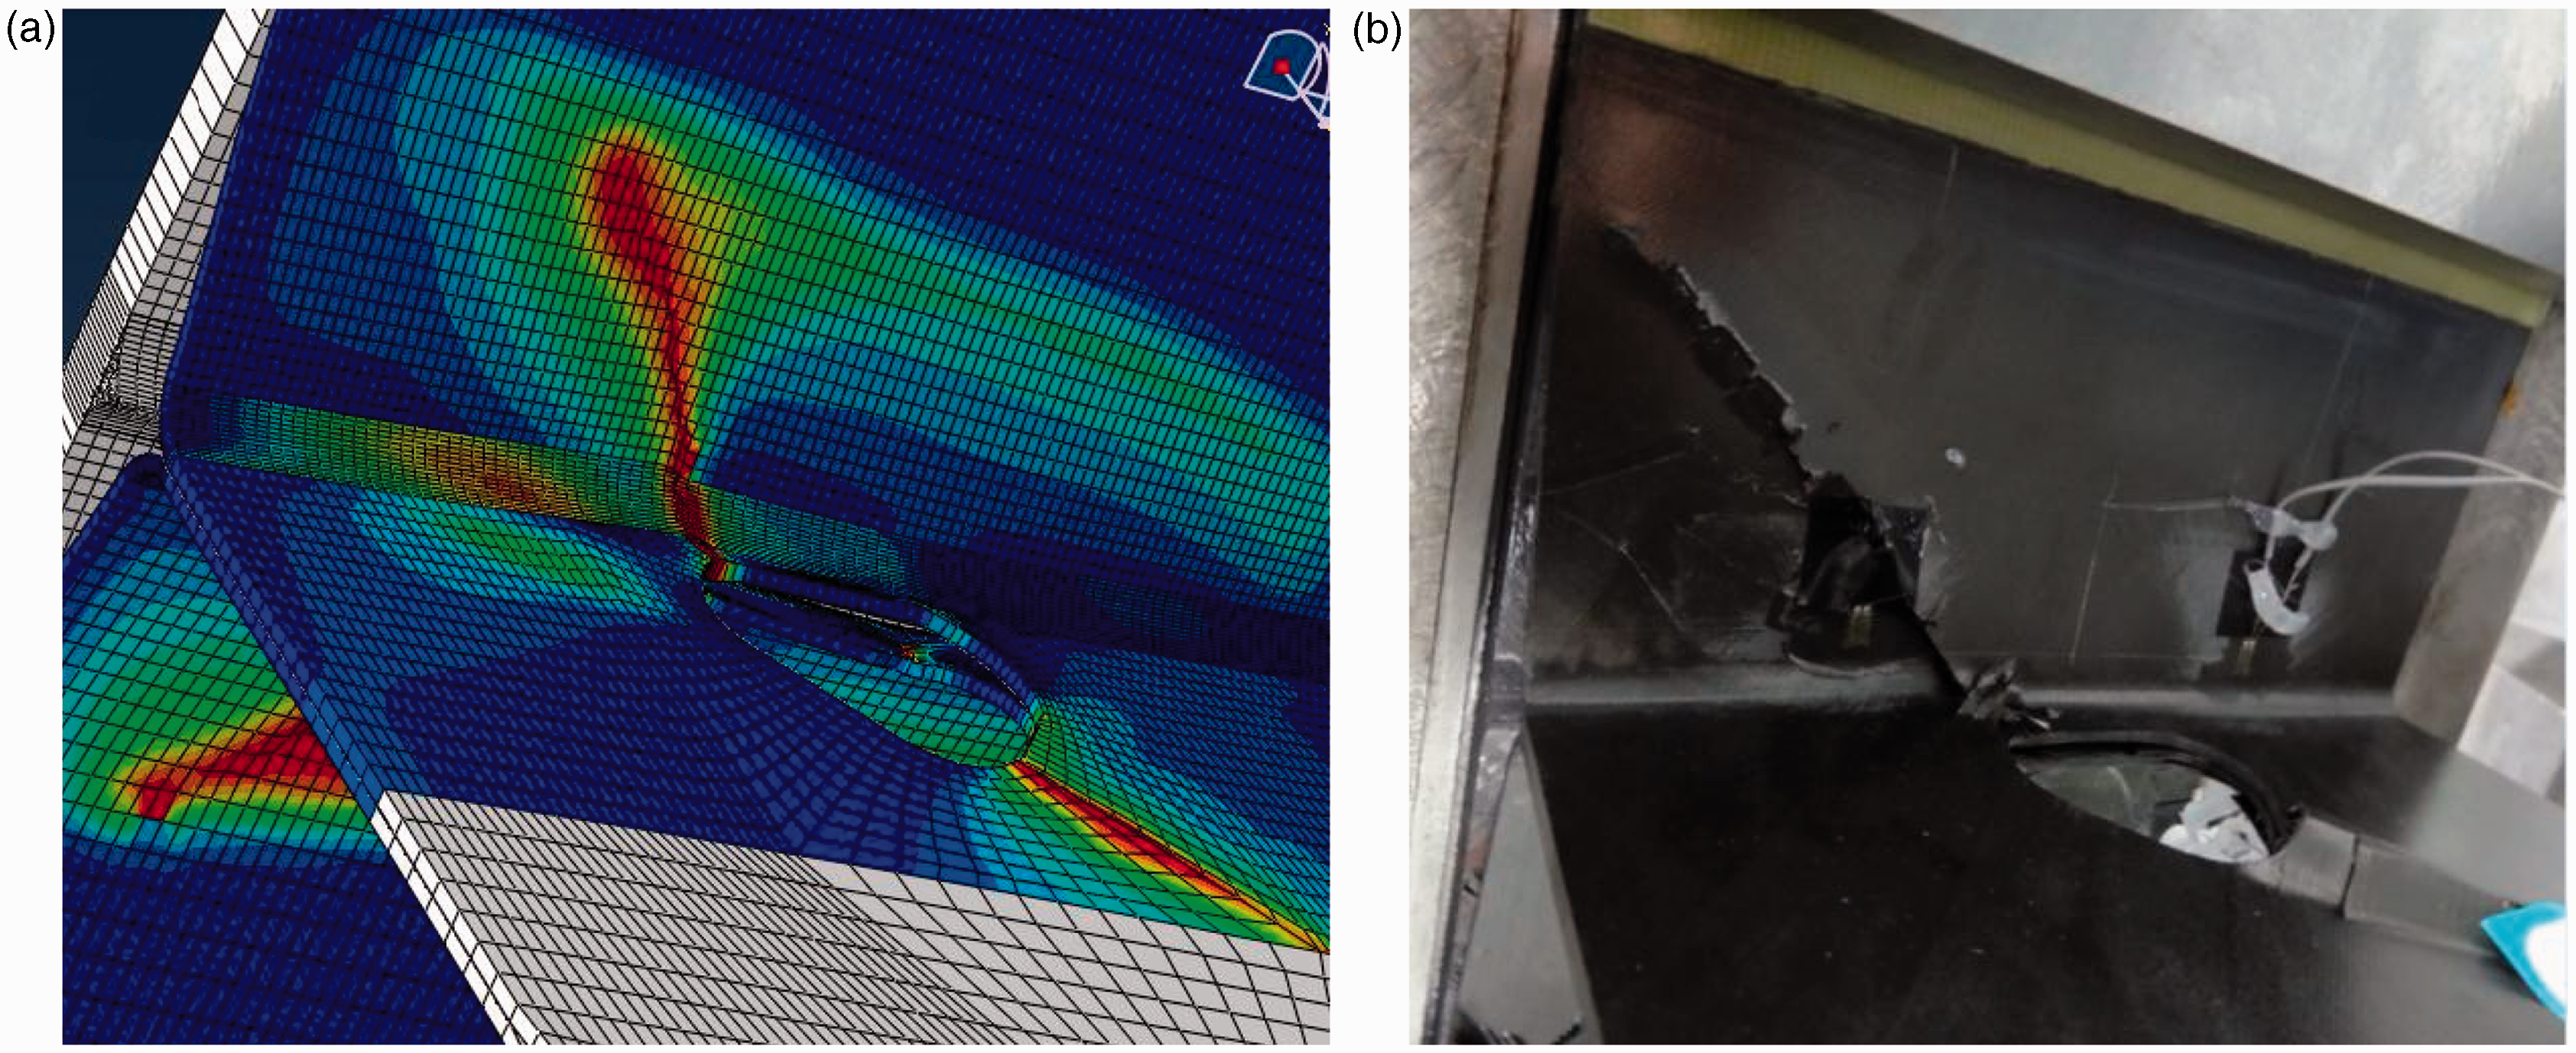
As observed from the experiment, the crack first occurred in the arc transitional region and it extended in two directions. One crack extended on the skin and the other was upwards on the web. The later crack resulted in the delamination at the bottom of the cutout. Due to the compression on the web, the crack extended from an edge of the cutout in a 45° direction. While the crack on the bottom of the cutout extended to the skin, it formed a ∧ shaped damage mode on the skin. Once the ∧ shaped crack appeared, the T-joint failed without any further load-carrying capacity.
Reinforced schemes to enhance the load-carrying capacity of the T-joint
Reinforced schemes of the T-joint
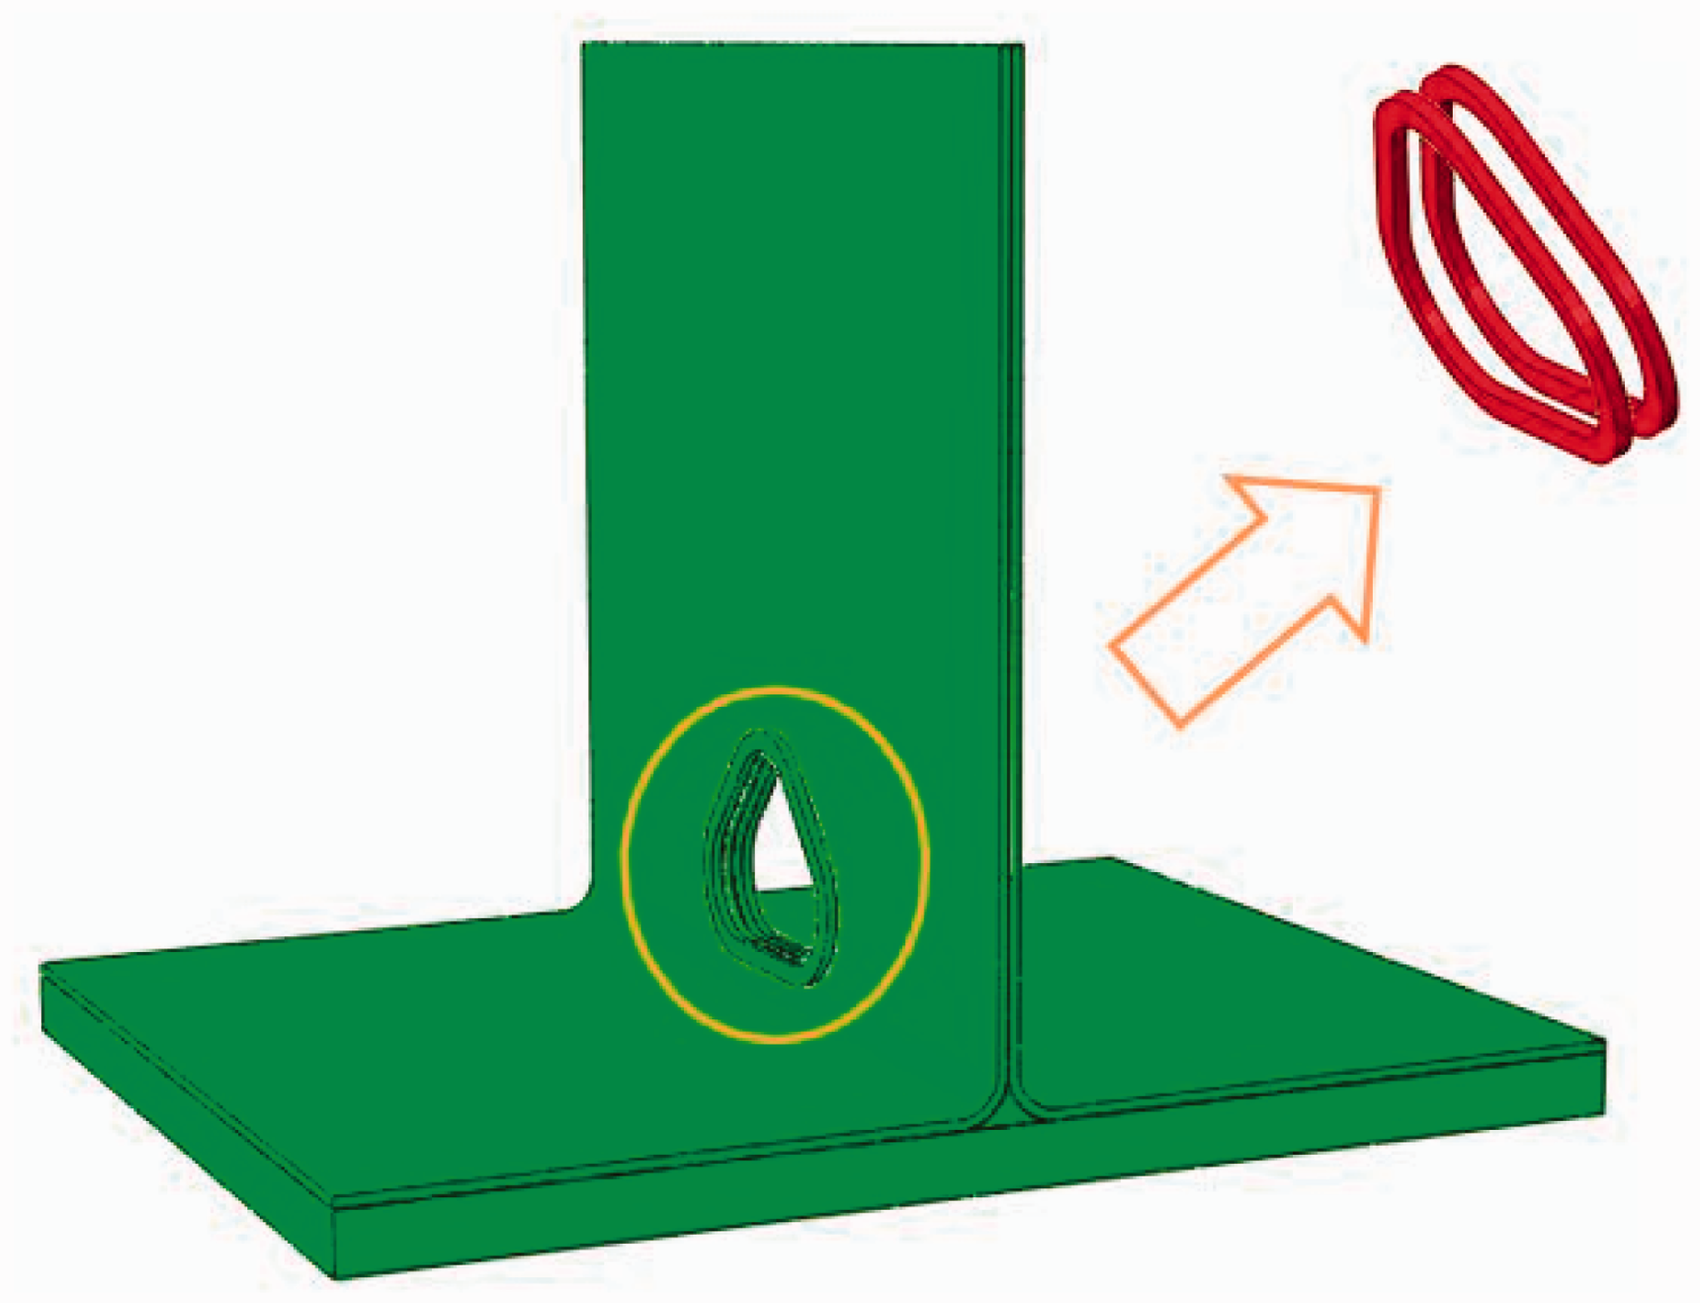
There are two weak regions on the T-joint: one is the region around the cutout where stress concentration may happen; the other is the filler region where delamination may initiate. On this consideration, three schemes are proposed in this study to reinforce the weak regions: (1) reinforcing the cutout by composite laminated rings, (2) flange reinforcement by composite material, and (3) using z-pins to enhance the filler region.
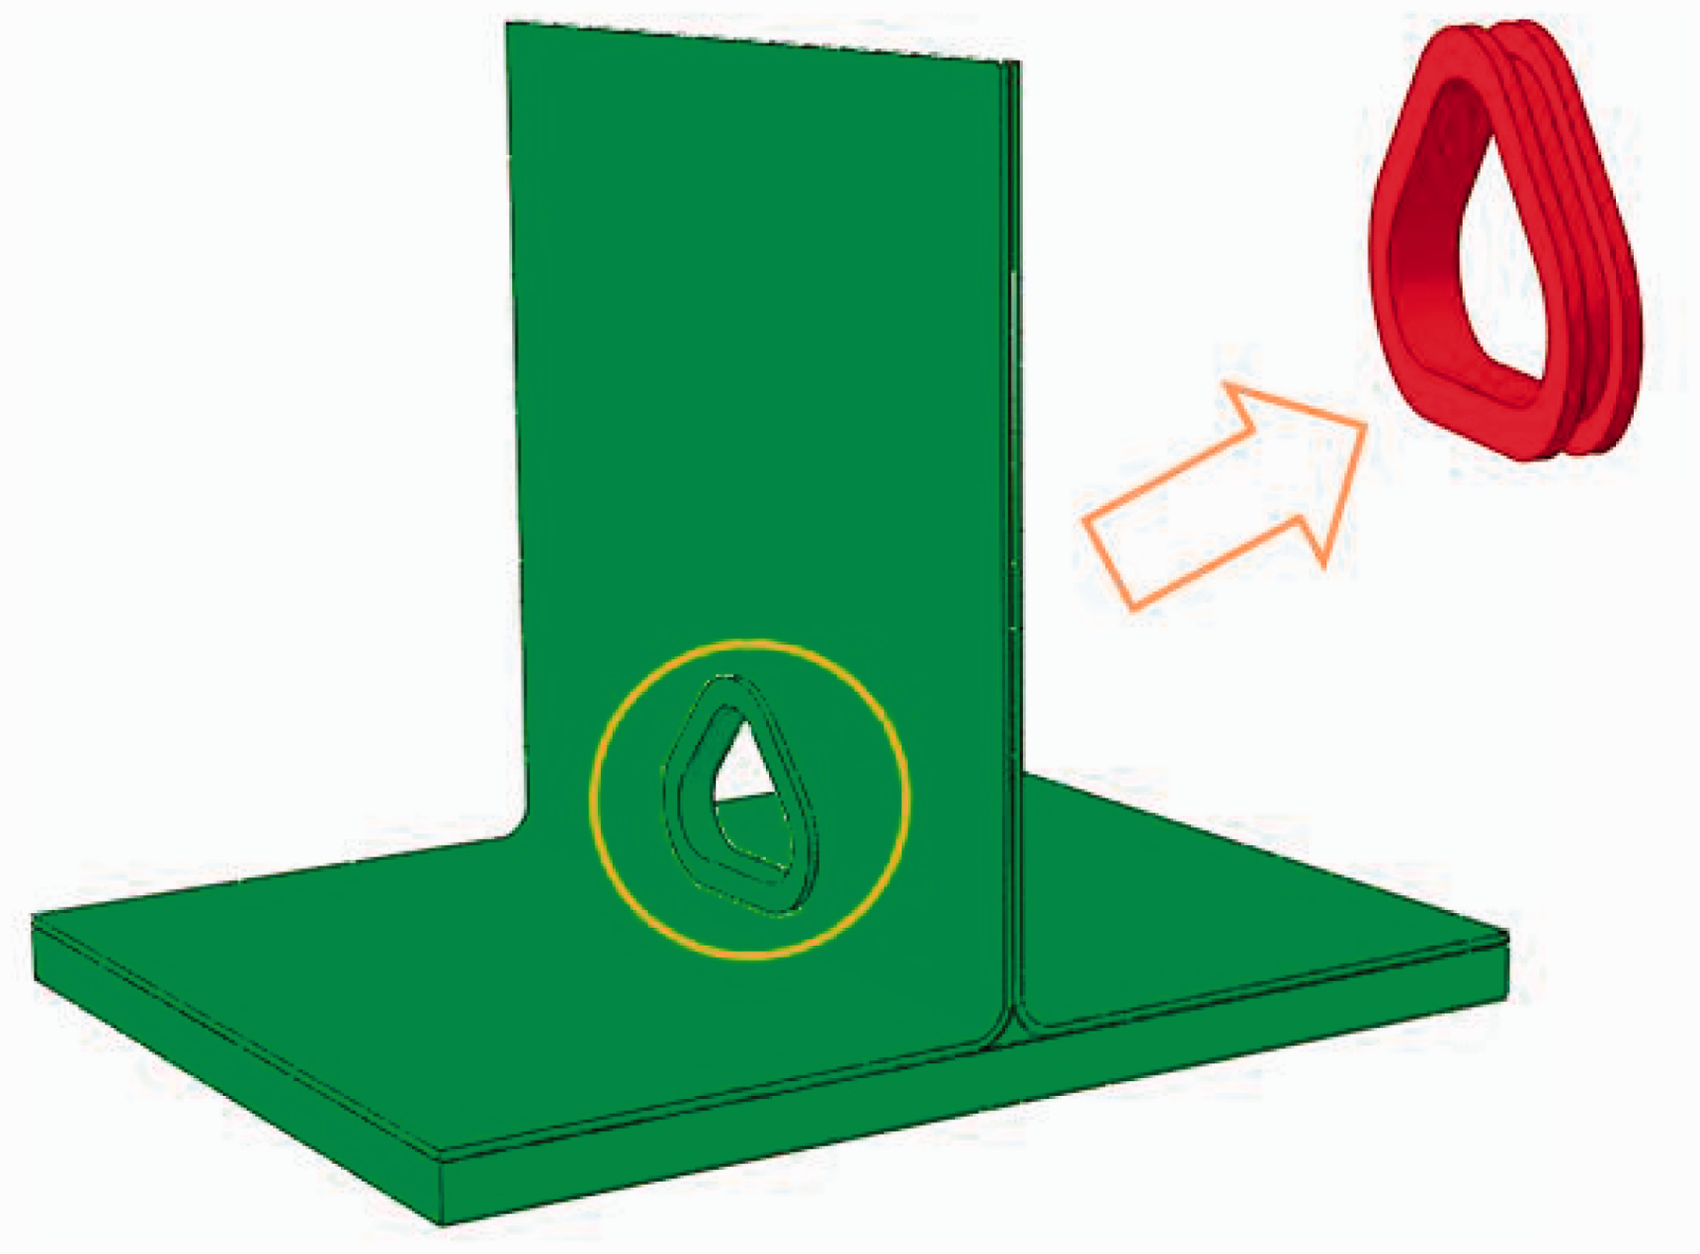
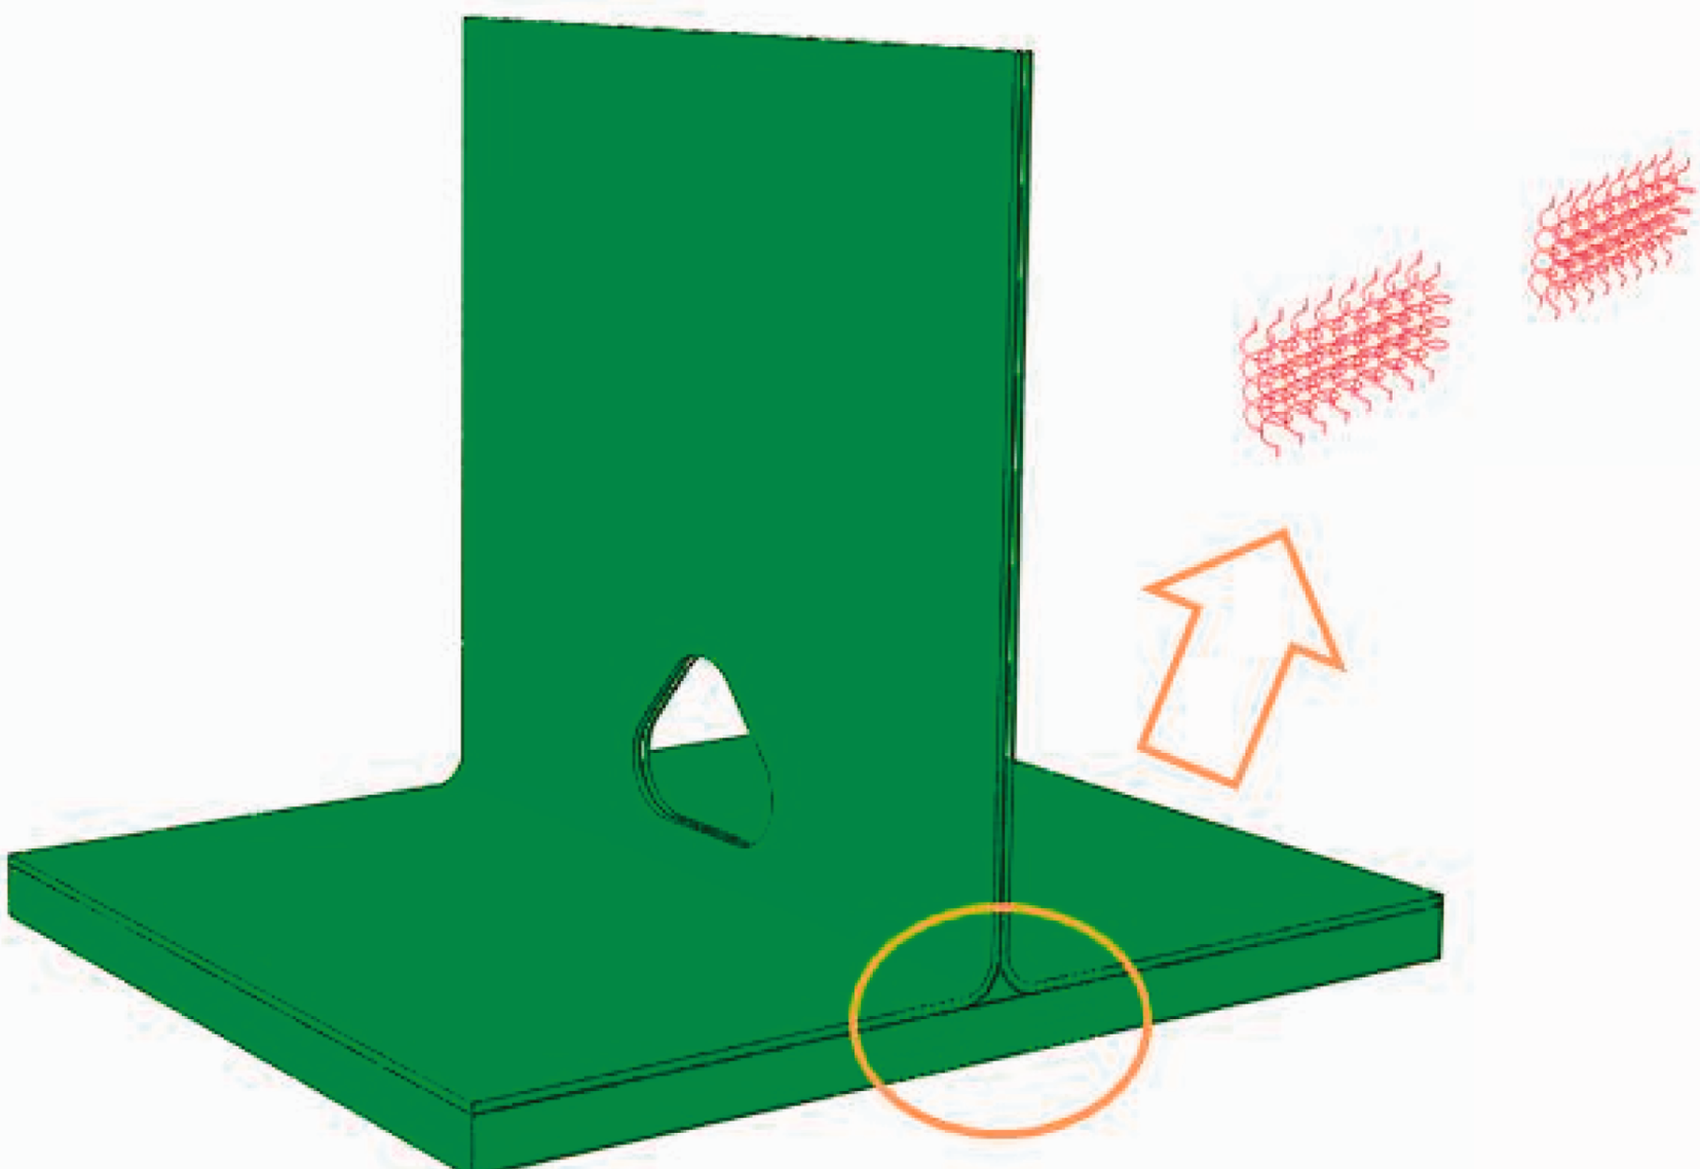
Scheme 1: Reinforcing the cutout by composite laminated rings. The cutout is reinforced along the edge of the cutout by a pair of rings made of carbon-epoxy prepreg (as shown in Figure 13). The rings are 3 mm wide and 1.75 mm thick. Scheme 2: Flange reinforcement. The materials of the flange reinforcement is the same as the rings. The width of the flange is 3 mm and its thickness is 1.75 mm (as shown in Figure 14). Scheme 3: Z-pin reinforcement. The material constants of z-pins used in this scheme come from the literature.
17
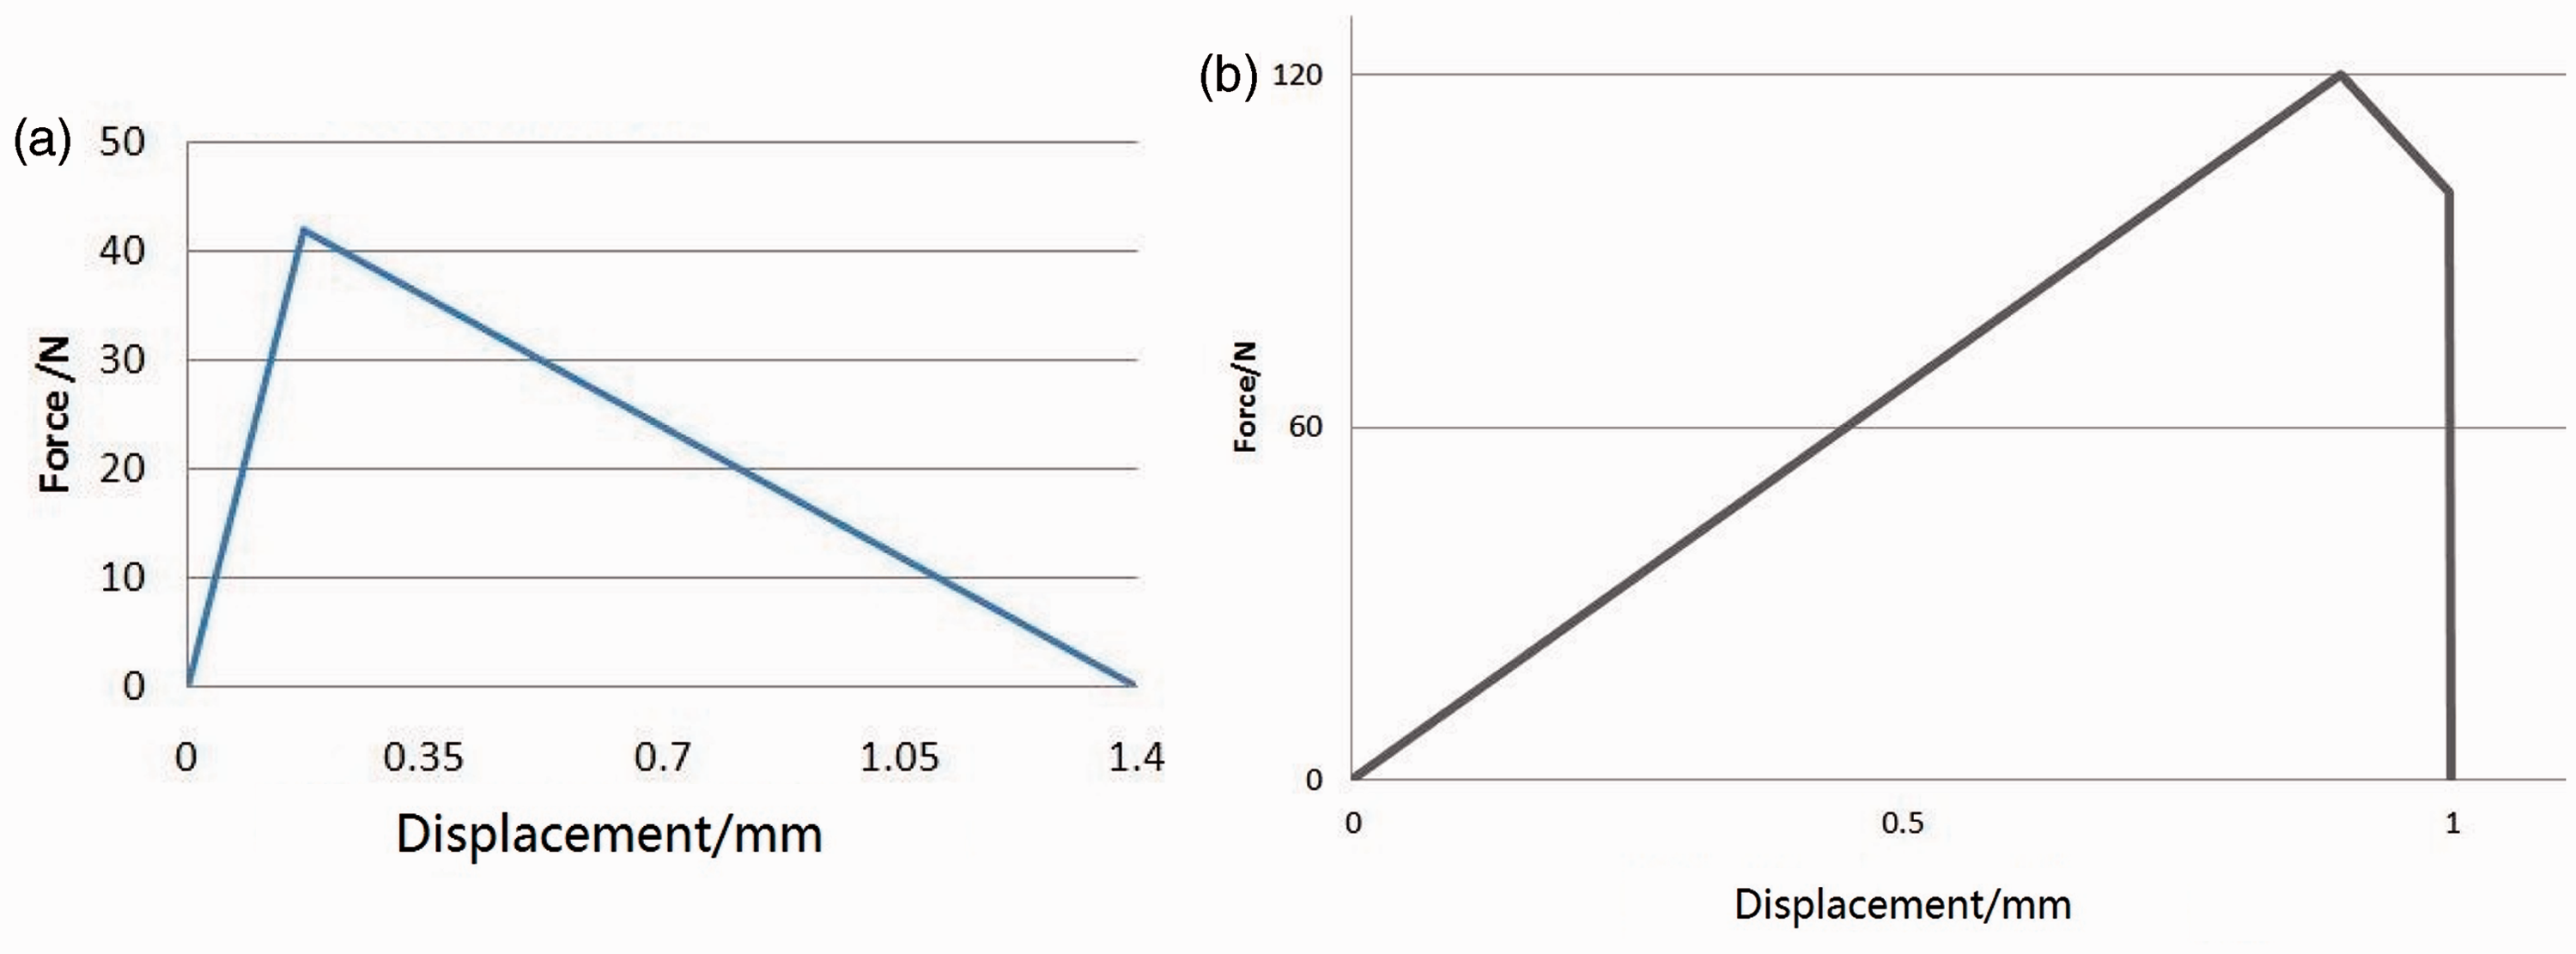
Z-pins are symmetrically inserted into the skin. Each side has two rows containing 10 pins, respectively. The distance of the two rows is 2 cm and that of the pins is 1 cm, as shown in Figure 15. The traction of the pin generated during delamination growths along the bond line is calculated using a nonlinear spring model developed by Dantuluri et al.
18
The mechanical behavior of the nonlinear spring in plane and out of plane is shown in Figure 16. Cutout reinforced along the edge by a pair of rings. Reinforced model by flanging reinforcement. T-joint with Z-pin reinforced. Force versus displacement curve of the nonlinear spring (a) in z-direction, (b) in x-direction.
Comparison of the reinforced schemes
Load–displacement curves
Figure 17 shows the load–displacement curves of the T-joint with three reinforcement schemes and the T-joint without reinforcement. From the figure it can be seen that all the curves are nearly coincident in stage 1. While in stage 2 when the circular arc transitional region begins to damage, the presence of the z-pins can prevent the damage extension. Therefore, in stage 2, the T-joint with z-pin scheme has a relatively higher load level.
Comparison of the load–displacement curves of the reinforcement schemes and the T-joint without reinforcement.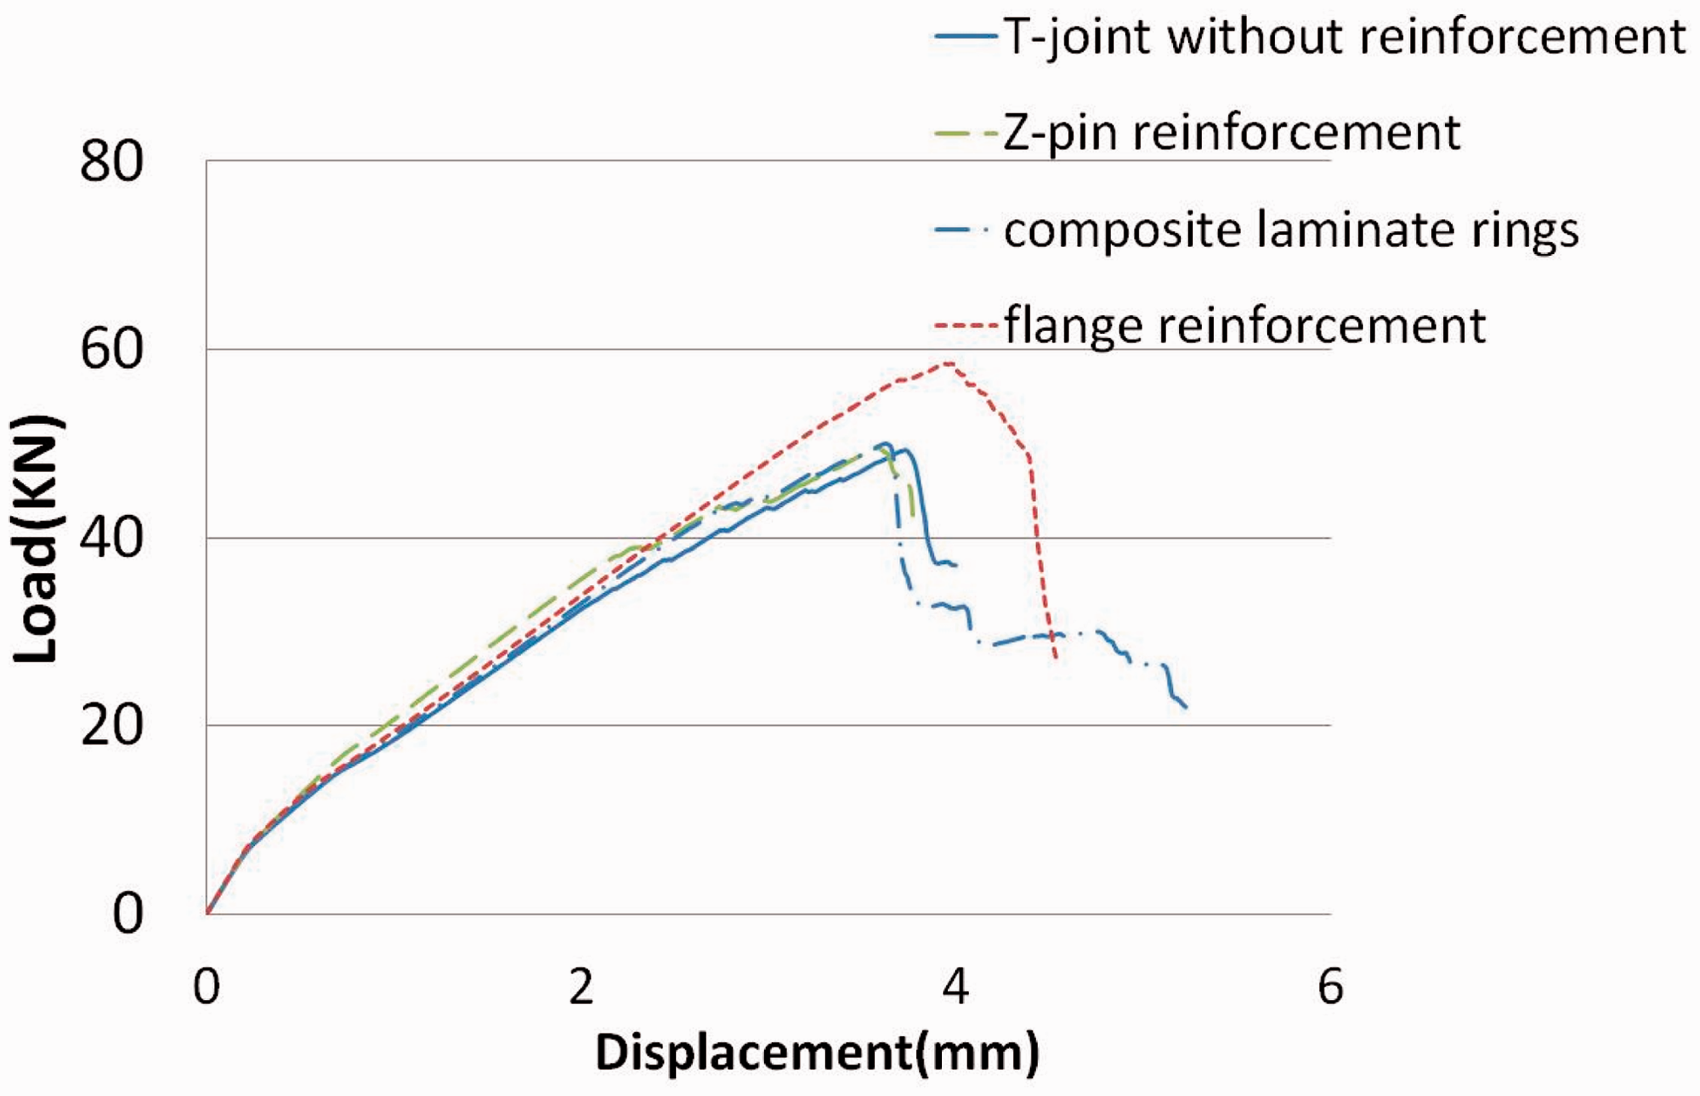
Comparing these curves, it is known that the flange reinforcement scheme can achieve nearly 20% increase in the ultimate strength, because it can prevent the damages around the cutout.
Failure behavior
For the T-joint without reinforcement, the crack on the skin extended from the cutout bottom. For the T-joint reinforced by composite laminate rings, the damage mode and crack position are basically the same with the T-joint without reinforcement. For the T-joint with flange reinforced, the crack on cutout edge moves to the top of the cutout (as shown in Figure 18(c)), while the flange reinforcement prevents the crack around the cutout and it only appears on the skin. With z-pin reinforced, the crack appearing in the arc transitional region does not extend to the skin, and three cracks around the cutout appear (as shown in Figure 18(d)). The z-pins stop the crack extending on the skin, so it extends along the web.
Failure modes: (a) T-joint without reinforcement, (b) T-joint reinforced by composite laminate rings, (c) T-joint reinforced by flange, and (d) T-joint reinforced by Z-pin.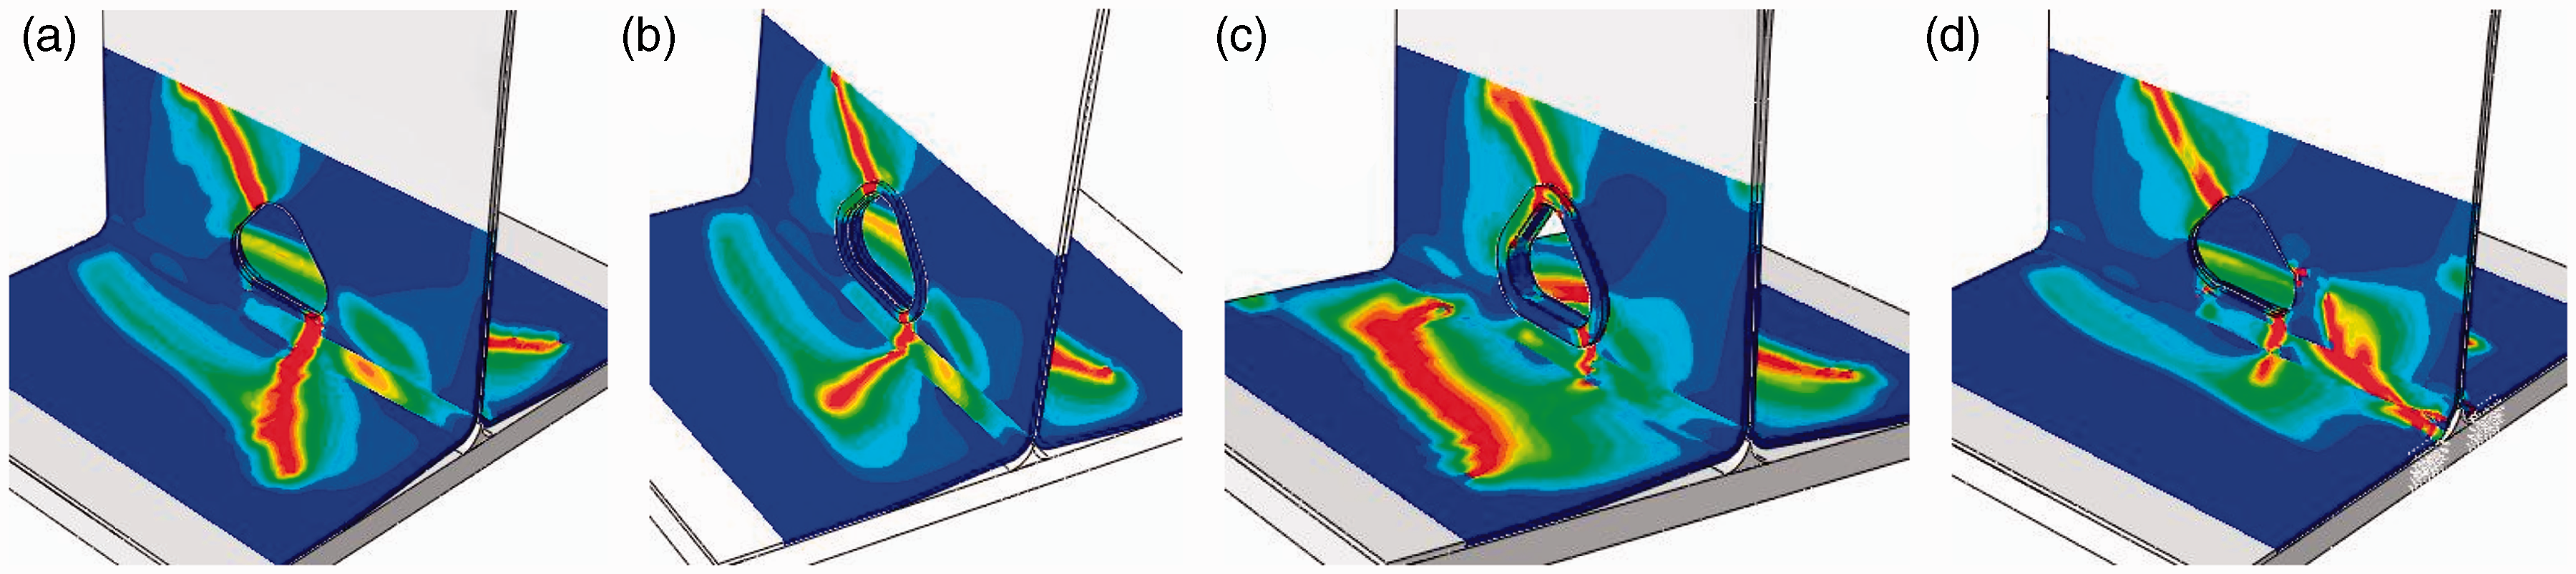
By comparing the load–displacement curves under shear load for the T-joint with flange reinforcement scheme and the T-joint without reinforcement, it can be found that the cutout on the web has a relatively greater effect on the ultimate shear strength of the T-joint than the effect of the circular arc transitional region. By comparing the damage modes, it shows that the flange reinforcement can effectively prevent the delamination at the bottom of cutout. Therefore, this scheme enhances the ultimate load of the T-joint with a cutout.
Conclusions
With continuous shell elements and cohesive interface elements, using the progressive damage algorithms, this study successfully predicts the mechanical behavior and the damage characteristics of T-joint with a teardrop-shaped cutout under shear loading. Some conclusions can be drawn:
With increasing the load, a crack first occurs at the circular arc transitional region of T-joint. When delamination happens at the bottom of cutout, the stiffness of the T-joint decreases. Damages around the cutout happen and extend along the direction of 45° on the web. When the crack at the bottom of the cutout extends to the skin, it suddenly forms a ∧ shaped damage zone and the T-joint finally fails. By comparing the load–displacement curves under shear load for the T-joint with flange reinforcement scheme and the T-joint without reinforcement, it can be found that the cutout on the web has a relatively greater effect on the ultimate shear strength of the T-joint than the effect of the circular arc transitional region. Among the three reinforcement schemes for the T-joint with the cutout, it shows the flange reinforced scheme is the most effective among the three reinforced schemes in increasing the shear load capacity of the T-joint.
Footnotes
Acknowledgements
We also thank Mr Zhixian Lu for his kind help on the experiments and Yitai Deng for his guide on the simulation.
Funding
The authors highly acknowledge the financial support from the National Natural Science Foundation of China under grant 11072202.
Conflict of interest
None declared.