
Abstract
Mechanical properties of short-fiber reinforced composites are crucially influenced by their microstructure. The microstructure itself is mainly governed by the manufacturing process like injection or compression molding. The main contribution of this paper lies in the homogenization of linear elastic properties using experimental microstructural information. For this purpose, the microstructure of injection-molded specimens made of polypropylene reinforced with 30wt.% of short glass fibers are analyzed through micro-computer tomography (μCT) measurements. Applying a recently developed segmentation algorithm, the spatial position, the orientation distribution and the length of the fibers are determined. This data is evaluated in terms of orientation tensors and length distribution, and is used within three mean field approaches: a self-consistent homogenization method, the interaction direct derivative estimate, which is based on the three-phase model, and a two-step bounding method. All methods account for the orientation, the length and the diameter distribution. The numerical results are compared to experimental tensile tests.
Keywords
Introduction
Due to the growing effort in building lightweight parts, materials such as short-fiber reinforced composites (SFRCs) have taken over a substantial market share. This class of material is relatively cheap, comparatively easy to process, and provides advantageous specific mechanical properties. However, to design parts made of SFRCs is still a challenging task, since their mechanical behavior strongly depends on the microstructure. The microstructure of SFRCs is characterized by the spatial distribution, the orientation distribution, the distribution of the aspect-ratio, and the volume fraction of the fibers.
1
Particularly in shell-like parts, the fibers are oriented in layers.2,3 In the boundary layer, the fibers are mostly oriented in the filling direction, and in the core layer in the transversal direction, which is perpendicular to the filling direction, see Figure 1. Thus, a reliable prediction of the mechanical properties depends on the particularities of the microstructure. In order to obtain this microstructural information, X-ray observations by means of computed tomography are, meanwhile, a common approach. Micro-computer tomography (μCT) in laboratories or synchrotron tomography have been used not only to observe and evaluate microstructures but also to characterize damage through ex situ and in situ observations.4,5 A detailed review on X-ray tomography can be found in Maire and Withers.
6
This methodology produces a three-dimensional voxel-based picture of the specimen in grayscale, and the question arises of how this information could be used to predict the mechanical properties. As a consequence of the complex microstructure and material behavior, phenomenological approaches are not quite suitable for this task. Alternatively, full field approaches based on solutions of finite element and finite cell models or fast Fourier transformation methods may be applied partially relying on mean microstructure data like orientation tensors, which have been previously extracted from CT data.7–9 Compared to the details of the microstructure, efforts to calculate full field solutions directly based on CT scans are still handicapped by rough meshes since the computational time is extremely high for these methods.10,11 Due to their efficient and straight forward algorithms, mean field approaches can be applied to calculate the effective material behavior regarding experimentally determined microstructure data. Especially in the case of SFRCs, the microstructure information, such as the fiber orientation distribution, can be extracted from the CT images in two different ways: In the first approach, the mean fiber orientation distribution in terms of fabric or orientation tensors is calculated directly using voxel data.
2
The second approach consists of a segmentation of the fibers, and a calculation of the mean orientation distribution based on these segmented data.
Three-layer model of injection-molded shell-like parts.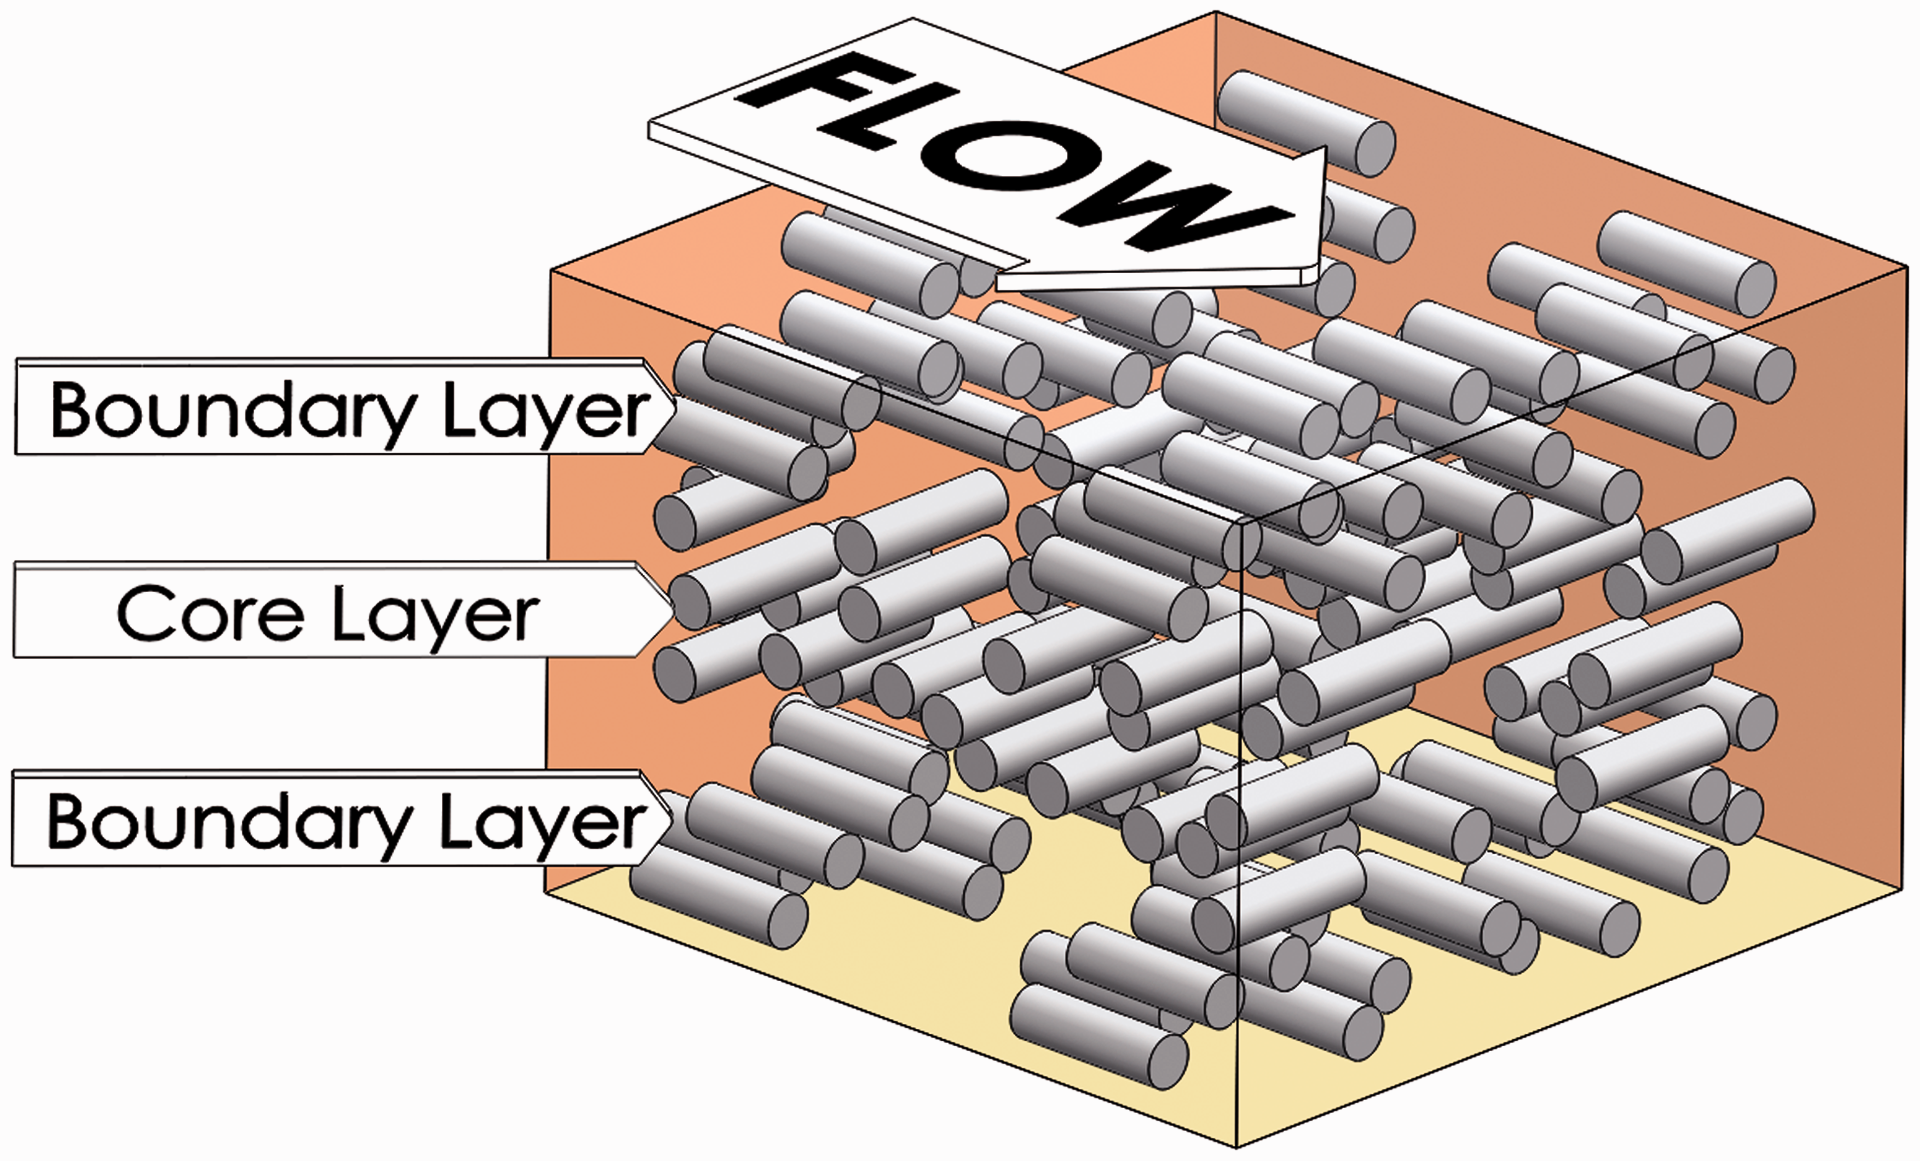
Generally, the set of mean field methods can be divided into bounding and estimating methods. The former specify an admissible range of possible effective properties for given microstructural information. Since the first order or simple bounds, known as the Voigt and Reuss bounds,12,13 only take into account the volume fractions, they enclose a wide range of admissible effective properties. Provided by Hashin and Shtrikman,14–16 the second-order bounds are based on a variation principle. This approach was extended and applied to anisotropic materials 17 and also nonlinear material behavior 18 as well. Contrary to the bounding methods, estimating approaches give approximations of the effective properties. The Mori-Tanaka, 19 the self-consistent 20 (SC), the generalized self-consistent 21 and the interaction direct derivative (IDD) 22 estimates are prominent representatives of such mean field schemes, which take the interaction of the inclusions into account. Based on the Eshelby solution, 23 the general idea of SC is to embed each inclusion in an infinite matrix with the properties of the effective material. Due to this assumption, the SC approach owns an inherently implicit character. The SC method was applied to granular and also to particulate materials with multiple phases and nonlinear properties.24–26 The major shortcoming of SC is that the interaction between the inclusions and the surrounding matrix is not considered directly. This drawback is the main motivation to apply methods like IDD, which are based on the three-phase model. Here, one inclusion interacts with the matrix directly and with the other inclusions through the effective medium. Additionally, two-step (TS) methods may be applied to homogenize particulate materials with arbitrarily oriented inclusions. 27 Within these methods, the microstructure is decomposed into as many domains as there exist different inclusions. Each domain is homogenized individually, and then all domains are homogenized to determine the effective properties. This method can be applied to a much larger class of microstructures compared to second-order bounding schemes 28 and also in conjunction with strength prediction. 29
In the present work, a composite material consisting of polypropylene reinforced with 30 wt.% of short glass fibers (PPGF30) is examined. The microstructure of this composite material is analyzed and segmented using μCT and a new segmentation algorithm. The segmented microstructure data consist of non-aligned fibers with varying aspect-ratios. It is used within three homogenization approaches directly, namely the SC method, the IDD and a bounding TS approach. In all applied methods, each fiber is considered in the homogenization procedure without a need of orientation averaging of transversal isotropic stiffnesses or compliances for unidirectional structures like it is often done in conjunction with the Mori-Tanaka approach. 30
Notation
A direct tensor notation is preferred throughout the text. If tensor components are used, then Latin indices are used and Einstein’s summation convention is applied. Vectors and second-order tensors are denoted by lowercase and uppercase bold letters, e.g.,
Experimental methods
Fabrication of specimens
The materials for the test specimens were compounded at the Fraunhofer-LBF to ensure control of all constituents. The polypropylene (PP) Moplen HP500N (Lyondell-Basell) was used as matrix material. In the reinforced configuration (PPGF30), a fraction of 30 wt.% of short glass fibers was added to the polymeric bulk material. To assure stability, durability, and an adequate performance of the reinforced system, three additives were appended to the compound. A fraction of 0.5 wt.% of Irganox B225 (BASF) served as long-term thermal stabilizer. Moreover, 0.07 wt.% of the calcium stearate acid scavenger Ceasit AV (Baerlocher) and 3.0 wt.% of the coupling agent Exxelor PO 1015 (Exxon Mobil) were added. To ensure the determination of the effect of the reinforcing glass fibers on the mechanical properties, these additives were added not only to the reinforced material but also to the pure PP material.
Plates of the dimensions (a) Locations of specimen extraction from plate (circles distinguish position of samples for microstructural analysis) and (b) example of 2D surface strain field calculated by the correlation software, and averaging area on a tension specimen.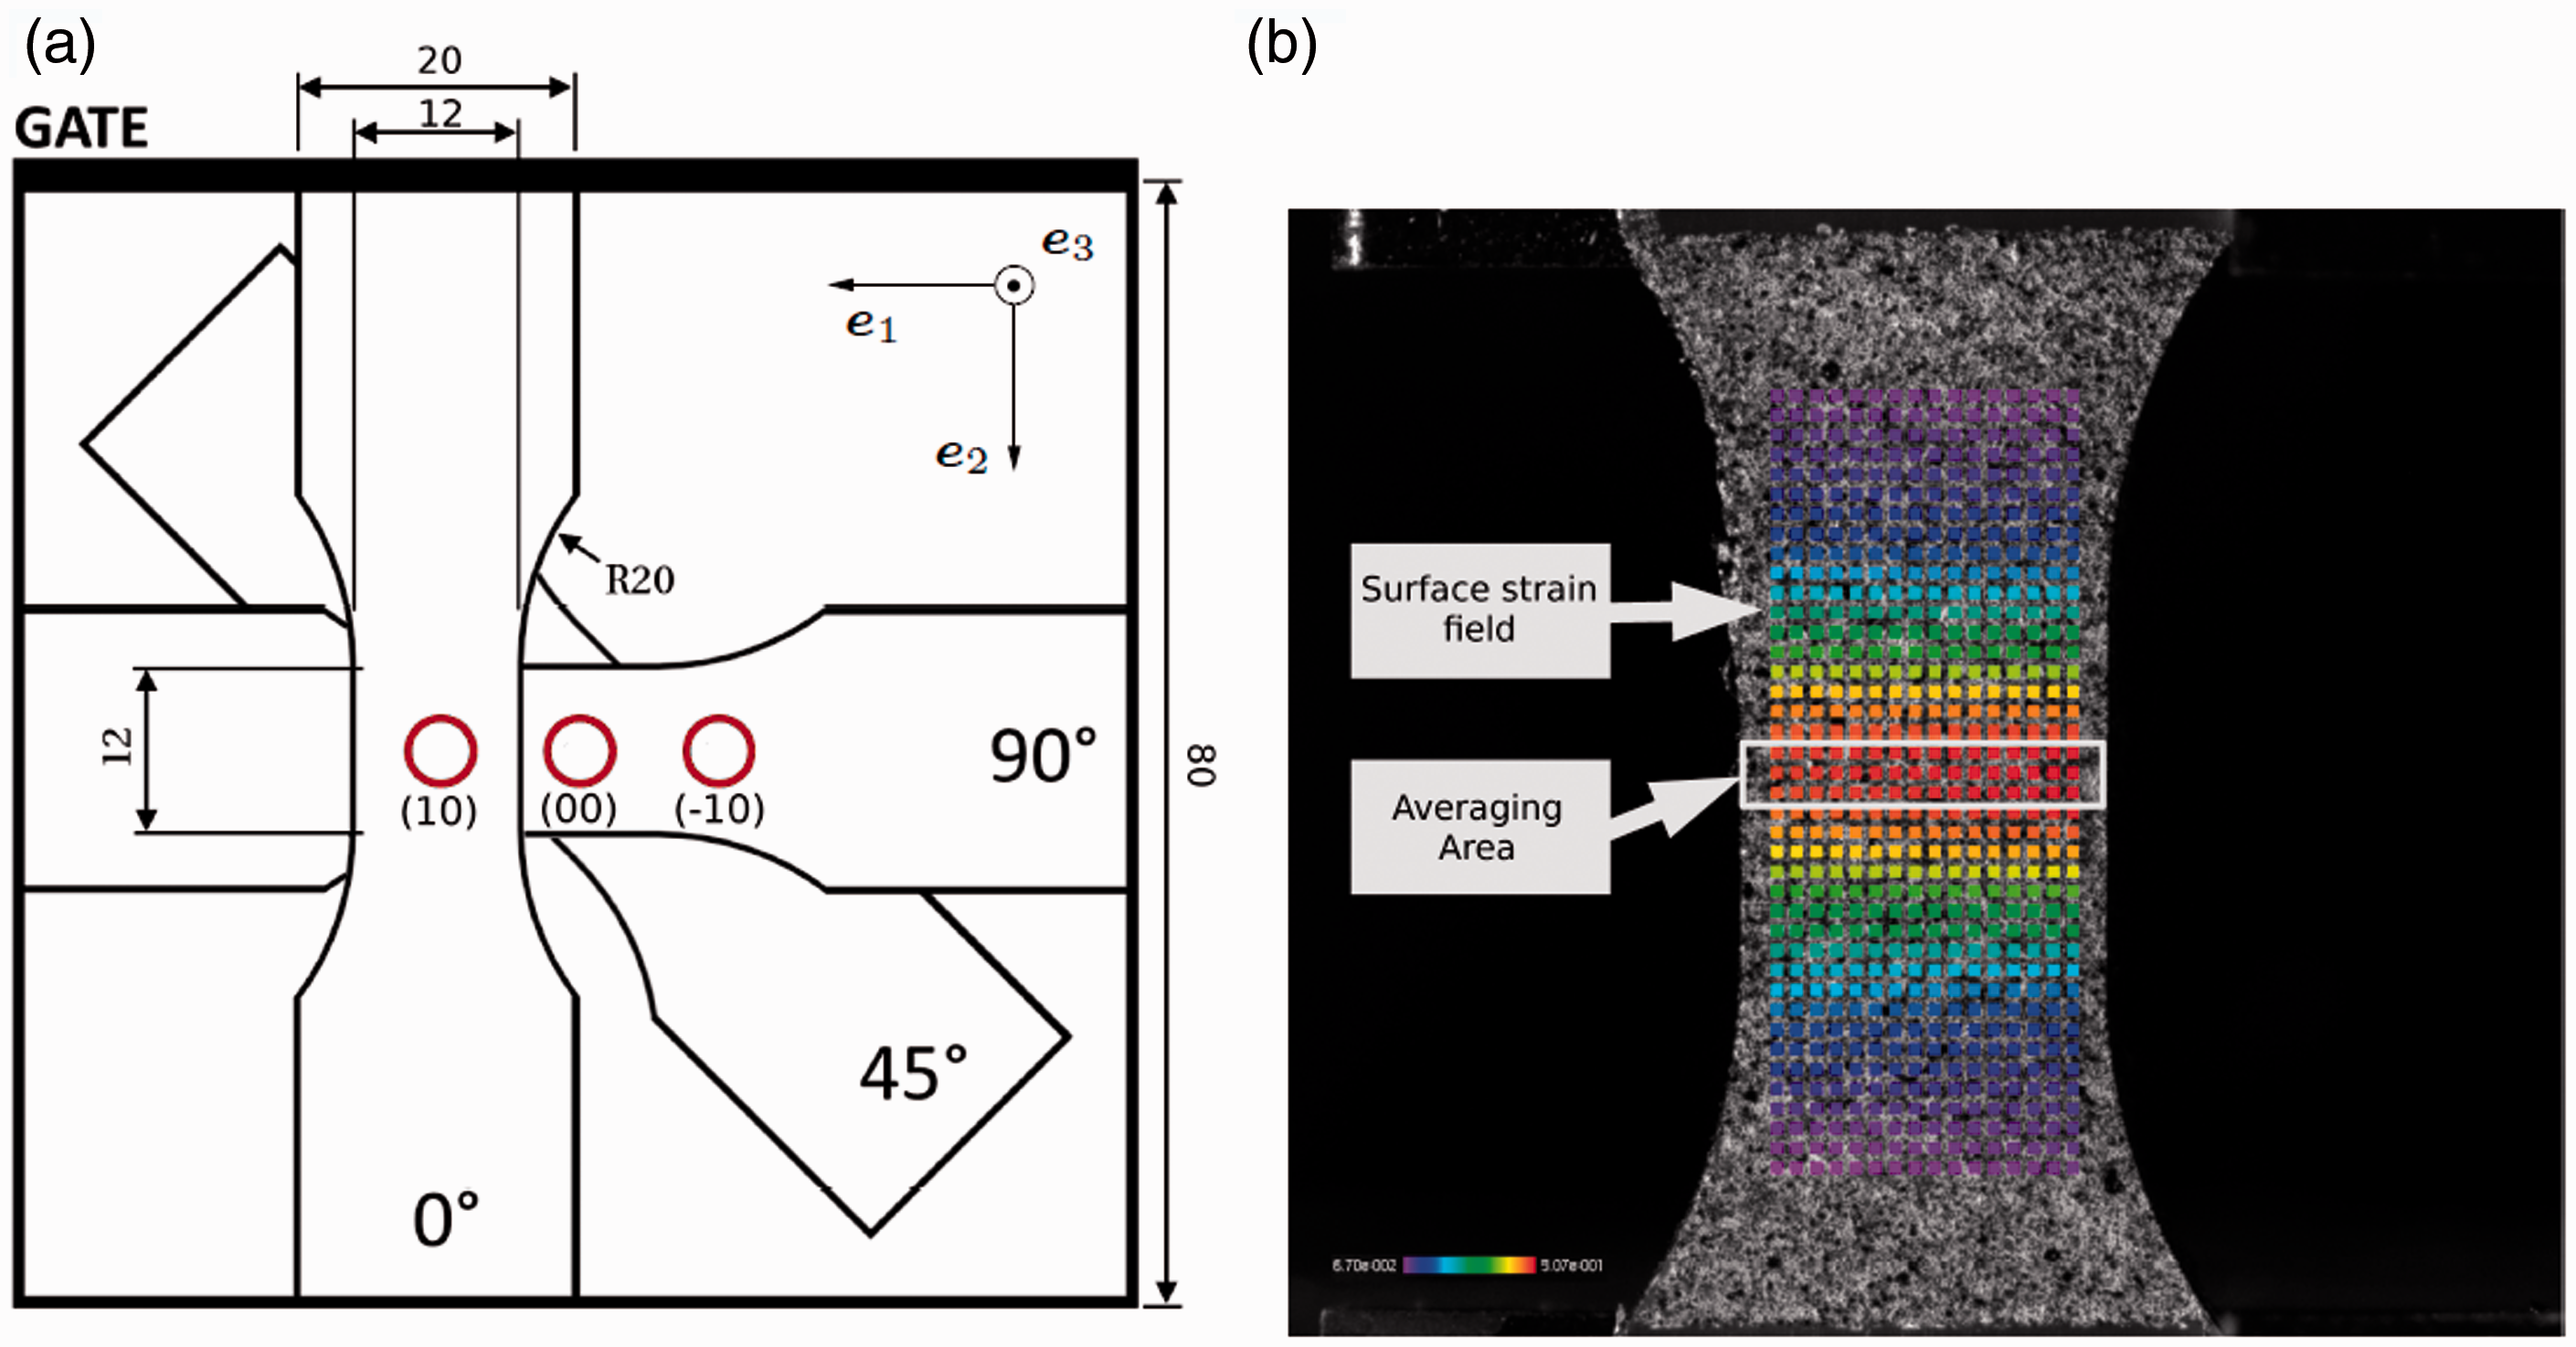
Quasi-static testing methods
The quasi-static tensile tests were conducted on a Z020 testing machine by Zwick-Roell with a velocity of 1 mm/min. Temperature and humidity during the testing procedure were kept at constant values of 23℃ and 50%, respectively. To avoid influences of long-term post-crystallization processes taking place in the PP matrix phase, all samples were tested within a two week time frame.
The deformation of the specimen was observed using 2D digital image correlation.33,34 Therefore, all specimens were spray-painted with a stochastic grayscale pattern. During the testing procedure, different stages of the sample deformation were captured with a monochromatic CCD-camera equipped with a resolution of
For each test configuration, the final result was generated from average values of five single tests. In Figure 3(a), these results are shown for the pure PP matrix material for specimen oriented in flow ( (a) Stress–strain curve of PP matrix material showing details on derivation of Young’s modulus and (b) stress–strain curve of SFRC with 30 wt.% of glass fibers.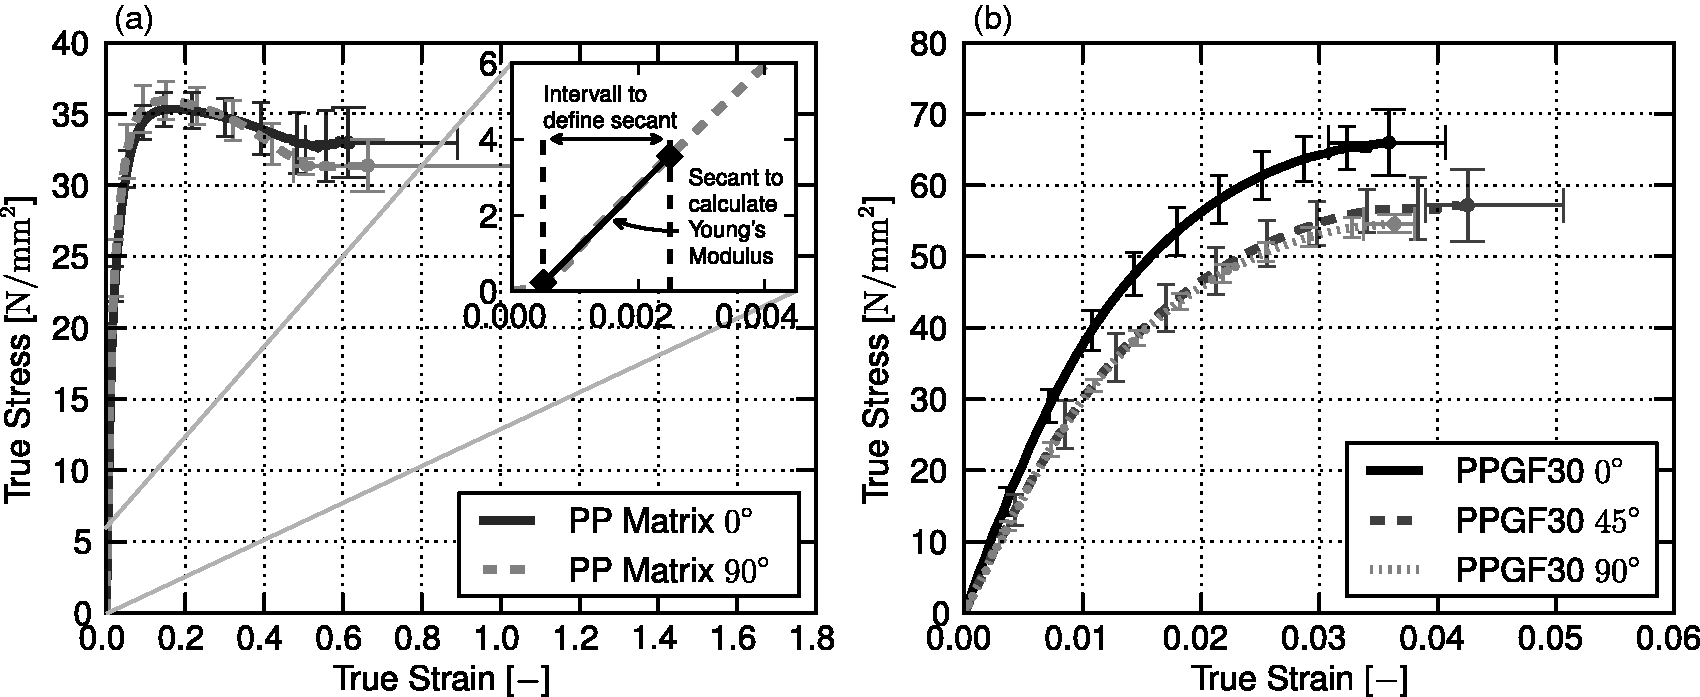
The stress–strain response of the SFRC shows a significant deviation depending on the orientation of sample extraction from the sample plate, see Figure 3(b). This mechanical anisotropy is a result of the material orientation induced by the fiber distribution inherent in the injection-molded plates.
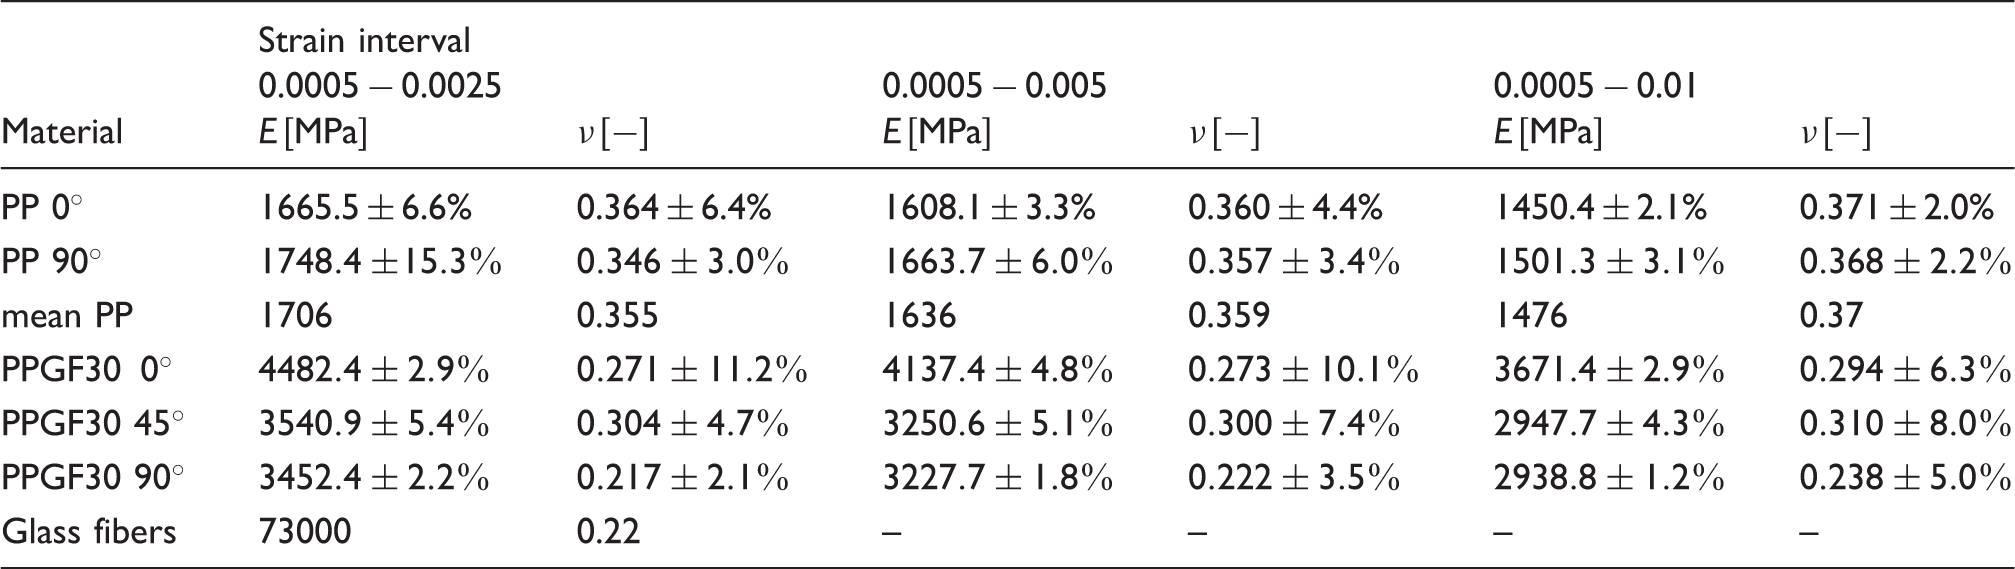
Experimental values of Young’s modulus E and Poisson’s ratio ν.
Analysis of microstructure
Micro-computer tomography measurement
The cylindrical specimens for micro-computer tomography (μCT) measurements were milled from the aforementioned plate at the positions defined in Figure 2(a). To achieve the maximum resolution needed to accurately resolve the reinforcement fibers, the diameter of the specimen should have a maximum diameter of (a) Specimen for analysis of microstructure on μCT mount and (b) μCT measurement setup.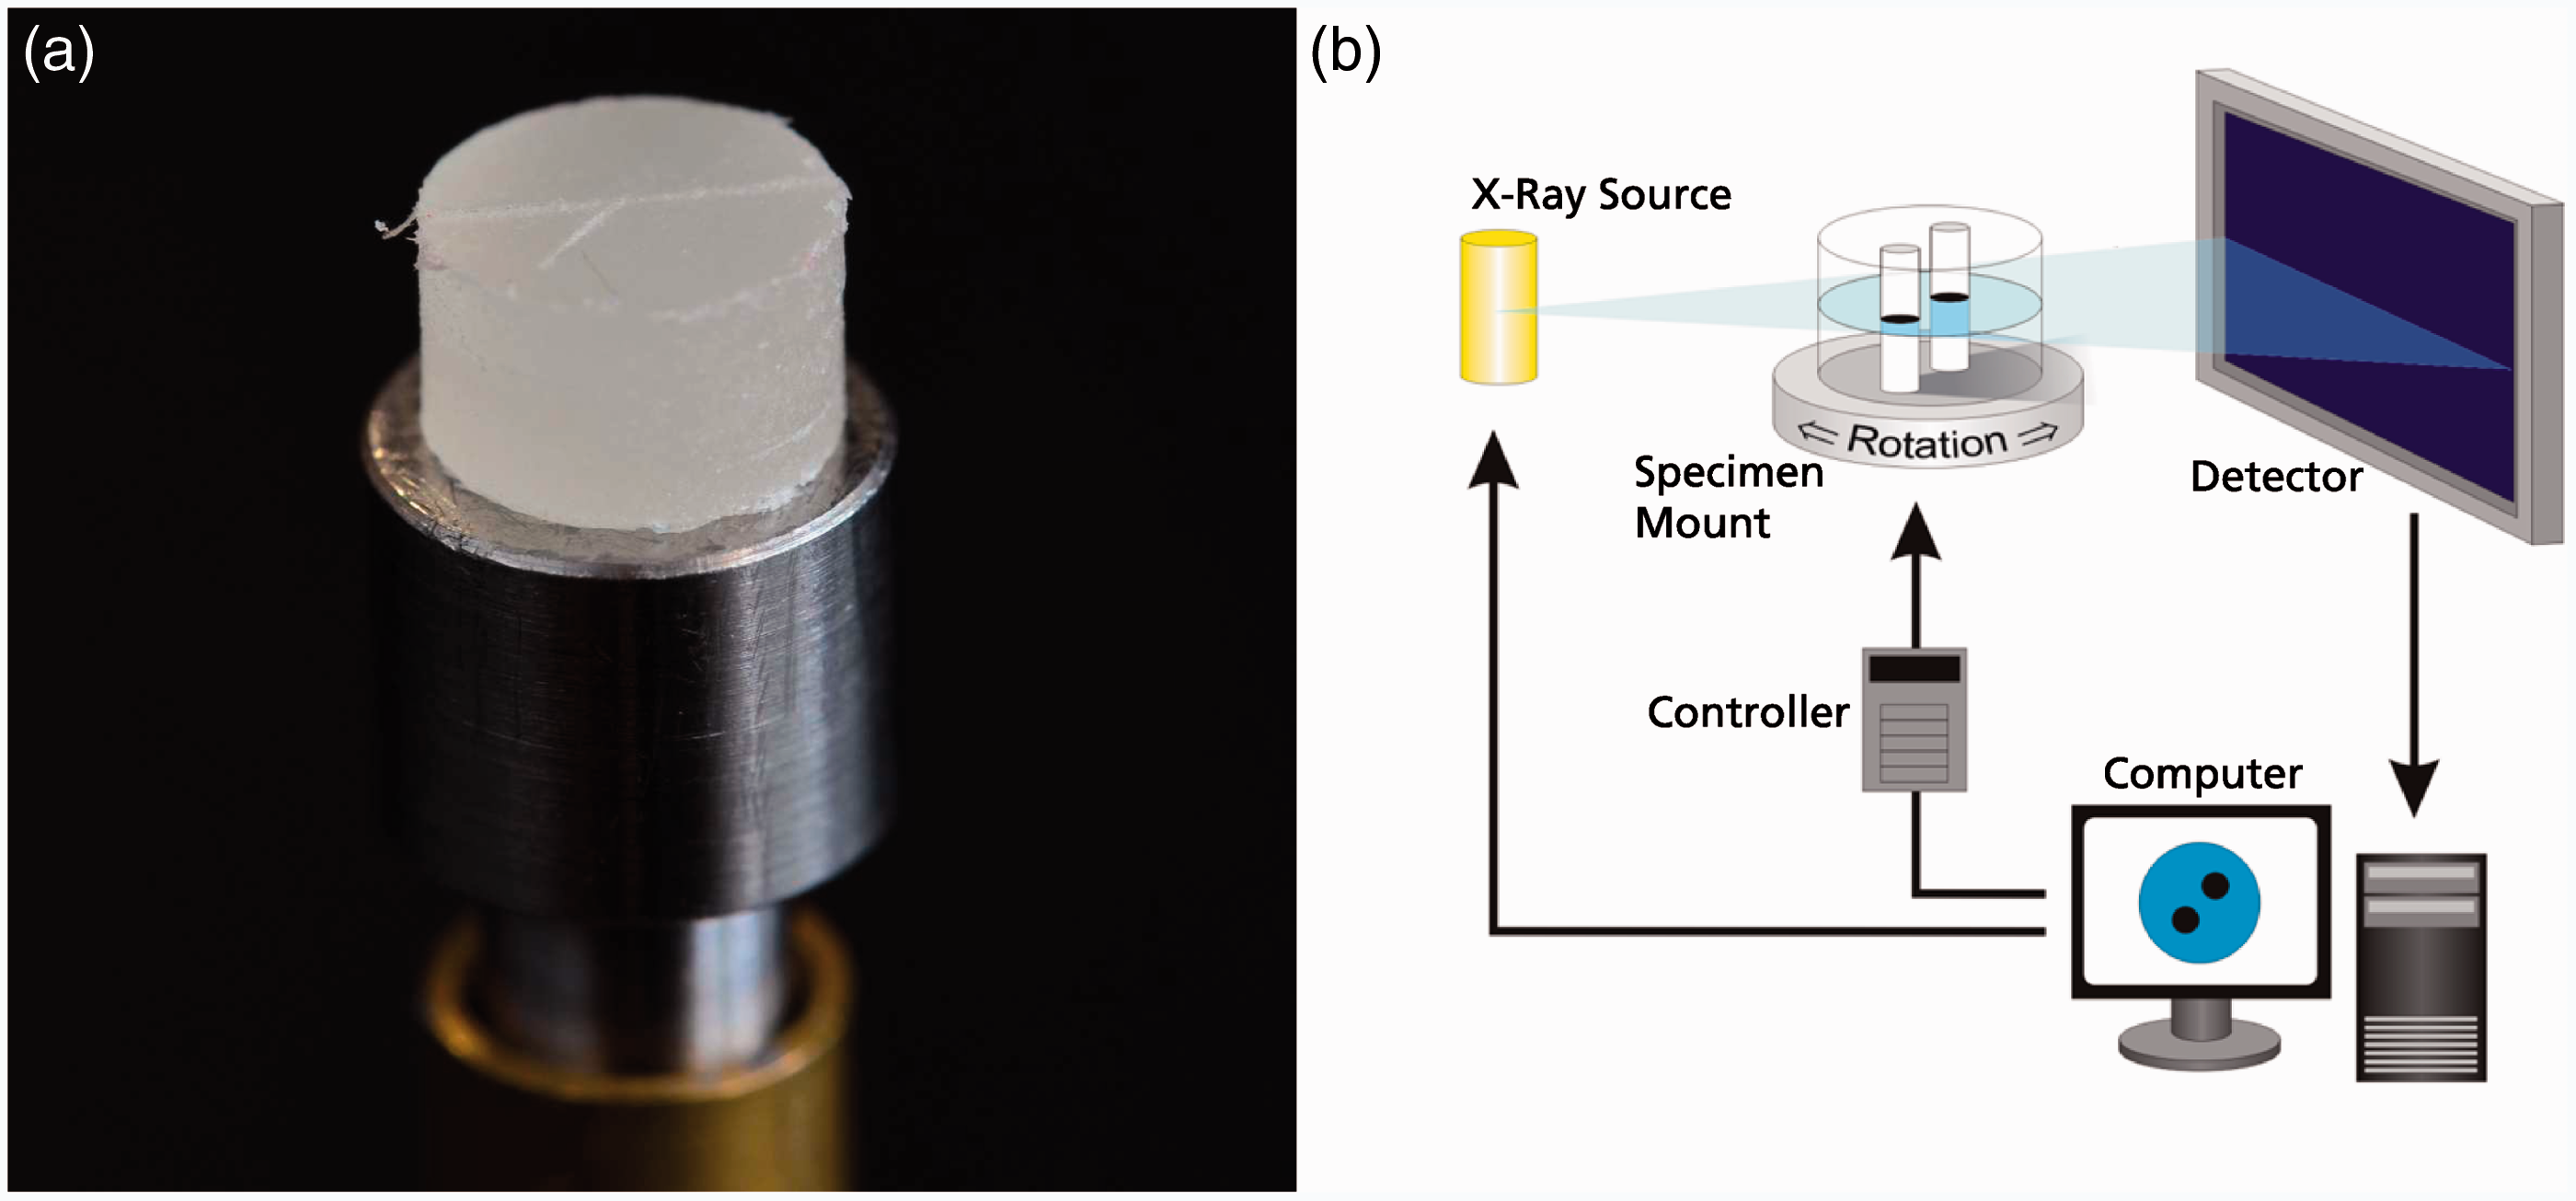
The samples have been analyzed with a SkyScan 1072-100 CT apparatus, using its maximum resolution of 1.8 µm. As shown in Figure 4(b), the specimen is exposed to a low intensity X-ray while being rotated around its vertical axis. The absorption of the X-ray depends on the density of the constituents in the sample and, therefore, the amount of the X-ray that reaches the detector varies with the sample orientation. For each full rotation, the sample is analyzed in small steps on the vertical axis, resulting in layer-wise voxel information of the density distribution. The detected images are transformed to slice images as shown in Figure 5 and to a three-dimensional geometrical representation of the sample.
μCT slice image of PPGF30.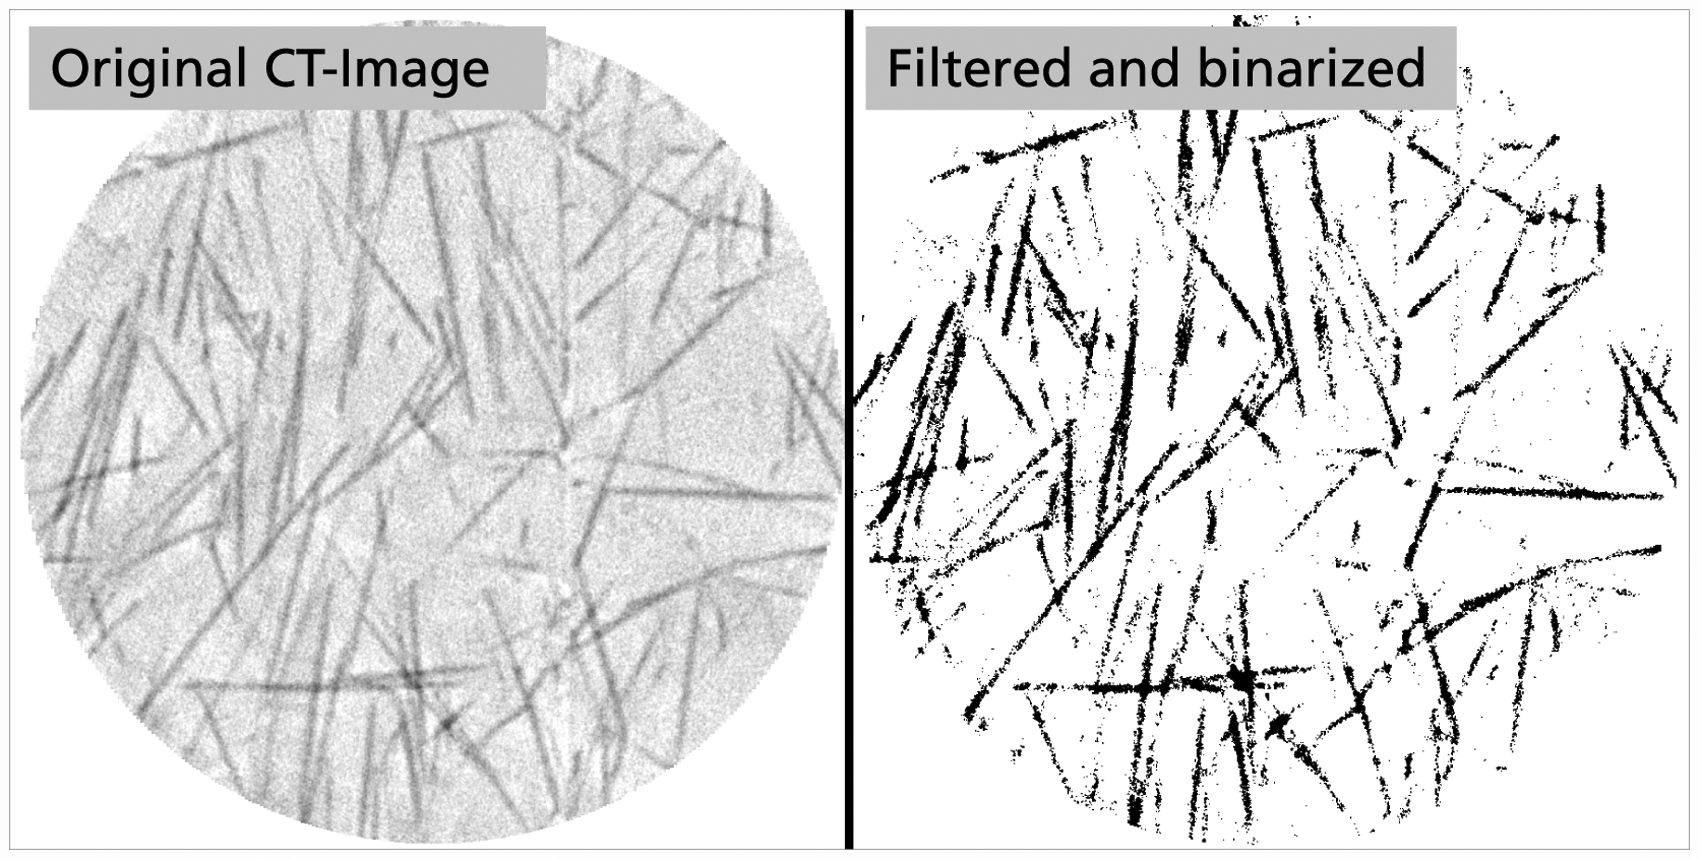
Evaluation of microstructure
With the new evaluation method, it is possible to determine the fiber length, the diameter, the orientation and the local position distributions by means of an iterative analysis of μCT images.
36
This analysis method is based on model assumptions considering geometrical and symmetrical properties of the fiber objects, such as a constant diameter and a small curvature without turning points. From these assumptions, heuristic approaches for the identification attempts of single fibers are derived. Furthermore, the model assumptions allow for assigning voxels of the μCT images to individual fibers in spite of the inherent image noise. As shown in Figure 6, the new approach consists of four functional units: in the image initialization phase, the μCT images are prepared for the evaluation process by means of filtering and binarization (see Figure 5). To achieve a reasonable binarization, the proper fiber volume fraction has to be defined. For the present work, the fiber volume fraction, known from the plate fabrication process, was confirmed by a thermogravimetric analysis. In the next step, the iterative Monte-Carlo pattern recognition process is started. Each of the parallel executed recognition processes evaluates integrals over a spherical region at random positions to identify centers of separate fiber sections.
36
After the identification of these fiber centers, first approximations of the fiber orientation
The algorithm was evaluated in three ways: first, artificially generated fiber data with three different lengths were mapped on a regular mesh, which correspond to a 3D voxel picture. The fiber positions were chosen randomly, however, the length and orientation were correlated. An analysis of this volume-image reveals an overestimation of the fiber length of up to 8% for the short fibers. Secondly, the polymer material of the composite was removed via combustion and the residual fibers were measured via microscope. Qualitatively, similar length distributions were found. Thirdly, a visual comparison of the volume-image and the detected fibers was undertaken. This confirmed visually the mentioned small overestimation of the fiber length. Additionally, the reproducibility of the algorithm was checked by repeated measurement of three different specimens. A standard deviation of the length of approximately 5% was found. Further details on the image analysis method and its properties can be found in Glöckner et al.
36
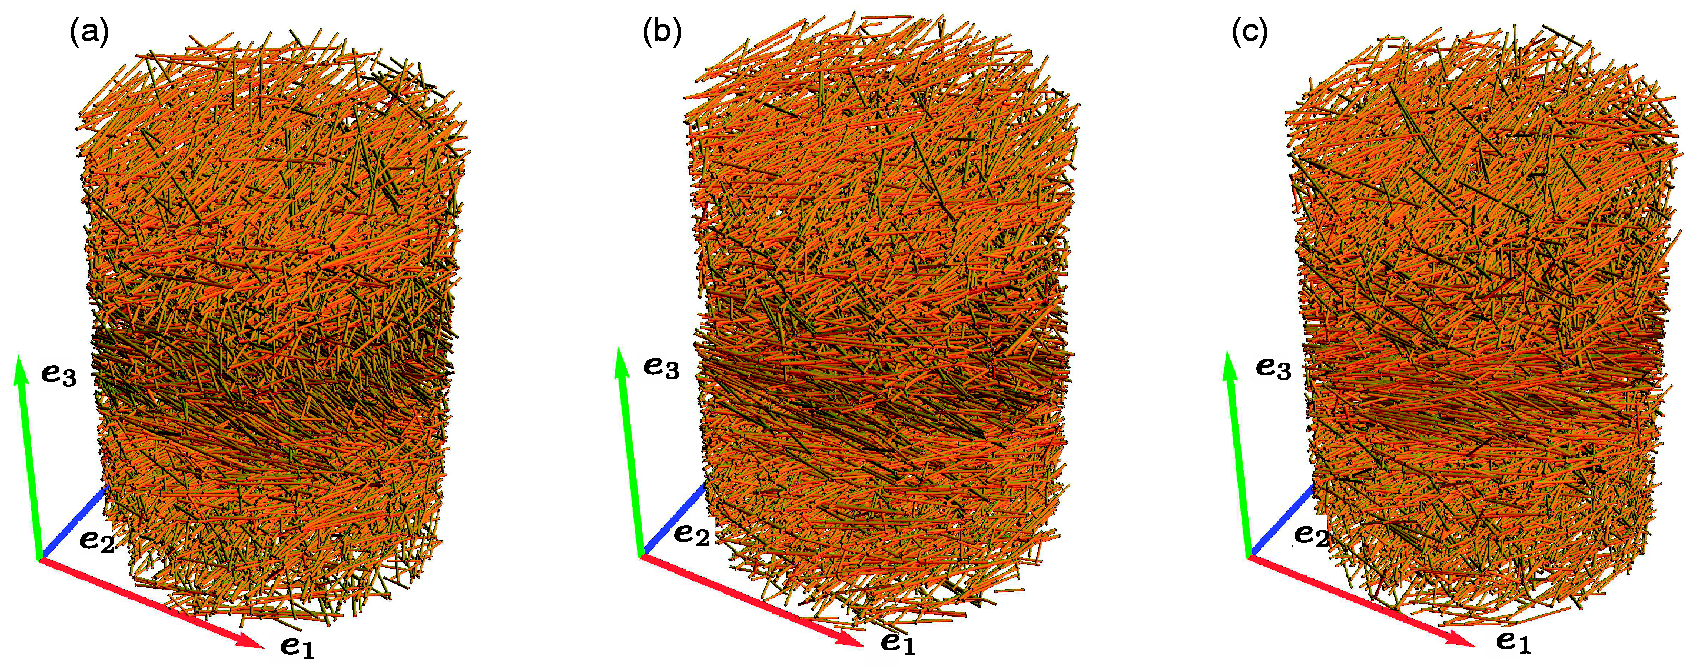
Fiber recognition process. Segmented μCT data for specimen at the positions (a) 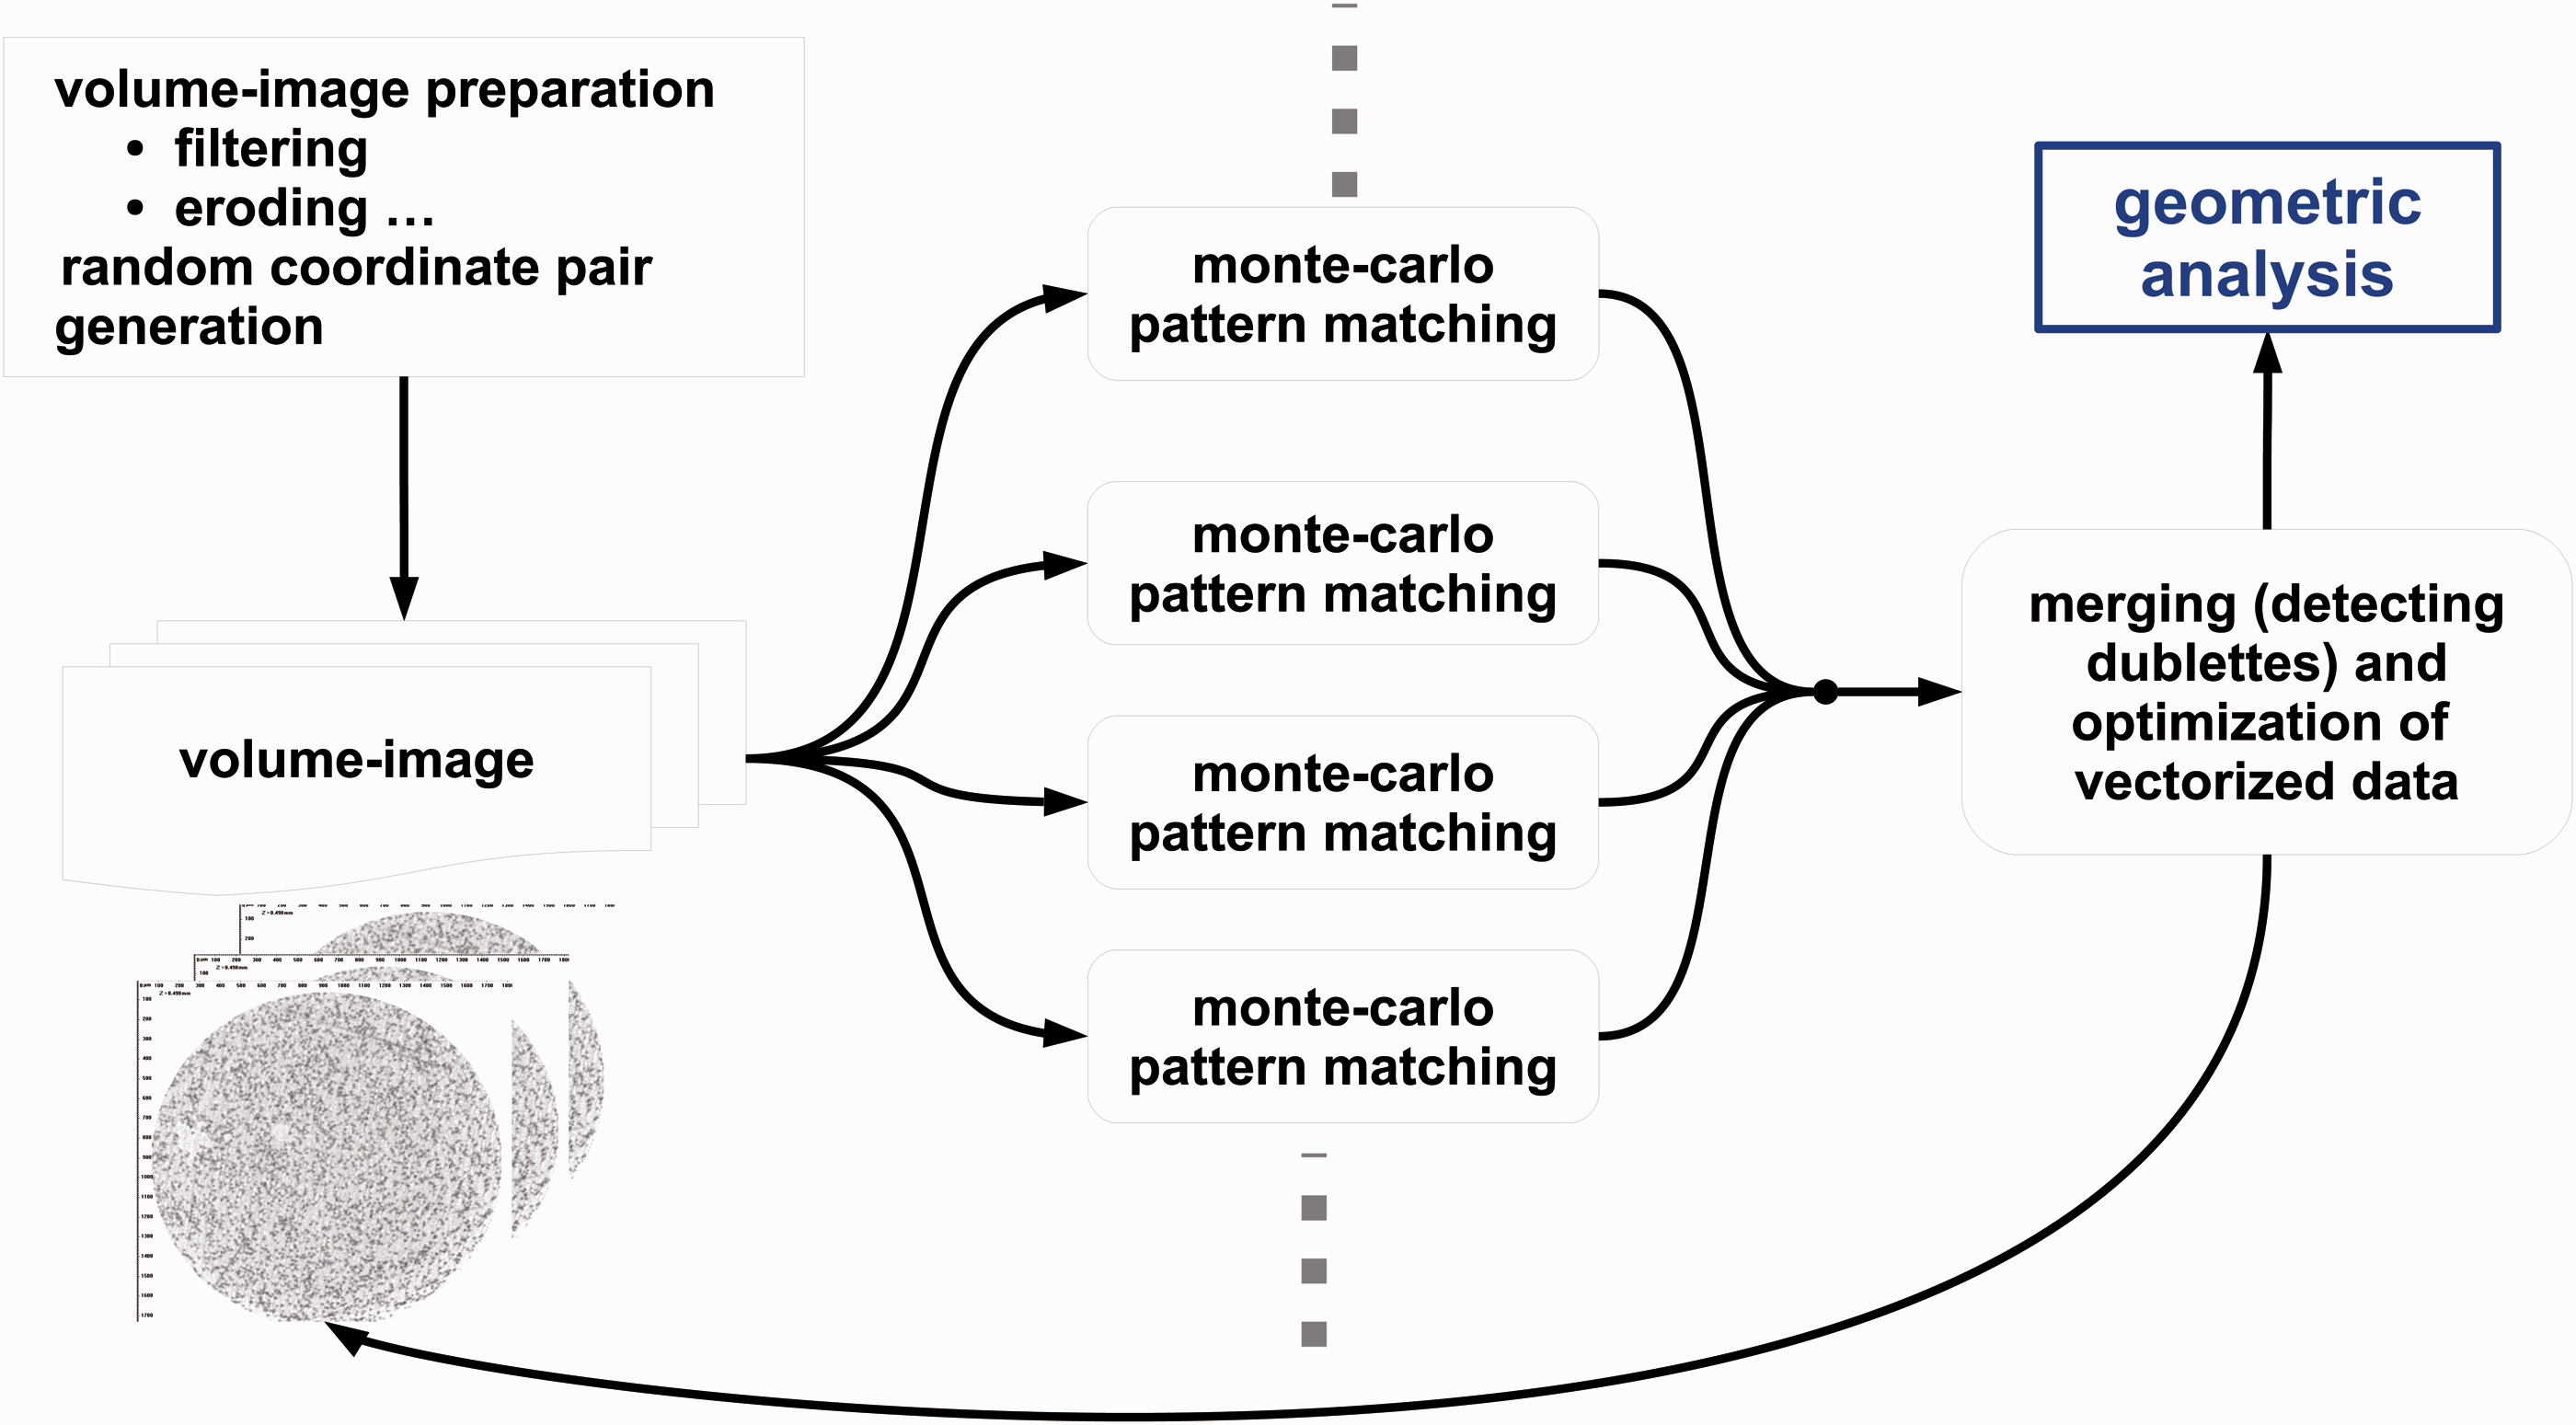
Properties of microstructure
In the reconstructions of the microstructure of the evaluated specimen shown in Figure 7, the characteristically graded mesostructure of injection-molded plates made of SFRCs can be recognized. This phenomenon is well known in the literature.
32
Since the segmented μCT data allow a detailed analysis of the properties of the microstructure, the μCT datasets were partitioned into 20 equal-sized layers in through-thickness direction of the plate. The mean aspect-ratio of the fibers 

In the last equation, (a), (d), and (g) Mean aspect ratio of the fibers in each layer 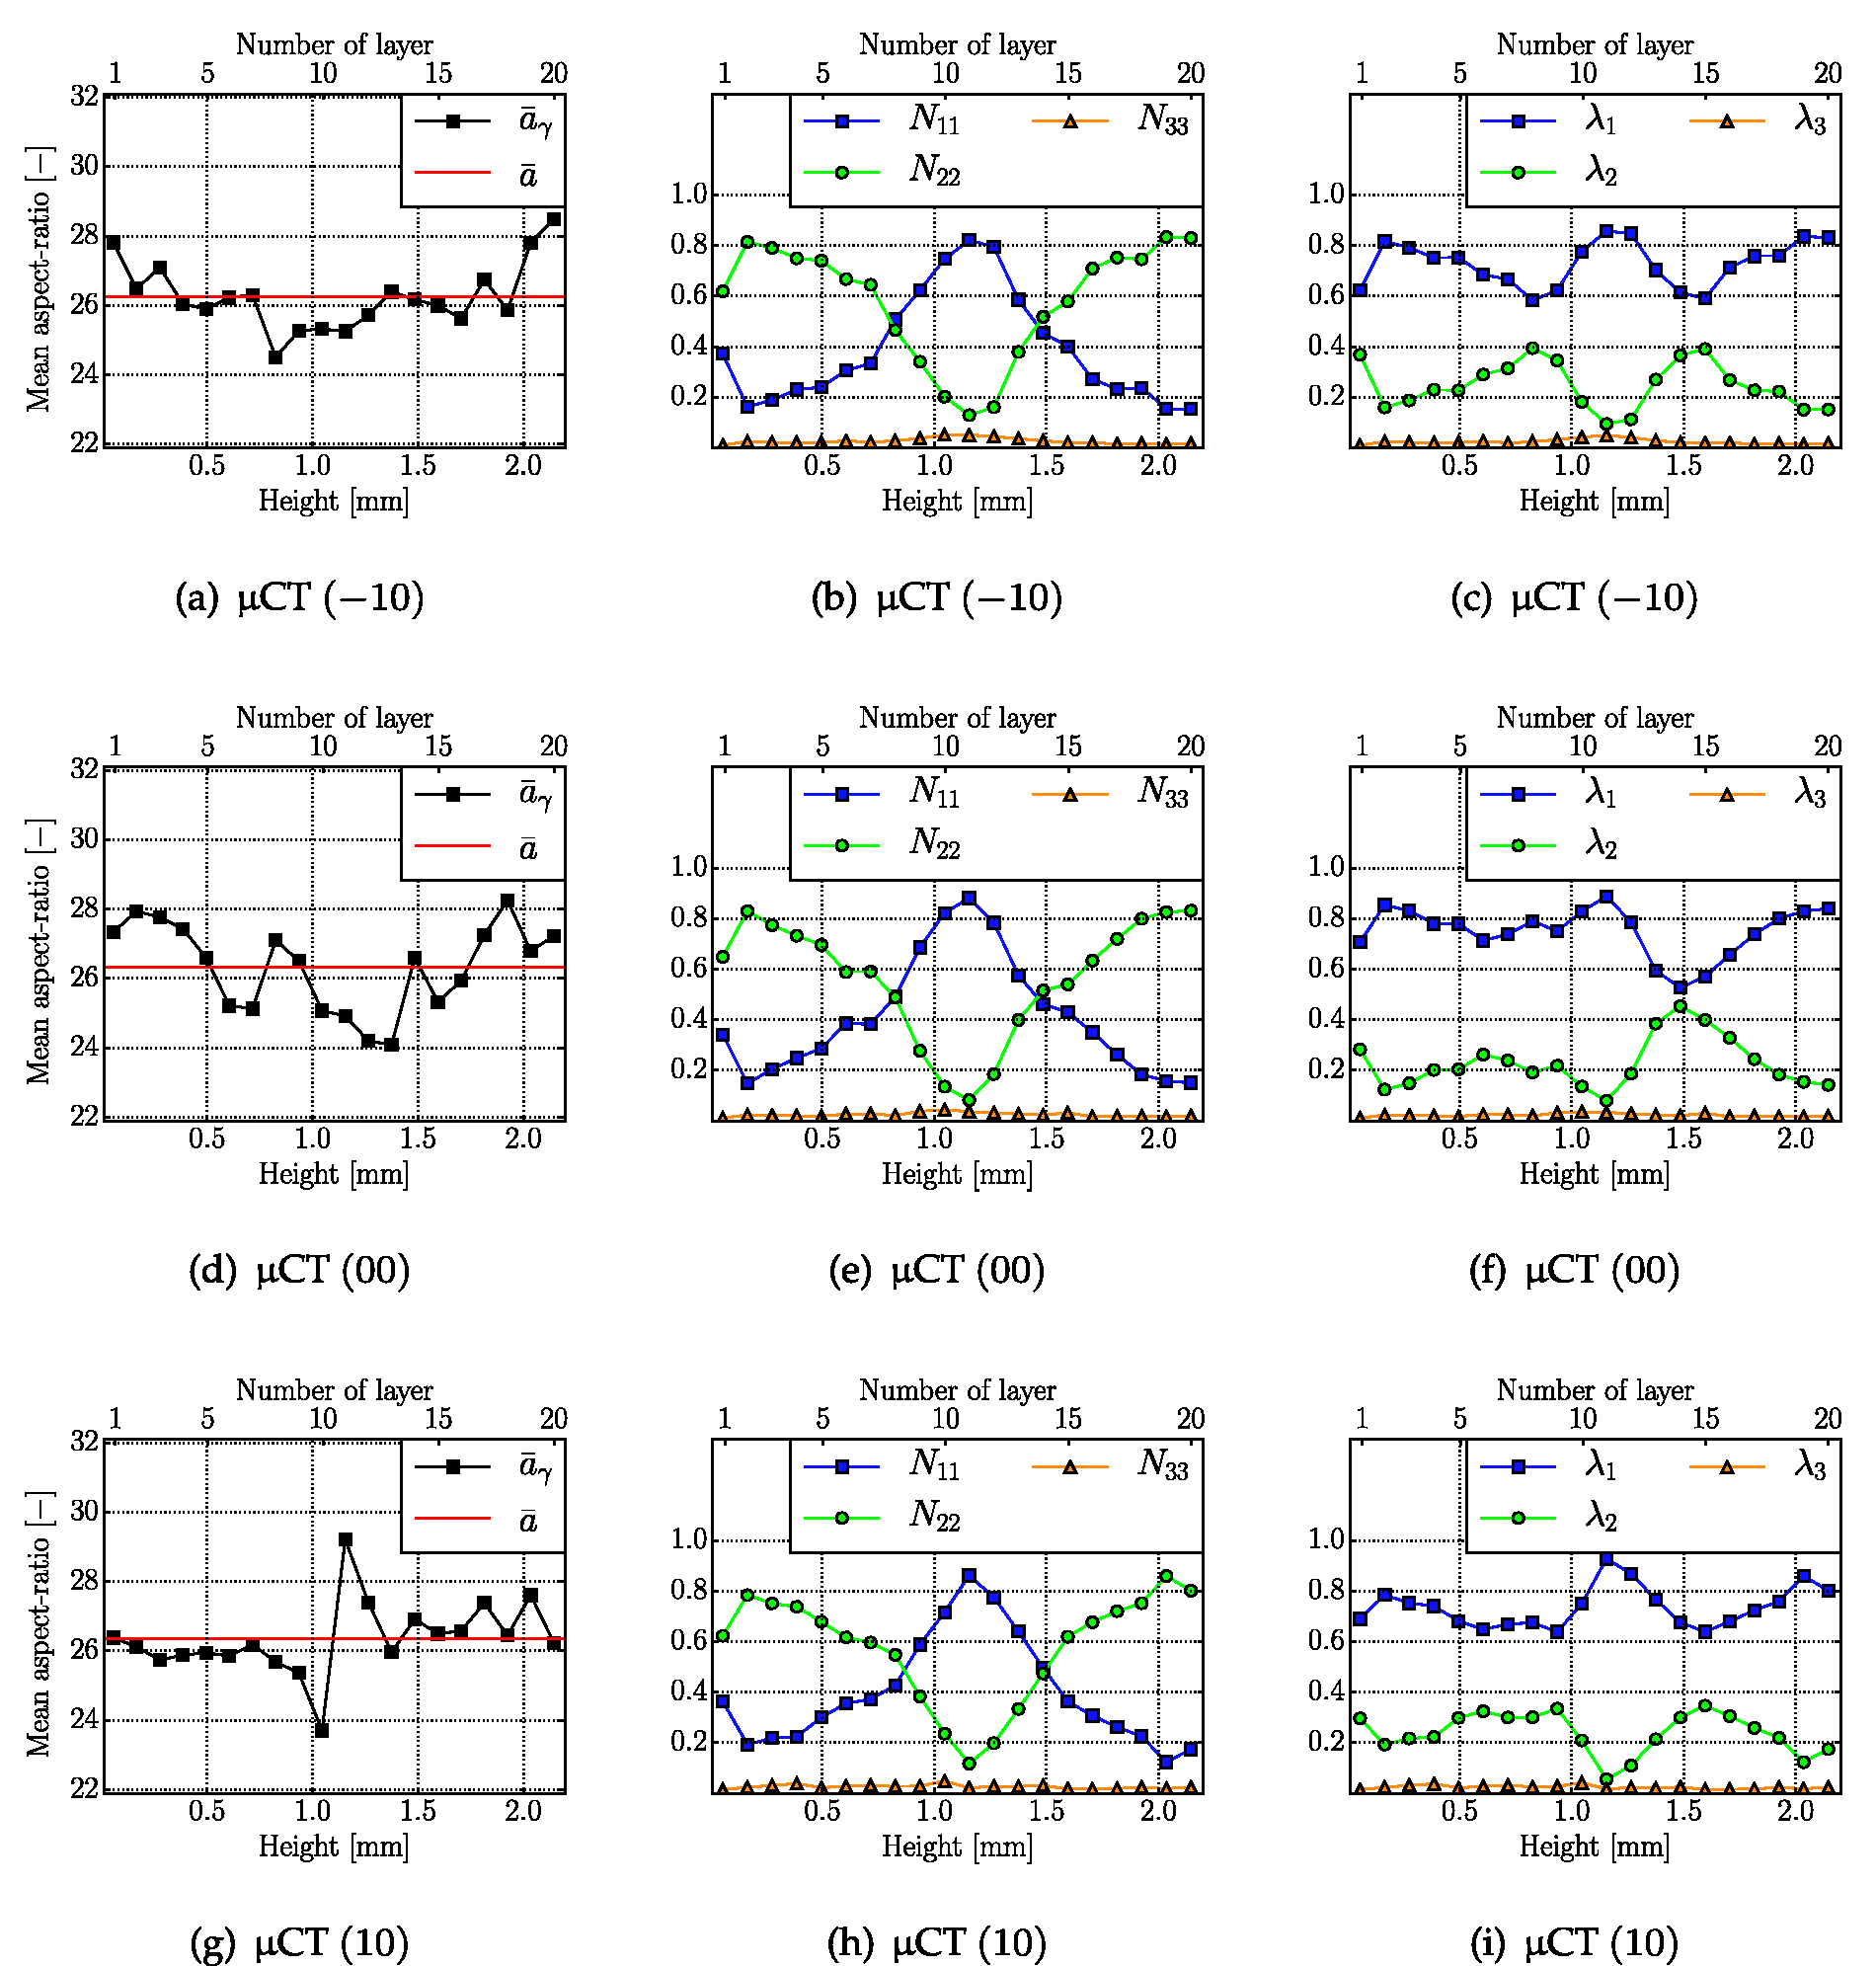
The fiber orientation distribution is also not constant throughout the thickness. In Figure 8(b), (e), and (h), the diagonal components N11, N22, and N33, and in Figure 8(c), (f), and (i), the eigenvalues of the fabric tensor
In the literature,39,40 the fiber orientation distribution is usually characterized only through the diagonal components N11, N22, and N33 of the second-order fabric tensor Pole figures for the layers 8, 11, and 14 of μCT data at position (00).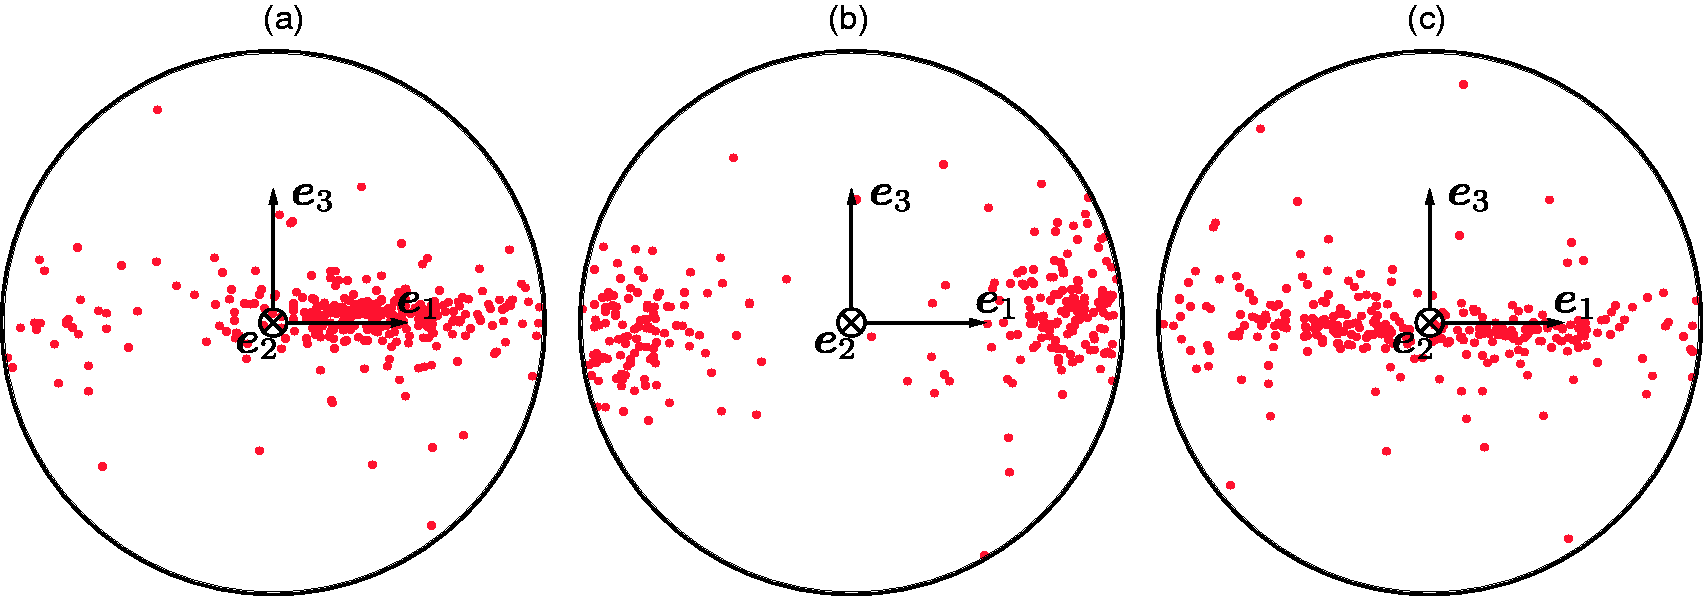
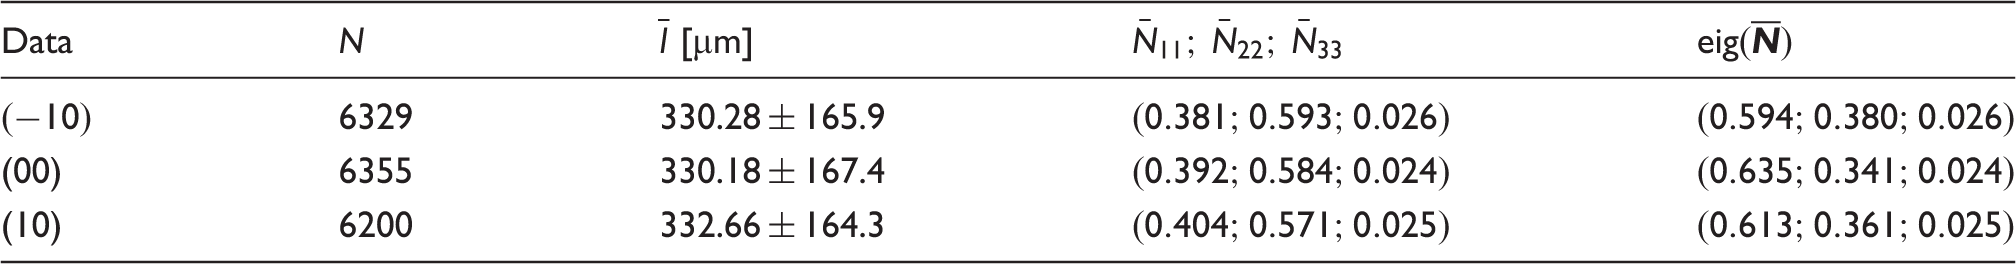
The stereographic projections of the entire segmented μCT data are shown in Figure 10. Since each μCT dataset contains more than 6000 fibers, continuous representations of the stereographic projections are shown. In all examples, the fiber orientation distribution is only approximately planar isotropic. There exists rather a preferred orientation different from the filling direction. This can be affiliated with the manufacturing process and the flow conditions during manufacturing. The mean length Stereographic projection of fiber axes for the μCT data Number of fibers, mean length with standard deviation, diagonal components and eigenvalues of 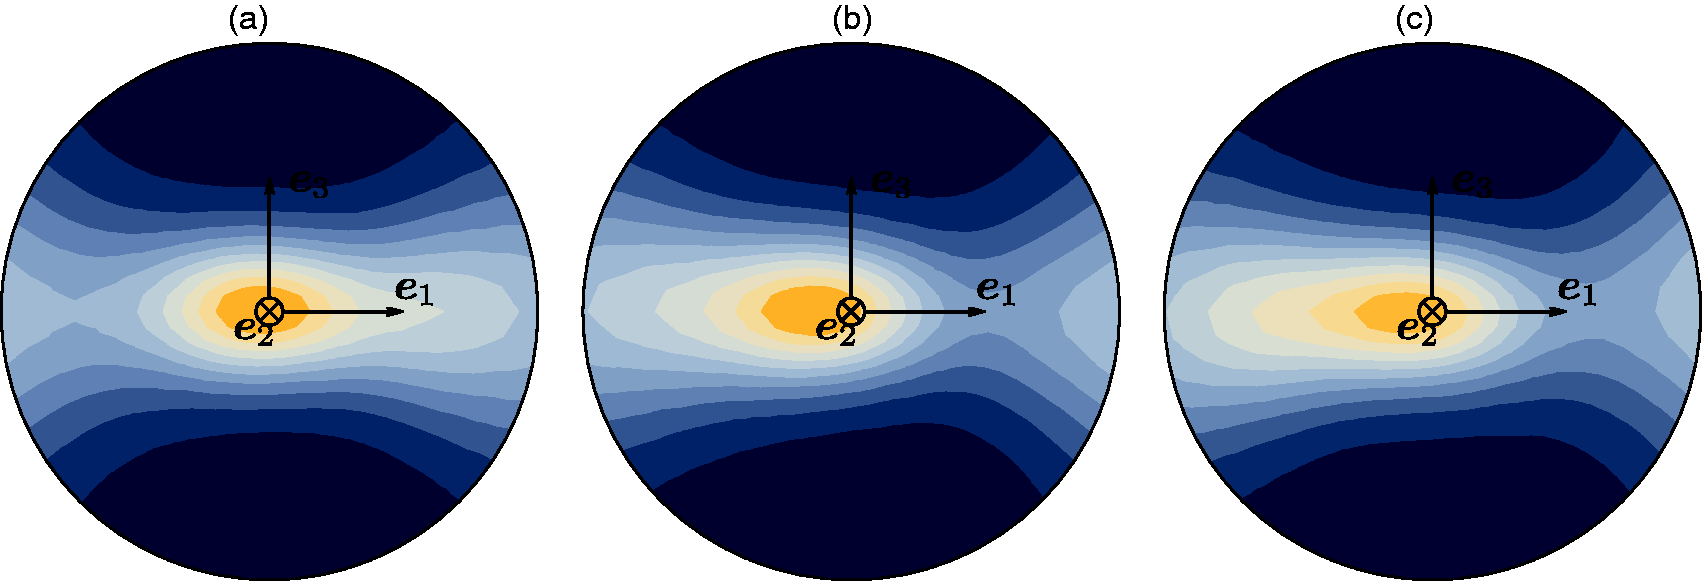
Homogenization of linear elastic properties
Modeling preliminaries
In the present work, the polymeric matrix and the arbitrarily oriented glass fibers are assumed to be linear elastic and isotropic with piecewise constant properties. The microstructure of this composite consists of a matrix reinforced with N fibers. The matrix phase is specified by the stiffness tensor Parametrization of the fiber axis 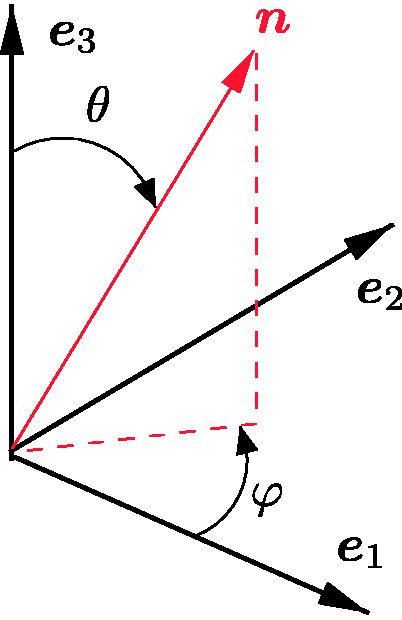
Self-consistent homogenization
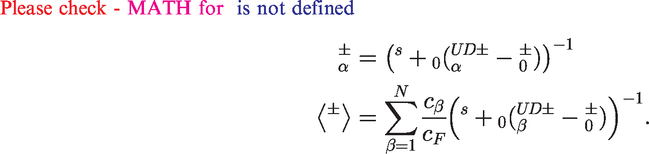
The effective stiffness tensor 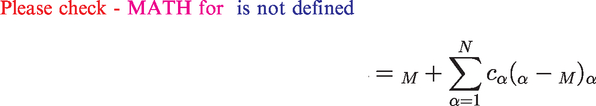
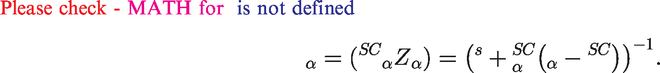
In this representation, the strain localization tensor 
In the last equation, 
Combining equations (5) and (6), and using the self-consistent approximation 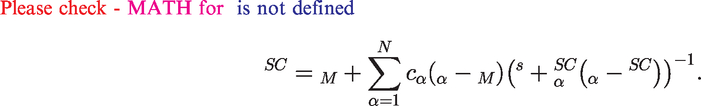
This implicit equation for the unknown tensorial quantity
Interaction direct derivative estimate
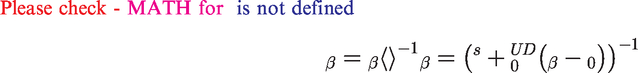
The interaction direct derivative (IDD) estimate, proposed by Zheng and Du 22 is based on the generalized self-consistent scheme 21 (GSCS), which for its part is based on the three-phase model. In the three-phase model, the inclusions are embedded in a finite matrix material region, directly. This inclusion-matrix cell itself is embedded in the unbounded initially unknown effective medium. The difference between the three-phase model and IDD can be identified in the estimation of the stresses in the inclusions: contrary to the three-phase model, Zheng and Du 22 assume an unbounded medium with the properties of the matrix for the embedding of the inclusion in the matrix material. Du and Zheng 43 have proven that the stresses in the inclusions are well approximated by this assumption with an error of second order of the inclusion volume fraction. The advantage of the IDD is its explicit structure, which is valid for multi-phase composites with different material symmetries and distributions.
The following prescription gives the IDD estimation of the properties of the effective medium

Particularly, if the distribution is constant for all inclusions (
A two-step bounding method
The SC and IDD approaches deliver estimates of the effective elastic properties. The two-step bounding method (TS) is a simple method providing an admissible range of possible effective properties. The first step consists of the decomposition of the microstructure into as many domains as there are different fibers. Fibers of equal shape and equal orientation are combined into unidirectional domains. In each domain, the fiber volume fraction corresponds to the total fiber volume fraction 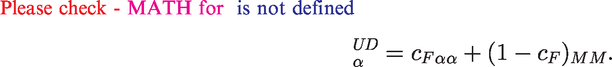
Within the second step, again HS bounds are calculated assuming an isotropic two-point correlation function for the domains.
47
Herein, corresponding bounds are combined: the lower (upper) HS bound of the domains is homogenized with the lower (upper) HS bound for the granular system. Thus, this procedure results in the stiffnesses tensors 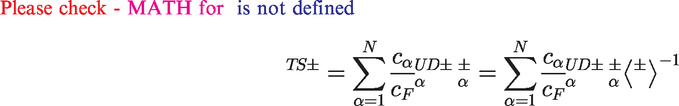
Results and discussion
The mean values of Young’s moduli and Poisson’s ratios of the isotropic polypropylene material in the strain region 0.0005–0.0025, as shown in Table 1, were used as input parameters for the homogenization of the composite. The fiber mass fraction is 30 wt.%, which corresponds to a fiber volume fraction of
Combining these data with the segmented μCT data, the effective elastic properties were calculated according to the methods described in the foregoing section. To compare the experimentally measured Young’s moduli to the computational results, for each homogenized stiffness, the direction-dependent Young’s modulus
48
In combination with the direction-dependent bulk modulus 
In the following first, the numerical results based on the three segmented μCT datasets are compared to each other, and second, the numerical estimations are compared to the experimentally measured Young’s moduli. In Figure 12, the contours of the direction-dependent Young’s moduli in the x–y plane are shown in dependence of the azimuthal angle as depicted in Figure 11. It can be seen that the SC and IDD estimates are located between the bounding TS results for all three datasets. SC predicts a stiffer behavior than IDD. The direction-dependence of Young’s modulus is more pronounced by SC and IDD than by the TS methods. The TS bounding methods exhibit a rather large range of admissible Young’s moduli. Furthermore, in Figure 12, it can be observed that the direction-dependence of Young’s moduli is very similar for the (00) and the (10) data, see Figure 12(b) and Figure 12(c). The data at the position Comparison of numerical Young’s moduli for the three μCT datasets.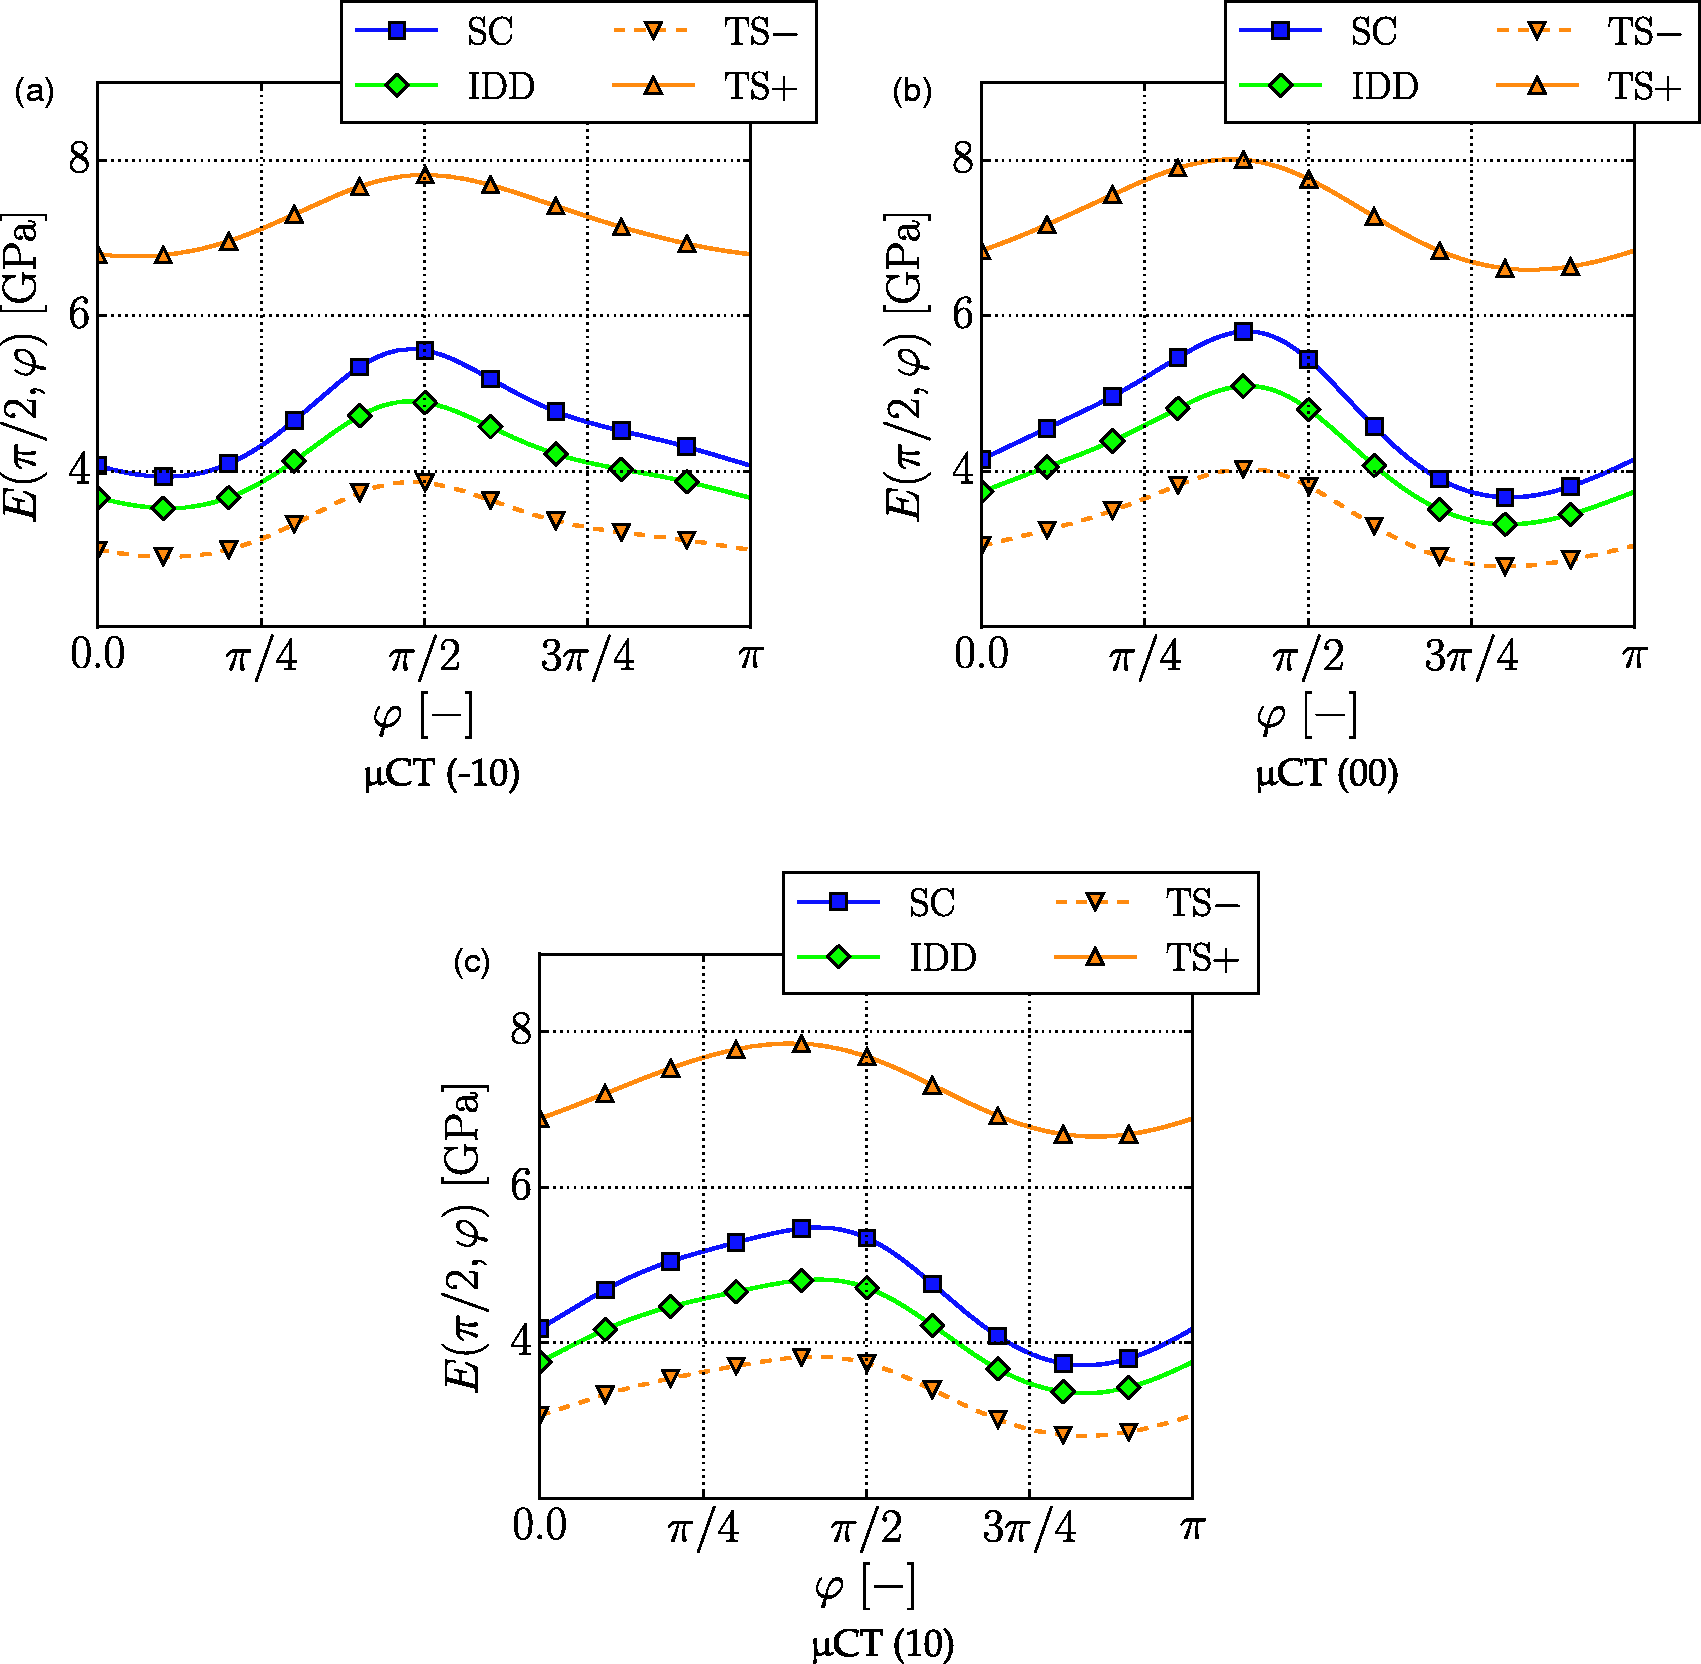
Since the volume element analyzed with the μCT measurements is small compared to the size of the tensile specimen, the three μCT datasets are combined to an overall dataset for the comparison of the numerical and experimental results. In Figure 13, the shapes of the direction-dependent Young’s moduli are shown on the x1–x3, x2–x3 and x1–x2 plane for the overall data. As the specimens for the tensile test were prepared in the x1–x2 plane, the experimental results are added to Figure 13(c). It can be observed that the direction-dependent Young’s modulus of the overall data exhibits a defined symmetry in the x1–x3 and the x2–x3 plane. In the x1–x2 plane, no characteristic symmetry is obvious. In Table 3, the experimental and the numerical results for all homogenization methods for the overall data are given.
Orientation dependence of Young’s modulus in the (a) x1–x3 plane, (b) x2–x3 plane and (c) x1–x2 plane for the overall data. Comparison of experimental and numerical Young’s modulus 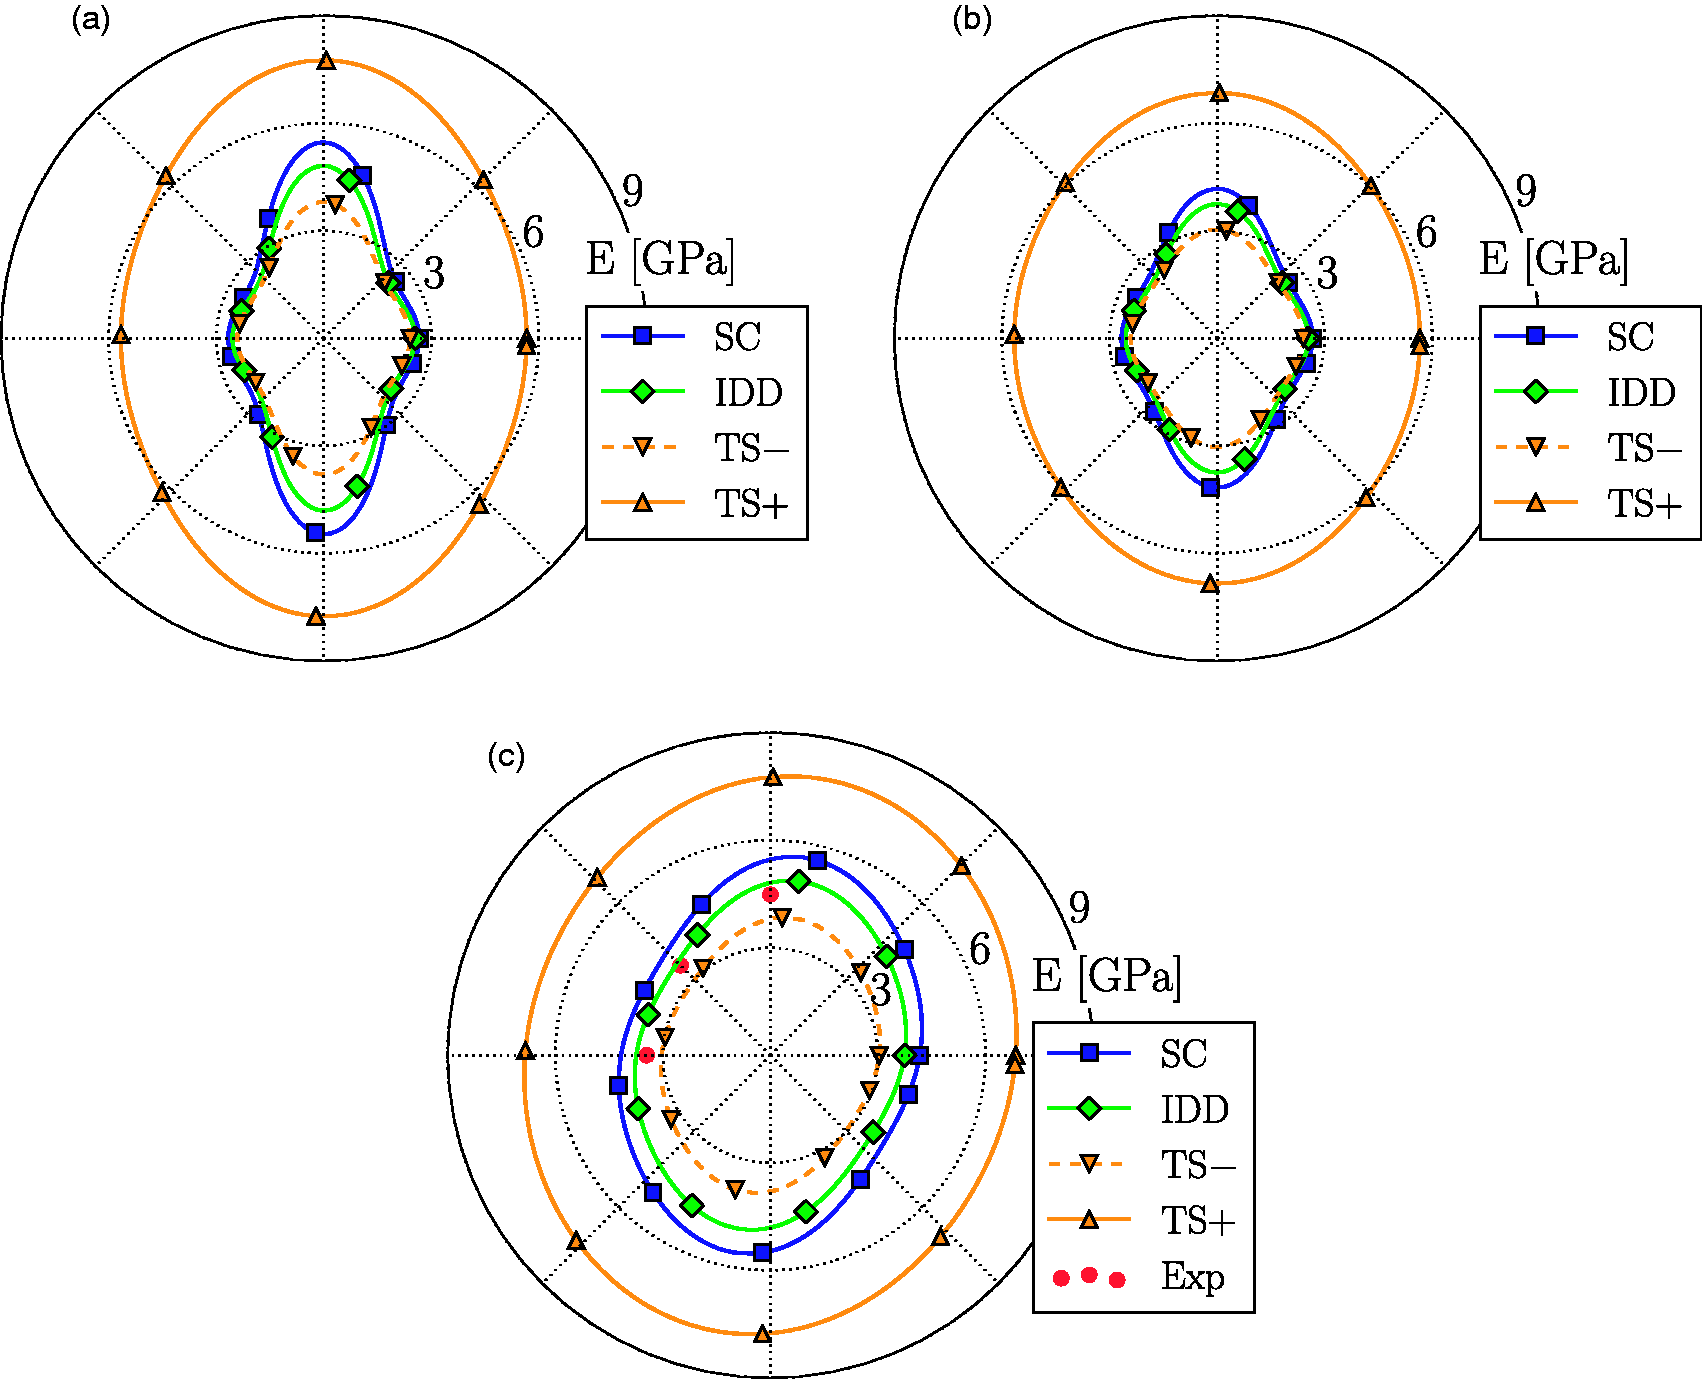
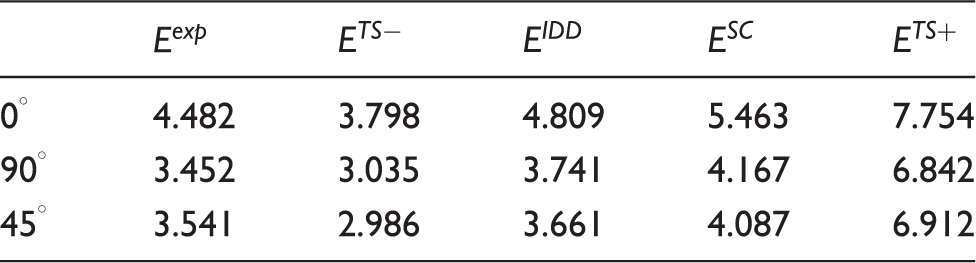
In addition to the qualitative evaluation of the numerical results compared to experimental measurements in Figure 13 and Table 3, it is interesting to notice that the predicted anisotropy of the direction-dependent Young’s modulus essentially depends on the homogenization procedure. Especially, the upper bound of the two-step approach does not represent the anisotropy accurately. It predicts a rather isotropic material behavior.
To observe this more quantitatively, the ratios Anisotropy ratios of Young’s modulus for the overall μCT data.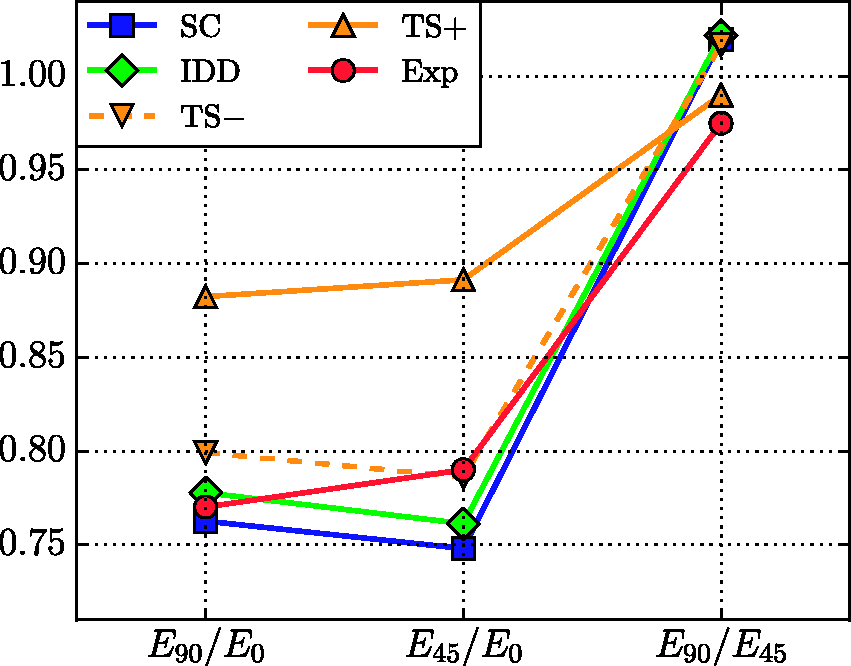
The TS methods predict a smaller anisotropy for
Summary and conclusions
The present paper discusses the examination of the thermoplastic composite PPGF30 through tensile tests in three different directions, and its microstructure through μCT measurements in combination with a stochastic fiber analysis approach. The microstructure was analyzed by means of the resulting segmented μCT data. Three different mean field homogenization methods were applied to estimate the effective elastic properties directly based on segmented microstructural data.
Relying on the experimental and numerical results, the following conclusions can be made:
Anisotropy: The evaluated injection-molded SFRC specimens show an anisotropic material behavior. The experiments in different directions indicate the importance of attaining detailed knowledge of the microstructure in order to dimension parts made of such a material. Inhomogeneity: Important properties of the microstructure, like the fiber orientation distribution and fiber length distribution, can be analyzed by using the segmented μCT data. Thus, a layer-wise analysis reveals the dependence of these properties on the position in the specimen. Thereby, a more accurate observation of the microstructure of SFRCs is possible. Microstructural information: All presented mean field homogenization approaches consider the segmented μCT data and take advantage of the information about the distribution of the fiber axes, fiber lengths and fiber radii. Two-step homogenization: In order to get an admissible range for the effective properties, two-step bounding methods have been applied: In the first step, the Hashin–Shtrikman bounds for unidirectional aligned fiber domains and, in the second step, the Hashin–Shtrikman bounds for granular systems have been calculated. SC and IDD estimates: Both methods, SC and IDD, allow for a direct consideration of the segmented μCT data. IDD uses the matrix material as reference material. SC is an implicit approach using the effective properties as reference material. In addition to the shape, the orientation, and the material properties, IDD accounts for a statistical description of the distribution of the inclusions. Here, a spheroidal distribution equal to the shape of the spheroidal approximation of the fibers has been used. Experimental vs numerical results: The self-consistent homogenization method delivers a stiffer material behavior compared to experimental measurements. Due to the inherent characteristics of the SC approach,49,50 this method tends to overestimate the elastic properties for the case of hard inclusions embedded in a soft matrix similar to the problem at hand. The Young’s modulus values predicted by IDD are located between the lower TS bounds and SC. Like SC, this approach delivers also a stiffer material behavior compared to experiments. The IDD predictions of the Young’s modulus values show the closest agreement with experimental measurements. In terms of the anisotropy ratios, SC and IDD show similar trends. Both methods predict a close agreement with experiments for
The present investigation shows the modeling of the elastic behavior of SFRCs, using homogenization techniques in combination with detailed microstructural data from a micro-computer tomography image analysis method. The homogenization results demonstrate the need of realistic microstructural data for the simulation of parts made of SFRCs. In engineering practice, the fiber configuration of complex SFRC components is derived from injection molding simulations. Further investigations should, thus, be dedicated to the validation of these simulations, taking advantage of the new possibility of extracting detailed μCT fiber information from real parts. Additionally, further experimental measurements like bending tests should reveal properties of the composite material, which are due to the inhomogeneous fiber orientation distribution in through-thickness direction.
Footnotes
Funding and Acknowledgment
The research documented in this manuscript was partially initiated by the German-Canadian research group “Integrated engineering of continuous-discontinuous long fiber reinforced polymer structures”. The support of the Institute of Engineering Mechanics at KIT by the German Research Foundation (DFG) is gratefully acknowledged.
Conflict of interest
None declared.