
Abstract
This paper presents an approach to defect detection and characterisation in ultrasonic inspection of laminate composite panels. A set of features coupled with gates was identified along with a method for sub-dividing and thresholding the ultrasonic data, which removes most of the location specific information from the defect data thus increasing the generalisation capabilities of the defect classifier. Validation results obtained from independent defect data indicate that the performance of the presented data description tools coupled with an artificial neural network classifier was able to correctly locate and classify defects at different depths. It was concluded that a structured approach to the pre-processing of ultrasonic testing data, combined with the selective feature extraction for artificial neural network classification, greatly reduces the requirement for artificial neural network training data. Furthermore, it allows for improved performance across a variety of panel geometries.
Keywords
Introduction
A large number of multi-layered composite structures exist in practice. These include fibre-reinforced composite materials, aircraft structures, biological tissues, thin films, modern electronic systems and semiconductors. 1 Composite materials have found an increasing number of applications 2 due to a combination of low weight, high strength and stiffness. This is predominantly so in aircraft structures as the weight reductions result in reduced running costs and greater payloads. 3 A constraint in large-scale composite use relates to the inspection for component integrity. 4 Besides, the main problem is high attenuation of the ultrasonic signal due to scattering and multiple reflections inside the material caused by different acoustic impedance of the layers or plies or resin/adhesives placed between the layers. 5 Hence, several researchers proposed that non-destructive examination is particularly suitable for this purpose, as the composite may vary in composition from point to point and removal of samples for destructive analysis would be neither permissible nor particularly useful.6–11
Of all the techniques available for non-destructive testing (NDT), ultrasonic testing (UT) has shown itself to be one of the most versatile and informative.4,12 Composite structures offer several unique challenges for UT over metals, most noticeably, high signal attenuation and strong ply/resin boundary reflections. The unique properties of laminar composite materials include a reasonably well-defined material structure leading to an almost discrete set of defect locations particularly for foreign objects (FOs) which occur in the resin bonding layer between plys. This layered structure can be exploited in the development of a defect classifier so that the type and location of defects can be determined using a minimal set of classifier calculations. Also, the data gates allow a trained artificial neural network (ANN) classifier to inspect any similar composite panel regardless of thickness. 1
Teti and Alberti 10 investigated ultrasonic non-destructive evaluation of defects in carbon-fibre-reinforced plastic laminates, displaying different quality levels according to their fabrication cycle. UT, mechanical testing and structural examinations were carried out to quantitatively characterise the carbon-fibre-reinforced plastic laminates and their quality. 10 D’orazio et al. 11 addressed the problem of automatic inspection of composite materials using an ultrasonic technique. The authors developed a normalisation procedure to suppress with a uniform step the samples which are under a selected threshold value. 11 Consequently, an evaluation was made of the number of signal points that have to be eliminated to reduce the signal length to that obtained from a minimum ply thickness. The reduced signal maintains the same shape and peak as the original signal. 11 Diamanti et al. 13 presented a method for detecting impact damage and repair-based cracks in composite materials using low-frequency Lamb waves that is only effective in plates for structure breakages. In this research, the authors were able to detect and locate defects of critical size (3–20 mm). 13
Automated signal classification is becoming increasingly popular in many commercial applications, including non-destructive evaluation. Over the past few decades, a substantial interest in the development of feature extraction techniques has been kindled largely by the requirement for addressing pattern recognition, defect detection and image processing problems, where features constitute inputs to a classifier. Selecting features that can effectively classify patterns is often a non-trivial task in many applications. 14 Once a set of optimal features are chosen, a suitable classifier is used to classify the signals. ANNs have been studied extensively in the literature15,16 and shown to perform well in many ultrasonic NDT classification problems.11,17–22 Two significant issues with ANN for defect detection and classification are data preparation and generalisation. Data preparation includes ultrasonic signal processing and feature extraction. 23 Generalisation refers to achieving performance in situations not specifically trained for, such as variation in defect depth within the composite panel being inspected.
This research attempts to address the problem of detecting and classifying FO type defects within multiple laminate carbon-fibre-reinforced polymer (CFRP) structures. In validating the proposed approach, the defect depth, number of defects within a single component and panel thickness of the test panels were varied from the situations presented to the classifier at training.
Panel preparation and data acquisition
In this research, two carbon-fibre-reinforced polymer panels were analysed. Both panels were made of CYCOM 970 fabric with a nominal ply thickness of 0.22 mm. Each panel contained three sections of 2 mm (9 plys), 4 mm (19 plys) and 6 mm (28 plys) with a step transition between each section. Both panels contained two types of FOs, a bonding Mylar 4MMFR2-36 film of thickness 0.002′′ and a non-bonding Teflon Airtech A4000R film of thickness 0.001′′. The first panel, which was referred to as the ‘Simple’ panel, was 300 × 175 mm. It contained defects after first ply, in the middle of the panel and before the last ply. Each of the three sections was similar in terms of defect layout and the schematic for the 2-mm-thick section was included in Figure 1(a). The second panel, referred to as the ‘Complex’ panel, was 520 × 350 mm in size. Some FOs were placed at the same depths of those in the simple panel. Other FOs were overlapping or included at different depths within the panel from the three depths previously stated. The schematic of the 2-mm-thick section was included in Figure 1(b).
Panel schematics showing defect depth, type and location information. P1-4 mm (left) and P1.4-2.2 mm (right), BO: bonding defect type; NB: non-bonding defect type.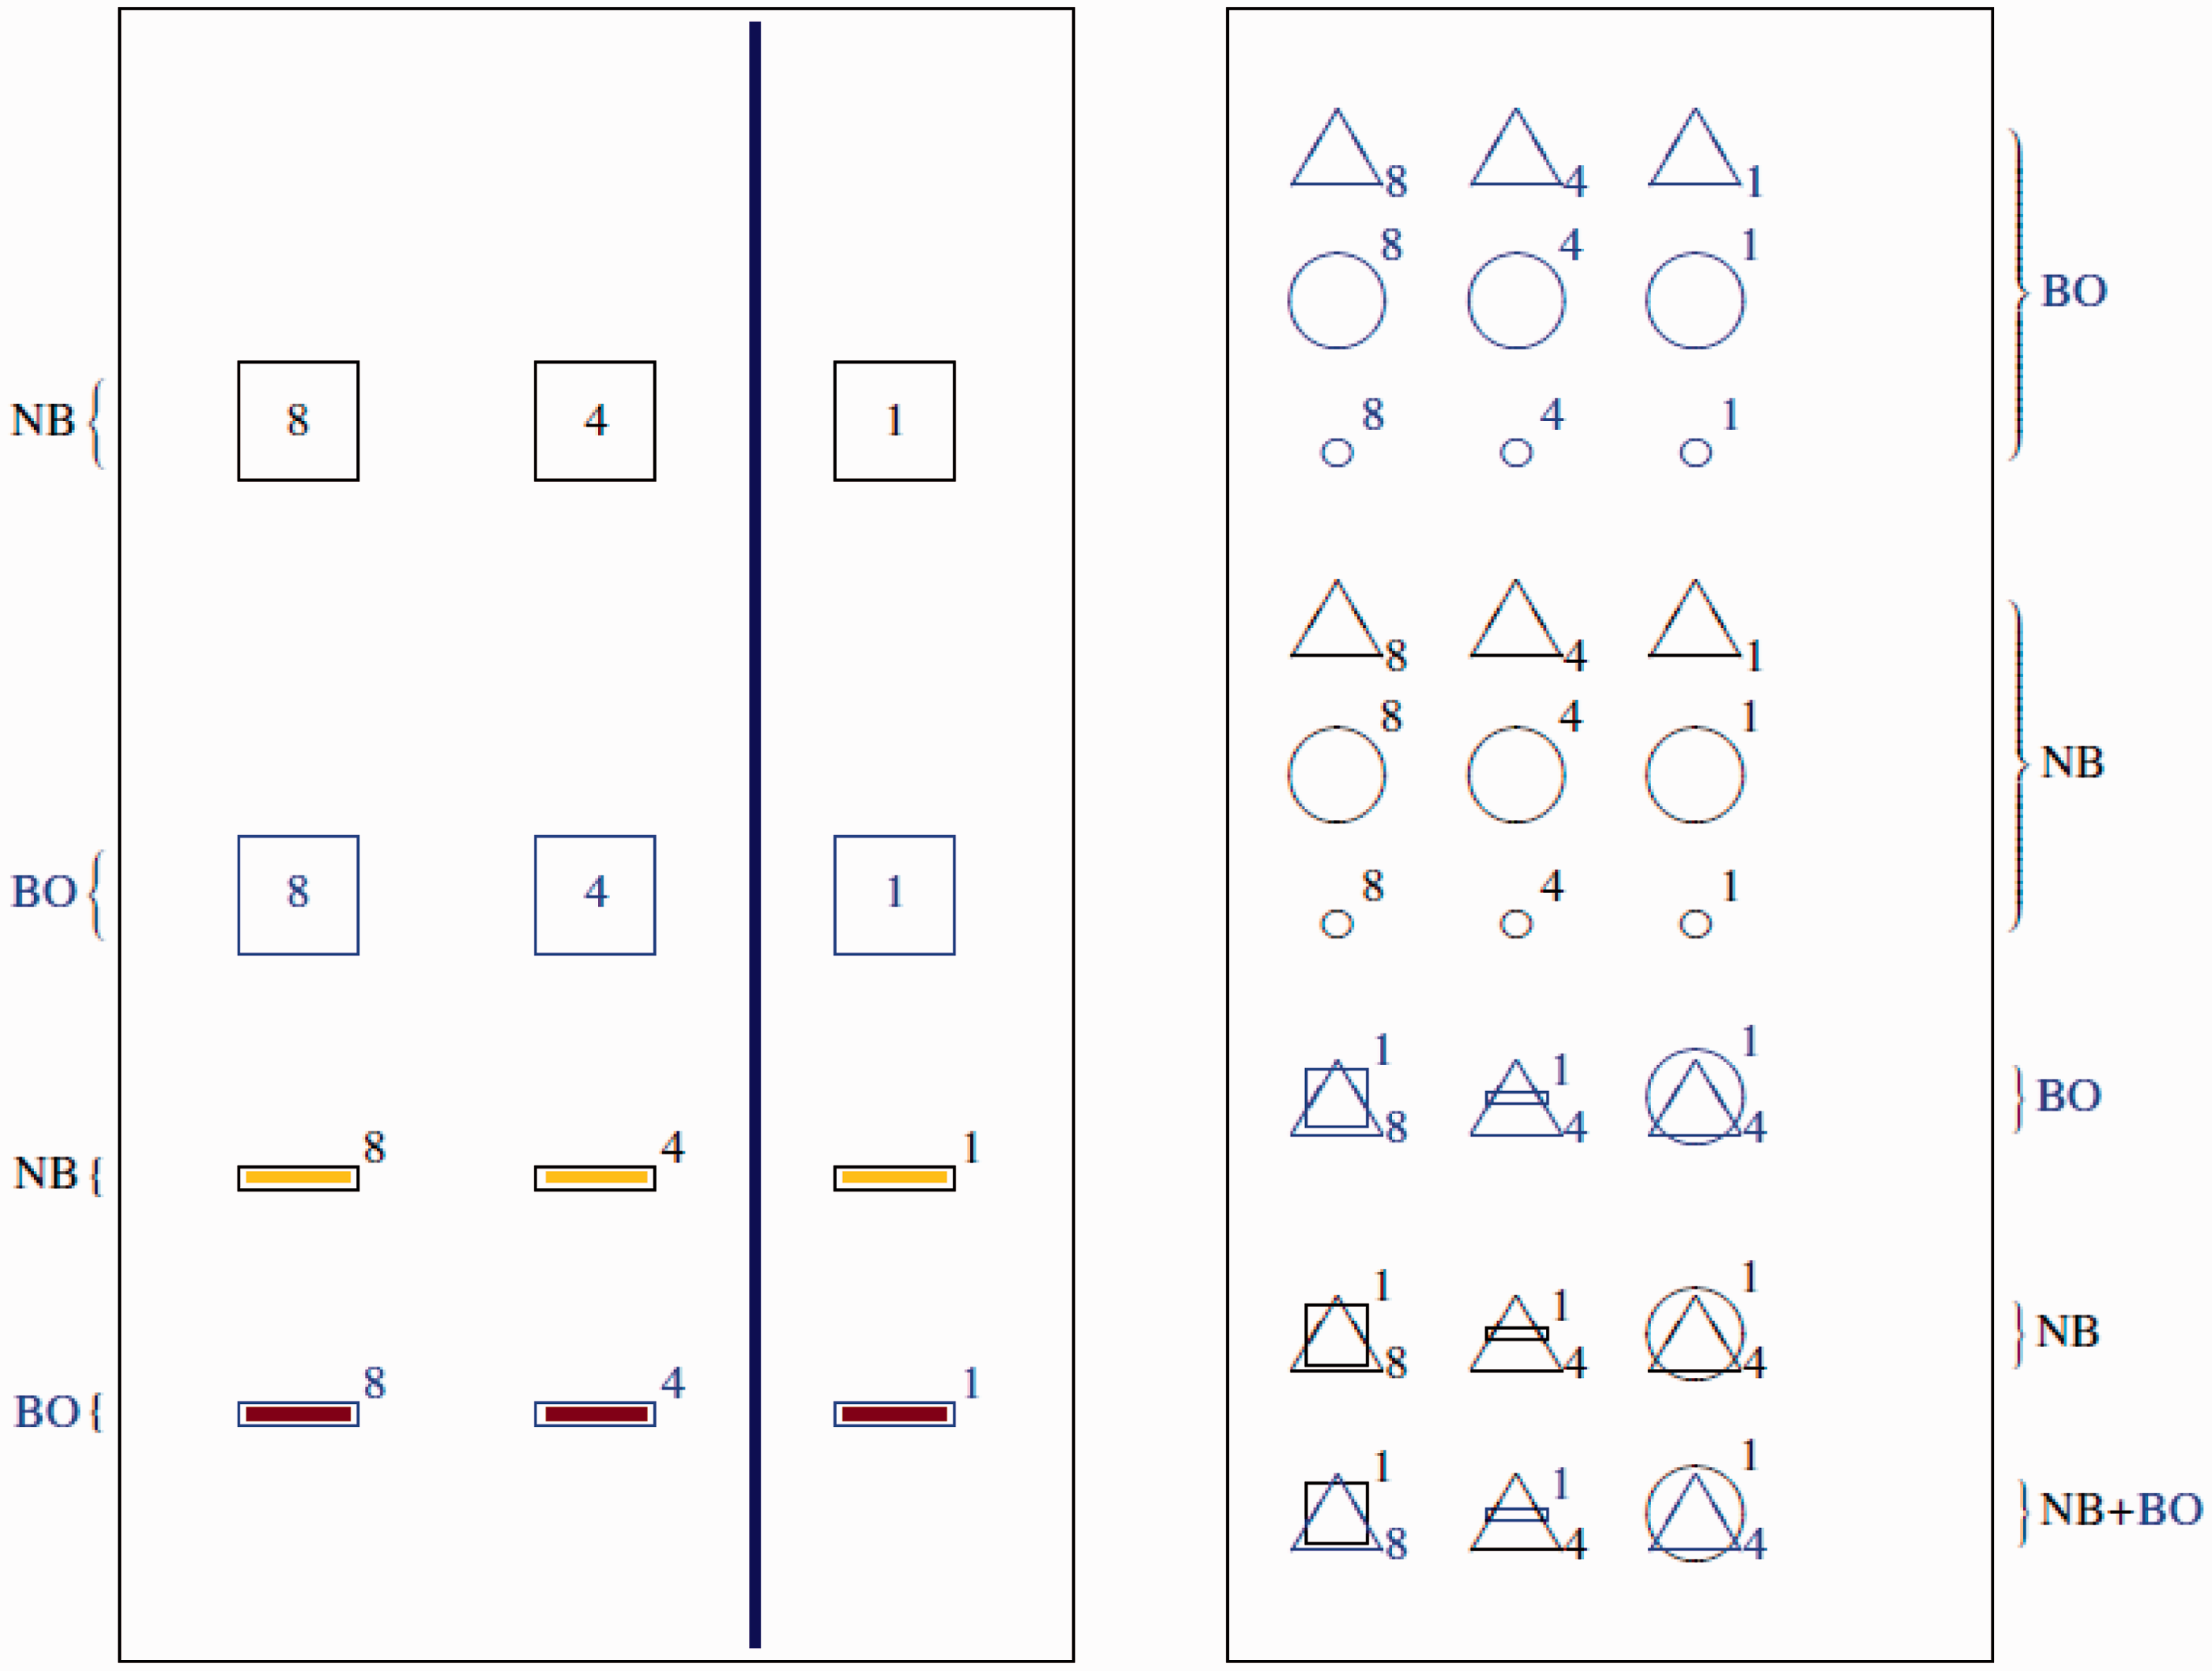
The ultrasonic scanning apparatus consisted of a 5-MHz, 0.25′′ diameter focussed transducer operating in pulse-echo mode in a water tank. Scanning was performed in incremental steps of 0.5 mm resulting in defect coverage of a factor of 12 scans within the diameter of the probe. The panel data presented here was scanned merely on the tool side of the panels. Each set of panel data was further sub-divided due to computer memory limitations. The simple panel data were reduced by 75% as only every second point in both the vertical and horizontal directions was kept as illustrated in Figure 2(a) and the complex panel data were physically larger and so every third point was kept, as shown in Figure 2(b).
Down-sampling grid for (a) simple panel and (b) complex panel. A-scans kept during down-sampling marked with ✓.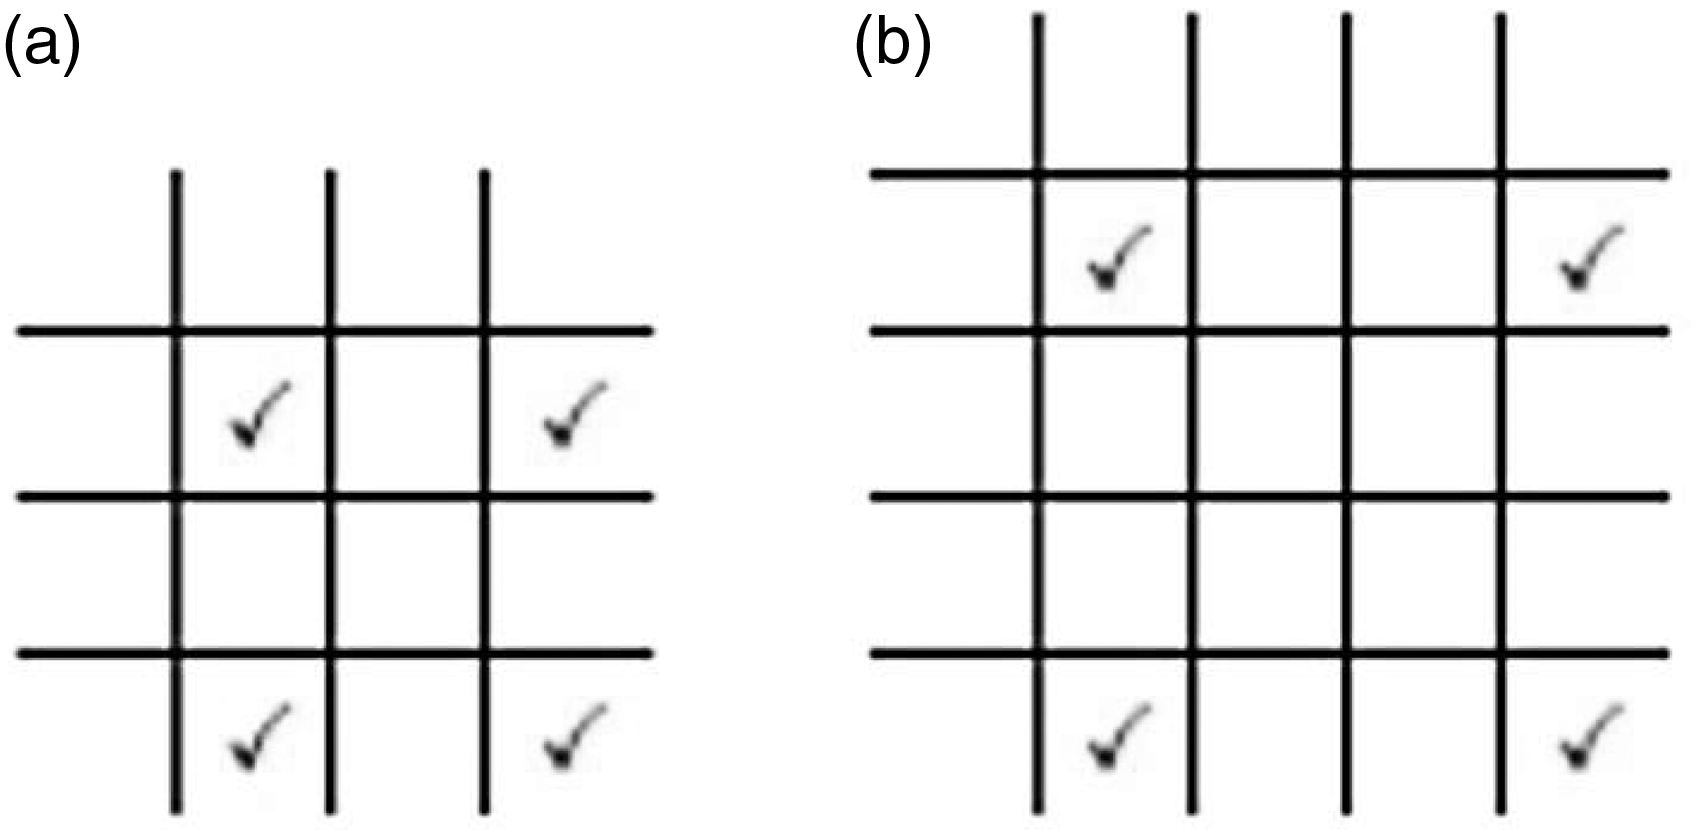
The ultrasonic data were recorded using the UT win software package at a rate of 50 MHz, and the system gain was set so that the front wall echo (FWE) displayed no clipping or saturation. Distance Amplitude Correction (DAC) was disabled in the software as was FWE synchronisation.
Methodology
To assist with the analysis, synchronisation of the ultrasonic data at the FWE was performed using peak detection of the smoothed ultrasonic signal. Smoothing of the A-Scan signal assisted in reducing the number of peaks while identifying the key echoes. The optimum smoothing filter was determined from the following set: uniform filter, triangular filter, Gaussian distribution filter, square of the triangular filter, square root of the triangular filter and decaying exponential filter. The width of each filter was applied and tested on the range of width from one to half of the A-Scan width. All the filters were normalised so that the area under the filter summed to one. Two performance metrics were used to measure the quality of the smoothed A-Scans, percentage reduction in the number of peaks and the absolute difference between the smoothed and original signal. The optimal filter was the one which produced the fewest peaks whilst maintaining the greatest similarity to the original signal. Figure 3 shows the performance for each filter on the 2 mm panel data. Based on these investigations, the triangular filter with width nine was used.
Performance matrices for smoothing of 2-mm-thick sample panel.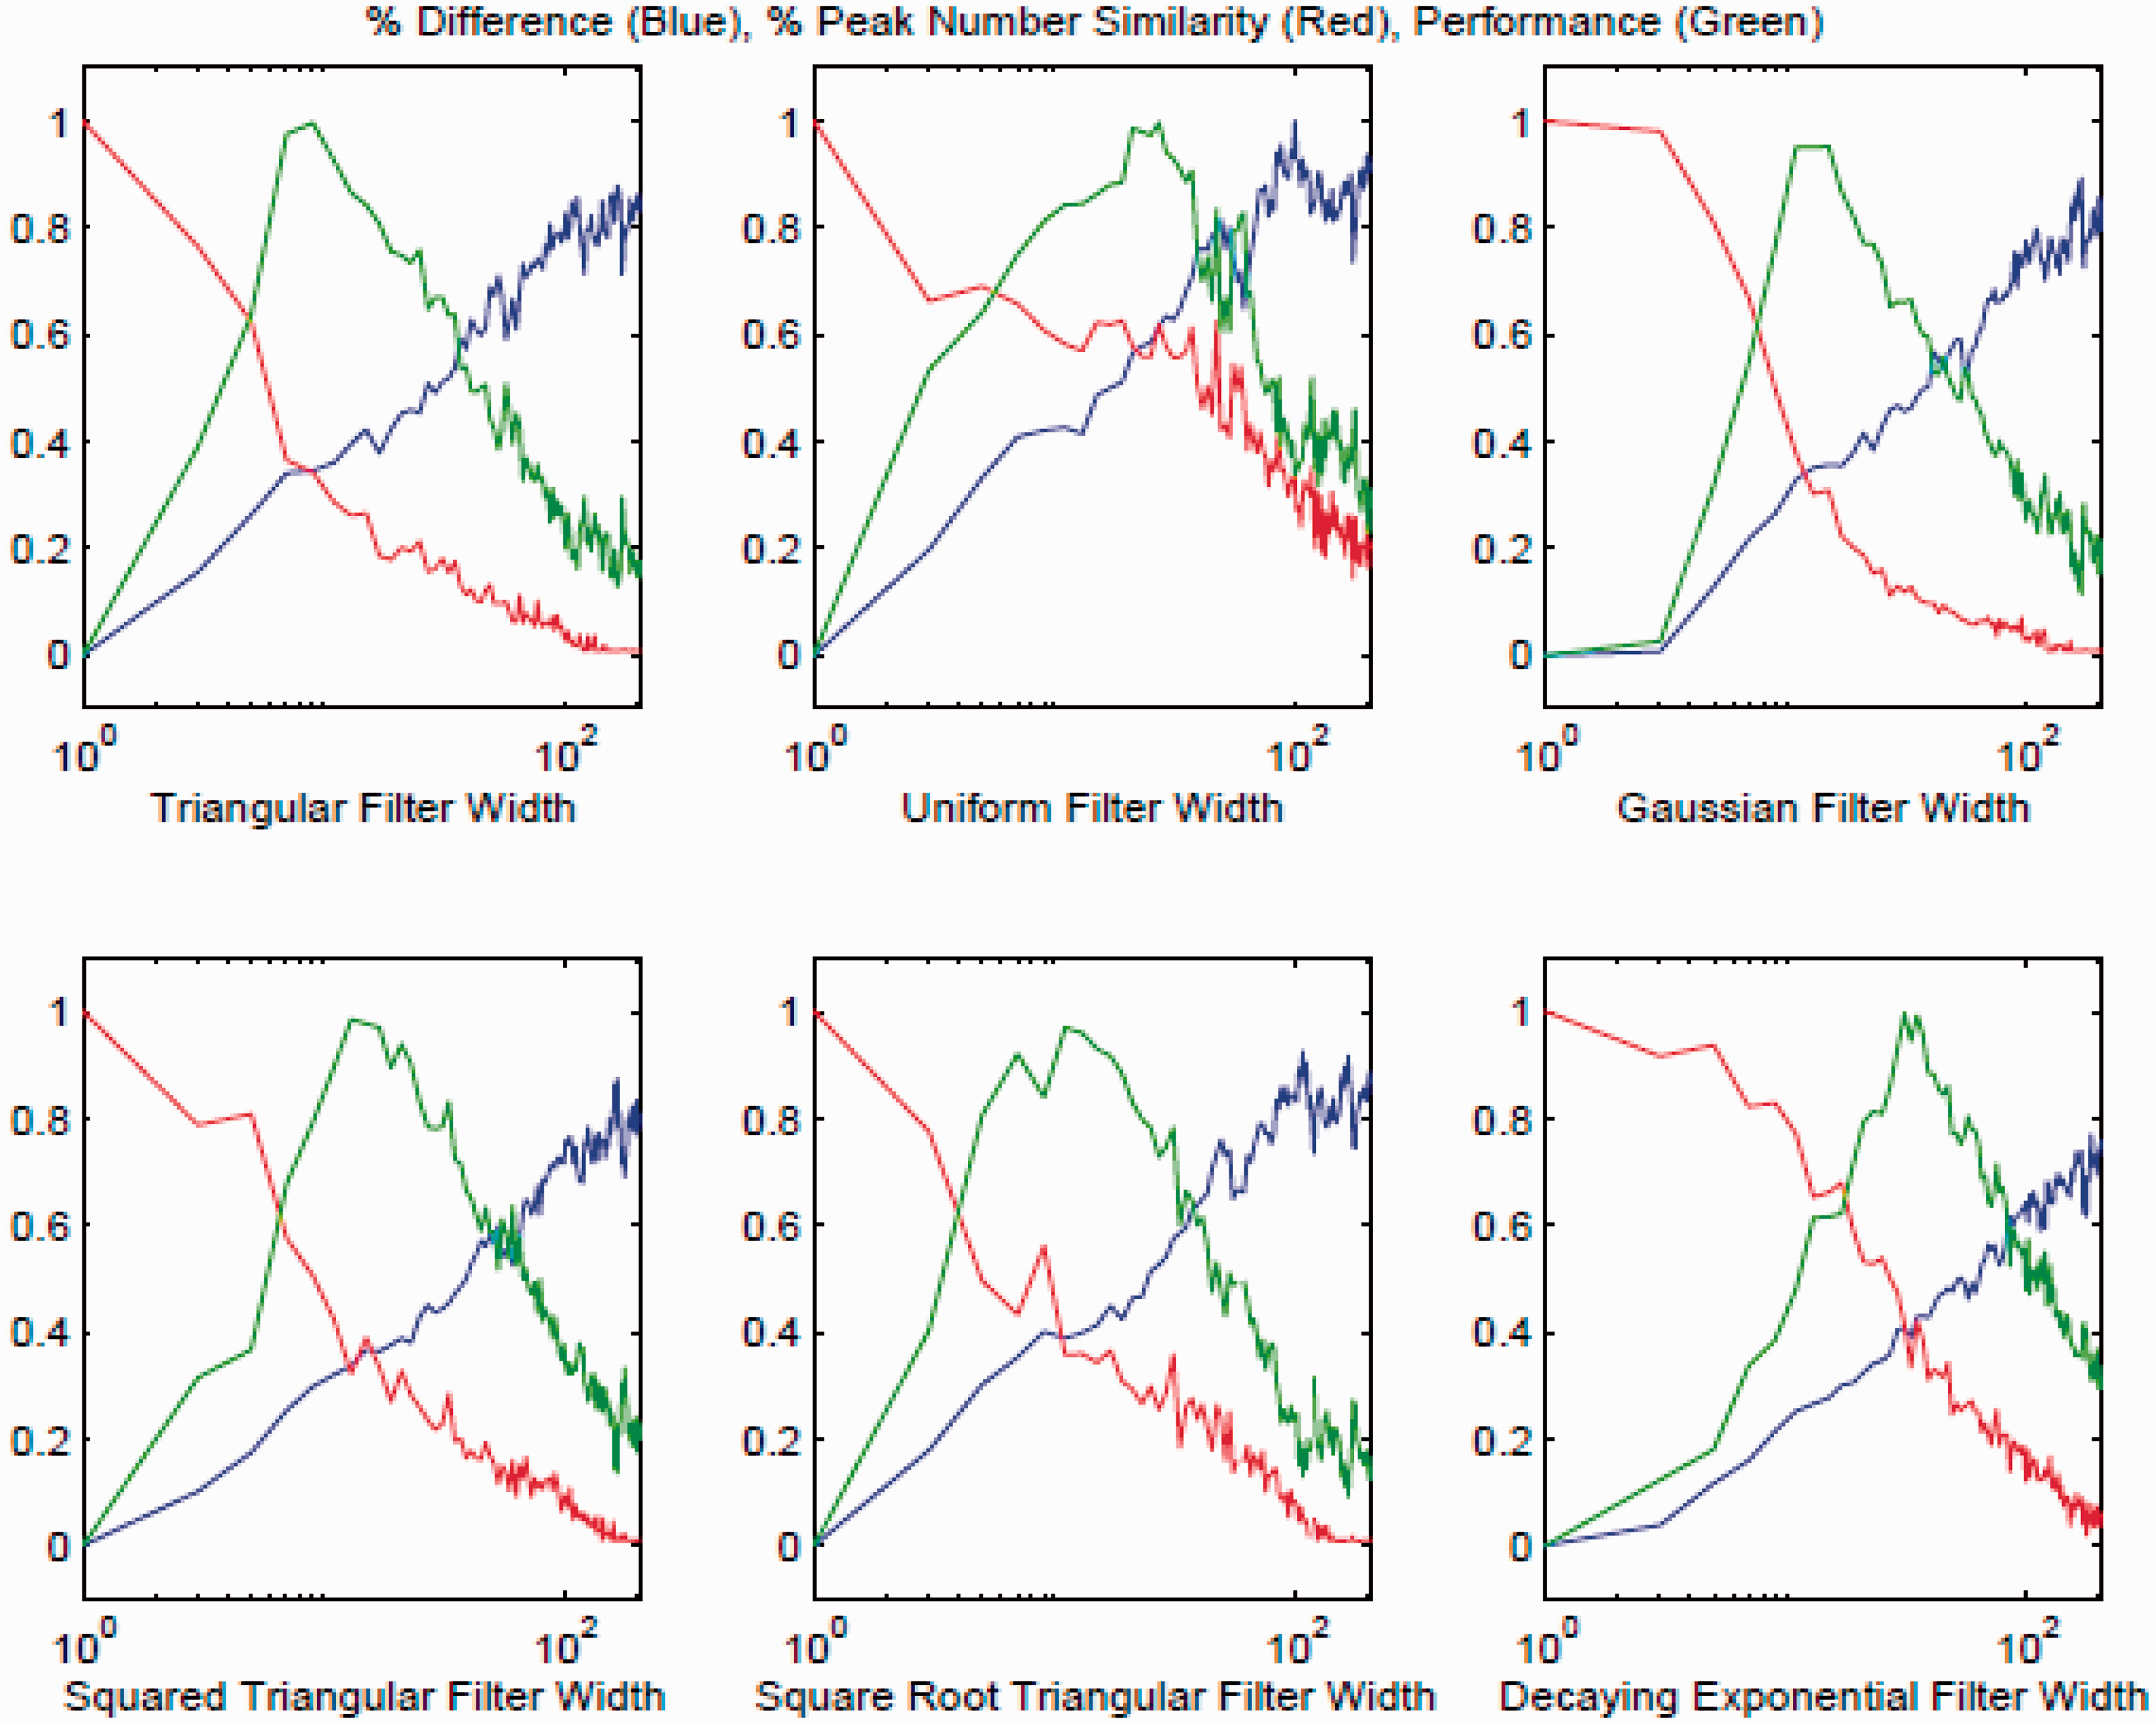
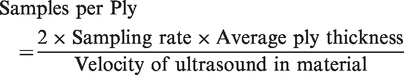
All A-Scans were trimmed; two ply thicknesses prior to the FWE and two ply thicknesses after the first back wall echo (BWE). The number of samples per ply was calculated as 7.12 using equation (1). The velocity of ultrasound was calculated to be 3.09 ± 0.08 mm/µs as discussed in
DAC was implemented as a single exponential gain function applied across all A-Scans equally as illustrated in Figure 4. The median FWE and BWE peak amplitudes for all A-Scans in the 2-mm-thick panel were used to determine the exponential coefficients. The DAC curve was clipped at the FWE and BWE locations to limit the effects of post-BWE signals.
DAC gain function for the 2-mm-thick sample panel. DAC: distance amplitude correction.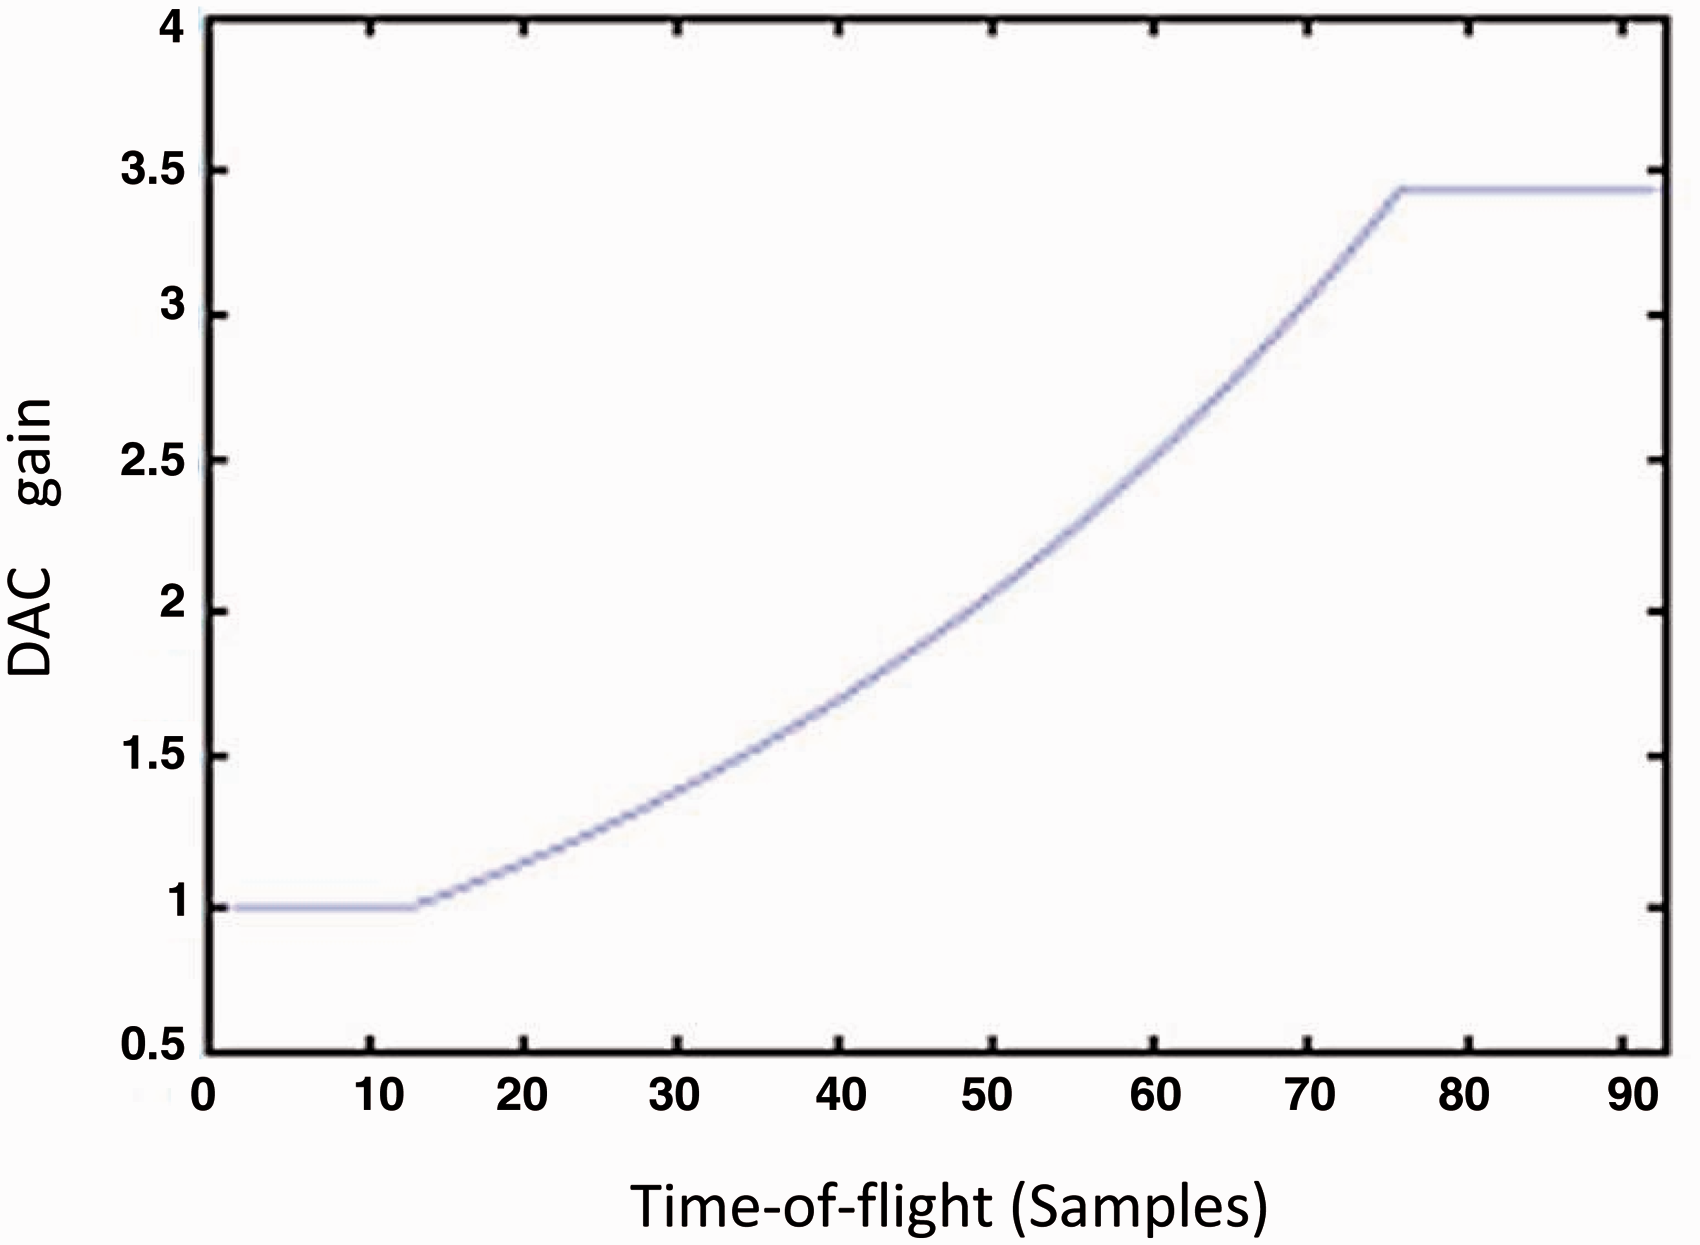
Data gates
Gates perform the role of segmenting ultrasonic data and filtering out insignificant responses. Gates consist of two descriptive parameters: amplitude or threshold; and also a range of times where the gates are active. In this work, gates are represented mathematically as shown in equation (2)
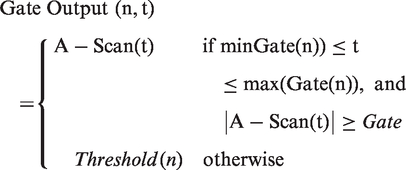
The time tmin was set to the median location of the FEW plus one ply thickness, and tmax was set to the median location of the BWE minus one and a half ply thickness. The offsets applied to the FEW and BWE were chosen to remove these echoes from future calculations. The BWE required a larger offset due to panel thickness variations and ultrasonic signal spread.
The gate threshold was determined using the average peak height within the range [tmin, tmax] for the 2 mm simple panel. As shown in Figure 5, the peak height is indicative of the presence of a defect, but ultrasonic variability means that more information was required for confident classification. In this work, the threshold (GateThreshold = 0.14) has been chosen as the lower limit at which defects occurred, so that all defect regions were presented to the classifier even though there is greater possibility for misclassification of the defect-free (DF) ultrasonic data.
Box plots of maximum amplitude between the FWE and BWE for 2 mm thick sample panel.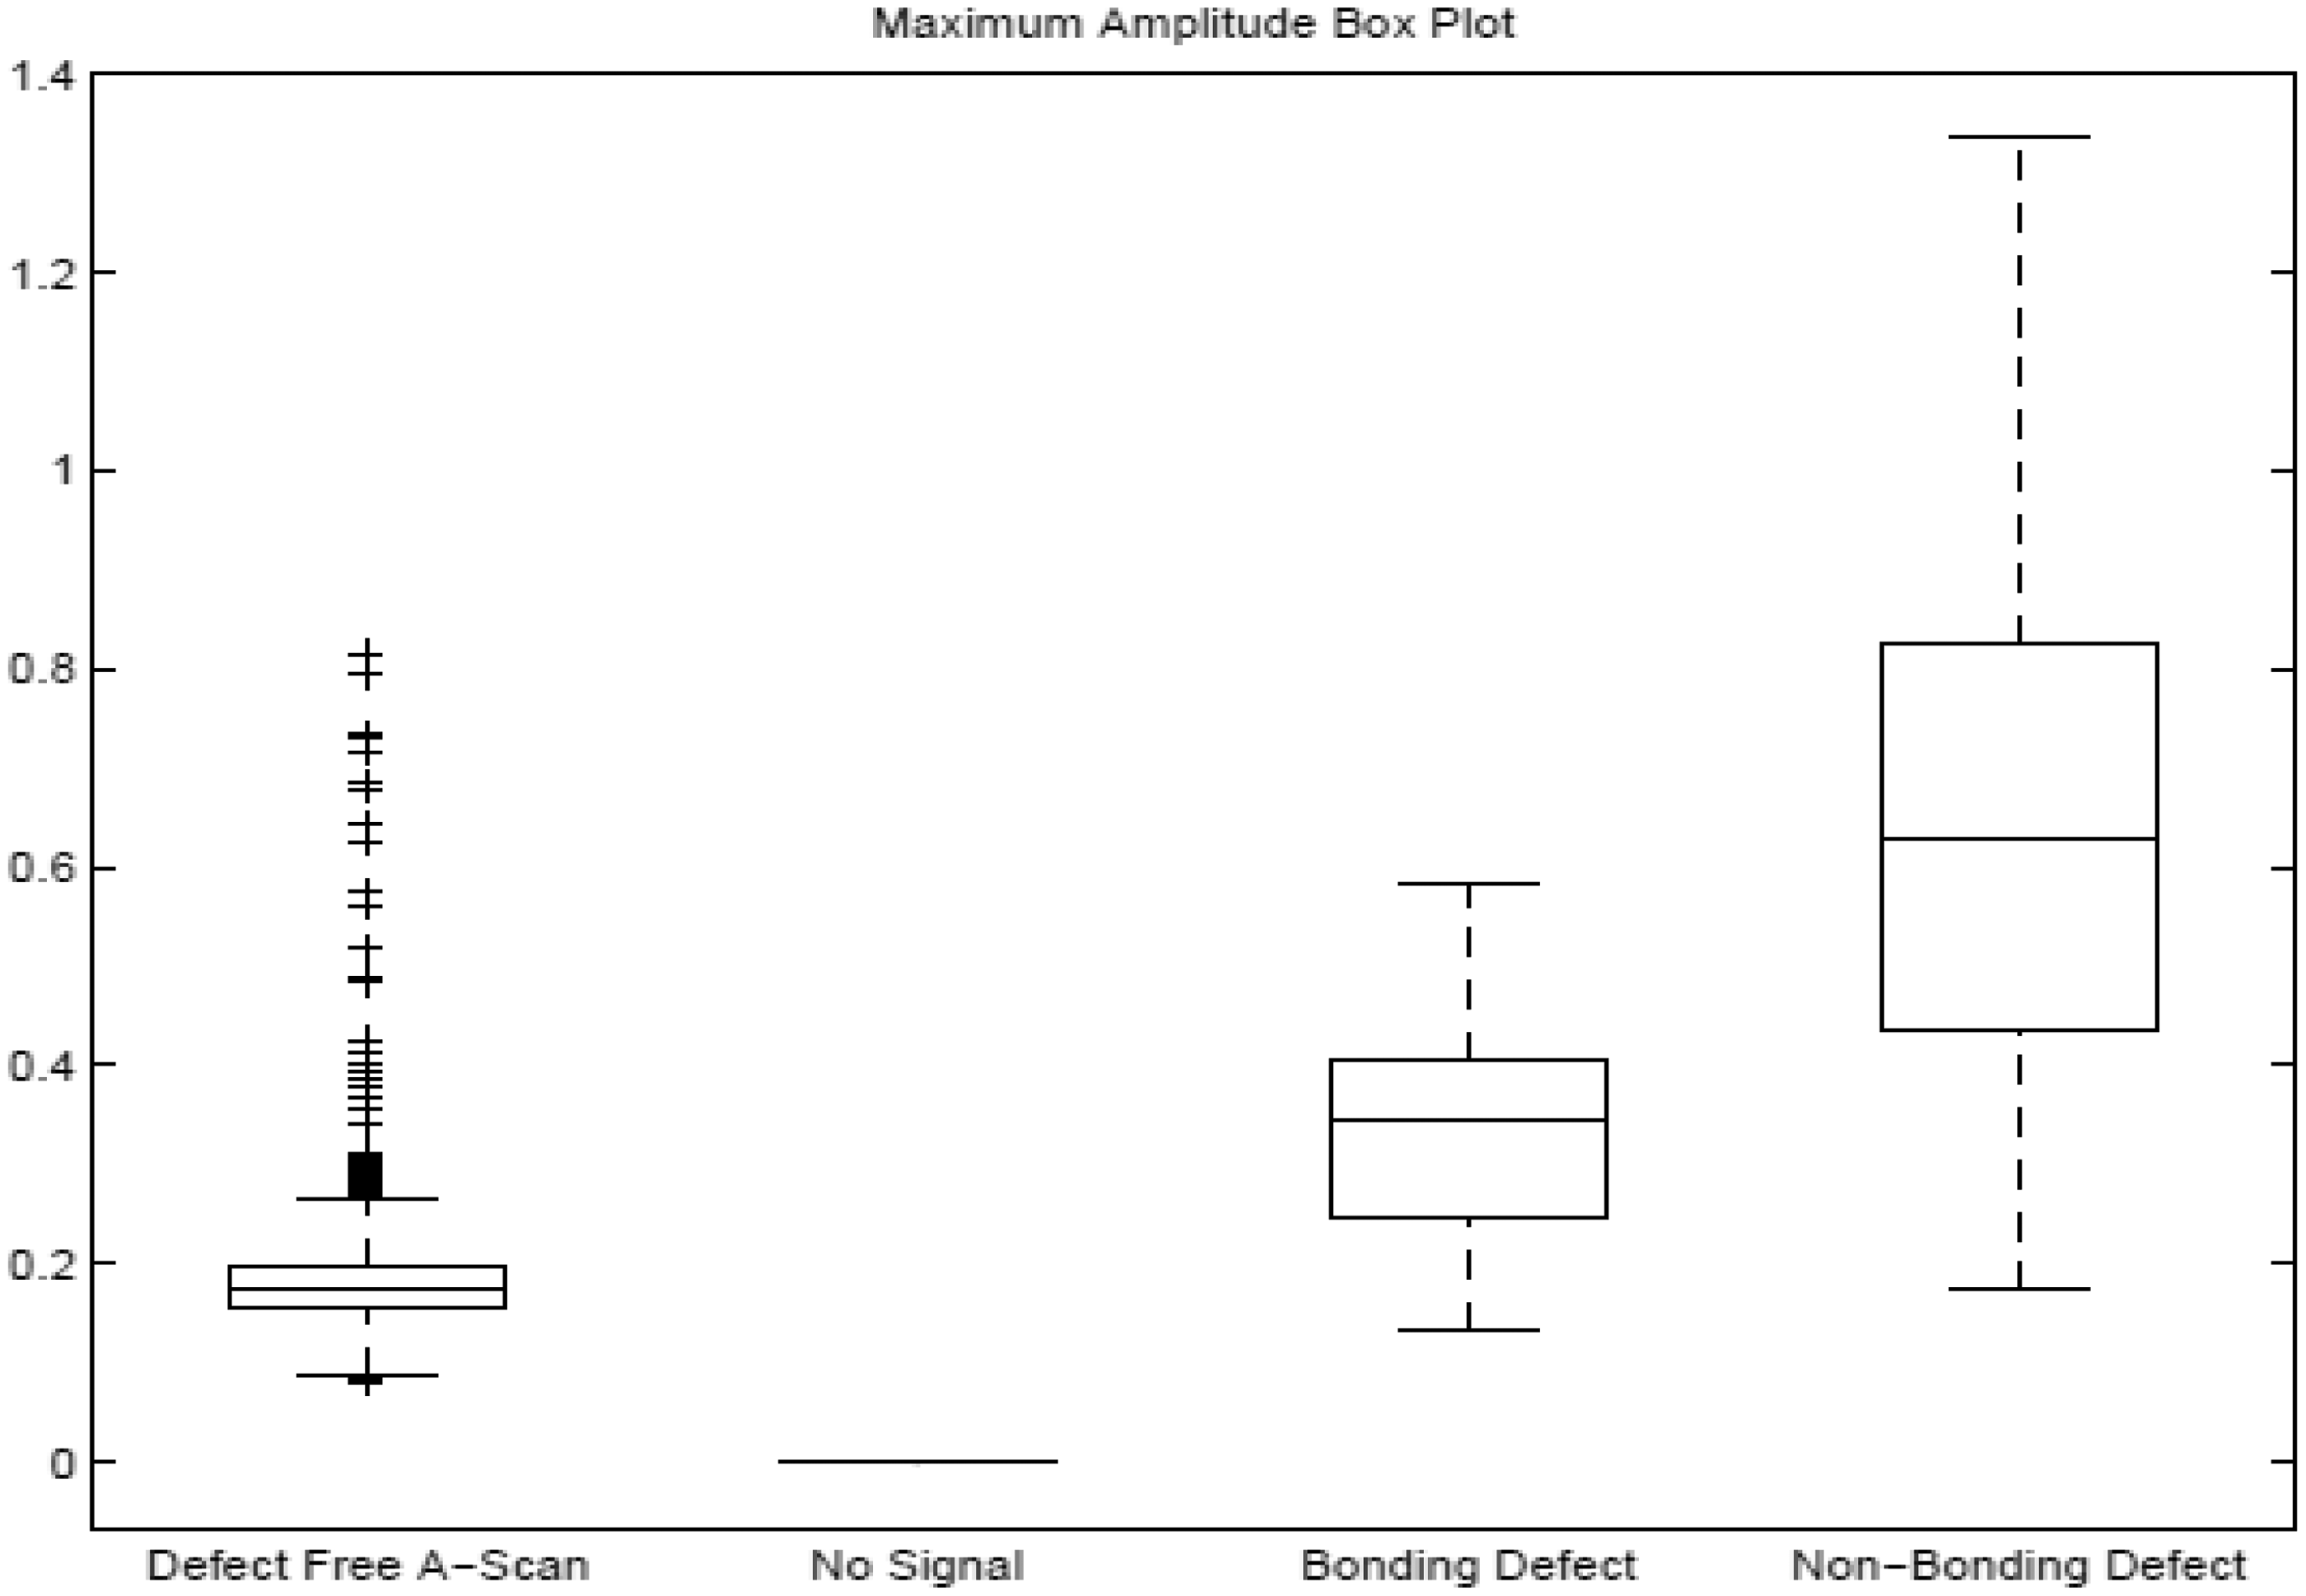
Feature extraction
Feature extraction for various ultrasonic inspection applications has been well covered in the literature. Ultrasonic data have been described in the time domain;17,23–27 frequency domain;17,23–28 correlation, convolution and deconvolution domains; 29 and with wavelets.23,26,30–32 Making use of all of the features presented in the literature would lead to a large scale of redundant information and very slow computation times, and so a narrow selection was adopted based on the review by Lee. 23
In this work, three sets of features were selected to describe four signal groups. The signal groups were DF, bonding (BO) Mylar inclusion, non-bonding (NB) Teflon inclusion and loss-of-signal (no signal, NS).
The first feature set is referred to as ‘general’, made use of statistical descriptors of the entire A-Scan and of local descriptors of the BWE. The ‘general’ features were mean (rectified), standard deviation, skewness, kurtosis, BWE peak, BWE ToF, BWE area, BWE width, BWE rise time from 25% to peak and BWE fall time from peak to 25%. The second set is referred to as ‘local’ that created localised gates with a width of two ply thicknesses (14 samples wide) in the regions of strong echoes and extracted the features from the smoothed ultrasonic data within these gates. Strong echoes were defined as any peaks between the FWE and BWE that exceeded the gate threshold level of 0.14 as discussed in Methodology section. The local features were peak amplitude, peak ToF, standard deviation, mean (rectified), peak area, peak width, rise time from 25% to peak and fall time from peak to 25%. The third set is referred to as ‘mixed’ which combines the entire ‘local’ feature set with the mean (rectified) and kurtosis of the entire A-Scan. In all these cases, the feature C-Scans were normalised to the range [−1,1].
Classifier training
The training data for all of the classifiers were taken from the 2-mm-thick simple panel as illustrated in Figure 1(a). The location of the training data for the DF, bonding and non-bonding defects was as shown and consisted of 166 samples, 98 samples and 93 samples, respectively. The non-bonding and bonding inclusion data were distributed evenly between defects after the FWE, in the middle of the panel and before the BWE. The NS data were simulated by including 21 empty A-Scans. The 2-mm-thick simple panel contained a total of 12,509 DF signals, 447 non-bonding defect signals, 443 bonding inclusion signals and 99 instances of NS.
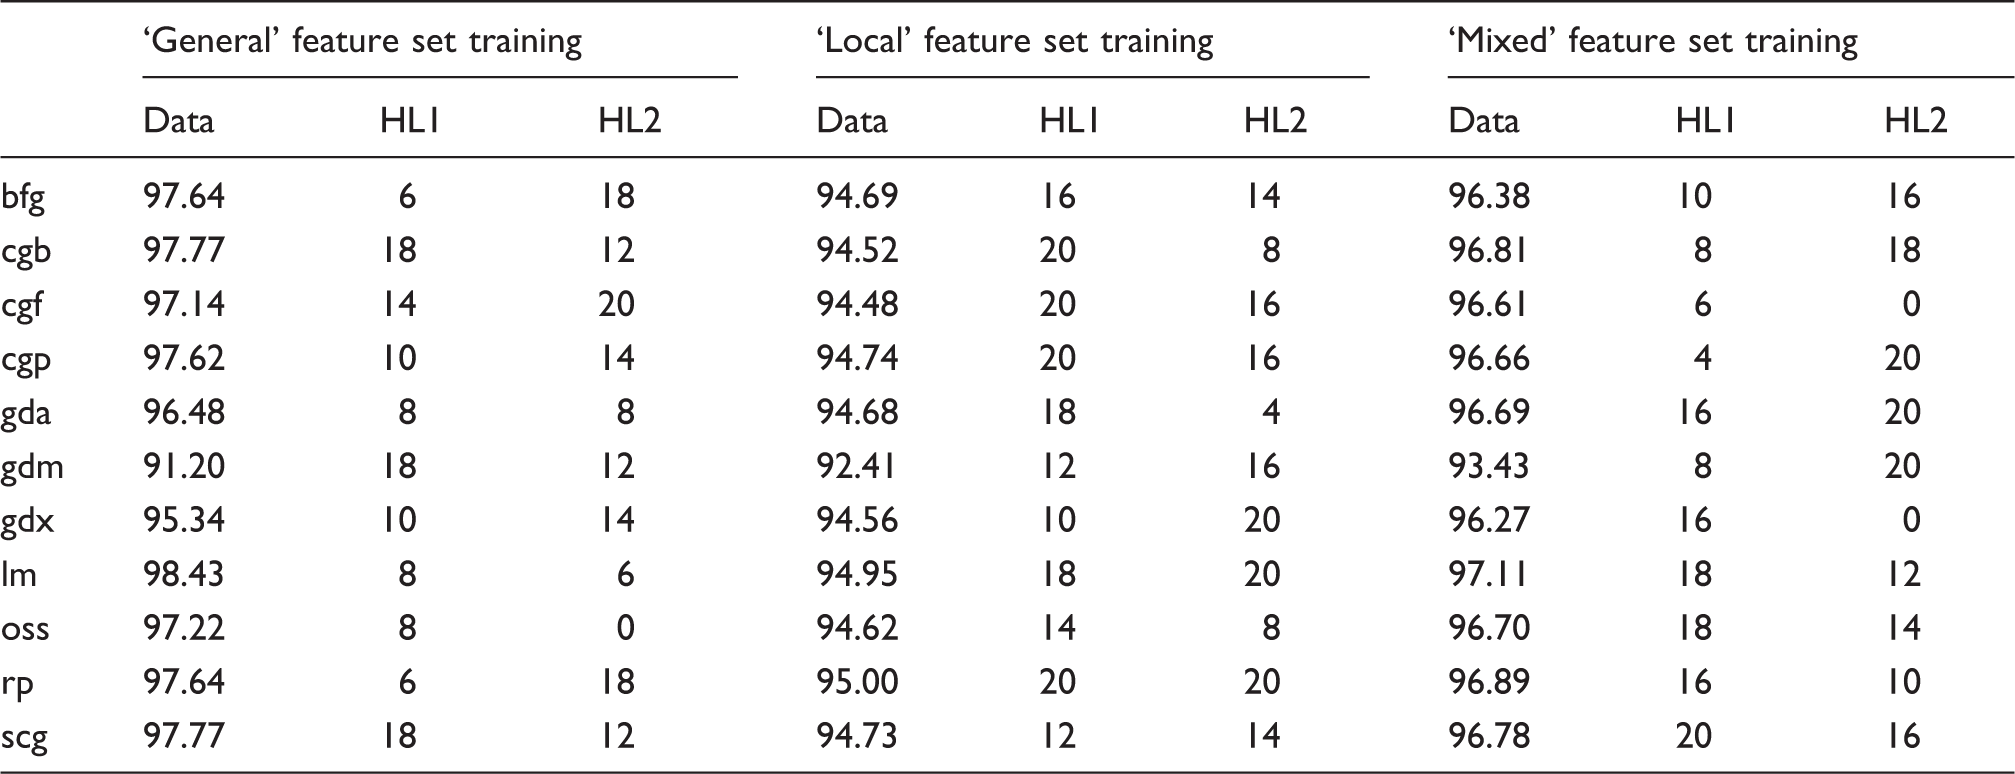
Based on earlier studies,17,33 feed-forward neural network with a back propagation training algorithm was selected and implemented using the MATLAB program (The MathWorks, Inc.). Nevertheless, the disadvantage of this algorithm is that the search for the best solution is often trapped in a local optimum, making it difficult for the network to work well. 34 Several authors35,36 have proposed training these networks with evolutionary search techniques as a good solution, but they have a drawback that training takes a long time. In order to address this issue, Cuéllar et al. 34 have proposed non-linear programming (BFGS 37 and Levenberg-Marquardt) algorithms that can be applied to train recurrent neural networks. 34
Summary of four-fold cross-validation training results for all artificial neural network training algorithms on the 2 mm simple panel data.
Post-classification image processing was performed to remove the occurrence of isolated classification results. The coarsest step size across either panel was 1.5 mm for the complex panels, and the smallest defects were the 0.5′′ × 0.1′′rectangle. All defects were represented across multiple adjacent pixels in the classification panel view image (i.e. C-Scan). As a result, any single point which does not have a minimum of three occurrences in any 3 × 3 neighbourhood was assumed to be in error and was set to the most frequently occurring value in that neighbourhood.
Results and discussion
Testing of the classifier was first performed on the remaining data within the 2-mm-thick simple panel, and in all cases, performance was a nearly perfect match based on the panel layout as illustrated in Figures 1(a) and 6(a). The next stage of testing followed the example provided in D’orazio et al.
11
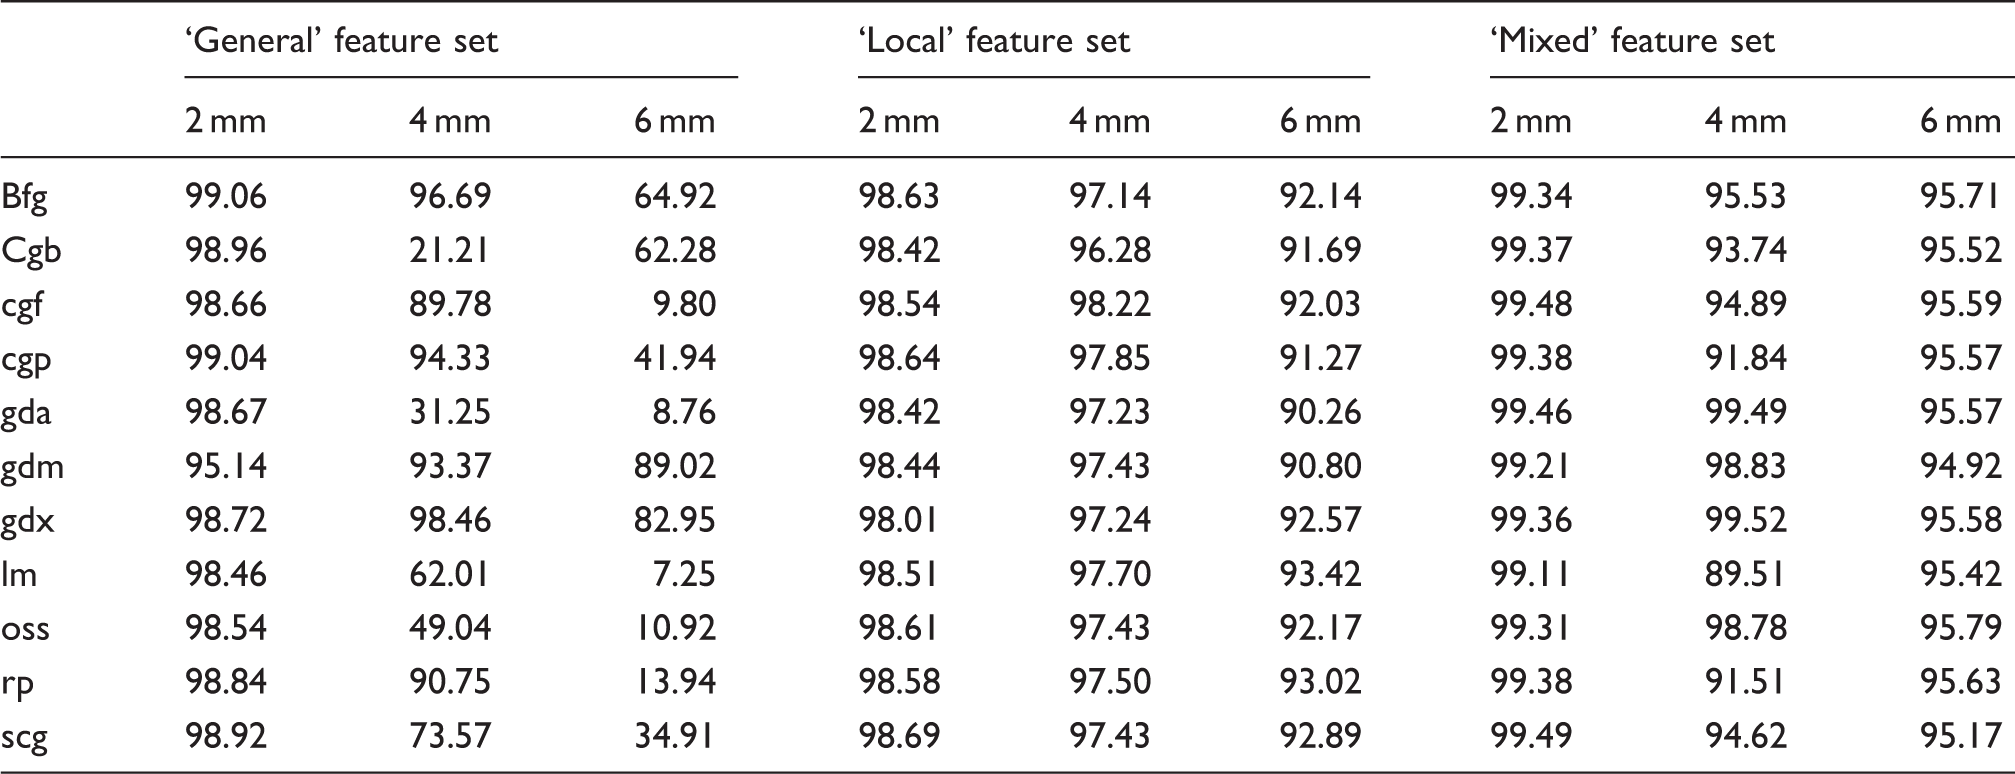
The trained classifier was tested on thicker panels where the defects were located in the same configuration as used in training, specifically immediately after the FWE and before the BWE. Results were recorded in Table 2. The ‘general’ classifier performing well on the 2-mm-thick panel, but performance was not satisfactory for the thicker panels. The best ‘general’ performance was achieved by the ‘gdx’ training algorithm, which was the second worst performing during the four-fold validation training. In addition, the ‘general’ classifier tended to identify more defects than what was present in the sample and frequently classified the DF region as a bonding defect.
Classification results using ‘mixed’ feature set and gdx trained classifier. Colours assigned: DF Classification results for all classifiers on data from the simple panel. , NS
, NS  , NB
, NB  , BO
, BO  .
.
On the other hand, the ‘local’ approach performed well in locating defects regardless of the training algorithm used, yet this classifier assigned the incorrect class. In addition, this approach was unable to identify the NS defects due to the use of data gates for all features. This could be easily circumvented with a logical check for the presence of any ultrasonic echoes above the threshold value, FWE and BWE included. The ‘mixed’ approach appeared to contain the strengths of both ‘general’ and ‘local’ classifiers and outperformed the other two.
Confusion matrices for all classifiers trained with gdx algorithm, tested on simple and complex panels.
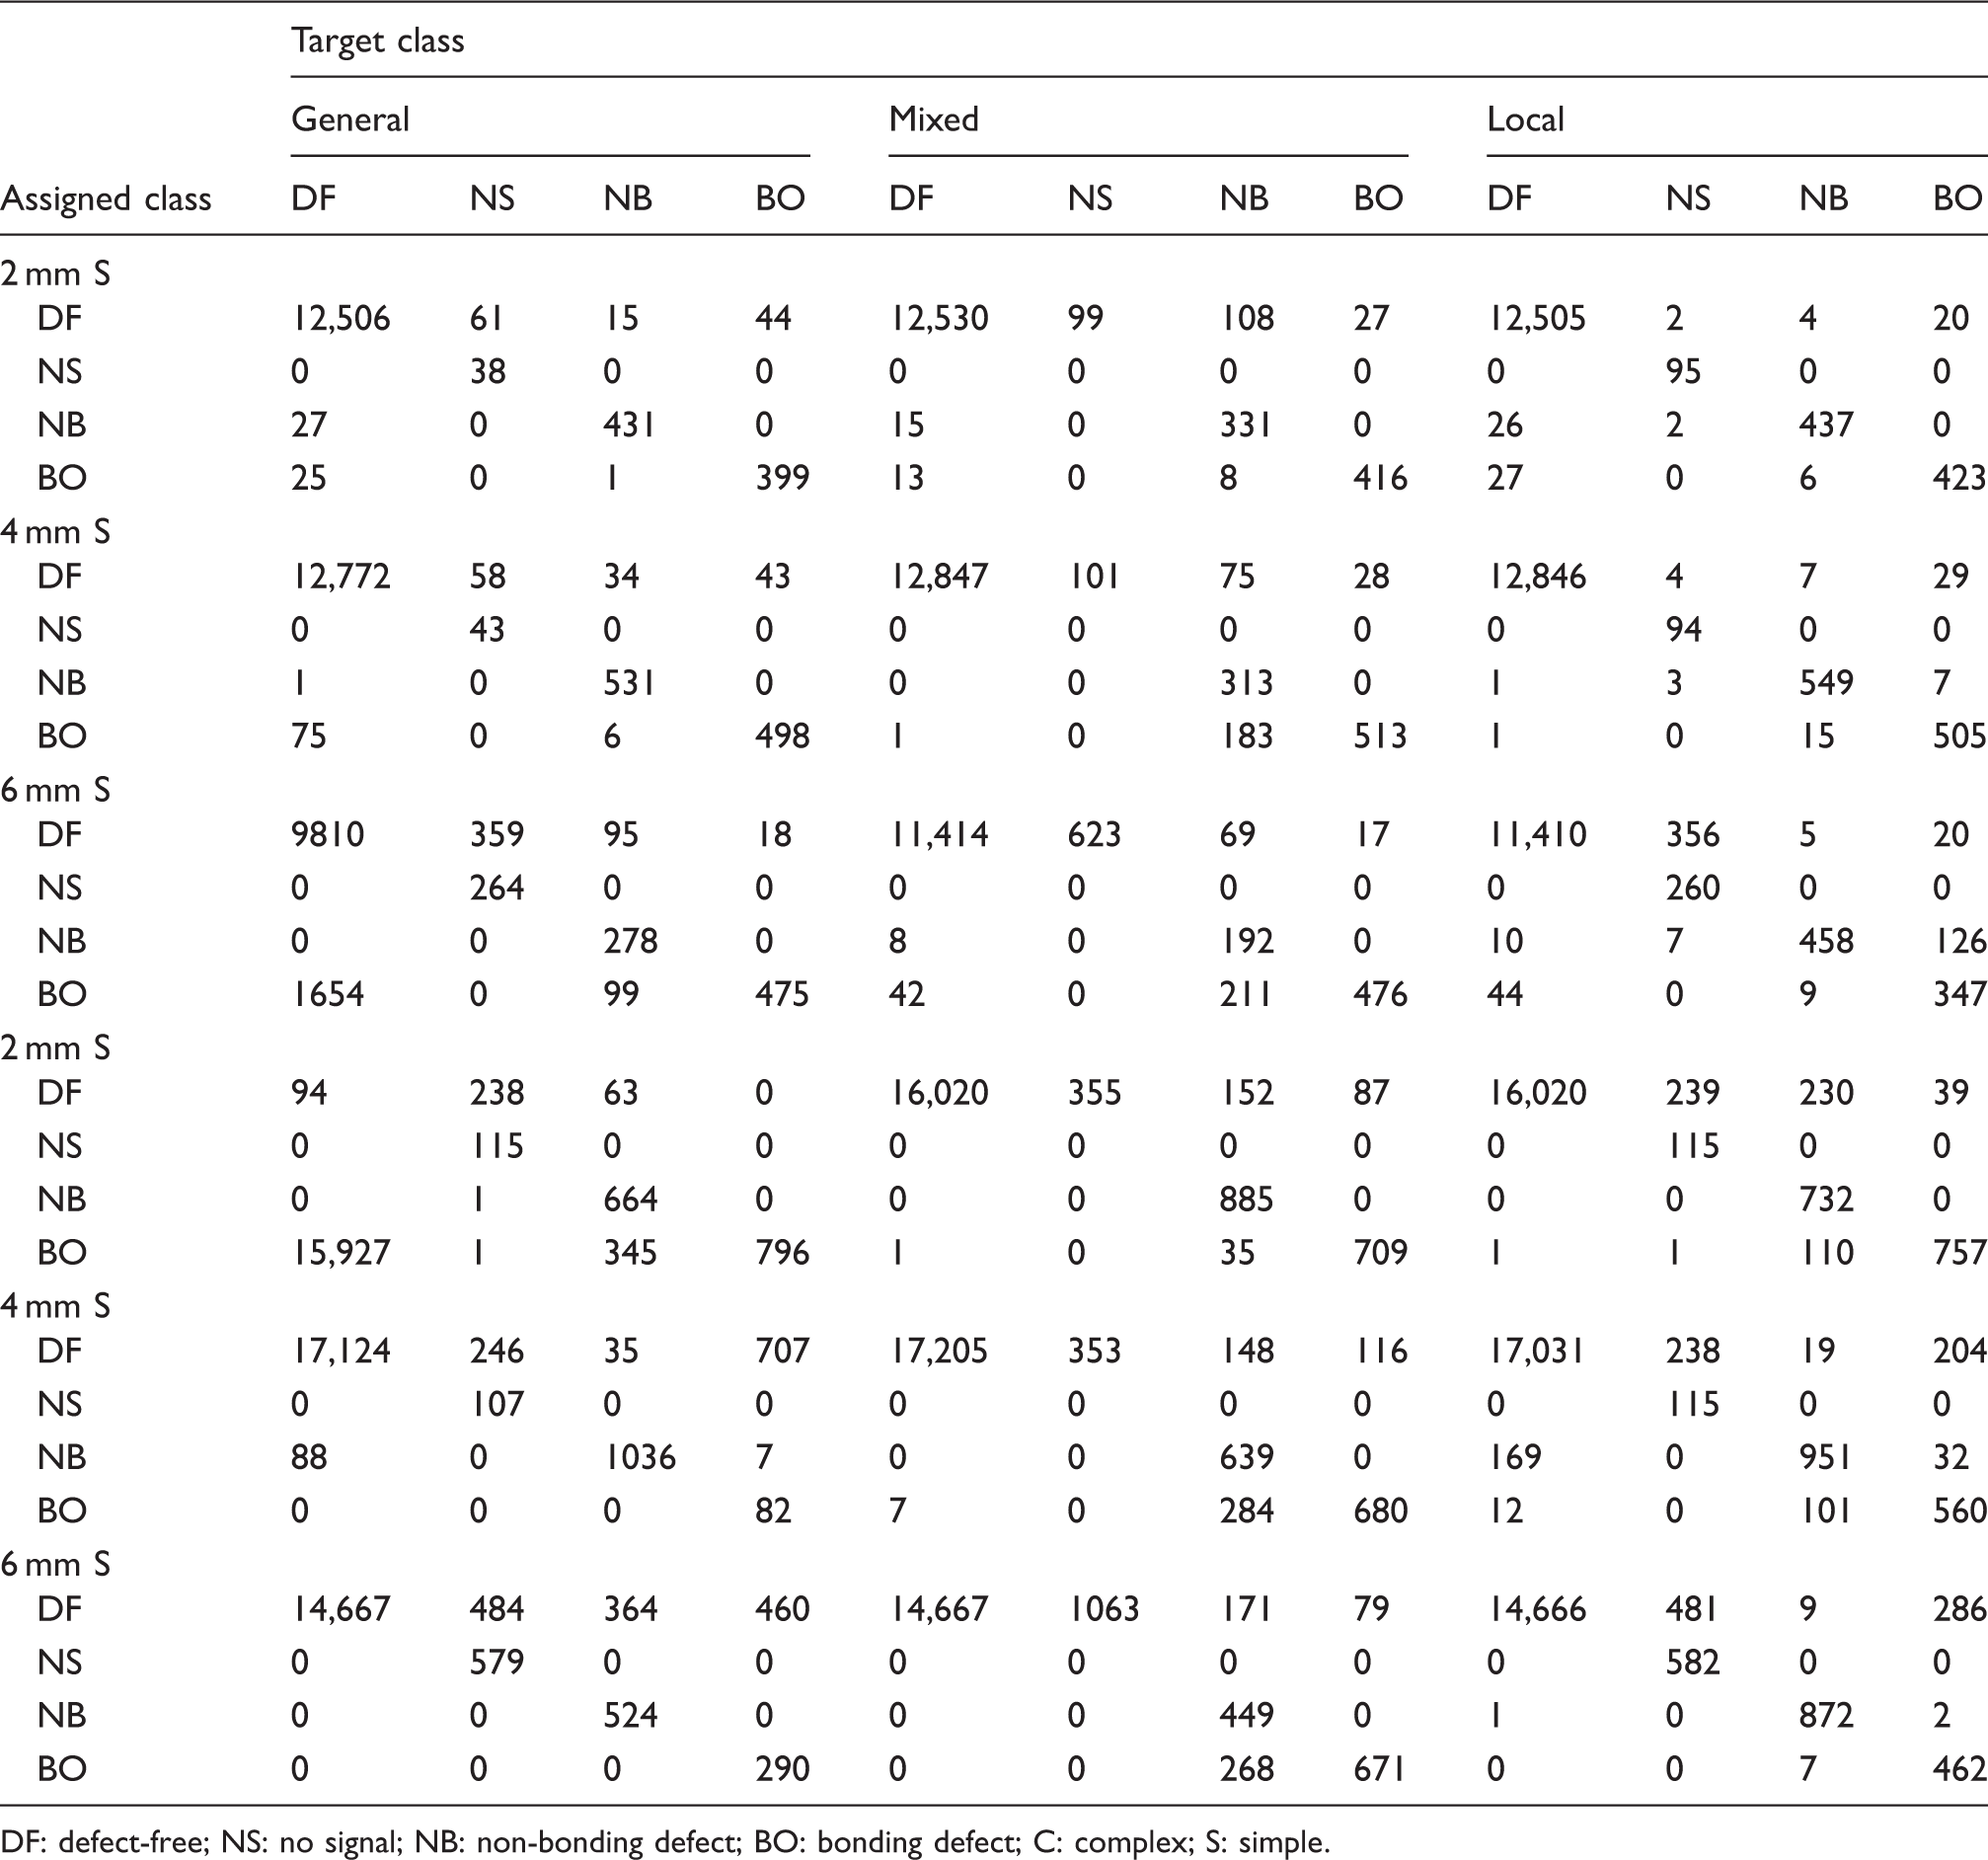
DF: defect-free; NS: no signal; NB: non-bonding defect; BO: bonding defect; C: complex; S: simple.
Most classifiers missed defects rather than incorrectly classifying the panel as containing extra defects. Part of this result can be attributed to the post-classifier image processing tool which performs some minor trimming of objects which would tend to favour DF classification as defects were less common. The uneven quantity of training data from each class also contributed towards a classifier tendency to favour DF classifications; however, this effect was small. In general, non-bonding type defects, with their stronger echoes, were correctly identified more often than bonding defects. The local classifier is unable to differentiate between bonding and non-bonding defects. This is indicated by only focusing on the immediate echo information and ignoring other information available in an A-Scan making the classification process harder to achieve. Additionally, the ‘local’ feature set makes use of smoothed A-Scan data which affects the amplitude of the echoes and can lead to a downgrading of apparent echo strength from non-bonding to bonding and from bonding to DF. This observed effect was small in the bonding defects but was significant with the non-bonding defects due to the smoothing of the high-amplitude pulses. In addition, the ‘local’ and ‘mixed’ classifiers also identified the second echo from the mid-panel non-bonding defect on the 4-mm-thick panel as a possible bonding type defect. This was caused by the second reflected pulse echo off the defect occurring prior to the BWE and having sufficient strength to exceed the gate threshold. Detection of second echoes is always a risk when ‘local’ inspection techniques are used, and this is discussed further with the complex panel results.
Classification results for all classifiers on data from the complex panel.
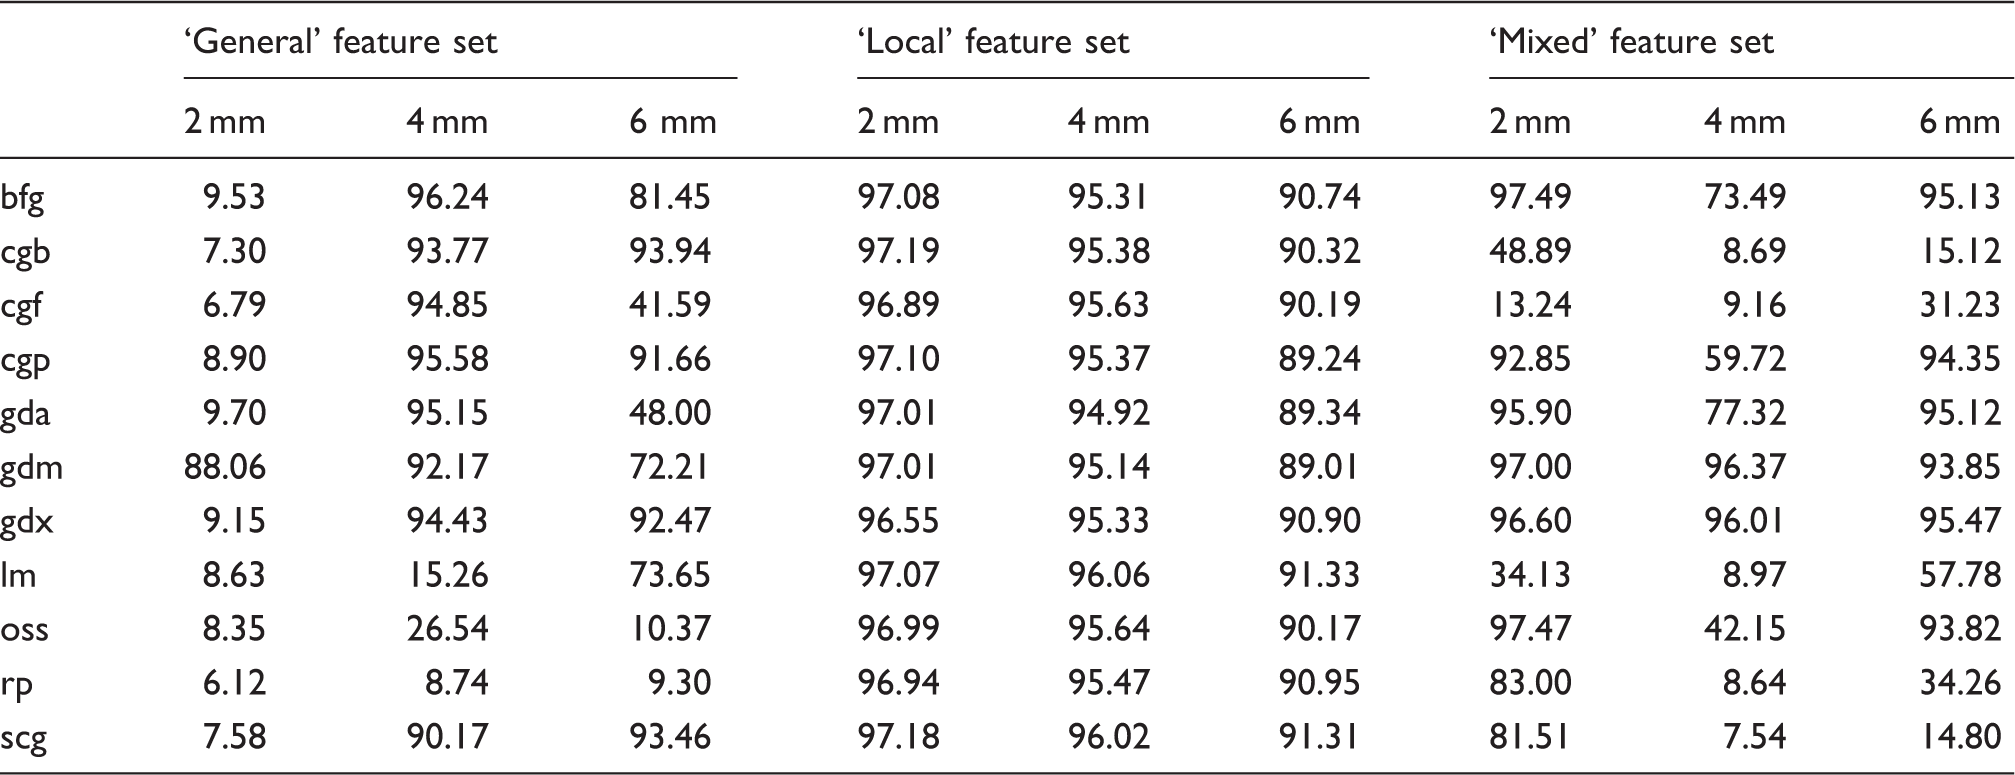
The ‘mixed’ and ‘general’ classifiers were found to either classify extremely well or poorly on the complex data indicating a statistically significant difference between the ultrasonic signals recorded between the two panels. This indicated that degree of separation between DF and defect was very small and that minor changes, such as resin fill levels, in the panel make-up (in terms of quantity of defects or physical characteristics) had a significant effect on statistical descriptors and on data normalisation calculations. This effect was less pronounced in the ‘local’ and ‘mixed’ feature sets which indicated that echo descriptors were more robust to minor changes in the panel make-up. One final observed occurrence was that second echoes received from defects nearer to the front surface were reported as additional defects later in the sample. This could have been prevented through creation of a dead zone in the detection system after a defect was detected, where additional observed defects were suspected to be second echoes and are ignored. The cautious nature of NDT inspection in aircraft structures led to inclusion of all findings, even the ghost defects. Figure 6 showed the ‘mixed’ gdx classifier output for the 2 mm sections of the simple and complex panels which can be compared with the panel schematics in Figure 1.
Conclusion
Three different approaches to ultrasonic data description for neural network classification of defects in CFRP panels have been presented and compared. A feature set based on the description of the ultrasonic pulse echo in the immediate neighbourhood of an abnormality was found to perform well across a wide range of defects and panel configurations regardless of the ANN training approach. Inclusion of statistical descriptors was found to provide an improvement in classification performance at a cost of reduced robustness in terms of classifier training.
Successful detection and classification of defects were achieved for CFRP panels with different thicknesses based on a small amount of training data from three defect locations in one thickness of panel only. The ability of the classifier to correctly identify and classify defects at different depths within the panel was shown along with moderate success at locating multiple defects positioned coaxially to the ultrasonic probe.
This approach would be of use as an extra reporting and display tool alongside traditional C-Scans and D-Scans as classifier training, and testing would only need to be performed once during the development of the inspection process and the numerical loading of these tools when classifying is light.
Footnotes
Declaration of Conflicting Interests
The author(s) declared no potential conflicts of interest with respect to the research, authorship, and/or publication of this article.
Funding
The author(s) disclosed receipt of the following financial support for the research, authorship, and/or publication of this article: The authors acknowledge the support of the Defence Materials Technology Centre (DMTC), which was established and is supported by the Australian Government’s Defence Future Capability Technology Centre (DFCTC) initiative, and would like to thank GKN Aerospace, Advanced Composite Structures Australia, Luscher Teknik and the Defence Science and Technology Organisation (DSTO) for their support in this work.