
Abstract
Materials containing phase change and graphite composites are very attractive materials for energy storage and thermal management applications because of their high thermal conductivity and heat storage characteristics. Mostly, these composites are currently used in thermal management of lithium-ion batteries to regulate the battery temperature and protect the battery from undesirable thermal runaway and also it can be used in other thermal energy storage applications. Several samples with expanded graphite impregnated with phase change material composites such as paraffin wax were tested in quasi-static stress–strain compression tests. To provide these composites with flexibility and compressibility, a special silicon polymer added to the phase change material–expanded graphite composite resulted in a new phase change material with expanded graphite and polymer composite; for which several samples of this composite were tested as well. The compression tests were performed using an Instron 3300R floor model universal testing system at a constant platen speed of 52 mm/min. All tests were conducted at room temperature and they were compressed up to failure. All phase change material–expanded graphite composite samples were tested in-plane and through-plane relative to the expanded graphite compaction directions. Both phase change material–expanded graphite composite samples in in-plane and through-plane directions showed distinct and unique mechanical and thermal characteristic responses. Compression stress–strain tests for all samples were modeled using a combined constitutive viscoelastic polymeric foam model equation based on Kelvin and Maxwell models. In this research, the Maxwell–Kelvin viscoelastic model was used to calibrate the compression tests for expanded graphite, phase change material–expanded graphite, and phase change material with expanded graphite and polymer composites. It was found that ductility and viscous characteristics of the model are due to the presence of expanded graphite whereas brittleness characteristics are due to the presence of phase change material. The polymeric foam model equation is a powerful tool for designing new energy storage composites with targeted mechanical and thermal characteristics such as yield strength, Young's modulus, thermal conductivity, and latent heat. From curve fitting of the experimental tests of phase change material–expanded graphite composites with the viscoelastic model, several mechanical properties such as elastic and viscous coefficients were computed.
Keywords
Introduction
Phase change composites such as paraffin wax impregnated in expanded graphite (EG) have been used for many years. Several studies and investigations of phase change material–expanded graphite (PCM–EG) composites were done by many researchers such as those conducted by Zhang and Fang, 1 Krupa et al., 2 Mills et al., 3 and Alrashdan et al. 4 These composites possess high latent heat of fusion and also high thermal conductivity characteristics for energy storage applications. Phase change material (PCM) or wax enables the composite materials to store large amount of heat per unit weight or volume during their phase transition; whereas EG provides composites with high thermal conductivity which is a very good thermal property for thermal management system applications. The combination of PCM and EG (PCM–EG) creates a composite that makes it very attractive for thermal management and energy storage applications. It is very important to know the exact weight percentage ratio of PCM to EG to optimize desired thermal and mechanical properties. Thermal properties such as thermal conductivity and latent heat can be tailored to suit the application needs. Mechanical properties of these composites can be deteriorated due to excessive PCM contents which result in a composite with high brittleness characteristics. Consequently, it is essential for these individual components to be blended by appropriate weight/volume percentage ratios to produce a composite with unique thermal and mechanical characteristic for certain industrial application usage. Changing weight ratios of PCM and EG should affect directly the mechanical and thermal properties of the resulted composite.
The first purpose of this paper was to build a unique mathematical model of the compression stress–strain of the PCMs with the EG composite using a viscoelastic polymeric equation of Maxwell and Kelvin models. There are several references that address the mathematical model derivation for viscoelastic materials such as those conducted by Alzoubi et al. 5 However, most of these references cover different viscoelastic materials such as polyurethanes and foam but never used for the phase change graphite composites. Due to increasing interest in energy storage materials and applications, modeling and mechanical characterization of these composites is becoming an interest for many researchers. A second goal of this research was to predict a compression stress–strain curve of individual models of these composites based on their mechanical properties using a viscoelastic polymeric foam equation that is a combination of Maxwell and Kelvin models. In this research; mathematical modeling especially for EG was done in both in-plane (IP) and through-plane (TP) relative to the graphite compaction directions. Viscoelastic models were introduced first by Goga. 6 Goga's model describes a uniaxial compression behavior of the polymeric foam model (PFM) which behaves similarly to viscoelastic model. In this paper, same viscoelastic model was used to curve fit compression curve of phase change composites such as PCM, EG, PCM–EG, and phase change material with expanded graphite and polymer composite (PCM–EG-POLYMER). Another recent work that highlights strain rates dependency was conducted by Jeong et al. 7 and Nagy et al. 8 In all previous models, the mathematical equations were derived by combinations of Maxwell and Kelvin–Voigt models which are a combination of mechanical systems such as springs and dashpots. From curve fitting the compression stress–strain tests using least square fitting technique, several viscous and elastic coefficients of Maxwell and Kelvin systems can be extracted. Such coefficients are essential factors to characterize, design, and determine targeted mechanical and thermal properties for the composite to perform effectively in several thermal and energy storage application and in specific environmental conditions. Changing these parameters and or changing the arrangement of these Maxwell and Kelvin systems shall affect the overall mechanical performance of these phase material composites.
Phase change composites with EG could be a potential material to be used for thermal storage applications as well as for cylindrical cells and pouch batteries in thermal management applications. AllCell Technologies' scientists are in progress to come up with new PCM–EG composites that contain special polymers to give the composite certain flexibility and compressibility for pouch cell applications. In this particular research, a composite prototype sample that will be used potentially in pouch cell applications was named PCM–EG-POLYMER sample and was tested and characterized. Furthermore, the research was extended to model the compression stress–strain curves of PCM–EG-POLYMER composite samples using the same viscoelastic polymeric model.
PCM and EG composite structure
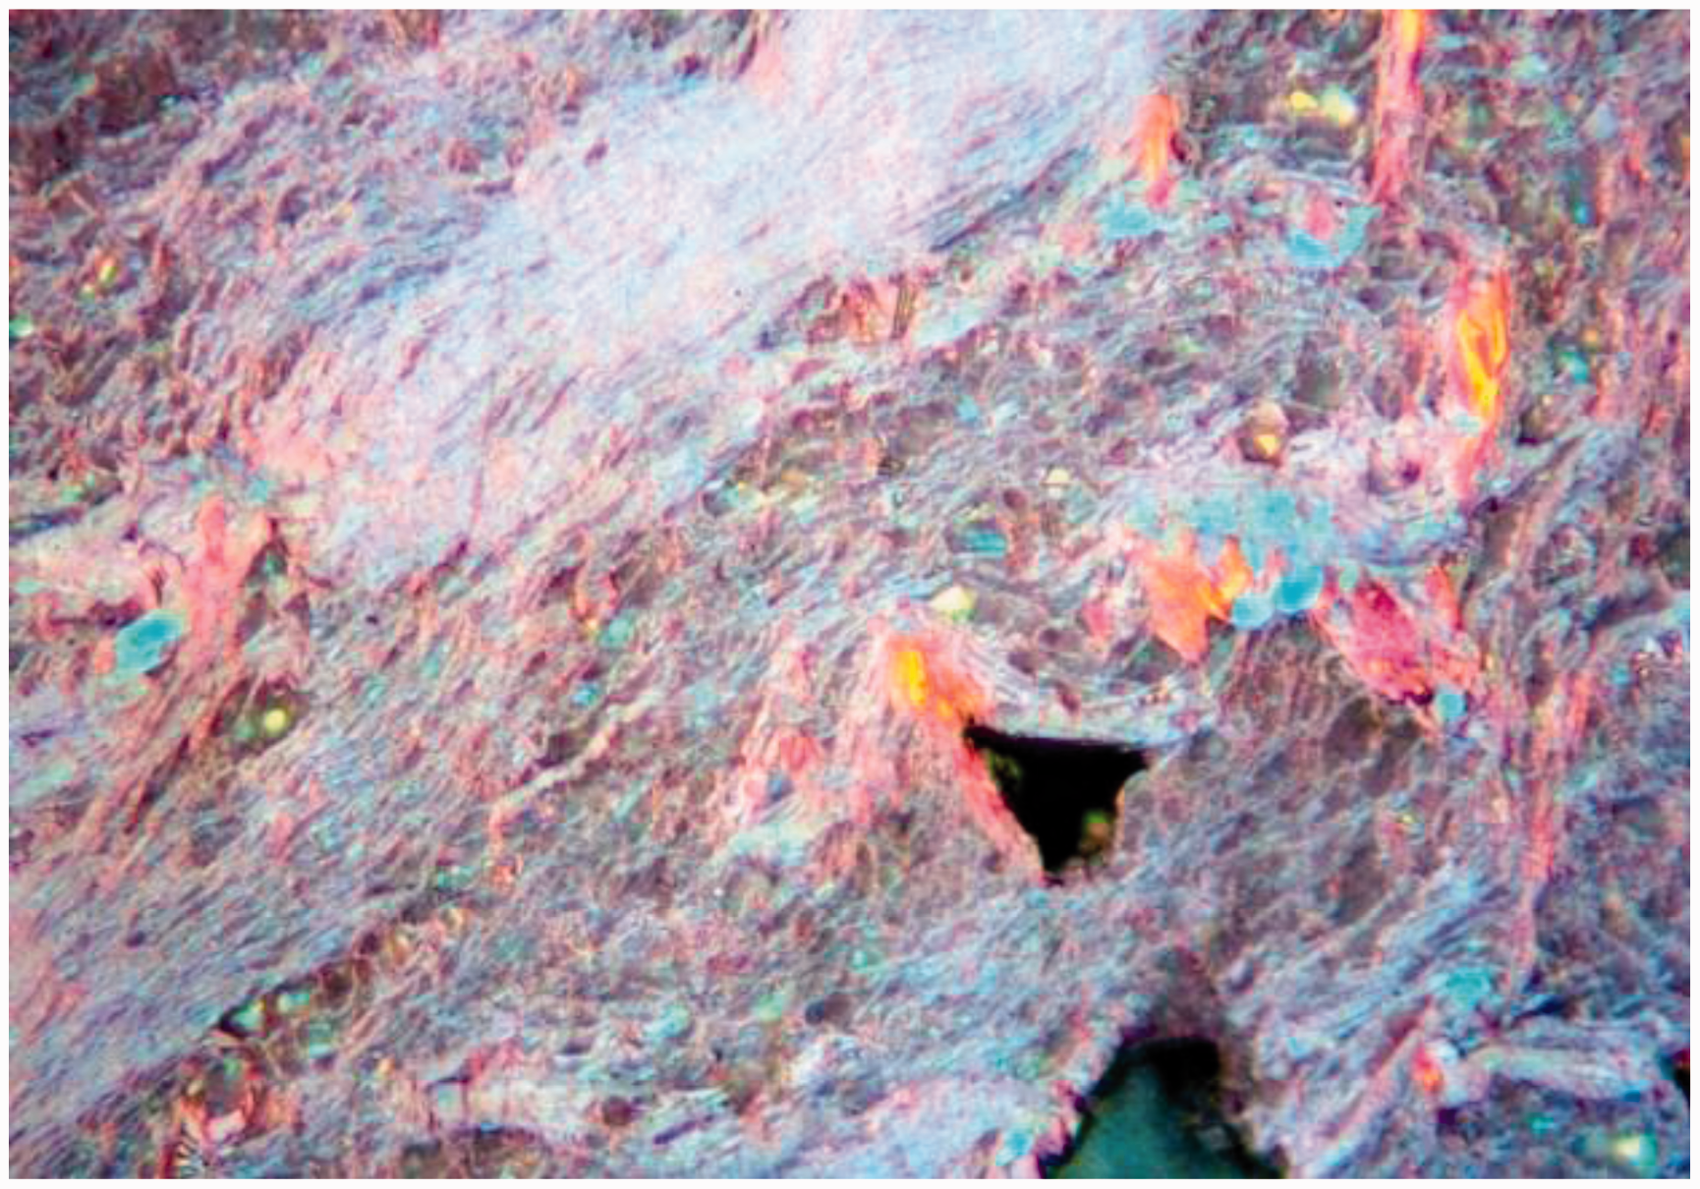
For this research, a finished block of EG matrix compacted to a desired density and to achieve necessary thermal conductivity and porosity for PCM impregnation was prepared. The EG block is soaked in 65 ℃ bath of molten paraffin wax that melts at 55 ℃. Depending on various application needs, different melting temperature of PCM can be used in the composite. In this research, the 55 ℃ melting PCM was used for all experiments. Optical microscopy photos of compacted EG without and with PCM are shown in Figures 1 and 2, respectively.
Optical microscopy of compacted expanded graphite without PCM. Optical microscopy of compacted expanded graphite with PCM.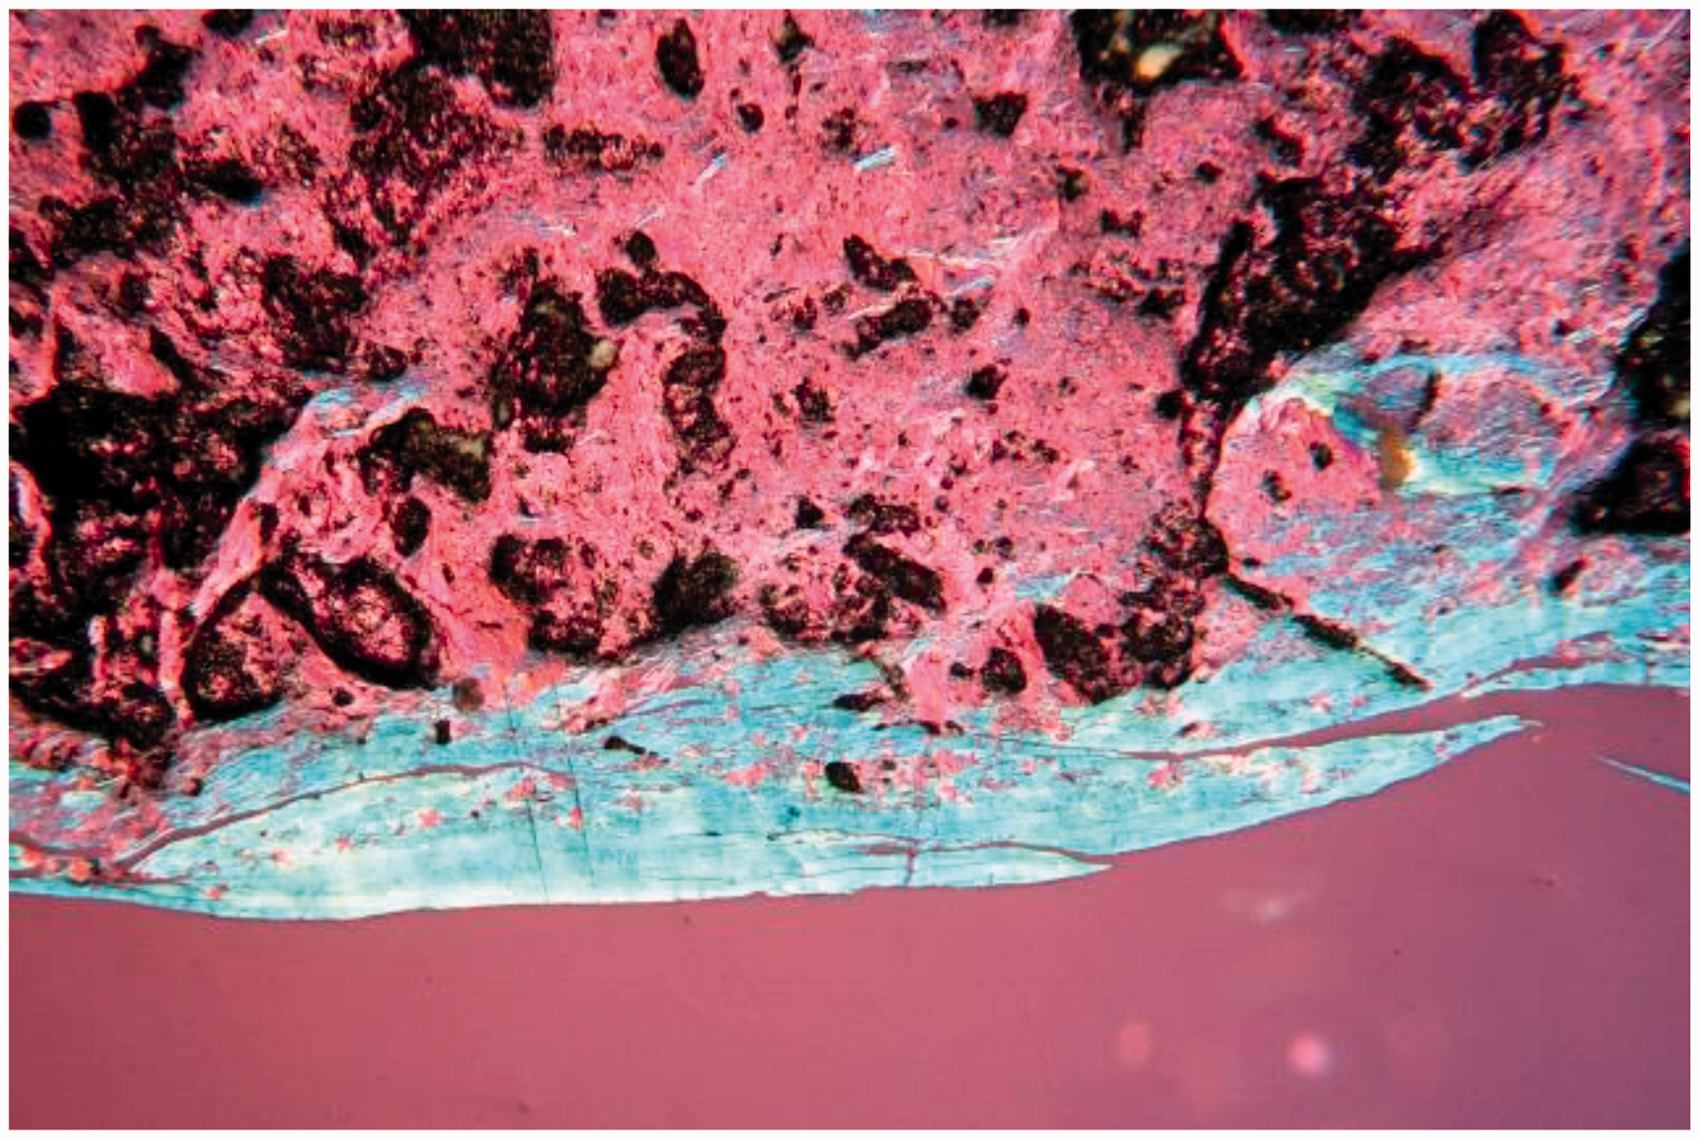
Graphite compaction direction dependencies
During graphite compaction, the graphite particles are pressed and are anisotropically aligned that result in creating graphite layers parallel to compaction direction. Usually, the thermal and mechanical properties of the graphite before and after the PCM impregnation have anisotropic characteristics and this was investigated by many such as those conducted by Wang et al.
9
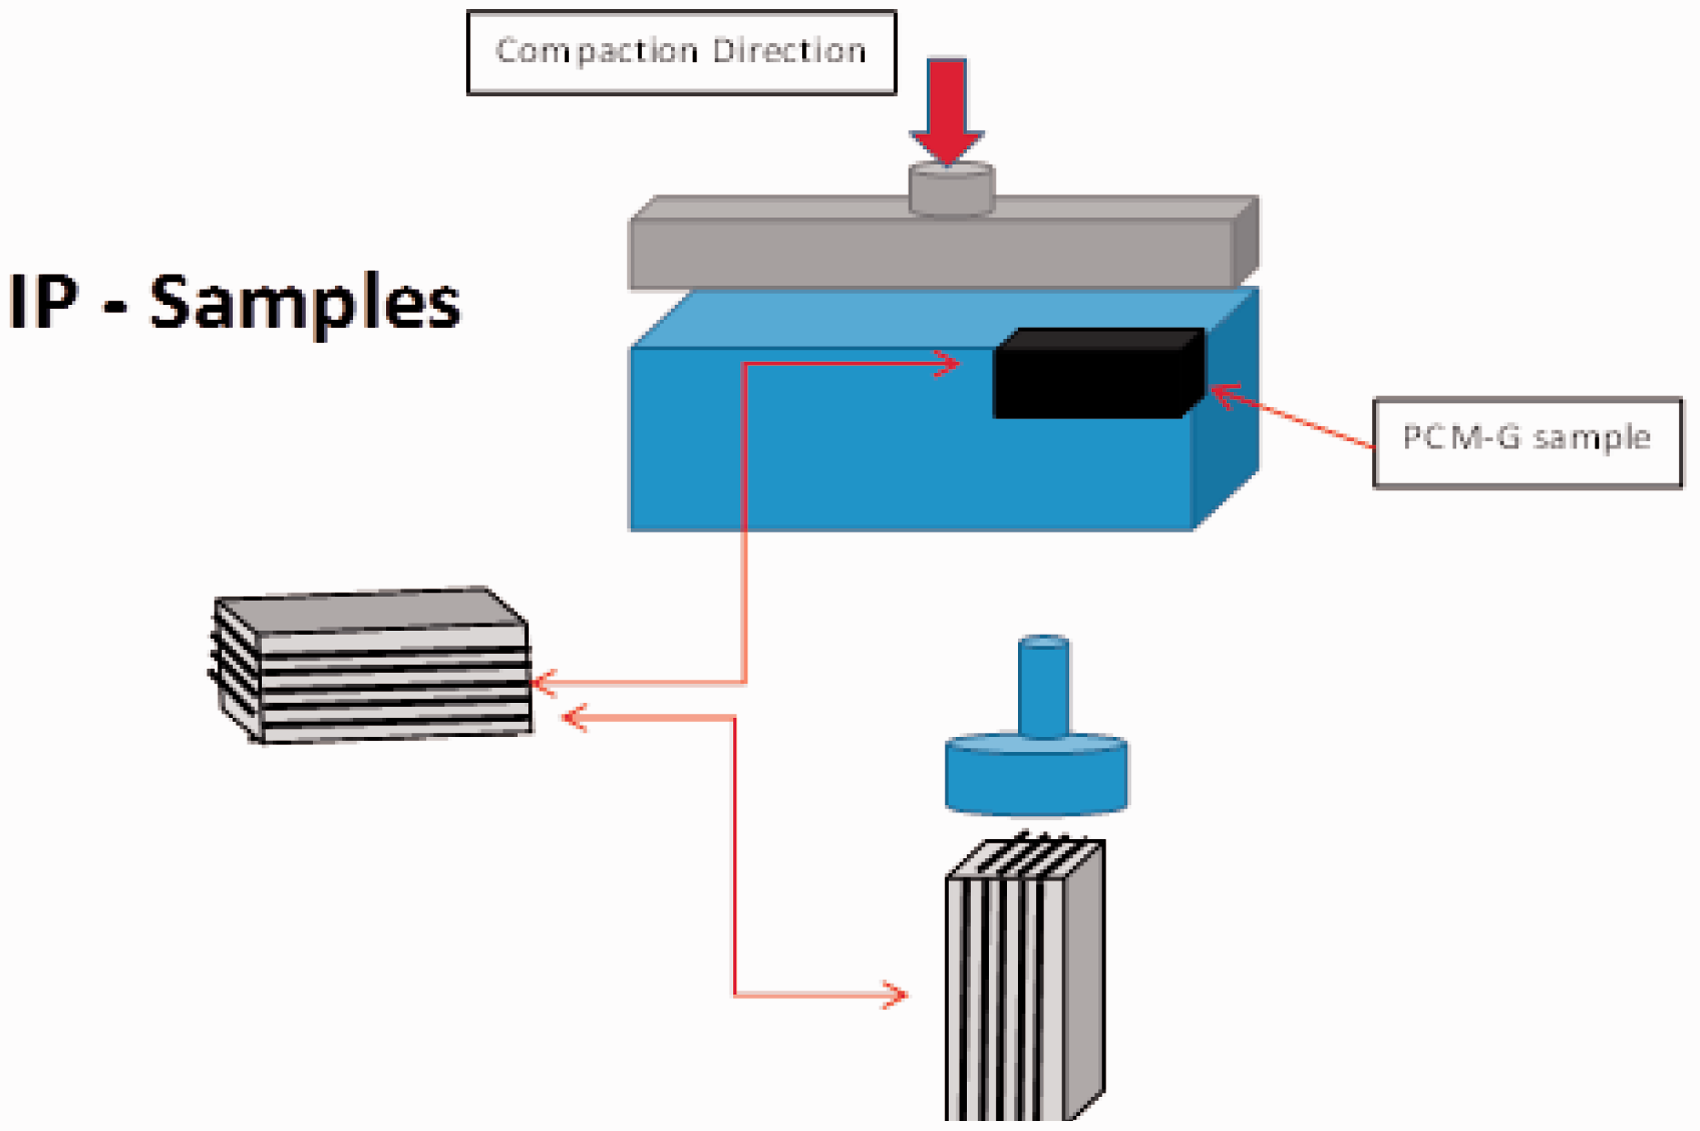
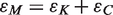
In this research, there are two types of samples used for compression tests based on their fiber orientations. The first type is TP, i.e. compression tests were conducted parallel to compaction and the second type is called IP, where tests were conducted perpendicular to compaction. Figures 3 and 4 show directions of compacted EG in TP and IP, respectively.
Through-plane (TP) compacted graphite, compression tests were done parallel to compaction. In-plane (IP) compacted graphite, compression tests were done perpendicular to compaction.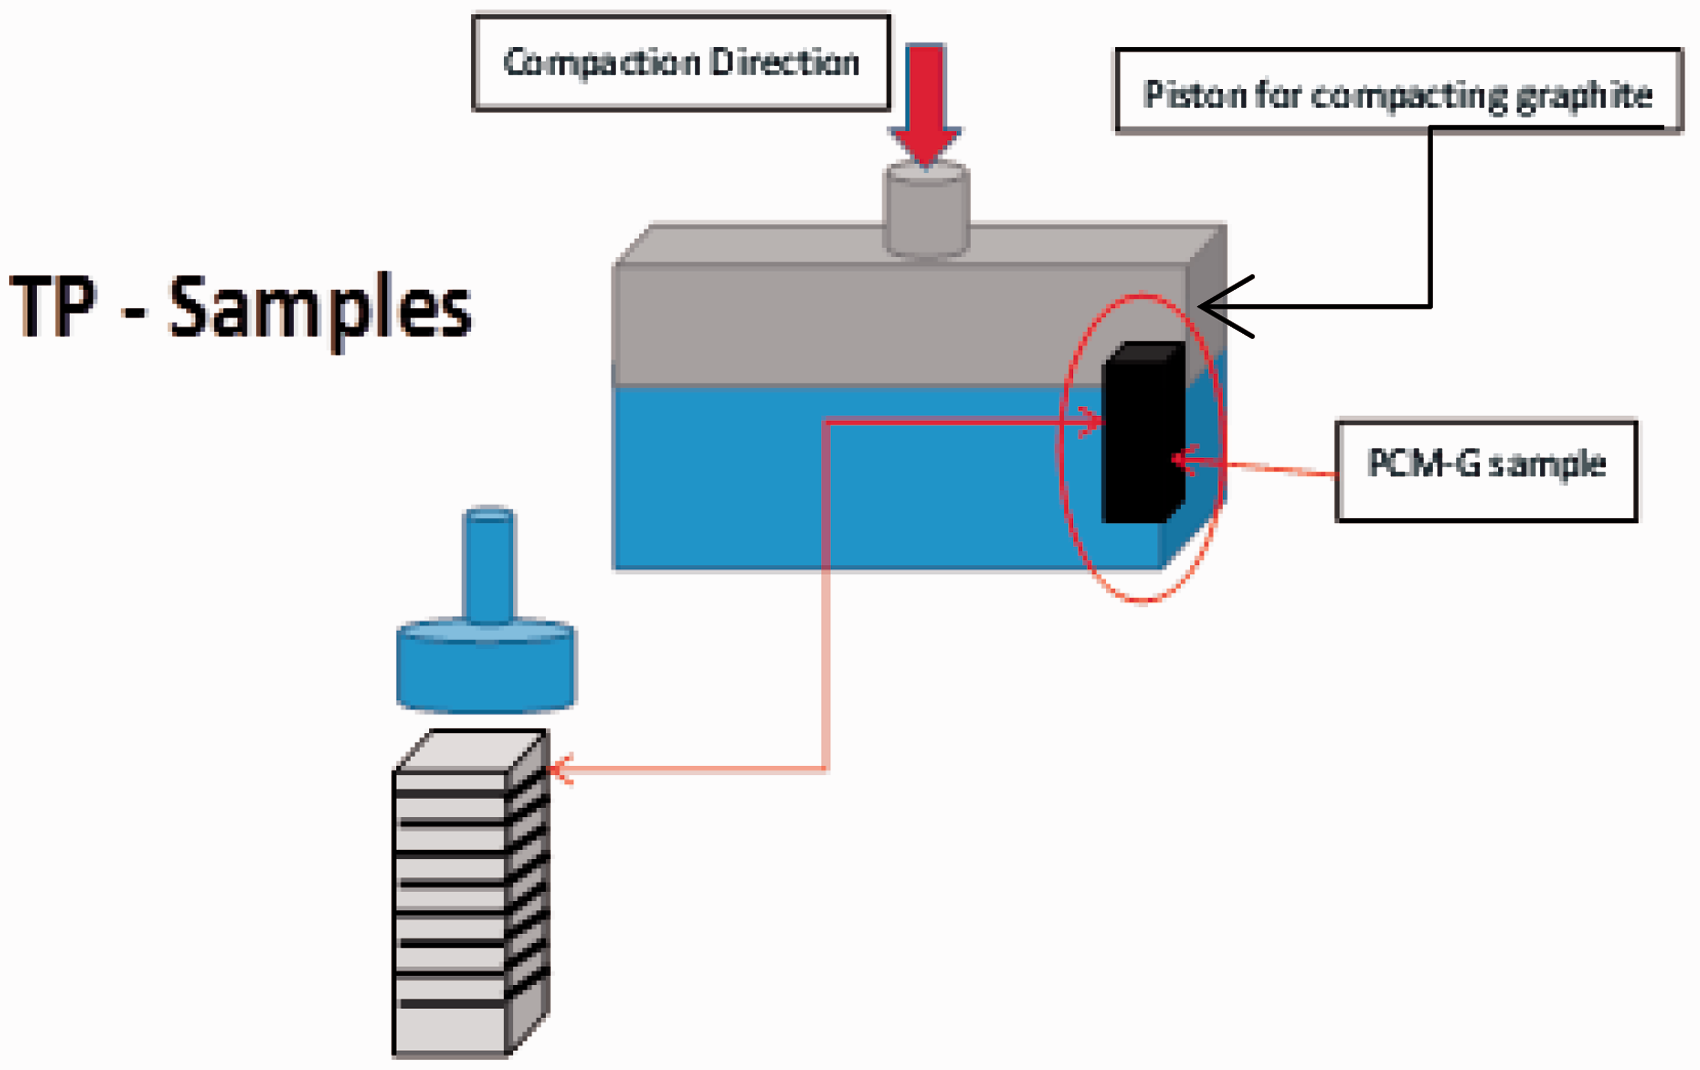
Thermal properties of PCM–EG composite
The thermal diffusivity of PCM–EG composites was measured using a TA Instruments DXF-200 laser flash analyzer. Due to anisotropy of PCM, separate samples were required to test the thermal diffusivity for the TP and IP directions. For each sample and orientation, five cylindrical specimens with a diameter of 12.7 mm and thickness of 2.5–3.5 mm were prepared. To improve electrical contact for the temperature sensor, one side of each sample was covered with a thin layer of silver paint. The sample face receiving the incident laser pulse was left unchanged, since it is sufficiently black to approximate an ideal absorber. Each specimen was tested at 26 ± 2 ℃ with three consecutive laser pulses, separated by 5 min equilibration periods.
Thermal properties of PCM–EG composites.
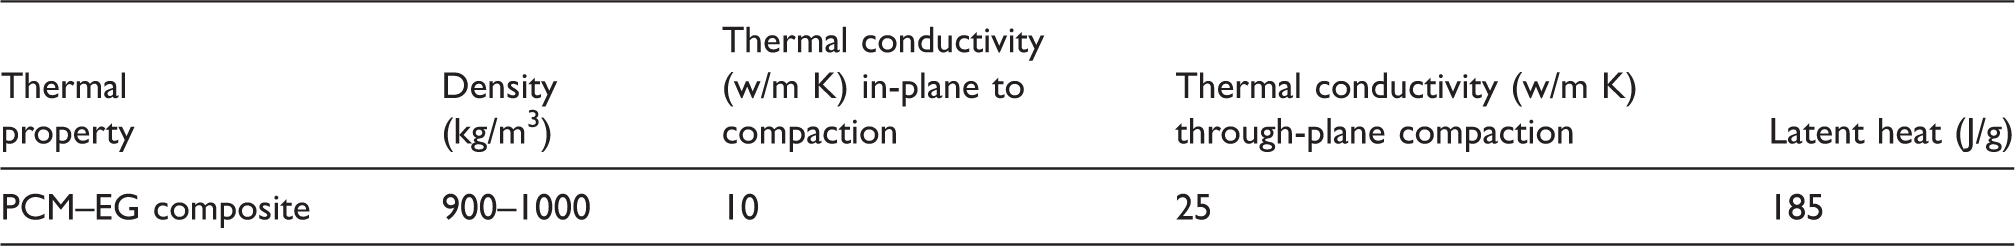
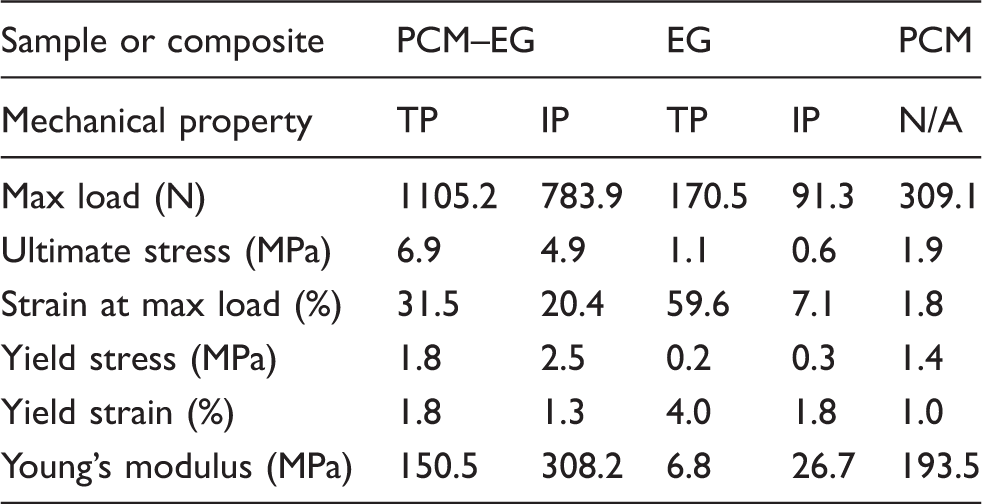
Latent heat of PCM–EG composites was measured using a Mettler-Toledo DSC823e/700 differential scanning calorimeter. Ten specimens weighing 8–12 mg each were placed in 40 μl aluminum pans, which were then hermetically sealed. Each specimen was given a pretest conditioning in nitrogen atmosphere over the range of 10–100 ℃ at a constant ramp rate of 10 ℃/min, followed immediately by cooling at the same rate. The program was then repeated a second time and this dataset was used for analysis. Additionally, two of the 10 specimens were then tested similarly over 10–75 ℃ at a ramp rate of 1 ℃/min. The measured latent heat results of the six samples were averaged and reported in Table 1. Summary results of density, thermal conductivity, and latent heat of PCM–EG finished composites are shown in Table 1.
General compression characteristics for viscoelastic materials
All PCM–EG samples of the stress–strain tests were compressed till failure. Generally, there are three distinct regions like those reported by Goga
6
for viscoelastic compression curves as shown in Figure 5. Historically, the first region exhibits an initial linear elastic region where strain energy is stored in reversible bending of the struts. The second region is a plateau region where struts begin to impinge upon each other. The third region is densification, where viscoelastic material at this stage becomes a solid causing a sudden increase in internal compression stiffness of the cellular network. The compression stress–strain curve of the viscoelastic foam material which is shown in Figure 5 does not show any failure sign after it was compressed to 55% strain since the curve plotted was for a viscoelastic material and not for PCM–EG composite. Usually, the stress–strain curves of PCM, EG, and PCM–EG samples show only one or two distinct regions of the viscoelastic stress–strain curve since failure for graphite composites under compression occurred at earlier stages than the viscoelastic materials due to the presence of PCM brittleness content in their composites. Usually cellular materials can be compressed up to 80% without any failure.
5
A general stress–strain curve for viscoelastic material under compression test. (a) Linear elastic region, (b) plateau region, and (c) densification region.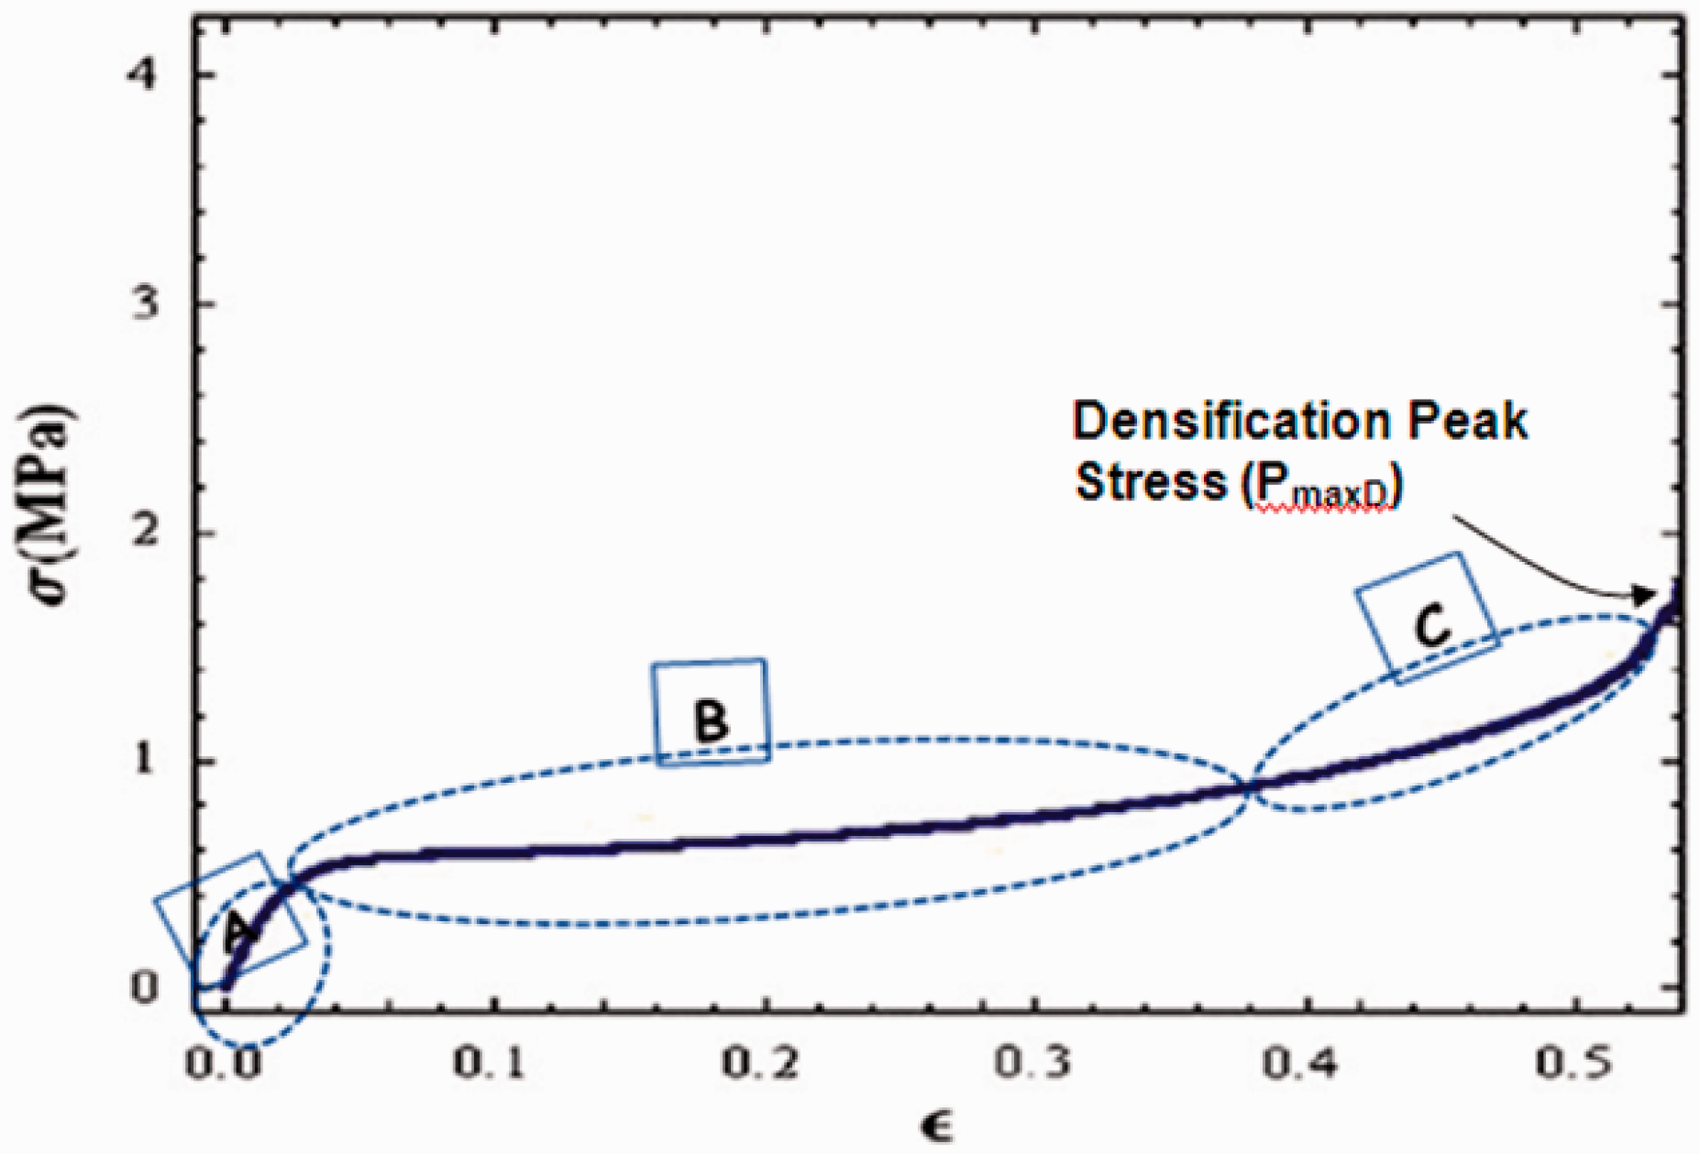
In this research an attempt was tried to fit the viscoelastic compression stress–strain polymeric equation into the compression stress–strain PCM–EG composite samples. Since PCM–EG composites exhibit some brittleness behavior, there was no need to include the densification portion of the viscoelastic equation and only the two regions of A and B in Figure 5 were used to model the phase change graphite composite.
From the mechanical compression tests of EG, PCM, and PCM–EG composites, several mechanical properties such as yield strength, modulus of elasticity, and ultimate strength can be extracted. Also from the least-square curve fit criteria between the mechanical tests and the viscoelastic model, several spring and viscous parameters can be calculated.
Viscoelastic mathematical models for PCMs and graphite composites
Several researchers such as Goga 6 described a new phenomenological model (PFM) for viscoelastic materials. The purpose of Goga's model was to come up with a new simpler model that has few parameters and can be a simplified model for predicting behavior of the compression stress–strain curve for polyurethane foam. Since polyurethane foam is a nonlinear viscoelastic material, Goga replaced this material with mechanical systems such as springs and dashpots. Springs represent an elastic linear component with restorative forces and dashpots represent a viscous linear component with damping forces. Connecting a spring and a dashpot in series yields the Maxwell model; this is also known to be the Maxwell arm. While connecting a spring and dashpot in parallel yields the Kelvin–Voigt model. Designing different mechanical combinations of these basic models gives engineers an opportunity to model viscoelastic materials with different mechanical property behaviors.
The PFM model that Goga generated for polyurethane foam is shown in Figure 6. This model is a combination of a Maxwell arm model which is located in the middle of Figure 6. From each side of the model, a couple of springs were connected in parallel to the Maxwell arm.
Polymeric phenomenological foam model (PFM).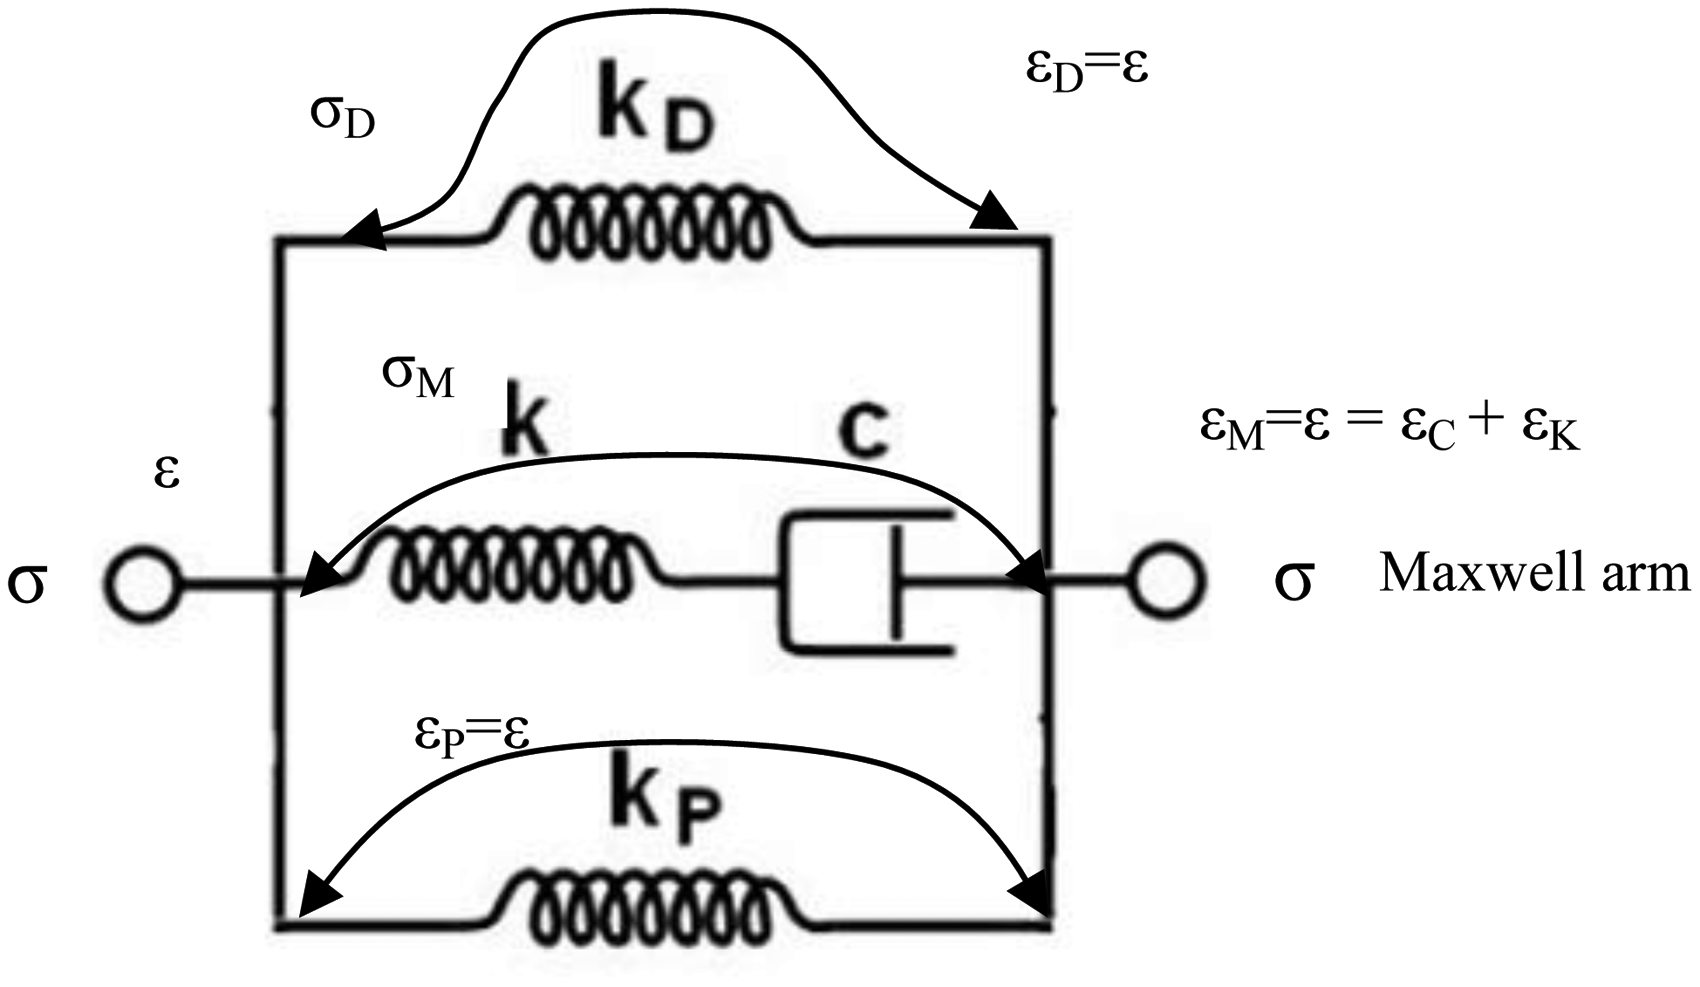
The first spring system “Kp” from the lower part of the PFM model in Figure 6 simulates linear spring stiffness in the plateau region which is also shown in Figure 7. The middle portions of the model “i.e. K & C” in Figure 6 represent the Maxwell arm. The Maxwell arm of the PFM model is a combination of the spring stiffness K and the damping viscosity C of the dashpot. The last portion from the top part of Figure 6 represents the second spring system KD which covers the nonlinear spring stiffness system in the densification region of Figure 7. The compression stress–strain response of the Maxwell arm along with the linear and the nonlinear spring coefficients is shown in detail in Figure 7 and this was shown also by Goga.
6
Stress–strain of the new foam model.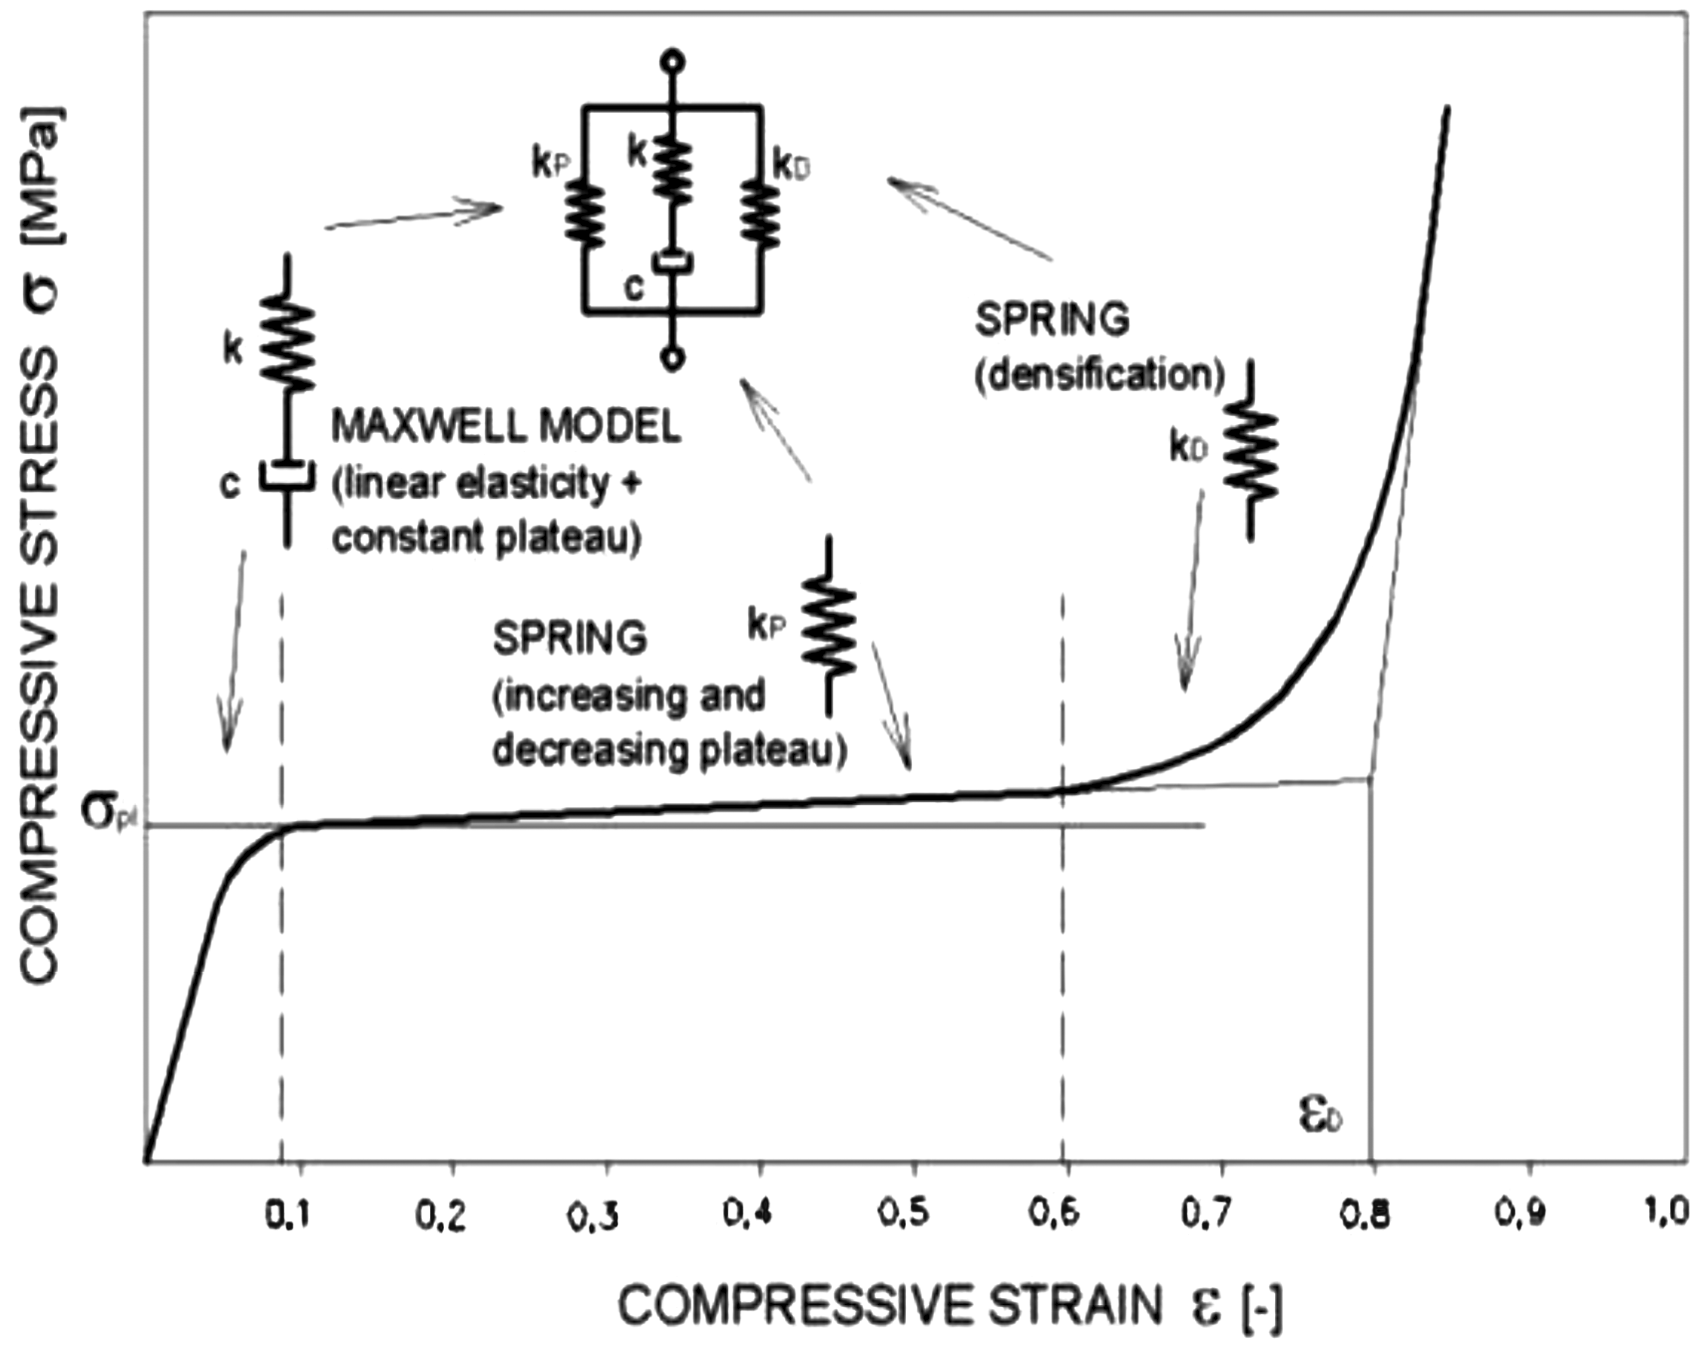
Equation (1) represents the total stress of the PFM model for Figure 7 and it contains three components of stresses: the first stress term 

Derivation of equation (2) was done comprehensively and in detail by Alzoubi et al.
5
Variables and constants of equation (2) can be identified as the following
ɛ is the total strain,
For the parallel components
K is the stiffness of the spring element in the Maxwell arm. C is the damping coefficient of the dashpot and γ is the densification coefficient and n is the polynomial exponent of the nonlinear spring element in densification region.

Equation (2) represents the overall general compression stress–strain equation for three regions of the foam which includes the Maxwell arm region, the plateau, and finally the densification regions. It should be worth to mention here that this equation was derived based on isotropic viscoelastic linear materials and it will be used for curve fitting the compression tests of the phase change and EG composites.
Test method
A total of 10 PCM–EG rectangular samples for which five samples were cut in TP and another five samples were cut in IP directions. Dimension of all samples was 12.4 mm width × 12.4 mm thickness × 25.2 mm height for which all samples were tested in the 25.2 mm TP and IP compaction directions. Quasi-static compression tests with 15 cm diameter platen of an Instron 3300R floor model universal testing system with load accuracy ±0.5% of reading; extension rate precision ± 0.2% of set speed was used. Instron instrument with 50 kN load cell was used to conduct all compression tests. All experiments were conducted per ASTM standard D695 at 52 mm/min platen speed.
Figure 8 shows a schematic diagram of the TP versus IP samples for PCM–EG composite samples. All experiments were conducted at constant temperatures of 25 ℃. The compression stress–strain curve tests were recorded as a function of time using a data acquisition program. Elastic moduli of elasticity of composite samples were calculated at yield loading for each test accordingly.
TP versus IP composite sample directions.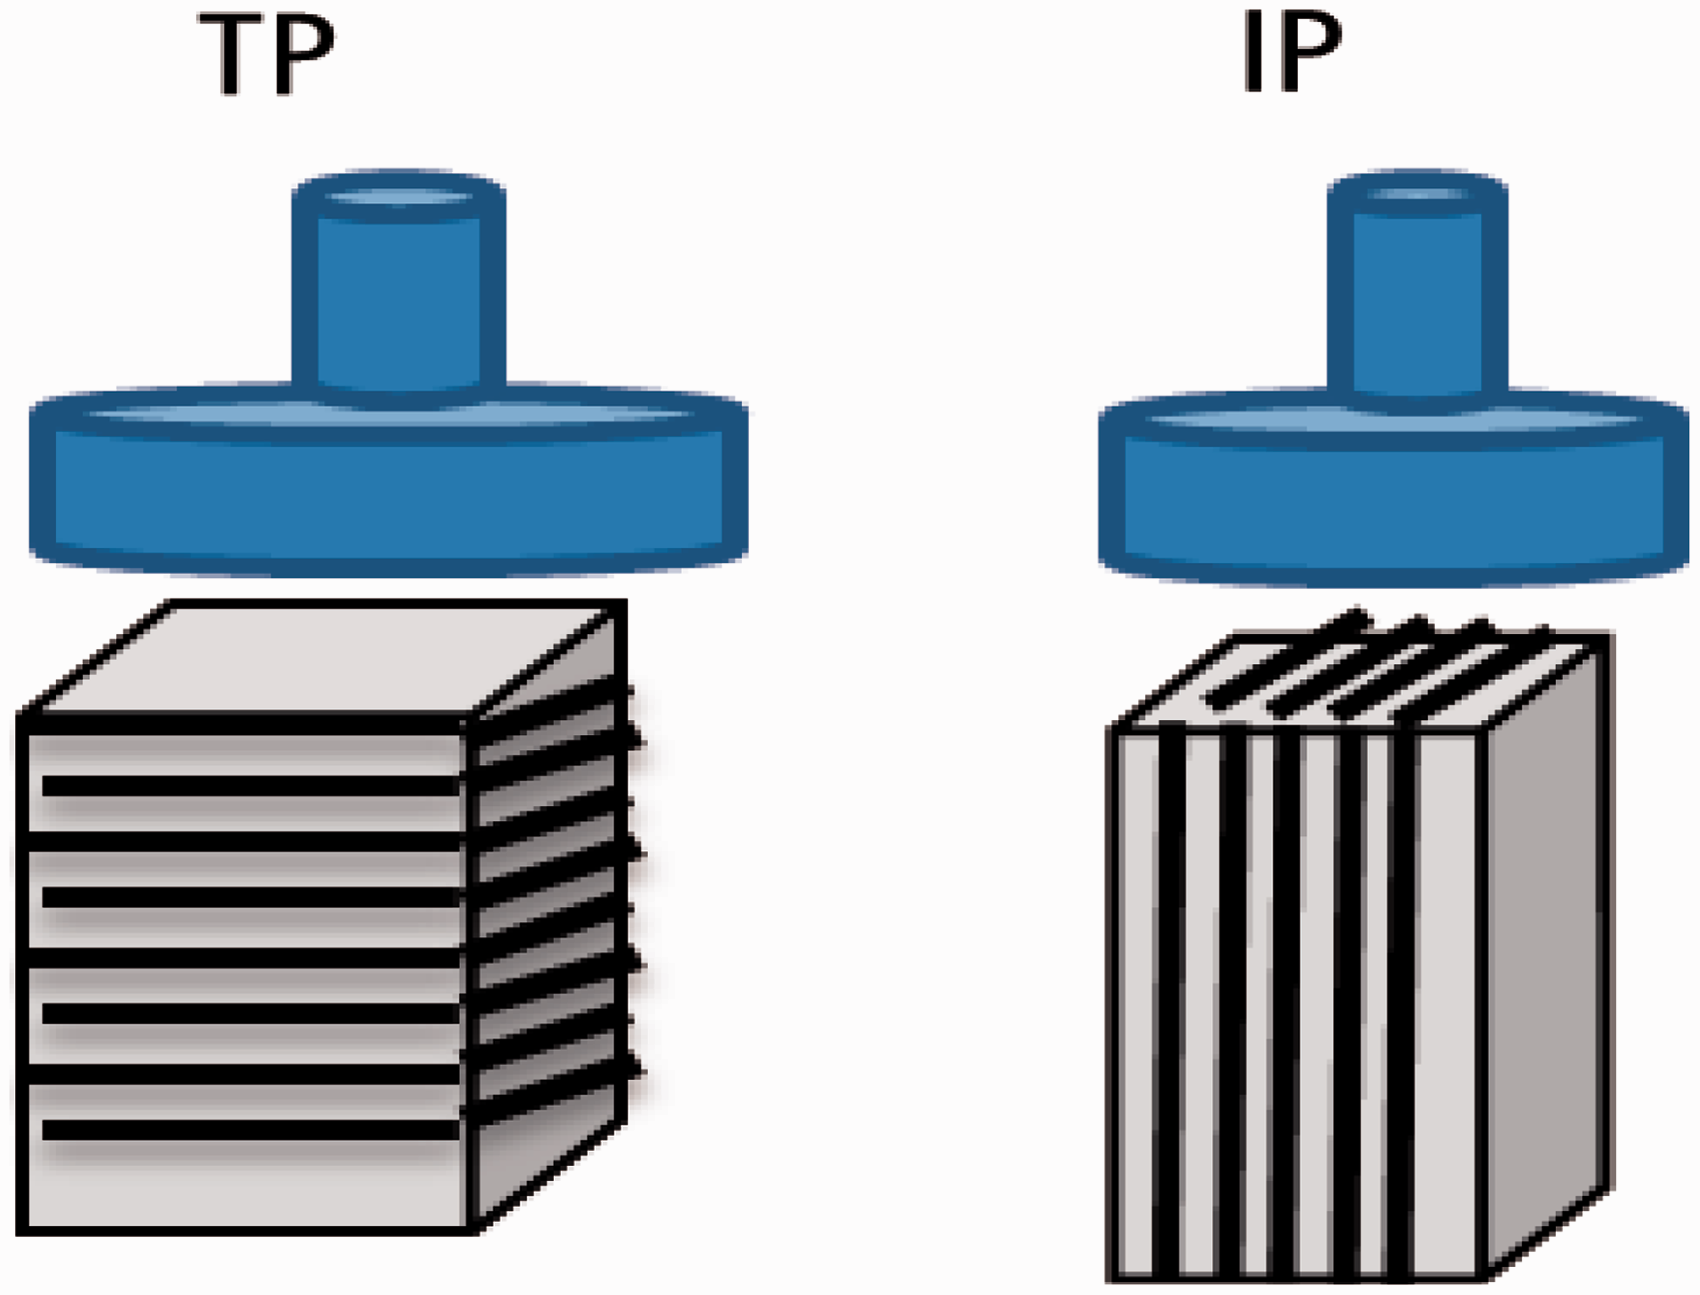
Results and discussion
Experimental compression tests for PCM–EG and EG sample results
Uniaxial quasi-static compression tests were performed for all PCM–EG samples in both TP and IP directions. All tests were conducted at a constant 52 mm/min platen speed. Five samples were tested for each sample type directions. Figure 9 shows compression stress–strain curves for five identical samples in TP orientation whereas Figure 10 shows compression stress–strain curves for five samples in IP orientation.
Quasi-static compression test response for five samples of PCM–EG in TP orientation. Quasi-static compression test response for five samples of PCM–EG in IP orientation.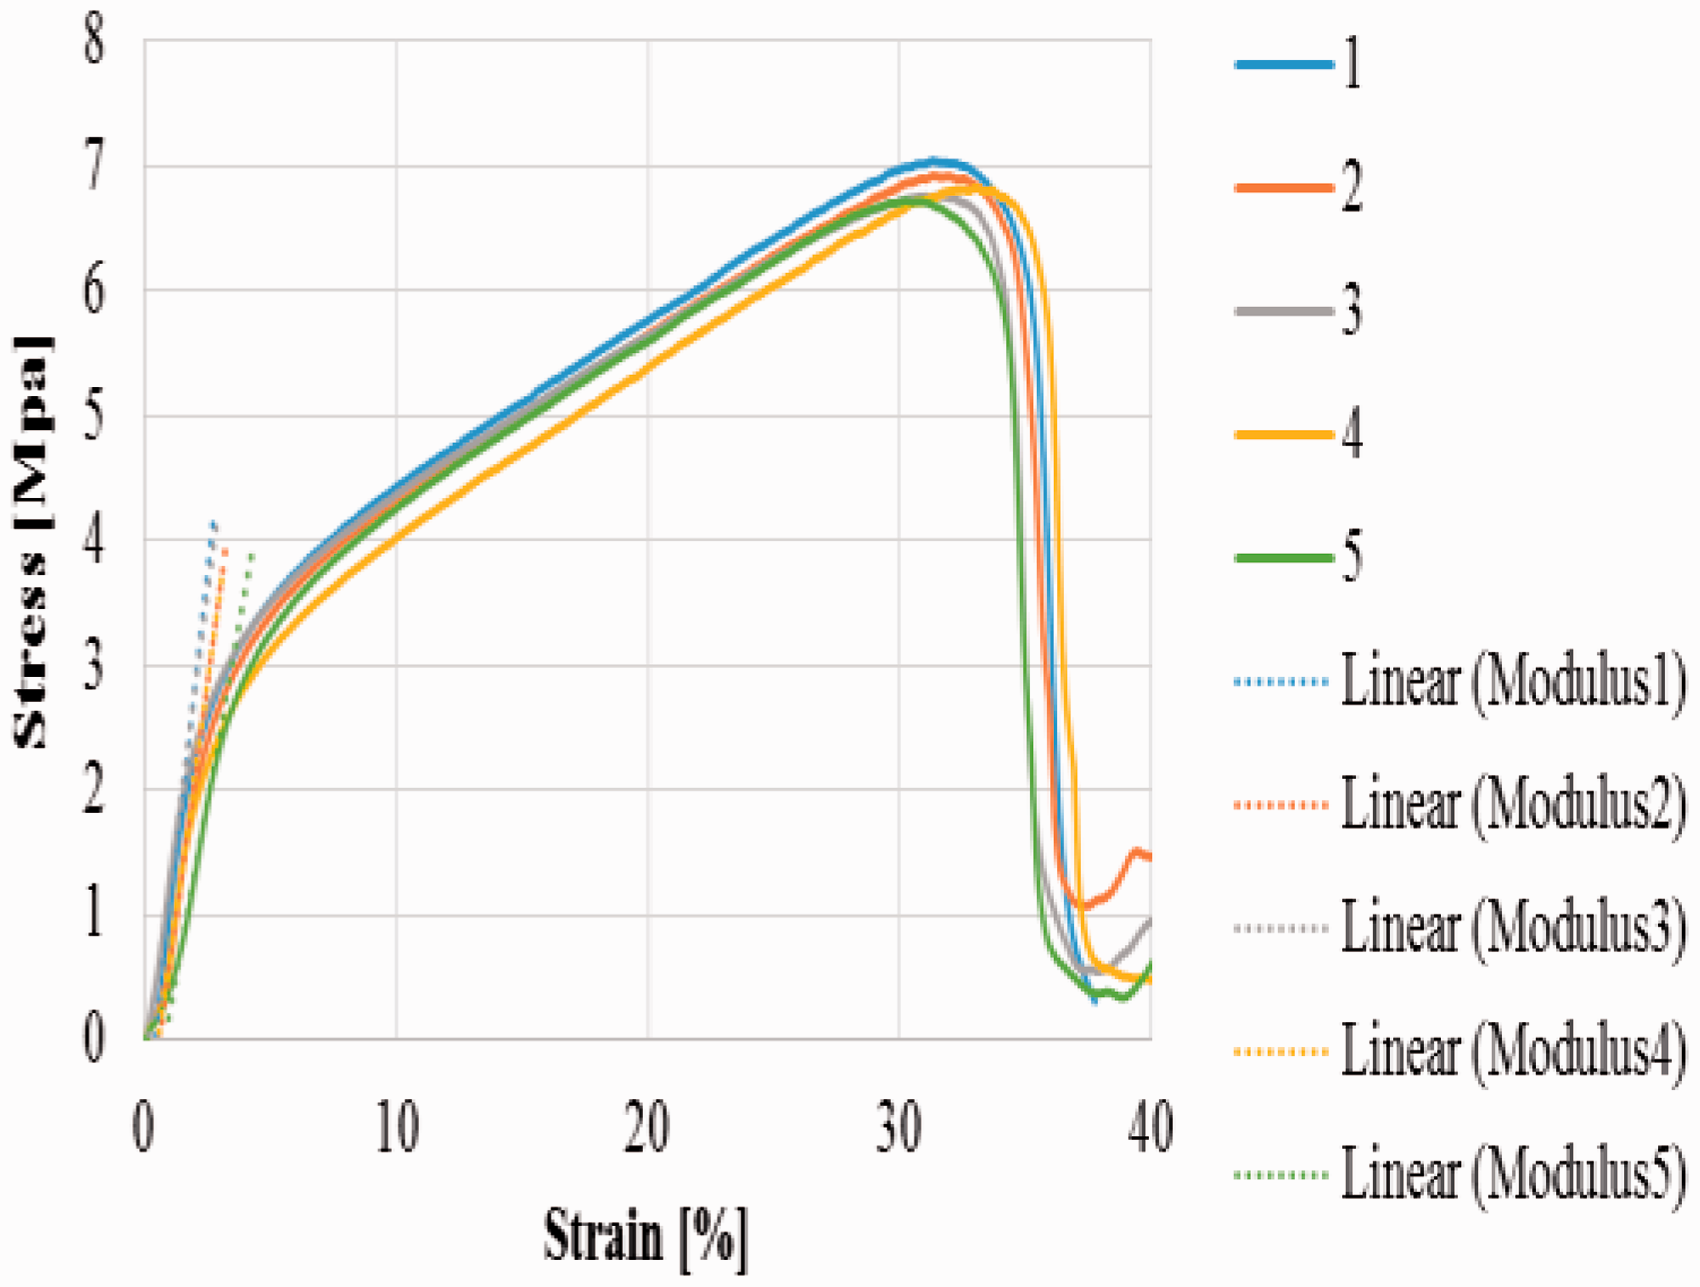
For a better representative comparison between IP and TP for the PCM–EG composites, an average compression response with linear error bar graphs ranges from 5 to 10% for PCM–EG, EG in both IP and TP orientations, and PCM samples were plotted on same figure as shown in Figure 11.
Left graph: Quasi-static compression test response for PCM–EG, EG, and PCM samples. Right graph: is a magnification of the circled region from left graph.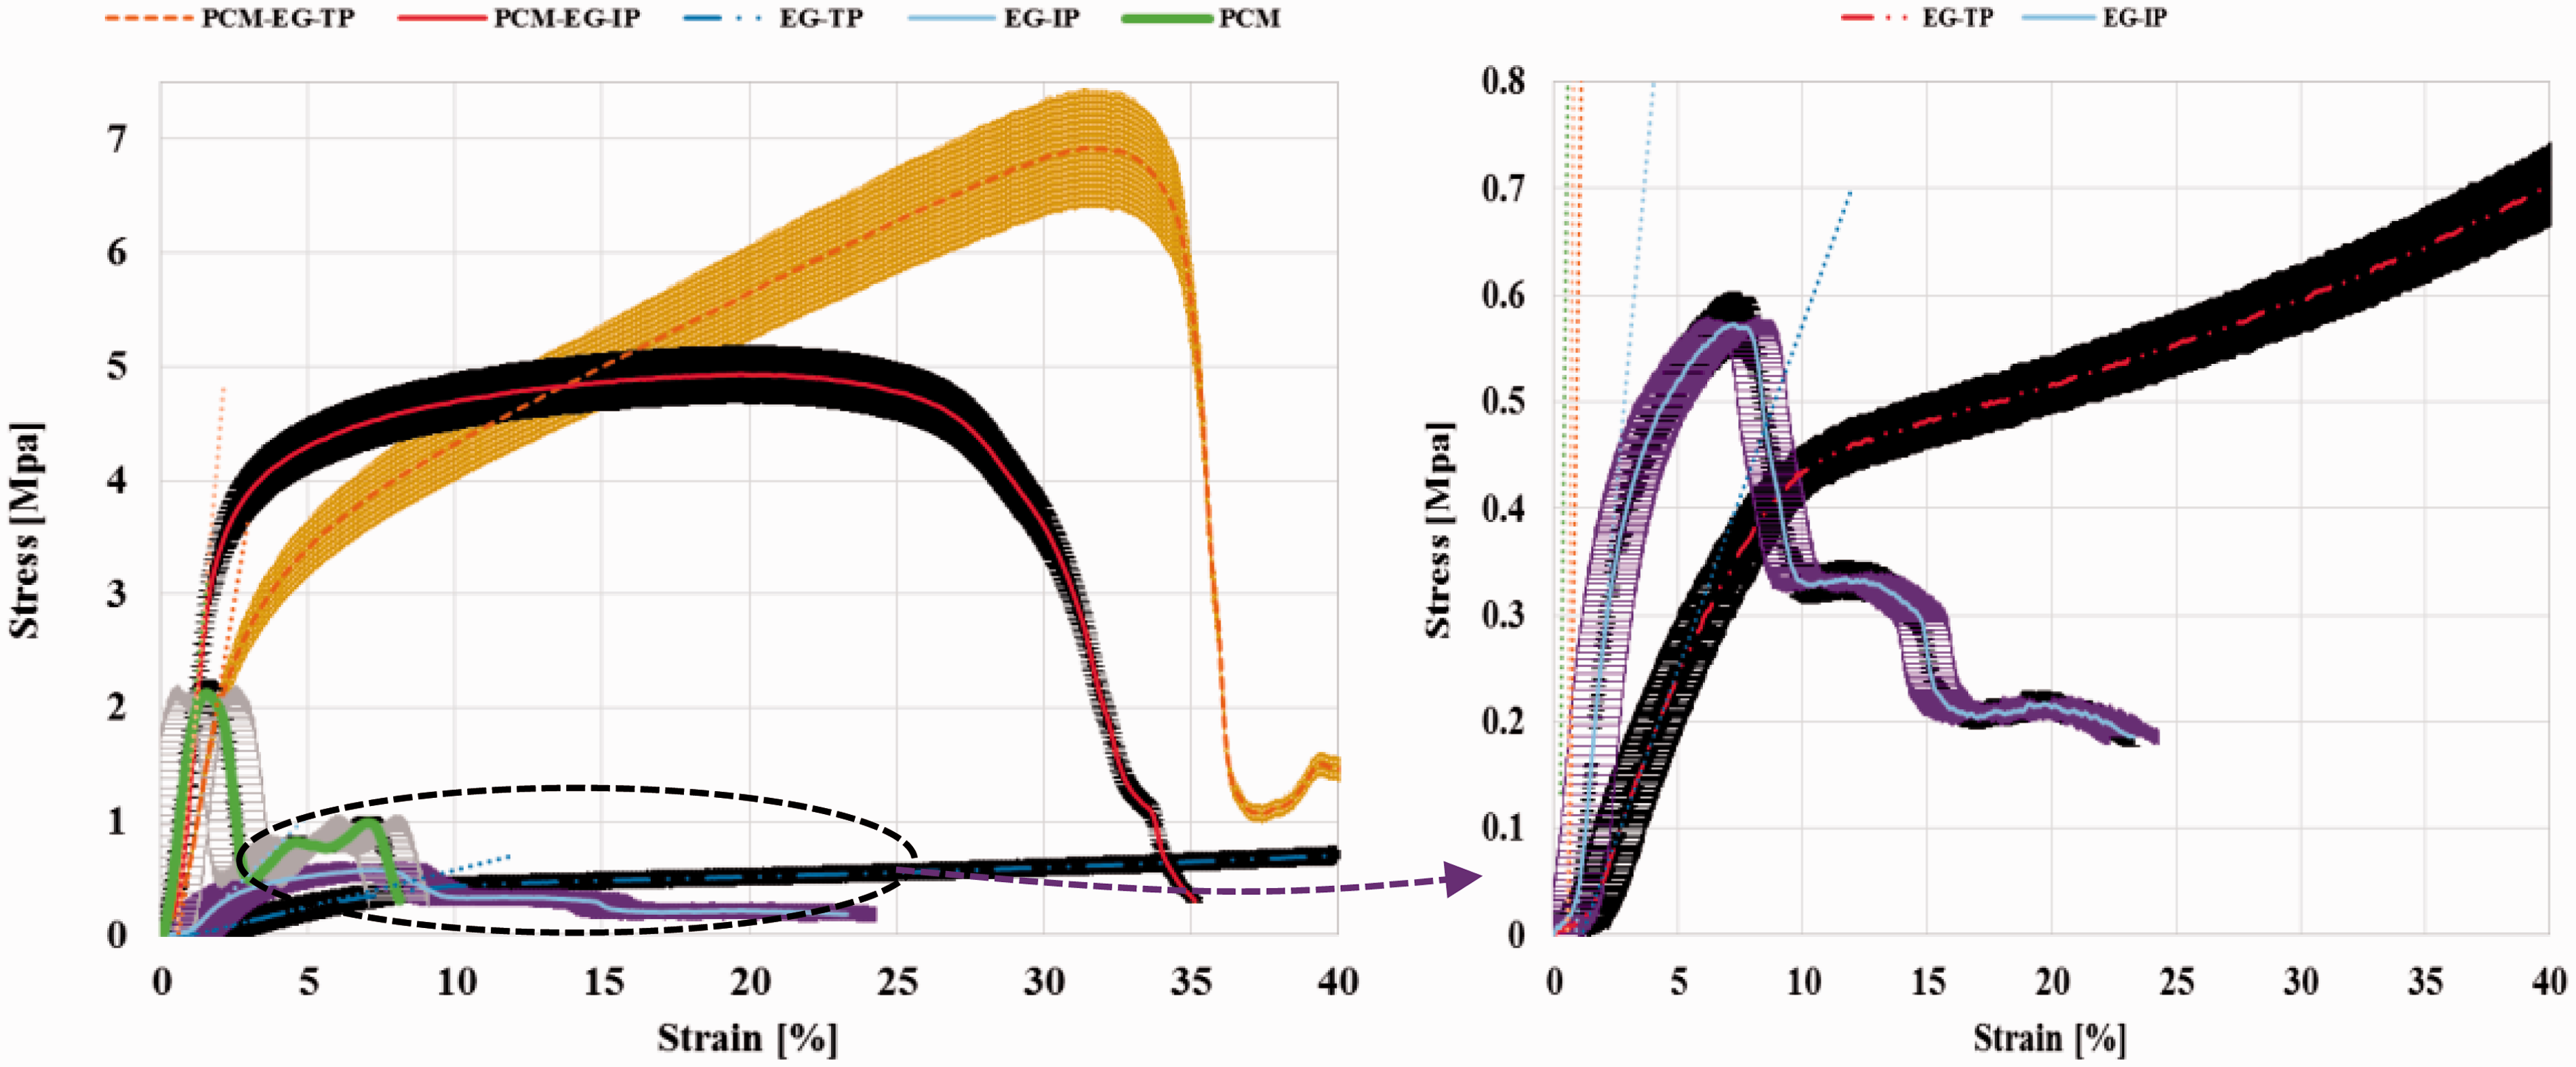
Figure 11 shows the average compression stress–strain test curves for all samples of PCM–EG, EG in TP and IP orientation, and PCM graph was added to the graph as well. Direction for PCM sample was independent of TP and IP orientation. The average stress–strain test results were calculated from running five samples for each material or composite sample. An error range between 5 and 10% was recorded from running five samples for each composite sample type and the error bar graph was added to all tests in Figure 11. It is obvious from Figure 11 that PCM–EG-IP sample has stiffer response than that for TP direction up to almost 13% strain. Interestingly, these curves have an opposite response after the 13% strain which resulted in higher ultimate compressive strength for TP than for IP direction. After the postelastic yield region, the physics of this composite shows an interesting complex and opposite behavior to the elastic region. Researches and engineers should make more attention to the elastic region application for these EGs rather than the postelastic yield region.
Figure 11 shows similar stress–strain response between EG for TP and IP and for PCM-TP and PCM-IP. The last observation in this curve is the compression stress–strain response of PCM sample. PCM sample shows very brittle response since it breaks almost at yielding without going further into the ductility regions as PCM–EG and EG composites do.
Mechanical properties of PCM–EG, EG, and PCM composites measured from Figure 11.
Curve fittings of PCM–EG experimental compression tests with viscoelastic model
PCM–EG
It is interesting to note that when comparing compression stress–strain curves for PCM–EG, EG, and PCM samples of Figure 11 with the viscoelastic compression curves of Figure 7, all curves show similar characteristics except that there is no densification region for PCM–EG and EG composites. Therefore, compression stress–strain test results of PCM–EG and EG samples in both IP and TP directions will be modeled using the viscoelastic model of equation (2) without the densification term and this yields the following equation

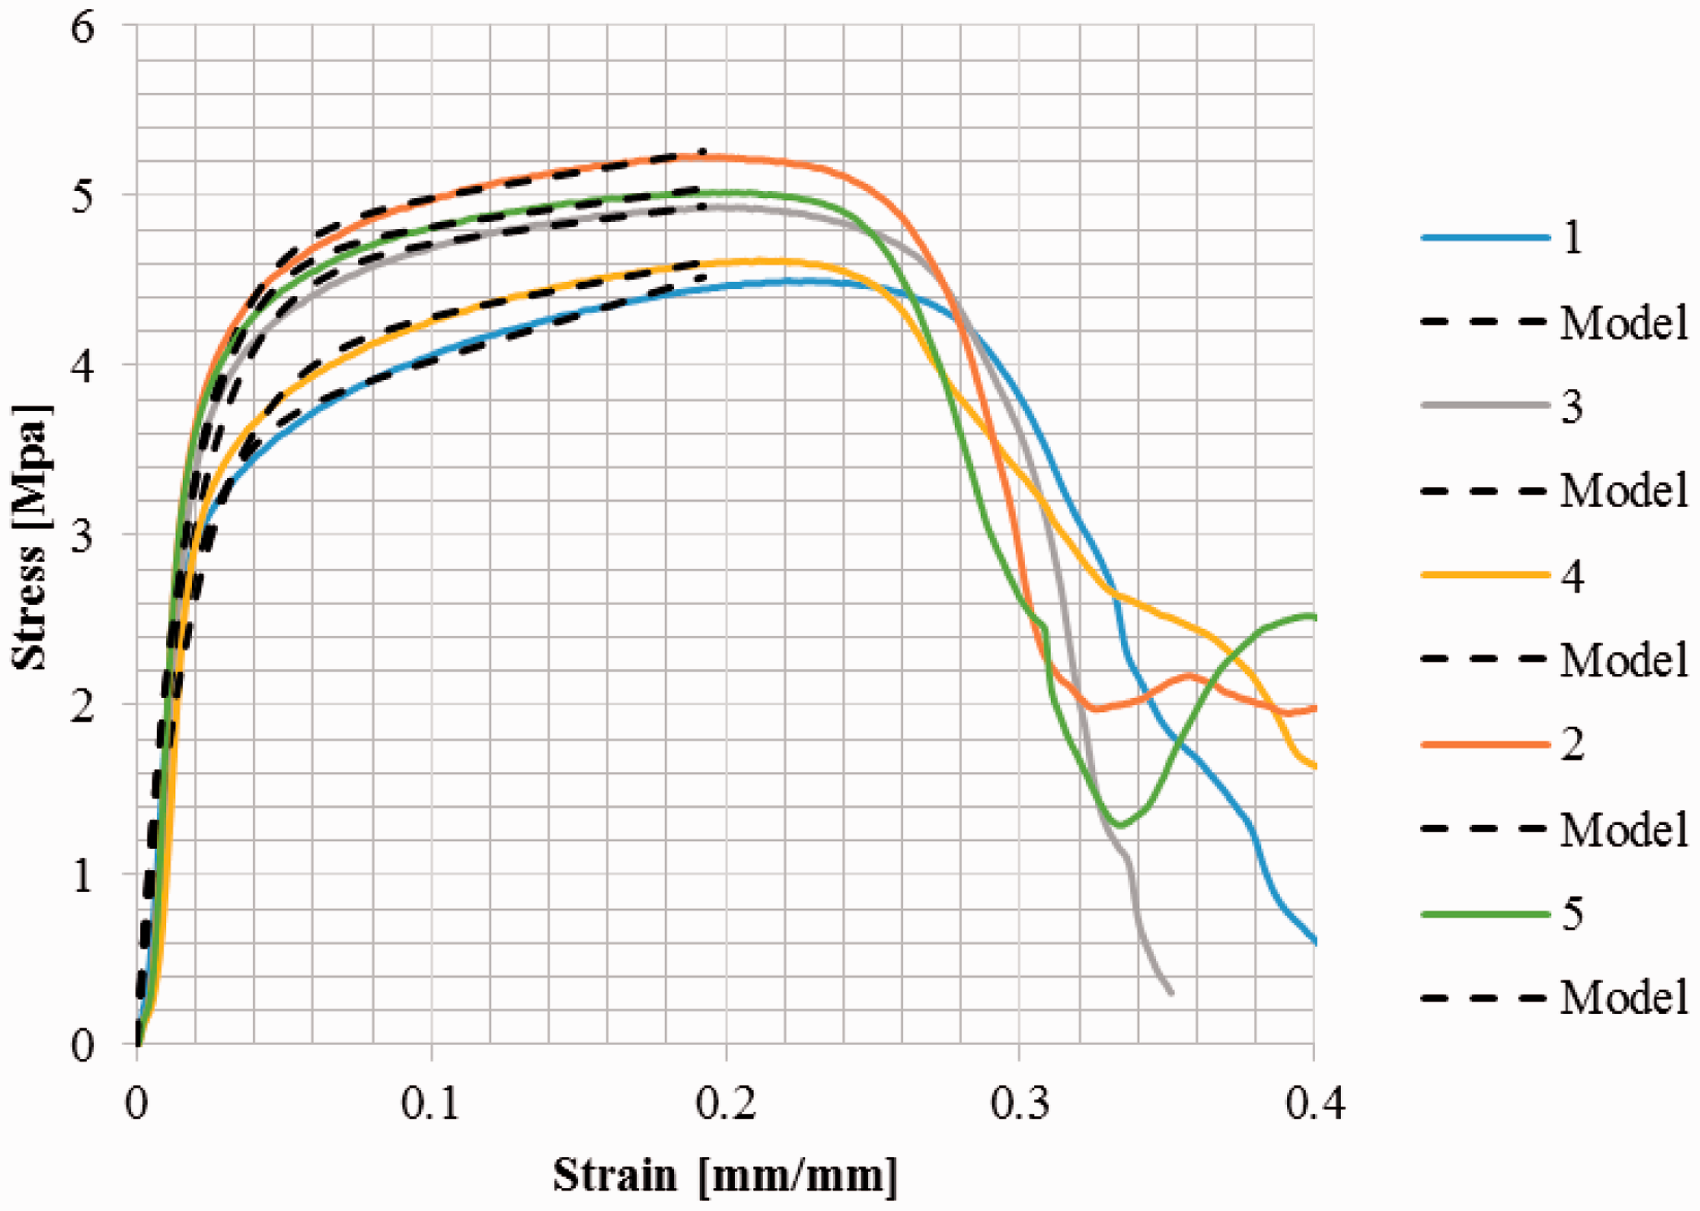
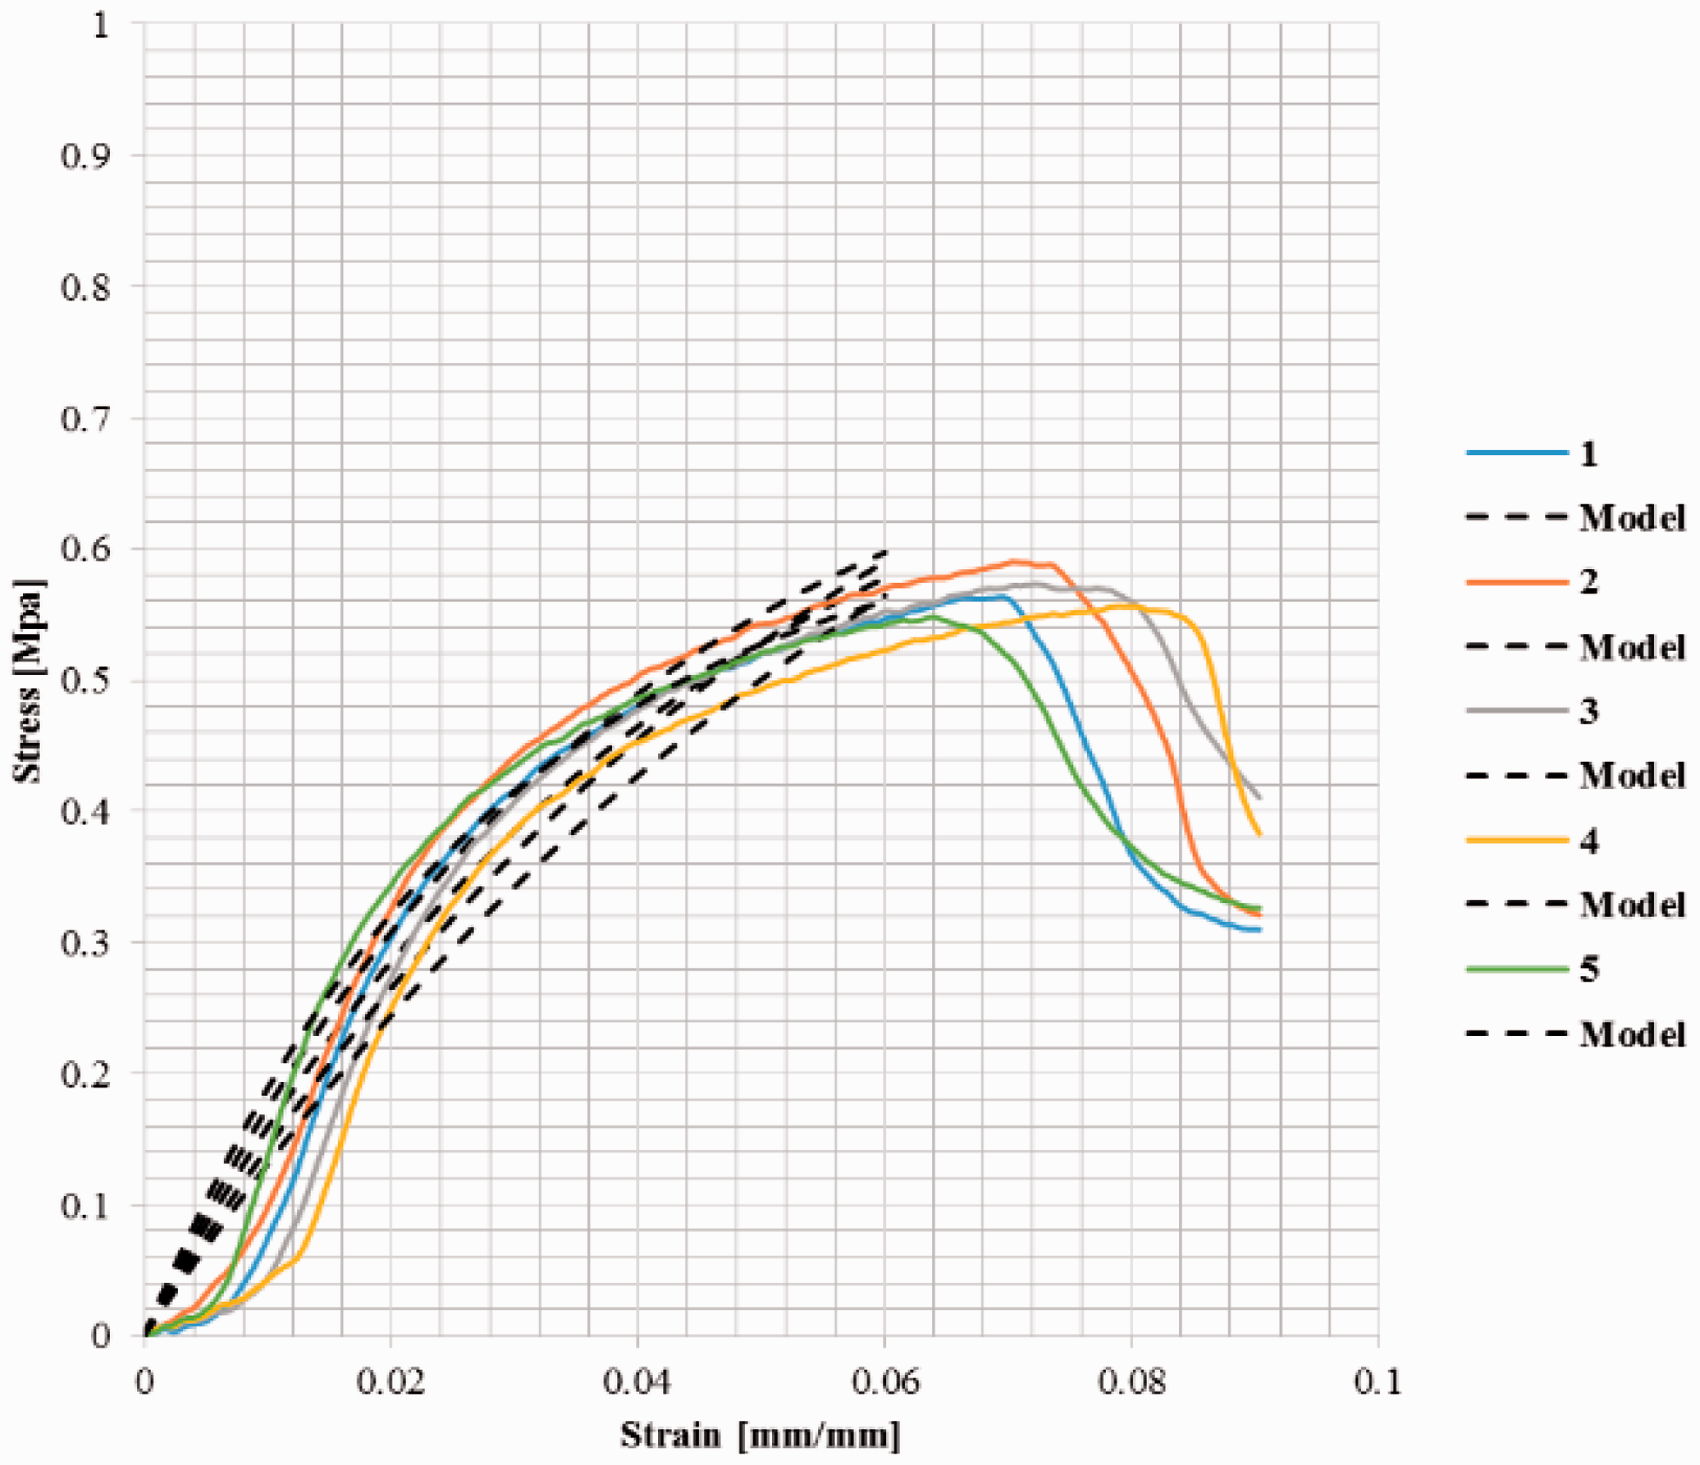
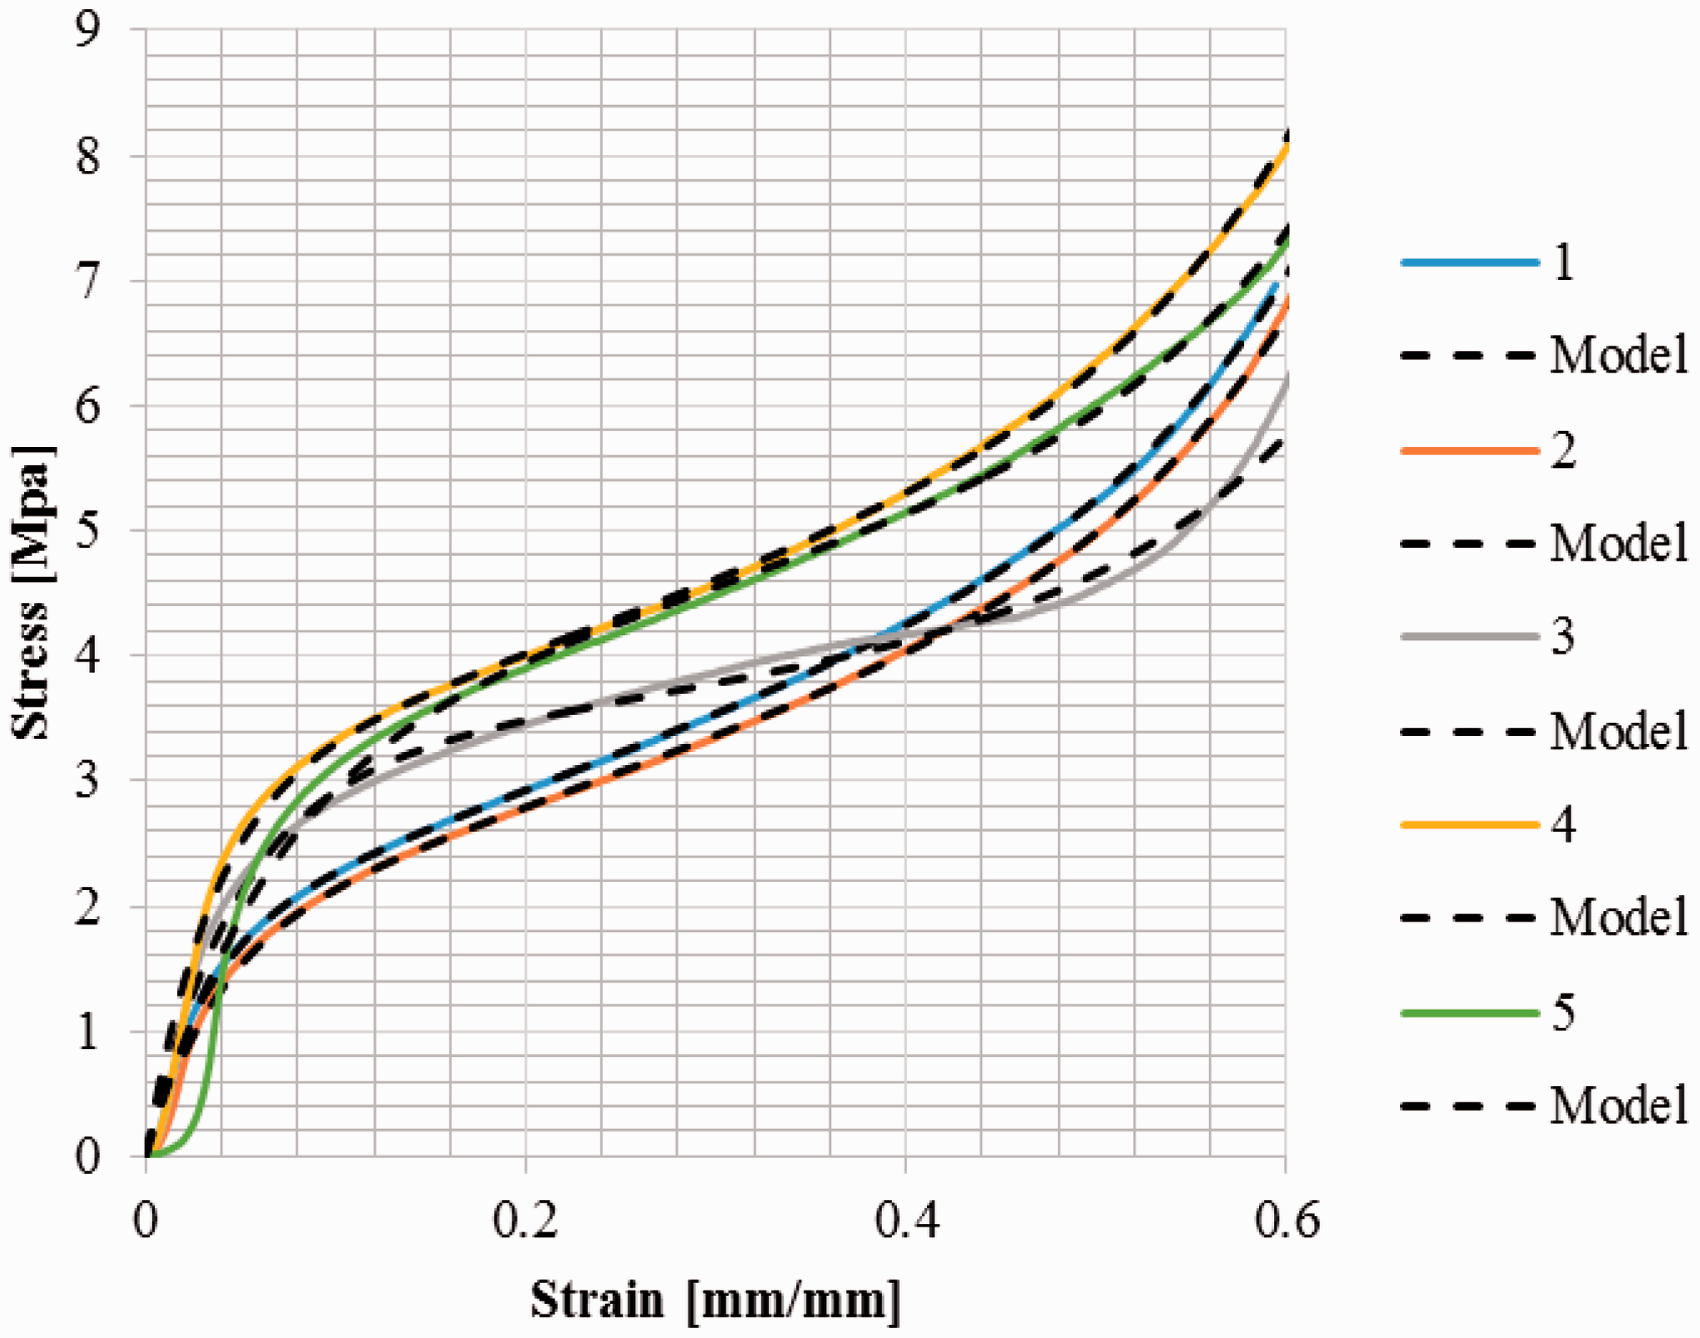
Experimental compression tests for PCM–EG in TP and IP directions for five samples and their viscoelastic curve fitted model were plotted in Figures 12 and 13, respectively.
Experimental and viscoelastic model stress–strain compression tests for PCM–EG in TP direction samples. Experimental and viscoelastic model stress–strain compression tests for PCM–EG in IP direction samples.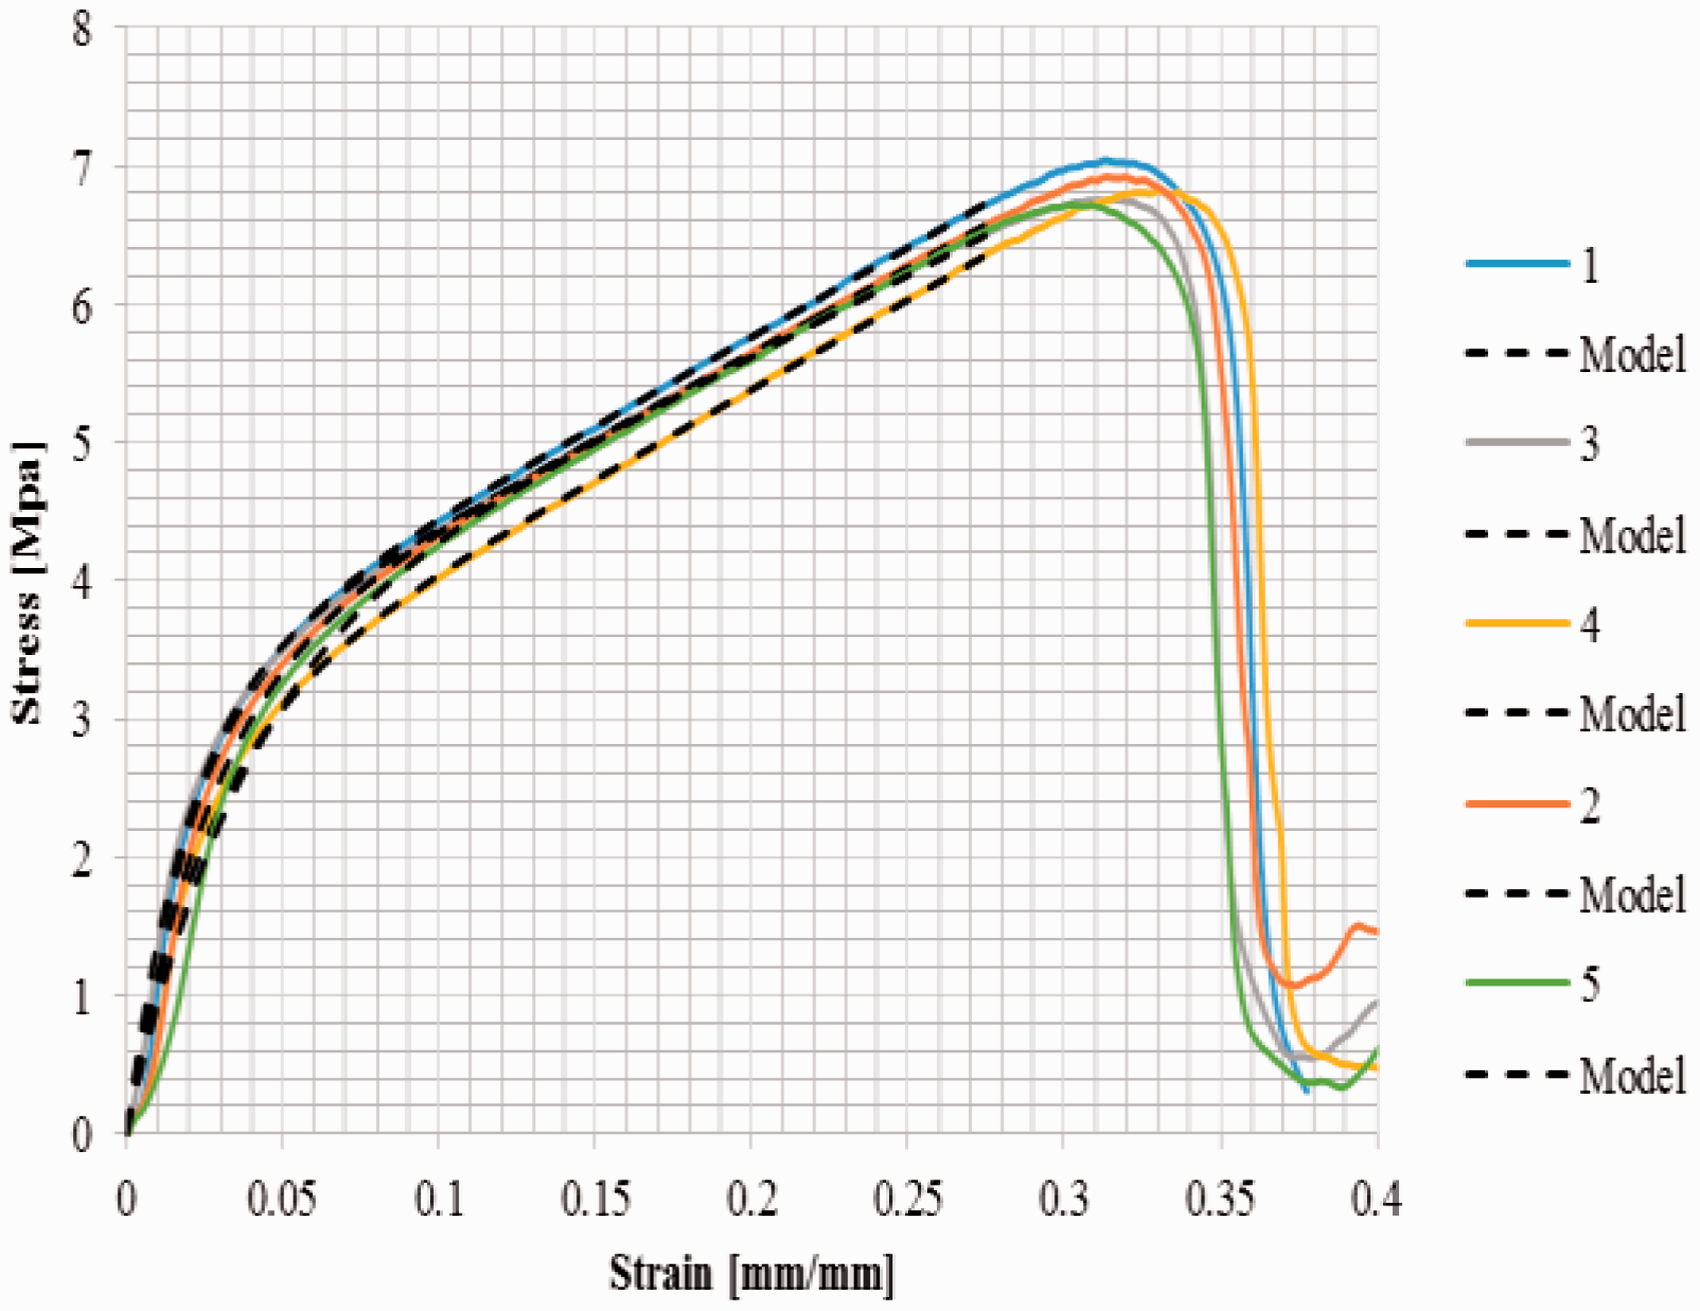
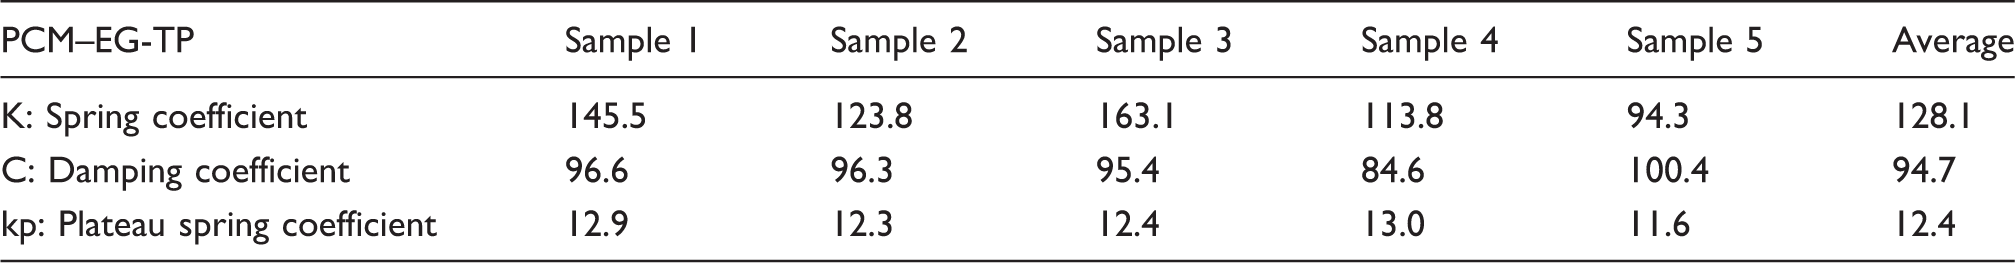
K, C, and Kp resulted viscoelastic parameters for PCM–EG-TP direction.
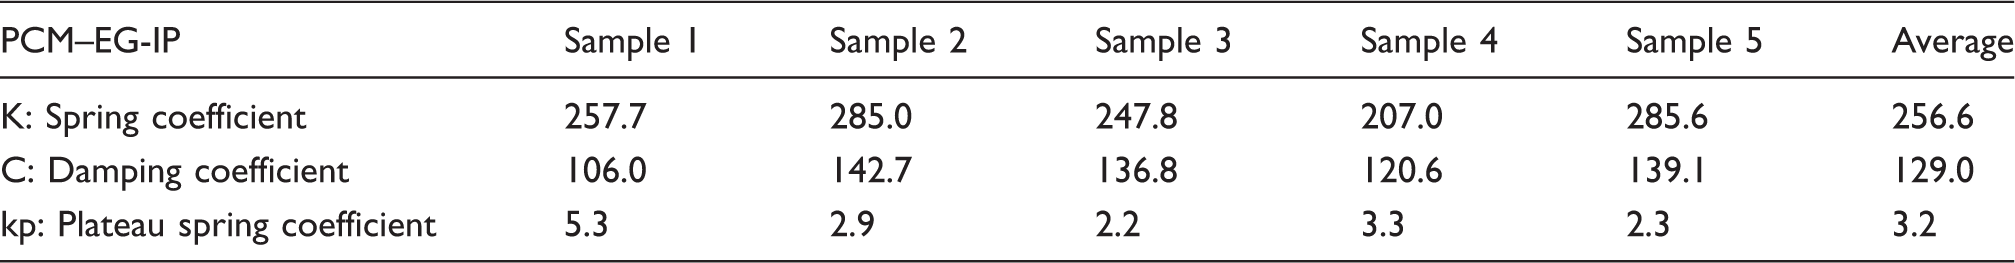
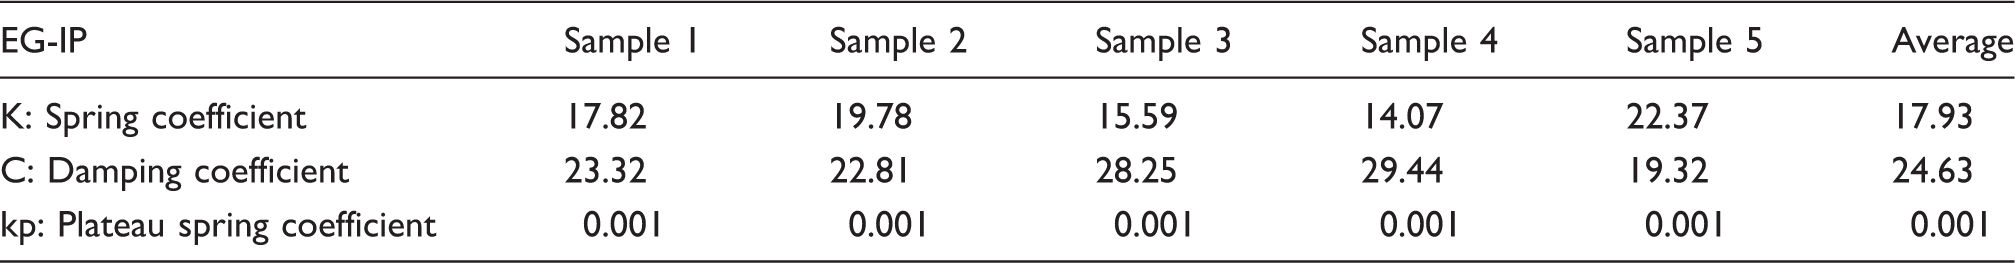
K, C, and Kp resulted viscoelastic parameters for PCM–EG-IP direction.
EG
Likewise, the compression stress–strain results of EG samples will be modeled using the PFM equation with excluding the densification region.
Experimental compression tests for EG in both TP and IP directions including their viscoelastic curve fitted model were plotted in Figures 14 and 15, respectively.
Experimental and viscoelastic model stress–strain compression tests for EG in TP direction samples. Experimental and viscoelastic model stress–strain compression tests for EG in IP direction samples.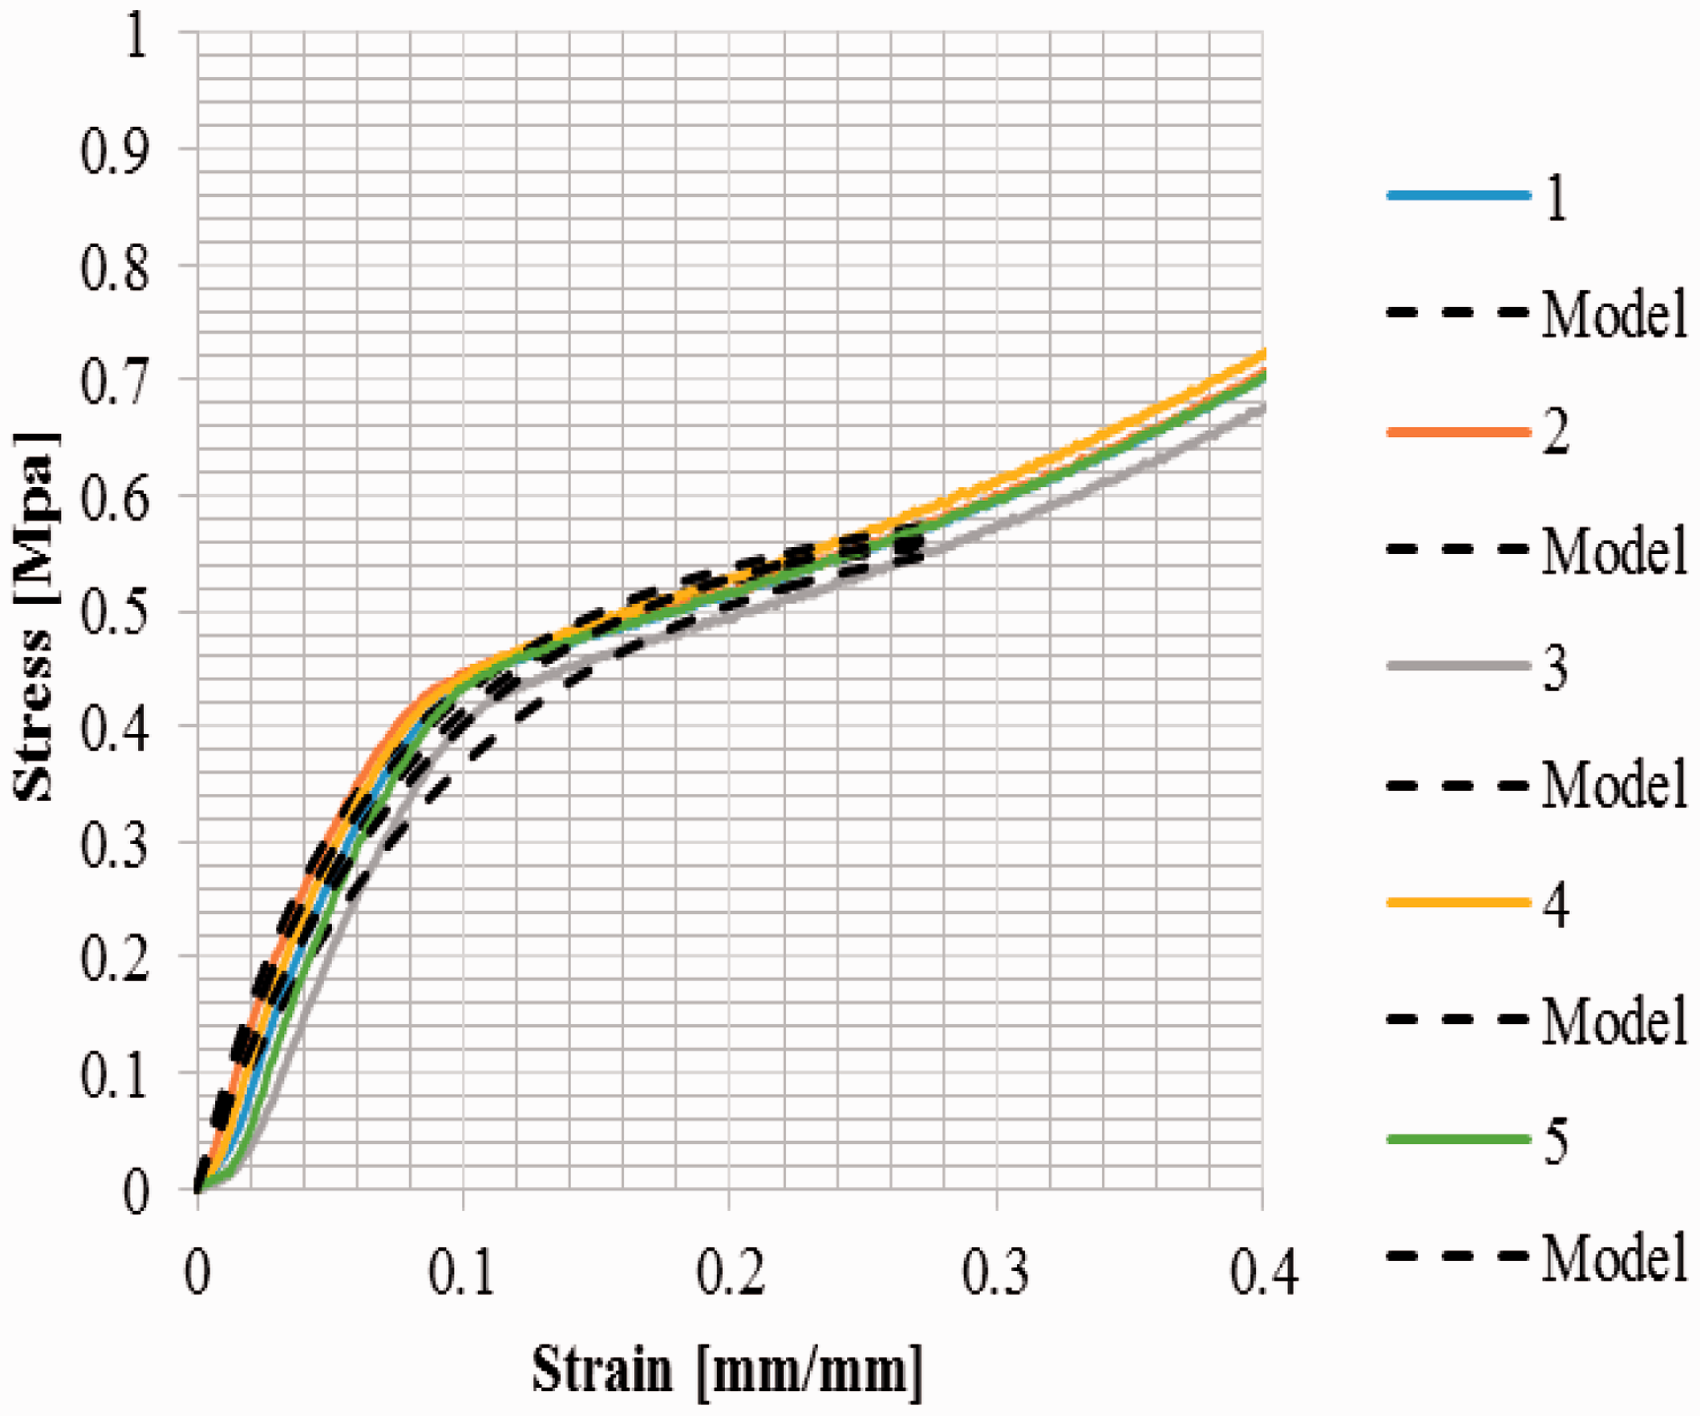
K, C, and Kp resulted viscoelastic parameters for EG-TP direction.
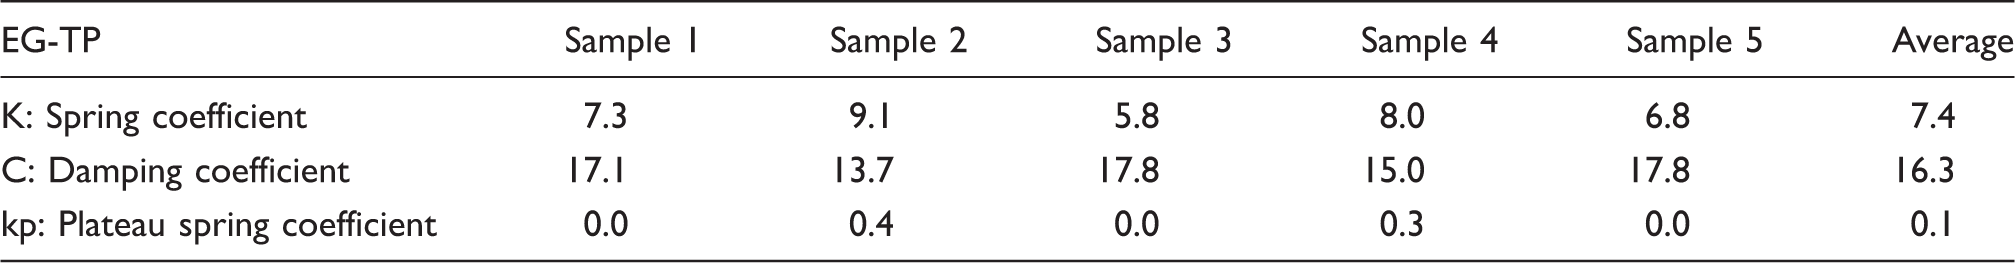
Figure 15 shows that the compression experimental tests have nonlinear behavior and were not on a good agreement with the curve fitting of the PFM equation as they were for the PCM–EG and EG-IP composites. This can be potentially explained due to the nature of the PFM equation which is more appropriate to be used for viscoelastic isotropic composites such as PCM–EG rather to be used for EG anisotropic brittle material characteristics. Therefore, this could be due to the fact that compacting EG and test EG samples cut in TP direction has anisotropic characteristics and not purely elastic. An interesting observation is worth mentioning here and that is for same EG, compression testing of the EG-TP direction samples shows brittle linear characteristics whereas compression testing of the EG in IP direction shows anisotropic nonlinear material behavior. Another hypothesis is that when compressing the anisotropic EG and based on the graphite fiber orientation of the composite, it is most likely that the samples cut in the IP direction cannot be characterized purely by compression test and other mechanical tests need to be conducted. Therefore, in order to better curve fit the data for the EG-IP direction, other mechanical tests such as tensile, biaxial planer, and bending tests should be carried out to characterize for the EG-IP anisotropic material. This is could be an interesting potential subject for future publications.
K, C, and Kp resulted viscoelastic parameters for EG-IP direction.
PCM–EG-POLYMER
To fully utilize the three regions of viscoelastic of equation (2), this research was expanded to include a polymer such as silicon that was added to the PCM–EG composite. The resulted composite which includes phase change composite, expanded graphite, and silicon (PCM–EG-POLYMER) will be simulated using the three portions of the PFM equation. This polymer was added to the PCM and EG composite using a proprietary molding technique for AllCell Technologies LLC. The purpose of this addition is to give the PCM–EG composite more viscous characteristics which may result in a composite exhibiting more flexibility and compressibility that might be used for pouch cell applications. Since this resulted composite of PCM–EG-POLYMER has more viscous characteristics than the PCM–EG composite, simulation of their compression stress–strain tests will be extended to curve fit the three portions of the PFM equation.
The PCM–EG-POLYMER composite samples that were used in this experiment by weights contain 50% of PCM which is responsible for energy storage functionality, 20% of EG for thermal conductivity ability to conduct heat, and finally 30% of silicon polymer to give the composite enough flexibility and compressibility for pouch cell applications in particular.
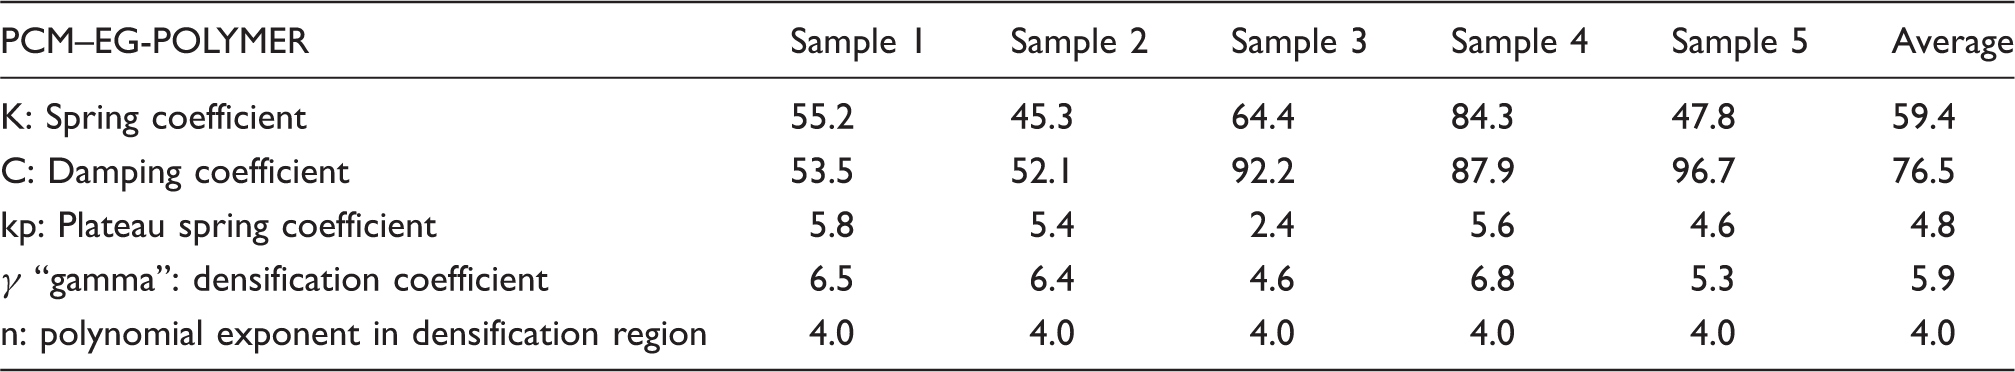
Figure 16 shows compression stress–strain curves for five samples of PCM–EG-POLYMER composite. Also, Figure 17 shows compression stress–strain experimental tests along with their PFM curve fit equation.
Experimental stress–strain compression tests for PCM–EG-POLYMER samples. Experimental and viscoelastic model stress–strain compression tests for PCM–EG-POLYMER samples.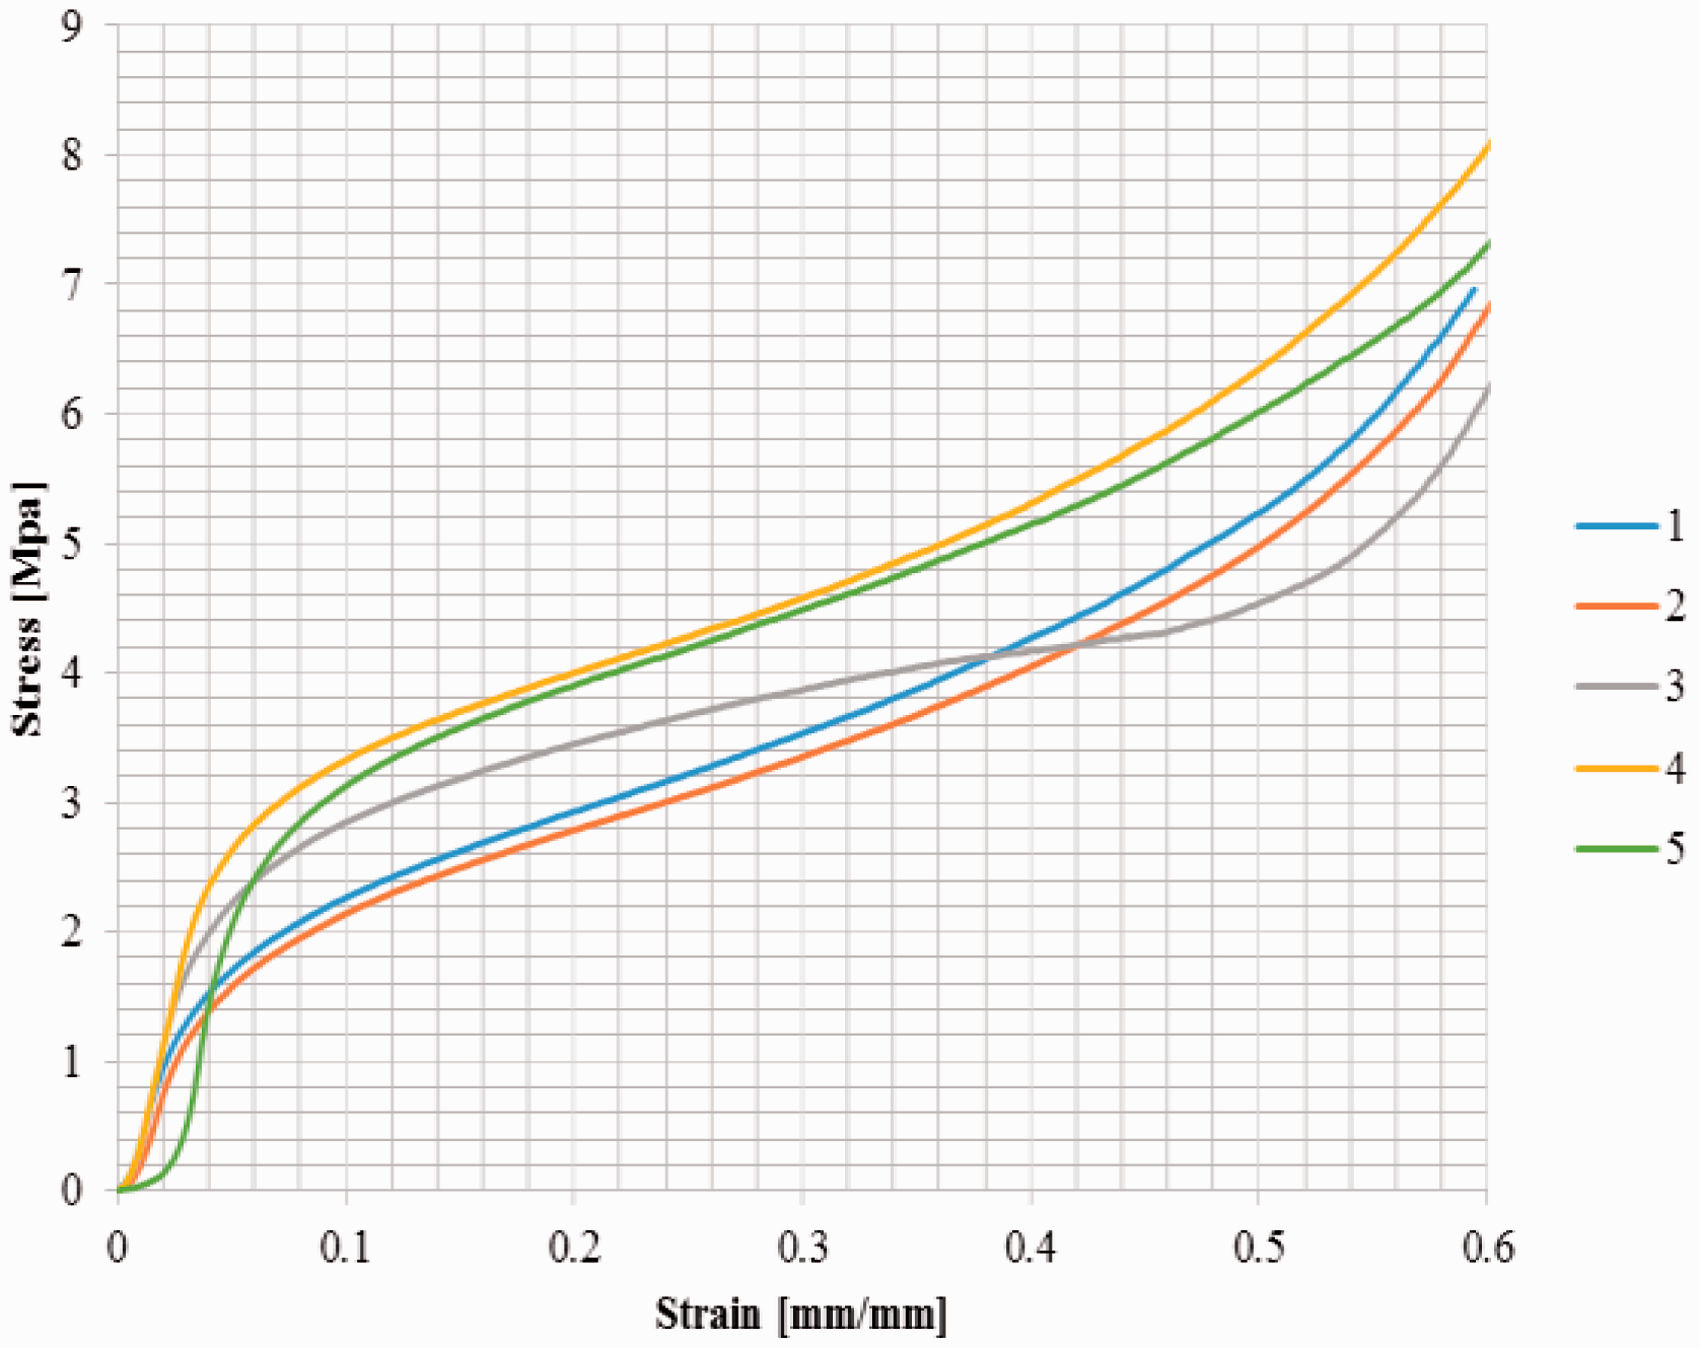
K, C, Kp, γ, and n (polynomial coefficient) resulted viscoelastic parameters for PCM–EG-POLYMER.
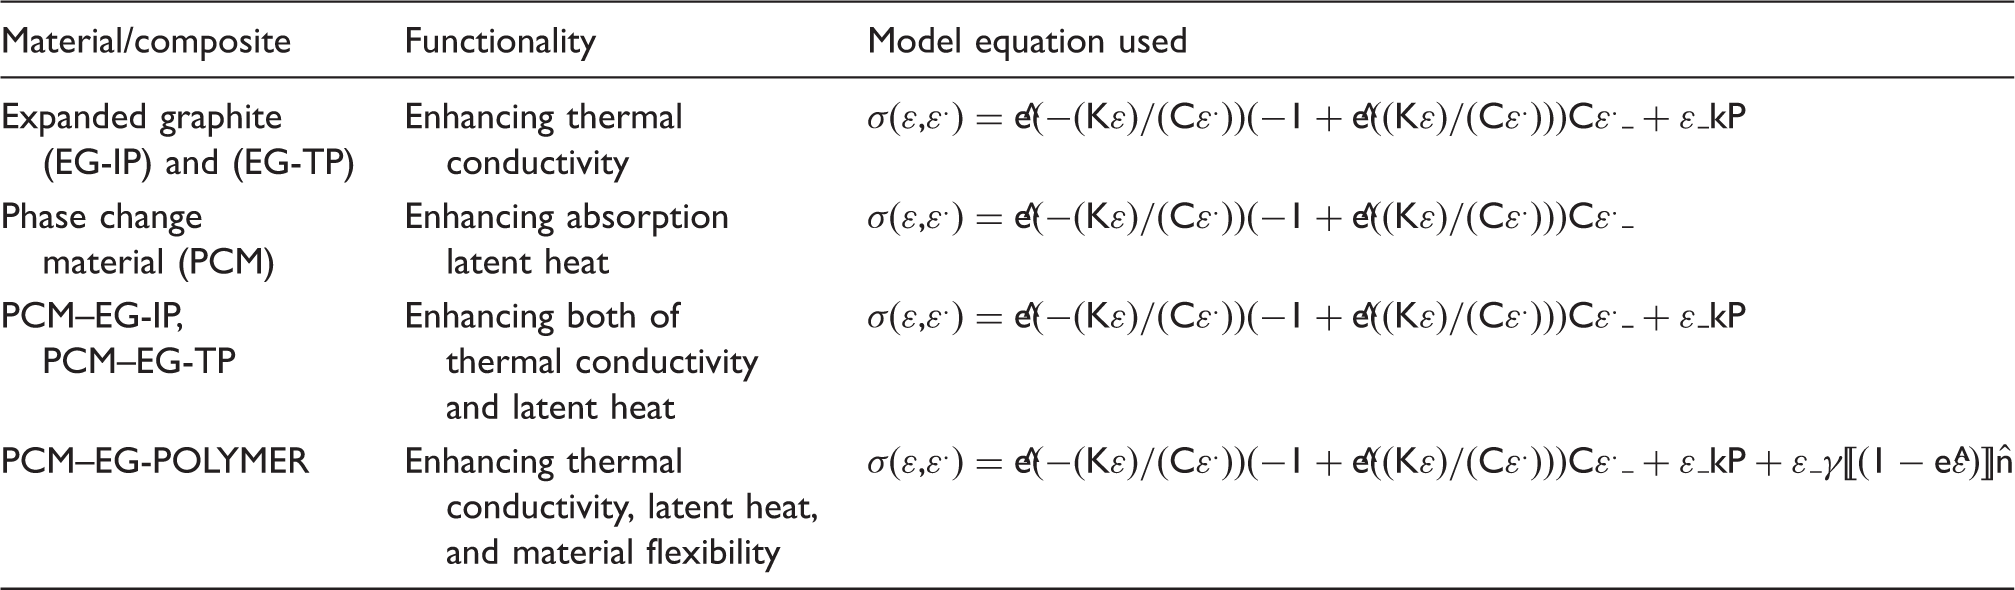
Materials functionalities and applications and their corresponding viscoelastic modeling regions.
Shows characteristic time length = damping coefficient to spring stiffness ratio (C/K).
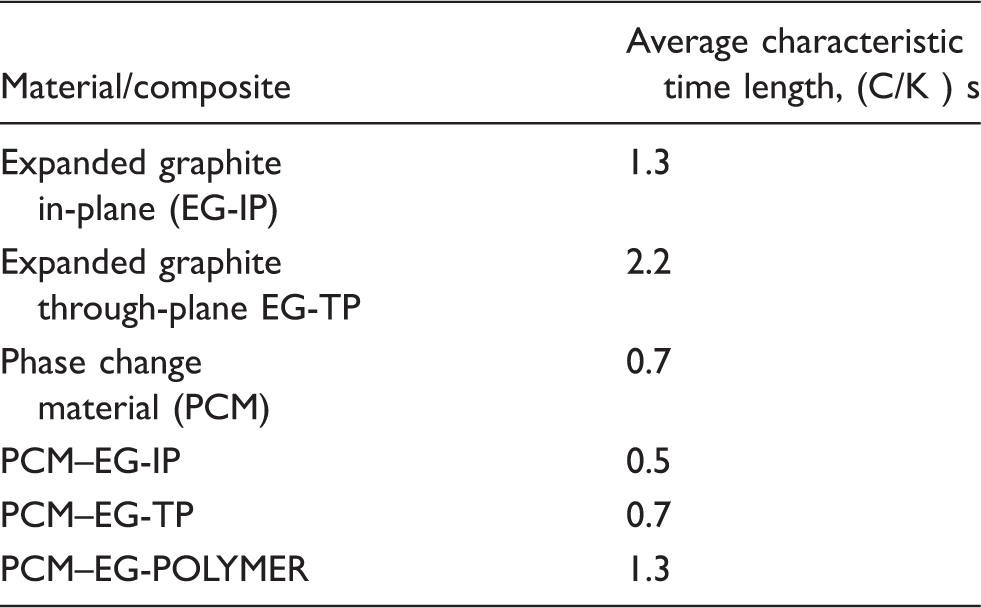
CTL as it was mentioned that is an indication of the amount of the viscous forces of the Maxwell arm to those of the elastic forces; consequently it has the time unit. Therefore, in order to estimate the amount of viscous behavior for a viscoelastic composite, researchers should be looking closely into the (C/K = T) ratio rather than the damping “C” value itself.
From the discussion earlier and in order to come up with a composite of PCM–EG with highly viscous characteristics, more EG content is needed to build the composite. The drawback of this is that reducing the PCM content will result in reducing the composite ability to absorb heat. Therefore and in order to come up with a unique composite for a specific application in particular, more tests with different ratios among graphite, PCM, and polymer weight percentages should be tried out. It is shown in Table 9 that the PCM–EG-POLYMER composite has higher viscous characteristics than PCM–EG composite since the former composite has a polymer content which is directly proportional to the viscous behavior of composite. Regarding heat storage, heat conduction, and composite flexibility characteristics, an ideal composite with an optimized weight percentage of PCM, EG, and the POLYMER should be looking into for any specific industrial application and this can be a potential research for future studies.
Conclusions
Elements with phase change composites and EG are very attractive materials for energy storage and thermal management applications due to their high thermal conductivity and high heat storage characteristic properties. Mechanical and thermal properties of these composites are essential for designing unique composites for multiple energy storage applications. In this research, compression tests were conducted and several mechanical properties such as yield strength, Young's modulus, and ultimate strength for these composites were calculated. The compression stress–strain experimental results of EG material correlated perfectly with the first viscoelastic linear and the second plateau terms of the viscoelastic equation of the PFM equation. The compression stress–strain experimental results of the combined PCM–EG composite correlated perfectly as well with the first linear viscoelastic term and the second plateau term without including the nonlinear densification term of the viscoelastic of the PFM equation.
In addition to that, the PCM–EG-POLYMER fits perfectly all three regions of the viscoelastic model of the PFM equation due to the polymer content in the composite. The presence of EG in a phase change composite with EG gives the composite more viscous characteristics than the presence of PCM. Whereas, PCM gives the composite more brittleness characteristics than the EG. Due to their high strength and high thermal properties of the IP samples when compared to TP samples, it is preferred when designing energy storage systems to use PCM–EG composite for samples cut in the IP rather than TP direction. For the Maxwell arm, it is very imperative to characterize the material by looking closely at the characteristic length time or the relaxation time which is the ratio between the damping coefficients to the elastic coefficient of the Maxwell model. Higher characteristic length time is an indication that damping viscous forces of the Maxwell arm are overweighing the elastic forces. The physics of compressing the EG in TP and IP directions in the elastic region is controllable but has totally different mechanical characteristics after the postyielding elastic region. Finally, and in order to better curve fit the data for the EG-IP direction with the polymeric model, several other mechanical tests such as tensile, biaxial planer, and bending tests should be added to the compression tests to characterize the EG-IP anisotropic material. This is could be an interesting potential subject for future publications.
Footnotes
Funding
The authors would like to thank AllCell Technologies LLC and John Crane Inc. for funding this research and to make this work successful.
Conflict of interest
None declared.