
Abstract
To determine the quality of composites cured with UV light ply by ply, the effects of exposure dose on the cure uniformity and interlaminar shear strength of composite laminates were investigated. This was done by using UV power meter, differential scanning calorimetry, and the fiber optic strain sensors. According to differential photocalorimety results, the accumulative curing effect is remarkable in the stepwise UV-curing process, which results in gradual improvement of the degree of cure of the underlying ply. The cure uniformity increased with increasing exposure dose, but higher exposure dose led to a decrease of the interlaminar shear strength. This was due to increased shrinking strain and residual stress according to the results from the fiber optic strain sensors.
Introduction
UV curing is a promising technology because it presents a number of unique advantages, like fast cure speed, solvent-free formulations, and room temperature operations.1,2 In recent years, UV-curing technology was introduced in composites manufacturing and has attracted more and more attention.3,4 Studies such as Yuan et al. 5 fabricated glass fiber reinforced polyester by vacuum bag infusion and UV curing, the results showed that UV curing was a cost-effective process that did not compromise mechanical properties. Li et al.6,7 developed a method to repair damaged composite laminates by using UV-curing technology. The results showed that the residual tensile strength of UV-curing resin repaired samples was 1.08 times that of unrepaired samples after low velocity impact test. The research from Compston et al. 8 highlights the potential of UV-curing composites as providing excellent mechanical performance while reducing manufacturing time and improving the manufacturing environments. Nowadays the UV-curing process has been applied in fabricating and repairing wind turbine blades and manufacturing large watercrafts.9–11
In the UV-curing process, the UV light intensity, the composite formulation (resin type, fiber volume fraction), and the laminate thickness all have important influence on the curing process.12,13 Thicker composite laminates need higher UV exposure dose to obtain a full cure throughout the laminate, which normally results in yellowing and degradation of the laminates’ surface. 14 However, the thicker laminates still cannot get fully cured because of the lower penetrated UV dose, when the time of UV exposure was 60 min. This had an obvious impact on the capacity for the adhesive to transfer load. 15 Moreover, the traditional one-shot UV-curing process required longer curing period to fully penetrate and cure a limited thickness (up to 13 mm) composites structure, 5 thereby reducing the production efficiency. 16 In order to solve these problems, a stepwise fabrication process combined automated fiber placement technology with UV in situ curing process which was researched by Abulizi and Yugang 17 and Di Pietro and Compston.18,19 And a cost-effective in situ UV-curing process for polymer–matrix composites was developed and the mechanical properties of the composite were tested by Yugang et al. 20 All the above studies indicated that stepwise curing process is an efficient and low-cost way to fabricate composites. The exposure dose in the UV stepwise curing process is important to the cure uniformity and the performances of composites cured layer by layer, but the relation between the exposure dose and the curing uniformity is seldom reported. In this paper, the effects of exposure dose on the uniformity of cure and the interlaminar shear strength (ILSS) of UV stepwise curing composite laminates are investigated to get high-quality UV-cured composites on the basis of early research. 21
Experimental
Materials
The UV prepreg was made by solution impregnation method. The resin content of the prepreg was about 36 ± 3% that measured according to ISO 11667:1997. 22 The E-glass fiber of UV prepreg was produced by Nanjing Fiberglass R&D Institute of China. The density of fiber glass was 2.5–2.7 g/m3, the tensile strength was 3140 MPa, and the Young’s modulus was approx. 69–76 GPa. The UV-curable resin was prepared according to the following formula (wt%): epoxy acrylate CN104NS 70%, 1,6-hexanedioldiacrylate (HDDA) 22%, trimethylolpropane triacrylate (TMPTA) 5%, and photo-initiator 651 (Benzil Dimethyl Ketal) 3%. The CN104NS was supplied by SATOMAR, USA. The HDDA and TMPTA were purchased from Taiwan External Chemical Industry Co., Ltd. The photo-initiator was purchased from Jingjiang Hongtai Chemical Engineering Co., Ltd of China.
UV transmission measurement
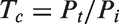
The method used for UV transmission measurement is shown in Figure 1. The FieldMate power meter (Coherent Inc., USA) was covered with a quartz glass slice (thickness: 0.5 mm, 365 nm UV transmittance: 95 ± 1%), and the prepreg was placed on the slide and was irradiated layer by layer using the UV-LED light. The transmitted light power was measured by the power meter. And the transmission coefficient Tc was calculated by equation (1)
Schematic for measurement of the transmitted UV light power.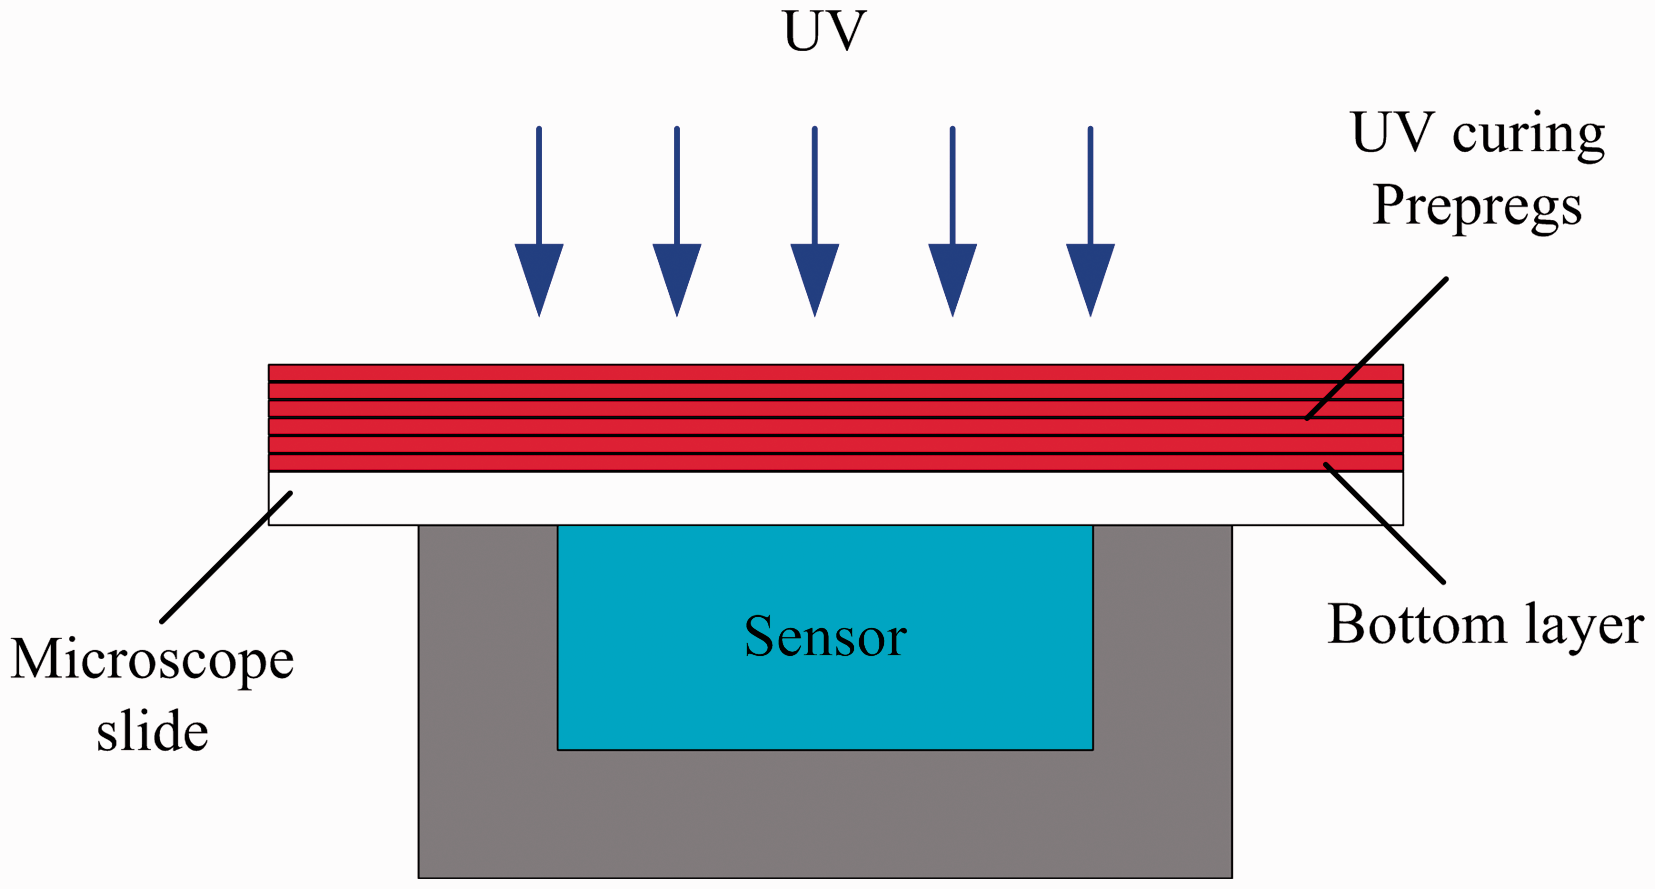
Fabrication of laminate
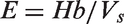
Figure 2 shows the principles of the UV stepwise curing fabrication process. According to ASTM 2344, the thickness of laminate is 6 ± 0.3 mm, which required 30 plies prepreg. The prepregs were pressed on the mold by the compacting roller and were irradiated by the UV at the same time. The exposure dose was calculated corresponding to the speed of the tape placement head. The relationship between the speed and the exposure dose is determined by equation (2)
Principle of UV stepwise curing process.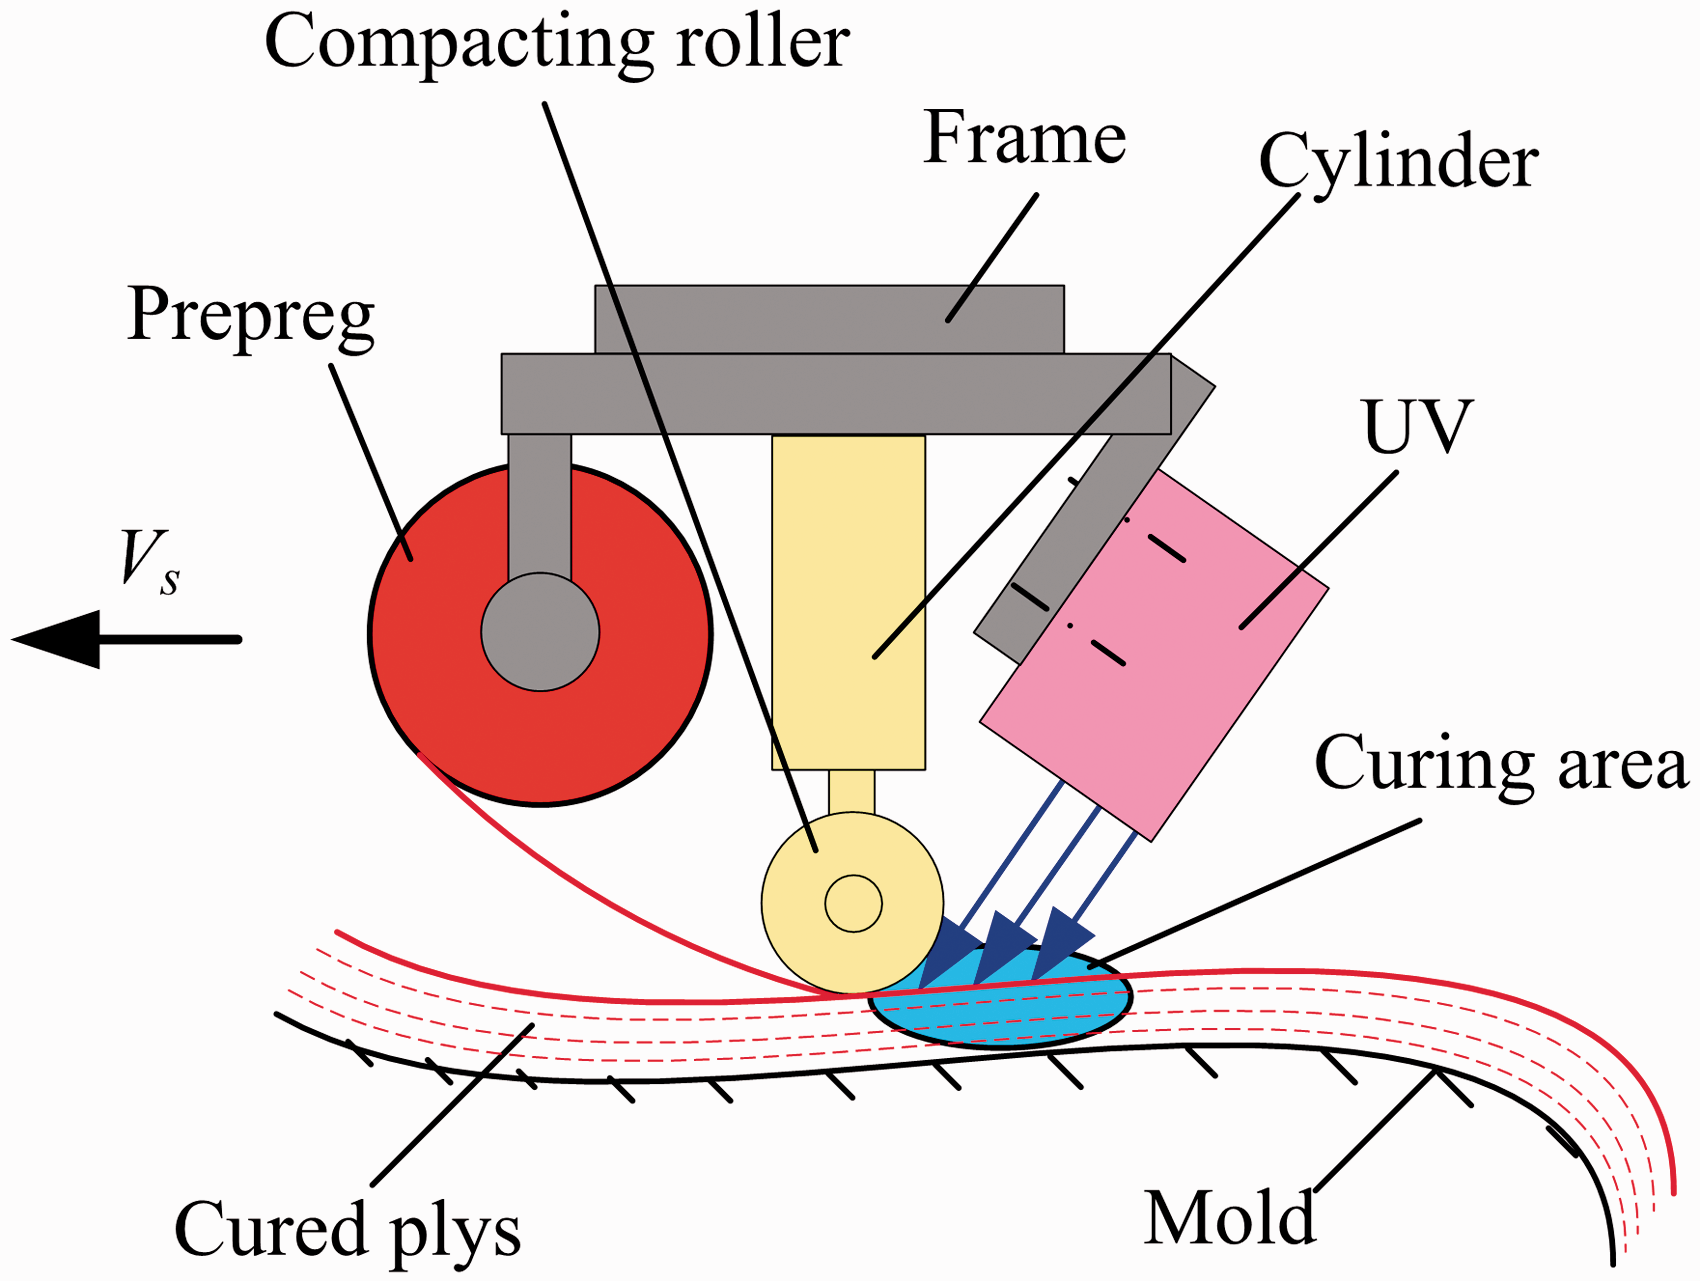
Tests of degree of cure (DoC)
The DoC of composite samples was tested by differential scanning calorimetry (DSC). The temperature range of DSC test was from 25 to 400℃, the heating rate was 10℃/min. The curing behavior of the prepreg irradiated by small UV exposure doses was studied by the differential photocalorimetry (DPC). The DSC with DPC function (model: DSC1) was made by METTLER TOLEDO. The DoC was calculated by equation (3)

Tests of the cure uniformity
The DoC of samples along the depth in the laminate was tested to evaluate the curing uniformity. Figure 3 shows the location of tested points in the laminate. The composite laminate was machined by a milling machine to get samples at different depths. Three samples from each depth were taken and the DoC of the samples was tested via DSC. And the curing uniformity of a laminate is calculated according to equation (4)
The schematic of sampling point for DSC.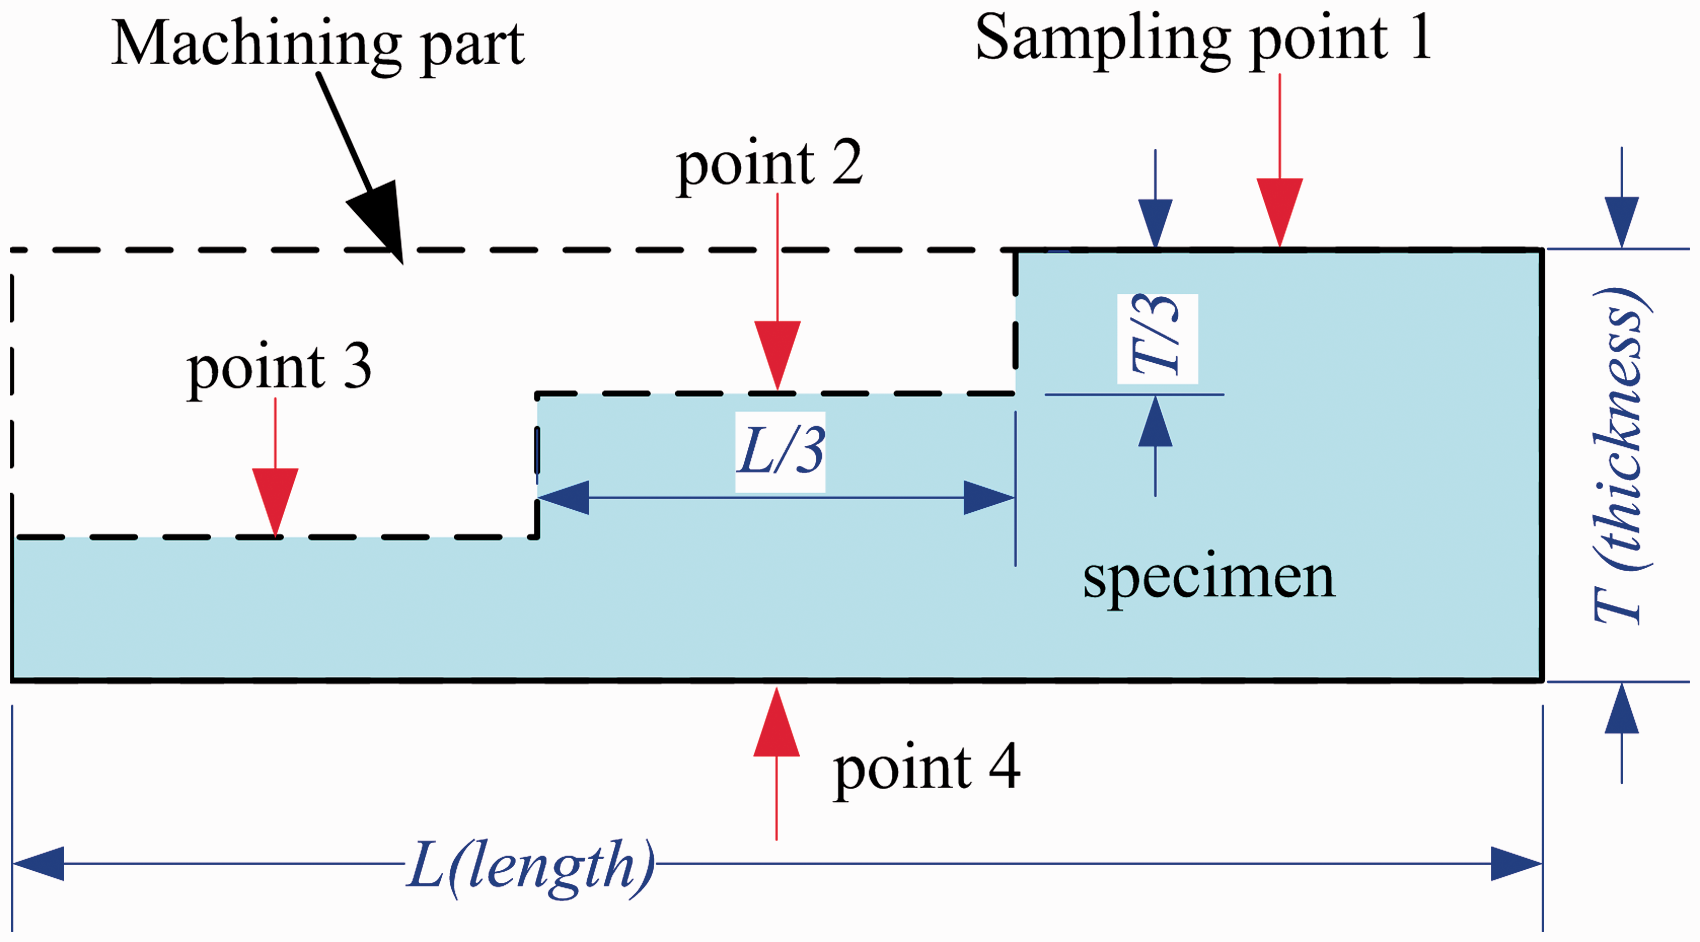

Test of the ILSS
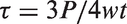
The ILSS was tested by a short-beam three-point bend fixture at 1.0 mm/min on the INSTRON 1195 according to ASTM D2344. The sample dimension was 40(length) × 12(width) × 6(thickness) mm. The ILSS (τ) was calculated using equation (5)
Test of shrinking strain
The micro strain of stepwise curing was tested by the fiber optic strain sensors. The sensors were embedded between cured and uncured prepreg with the angle perpendicular and parallel to the fibers (as shown in Figure 4). The test method was as follows: first, the prepreg was laid up on the mold and was cured with UV. Then the fiber optic strain sensors were fixed on it along two directions. Next, the second layer prepreg was placed and compacted by compaction roller without curing. Finally, when the second layer prepreg was cured without compaction, the shrinking strains were detected by the sensors. Fiber optic strain sensor was made by FISO Technologies Inc. (Canada) with range from −5000 to 5000 μɛ. The individual samples were made in order to test the shrink strain of the laminates irradiated by different UV exposure dose.
The schematic of embedded fiber optic strain sensor in the laminate.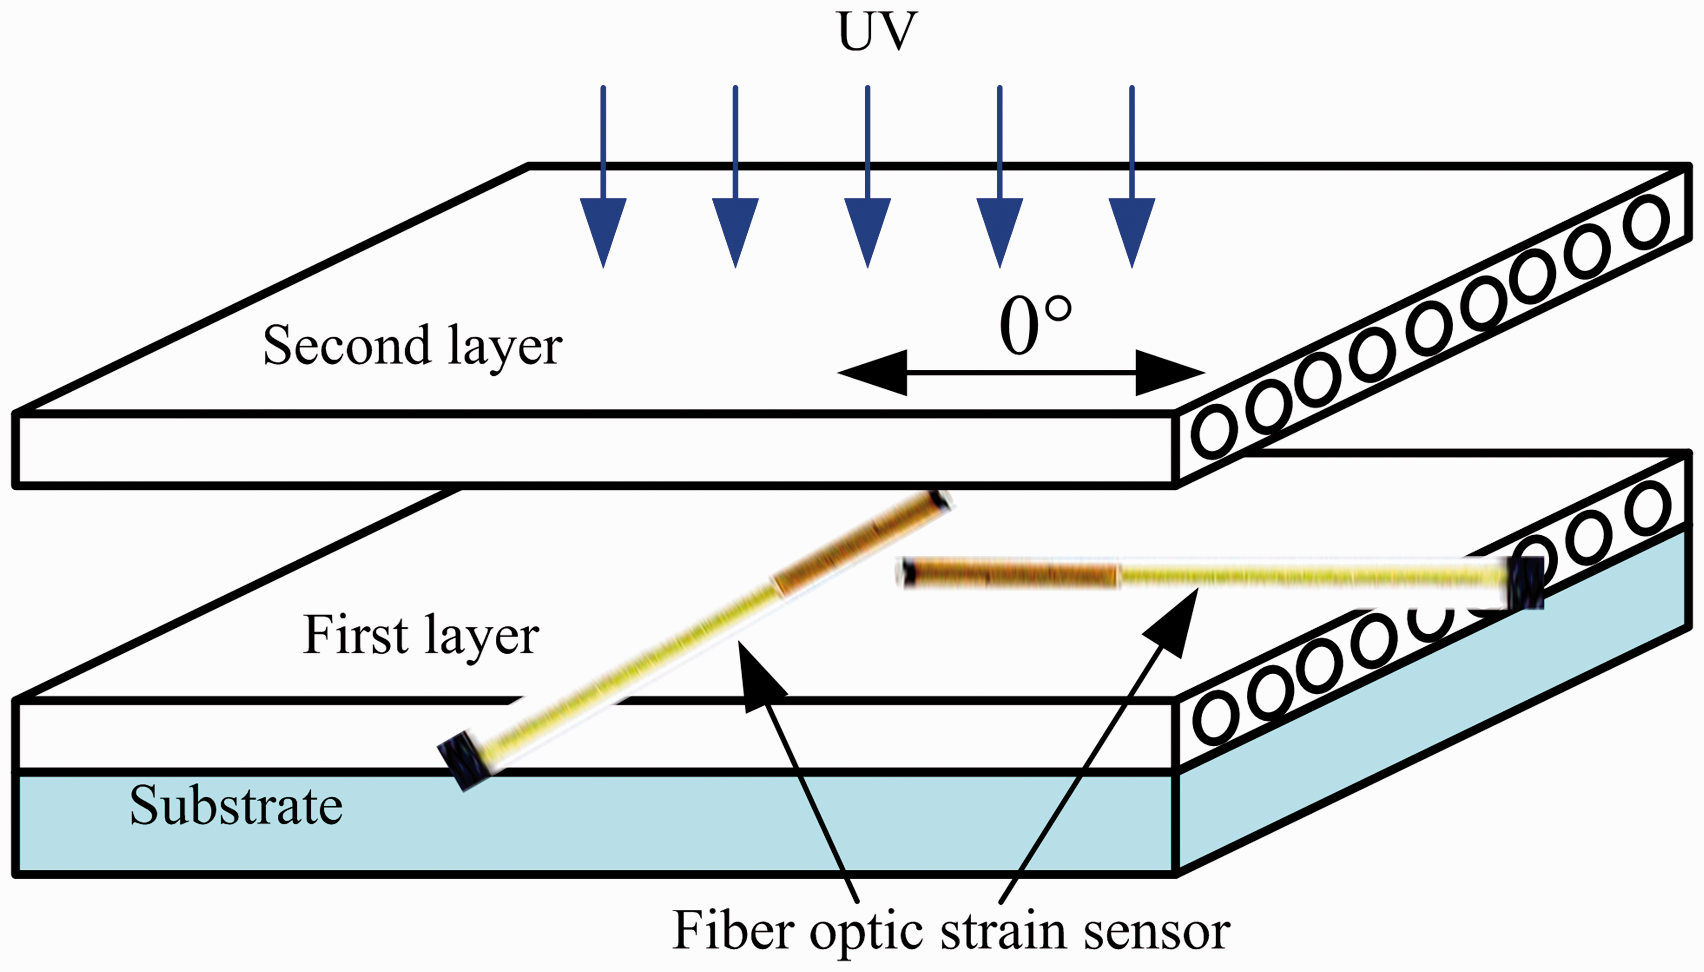
Results and discussion
The accumulative curing effect
Figure 5 shows the DoC variation of the bottom layer (the firstly placed layer) increasing with each subsequent ply at the 0.83 mJ/mm2 level of exposure dose. The reason could be explained by Figure 6, by which the change of transmission coefficient versus ply number by incident exposure dose of 0.83 mJ/mm2 is shown. It can be noted in Figure 6 that the UV light could penetrate five layers maximum, and the average transmission coefficient decreases exponentially with increasing of penetrated layers, the average transmission coefficient of the first placed layer is about 0.445, and the average transmission coefficient of total five layers under the top layer is about 0.047. This means the first placed layer still receive approx. 0.039 mJ/mm2 exposure dose (0.83 × 0.047) when the exposure dose on the fifth placed layer is 0.83 mJ/mm2, which could improve the DoC of the first (bottom) layer, and it is the same for every five layers, this conclusion could be verified from Figure 7.
The accumulative DoC curves of the bottom layer. Relationship of transmission coefficient and layers. The DPC curves of a multiple step irradiation.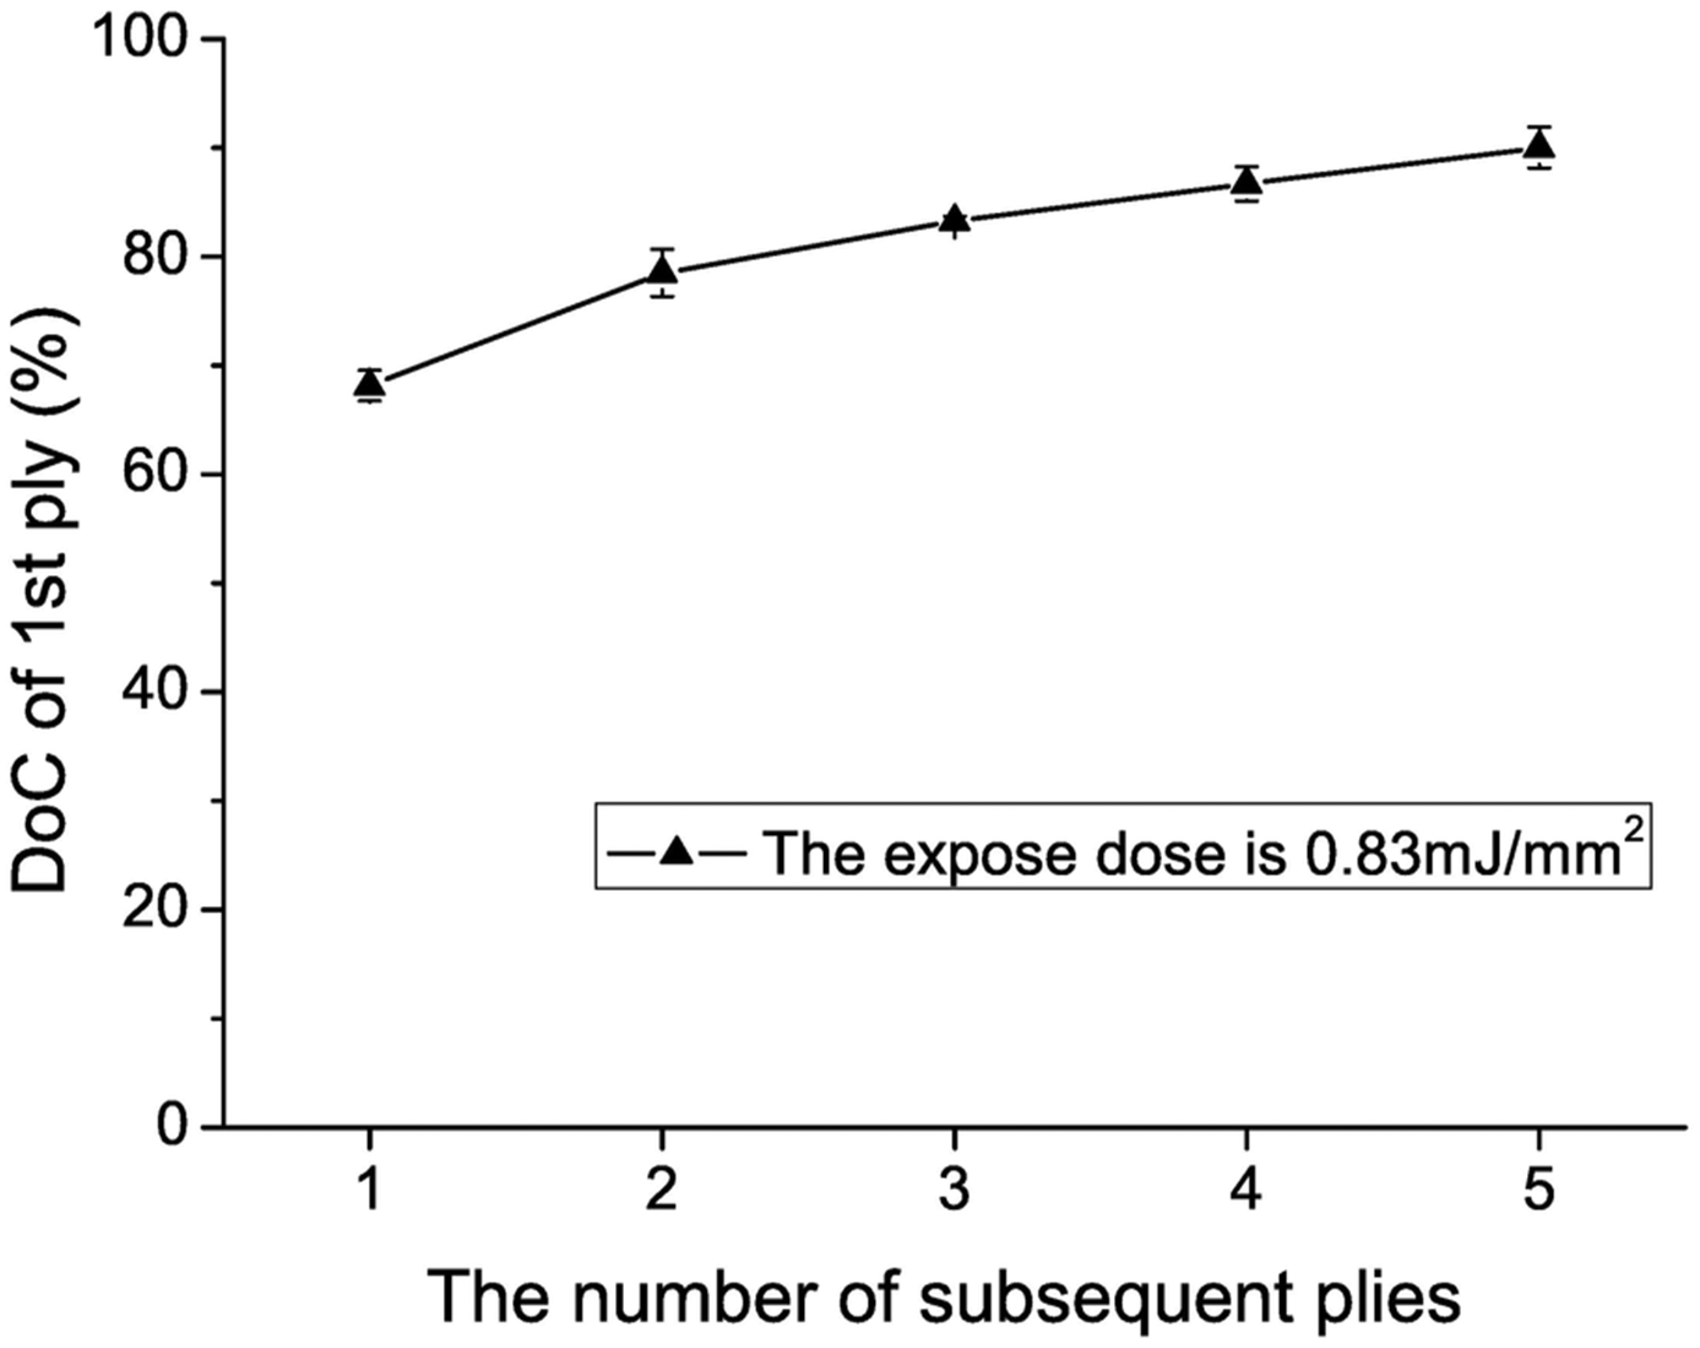
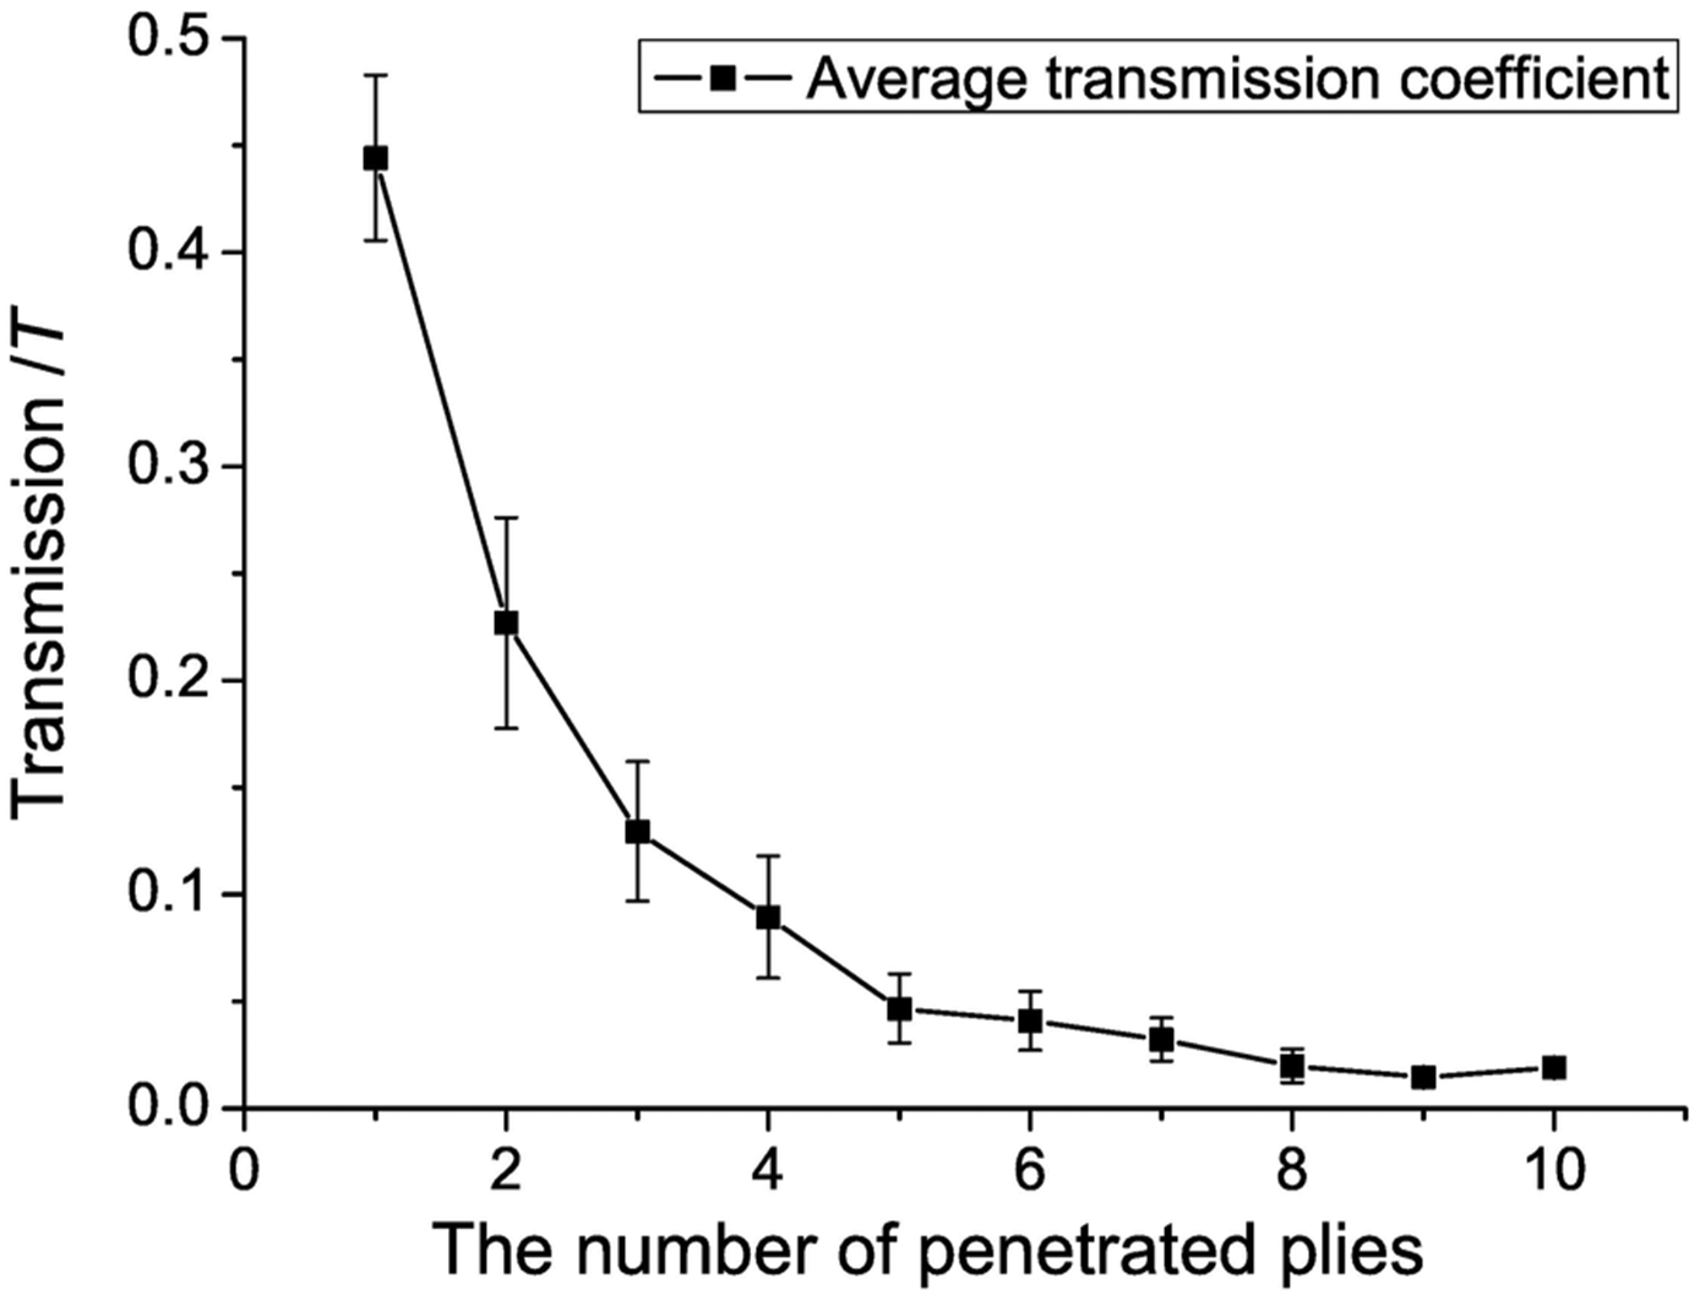
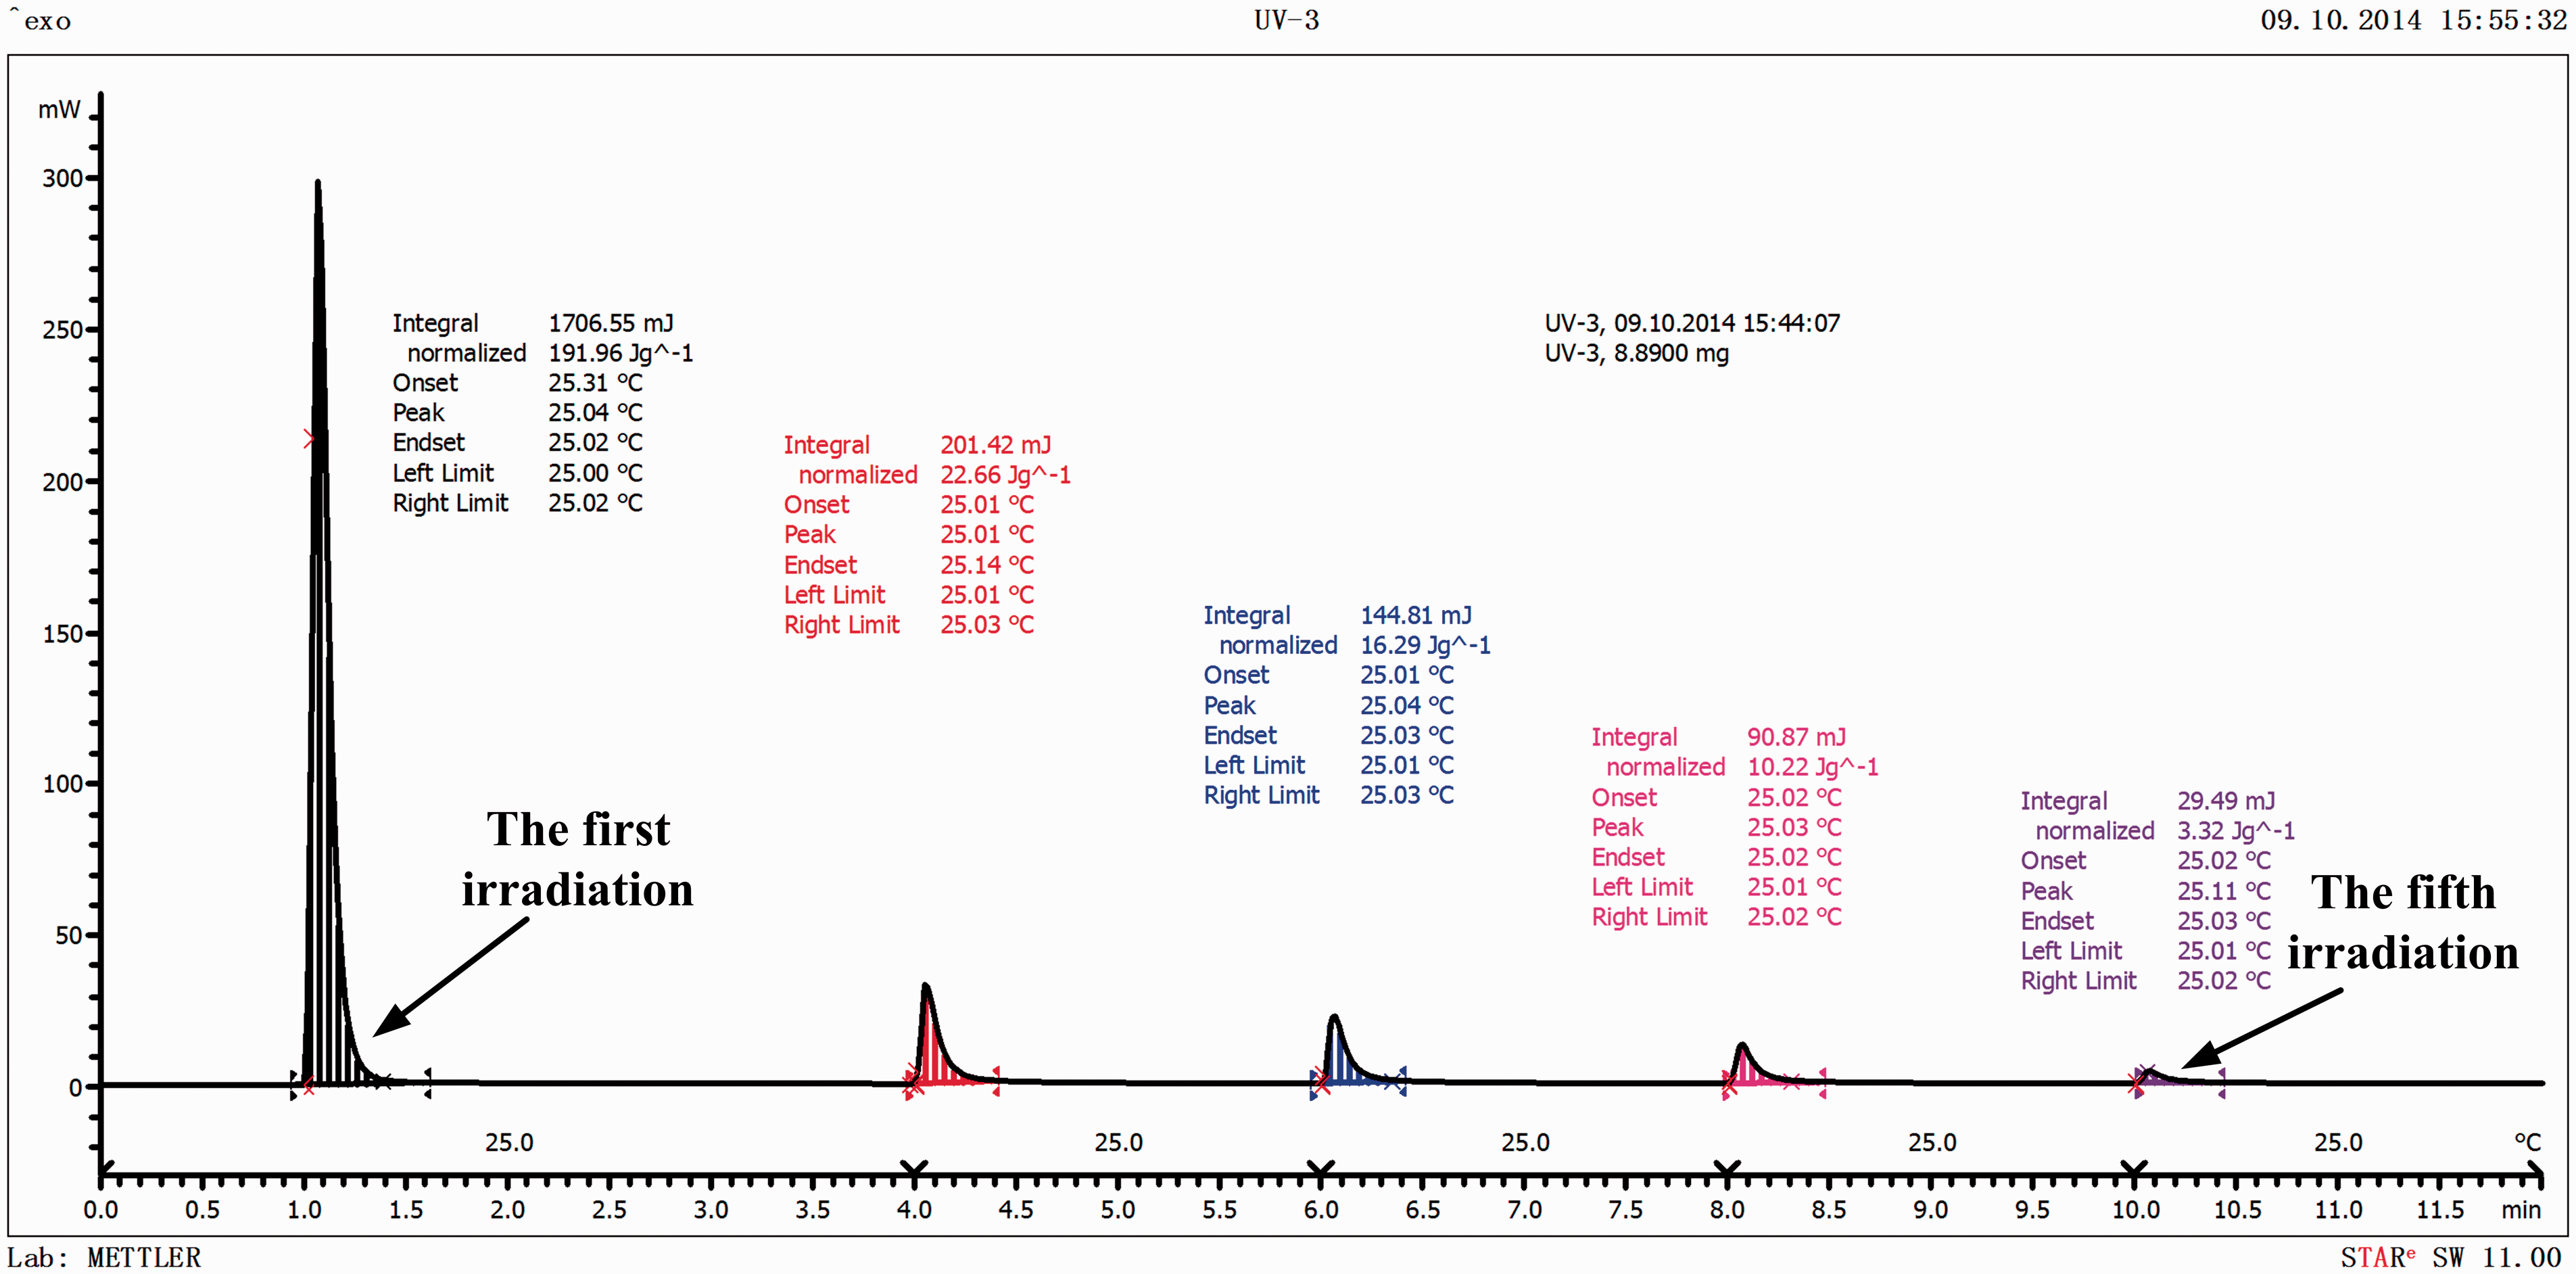
Figure 7 shows the stepwise UV-curing reaction curves from DPC. It can be seen from Figure 7 that when the prepreg sample is first irradiated by 0.83 mJ/mm2 of UV light and then by 0.031 mJ/mm2 (the minimum UV dose of the DPC) for four times, the curing reaction heat of the sample is 191.96, 22.66, 16.29, 10.22, and 3.32 J/g, respectively. This is because the prepreg was not fully cured under the first irradiation of UV, so when the next step UV irradiated on the prepreg sample, the reaction heat was detected by DPC once again. These results indicated that even tiny UV exposure dose could still induce the curing reaction of the prepreg. Moreover, the hmax (the full exothermic energy of an uncured prepreg sample) was about 264.52 J/g, and the total exothermic energy of the five irradiations was 244.45 J/g. These results meant if the sample got more UV irradiation it still would produce more reaction heat. But the UV just penetrated five plies in this study, so a higher UV dose was needed to trigger more reaction heat, which resulted in a higher DoC. It also can be noted that with the increase of the irradiation times, the heat from curing reaction decreased gradually, that is to say, the DoC of the UV prepreg improved stepwise. From the discussion above, during the UV stepwise curing process, the UV light can penetrate the layers until the fifth layer below, which could improve the DoC of the UV prepreg layers step by step gradually.
Effect of the exposure dose on curing uniformity
Figure 8 shows the DoC difference of the four test points for different exposures. It can be seen from Figure 8 that the DoC difference between the maximum value and minimum value of the four tested points decreases with the increasing exposure dose. This indicates that the curing uniformity is improved gradually with the increasing of exposure dose. That means the more exposure dose, the more uniform of the DoC. At 4.00 mJ/mm2 level of exposure doses, the average DoC was 92.33%, and the curing uniformity was 96.46%.
The DoC plot of the four tested points of different exposure doses.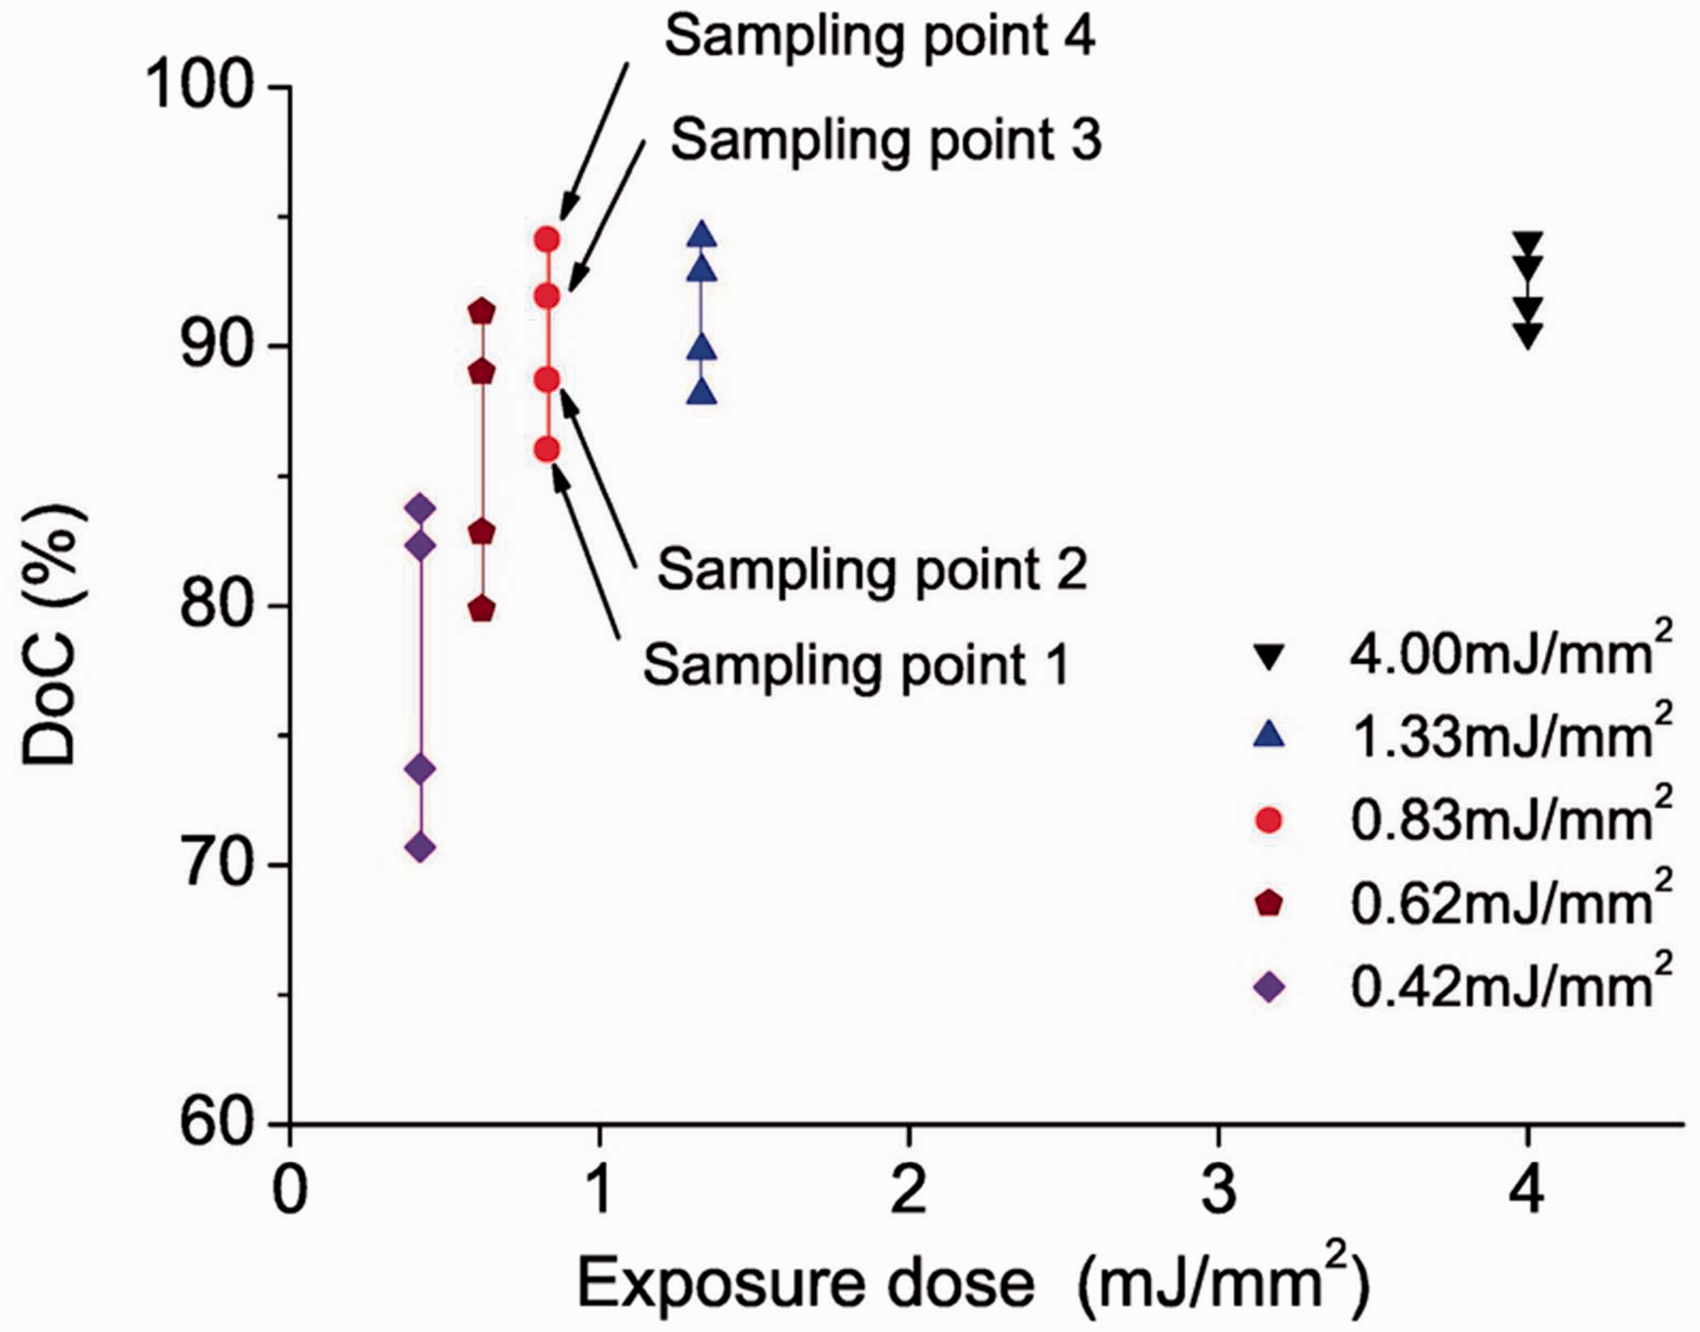
It can be seen from Figure 8 that the maximum DoC appears in the test point 4, the DoC in the point 3, point 2, and point 1 gradually decreases. The reason was that the point 4 (bottom surface) was irradiated more times than the other points because of the accumulative curing effect.
Effect of the exposure dose on ILSS
Figure 9 shows the variation of the ILSS with different UV exposure doses. It can be seen that the ILSS of UV stepwise curing laminate increases first, then deceases with the increasing of the exposure dose. When the exposure dose is 0.83 mJ/mm2, the maximum ILSS of the laminate is 30.26 MPa.
Correlation between the ILSS and exposure dose.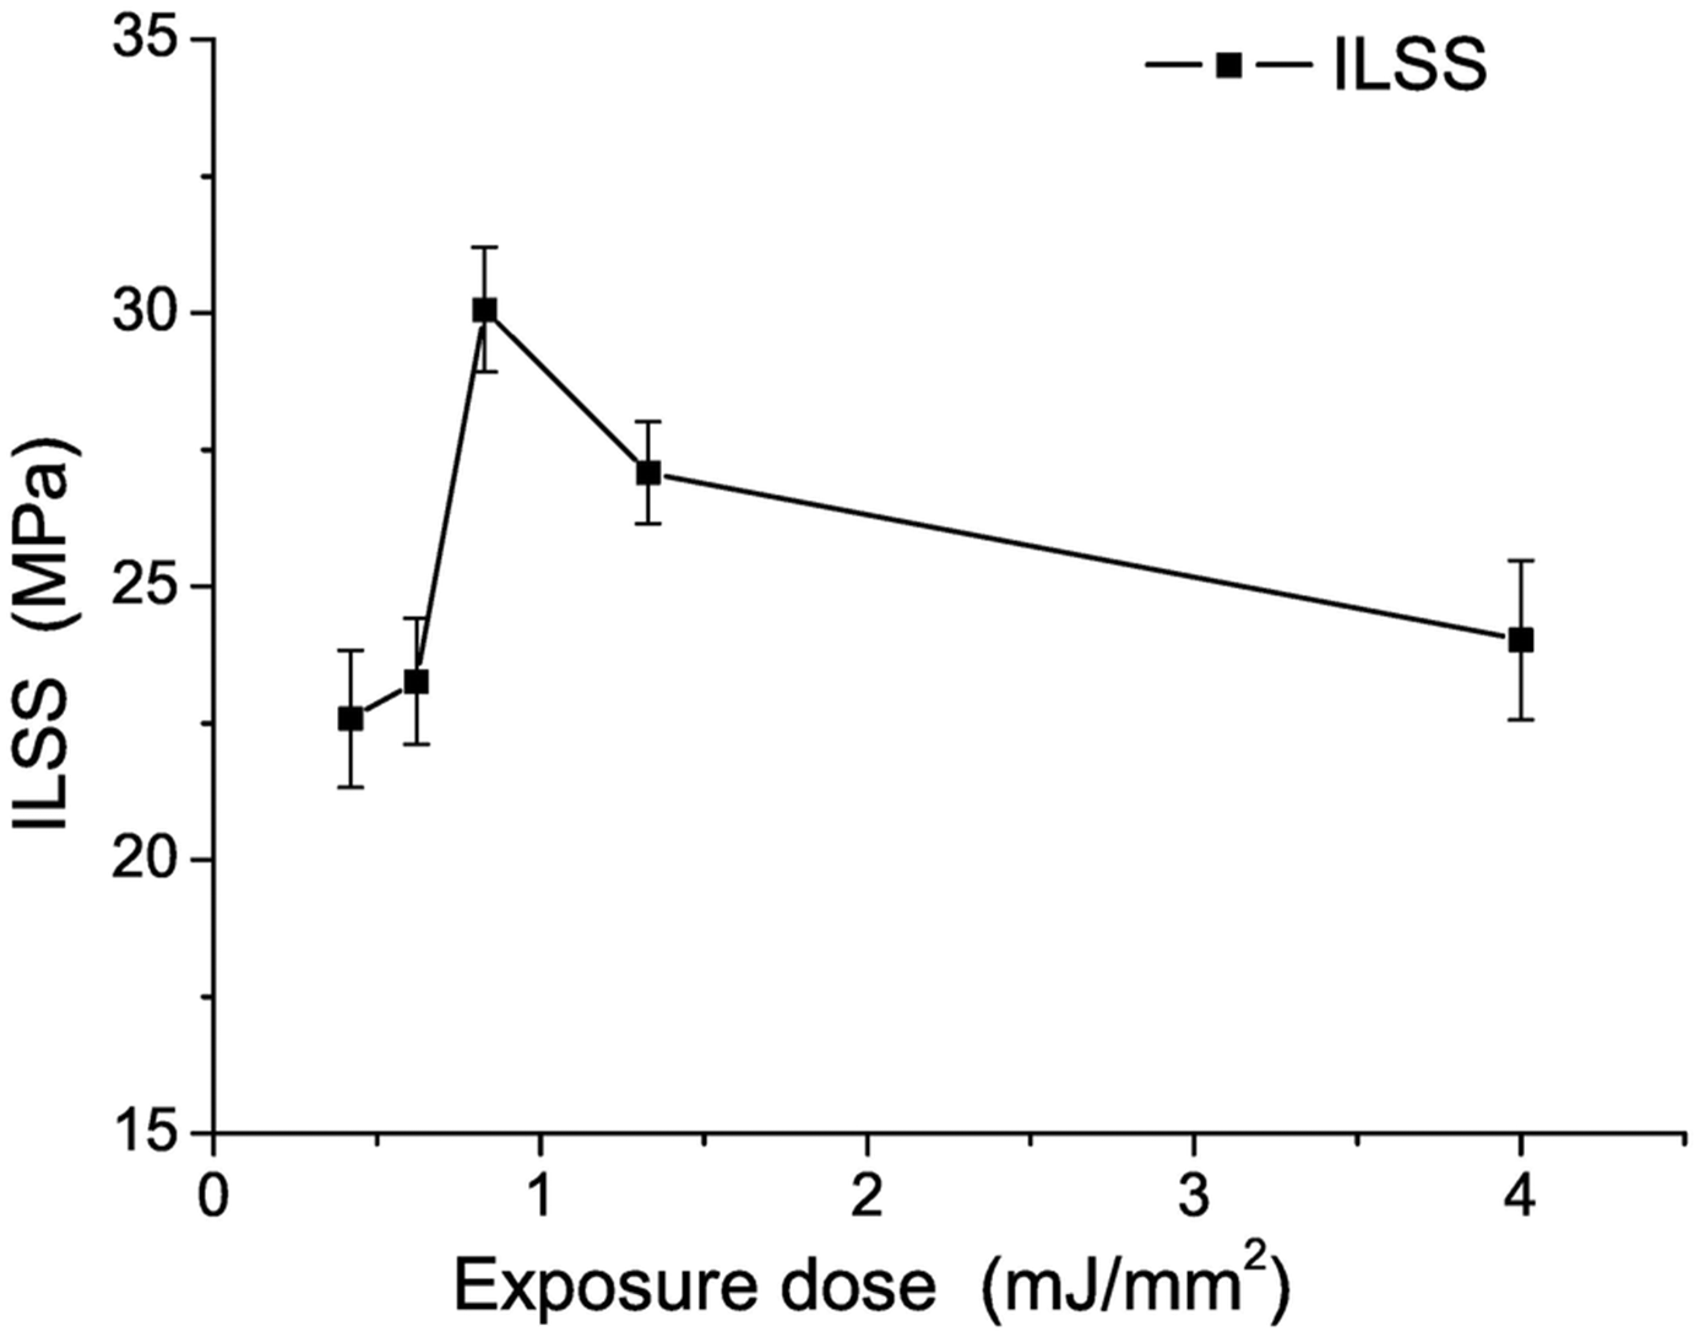
Figure 10(a) and (b) shows the strain variation of perpendicular and parallel to the fiber direction, respectively. It can be seen from Figure 10 that the curves have similar variation in both directions. There are three stages in the curing process. In the initial stage, the UV irradiates on the prepreg layers and activates the polymerization, and the reaction heat results in thermal expansion of the prepreg. Positive strains were detected during the stage, which results in the convex portion of the curves in Figure 10. After that, the matrix resin started to shrink because of the polymerization, which is relatively high resulting in negative strain. Finally, the resin achieves the gel state and the residual strain stabilized gradually. From Figure 10, the maximum strain is approx. 63, 98, and 552 μɛ when exposure dose is 0.42, 0.83, and 4.00 mJ/mm2, respectively. These results indicate that the more exposure dose was irradiated on the prepreg, the more shrinking strain was introduced. It is proposed that the difference of DoC between the upper layer and lower layer became larger with the exposure dose increasing, when the upper layer began to cure, the lower layer with higher curing degree would restrict the cure shrinkage of curing layer, which induced residual strain. The more the exposure dose, the “restriction effect” is more obvious, accordingly the more the residual strain. This would lead to decrease of the ILSS. However, according to the discussion in “Effect of the exposure dose on curing uniformity” section, the high exposure dose is beneficial to the curing uniformity, so a suitable exposure dose should be considered for a balance between ILSS and curing uniformity.
The curves of strain in the directions of perpendicular (a) and parallel (b) to the fibers with different exposure doses.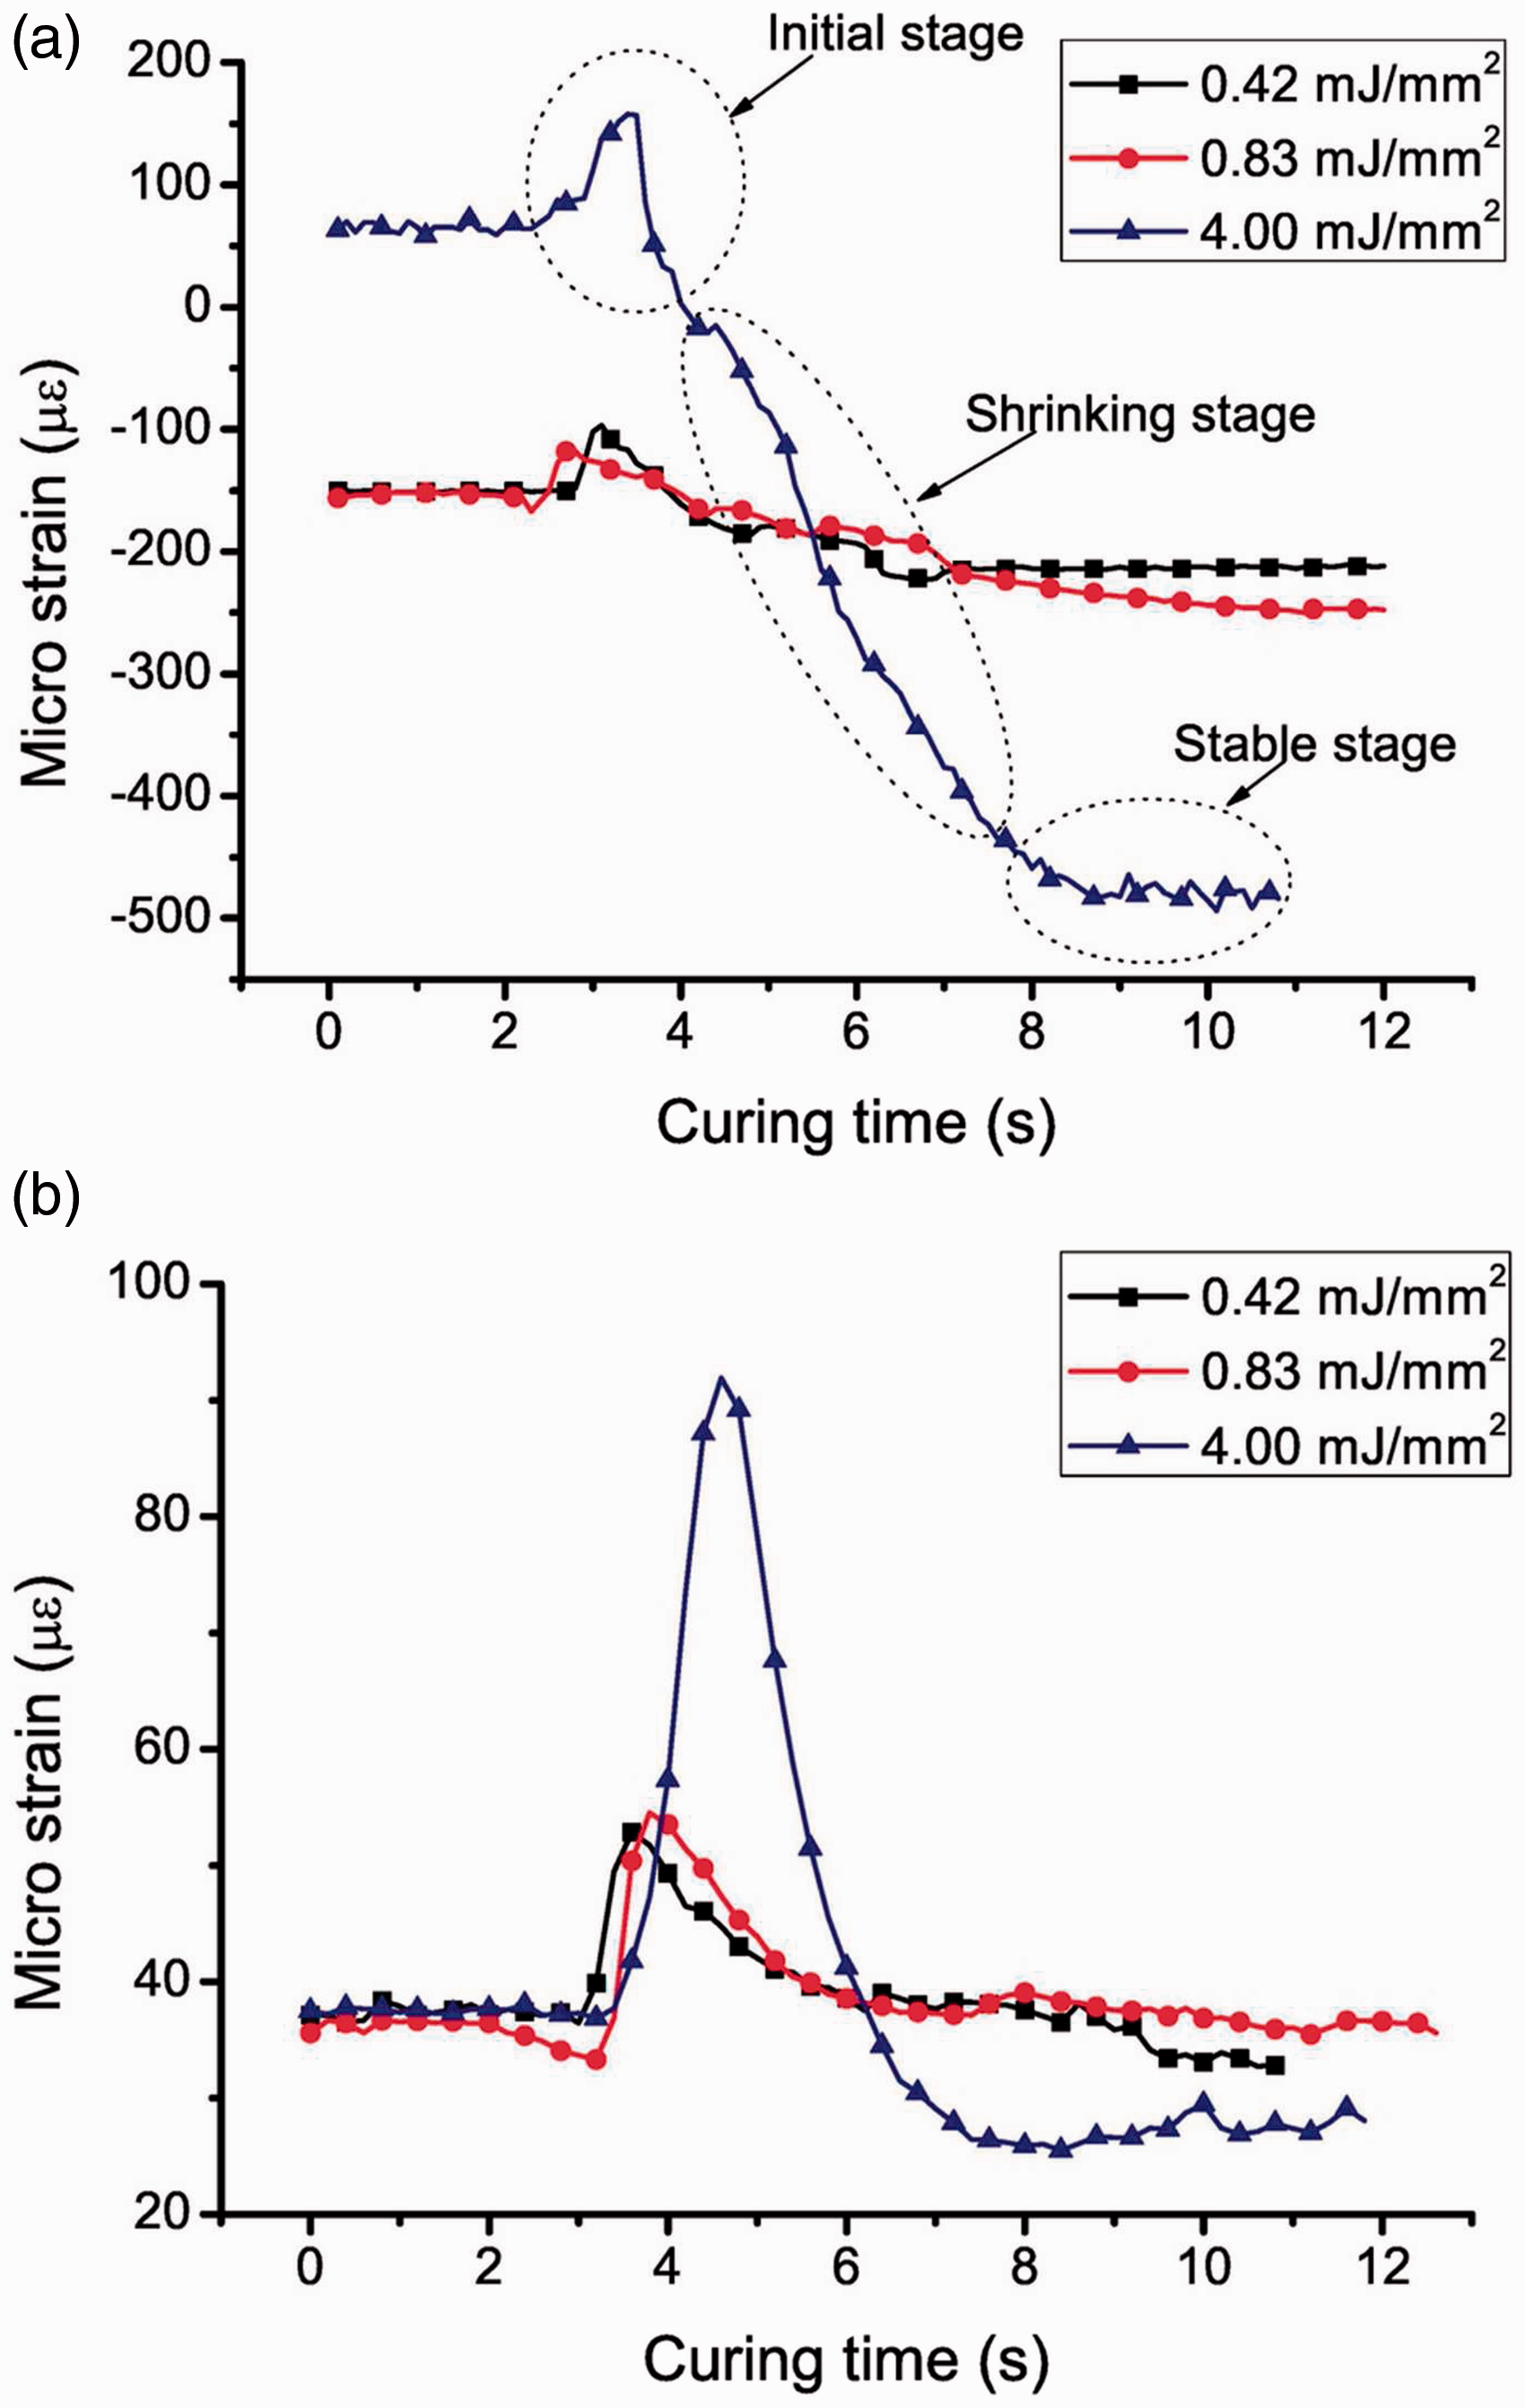
Conclusions
In the UV stepwise curing process, the accumulative curing effect is remarkable due to the transmission behavior of the UV in the UV curable prepreg. This makes stepwise curing process an energy saving method to fabricate thicker composite laminate. The UV exposure dose has an important effect on the properties of the laminate. With the increasing of the UV dose, the curing uniformity of laminate is improved, but the ILSS decreased because of large shrinking strain. So a suitable exposure dose should be considered for a balance between ILSS and curing uniformity, which would improve the quality of UV-curing composite laminates with lower fabrication stress.
Footnotes
Funding
This research was supported by NSFC of China (51275393), Program for New Century Excellent Talents in University (NCET-11-0419), and Fundamental Research Funds for the Central Universities and Specialized Research Fund for the Doctoral Program of Higher Education (20120201110031).
Conflict of interest
None declared.