
Abstract
Poly(butylene adipate-co-terephthalate) (PBAT) biocomposites containing carbon nanotubes (CNTs) were prepared by melt compounding. The linear viscoelasticity of composites, including creep, creep recovery and stress relaxation in the solid state, and dynamic shear flow in the molten state, were studied and then further described by the viscoelastic models, aiming at exploring relaxation of hierarchical structures of CNTs and obtaining structural parameters of CNTs in PBAT matrix. The results reveal that CNTs are dispersed mainly as flocs or small aggregates in PBAT, which is further confirmed by the structural parameters of CNTs obtained through model simulations on the dynamic rheological responses of composites. The presence of CNTs retards overall kinetics of creep and stress relaxation of PBAT. This is attributed to highly restrained viscoelastic and viscoplastic deformation of PBAT chain coils, rather than slightly confined elastic deformation of chain segments because the chain coils is in the same size-scale with the CNT flocs.
Introduction
With growing awareness of the environmental deterioration, biodegradable materials have attracted considerable attention in recent years. Many biodegradable polymers have been developed so far and put into applications successfully. 1 Among them, aliphatic-aromatic copolyesters turn out to be the most promising materials for the technical applications because of their good bulk properties and large availability of their monomers that can be obtained from renewable resources. 2 Poly(butylene adipate-co-terephthalate) (PBAT) is typical one of these aliphatic-aromatic copolyesters, which combines the biodegradability of aliphatic polyesters with the excellent properties imparted by aromatic polyesters. 3 Therefore, it becomes an important series among the biodegradable polymers because the balance of its degradability and physical properties can be adjusted by controlling the molar ratio of comonomers.4,5
For commercial aliphatic-aromatic copolyesters, the concentration of aliphatic unit is high up to 45–65 mol.% because they show optimal balance of biodegradability and physical properties in this case. 5 It has been reported that the crystalline region of PBAT is composed of BT units, whereas almost all BA units exist in the amorphous region. 6 An insufficiency of crystallizable BT units makes it difficult for PBAT to form regular crystals, leading to a low degree of crystallinity. 7 Thus, PBAT is commonly a rubbery product with low modulus. One way of improving its stiffness is to blend it with other biodegradable polymers with higher strength and modulus, such as polylactide8,9 and starch.10,11 Incorporation with the stiffer inorganic filler has been proved to be another effective strategy. 2 The presence of nanoparticles, such as clay,12–14 silica, 15 and carbon black, 16 can enhance strength and modulus of PBAT evidently and even improve its crystallization capacity and bacterinertness. Besides, the addition of nanoparticles can improve phase morphology of the PBAT based polymer blends by controlling their selective localization, which provides a new approach of obtaining ternary nanocomposites with high performance.17–20
Recently, carbon nanotubes (CNTs) have been used as the new-generation nanofiller to prepare polymer composites because of their fascinating properties. 21 Many polymer/CNT composites have been fabricated successfully so far, 22 also including the PBAT-based nanocomposites.23–26 The reported work mainly focused on the determination of mechanical and thermal as well as rheological properties, evaluation of antibacterial properties, and assessment of the role of CNTs played in morphology control of the PBAT/PLA blends. It is well accepted that viscoelastic behavior is vital to the CNTs-based polymer composites because it is closely related to the processing and applications of the composite system.27,28 The viscoelasticity of PBAT/CNT composites has also been studied preliminarily. Hong et al. 23 found that the steady shear viscosity of PBAT composites increased with increasing CNT loading, and the shear thinning viscosity data were fitted well with the power law equation. Ko et al.25,26 observed an evident increase in the dynamic storage and loss moduli for the PLA/PBT/CNT nanocomposites, and also found that both the shear and complex viscosities showed unique shear thinning behavior due to selective location of CNTs.
In general, viscoelasticity of a polymeric material is time-dependent. This means that the responses at different time/frequency scales come from relaxation of the structures with different size scales. In other words, the long-term structure of CNTs, such as percolation networks of CNTs and interactions among CNTs or between CNTs and polymers, may affect the viscoelastic behavior of matrix polymers in different ways relative to the short-term structure of CNTs (such as shape, aspect ratio, average size of nanotube, etc.). Therefore, viscoelastic behavior of the PBAT composites is worthy of further study because it is a powerful tool to probe hierarchical structures of the multiphase PBAT composites. In this work, the static viscoelastic behavior and the dynamic rheology of PBAT/CNT composites, including creep, creep recovery and stress relaxation in the solid state, as well as the dynamic shear flow in the molten state, were explored and then further described by some simple constitutive models, aiming at making a full understanding of the relations between macroscopic relaxations of the composites and hierarchical structures of CNTs with different sizes.
Experimental
Materials
Poly(butylene adipate-co-terephthalate) (PBAT) was purchased from Huiying New Material Science and Technology Co. Ltd., Shandong, P. R. China, with the density of 1.26 g/cm3 and the weight average molecular weight of 12,000 g/mol (polydispersity of 2.45). Its melting point is 115–120℃. The purified multi-walled carbon nanotubes (CNTs), which are chemical vapor deposition material (purity>98%), were purchased from department of chemical engineering, Tsinghua University. Their average outside and inside diameters are 8.6 nm and 3.5 nm, respectively. The length is 100–300 µm and the special surface area is 250–300 m2/g.
Preparation of PBAT/CNT composites
The PBAT/CNT composites (PBATCs, where s represents wt% CNTs) were prepared by melt mixing CNTs with PBAT by a Haake Polylab Rheometer (Thermo Electron Co., USA) at 150℃ and 50 r/min for 8 min. The loadings of CNT range from 0.5 to 5 wt%. For better comparison, the neat PBAT was also processed by rheometer to keep the same thermal histories with those composites. All materials were dried at 60℃ for 24 h before using. The dog-bone-shaped specimens (32 mm × 4 mm × 2 mm) were then prepared by injection molding using a Haake mini-jet for tensile property testing. The injection was performed at the cylinder temperature 160℃ and the mold temperature 25℃ with the injection pressure 600 bar and holding pressure 500 bar. The sheet samples with about 1 mm thickness were prepared by compression molding at 150℃ and 10 MPa for the morphological and rheological measurements.
Morphological characterizations
The CNT distribution in PBAT was explored by an S-4800 field-emission scanning electron microscope (FE-SEM, Hitachi, Japan) with 10 kV accelerating voltage. The sheet samples were frozen in liquid nitrogen and fractured, and then coated with gold using an SPI sputter coater before observation for enhanced conductivity. The CNT dispersion in the matrix was investigated using a transmission electron microscope (Tecnai 12, Amsterdam, Netherlands) with 120 kV accelerating voltage.
Tensile property tests
Tensile properties of the samples were determined by an Instron Mechanical Tester (ASTM D638) at a crosshead speed of 50 mm/min. All values reported here represent an average of the results for tests run on six specimens at room temperature.
Creep recovery and stress relaxation tests
Creep tests were performed on a DMA Q800 analyzer (TA Instruments, USA) with tensile mode at various temperatures and stress levels. The applied stress levels (0.5, 1.0, 1.5, 2.0, and 2.5 MPa), which are in the linear viscoelastic region of all samples, were determined by the tensile tests. The duration of measurements was determined as 10 min and 30 min for the creep and creep-recovery tests, respectively. The creep strain/recoverable strain and compliance were recorded with time. Three rectangular specimens (30 mm × 5 mm × 1 mm) were tested for each composition. Before each test, the specimen was equilibrated for 5 min at each temperature in order to evenly adjust for the correct temperature of the sample. The stress relaxation was also performed on the DMA Q800 analyzer at 40℃. The strain level of 0.5% was predetermined by the tensile tests. The stress and modulus were recorded as a function of the time. All tests were triplicated and there were nearly no evident difference in the results of each test.
Rheological measurements
Rheological measurements were performed on a rotational rheometer (Haake RS600, Thermo Electron, USA) equipped with a parallel plate geometry using 20 mm plates. The sheet samples were molten for 5 min in the fixture to eliminate residual thermal histories. Then, the dynamic frequency sweep was performed under small amplitude oscillatory shear (SAOS) flow. The applied strain level of 1% is in the linear region, which was predetermined by the dynamic strain sweep.
Crystallization characterizations
The crystallization behavior of the neat PBAT and its composites were recorded using a differential scanning calorimeter (DSC, NETZSCH DSC-204F1, Germany). The sheet samples about 3.0 mg were melted at 170℃ and held for 5 min to eliminate previous thermal histories, and then cooled to 0℃ at the cooling rate of 5℃/min. The exothermal curves of heat flow as a function of temperature were recorded in this process. All tests were carried out under nitrogen.
Results and discussion
Dispersion of CNTs in the PBAT/CNT composites
Figure 1 gives SEM and TEM images of the composites. Clearly, CNTs present full distribution throughout the PBAT matrix (Figure 1(a)). Most of CNTs are mainly dispersed as flocs (indicated by solid arrows in Figure 1(b)) rather than individuals, accompanied with some small aggregates (hollow arrow in Figure 1(b)), suggesting that the primary aggregates of CNTs are hard to be fully detached merely by the shear flow during melt mixing because of strong intermolecular van der Waals interactions among CNTs if without any surface modification. Actually this dispersion state of CNTs has been widely reported on many polymer composite systems.
22
In addition, those CNT flocs are randomly oriented, locally forming an interconnecting network structure, which is mainly attributed to the relaxation of CNT flocs during annealing of molding step.29–31
(a) SEM and (b) TEM images of the PBATC3 samples with the scale bar of 5.0 µm and 0.2 µm, respectively. The inset graph is the TEM image of CNTs with the scale bar of 50 nm.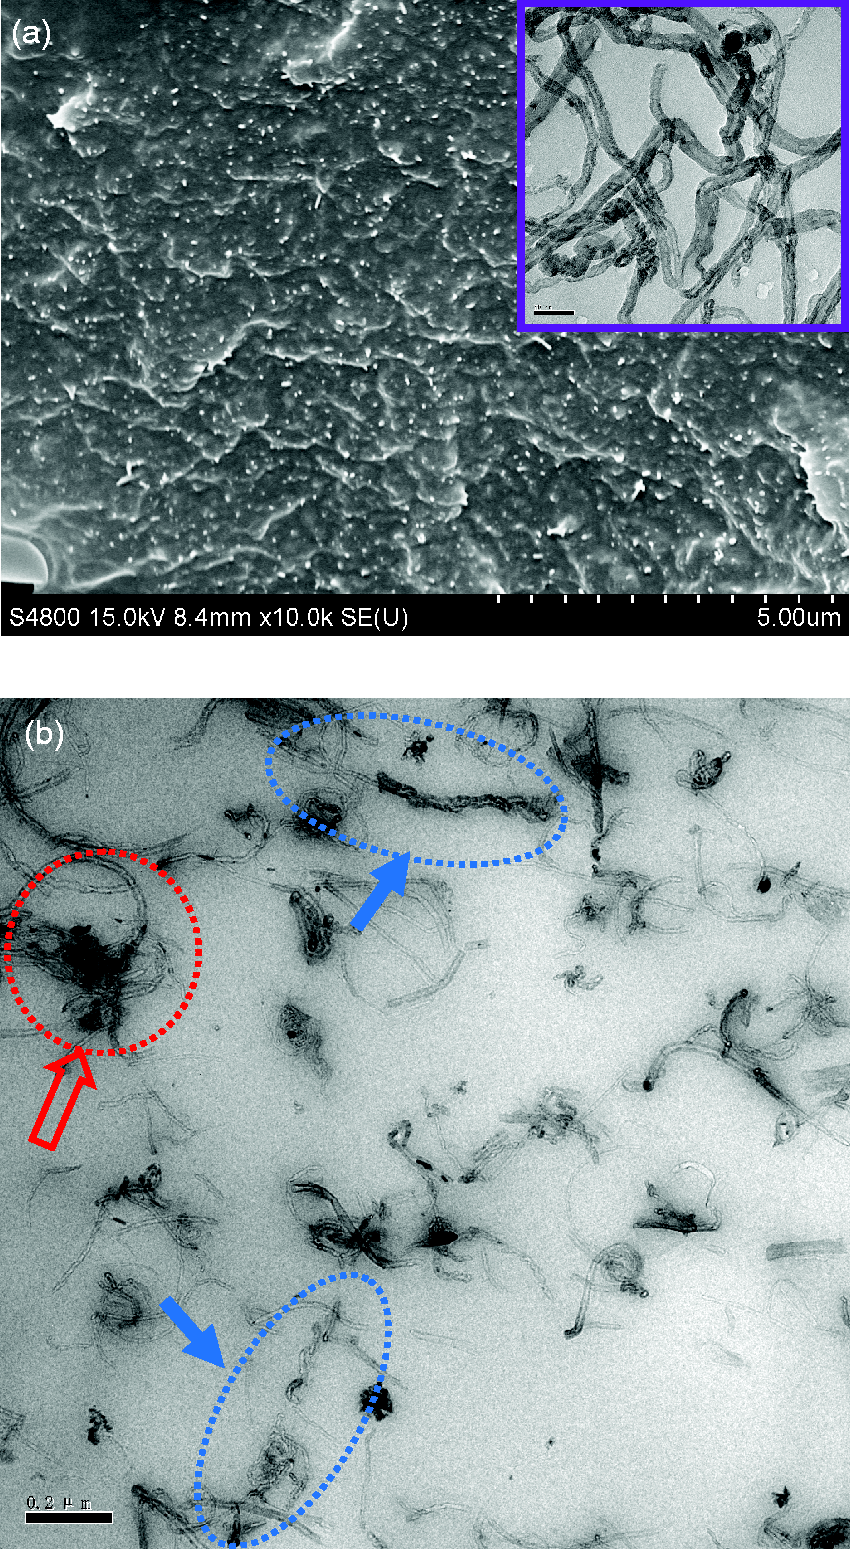
Figure 2 shows the DSC traces of all samples. The crystallization temperature (Tc) does not show evident shift with addition of CNTs, which indicates that CNTs merely act as the inert filler and have no heterogeneous nucleation on the crystallization of PBAT. The degree of crystallinity (Xc%) are calculated by comparing melt enthalpy (ΔHm) with the theoretical enthalpy of 100% crystalline PBAT (114 J/g3). Both the neat PBAT and the composites show very low crystallinity degrees around 10%, and all samples have almost identical degree of crystallinity (Xc%) with that of the neat PBAT within the experimental error ranges. Similar results have also been observed on the PBAT composites filled with graphite nanoplatelets.
32
These two results, namely inert filler role of CNTs and low degrees of crystallinity of system, mean that all issues related to crystallization could be ignored in current composite system. In other words, the possible alterations of crystal structure and crystallinity of PBAT matrix caused by the presence of CNTs, which may also have large influence on the final properties of composites, need not to be taken into account. In this case, the linear viscoelastic behavior, such as creep and stress relaxation, can be used as a good tool to detect possible alteration of relaxation behavior of PBAT chain caused by the presence of CNTs.
DSC thermograms of the neat PBAT and its composites at the cooling rate of 5℃/min.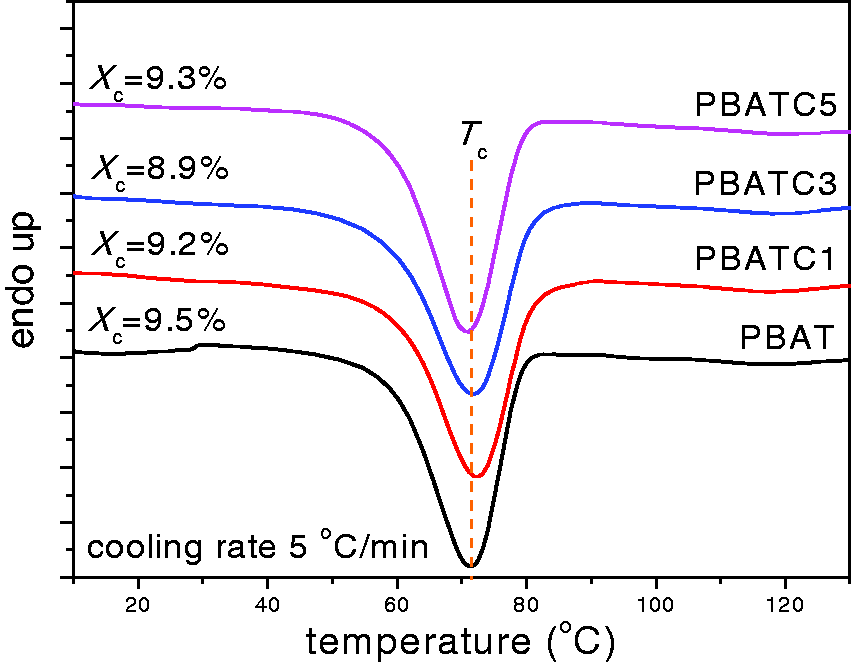
Creep and creep recovery of the PBAT/CNT composites
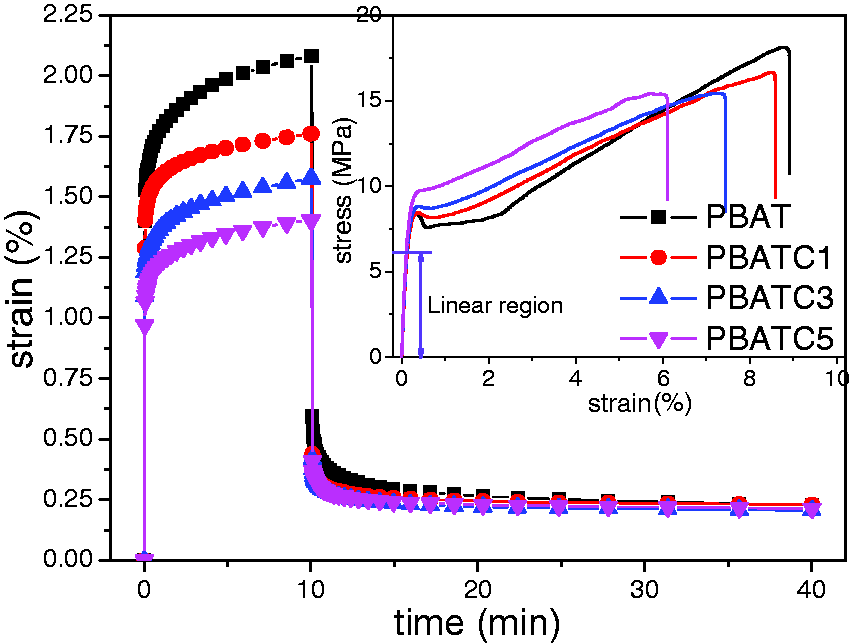
Figure 3 shows creep and creep-recovery behaviors of PBATC1 sample. The steady compliance increases monotonously with temperature (Figure 3(a)) because of the enhanced chain mobility. For the same reason, the creep strain also shows an increase trend with applied stress levels, as can be seen in Figure 3(b). All stress levels are in the linear region of deformation, as shown in the inset graph in Figure 4. It is clear that the creep strain level decreases remarkably with increasing CNT loadings, which indicates that the creep of matrix PBAT is restrained by the presence of CNTs. On the one hand, incorporation with CNTs enhances modulus of the system and as a result, the linear elastic deformation level decreases at identical load levels. On the other hand, the presence of CNTs may constrain movements of chain segments or suppress relaxations of chain coils, retarding viscoelastic and viscoplastic deformation of the system. Similar trend has also been reported on many other CNTs-based polymer composites.29–31,33–35
(a) Creep curves at various temperatures under 1.0 MPa and (b) creep and creep-recovery curves under various stress levels at 30℃ for the PBATC1 sample. Creep and creep-recovery strain–time curves for the PBATCs samples with different CNT loadings at 30℃ and 1.0 MPa. The inset graph shows stress–strain curves.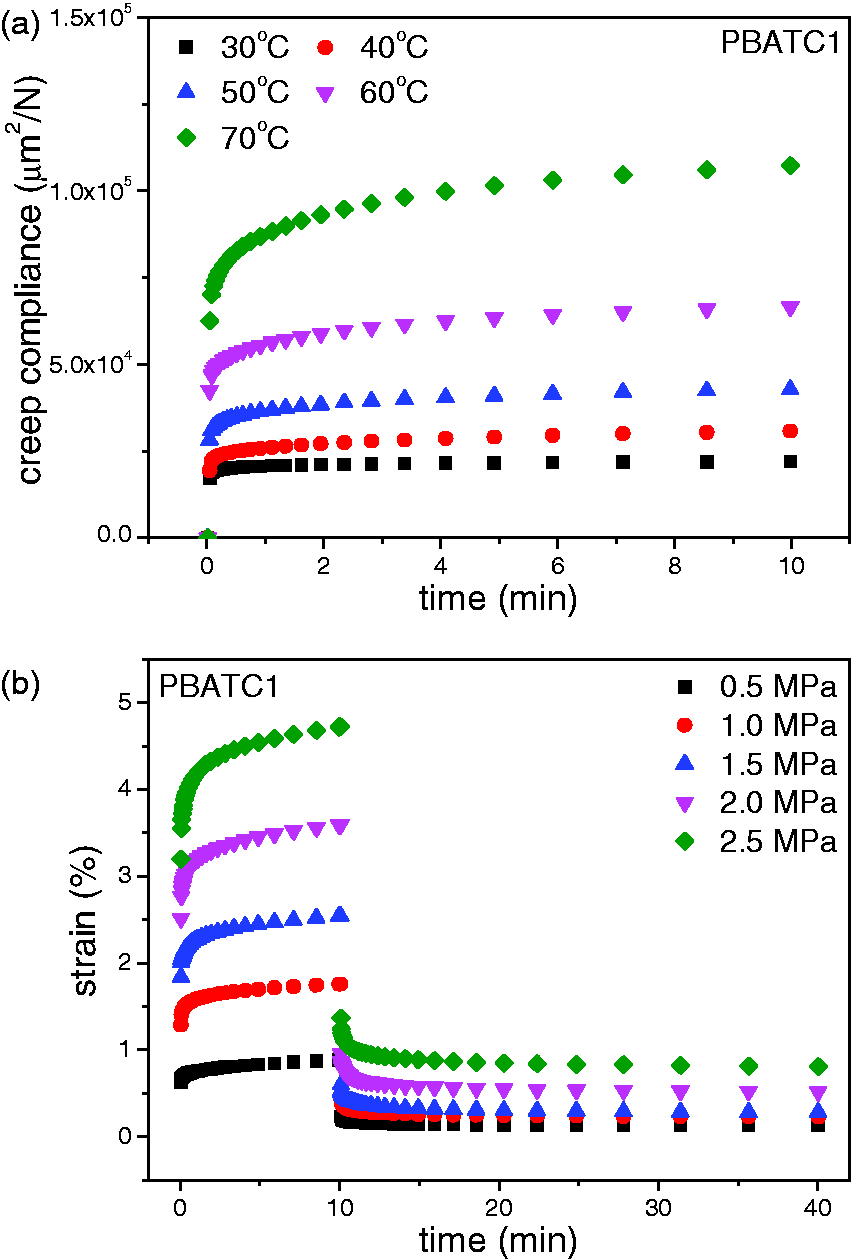
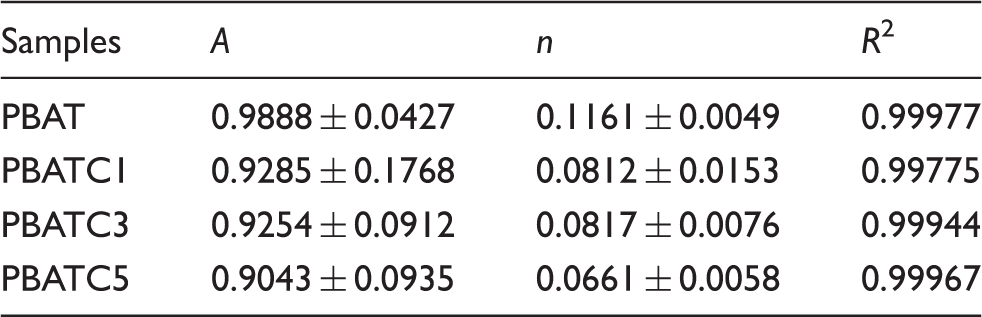
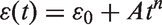
A simple power law equation developed by Findley and Peterson
36
can provide an overview on how the presence of CNTs affects the creep of PBAT
Theoretical predictions on the creep of the neat PBAT and its composites (30℃, 1.0 MPa) by (a) Findley power law model and (b) Burgers model. Average values of parameters obtained from Findley model prediction on creep behavior of the neat PBAT and its composites.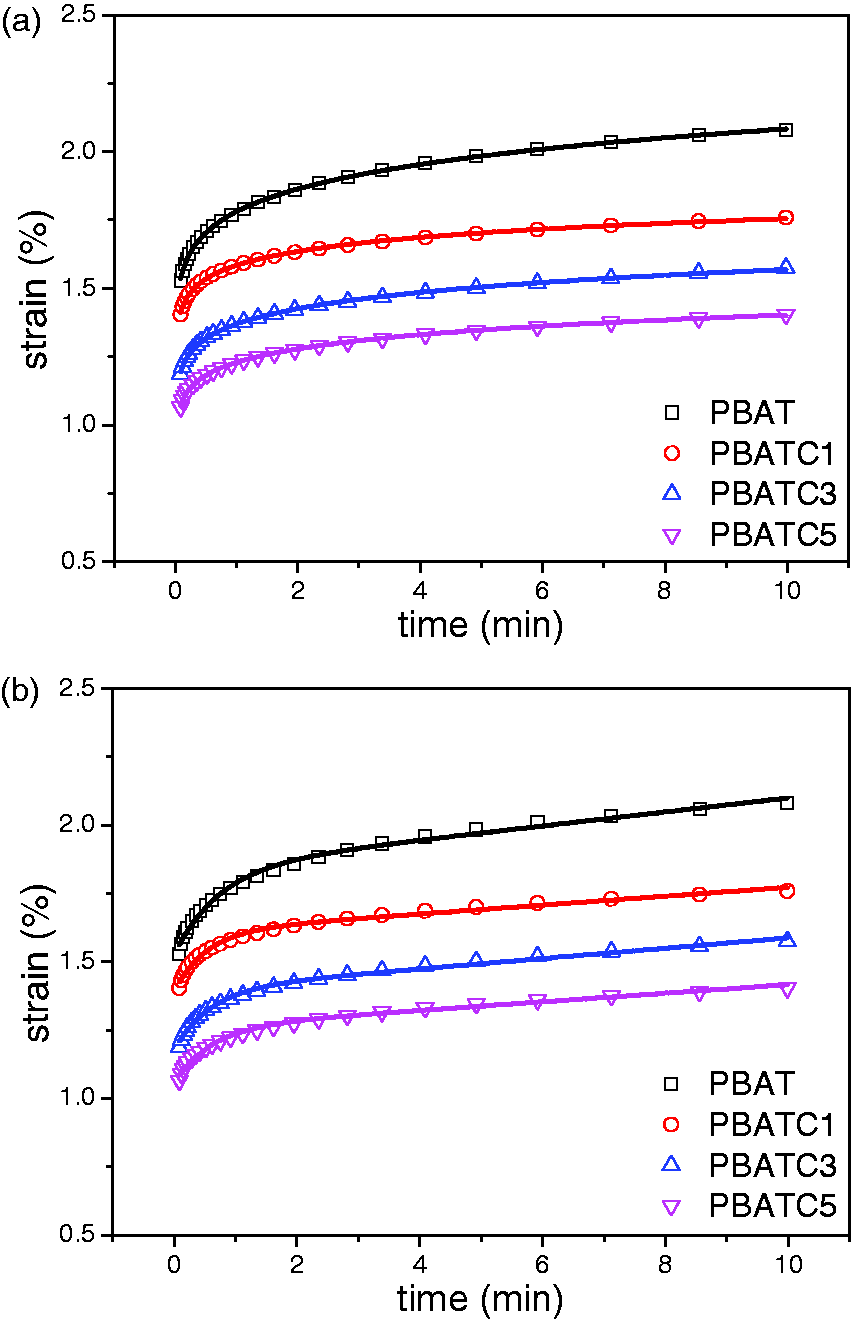
Average values of parameters obtained from Burgers model prediction on creep behavior of the neat PBAT and its composites.
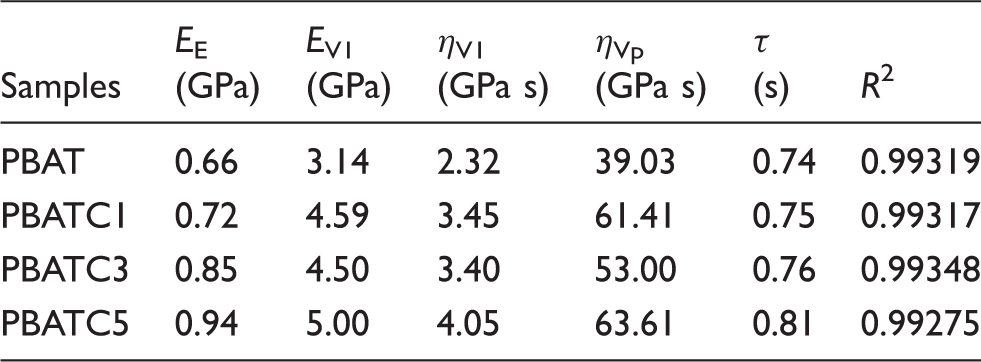
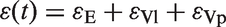
It is seen that the Burgers model prediction results are in good accordance with the experimental data of creep strain, although not that good as the predictions of Findley model. This is reflected by the reduced values of coefficient R2, which is commonly used to evaluate the goodness of nonlinear fitting. All viscoelastic and viscoplastic parameters increase with addition of CNTs relative to the neat PBAT. The parameter EE associated to the Maxwell spring contributes instantaneous creep strain that can recover after stress elimination. The increased values of EE, therefore, confirm the reinforcing effect of CNTs because they are much stiffer than PBAT. The retardant modulus EVl is related to the stiffness of amorphous polymer chain. It shows the same tendency with EE, which reveals reinforcement of CNTs on the Kelvin–Voigt unit.
29
In other words, the presence of CNTs suppresses viscoelastic deformation of the PBAT chain. Dynamic storage modulus (E′) and loss factors (tan δ) for the neat PBAT and its composites at 5 Hz.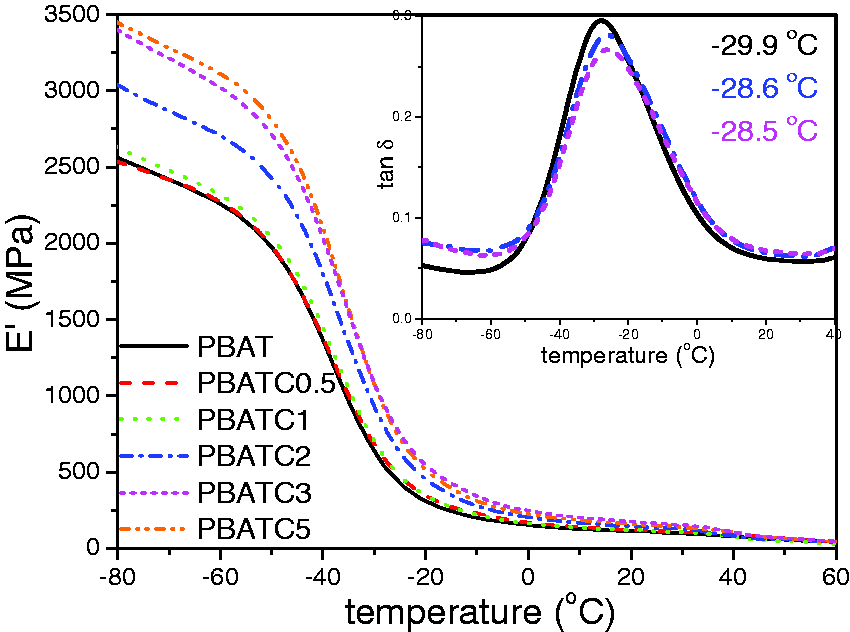
Since the presence of CNTs has large influence on creep of PBAT, it may also affect creep-recovery process of PBAT. Weibull distribution equation
40
is used here to describe the role of CNTs played during creep recovery. On removing the loads, the instantaneous recovery strain 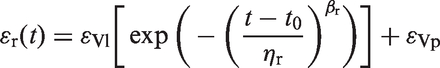
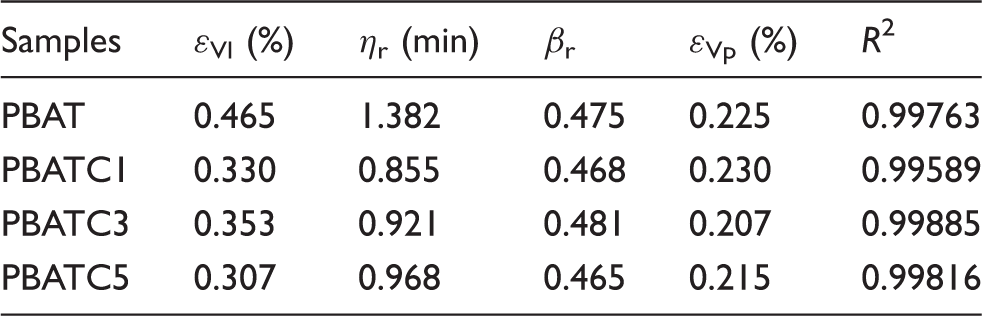
where Theoretical predictions on the creep-recovery results of the neat PBAT and its composites (30℃) using Weibull distribution function. Average values of parameters obtained from Weibull model prediction on creep-recovery behavior of the neat PBAT and its composites.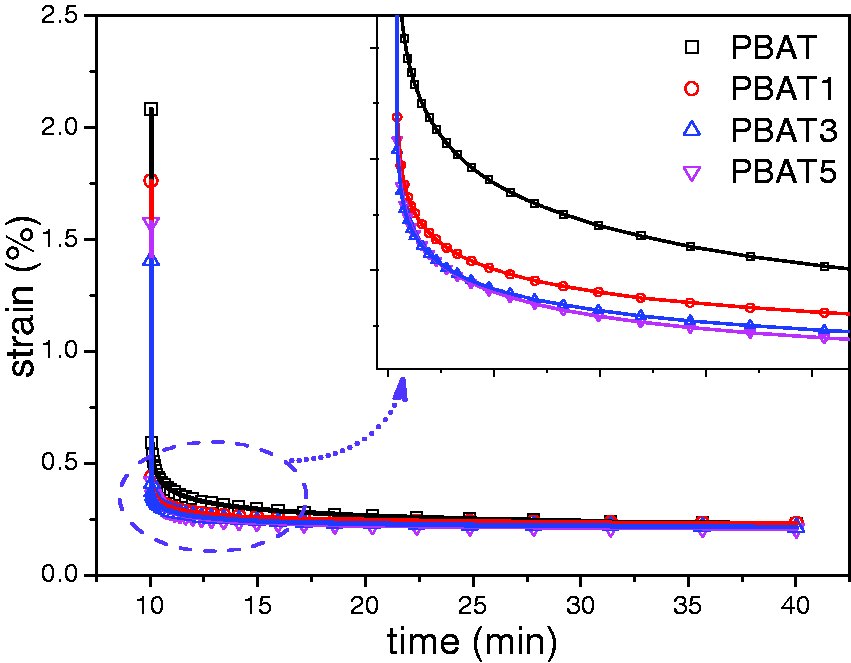
Stress relaxation of the PBAT/CNT composites
The role CNTs played during stress relaxation of the composite system is essentially the same as that during creep recovery. Figure 8 shows the stress relaxation behavior of all samples. The composites have higher initial transient stress response than that of the neat PBAT. This is attributed to the higher modulus of the composites. The solid lines are the best linear fitting results on the last four plots and the slope and R2 values are given in Figure 8. It is seen that the composite samples are much closer to the equilibrium state at the last experimental stage of relaxation because their absolute values of slope of the relaxation curves are lower than that of the neat PBAT. This means that the composites show lower relaxation rates than the neat PBAT at the last stage. This may be because the presence of CNTs decreases stress contribution by the purely viscous part and the viscous part of viscoelastic unit in the system.
29
It is notable that at the initial stage, namely the accelerated relaxation stage, the composite shows higher relaxation rate, as can be seen on the normalized stress curves shown in the inset graph in Figure 8. This is attributed to the increased stiffness or elasticity of the composite system because of reinforcement of CNTs. In other words, the presence of CNTs enhances the overall elastic recovery responses contributed by linear elastic unit and the elastic part of viscoelastic unit.
37
Stress relaxation curves of the neat PBAT and its composites (40℃, 0.5% strain). The inset graph shows normalized stress–time curves.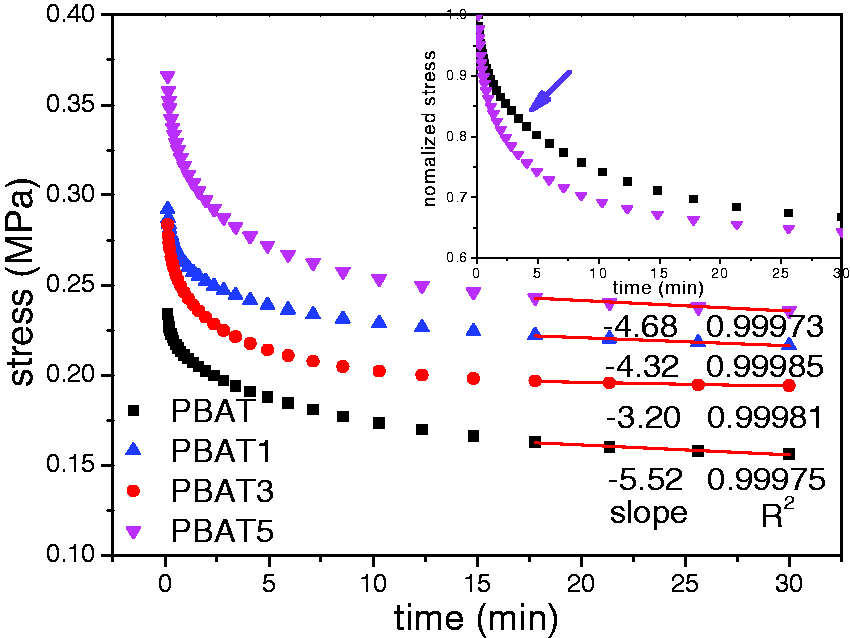
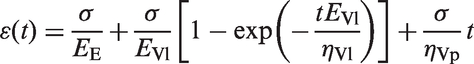
The stretched exponential model
41
is a useful model describing stress relaxation. The transient stress relaxation modulus (E(t)) is
Theoretical predictions on the stress relaxation of the neat PBAT and its composites (40℃, 0.5% strain) by the stretched exponential model. Average values of parameters obtained from stretched exponential model prediction on stress relaxation behavior of the neat PBAT and its composites.

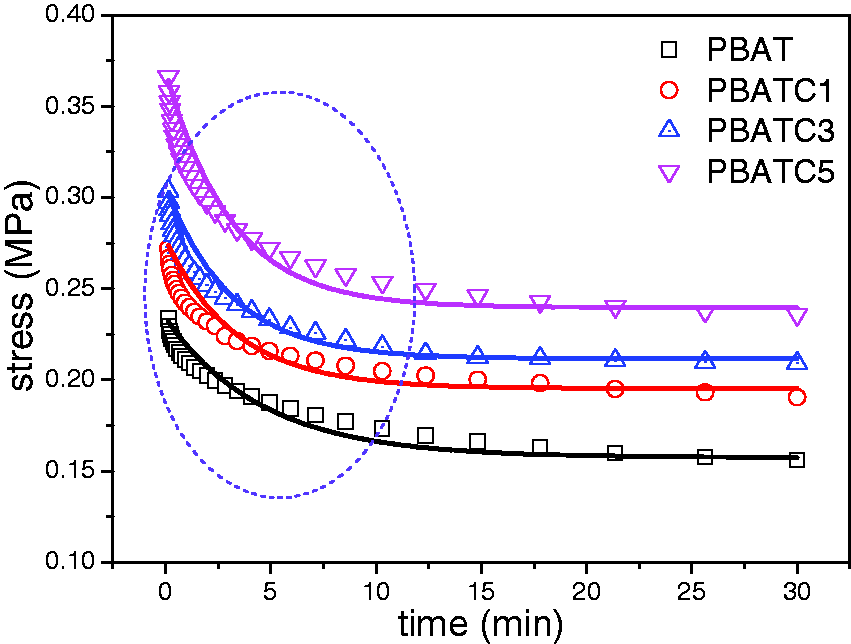
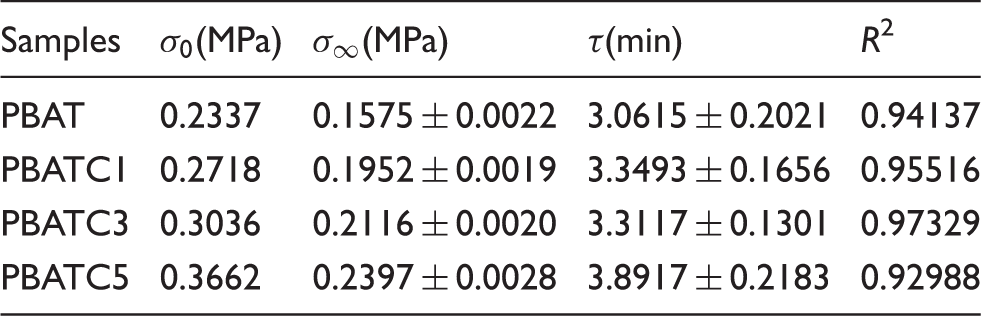
It is seen that the stretched exponential model cannot provide satisfied descriptions on the stress relaxation behavior for both the neat PBAT and its composites, especially at the accelerated relaxation stage (see the indicated parts in Figure 9). This is also reflected in the decreased coefficient R2. Therefore, the obtained parameter values are not very accurate. But those values may be used for a qualitative comparison. It is seen that the predicted values of
Linear dynamic rheology of the PBAT/CNT composites
The creep results above reveal the linear viscoelasticity of PBAT composites in solid state, while the dynamic rheology in molten state can give more information on the relaxation behavior from other side of view. Cole–Cole plots
42
are convenient way of describing viscoelastic properties of the materials with a relaxation time distribution such as multiphase polymeric system. Figure 10(a) shows the Cole–Cole plots of the neat PBAT and its composites. A single arc is seen on the neat PBAT, which represents relaxation process with a relaxation time distribution.
43
With addition of the CNTs, the Cole–Cole arc is divided into two parts: a half-baked arc at the low viscosities, corresponding to the local dynamic of PBAT and, a rigid tail at high-viscosity region caused by the long-term relaxation of those restrained chain coils.
44
As the CNT loading level achieves up to 3 wt% and above, the Cole–Cole arc cannot fully appear in the experimental frequency range. This is indicative of formation of percolated CNT network,
43
a long-term structure of CNTs, which is mesoscopic and far larger than the polymer chain scale.
(a) Cole–Cole plots of imaginary viscosity (η″) versus real viscosity (η′) and (b) v-GP plots of phase angle (δ) versus dynamic complex modulus (|G*|) for the neat PBAT and its composites at 150℃.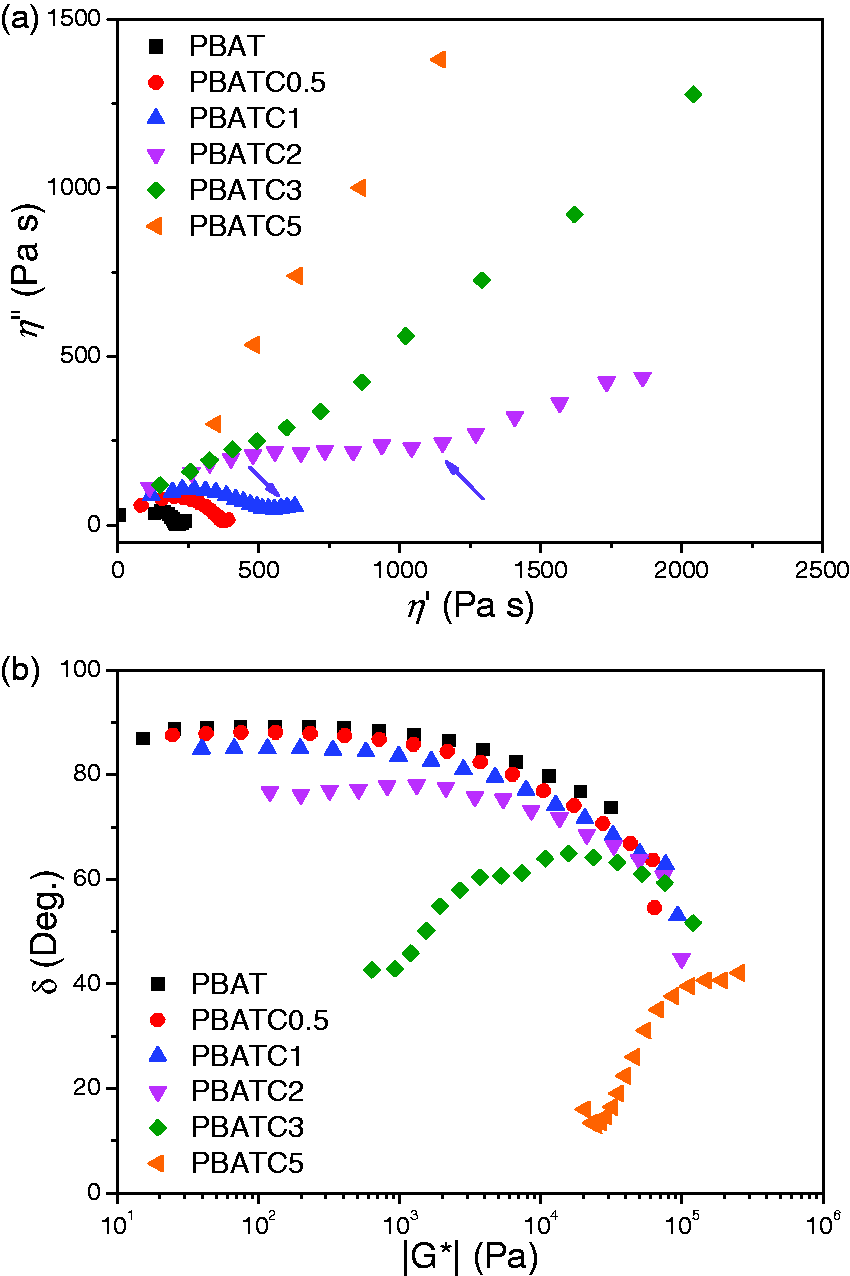
van Gurp-Palmen (v-GP) method,
45
which plots dynamic complex modulus (|G*|) versus phase angle (δ), is commonly used to detect the rheological percolation of a CNT based polymeric system.46–49 Figure 10(b) gives the v-GP plots for the neat PBAT and its composites. At the lower CNT loading levels, the low-frequency phase angle values of the system are higher than 45°, indicating a flow behavior dominated by the viscous PBAT. As the CNT loading achieves up to 3 wt%, the composites show evident solid-like response in the low-frequency region because low-frequency phase angle values sharply reduce to lower than 45°. It indicates that the viscoelastic flow of the system is dominated by elastic deformation. Therefore, the percolation threshold of PBATCs is about 2–3 wt%. Above this loading level, the hydrodynamic interactions among CNTs are strong enough, leading to the formation of a transient long-term structure of CNTs through dynamic shear flow,47–51 namely percolation network. In this case, relaxation of large-scale structure of matrix PBAT, such as chain coils, is highly restrained by the presence of CNTs,49–54 and hence the composites show a solid-like flow behavior at low-frequency region after percolation and, their storage modulus values increase evidently by 3–5 orders of magnitude, as can be seen in Figure 11.
(a) The plots of dynamic storage modulus (G′) and (b) loss modulus (G″) for the neat PBAT and its composites at 150℃. The dotted curve is drawn according to least square fitting of the equation (11) with j = 3 to the neat PBAT sample and the solid curves are calculated according to equations (13) and (14).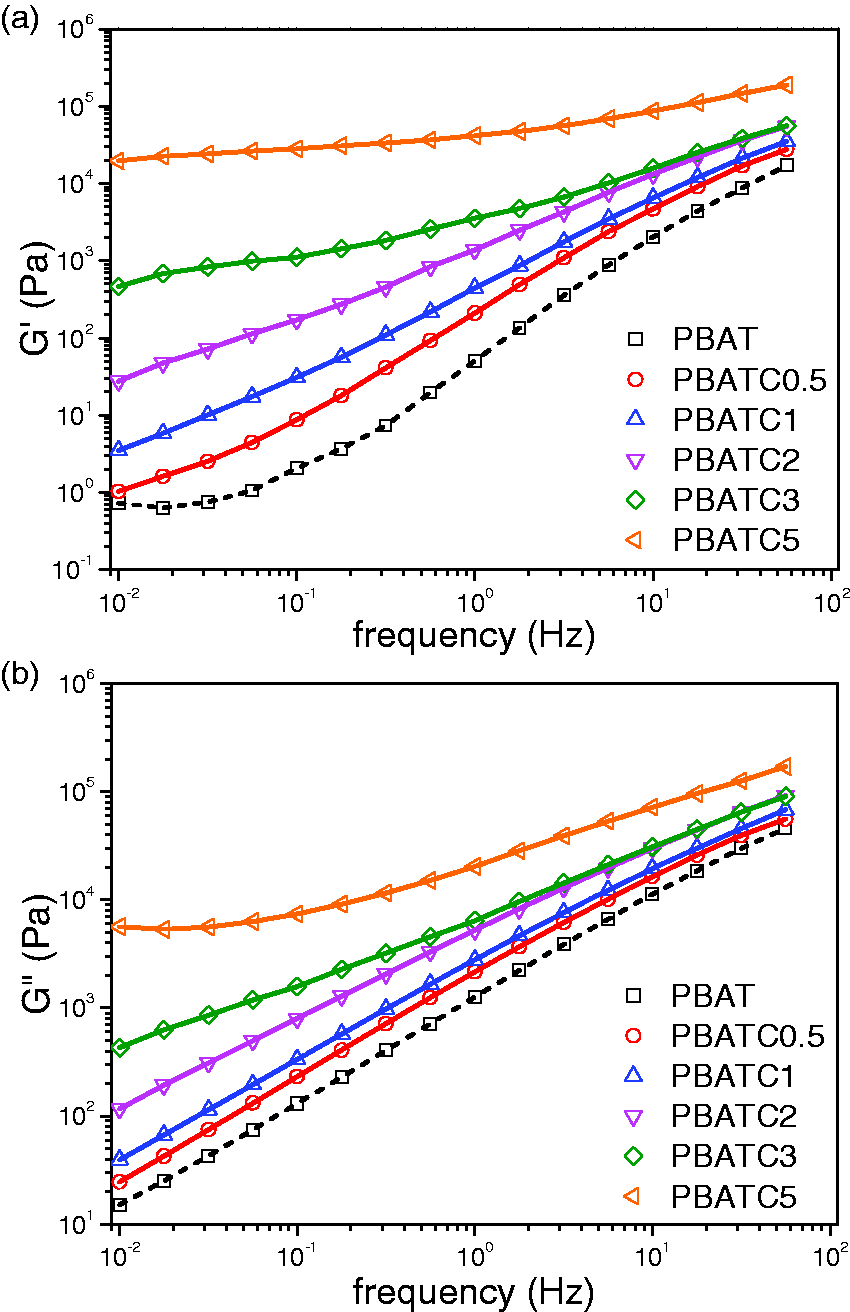
Besides the long-term structure of CNTs, the short-term one, such as the CNT flocs or bundles, can also be preliminarily revealed by the dynamic rheological responses of PBAT composite system. Song et al. proposed a two-phase model,55–57 which can be well used to describe the dynamic rheological responses of a filled polymeric system. Generally, the presence of hard and much less deformable filler inclusions in a soft and highly deformable polymer matrix leads to hydrodynamic effects referring to a strain amplification factor (


A microrheological model
60
based on the fractal concept reveals that 
Here, α is an exponent related to the polymer-filler affinity,
56
Polynomial functions can be used here to fit 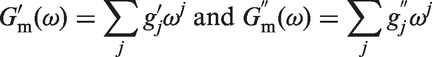
Here, 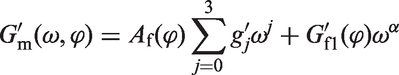
Average values of parameters obtained from two-phase model prediction on dynamic rheological responses of the neat PBAT and its composites.
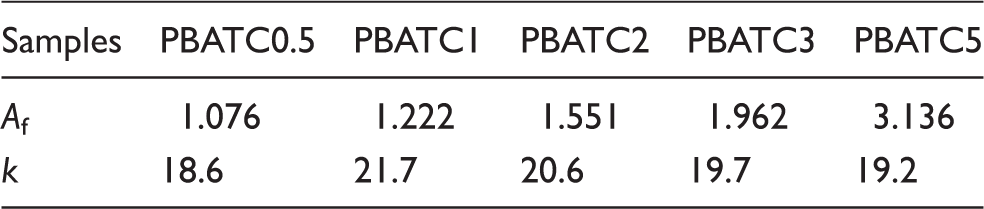
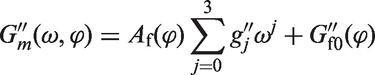
The strain amplification factor (Af) as a function of 
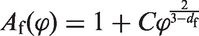
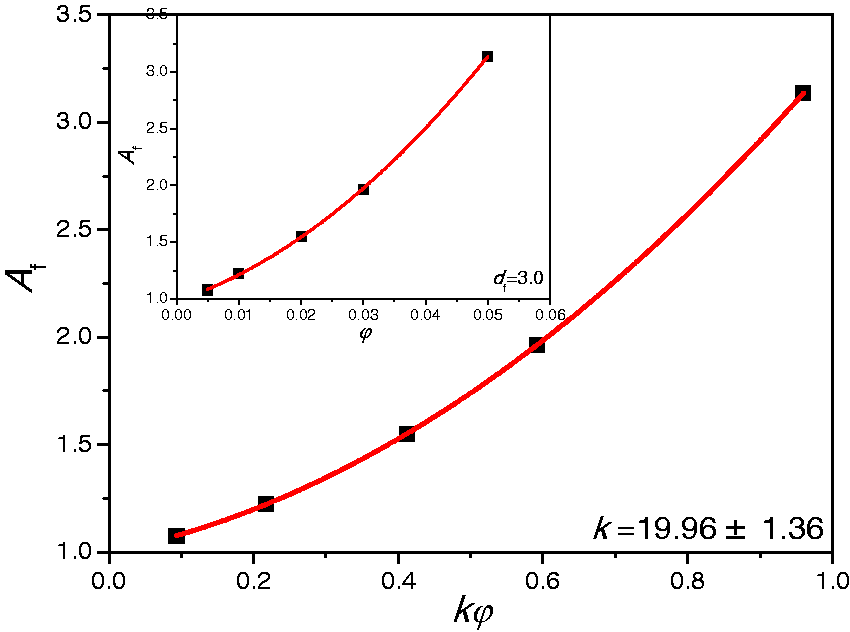
The k values of three-dimensional nanoparticles, such as silica and carbon black, commonly range from 4 to 10 because of irregular shape of their aggregates by fusion of primary particles.55,62,63 The one-dimensional nanoparticles, such as CNTs, have far larger k values ranged from 15 to 30 because of the formation of clusters with large aspect ratios.55,64 In this work, the k value of CNTs in the matrix PBAT is about 20, located in a common value range of the filler with high aspect ratios and nearly independent on the CNT loadings (Table 5). The value of fractal dimension (df) is about 3, which agrees well with the structural characteristics of CNT flocs,65,66 and hence confirms the dispersion state of CNTs observed by TEM.
Conclusion
The linear viscoelastic response can be well used as the probe to detect the long-term and short-term structures of CNTs. The CNTs show the percolation threshold of 2–3 wt% in the PBAT matrix, and their structural parameters related to aspect ratio and fractal dimension, etc., can be obtained by the two-phase model simulations on the dynamic rheological responses of composites. The presence of CNT flocs or small bundles retard both creep and stress relaxation of PBAT by the approach of restraining viscoelastic and viscoplastic deformation of chain coils, rather than constraining chain segments. The creep behavior of composite system is well described by Findley model and Burgers model, and the creep-recovery behavior is well described by Weibull model, which can give useful information on relaxation of the hierarchical structures of CNTs with various scales.
Footnotes
Declaration of Conflicting Interests
The author(s) declared no potential conflicts of interest with respect to the research, authorship, and/or publication of this article.
Funding
The author(s) disclosed receipt of the following financial support for the research, authorship, and/or publication of this article: This work was supported by the research grants from the National Natural Science Foundation of China (No. 51173156) and the Prospective Joint Research Program of Jiangsu Province (No. BY2014117-01) as well as the Blue Project of Jiangsu Province.