
Abstract
This paper focuses on the development and the validation of flexural modulus and flexural strength predictive models of long glass fibre reinforced polyamide 6.6 (PA66). Based on previous injection moulding optimization of 40 wt% long glass fibre PA66, a microstructure analysis was investigated on glass fibre reinforced PA66 by varying the parameters of the material (fibre length, fibre content, fibre diameter). In a first phase, analytical models established within the framework of the processing condition limits previously determined have been elaborated. These models lead to a good experimental/calculation correlation but remain limited to a mould and part design. In a second phase the flexural modulus and maximal flexural stress have been then estimated from structural models based on a five layer morphological description of the composites (local residual fibre length, local fibre content and fibre orientations). The long glass fibre PA66 composites were characterized in terms of fibre content distribution model and fibre orientation model through the part thickness. The experimental/model correlation was achieved whatever the process variability is (mould, material and processing conditions) both for the flexural modulus or flexural strength. The models have been then validated with an industrial part. Finally, a correlation between the two studied properties has been revealed depending on the nature of the composite matrix (PA66, PA6 or PP).
Introduction
In recent years the increase in the use of long glass fibre thermoplastics (LFT) in many field of applications led to a development of technical and scientific investigations. Among them, the automotive sector shows a high growth of their applications for light structural parts in the replacement of metal.1,2 Elaborated first on the base of polypropylene for the increase of stiffness and strengths, the LFT composites have found new developments with other technical matrix (polyamides, PET or polycarbonate …) in order to answer the needs of technical performances under thermo-oxidative environments for the under-the-hood applications for instance.
The LFT injection moulding induce composite structures characterized by a fibre degradation directed by the high shear stresses occurred during the plasticization and by the melt flowing through the gates or within the mould cavities,3,4 a fibre segregation along the flow and through the thickness,5–7 a fibre orientation directed by the melt flowing6–9 and an interphase specific to the crystalline matrix governing the fibre/matrix linkage. 7 These micro-structural parameters depending of the process are responsible for the mechanical properties of the LFT’s parts.6,7,9–14
Regarding the prediction of glass fibre reinforced thermoplastic tensile properties, in the fibre direction, a simplest model based in a rule of mixture (ROM) can be used to predict the elastic properties of a composite. This model assumes that both the fibre and the matrix have a same strain and requires the only knowledge of the, respectively, fibre and matrix elastic modulii as well as the fibre volume content in the composite. In the transverse direction, the applied transverse stress is assumed equal in the fibre and the matrix the modulus is calculated from the inverse rule of mixture (IROM). 15 In the case of misaligned fibres as observed in short or long fibre composites, the fibres are not oriented in the same direction through the part thickness and have not the same length. The usual ROM applied for a unidirectional reinforced composite does not give the expected accuracy. 16 Cox 17 have developed a model for random in-plane fibre reinforced composite. The elastic modulus is determined from a modified ROM taking into account an orientation factor and a length factor depending on fibre shape, fibre properties as well as fibre/matrix properties. Kelly and Tyson 18 have shown that for very small strain within a fully elastic domain, the sliding load transfer at fibre extremities can be neglected and the stiffness is done by a modified ROM including only the orientation factor. The Halpin-Tsai equations are certainly the most common model used to predict young’s modulus in the case of fibre reinforced polymers. 19 These equations are especially attractive because no experimental measurements are required. The Halpin-Tsai equations are a set of empirical relationships that enable the property of a composite material to be expressed in terms of the properties of the matrix and reinforcing phases together with their proportions and geometry. Halpin and Tsai showed that the property of a composite could be expressed in terms of the corresponding property of the matrix and the reinforcing phase associated to an empirical shape-fitting parameter depending of the fibre shape and the fibre/loading alignment.
The tensile stress prediction is more complicated to predict than young’s modulus because the material is no longer in the lower strain region, it evolved from its initial state to plastic strain, rearrangement and damage. In a composite, the failure can occur in the fibres or at the fibre-matrix interface. In the case of a slipping matrix/fibre load transfer, the Kelly Tyson’s model 18 is commonly used. The model is set on fibre contribution composed both of fibre subcritical length and fibre supercritical length and matrix contribution. Thomason 20 suggested an experimental method called interfacial shear stress (IFSS) to estimate these matrix and fibre contributions. Equally used for long glass fibre (LGF) strength prediction, the model is in accordance with experimental values. 6
For complex flexural load deflection where both elongation and shear stresses are combined, the finite element methods (FEMs) are generally used. The material is considered a superimposition of unidirectional reinforced layers. The best prediction comes from the analytical homogenization models allowing estimating the bulk elastic properties of the composites from a microstructural description of the moulded composites (properties of the constituent, fibre length and fibre orientation). Most of these models are based on Elshelby model or Mori Tanaka model
21
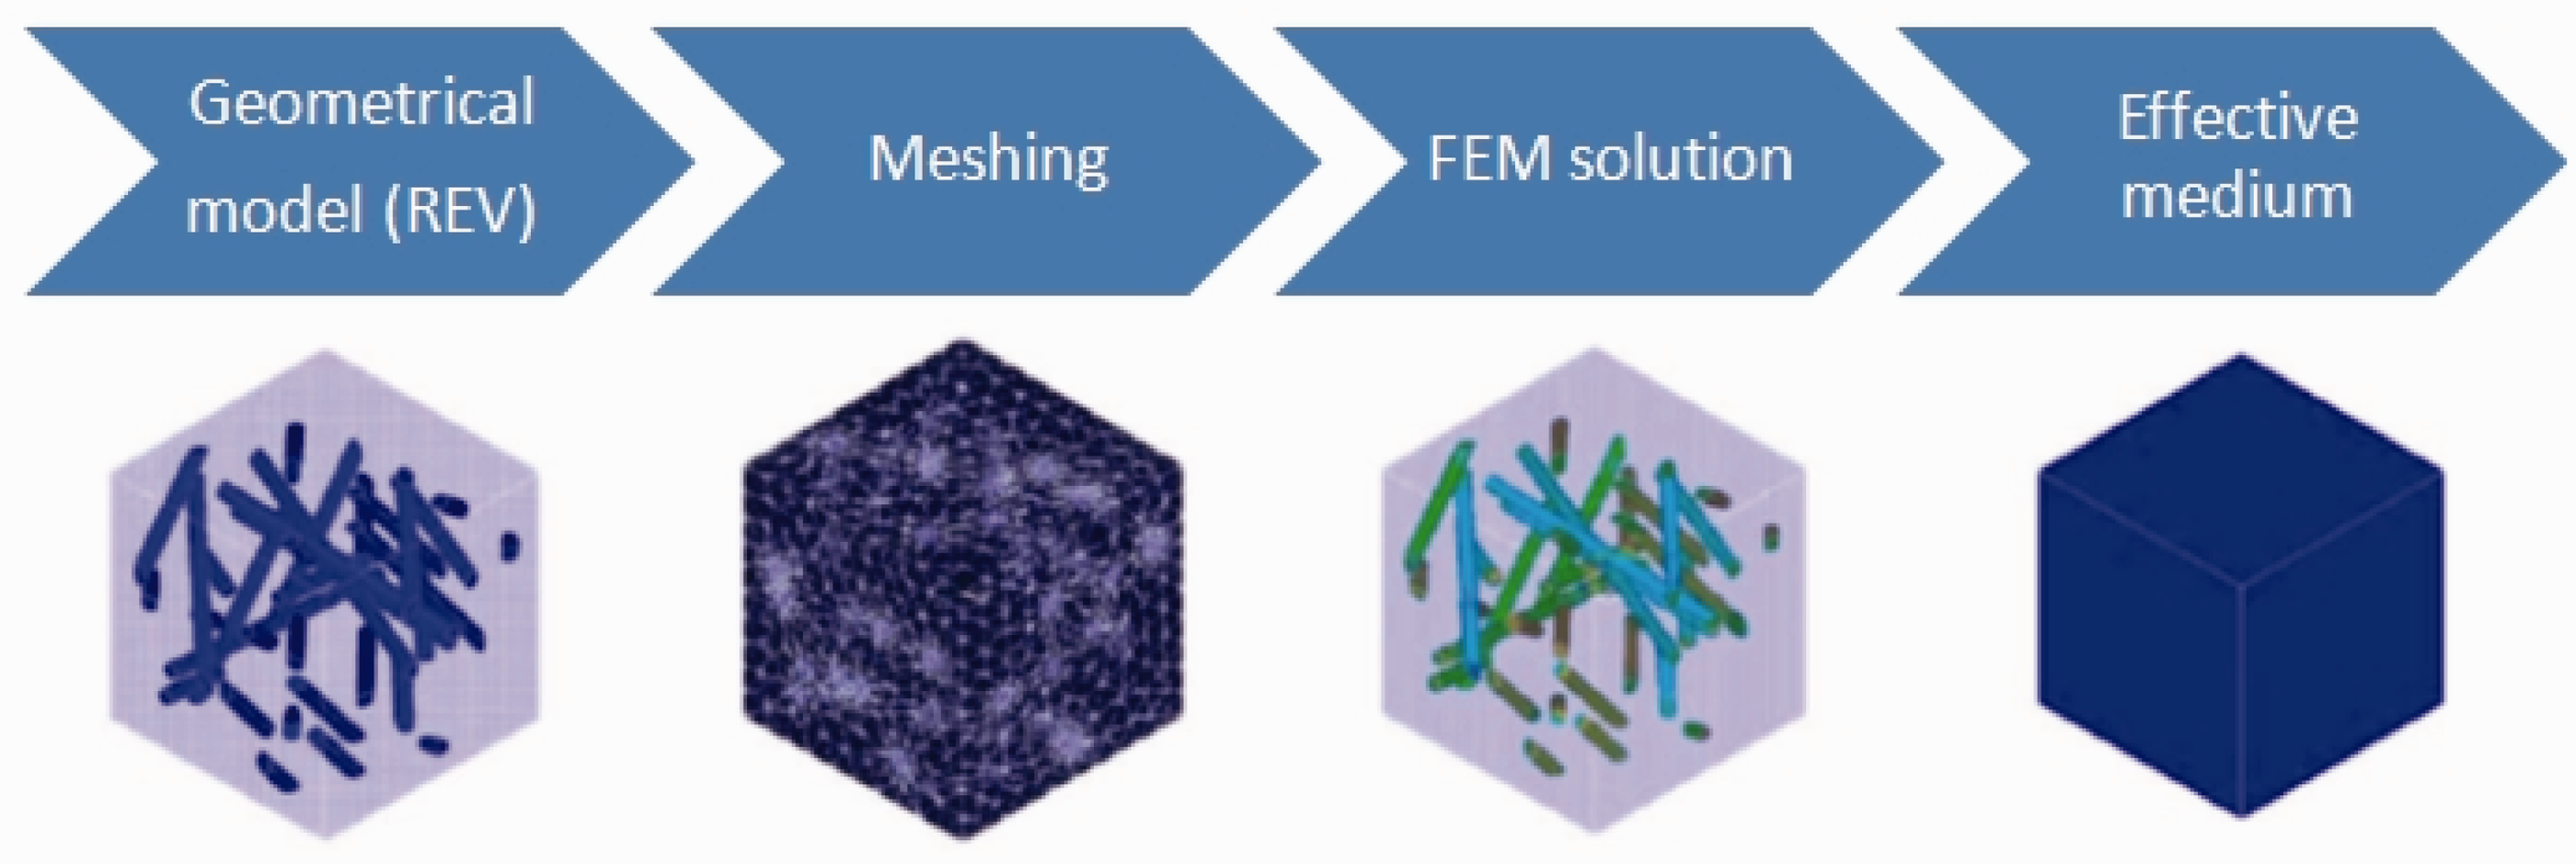
and are generally coupled to the injection process simulation. The FEMs can be schematically represented by four main steps illustrated in Figure 1.
22
These methods require important means of calculation.
Schematic representation of FEM modelling steps: (1) geometrical model generation, (2) meshing, (3) periodic conditions and FEM solution and (4) effective properties calculation.
22
The aim of the present work is to develop and validate predictive models allowing the description of the flexural mechanical behaviour of long fibre reinforced polyamide 66. These models are based on the established typical structures coming from fibre content distribution through the part thickness, fibre orientation distribution and fibre length spectra data banks. Several ways are envisaged, either by developing a simplified analytical model taking into account the whole processing variables (material, process …) or by developing a more or less complex model based on the targeted part structures.
Experimentals
Materials
The materials studied are polyamides 6-6 (PA6-6 LGF Factor®) reinforced by 10 wt%, 40 wt% or 55 wt% of 12-mm long and 12-µm diameter glass fibres (FACTS GmbH). A 40-wt% of 800 µm short glass fibre (SGF) reinforced polyamide 6-6 has also been used in the study for the comparison with the LGF compounds. All the compounds (SGF or LGF) are made on the base of Technyl® A216 polyamide 6-6 matrix (Solvay, France).
These materials will be referenced LGF 10 wt%; LGF 40 wt%; LGF 55 wt% and SGF 40 wt%.
Machine and mould
The experiments were carried out on a 2000-kN clamping force injection moulding machine (DK Codim). The machine has an injection gate located in the parting line and is equipped with a standard 55-mm diameter screw.
The prototype injection mould is a rectangular plate of 300 × 120 × 3 mm. The feeding of cavity is made by a 4-mm-thick fan gate over its whole width (unidirectional flow in the longitudinal direction of the plate). This mould was specially designed so as to reproduce some geometrical discontinuities (like frontal and tangential steps) occurring on real industrial moulds and to be able to study the effects of such more or less sharp accidents on the flow mechanisms and related part properties (Figure 2).
Plastic part and fan gate geometry.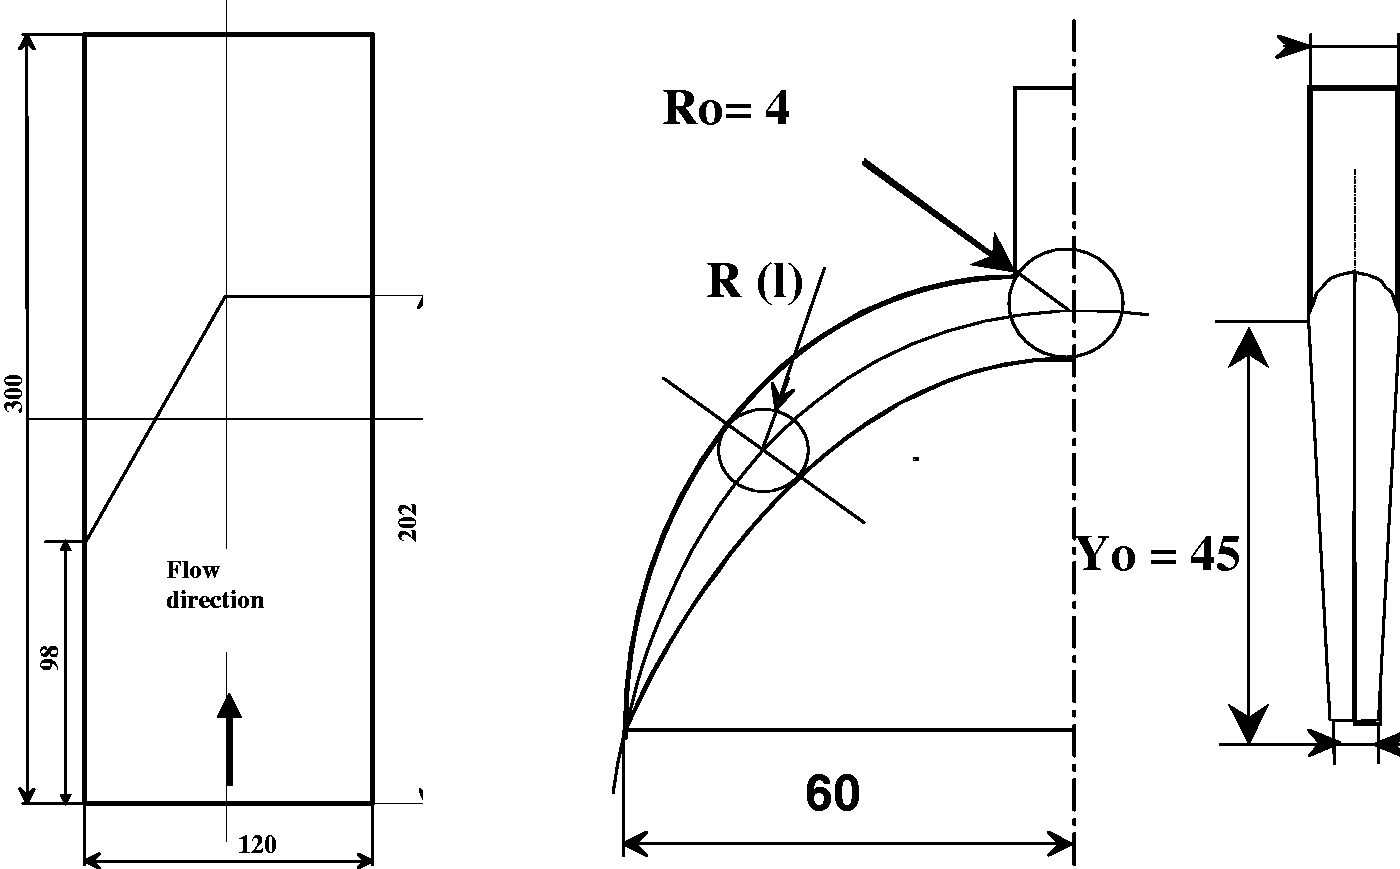
Moulding conditions
Mechanical testing
Bending test leading to the determination of the flexural properties (strength, defined as maximum stress and modulus) were performed according to ISO 178 on a standard tensile machine (Instron) at 2 mm/min, on five samples (dimensions 60 × 25 × 3 mm) in both flow (longitudinal, 1) and transverse (2) directions before (beginning) and after (end) the geometrical discontinuities as shown in Figure 3.
Location of test samples in the plate.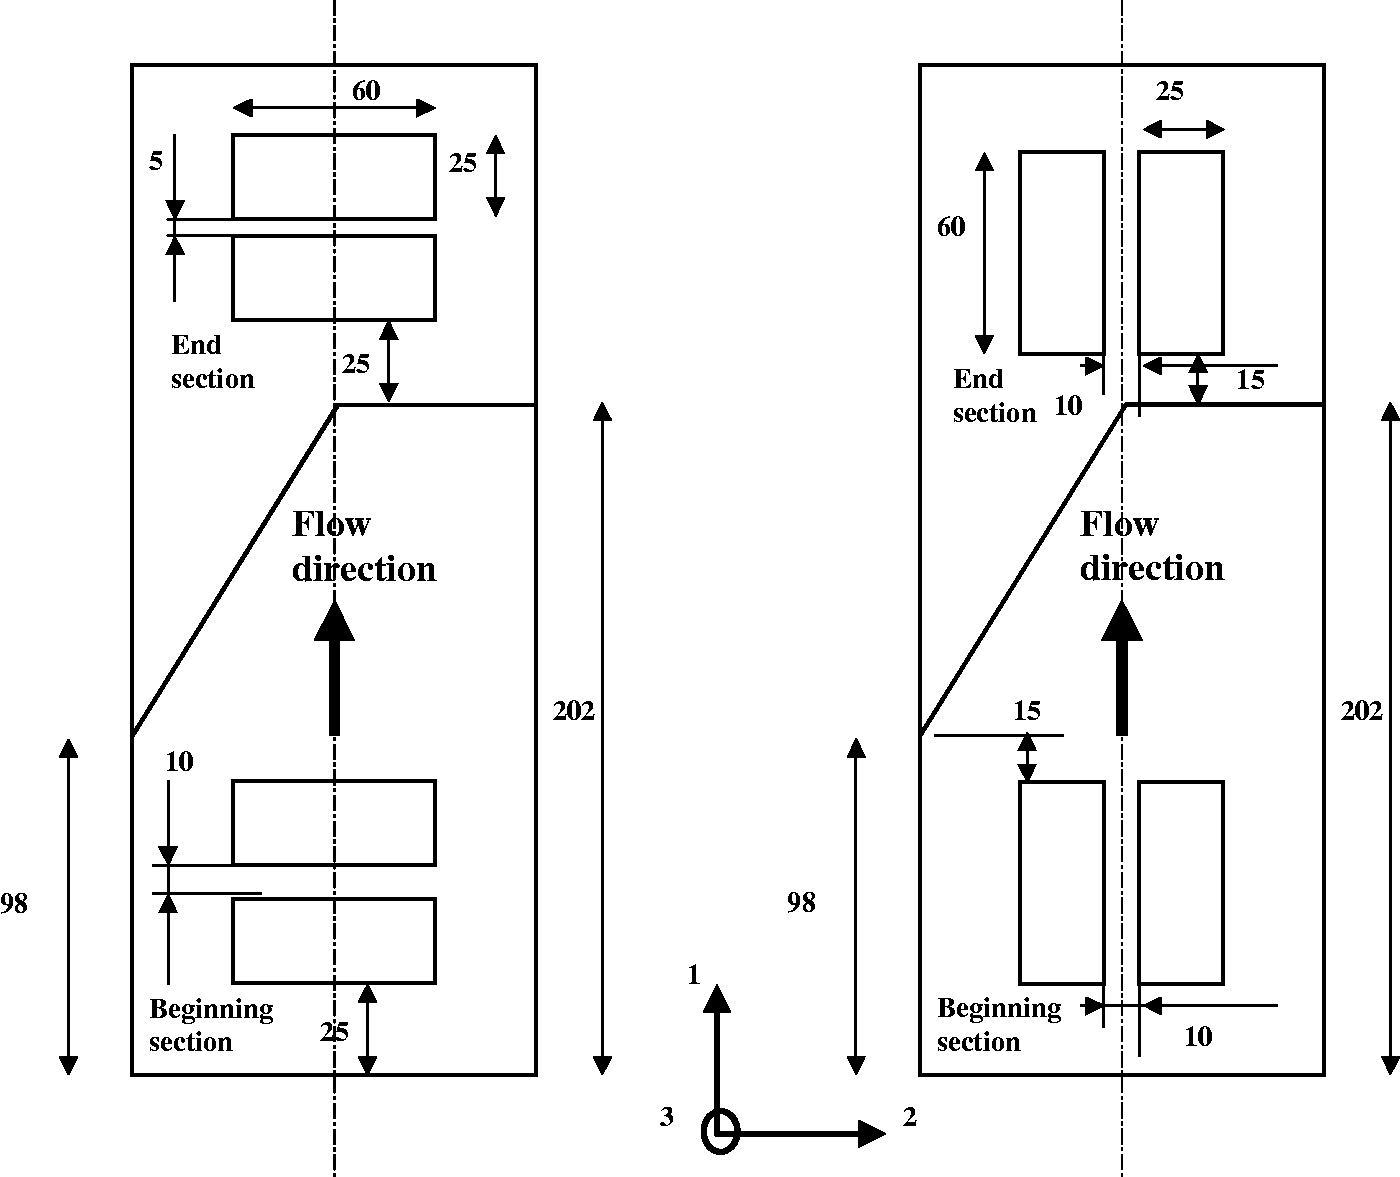
Melt apparent viscosity
The LGF PA6.6 melt viscosity representation is obtained during the filling stage of the cavity. The mould is instrumented by three pressure transducers located along the flow axes at 40 mm, 110 mm and 220 mm from the gate. The two first sensors situated in the non-disturbed area allow recording the pressure losses between two parallel plans, linked to the viscosity by the relation


ΔP is the pressure losses h is the thickness
η is the shear viscosity K is the flow consistency
Q is the volumetric flow rate n is the flow behaviour index
L is the flow length
l is the flow width
However, a non-isothermal flow occurs in the case of injection moulding. The mould cooling system induces a viscosity decrease near the mould wall and a decrease of the thickness (h) due to the increase of the frozen layer. The pressure lost is represented by the Figure 4. The melt apparent viscosity is then calculated with equation (1) from the effective pressure losses (ΔPEffective).
Evolution of pressure losses between two sensors during the filling stage.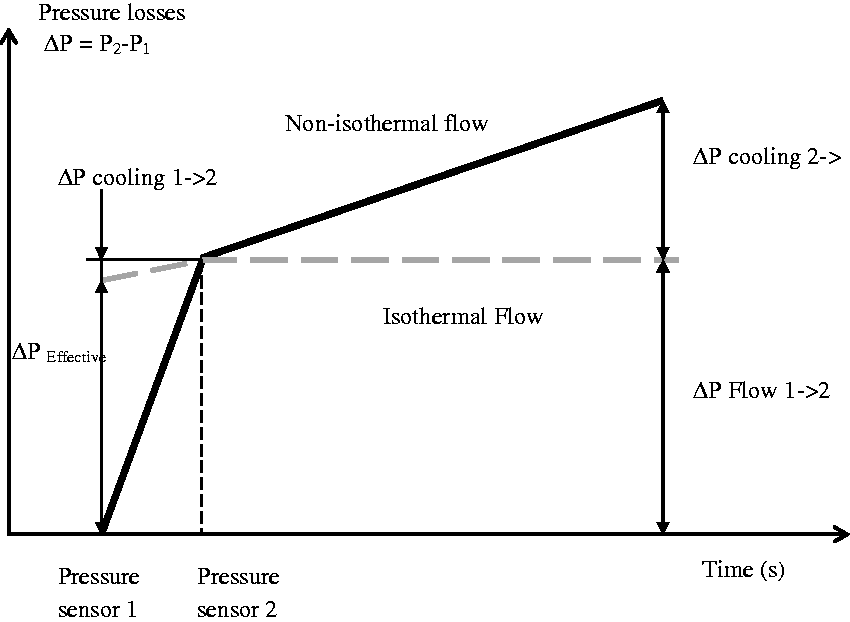
Results and discussion
Development of the analytical model
In this section, a predictive analytical model of flexural moduli and flexural strengths from the moulding conditions within a defined framework were studied. Supported by our previous studies6,7 and the literature,23–27 the hypothesis of a linear response between the processing conditions (melt and mould temperatures, volumetric flow rate), the material composition (initial fibre length, fibre diameter and fibre content) and flexural mechanical properties exists within a restricted process window. The Thomason’s works on the LGF reinforced polypropylene can support this hypothesis in this way on reflection, at least in the range of 10 to 40 wt% fibre content.
24
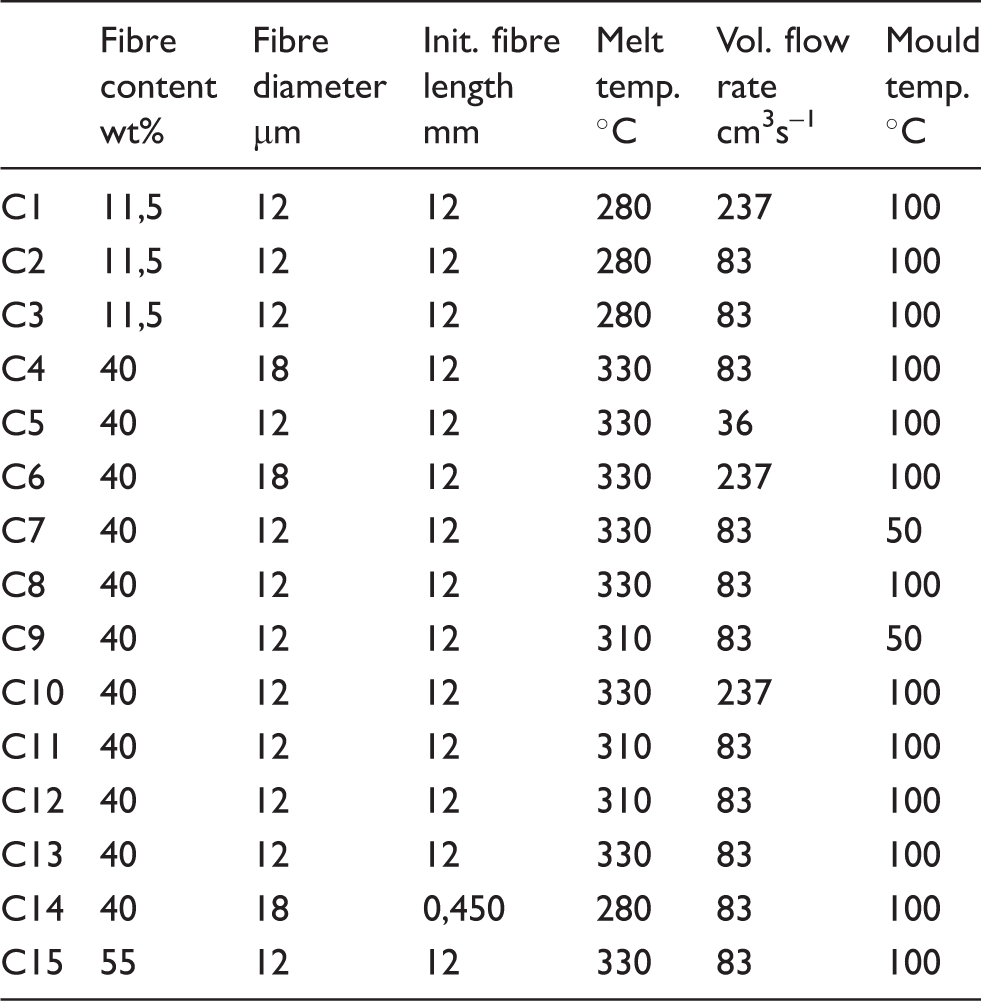
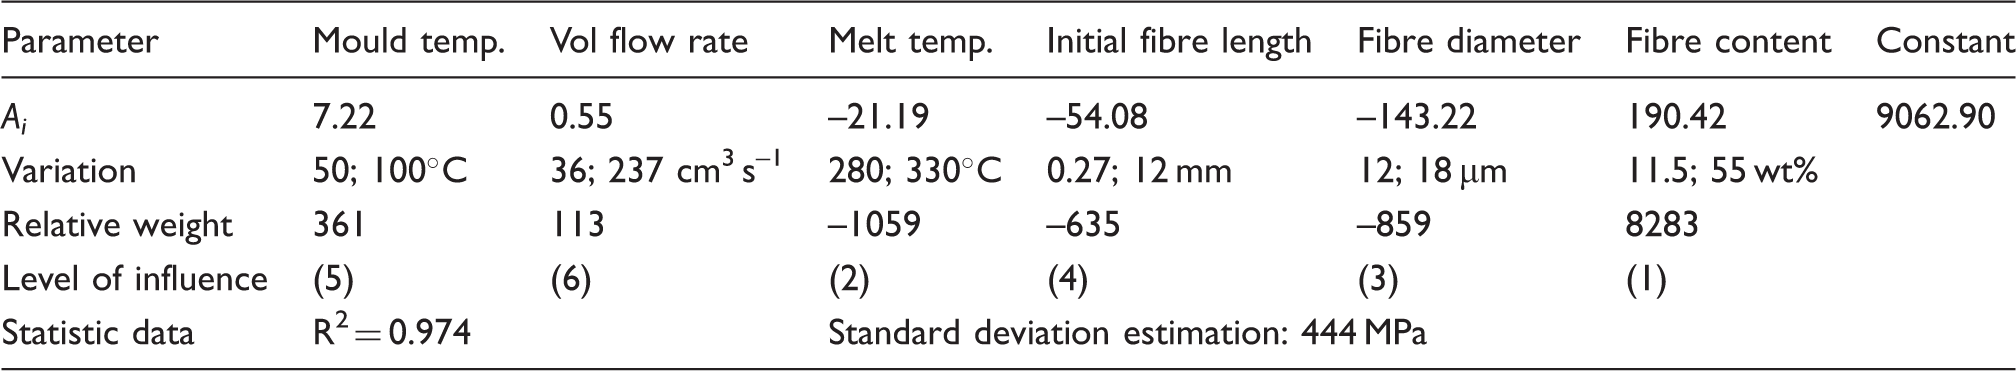
On this base, an empirical model of six parameters (15 conditions Table 1) can be elaborated (equation 3). In that case the material structure (residual fibre length, fibre orientation, crystallinity degree …) is implicit in the model coefficients

Analytical model coefficients for flexural modulus in direction 1 at the beginning section for LGF PA66 composites.
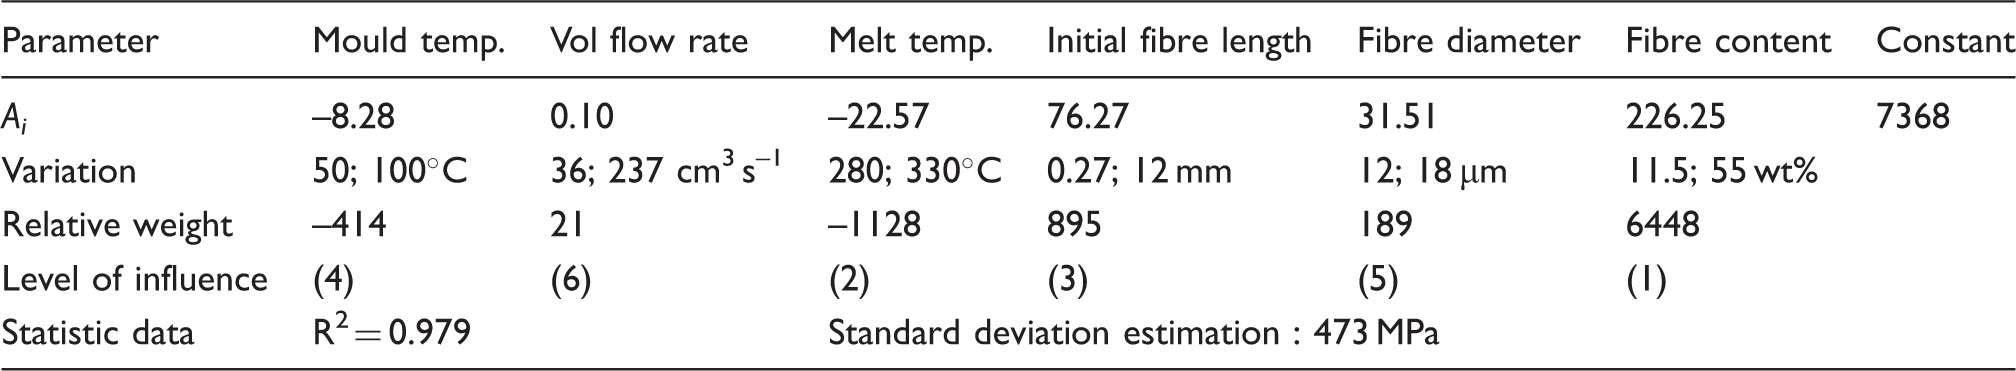
Analytical model coefficients for flexural modulus in direction 1 at the end section for LGF PA66 composites.
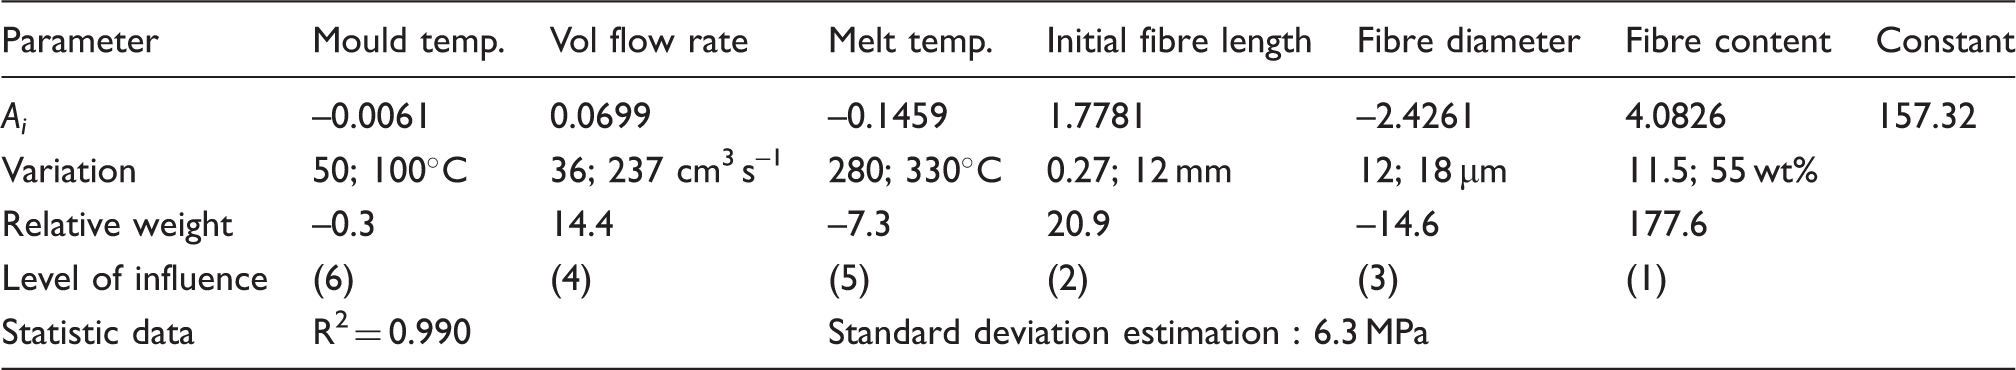
Analytical model coefficients for flexural strength in direction 1 at the beginning section for LGF PA66 composites.
Analytical model coefficients for flexural strength in direction 1 at the end section for LGF PA66 composites.
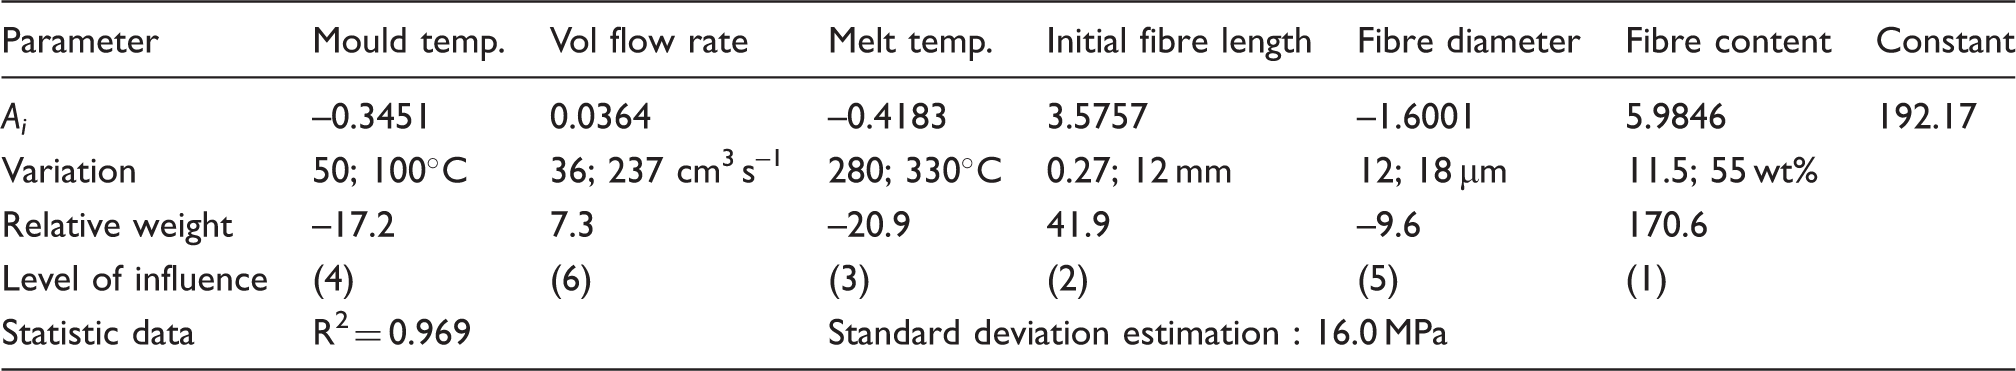
Excepted for the initial fibre content governing mainly the mechanical properties of the composites, the melt temperature remains the predominant parameter on the flexural modulus. It acts on the fibre orientation during the filling stage of the cavity. The effect of the fibre length is to be taken with precaution because it is a question of comparing the long fibres and short fibres both for the modulus and for the strength. In spite of its simplicity, the calculation is completely in accordance with the experimental data as shown in the Figure 5.
Comparison experimental/calculation values for flexural modulus and flexural strength PA66 LGF for different moulding or material combinations (C1,…,Cn) at the beginning (a, c) and end (b, d) section of the part.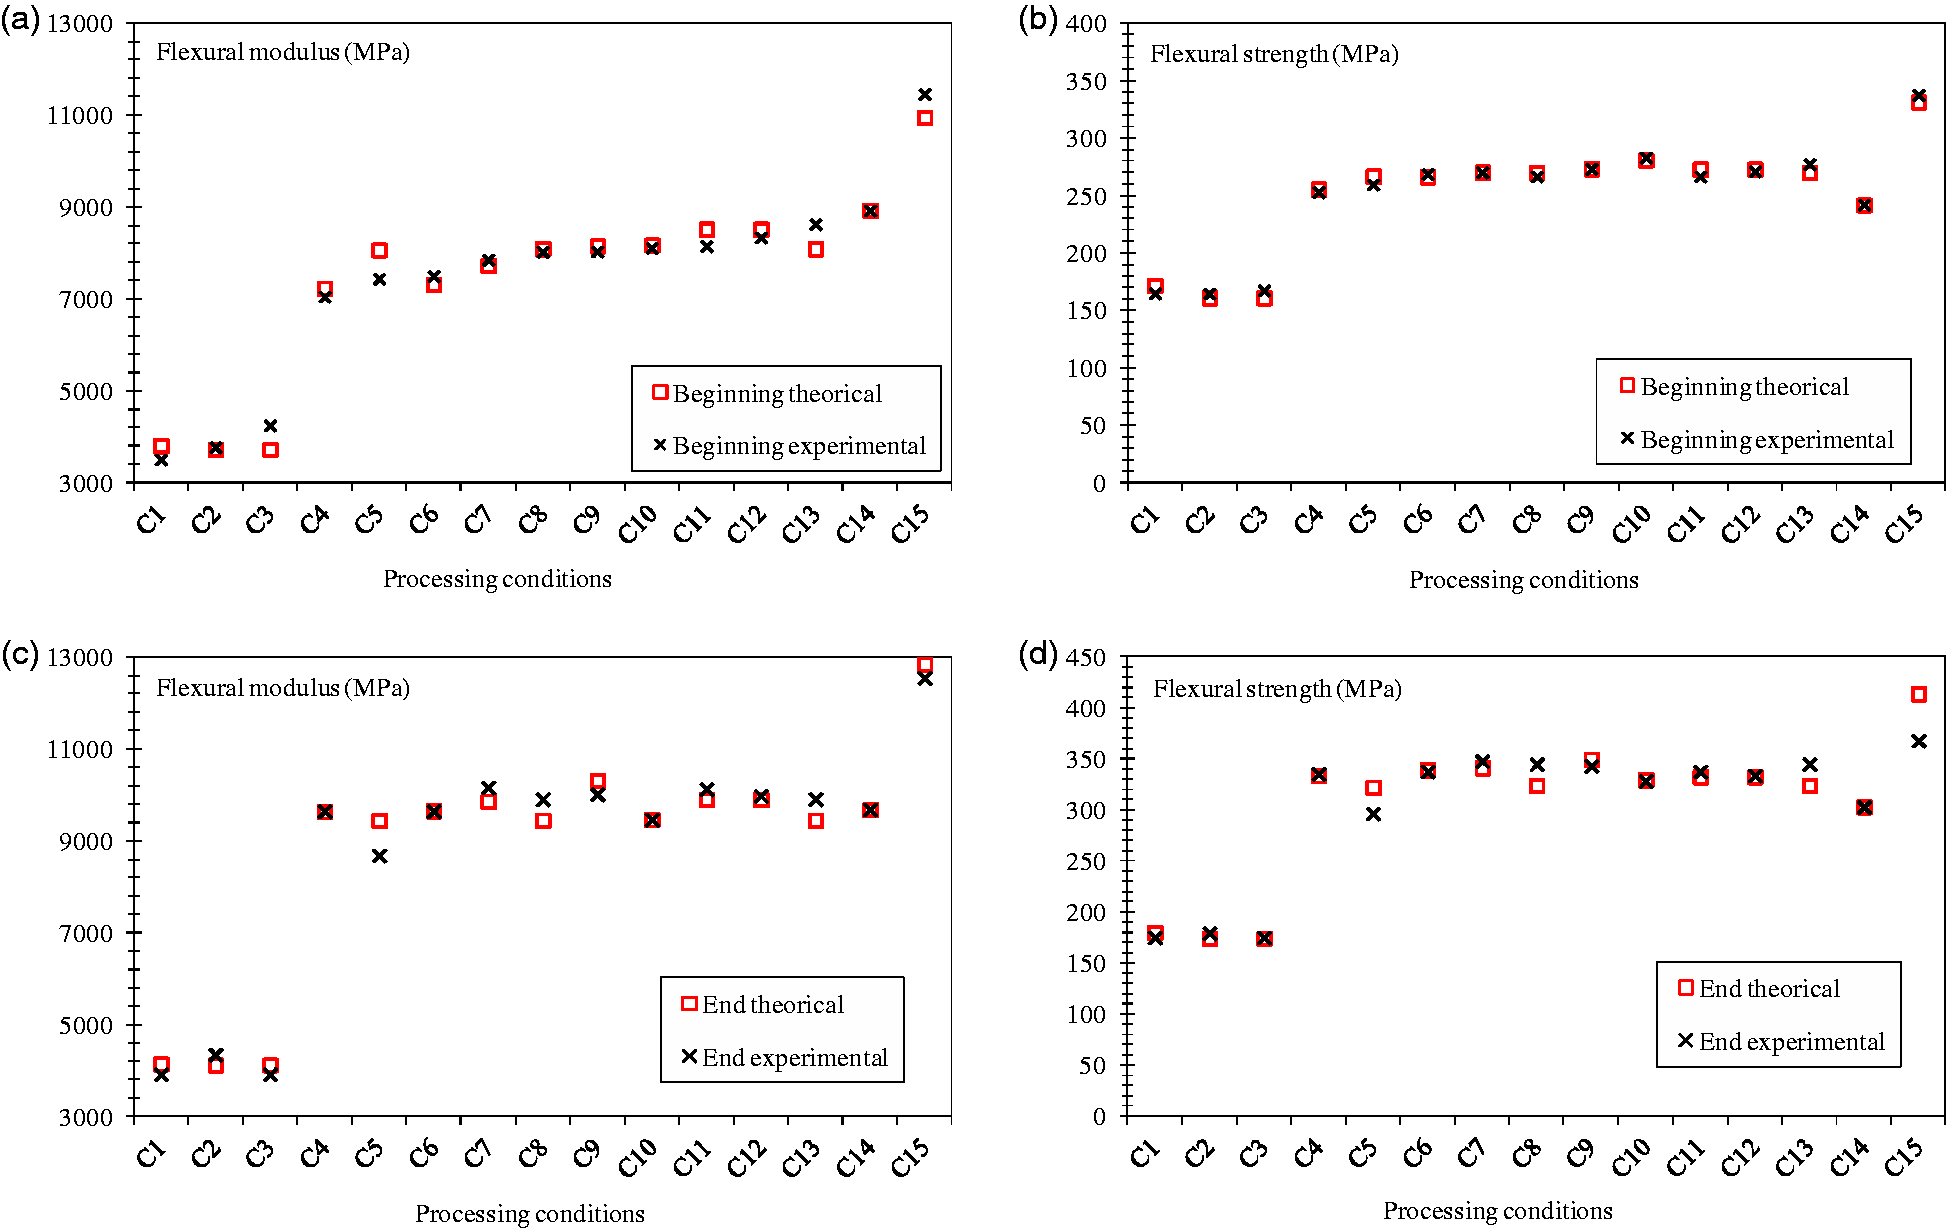
The use of linear regression confirms the possibility to approach the mechanical performances of the composites as already showed by other authors. 23 The models however depend on the part and gate geometries and its use remains limited to same matrix and fibre properties within a restricted processing window of the part. They do not take into account the real parameters linked to the material (matrix and fibre moduli, residual fibre length, fibre orientations, melt viscosity …) and the interactions between the parameters. The generalisation of the models is thus necessary taking into account the local micro-structure in order to be applicable to any material and to any parts.
Development of microstructural models
In previous studies,6,28 a thorough experimental study highlighted the influence of the processing parameters, the gate design and gate location, as well as the material formulation (initial fibre length, fibre shape ratio and fibre content) on the flexural properties of LGF reinforced polyamide 6.6. In these studies, the microstructure/flexural properties relationships have been established. The obtained results permitted to consolidate those already revealed with another LGF reinforced polymer (PET Twintex® Fibre Glass Industries Inc Netherland). 7 These various studies allowed concluding in the possibility of predicting in a simplified way but no more enough precise, the LGF composite structure evolution (inhomogeneity, anisotropy) within a definite field of the injection process (tolerances of processing conditions, flow length, gate design and location, nature of the matrix, reinforcement parameters …). With the knowledge of the final part structure, the mechanical properties can be calculated.
The first objective was to imagine and to validate a robust model describing the LGF reinforced PA66 flexural mechanical behaviour. This model is based on the typical structures previously established for the fibre weight repartition, the residual fibre length and the fibre orientation in the parts. The part structure is defined according to a five-layer configuration symmetrically distributed compared with the symmetry plane or middle plane of the part.
Young’s modulus prediction
The mechanical properties of each layer are calculated from the correspondent unidirectional composite Young’s modulus (EL) depending on the Young’s modulus of the fibre (Ef) and of the matrix (Em). The elastic modulus is then weighted by an orientation factor (η0) and a residual fibre length factor (ηl) according to equation (4)
29


Residual fibre length measurement of PA6.6 composites.
The calculated modulus Ecomposite is then obtained from the relation

For the Young’s modulus Wi = 1; for the flexural modulus
Where ei represents the layer thickness and zi the distance from the reference axe.
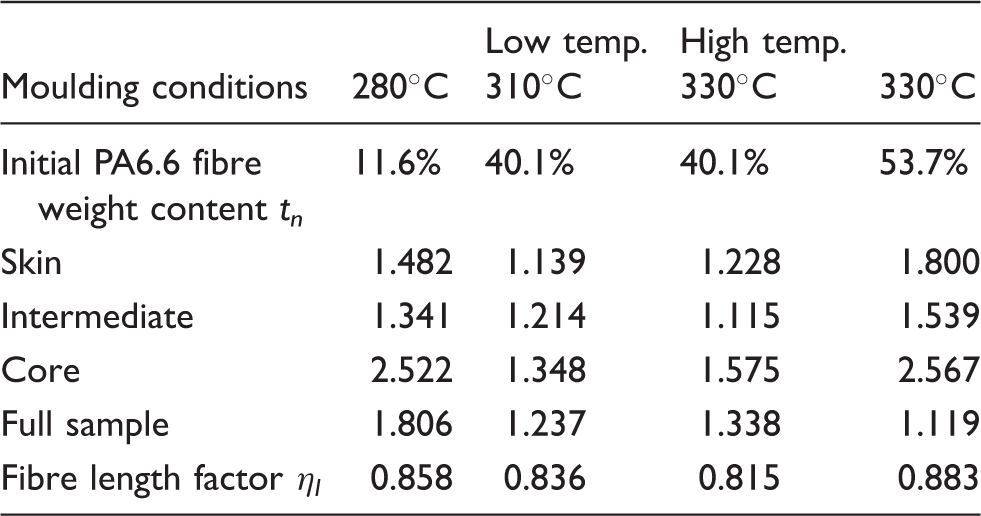
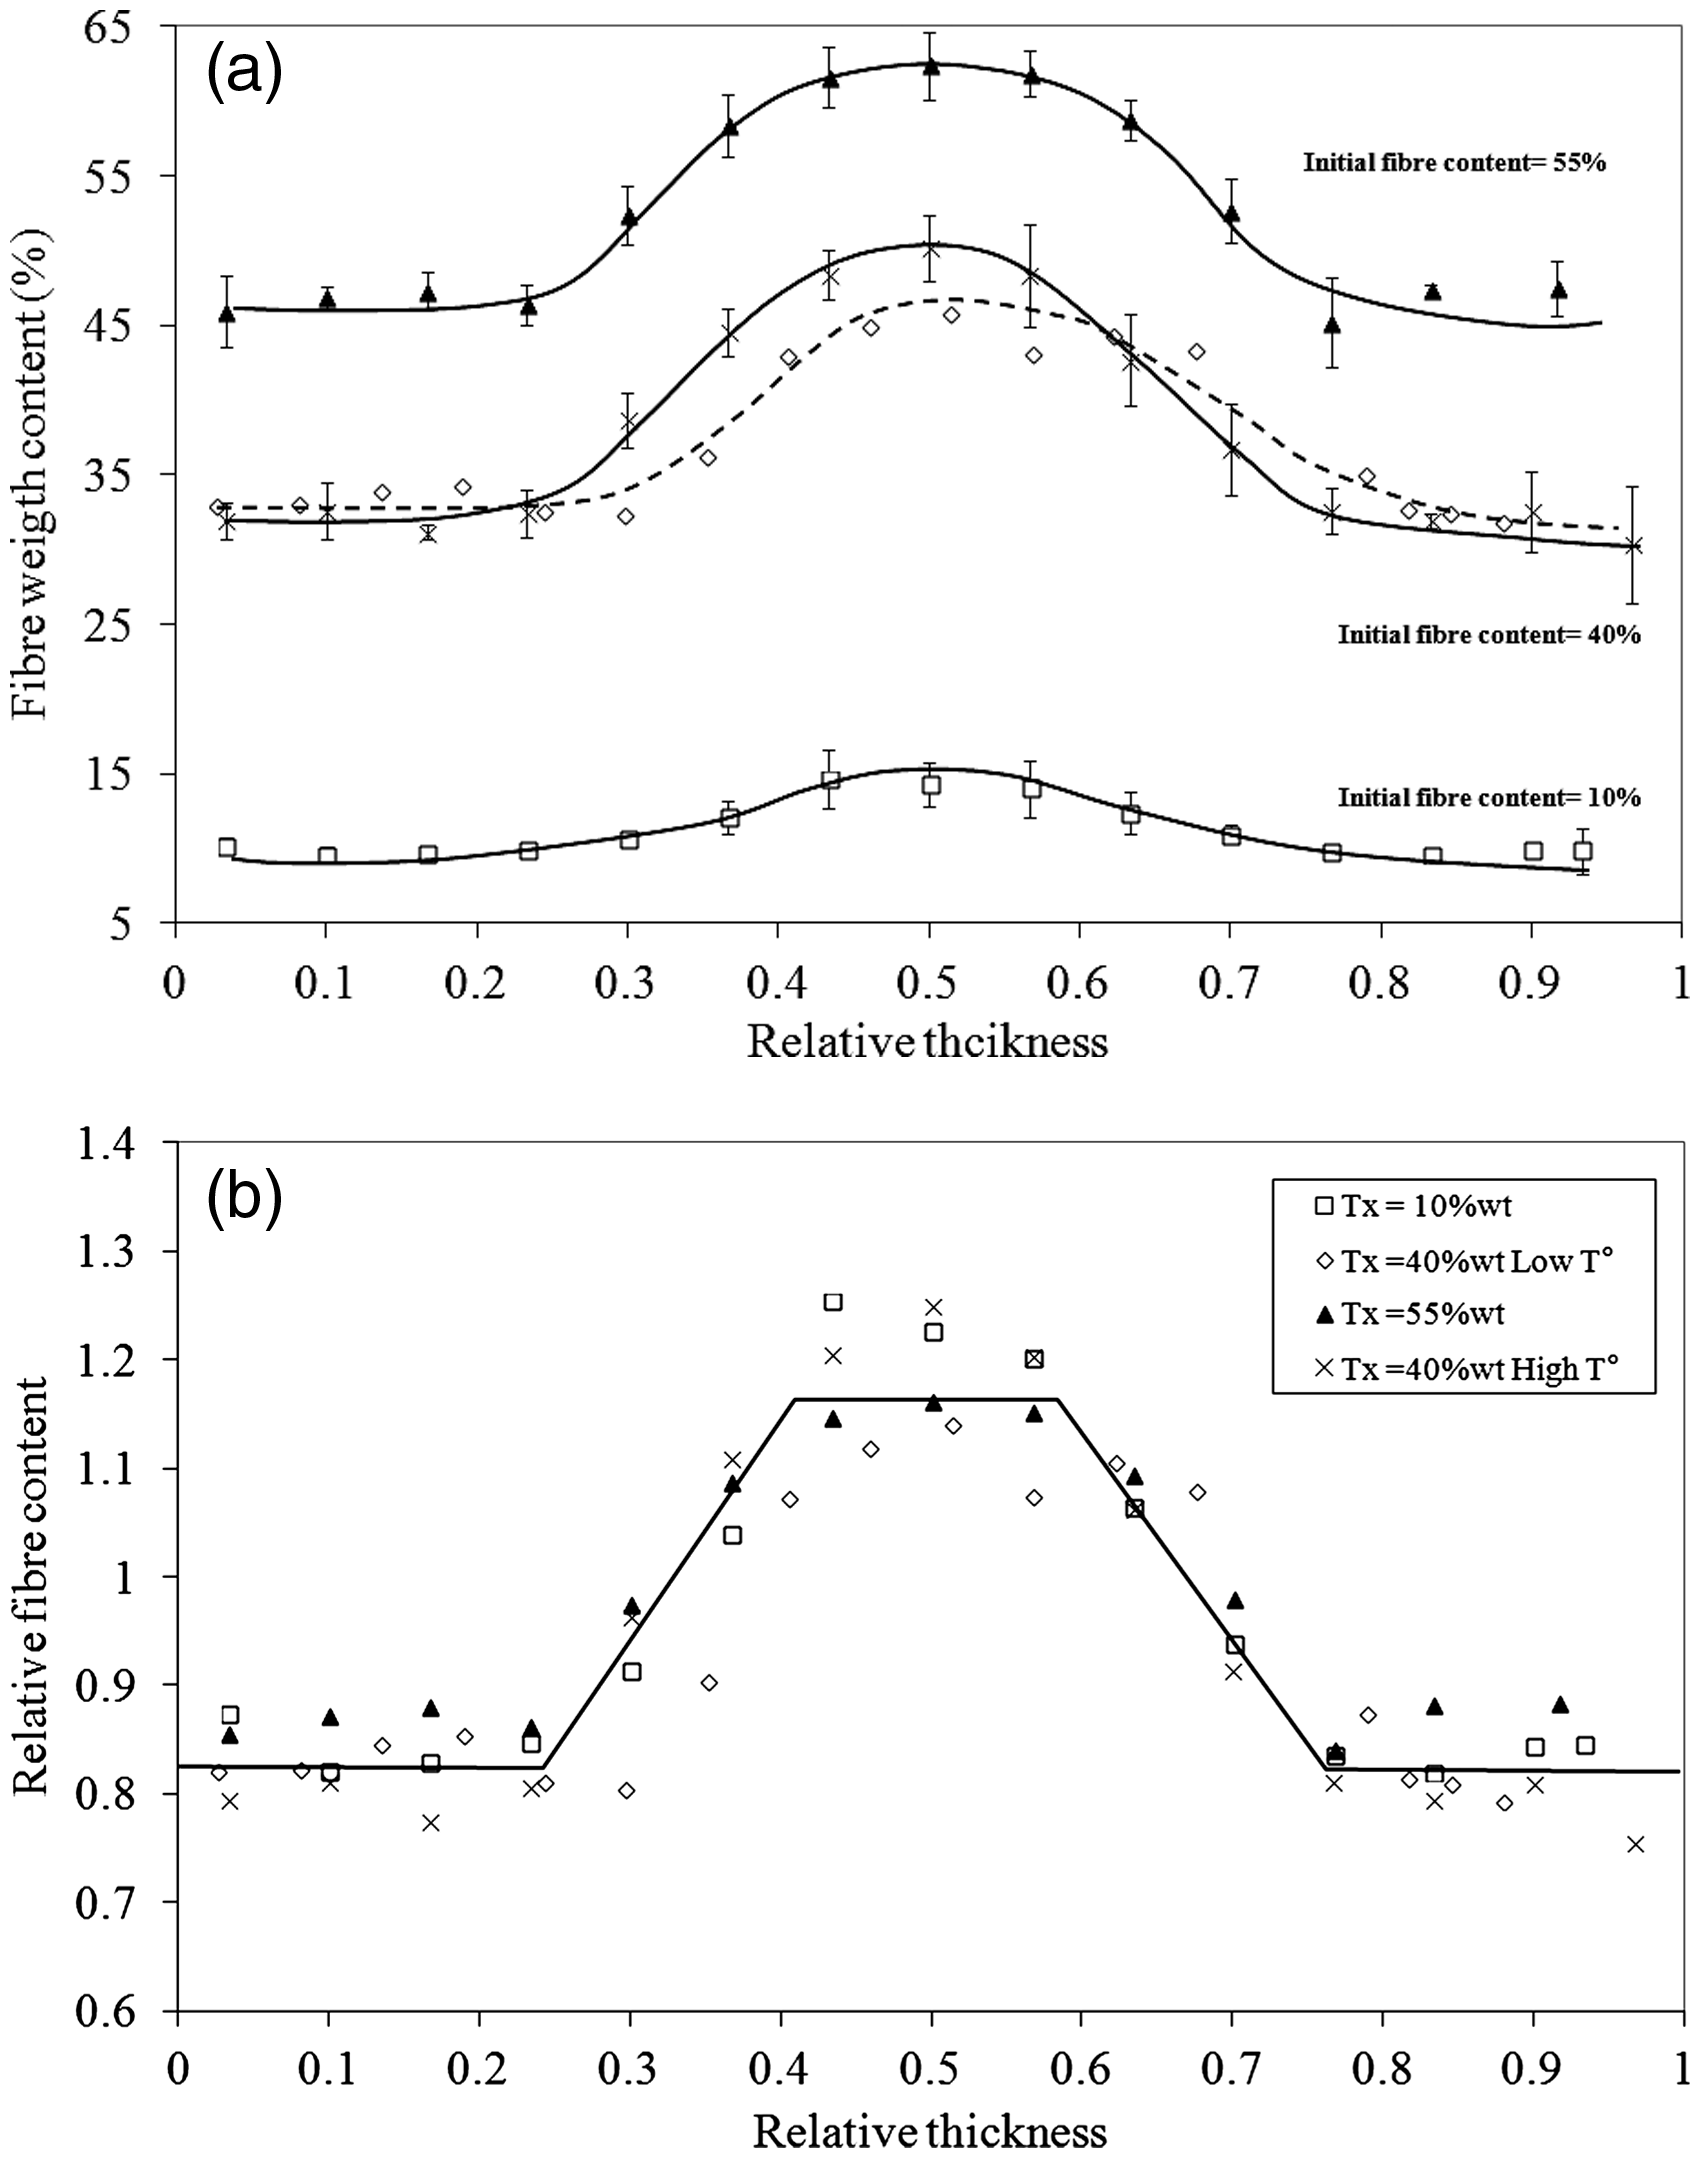
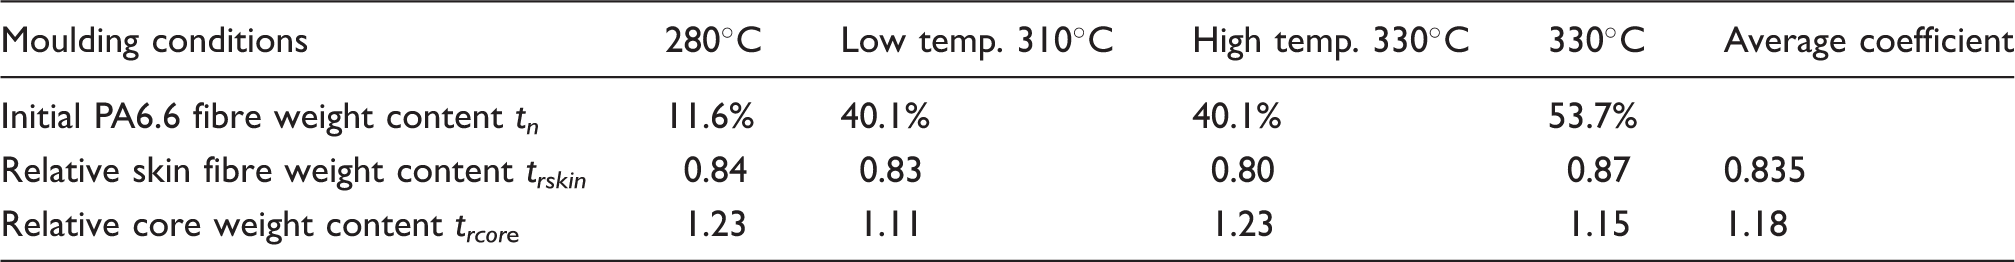
Whatever the fibre content in the polyamide 6-6 injected (10 wt% to 55 wt%) and the setting injection conditions, the fibre weight repartition through the composite thicknesses can be described according to the following representation (Figure 6):
‐ Two skin layers representing about 25% of the total thickness, the relative fibre weight content (trskin) being constant.
Fibre content profile through the part thickness: (a) influence of initial fibre weight, (b) data for the model calculation. One skin core layer of about 20% of the total thickness describing a constant relative fibre weight content (trcore). Two intermediate layers of about 15% thick each where the relative fibre weight content increases from the skin layer to the core layer fibre weight values. The average fibre weight content can be directly calculated from these two precedent values. Fibre weight descriptions of the composites for calculation.
The model structure for the fibre weight content through the thickness is then described with these three parameters as represented in Table 7.
Regarding the fibre orientation distribution, the respective thicknesses of the five oriented layers will be the same as that of the fibre weight content in so far as a good concordance exists between the orientation profiles and the fibre content profiles (Figure 7). Thus, the model will use a five-layer model symmetrically distributed compared with the symmetric plan of the part.
Fibre orientation profile through the part thickness: (a) in the flow direction (1), (b) in transverse direction (2).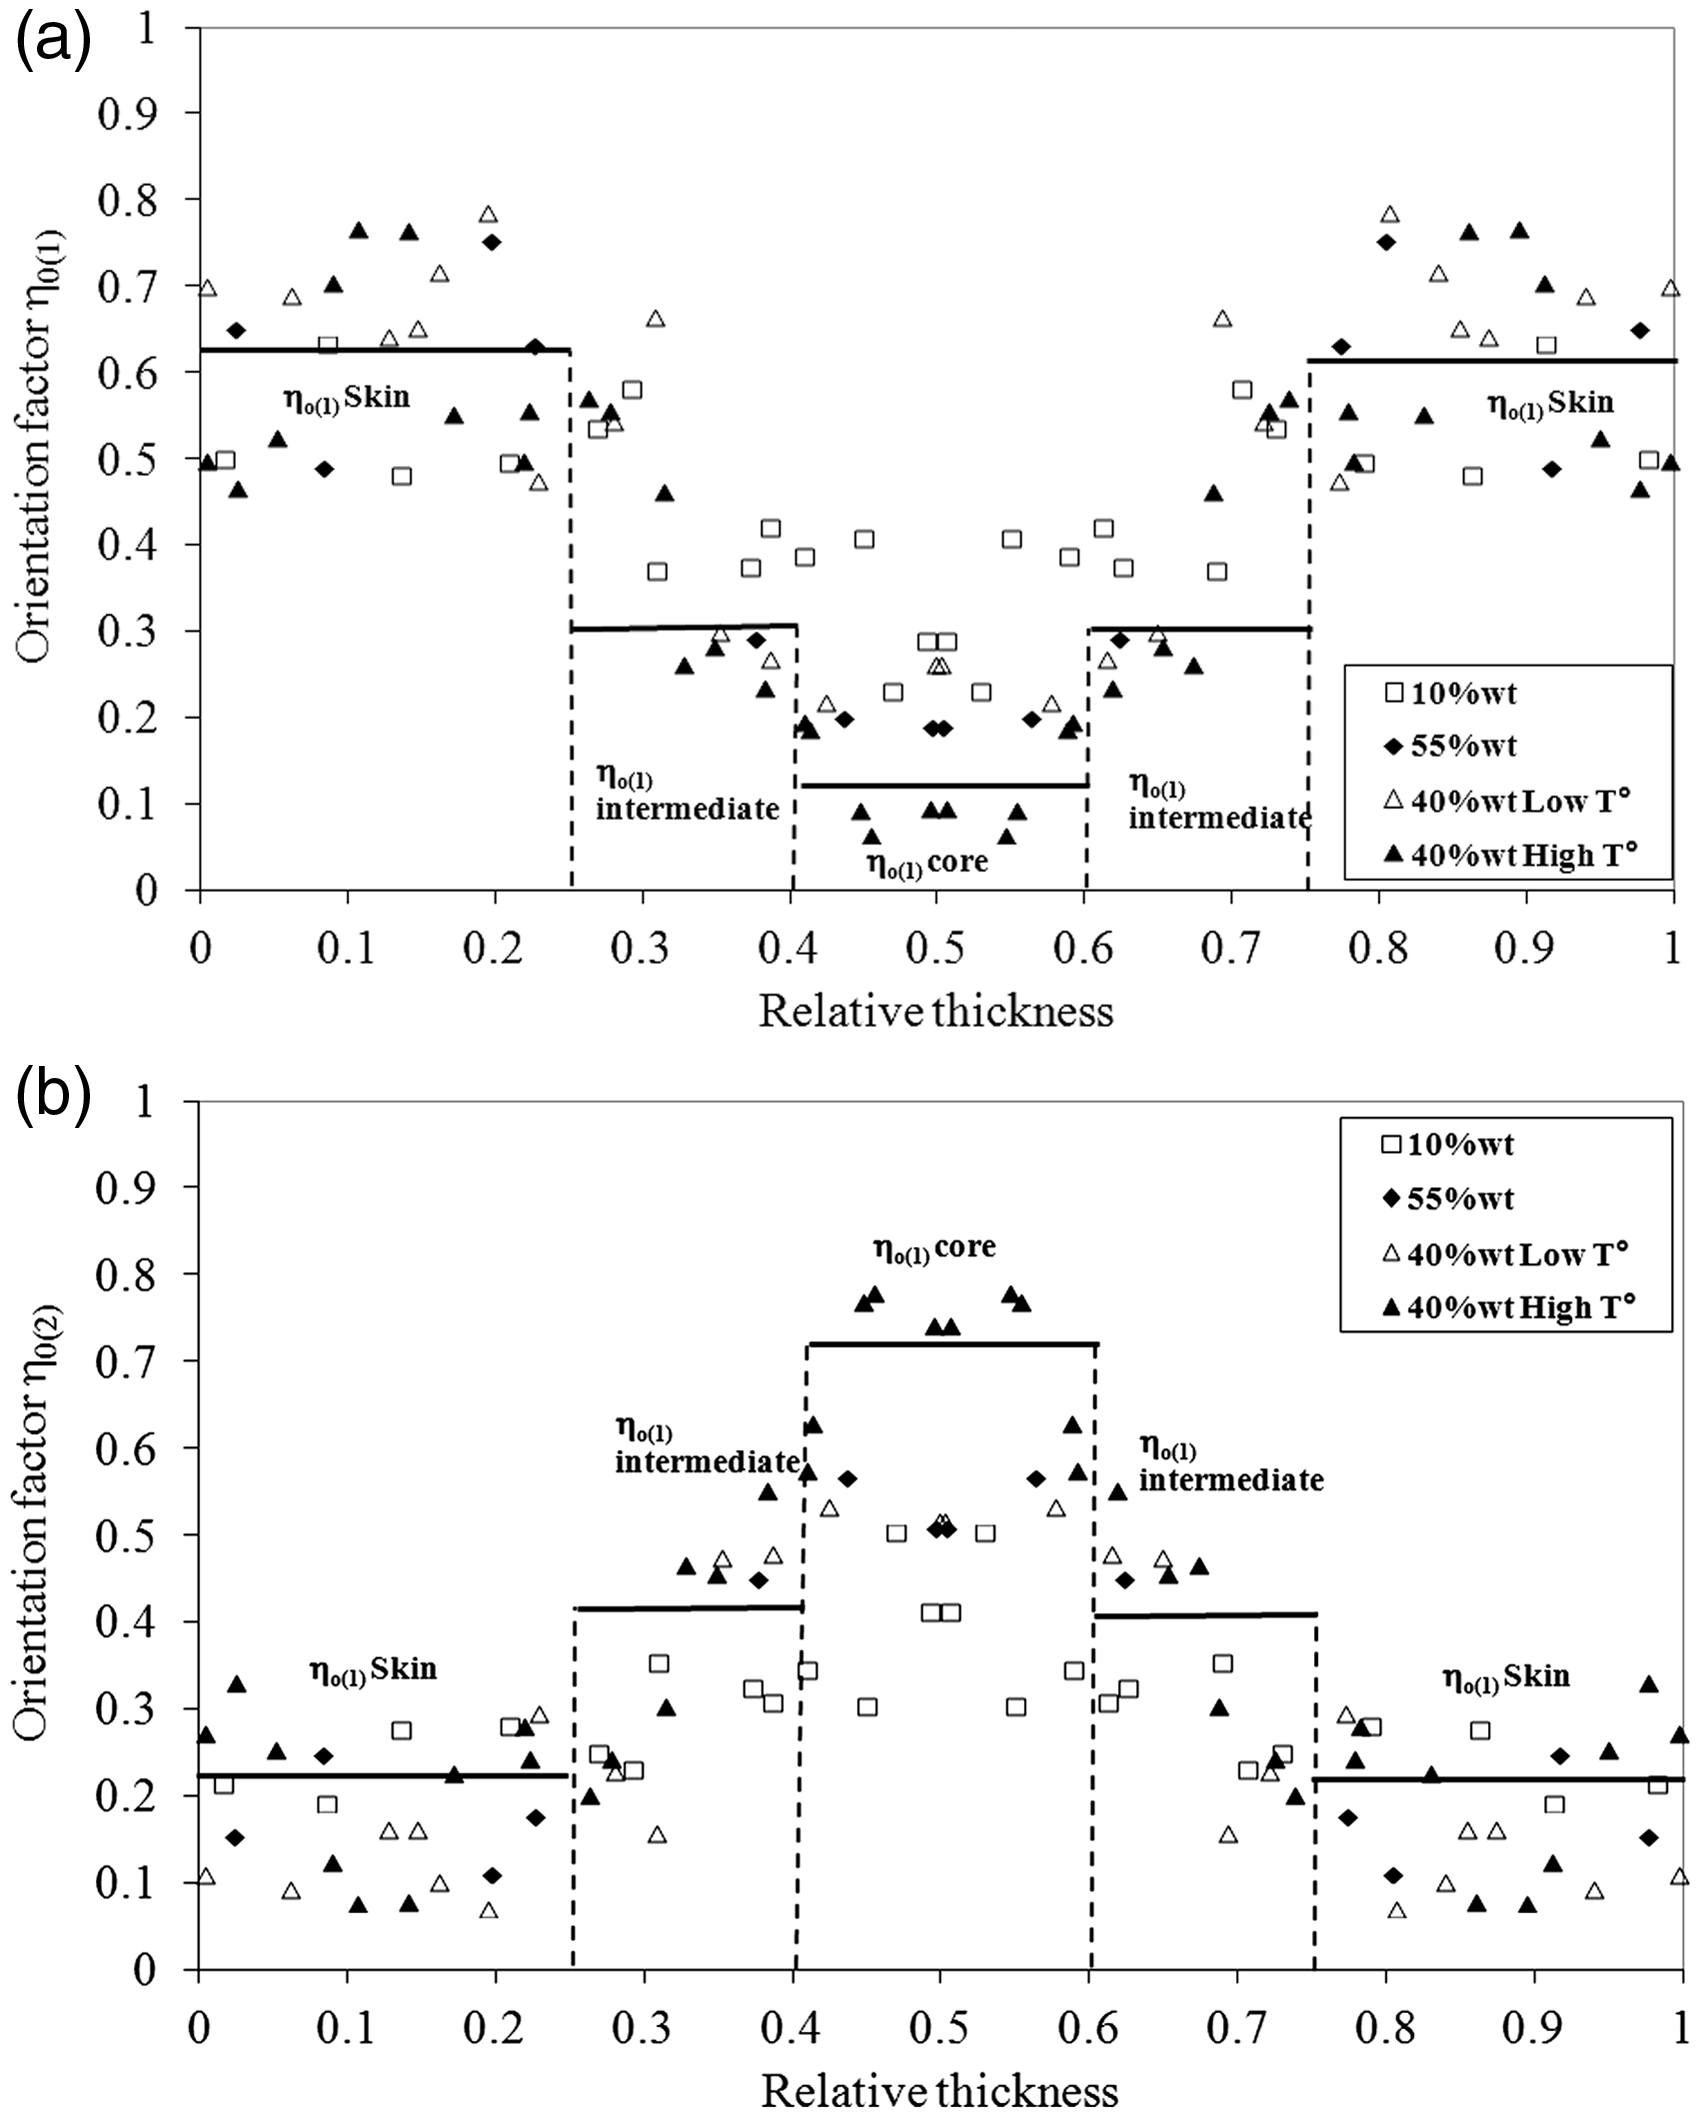
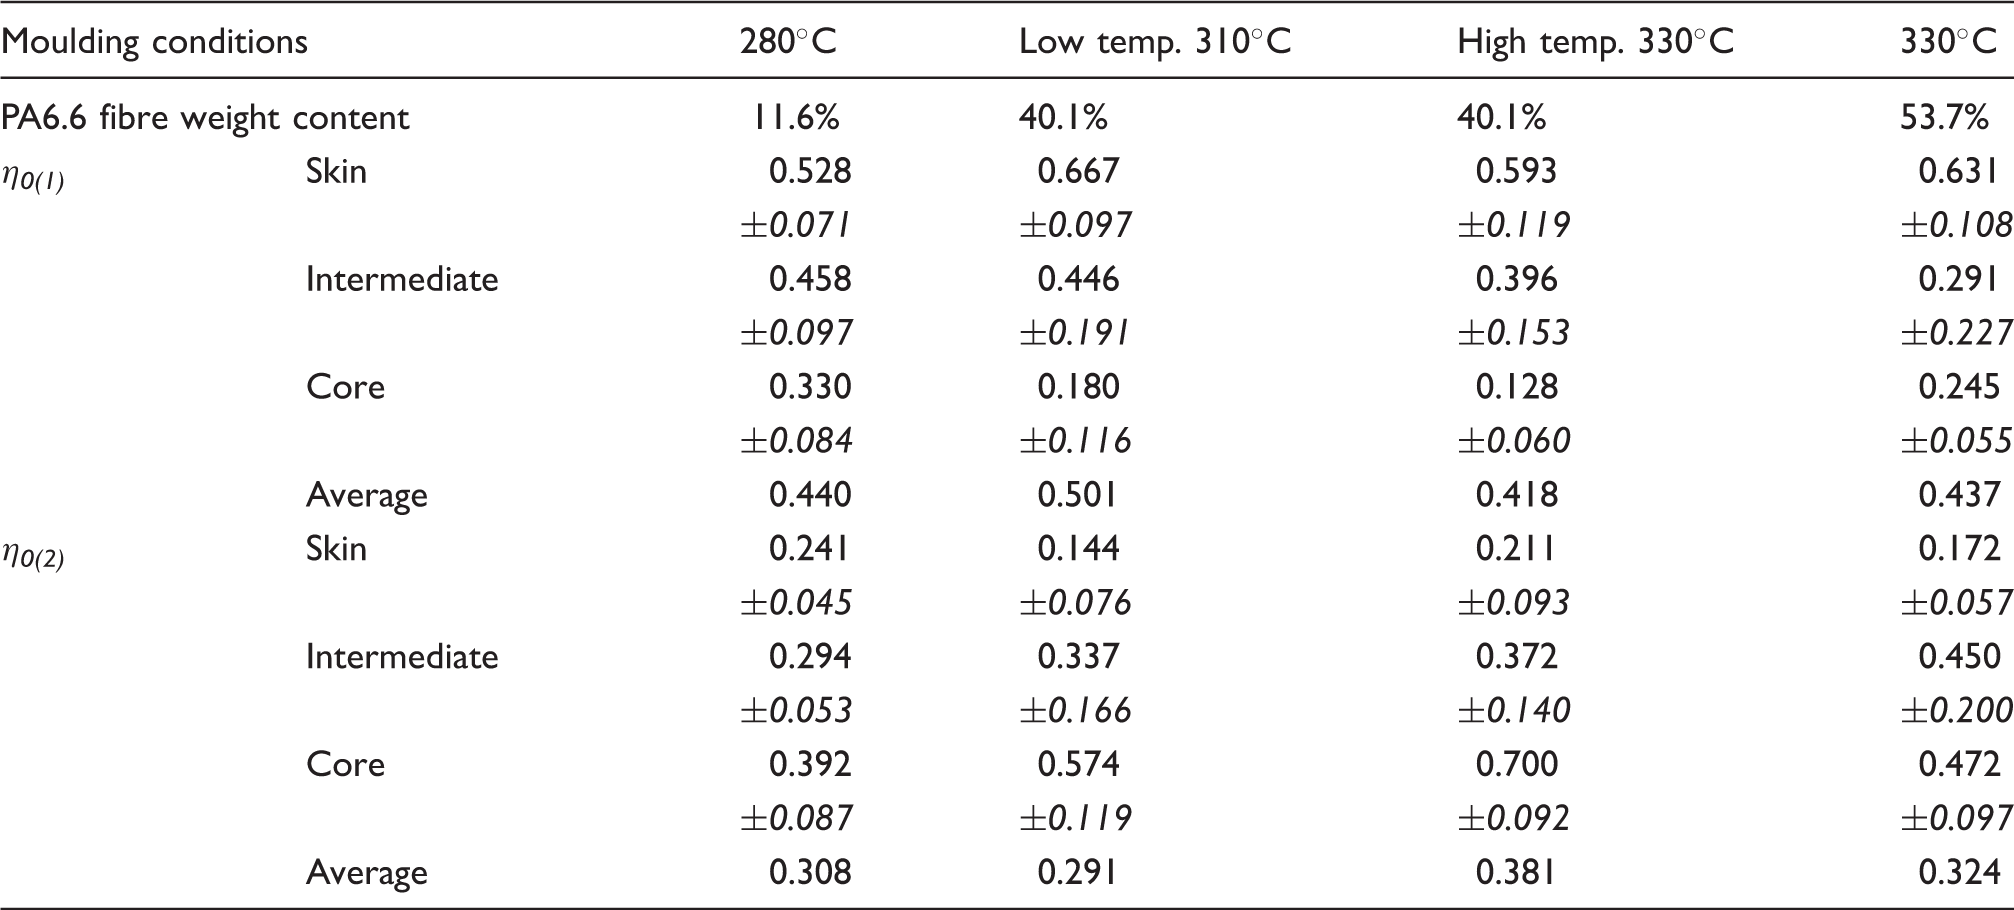
Fibre orientation descriptions of the composites for calculation.
The melt viscosity influences fibre orientation through the part thickness as presented in Figure 8. The increase in melt viscosity induces an increase of skin fibre orientation in the flow direction. In the part core, the viscosity dependence is limited. The knowledge of the pressure losses during the filling stage promotes the fibre orientation in the part, at least for a same family of polymers.
Influence of melt viscosity on the skin/core layer orientations in the flow direction.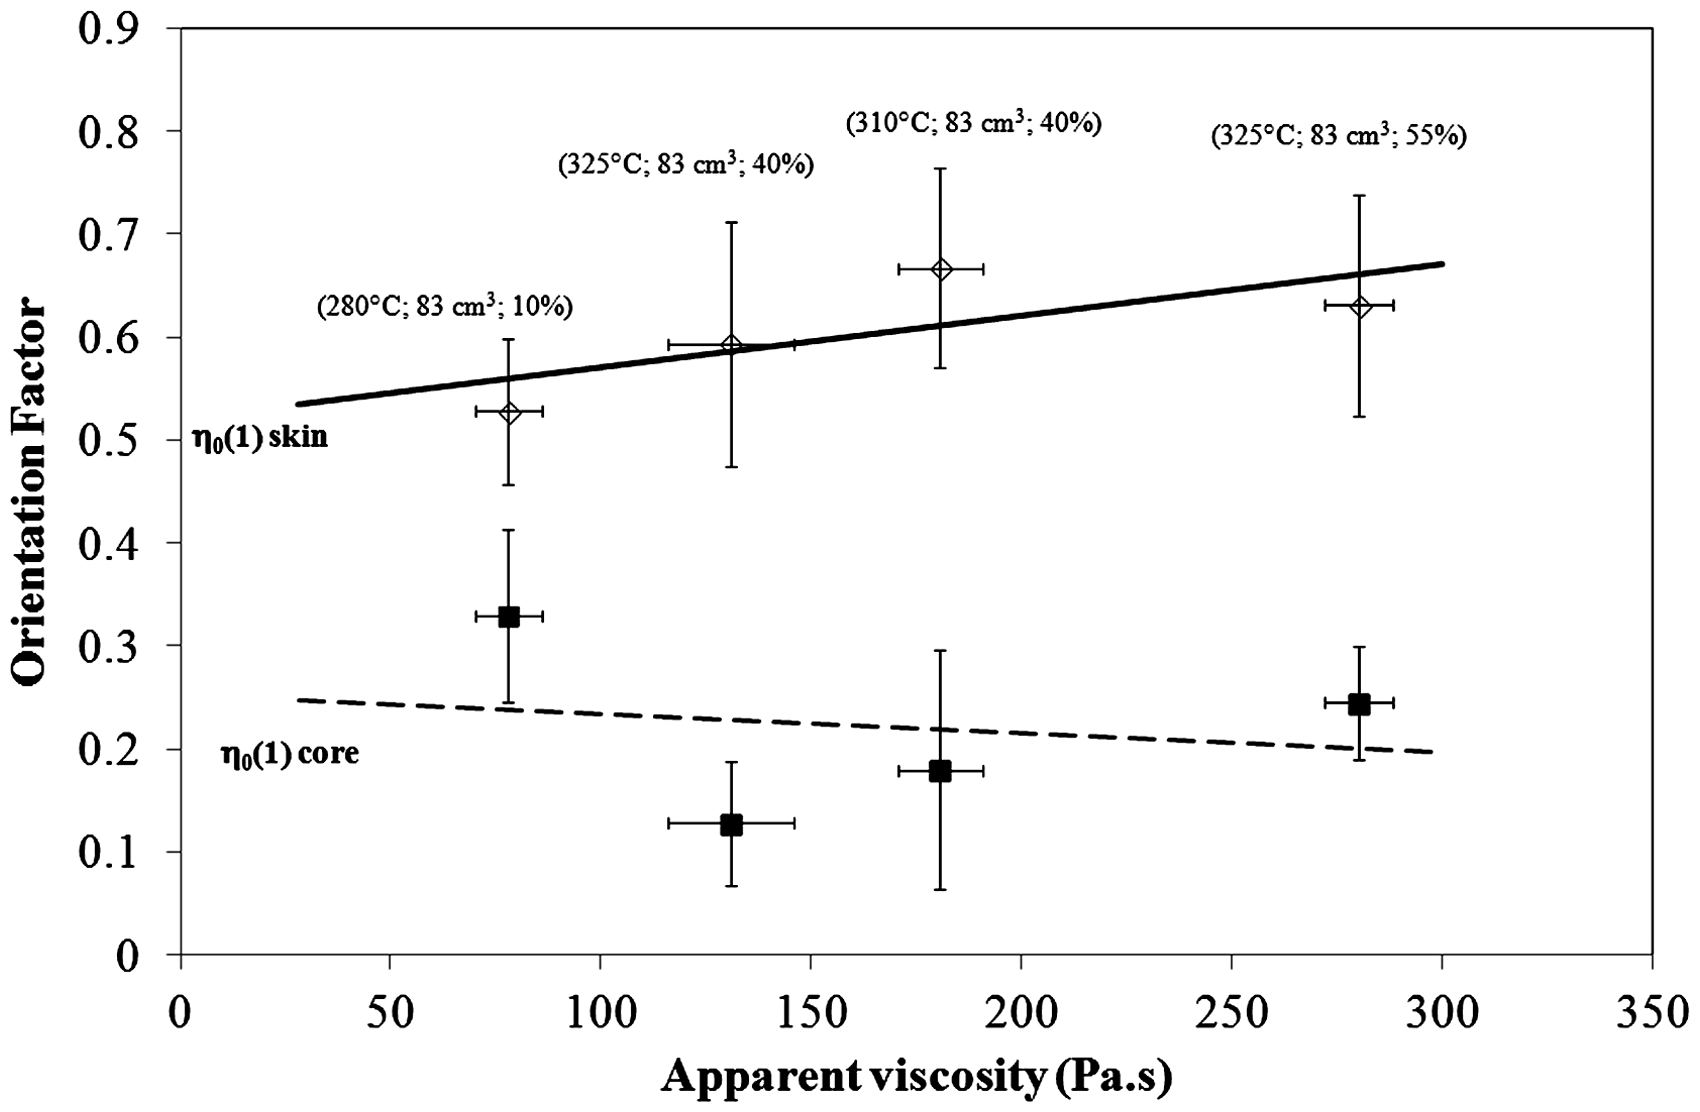
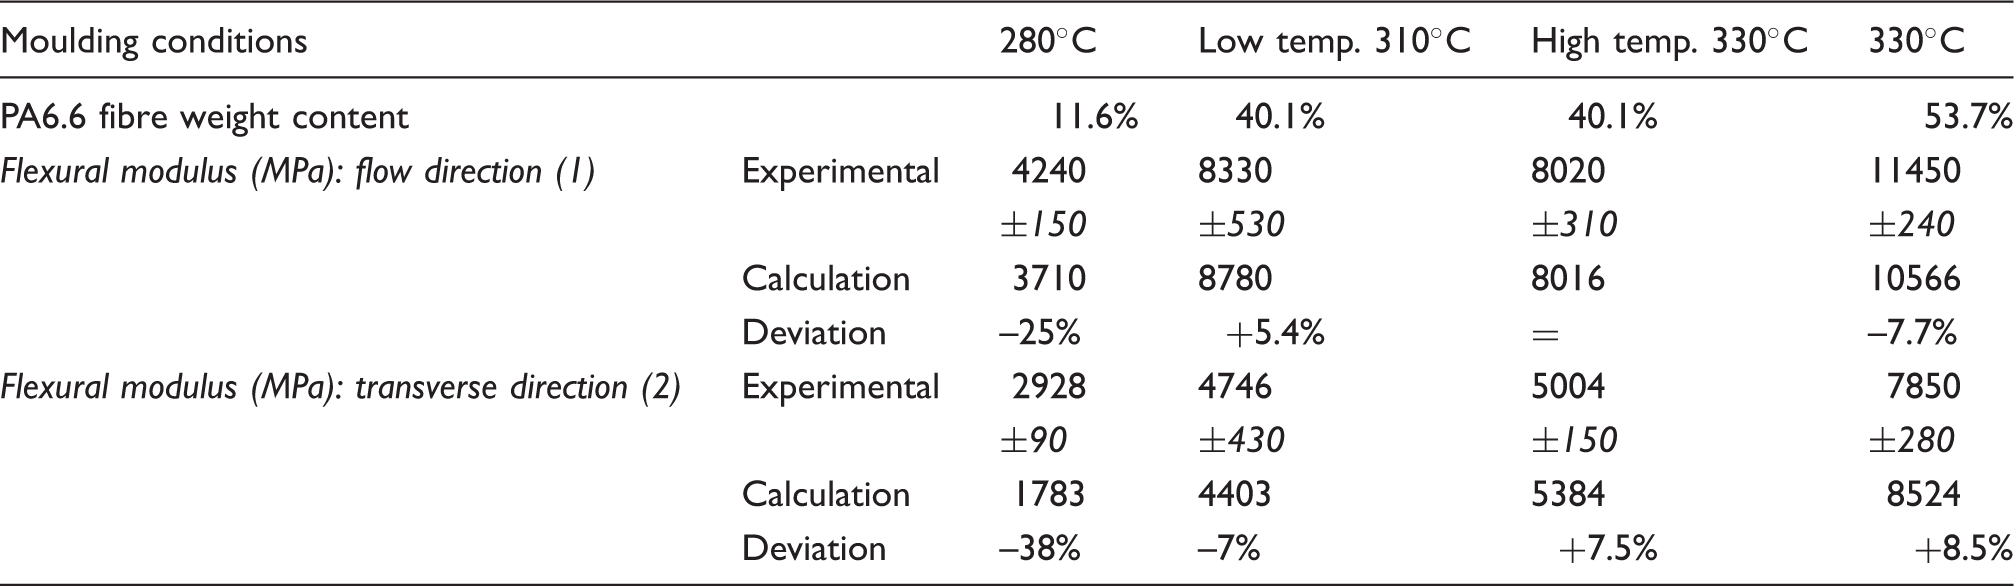
Experimental/calculation comparison of the PA66 flexural modulus composites.
Regarding the comparison with conventional methods of calculation such as laminated plate theory
30
or the Elshelby-Mori Tanaka micromechanical model,31–33 the analytical microstructural model developed here offers the advantage to give a good evaluation of the composite modulus with a limited number of layers, at least in the case of not complex part shape. The laminated plate theory considering a largest number of layers (43 oriented layers), consequently a better definition of the microstructure, gives the most precise evaluation of the rigidity of the system (Figure 9). Finally, The Eshelby-Mori Tanaka model, taking into consideration both fibre orientation and fibre aspect ratio, tends to overestimate the flexural moduli (Figure 9) probably due to the high average fibre aspect ratio measured in the composites that increases the fibre/matrix interactions (Table 6). A modulus over evaluation of more than 10% was moreover already noticed for fibre shape ratio superior to 50.22,34,35
Calculated flexural modulus in the flow direction, versus the fibre weight fraction: comparison with experimental data.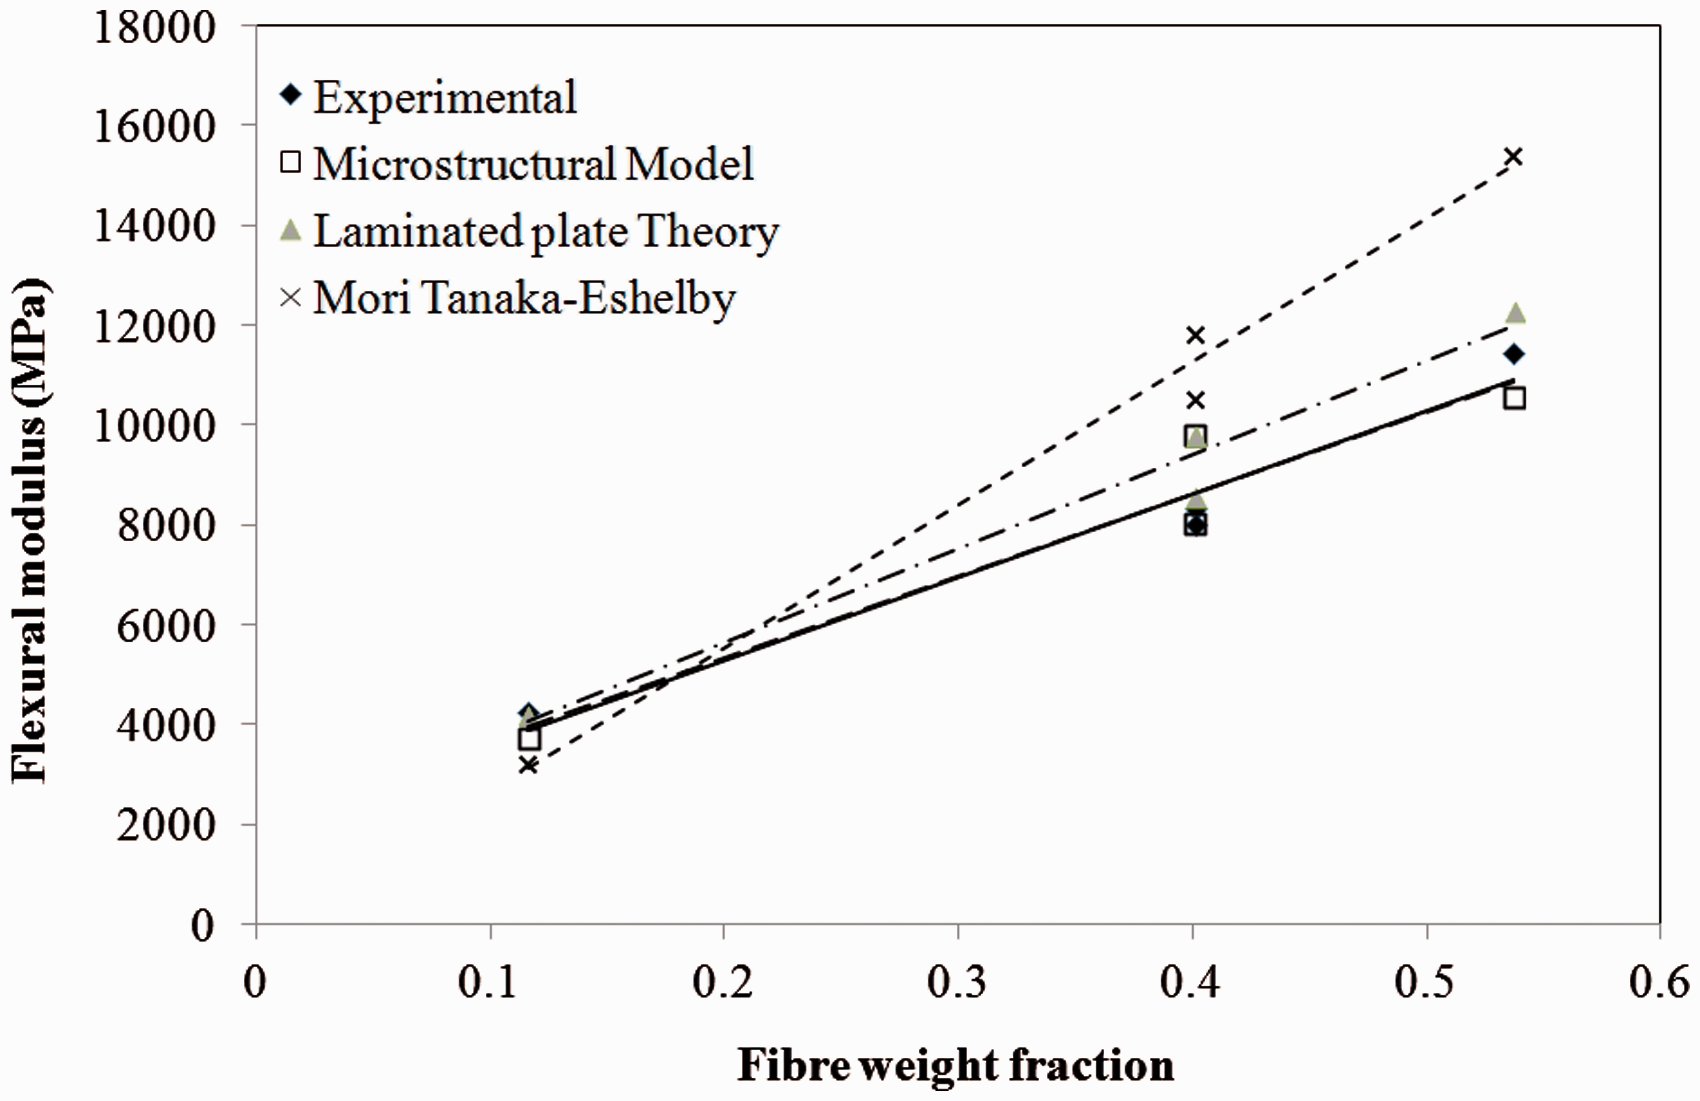
Flexural strength prediction
The strength prediction is more complicated to appreciate than Young’s modulus. The strength determination is generally achieved on the basis of laminate theory where the composite is considered as a multilayer unidirectional assembly as well as the Elshelby or Mori-Tanaka models developed from the microstructure knowledge of the composite (constituent properties, shape ratio, orientation and location) and applied in the FEM. In the case of slipping fibre/matrix load transfer for tensile strength, the microstructural Kelly Tyson’s model is commonly used to predict the stress at break.
18
This model distinguishes three main contributions, the subcritical and supercritical fibre length contributions and the matrix contribution (equation 9)
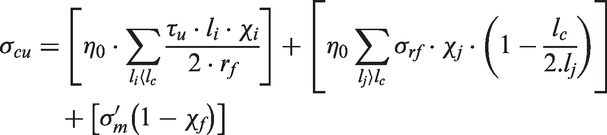
σcu is the ultimate composite stress (stress at break)
li and lj are the subcritical and the supercritical fibre length to the critical fibre length lc
χi and χj are the volume faction of li and lj fibre lengths
σ′m – stress supported in the matrix at composite failure strain (σ′m = Em*ɛc)
ɛc – strain at composite failure
The fibre strength supported by the fibre at the moment of composite failure (σrf) has been experimentally determined by Thomason giving a value of 1700 MPa ± 250 for a glass fibre reinforced PA66 composite. 12
Experimental/calculation comparison of the PA66 flexural strength composites.
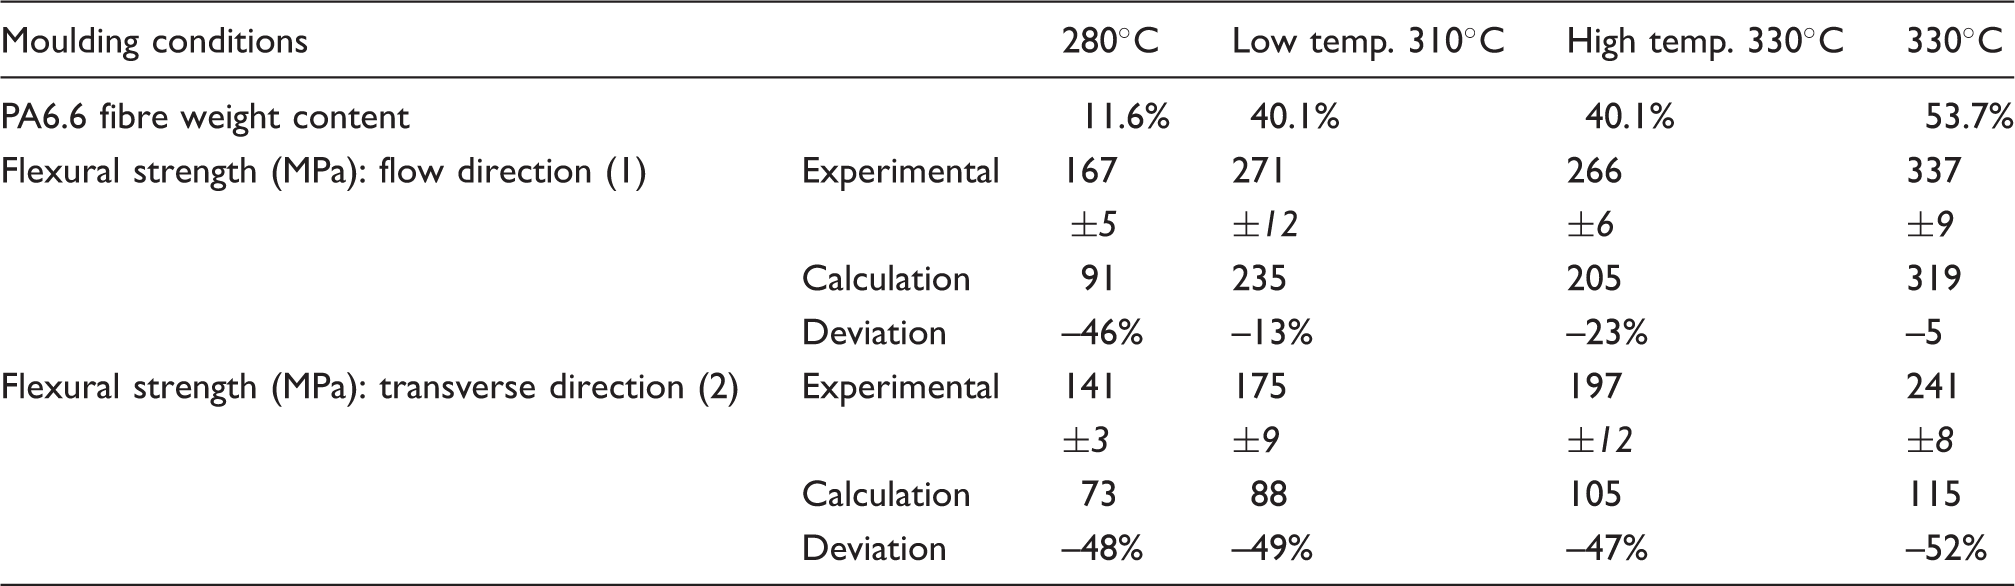
The flexural strength calculation underestimates systematically the experimental values all the more that the sample has a plastic behaviour (low fibre content, transverse direction) in that case, a strength ratio (Tensile strength/Estimated flexural strength) of 2 is obtained corroborating the literature value. 28
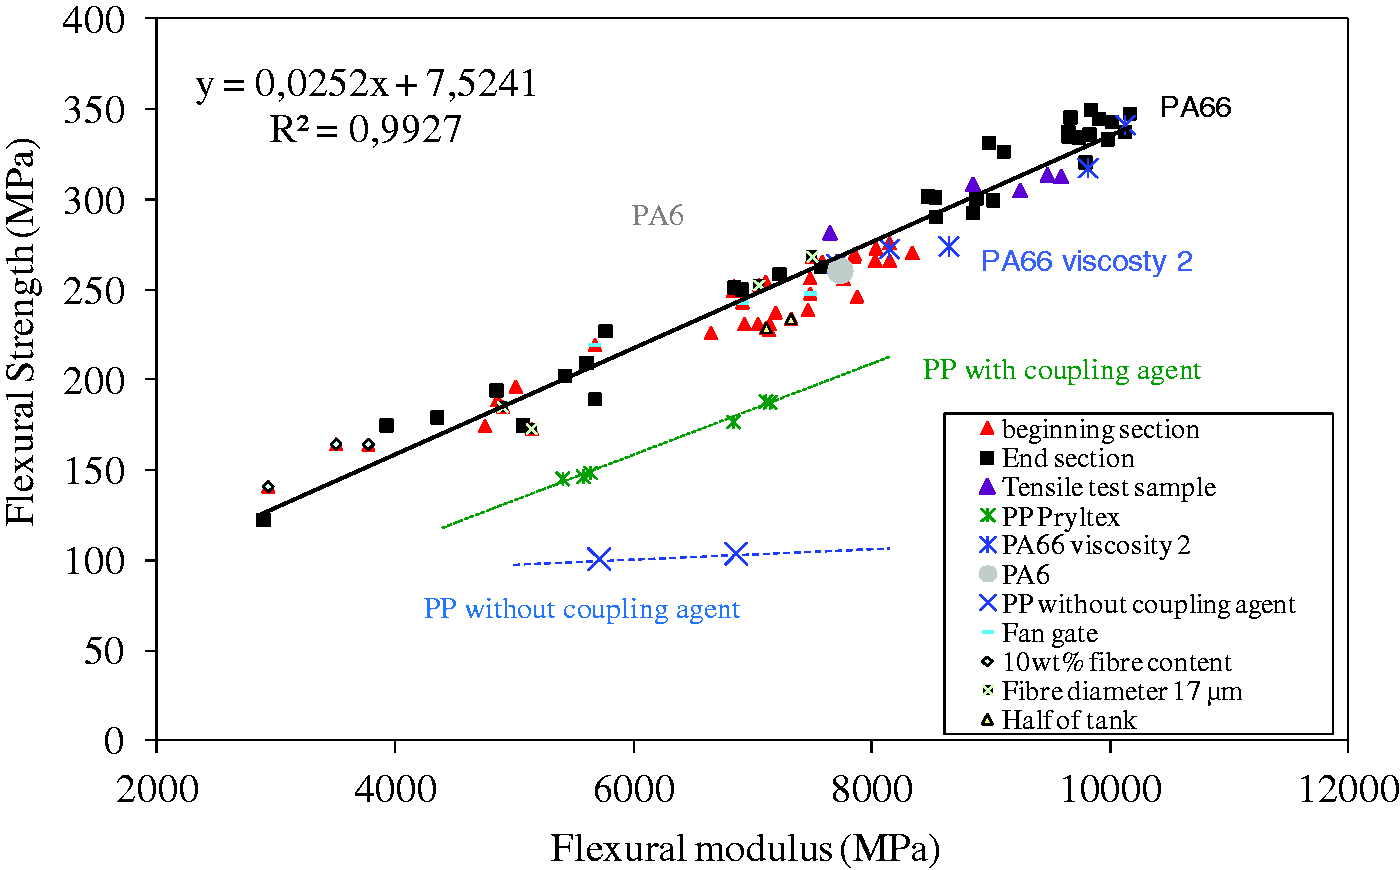
On the basis of this model, linear correlations are then possible to be established between flexural modulus and flexural strength whatever the configuration is: mould design (gate location or gate size), part design (rectangular plate, tensile test sample or industrial part (half of tank presented in Figure 10)), LFT definition (initial fibre content (10 wt% to 55 wt%), initial fibre length (450 µm to 12 mm, fibre diameter (12 µm to 17 µm)), processing conditions (melt and mould temperature, volumetric flow rate) or mechanical testing location (Beginning section or end section) (Figure 11). This correlation is linked to the nature of the matrix as presented in Figure 12.
Industrial part (half of tank) (a) and orientation factor comparison with the rectangular plate (b). Flexural modulus/flexural strength correlation: influence of part and gate geometries, fibre shape ratio and fibre diameter (LGF 10 wt%; LGF 40 wt%; LGF 55 wt% and SGF 40 wt%). Flexural modulus/flexural strength correlation: influence of the matrix nature.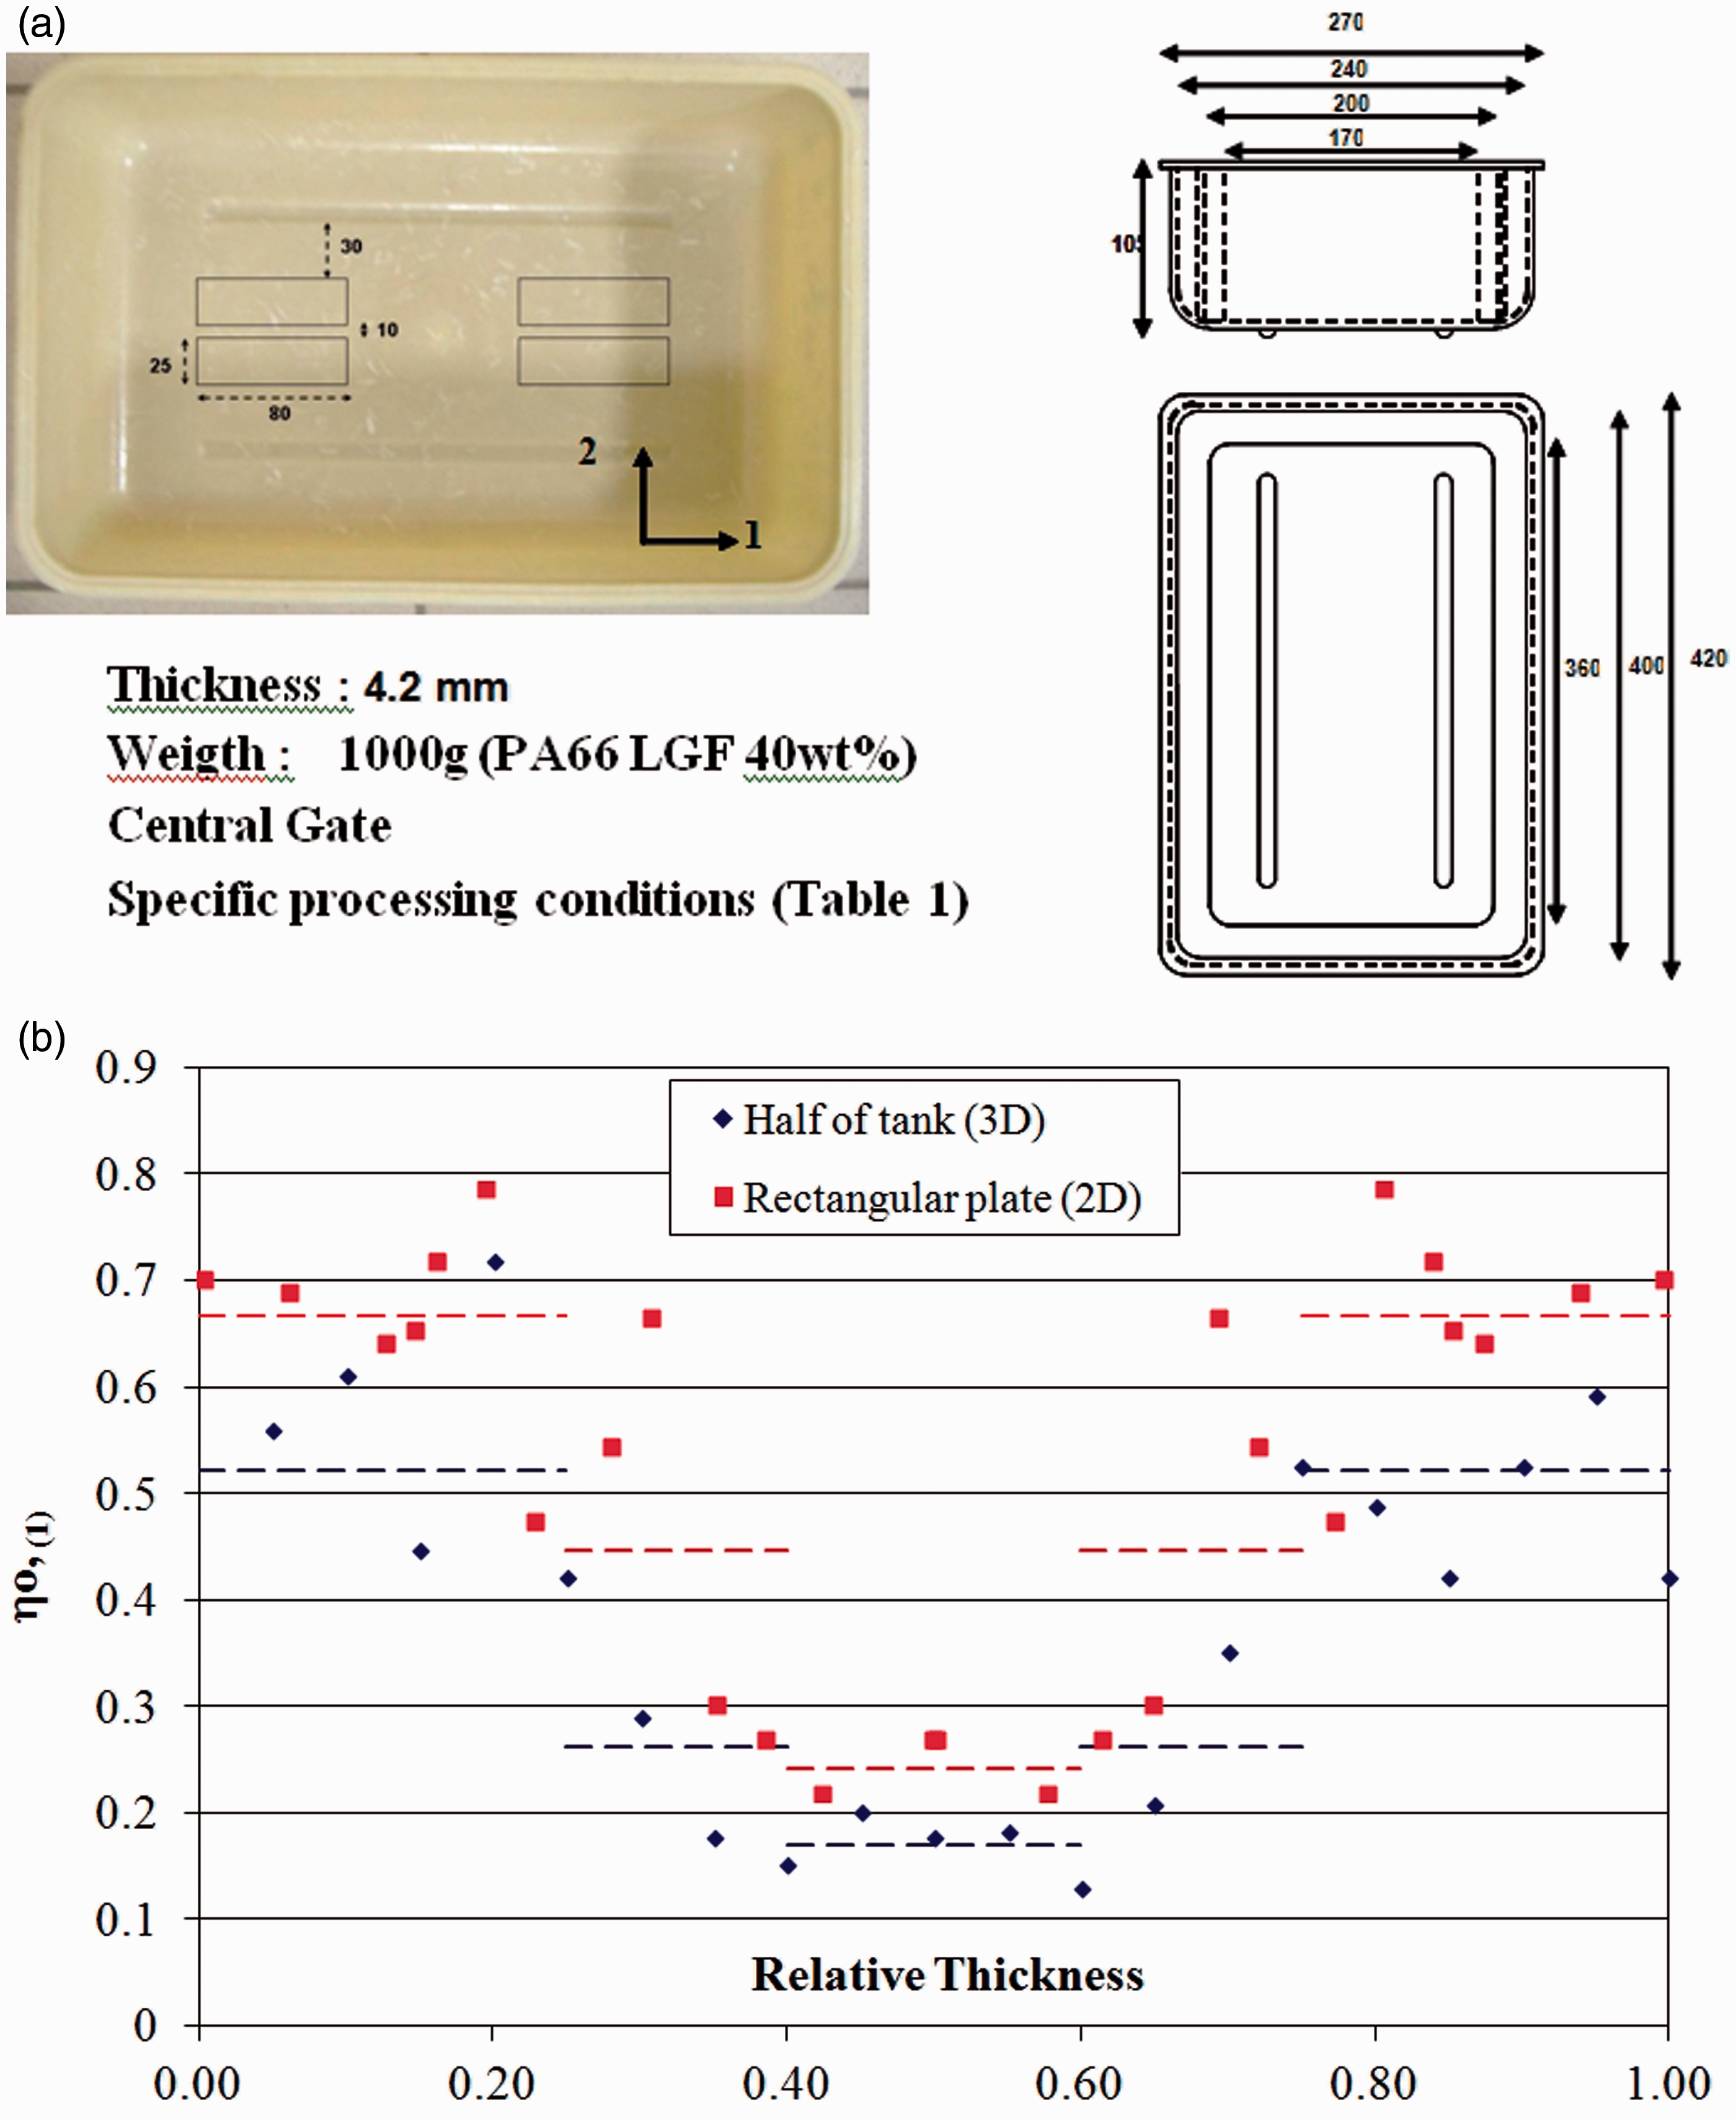
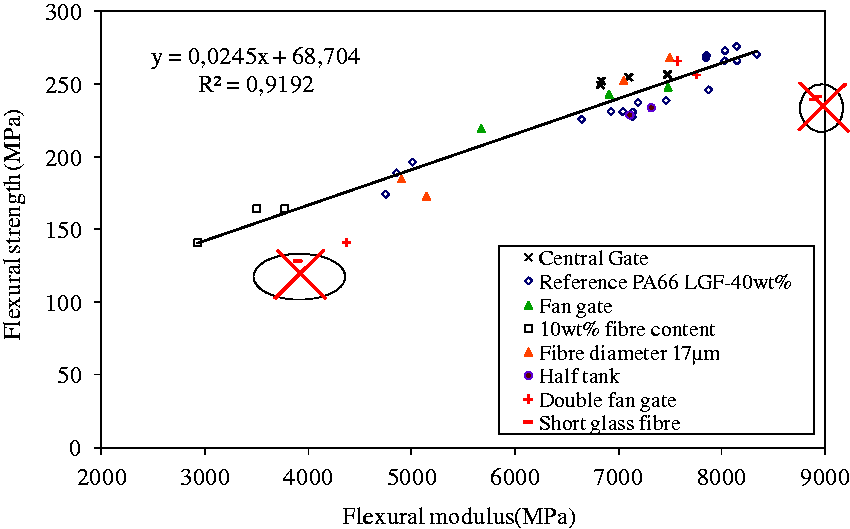
The only cases of short glass fibre PA66 and double fan gate go away from the line of correlation (Figure 11). These two particular cases show a decrease in flexural strength due to numerous fibres under the subcritical length in the first case and the presence of weld line in the second case. Thus, with the calculation of the modulus (equation 7) and limited quantity of mechanical tests on standard samples, the flexural strength becomes possible to be evaluated; the calculated values can be of use for the creep models for instance.
Conclusion
The injection moulding of LGF PA66 composites were characterized in terms of fibre content distribution and fibre orientation through the part thickness. The relative fibre rate profiles through the part thickness present a similar distribution whatever the initial fibre content is. Thus, a structural model of fibre weight distribution through the part thickness is described from the initial fibre content of the LGF PA66, the relative fibre rate in the skin, the relative fibre rate in the core and the constant skin layer and core layer thicknesses (respectively, 25% and 15% of the total part thickness). The fibre orientation profiles have been then represented in five main layers of constant thickness whatever the initial fibre content or moulding conditions is:
Two skin oriented layers 25% thick each One core layer 20% thick Two intermediate layers 15% thick each
The correspondent orientation factors of each layers was able to be connected to the apparent viscosity measured directly during the filling stage of the injection process from two pressure sensors placed in the cavity. Within a framework of the LGF PA66 injection process the estimation of the orientation state of the part then becomes possible.
The analytical models obtained from the injection moulding conditions varying within a determined moulding window lead to a good experimental/calculation correlation, but these models remain limited to a part geometry and mould design. Furthermore, they do not take into account the material parameters (local fibre content, residual fibre length or fibre orientations) and thus the local moduli of the composite.
The structural models are based on a five layer description of the part thickness for the local fibre content and the fibre orientation. This orientation profile can be moreover obtained from rheological melt behaviour of the composites. A very good experimental/calculation correlation is noticed as well for the flexural modulus as the flexural strength, whatever the process variability is (mould, material and processing conditions). The models have been validated with an industrial part (half of tank) moulded inside the same processing window that of the reference plate.
Finally, a linear correlation between the flexural modulus and the flexural strength appears depending on the nature of the matrix (PA66, PA6, PP) whatever the processing conditions, the mould design (gate size or gate position) or glass reinforcement characteristics (fibre length, fibre diameter, fibre content or the presence of coupling agent).
Footnotes
Acknowledgments
The authors gratefully acknowledge the support and contribution of CISIT (International Campus on Safety and Intermodality in Transportation), the Nord-Pas-de-Calais Region and the European Community (FEDER, European Funds for Regional Development) for funding of injection materials.
Declaration of Conflicting Interests
The author(s) declared no potential conflicts of interest with respect to the research, authorship, and/or publication of this article.
Funding
The author(s) received no financial support for the research, authorship, and/or publication of this article.