
Abstract
The mechanical properties of Kevlar® 29 single filaments and yarns with different gage lengths were investigated by utilizing an MTI miniature tester and an MTS load frame. Single yarns of 25 mm were also tested over four different strain rates using a drop-weight impact system. The experimental results showed that the mechanical properties of Kevlar® 29 are sensitive to gage length, structural size scale, and strain rate. The tensile strength decreased with increasing gage length and the structural scale from fiber to yarn, and increased with increasing strain rate. Weibull analysis was conducted to quantify the degree of variability in tensile strength. The obtained Weibull parameters were then used in an analytical model to simulate the stress–strain response of single yarn. Finally, Weibull parameters of single filaments with other gage lengths and strain rates were also obtained by fitting the stress–strain curves of single yarns with corresponding testing conditions.
Introduction
Kevlar fabrics are known for their high modulus, high strength, light weight, good chemical resistance, and thermal stability, which are widely used as bullet resistant vests, confinement chambers for jet engines, cut-resistant gloves, etc. These applications have created a demand for numerical modeling of fibers, yarns, and fabrics. Although the mechanical properties of single fibers under quasi-static loading are available, they cannot be directly extrapolated and scaled up for yarns and fabrics consisting of many fibers. Furthermore, the strain rate obtained in quasi-static experiments is several orders of magnitude lower than those observed in ballistic applications. 1
However, an understanding of the dynamic phenomena, parameter interaction, and their influence on the overall measurements are far from complete because of the immaturity in dynamic tensile tests, and also, a general agreement about the standards and methodology used to conduct dynamic tensile tests is still not well reached. 2 There are a number of experimental techniques to obtain high strain rate material properties including split Hopkinson pressure bar, falling weight devices, flywheel facilities, hydraulic machine, etc.3–7 However, the relevant techniques to generate tensile stress–strain data at the medium strain rates in the range of 1–200 s−1 are not well established. 2 Two types of equipments have been used to generate data in this strain rate range: high-rate servo-hydraulic testing machines2,8 and drop-weight impact machines.6,9 The utilization of drop-weight impact machines in medium strain rate tensile testing was reported for a variety of materials including textile, 10 concrete,11–13 steel,14–16 alloys, 17 and composite materials,18–22, while there are little data on the dynamic behaviors of aramid filaments and single yarns in this strain-rate range.
Experimental studies of aramid filaments and yarns have been conducted by several authors. Wagner et al.
23
investigated the variability in the mechanical strength of single aramid filaments and found that the distributions for linear density show significant scatter and contribute to the failure loads varying considerably in positive correlation, meanwhile the variability for the fibers sampled across a yarn is greater than that sampled along a single filament. They also found that the tenacity for fibers sampled across a yarn shows less variability and obeys Weibull distribution better than the strength does. Zohdi and Steigmann
24
addressed the effect of filament misalignment on the failure behavior of filament bundle and macroscopic fabric due to its multi-scale structure. Cisneros et al.
25
studied the intrinsic stress–strain behavior and the cross-section mechanical properties of single Kevlar® 29 filaments using quasi-static loading tensile tests and nano-indentation. The samples have linear stress–strain curves and high strength and modulus with considerable scatter and severe splitting of the structure in fracture morphology. Meanwhile, the elastic modulus obtained from radial direction is homogeneous but four times lower than that from longitudinal direction. Yue et al.
26
conducted single-fiber tests to evaluate the mechanical properties of Kevlar® 29 fibers subjected to heat aging treatment at temperature ranging from 100℃ to 300℃ under both atmosphere and vacuum environments. Results indicated that the tensile strengths and failure strains of fibers decrease with increasing treatment temperature. Wang and Xia
27
carried out the tensile experiments on Kevlar® 49 fiber bundles to investigate the combined effect of strain rates (140, 440, 1350 s−1) and temperatures (−60, −20, 15, 50, and 90℃) on the mechanical behaviors. Result showed that the increasing temperature leads to decline of initial elastic modulus and increase of failure strain while the increasing strain rate contributes to increase of initial elastic modulus and failure strain. Hill and Okoroafor
28
performed the mechanical load measurements and more precise acoustic emission to investigate the failure of fiber bundles of glass, carbon, and Kevlar in the lubricated and unlubricated states. Result indicated that the tensile strength and failure strain decrease due to the inter-fiber friction (while the Young’s modulus remains constant). Zhu et al.
29
investigated strain rate and gage length effects on tensile behavior of Kevlar
The primary objective of our research was to investigate the mechanical properties of Kevlar® 29 single filaments under quasi-static and single yarns under both quasi-static and dynamic tensile loadings. In the next section, the experimental procedures and results of single filament and single yarn specimens are presented. Test parameters were systematically varied, which include gage length, the directions of the yarn in a fabric, and loading rates. The third section discusses the results of Weibull statistical analysis on experimental results and uses an analytical model based on the Weibull strength failure distribution to predict the quasi-static and dynamic stress–strain response of single yarns.
Experimental program
Testing materials
A plain-woven Kevlar® 29 fabric was used in this study which had been manufactured using a plain-weave of 7 × 7 yarns (per linear centimeter), as shown in Figure 1(a). The yarns in the woven structure consist of hundreds of filaments as shown in Figure 1(b). The bulk density and linear density are 1.44 g/cm3 and 1.64 × 10⁻³ g/cm, respectively. The cross-sectional area of each yarn was calculated as 1.14 × 10⁻³ cm2 by dividing the linear density of the material by its bulk density.
31
(a) Woven structure and (b) optical microscopy image of Kevlar® 29.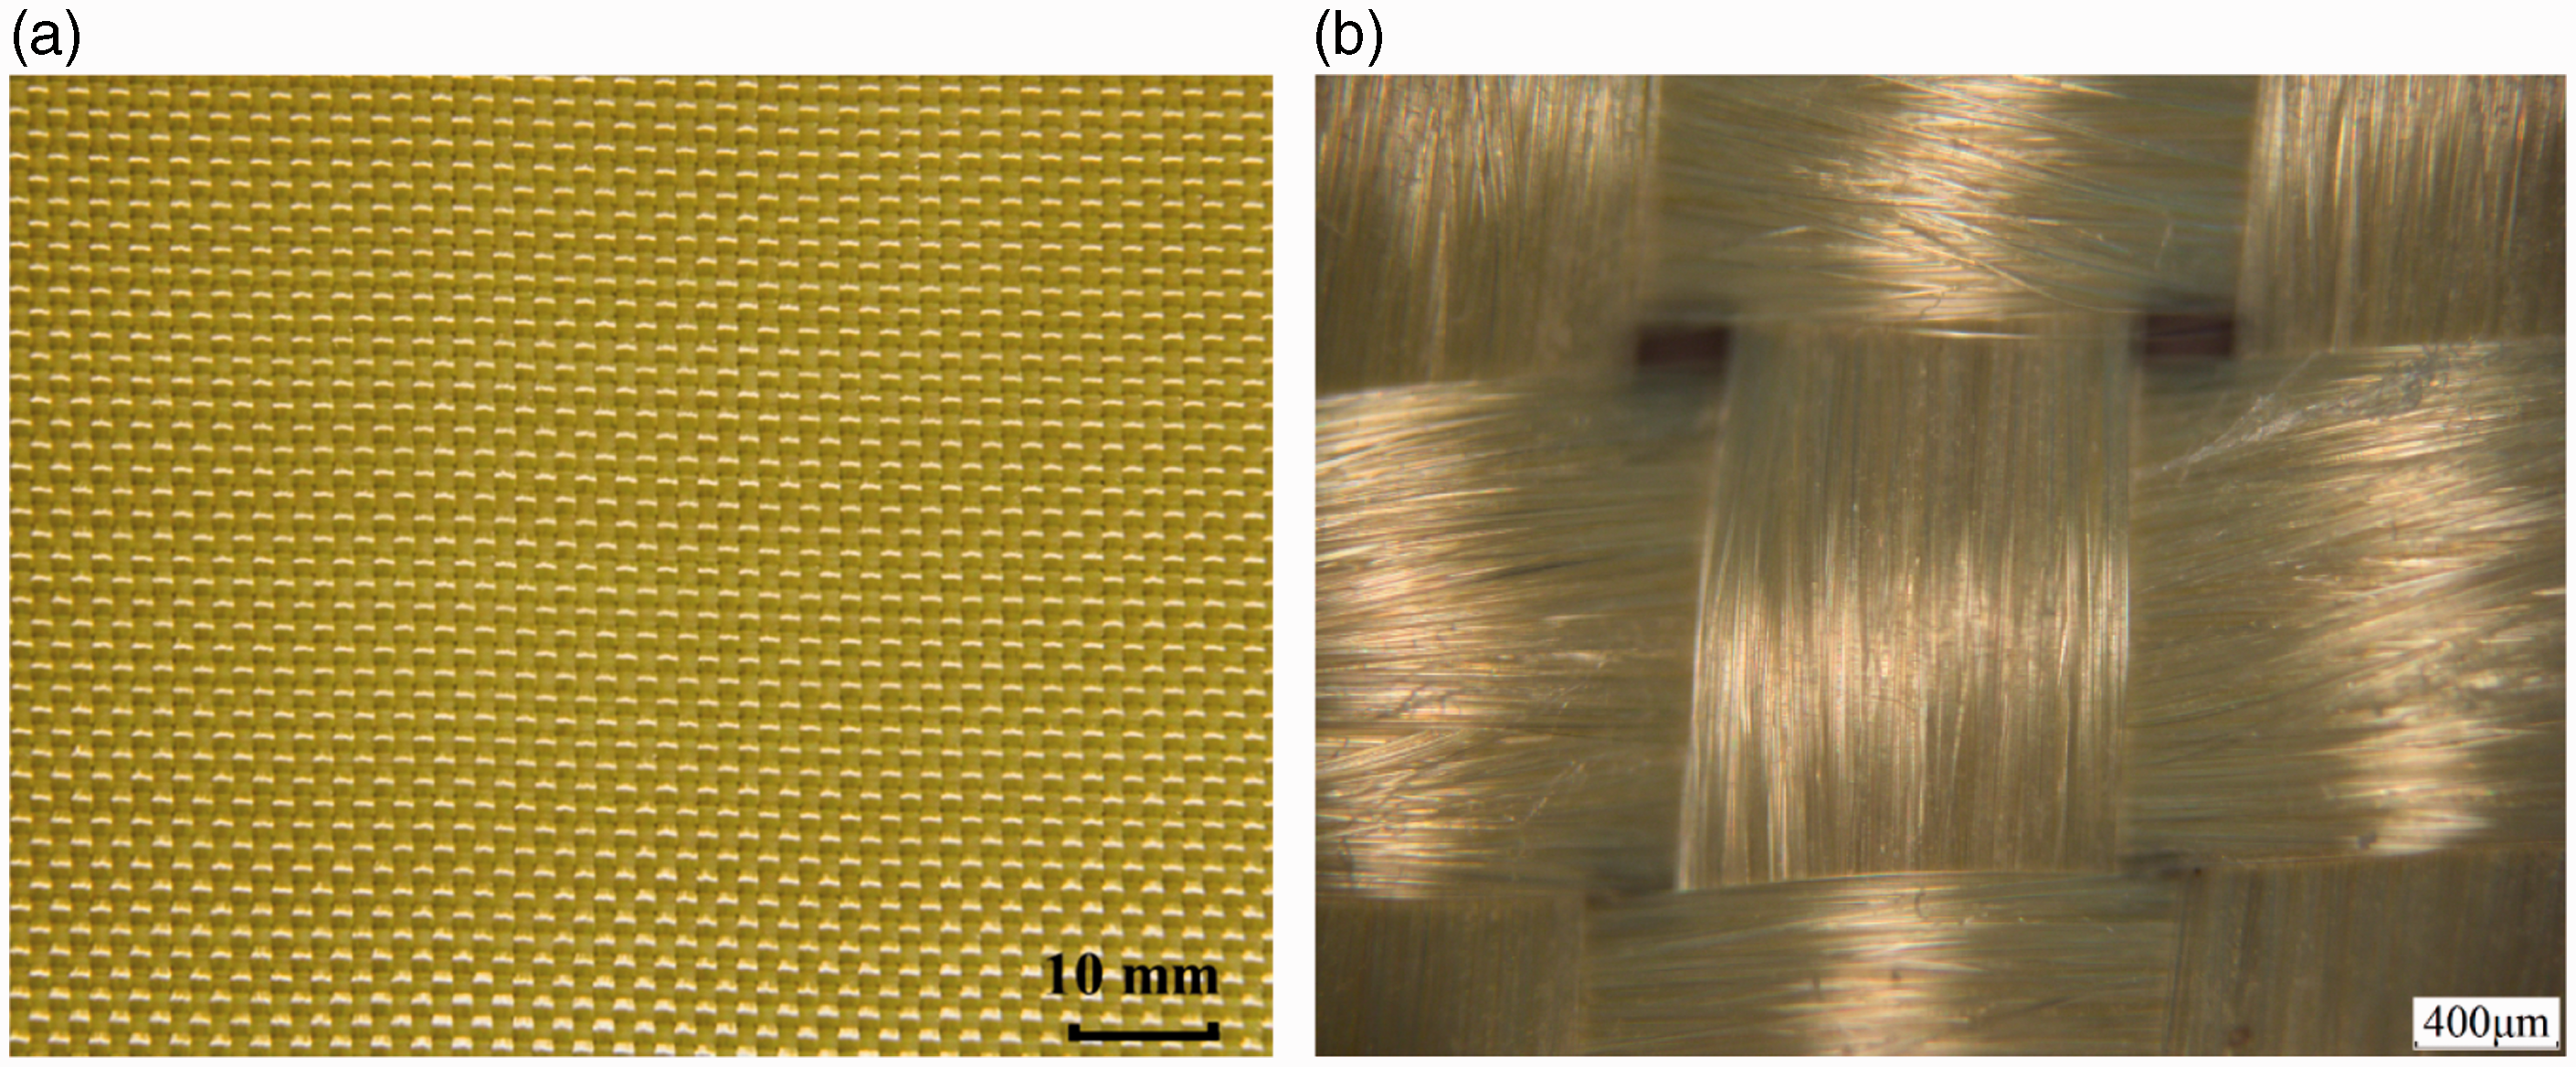
Preparation and testing method of single yarn
Individual yarns were extracted carefully from the woven fabric. Thin aluminum sheets were roughhewed by toothed steel plate before being glued at both ends of the single yarn specimen by using high-strength epoxy, in order to reduce stress concentration and to improve the load transfer mechanism between the specimen and steel wedges. When the epoxy was fully cured, the specimen was constructed by cutting the redundant yarns at both sides using electric scissor as shown in Figure 2(a). The test specimens were placed between steel wedges with serrated surfaces to prevent any slippage. Specimens with a variety of gage lengths (25, 50, 100, 150, 200, and 300 mm) were prefabricated for quasi-static tensile testing. Ten samples were tested for each gage length. Another set of specimens with 25 mm gage length were used for dynamic tensile testing.
(a) Single yarn specimen, (b) MTS load frame, and (c) Instron drop-weight impact system.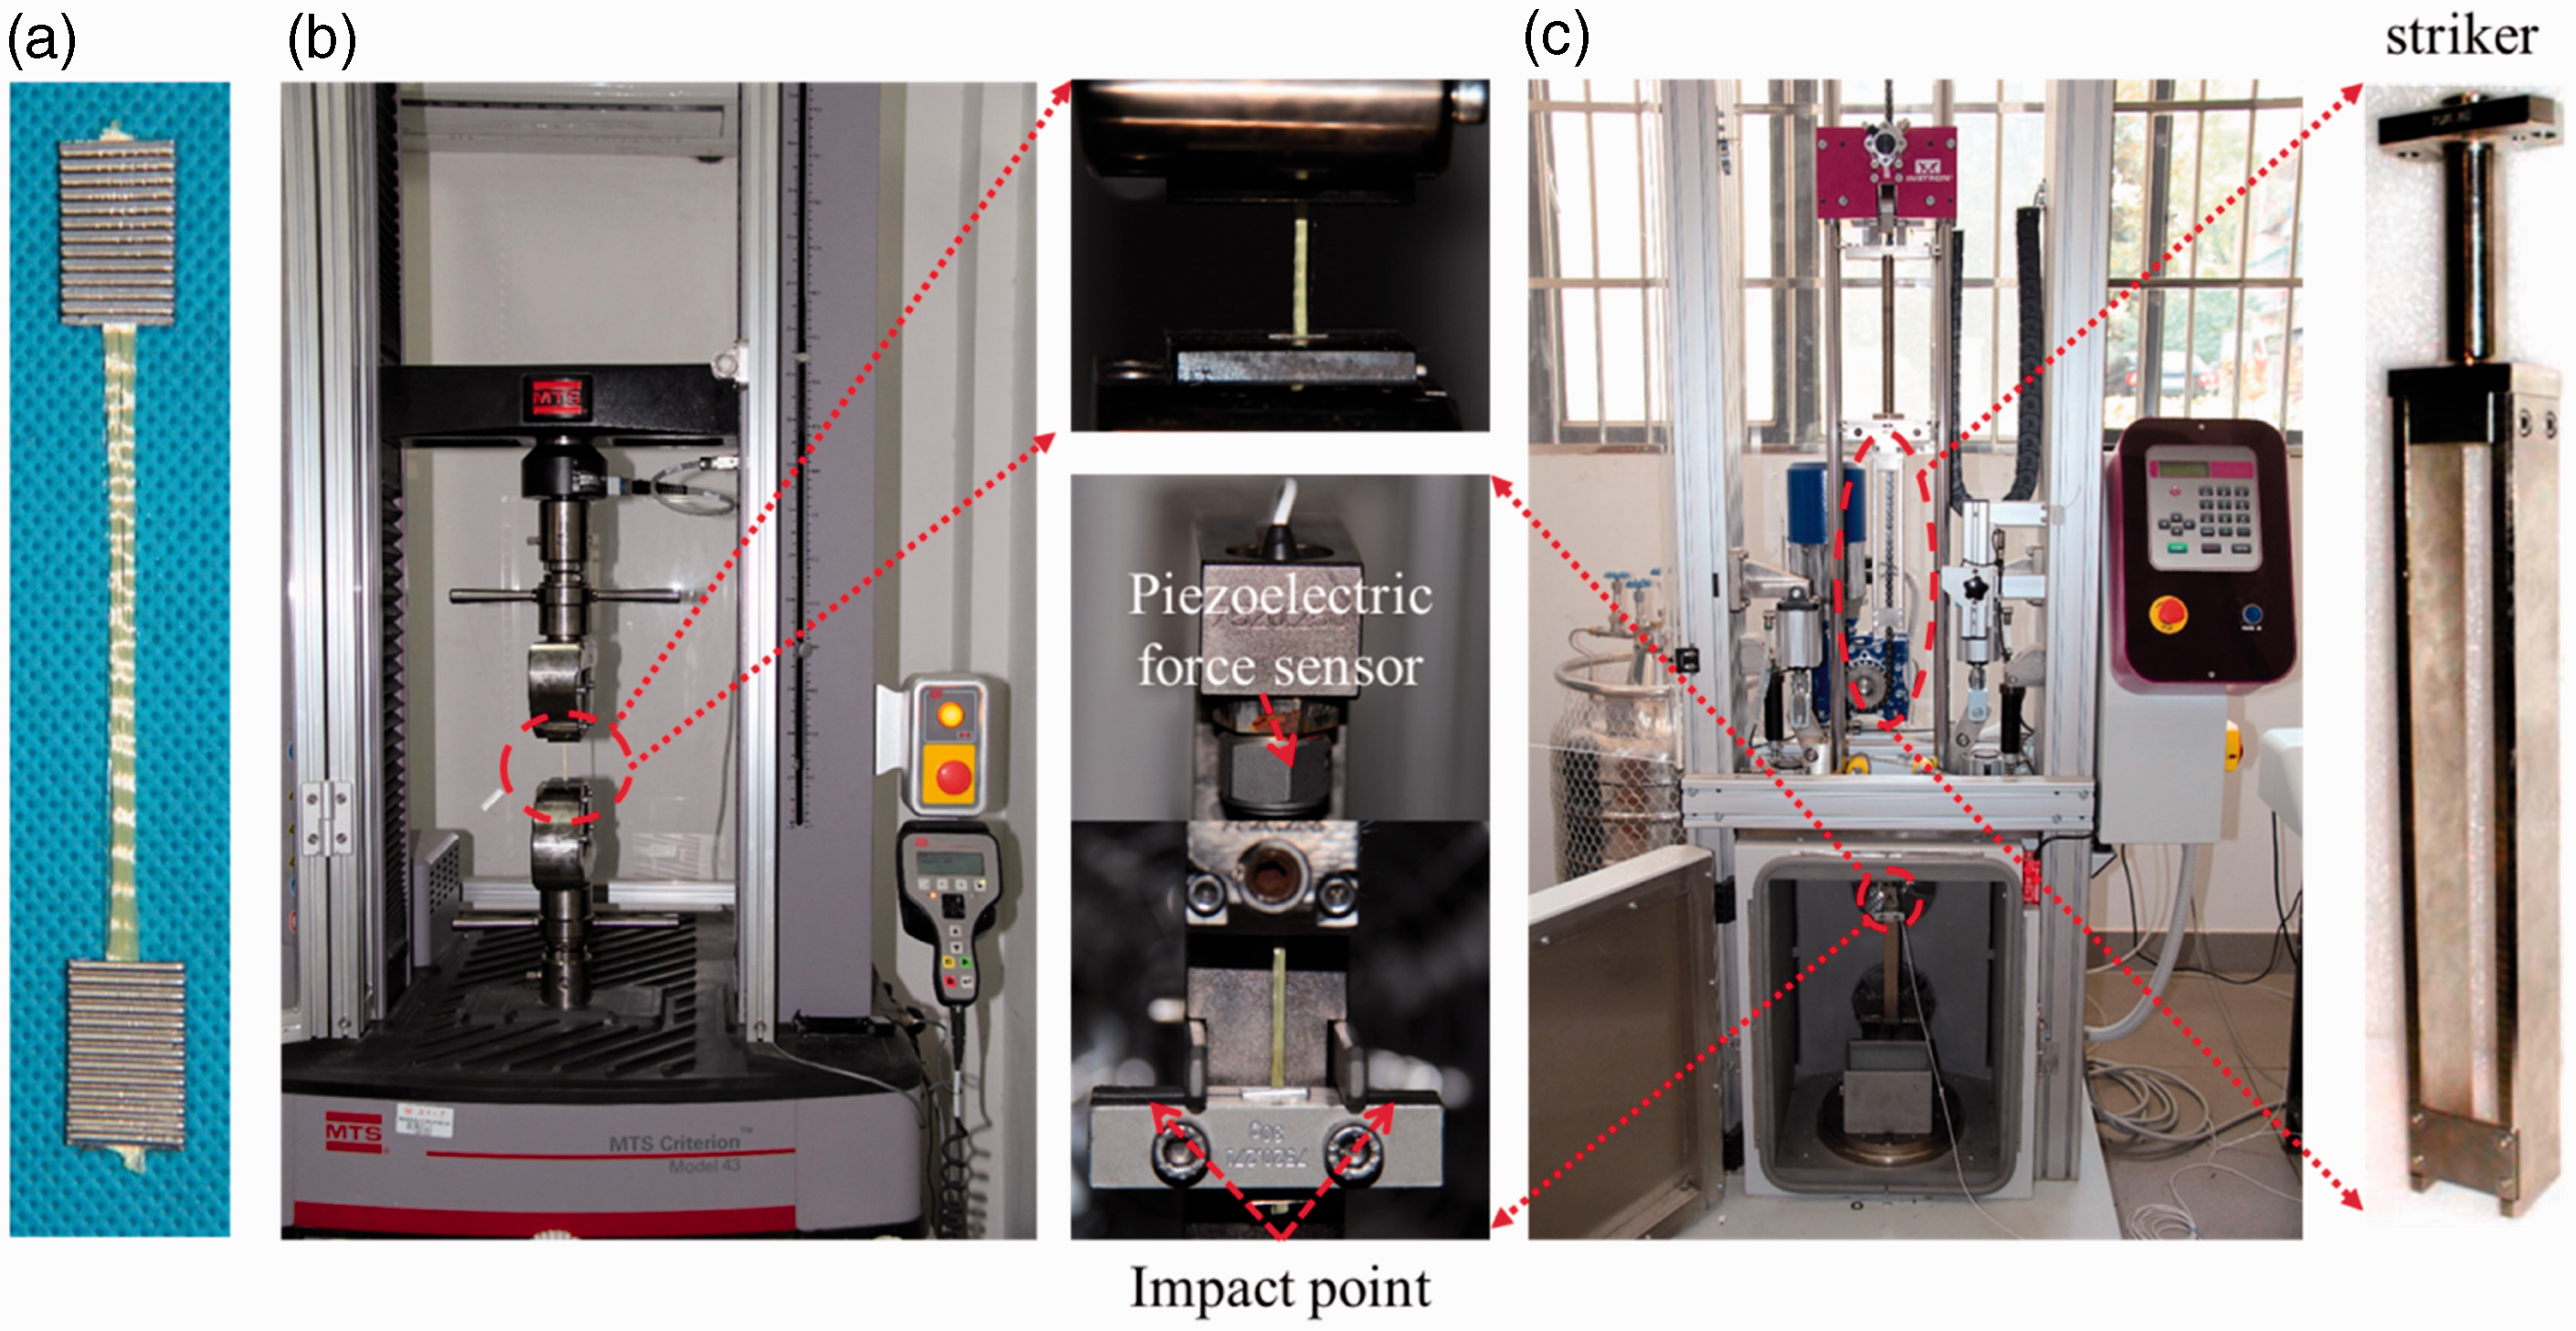
Quasi-static testing was performed on an MTS load frame (C43.304) with a load capacity of 30 kN and the maximum sampling rate of 1000 Hz, as shown in Figure 2(b). In this work, a load cell with 1 kN capacity was used for force measurement with a sample rate of 20 Hz and loading velocity was set to be 2.5 mm/min. An extensometer was also used to validate the accuracy of displacement measurement, as shown in Figure 3(a). The displacement recorded by MTS load frame is very close to that measured by the extensometer with an error less than 2% as shown in Figure 3(b), so it is reasonable to use the crosshead measurement as the deformation of specimens.
(a) Installation of extensometer and (b) comparison of collected data with an extensometer and the machine crosshead.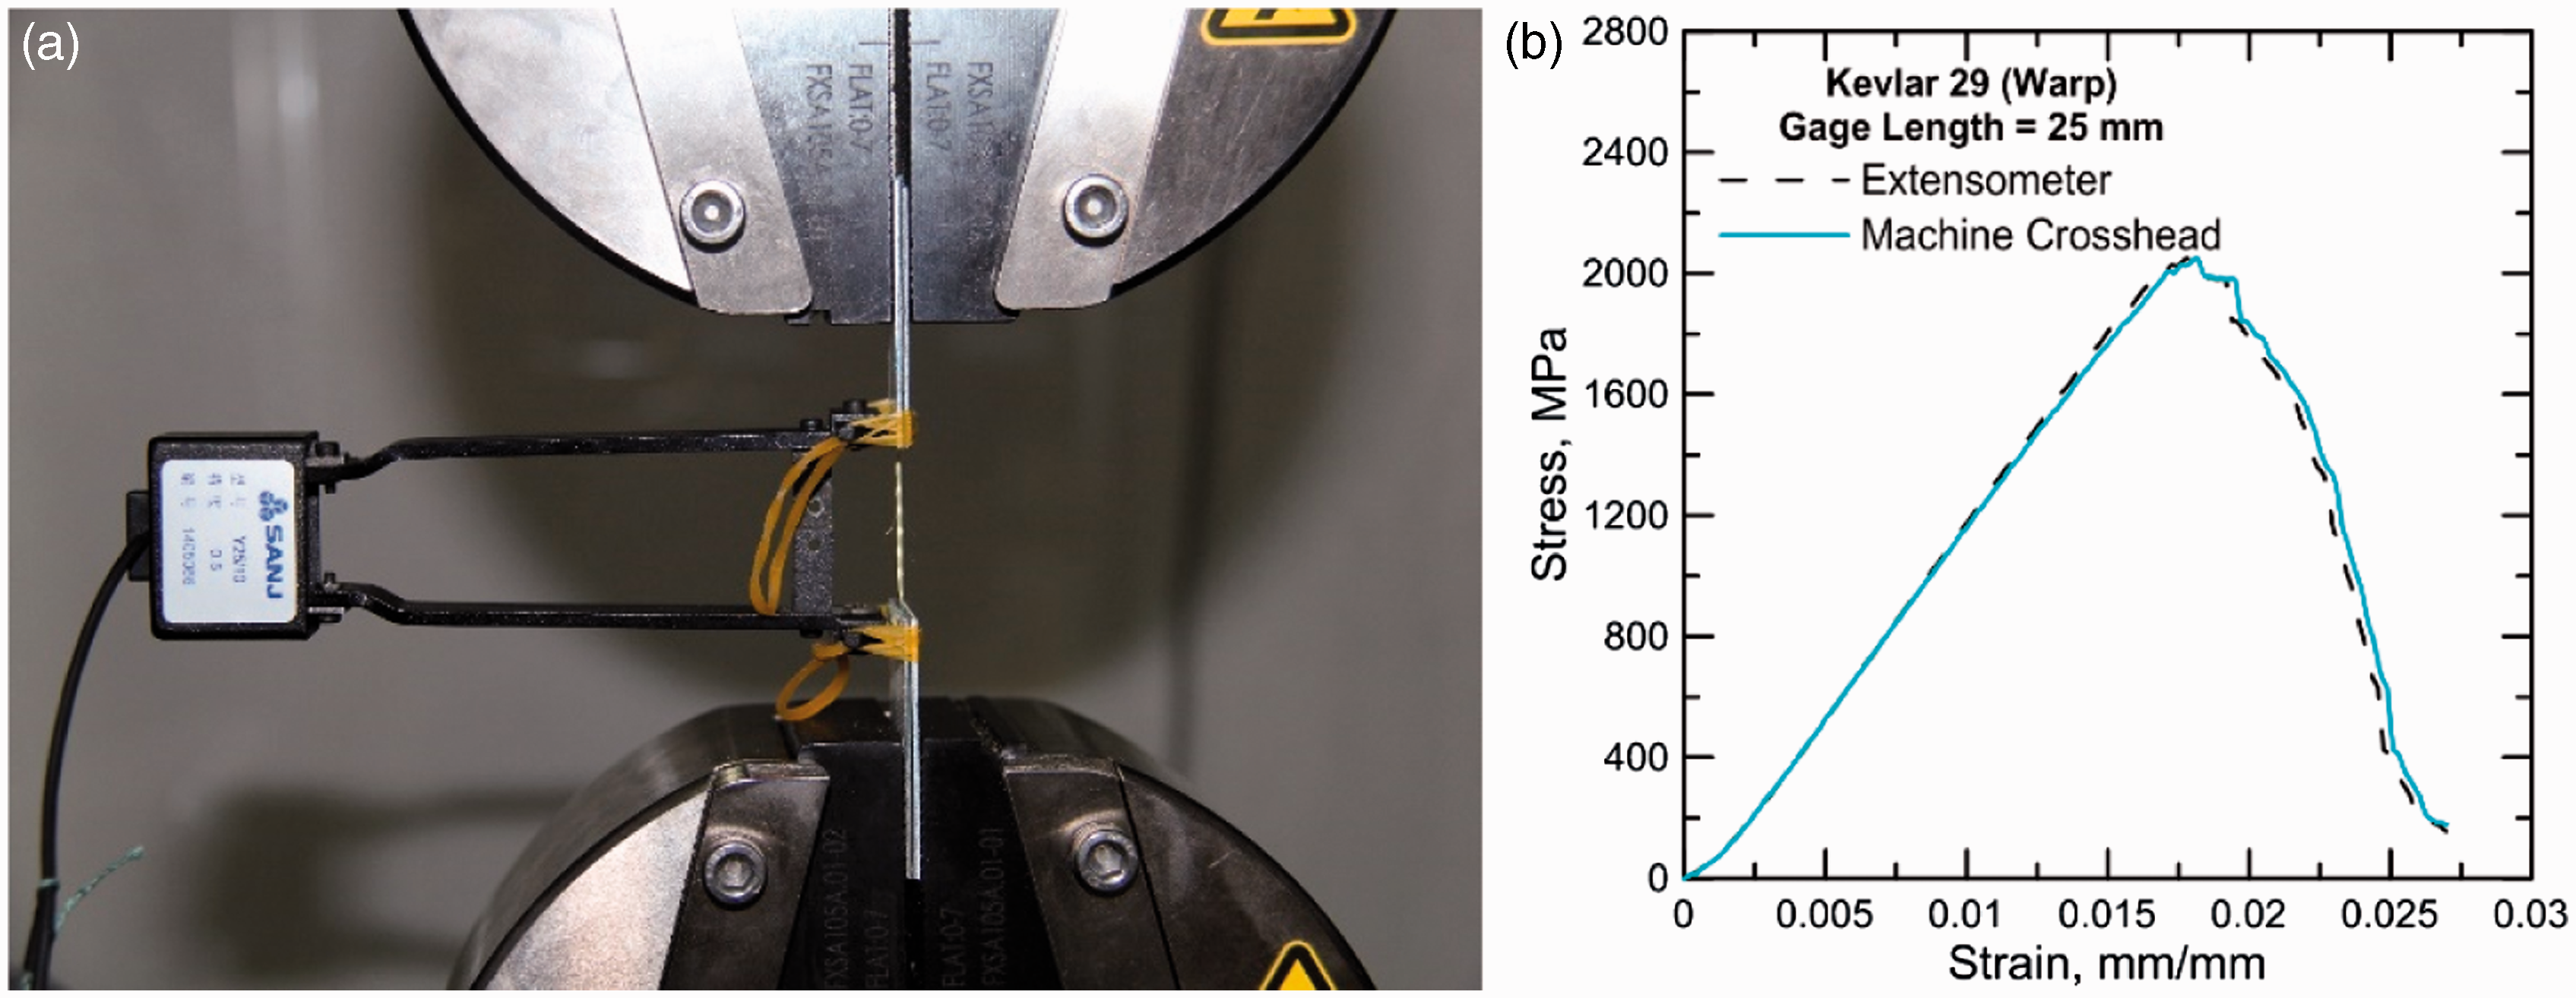
Dynamic tensile tests were conducted on a state-of-the-art drop-weight impact system (Instron, CEAST9340) with a pneumatic anti-rebound device to avoid a second impact on non-broken specimens, as shown in Figure 2(c). The drop height was from 0.03 m to 1.10 m with corresponding impact velocity from 0.77 m/s to 4.65 m/s. The maximum capacity and load application was 90 kN with maximum potential energy of 405 J. The required impact velocities could be achieved by releasing the impactor with a weight of 52 N from predetermined drop heights by means of an electronic brake release mechanism. The impact force induced by the free fall weight was measured by piezoelectric force transducer with a capacity of 2.2 kN, and the deformation and energy vs. time were recorded simultaneously at a sampling rate of 1 MHz with 14 bit resolution. Displacement is calculated based on the force measurement as follows
32
:

In this work, four different impact velocities (1, 2, 3, and 4 m/s) were chosen to achieve the strain rates of 40, 80, 120, and 160 s−1 for 25 mm gage length single yarn specimens. Ten single yarn samples were tested for each strain rate.
Preparation and testing method of single filament
Single filaments with a diameter of 12 µm33 were randomly selected from Kevlar® 29 yarns and cautiously glued on hollow cardboards as shown in Figure 4(a). The gage lengths of single filaments were set to 12.5, 25, and 40 mm based on measuring range of the tester. The cardboard bands on both sides were cut off before loading the specimen. A miniature tester (SEMTESTER 1000, MTI Instruments, Inc., USA) with a load capacity of 450 N and measuring accuracy of ±0.2% of full-scale loading range was utilized to conduct the tensile experiment of filaments, as shown in Figure 4(b). The maximum strain travel is 28.5 mm with a linear scale accuracy of ±20 nm. The maximum sampling rate of the digital data acquisition system is 1000 Hz. The sampling rate of 30 Hz was used in the present work. The loading velocity of the miniature tester was set at 0.5 mm/min for the experiment; 20 filament samples were tested for each gage length.
(a) Schematic of filament specimen and (b) miniature tester.
Results and discussion
Stress–strain relation
Figure 5 shows the stress–strain curves of Kevlar® 29 single filaments with different gage lengths. Noises on the curves could most likely be attributed to the vibration of the motor in the equipment and the gradual increment of displacement imposed on the specimen during test. The transducer is extremely sensitive and precise and able to record the noises in the load. The stress–strain behavior of the single filament is typically linear elastic before reaching the failure stress and the stresses drop to zero right after the brittle failure. Young’s modulus of the filament is defined as the slope of the curve in the elastic region. The toughness is evaluated using the area under the stress–strain curve. The stress–strain curves measured on single filaments although of similar shape (triangular) show a huge scatter not only in the properties at failure as expected but also in modulus, which could be attributed to the damages induced by manufacturing process and operation of drawing filaments from yarn.
Stress–strain curves of single filaments at gage lengths of (a) 12.5, (b) 25, and (c) 40 mm.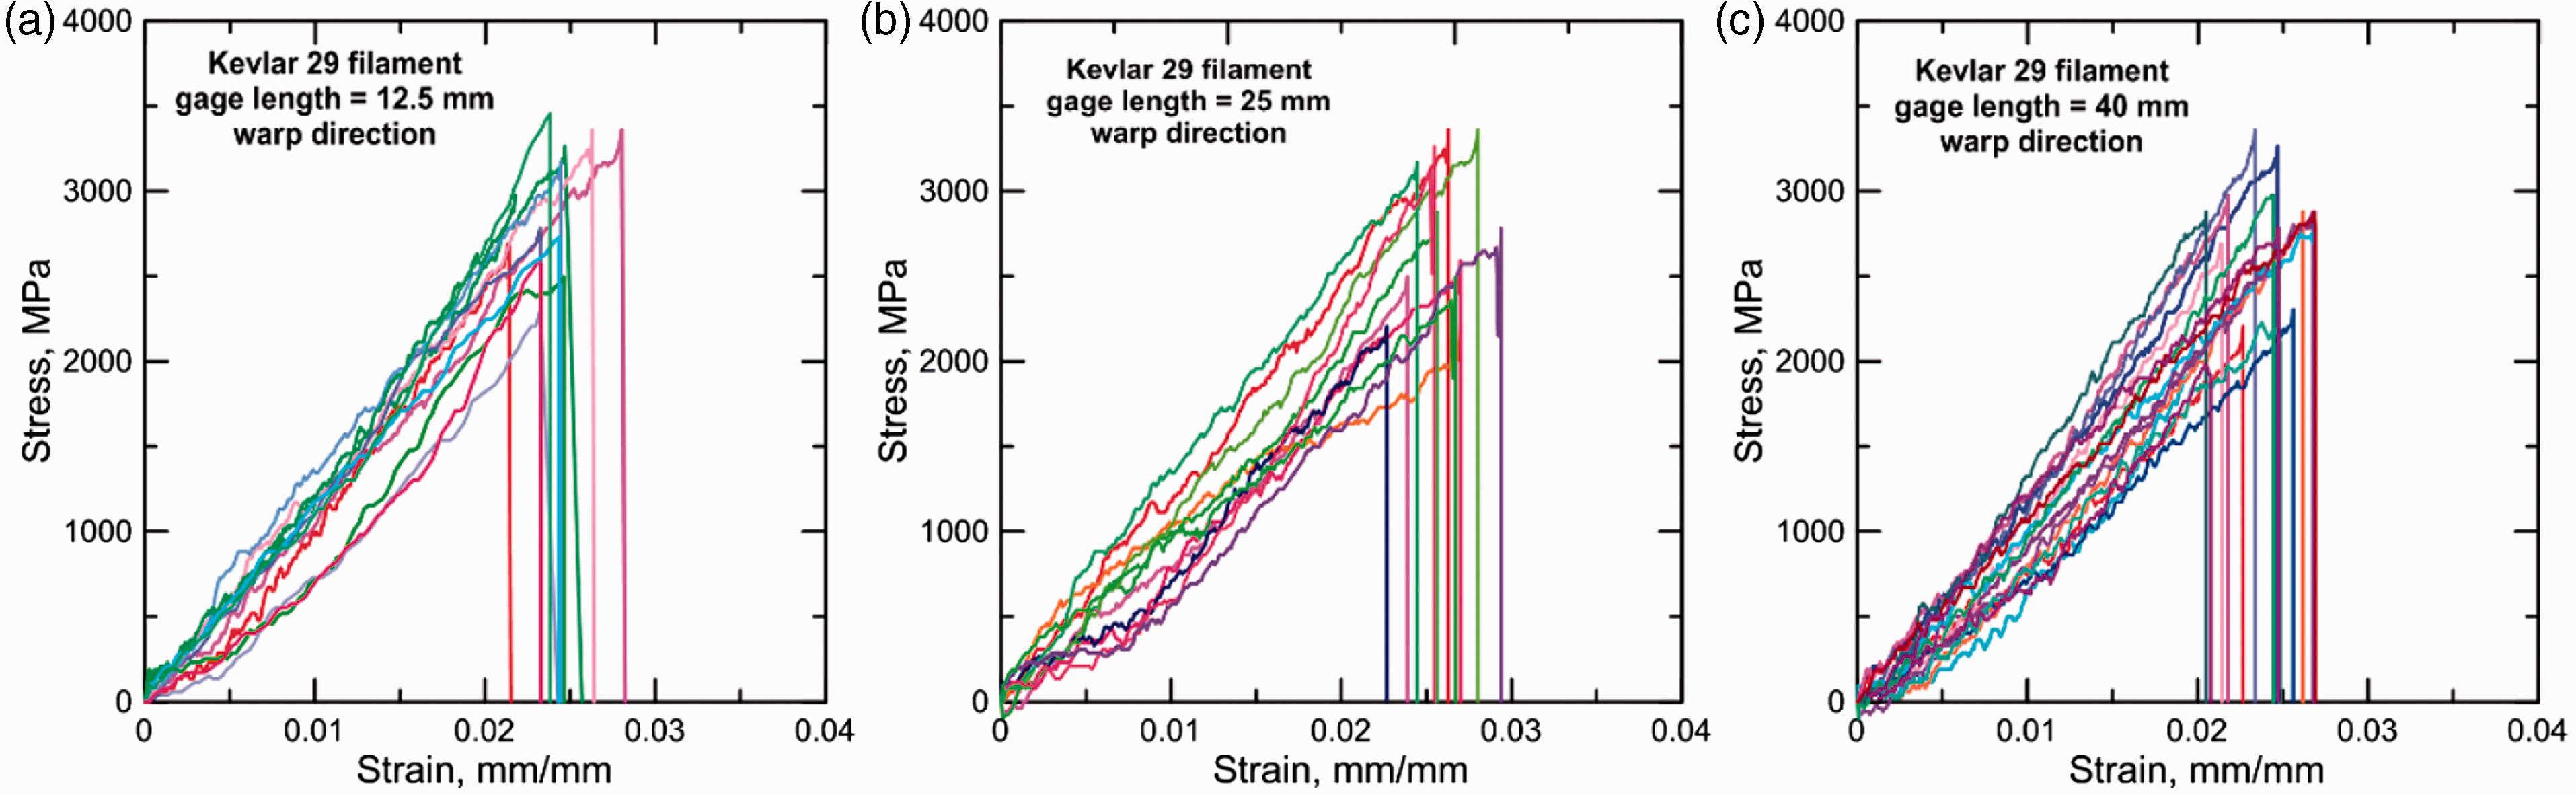
As shown in Figure 6(a), the stress–strain response of the single yarn under quasi-static loading (strain rate = 1/600 s−1) exhibits four distinct regions during loading, similar to the response under dynamic loading condition
29
: (I) non-linear region of strain, (II) linear region of strain, (III) pre-peak failure region, and (IV) post-peak failure region. The stress–strain curves were then analysed to extract the Young’s modulus, tensile strength, ultimate strain, and toughness for all the specimens. The toughness was evaluated using the area under the stress–strain curve. Figure 6(b) and (c) show the stress–strain curves of Kevlar® 29 single yarns in warp and fill directions with two gage lengths, i.e. 25 mm and 150 mm, respectively. Apparently, the responses of warp yarn are different with those of fill yarns, which might attribute to the fact that more damages are caused by the weaving process in the warp yarn.
(a) Typical stress–strain curve of single yarn with 25 mm gage length; and stress–strain curves of single yarn with gage lengths of (b) 25 mm; and (c) 150 mm in warp and fill directions under quasi-static loading.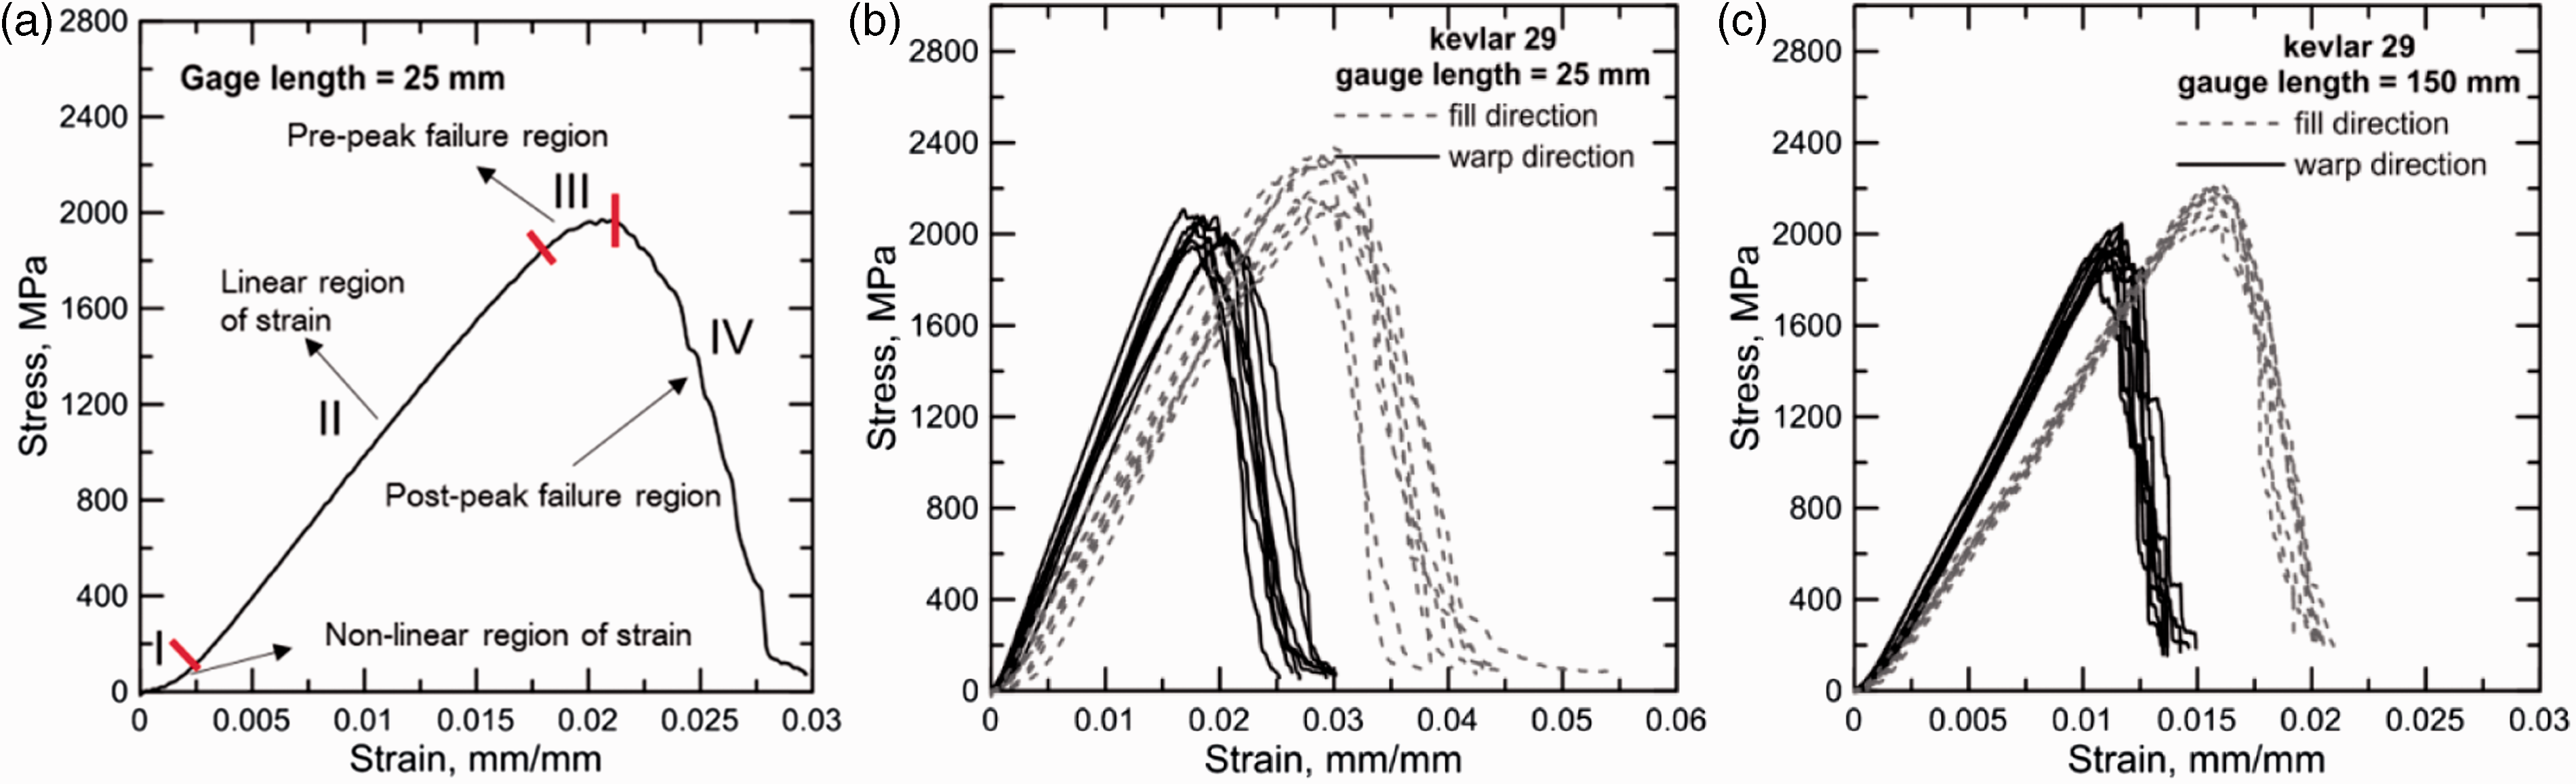
Figure 7 shows the stress–strain curves of Kevlar® 29 single yarns with different gage lengths. In some fibers, the possibility of including a defect is increased by increasing the gage length. The gage-length effect may provide a measure of the defect distribution along the length of the fiber. A significant defect will limit the tensile strength as measured.
34
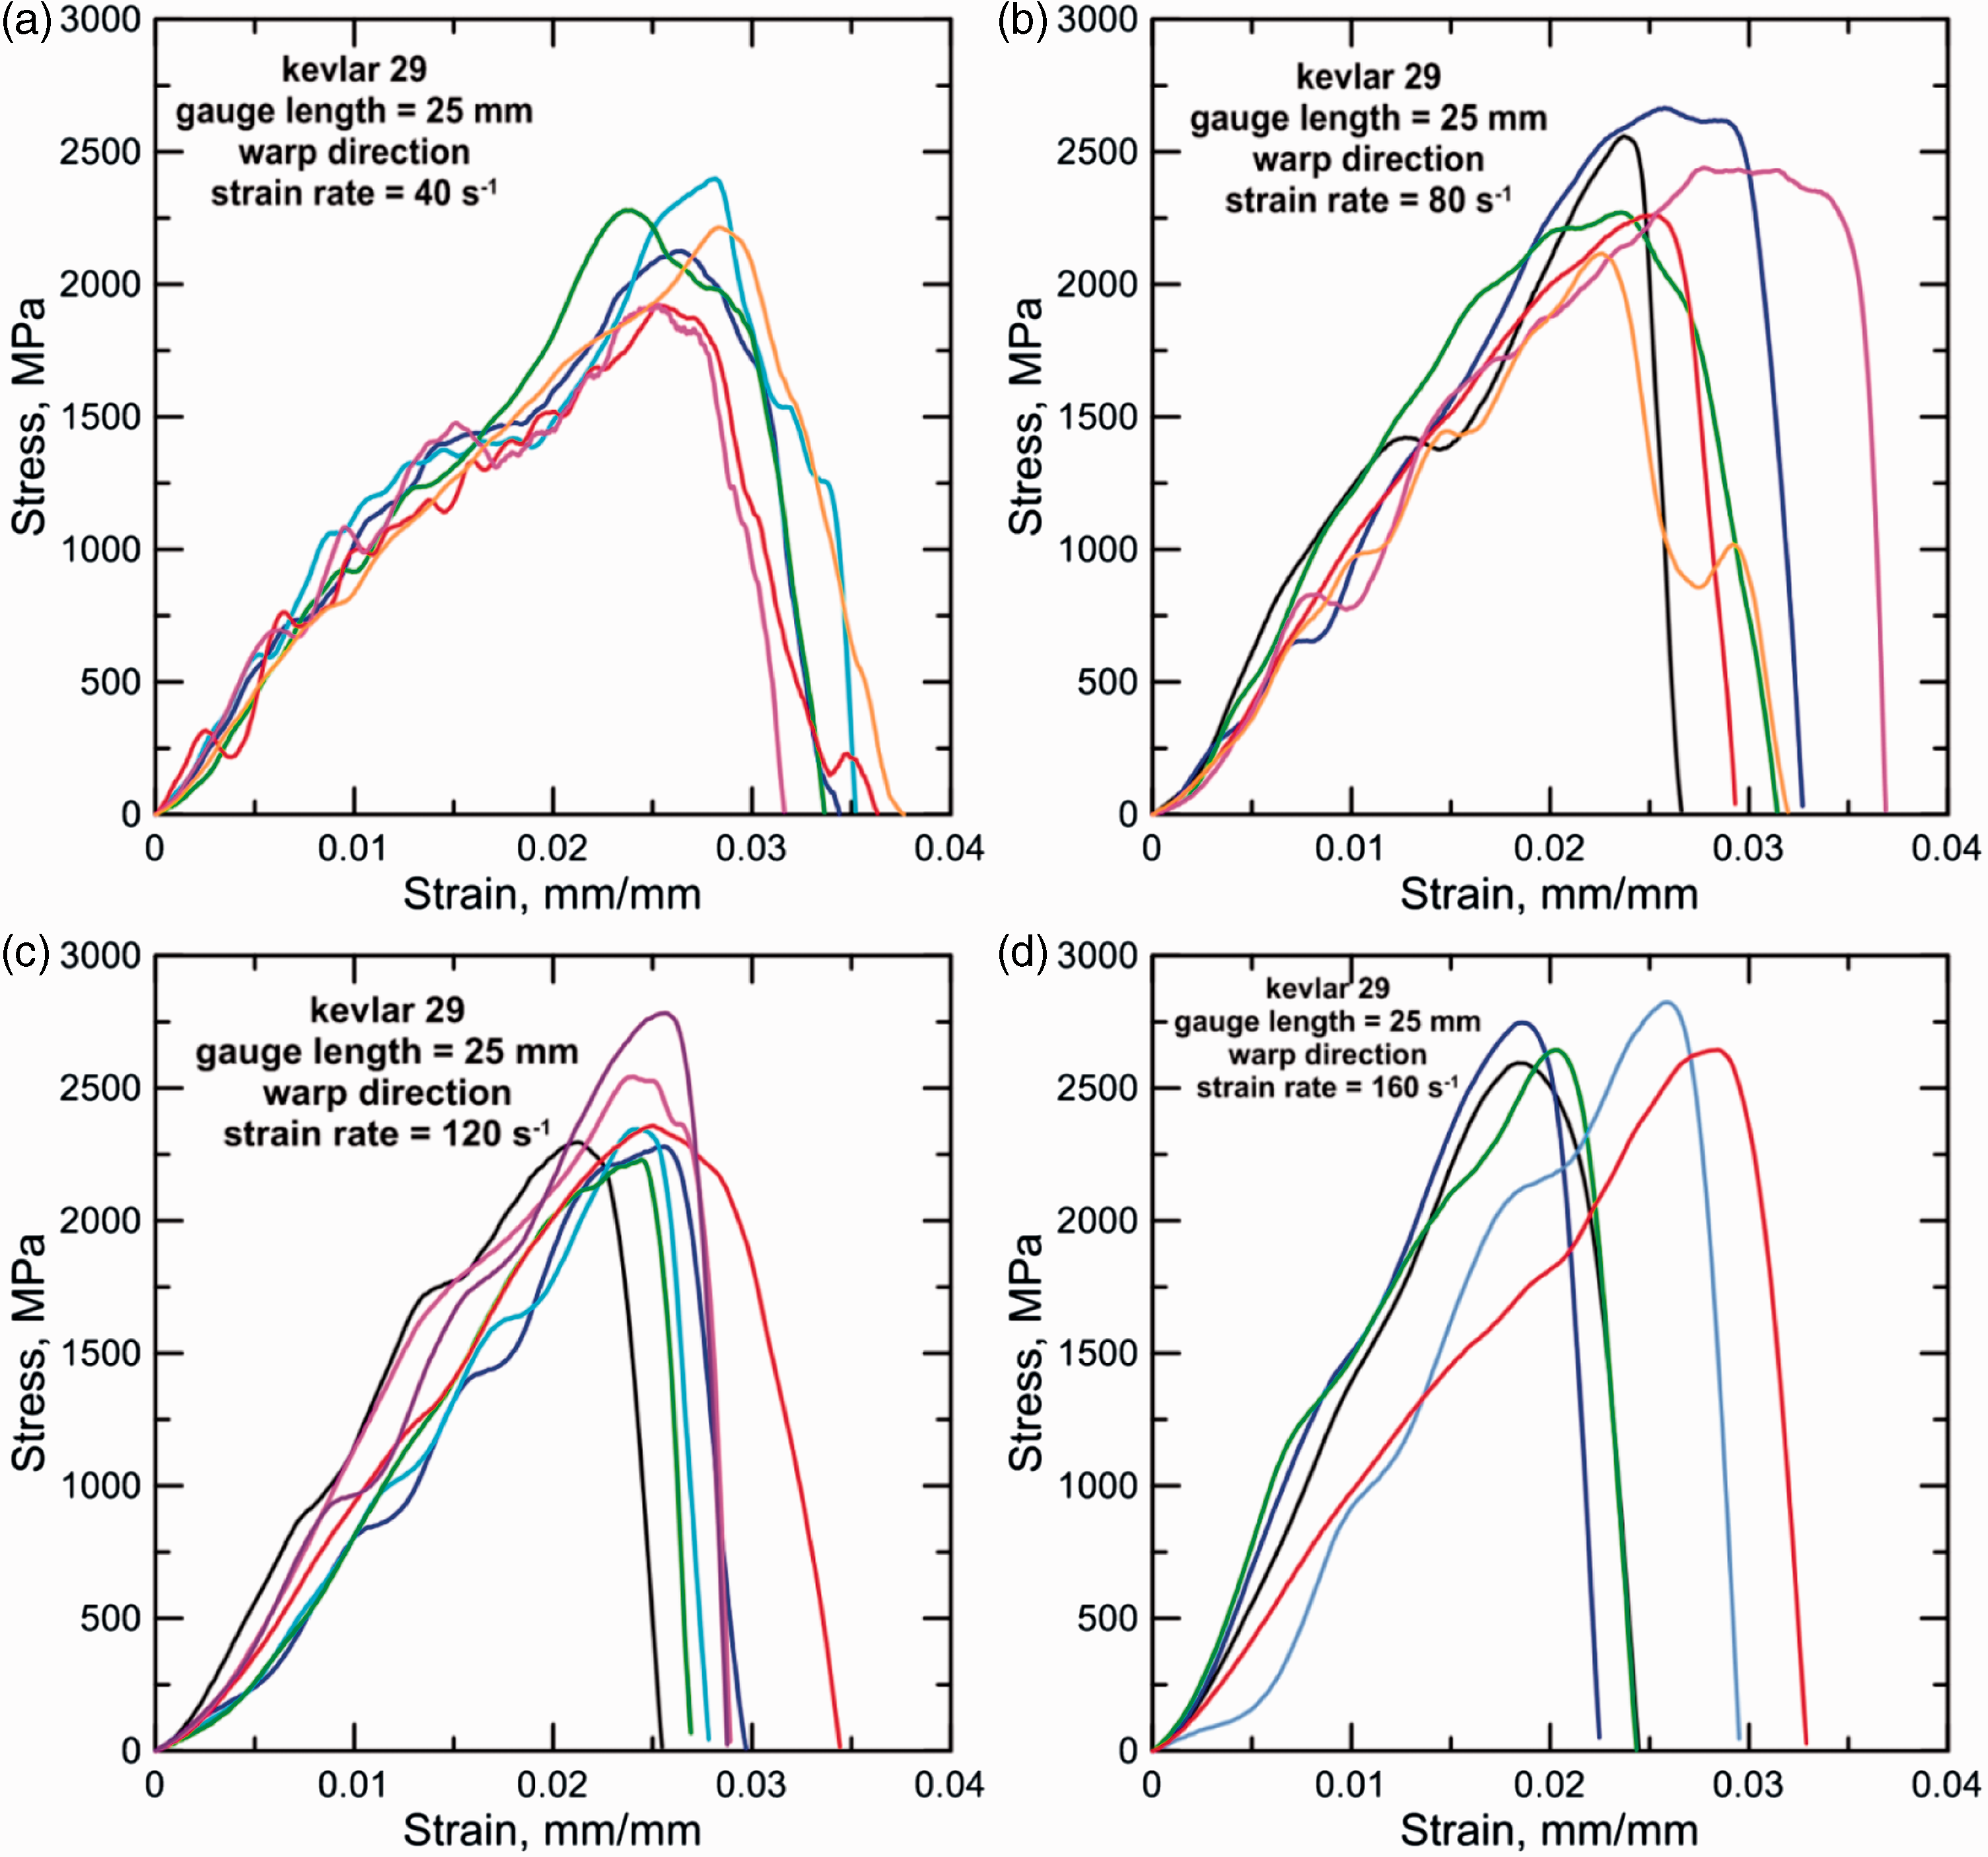
Figure 8 shows the dynamic stress–strain curves of Kevlar® 29 single yarn, which are more scattered than those under quasi-static loading. The fluctuations in the stresses are caused by the system ringing of impact test device when the specimens were struck by the impactor.6,35 The number of fluctuations in the curves decreases with increasing impact velocities, since the impact duration is much shorter at higher loading rates. The displacement vs. time curves under different target strain rates are shown in Figure 9(a). It shows that the displacement is linear as a function of time, and the corresponding velocities and target strain rates are reached with errors of less than 1.3% and constant during the entire loading duration. Incident kinetic energies of the striker at strain rates of 40, 80, 120, and 160 s−1 are 2.65, 10.62, 23.90, and 42.48 J, respectively, which are much larger than the works done until failure under corresponding conditions (i.e. areas under force–displacement curves, about 0.12, 0.13, 0.11, and 0.11 J, respectively). On the basis of law of conservation of energy and theorem of kinetic energy, the velocity of striker would not apparently decrease during striking the yarn samples. The representative stress vs. time curves under different strain rates are shown in Figure 9(b). The test durations (until fiber breaks) under strains rate of 40, 80, 120, and 160 s−1 are 0.805, 0.401, 0.257, and 0.167 ms. Based on a magnitude of stress fluctuation caused by system ringing in the literature,
36
the stress oscillations in the stress–strain curves at all the strain rates investigated are within the acceptable range.
Stress–strain curves of Kevlar® 29 single yarn at gage lengths of (a) 50, (b) 100, (c) 200, and (d) 300 mm. Stress–strain curves of Kevlar® 29 single warp yarn at the strain rates of (a) 40, (b) 80, (c) 120, and (d) 160 s−1. (a) Representative displacement vs. time and (b) representative stress vs. time curves of Kevlar® 29 single yarn under different strain rates.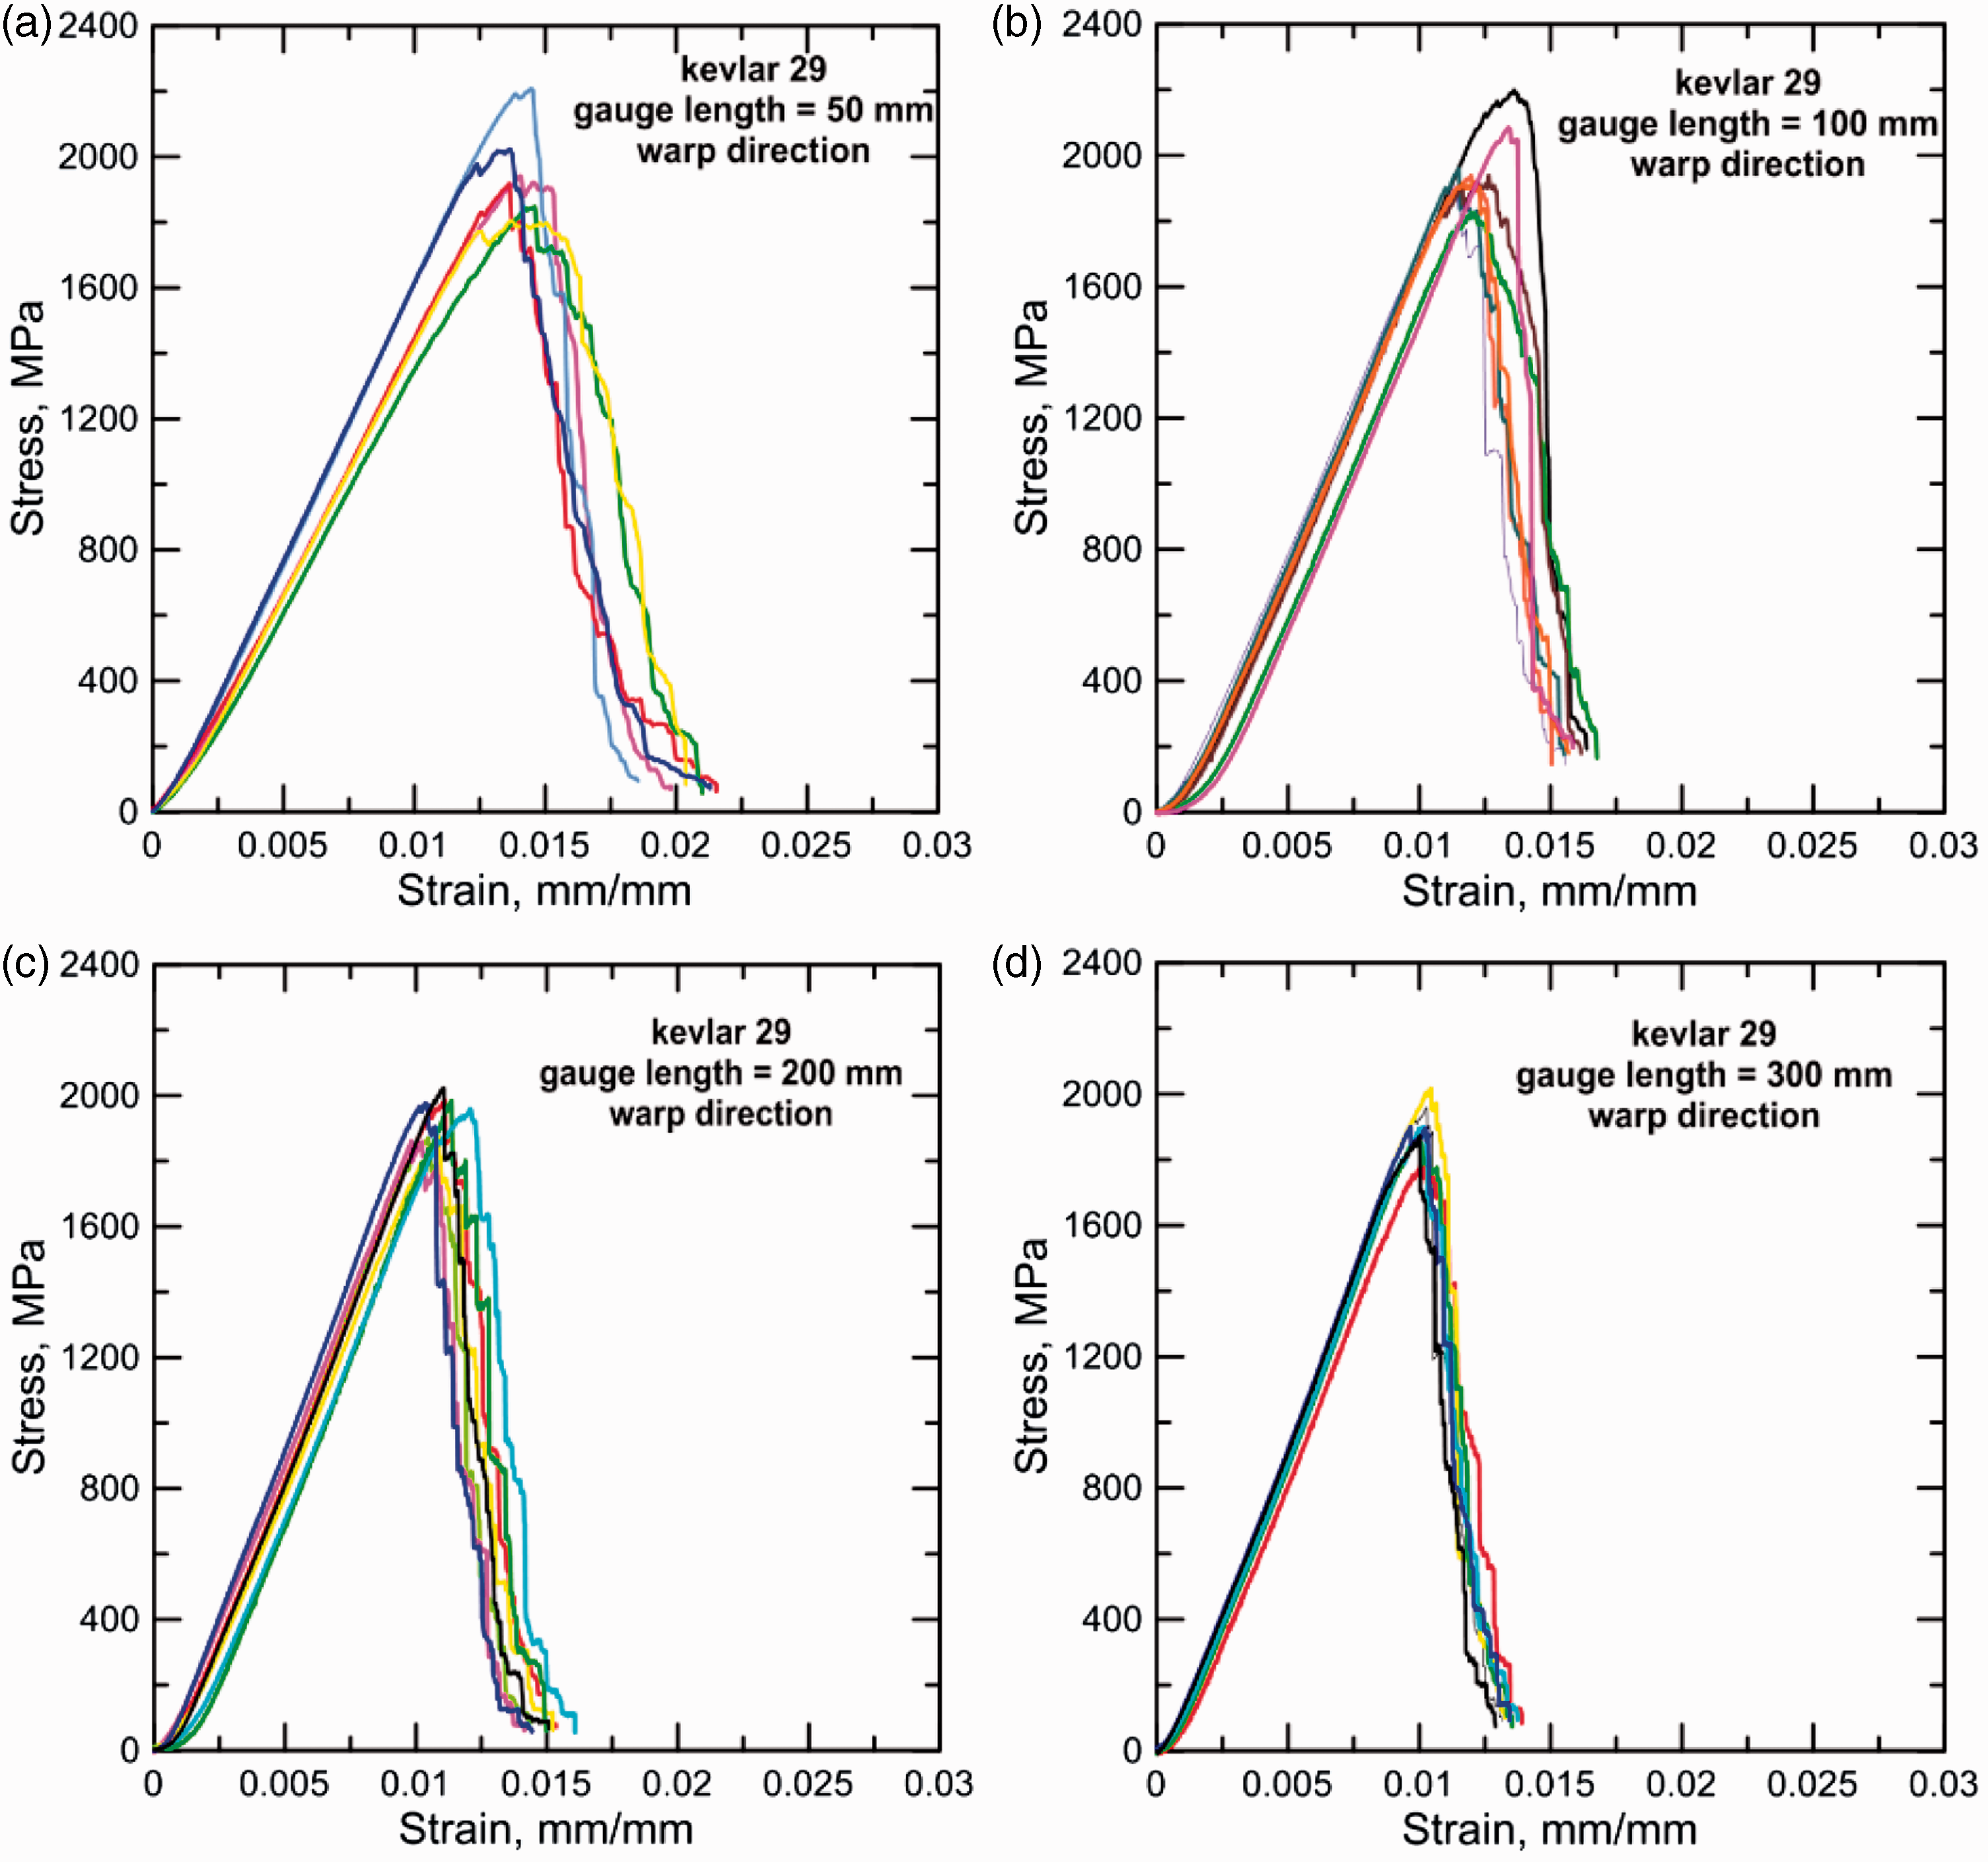

Gage length and direction effects
Figure 10 shows the variations of Young’s modulus, tensile strength, ultimate strain, and toughness of Kevlar® 29 filaments and yarns over the gage length ranges investigated. For the single filaments, the experimental results show that the effect of gage length on the mechanical properties is insignificant. The tensile strength decreases about 5.0% from 3191 ± 292 MPa to 3032 ± 307 MPa with the gage length increasing from 12.5 mm to 40 mm, Young’s modulus increases approximately 4.2% from 126.3 ± 15.7 GPa to 131.6 ± 16.7 GPa, which is generally higher (26.3%–31.6%) than the values reported by Yue et al.
26
(100 GPa or so). The discrepancy of Young’s modulus can be attributed to the variation of measured cross-sectional area of Kevlar 29 filament. In the work by Yue et al.,
26
the average measured filament diameter of 14.8 µm was used in the calculation of mechanical properties, which is 23.3% larger than the diameter of 12 µm33 used in the present work.
Gage length effect on the mechanical properties of Kevlar® 29 single filament and yarn: (a, b) Young’s Modulus, (c, d) tensile strength, (e, f) ultimate strain, and (g, h) toughness.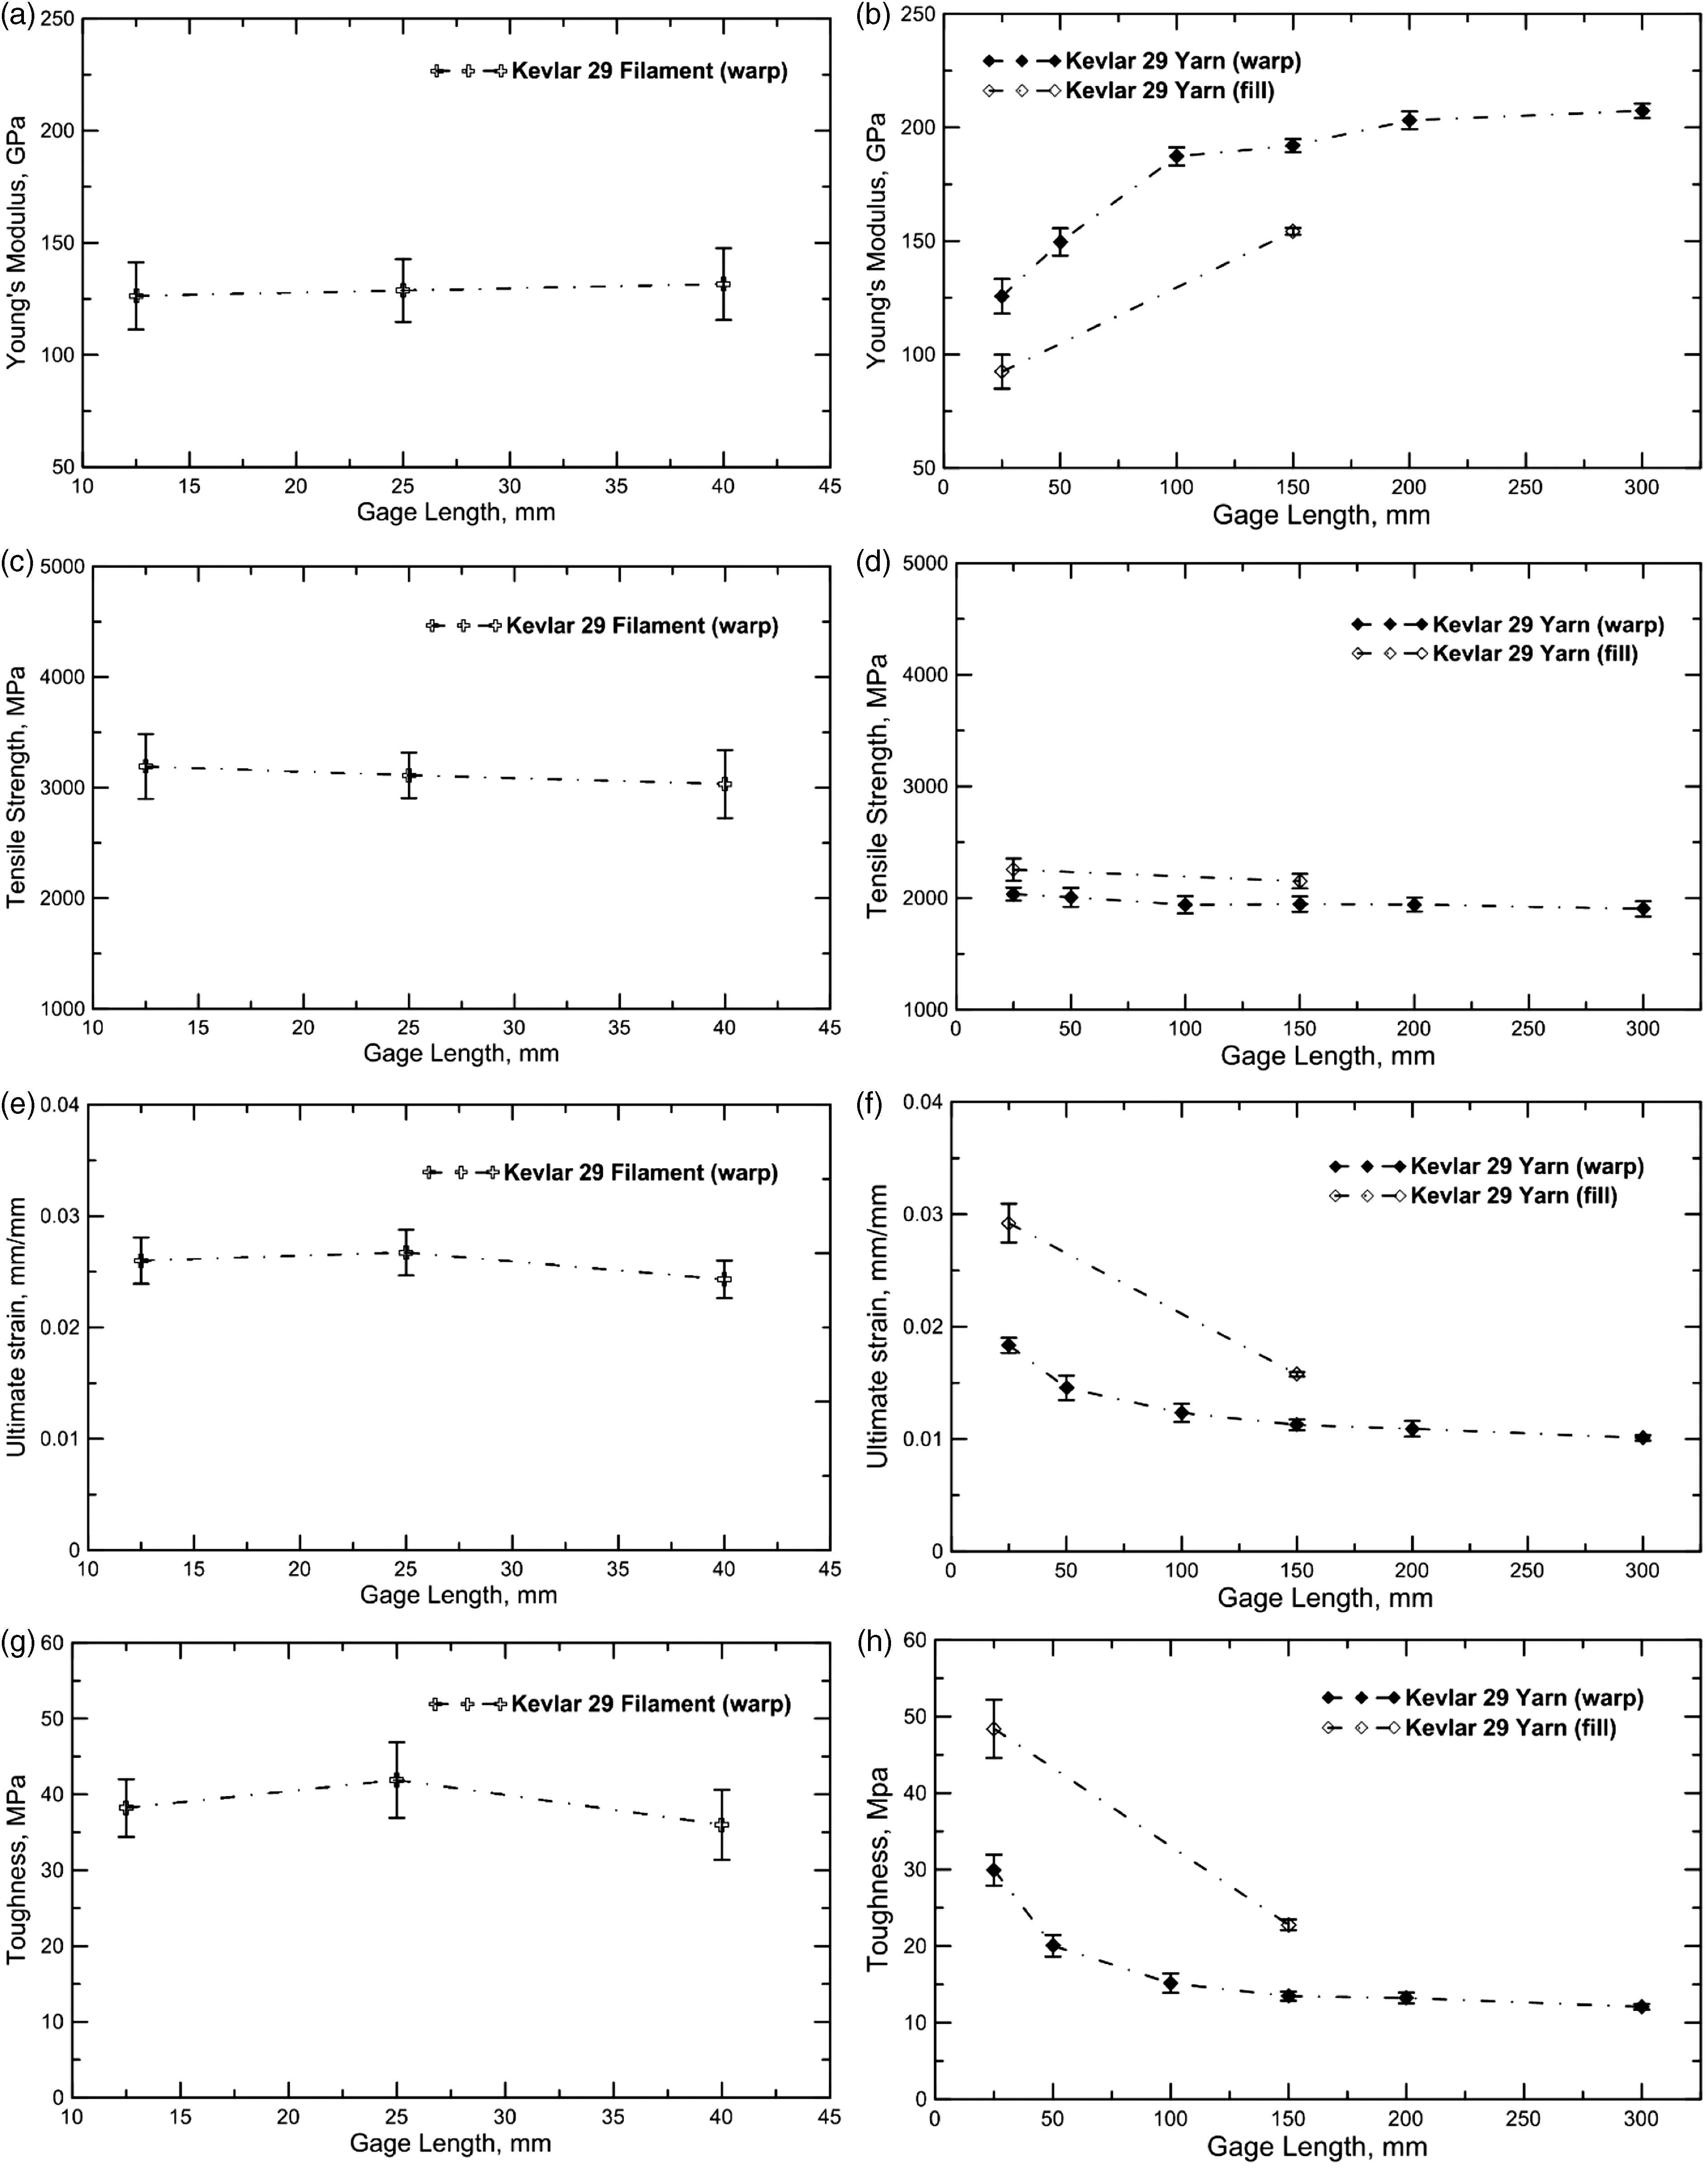
The variation of ultimate strain and toughness are also within 6%. These findings are also consistent with those by Nilakantan and Nutt.
37
The little variations in the tensile strength of single filament studied in this work may indicate that the strength-limiting defects are quite numerous and evenly distributed along the filaments, which is similar to Kevlar®, Kevlar
For the single yarn samples, the tensile strength, ultimate strain, and toughness decrease with increasing gage length, except of the Young’s modulus. For example, when the gage length increases from 25 mm to 300 mm, tensile strength, ultimate strain, and toughness decrease from 2035 ± 58 MPa, 0.018 ± 0.001 mm/mm, and 29.9 ± 2.0 MPa to 1903 ± 68 MPa, 0.010 ± 0.001 mm/mm and 12.1 ± 0.4 MPa, which are about 6.5%, 44.8%, and 59.5% changes, respectively. The Young’s modulus increases as much as 65.0% from 125.6 ± 7.6 GPa to 207.3 ± 3.2 GPa. The tensile strength of single yarn does not vary significantly when the gage length is larger than 100 mm, indicating there are strength-limiting defects in single yarns with a length of 100 mm or longer. Similar phenomena were also found in A265 single fibers by Lim et al.30,38 The tensile strength and ultimate strain of warp yarn are about 9.7% and 34.8% less than those of fill yarn, respectively, but the Young’s modulus of warp yarn is 32.9% higher than that of fill yarn.
Strain rate effect
Figure 11(a) to (d) show the strain rate dependence of the dynamic material properties of Kevlar® 29 single yarn, defined in terms of apparent Young’s modulus, tensile strength, ultimate strain, and toughness, respectively. There is an apparent strain rate effect on the dynamic mechanical properties. The Young’s modulus and tensile strength increase from 121.5 ± 10.9 GPa and 2026 ± 55 MPa to 156.6 ± 14.6 GPa and 2691 ± 103 MPa, namely 28.9% and 32.8%, when the strain rate increases from 1/600 s−1 to 160 s−1. In addition, the ultimate strain decreases about 15.4% from 0.026 ± 0.002 mm/mm to 0.022 ± 0.004 mm/mm with increasing strain rate over the range of 40 ∼ 160 s−1. The toughness initially increases from 30.2 ± 2.0 MPa to 43.9 ± 8.6 MPa when the strain rate increases from 1/600 s−1 to 80 s−1 and then drops to 38.1 ± 3.1 MPa at the strain rate of 160 s−1.
Strain rate effect on mechanical properties of Kevlar® 29 single yarns with a gage length of 25 mm: (a) Young’s modulus, (b) tensile strength, (c) ultimate strain, and (d) toughness.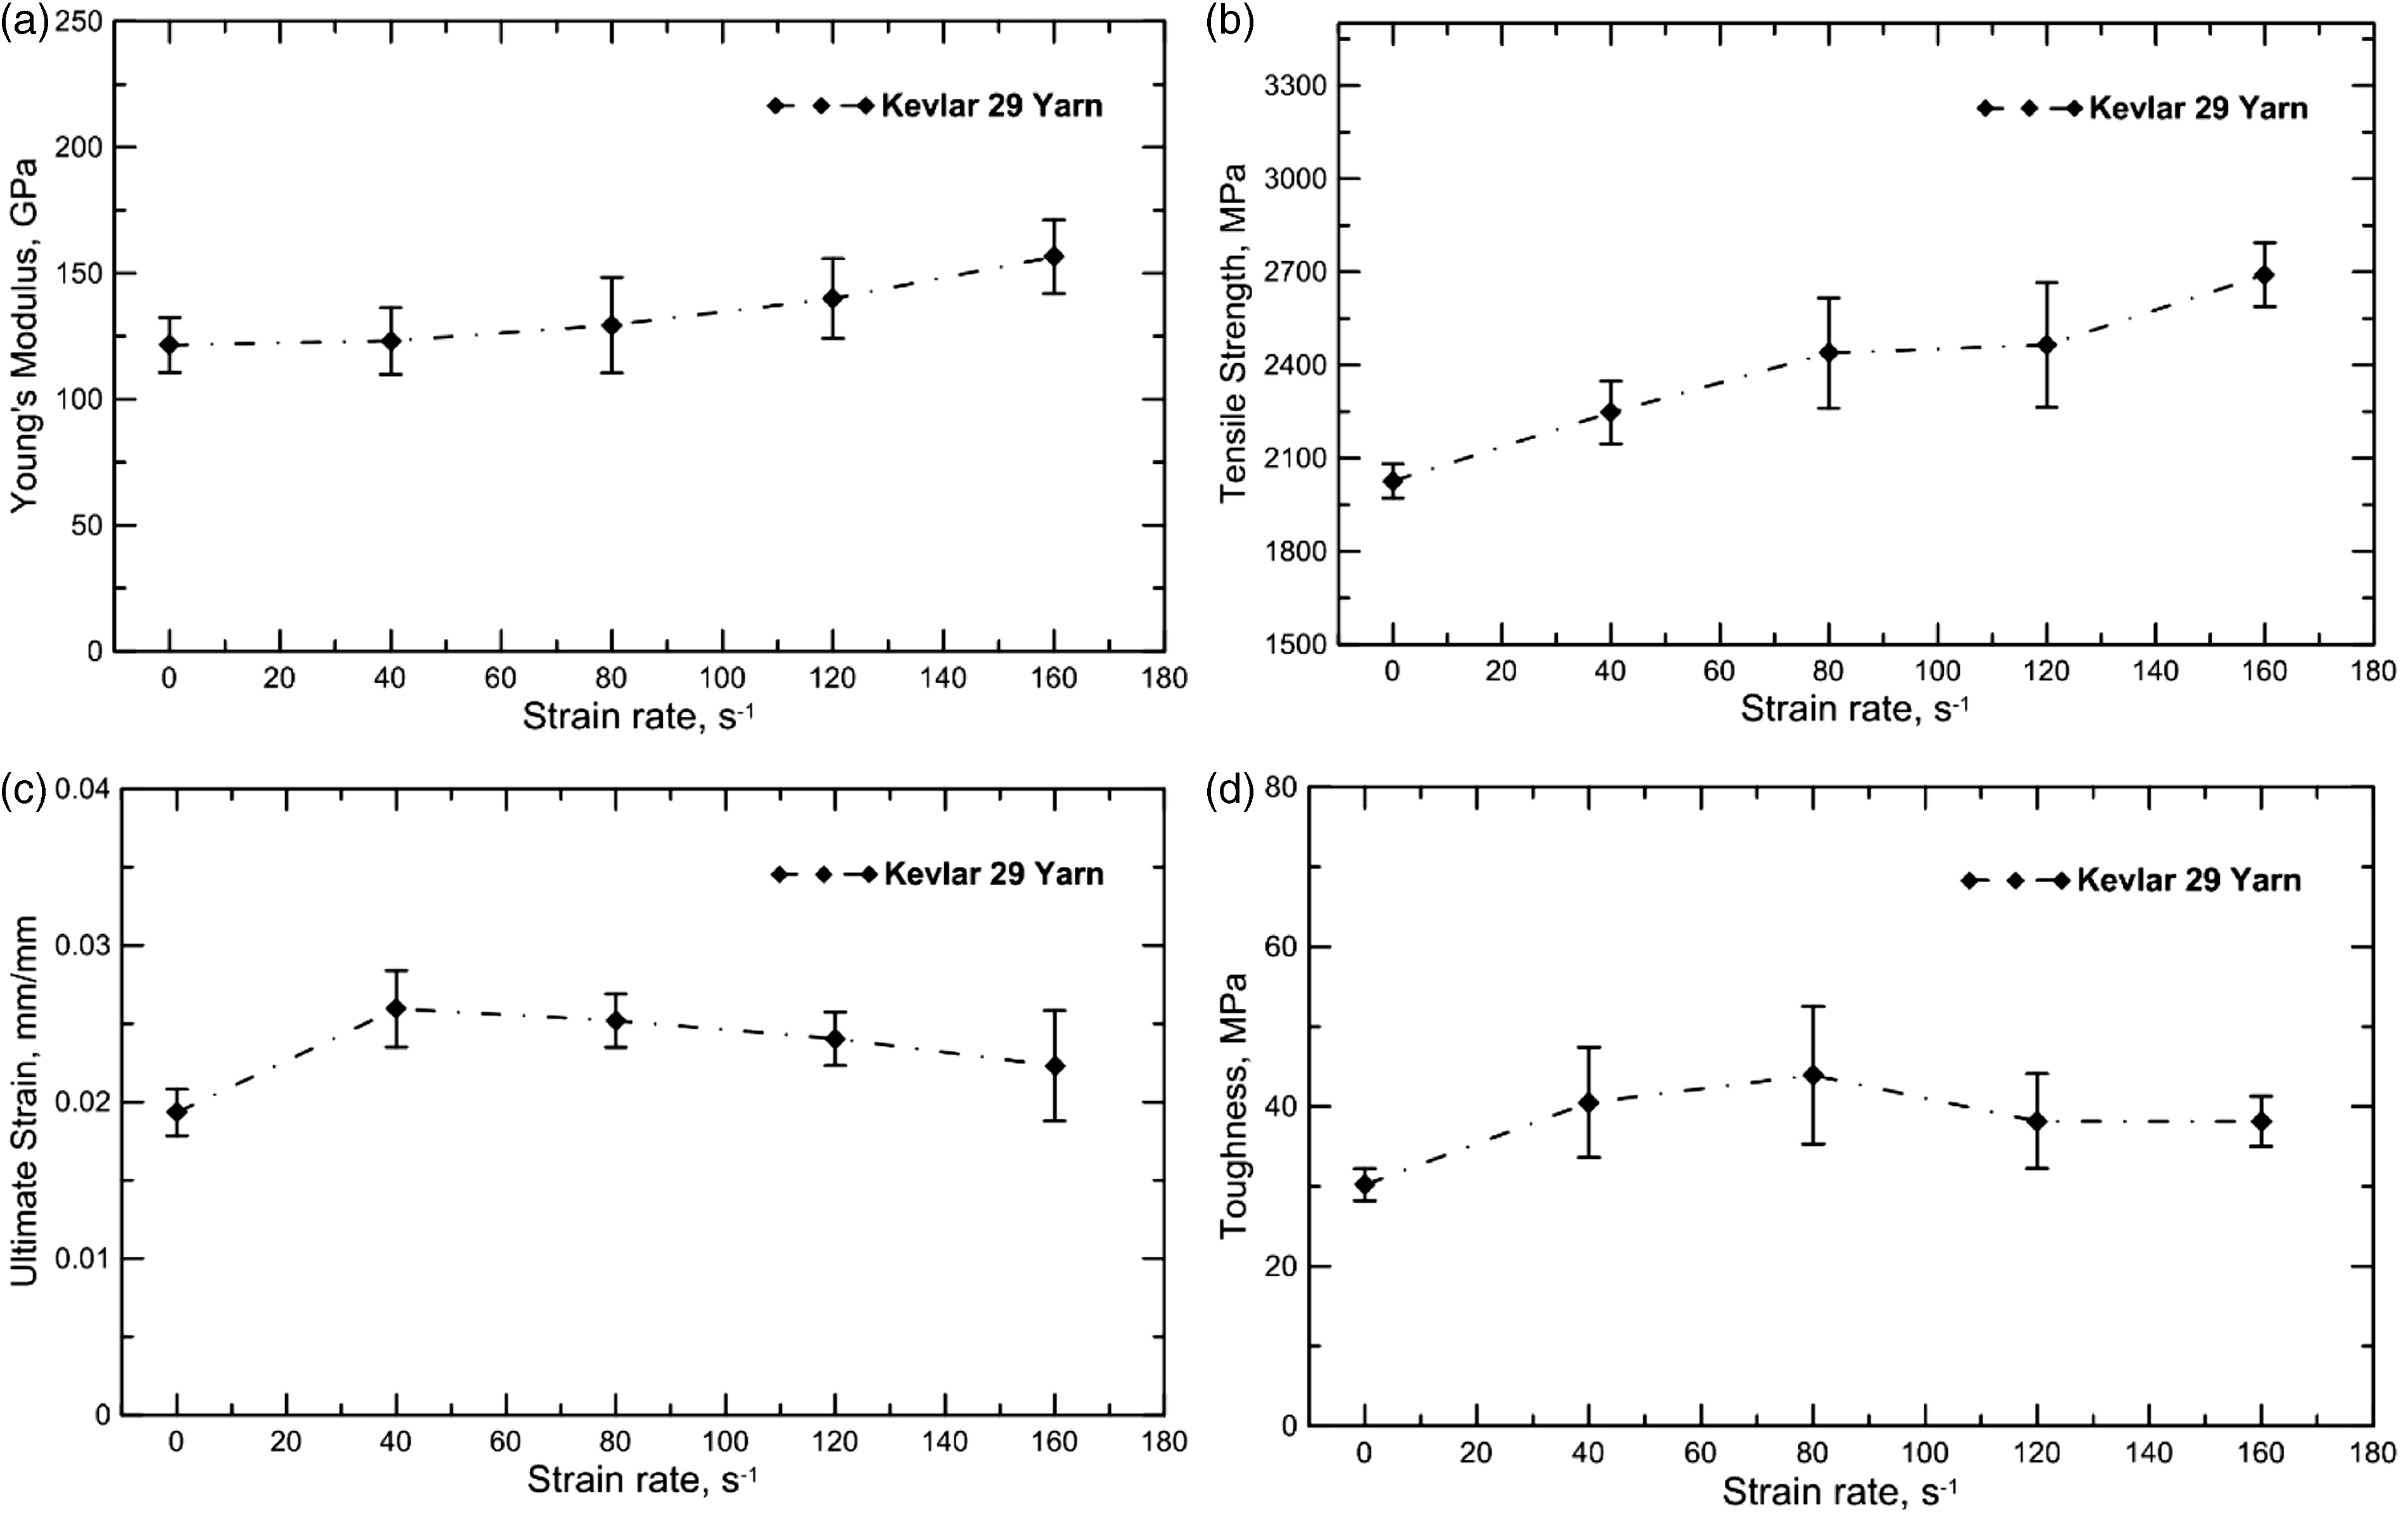
The significant increase in tensile strength may be attributed to several possible reasons: (i) the frictions between adjacent filaments always play an important role due to random and misaligned breakage of filaments in the yarn during the tensile deformation; (ii) the contact force among adjacent filaments increase with increasing strain rate, resulting in the increase of sliding friction force (friction coefficient is assumed be constant); (iii) there is not enough time to initiate internal defects in the material at higher strain rates. Under such conditions, more energy is needed for damage initiation and propagation, which could lead to increasing tensile strength at high strain rates.
Comparison with literatures
Figure 12(a) to (d) compares the Young’s modulus, tensile strength, ultimate strain, and toughness of single filament and yarn under different strain rates obtained in the present work with the data available in literatures. Results from Zhu et al.29,31 showed that the Young’s modulus and tensile strength of Kevlar 49 yarn/fabric increase with increasing strain rate. Besides, when the gage length of Kevlar 49 yarn/bundle increases from 8 mm39 to 25 mm and 50 mm,
29
Young’s modulus increases, while tensile strength decreases. Obviously, those tendencies are in line with Kevlar 29 yarn. The strain rate exerts insignificant effect on the tensile strength of KM2 filament,
40
but it is notable for Kevlar 49 filament bundle
39
and Kevlar 129 filament,
30
whose tensile strengths increase with increasing strain rate.
Comparison of dynamic material properties with published literature data: (a) Young’s modulus, (b) tensile strength, (c) ultimate strain, and (d) toughness.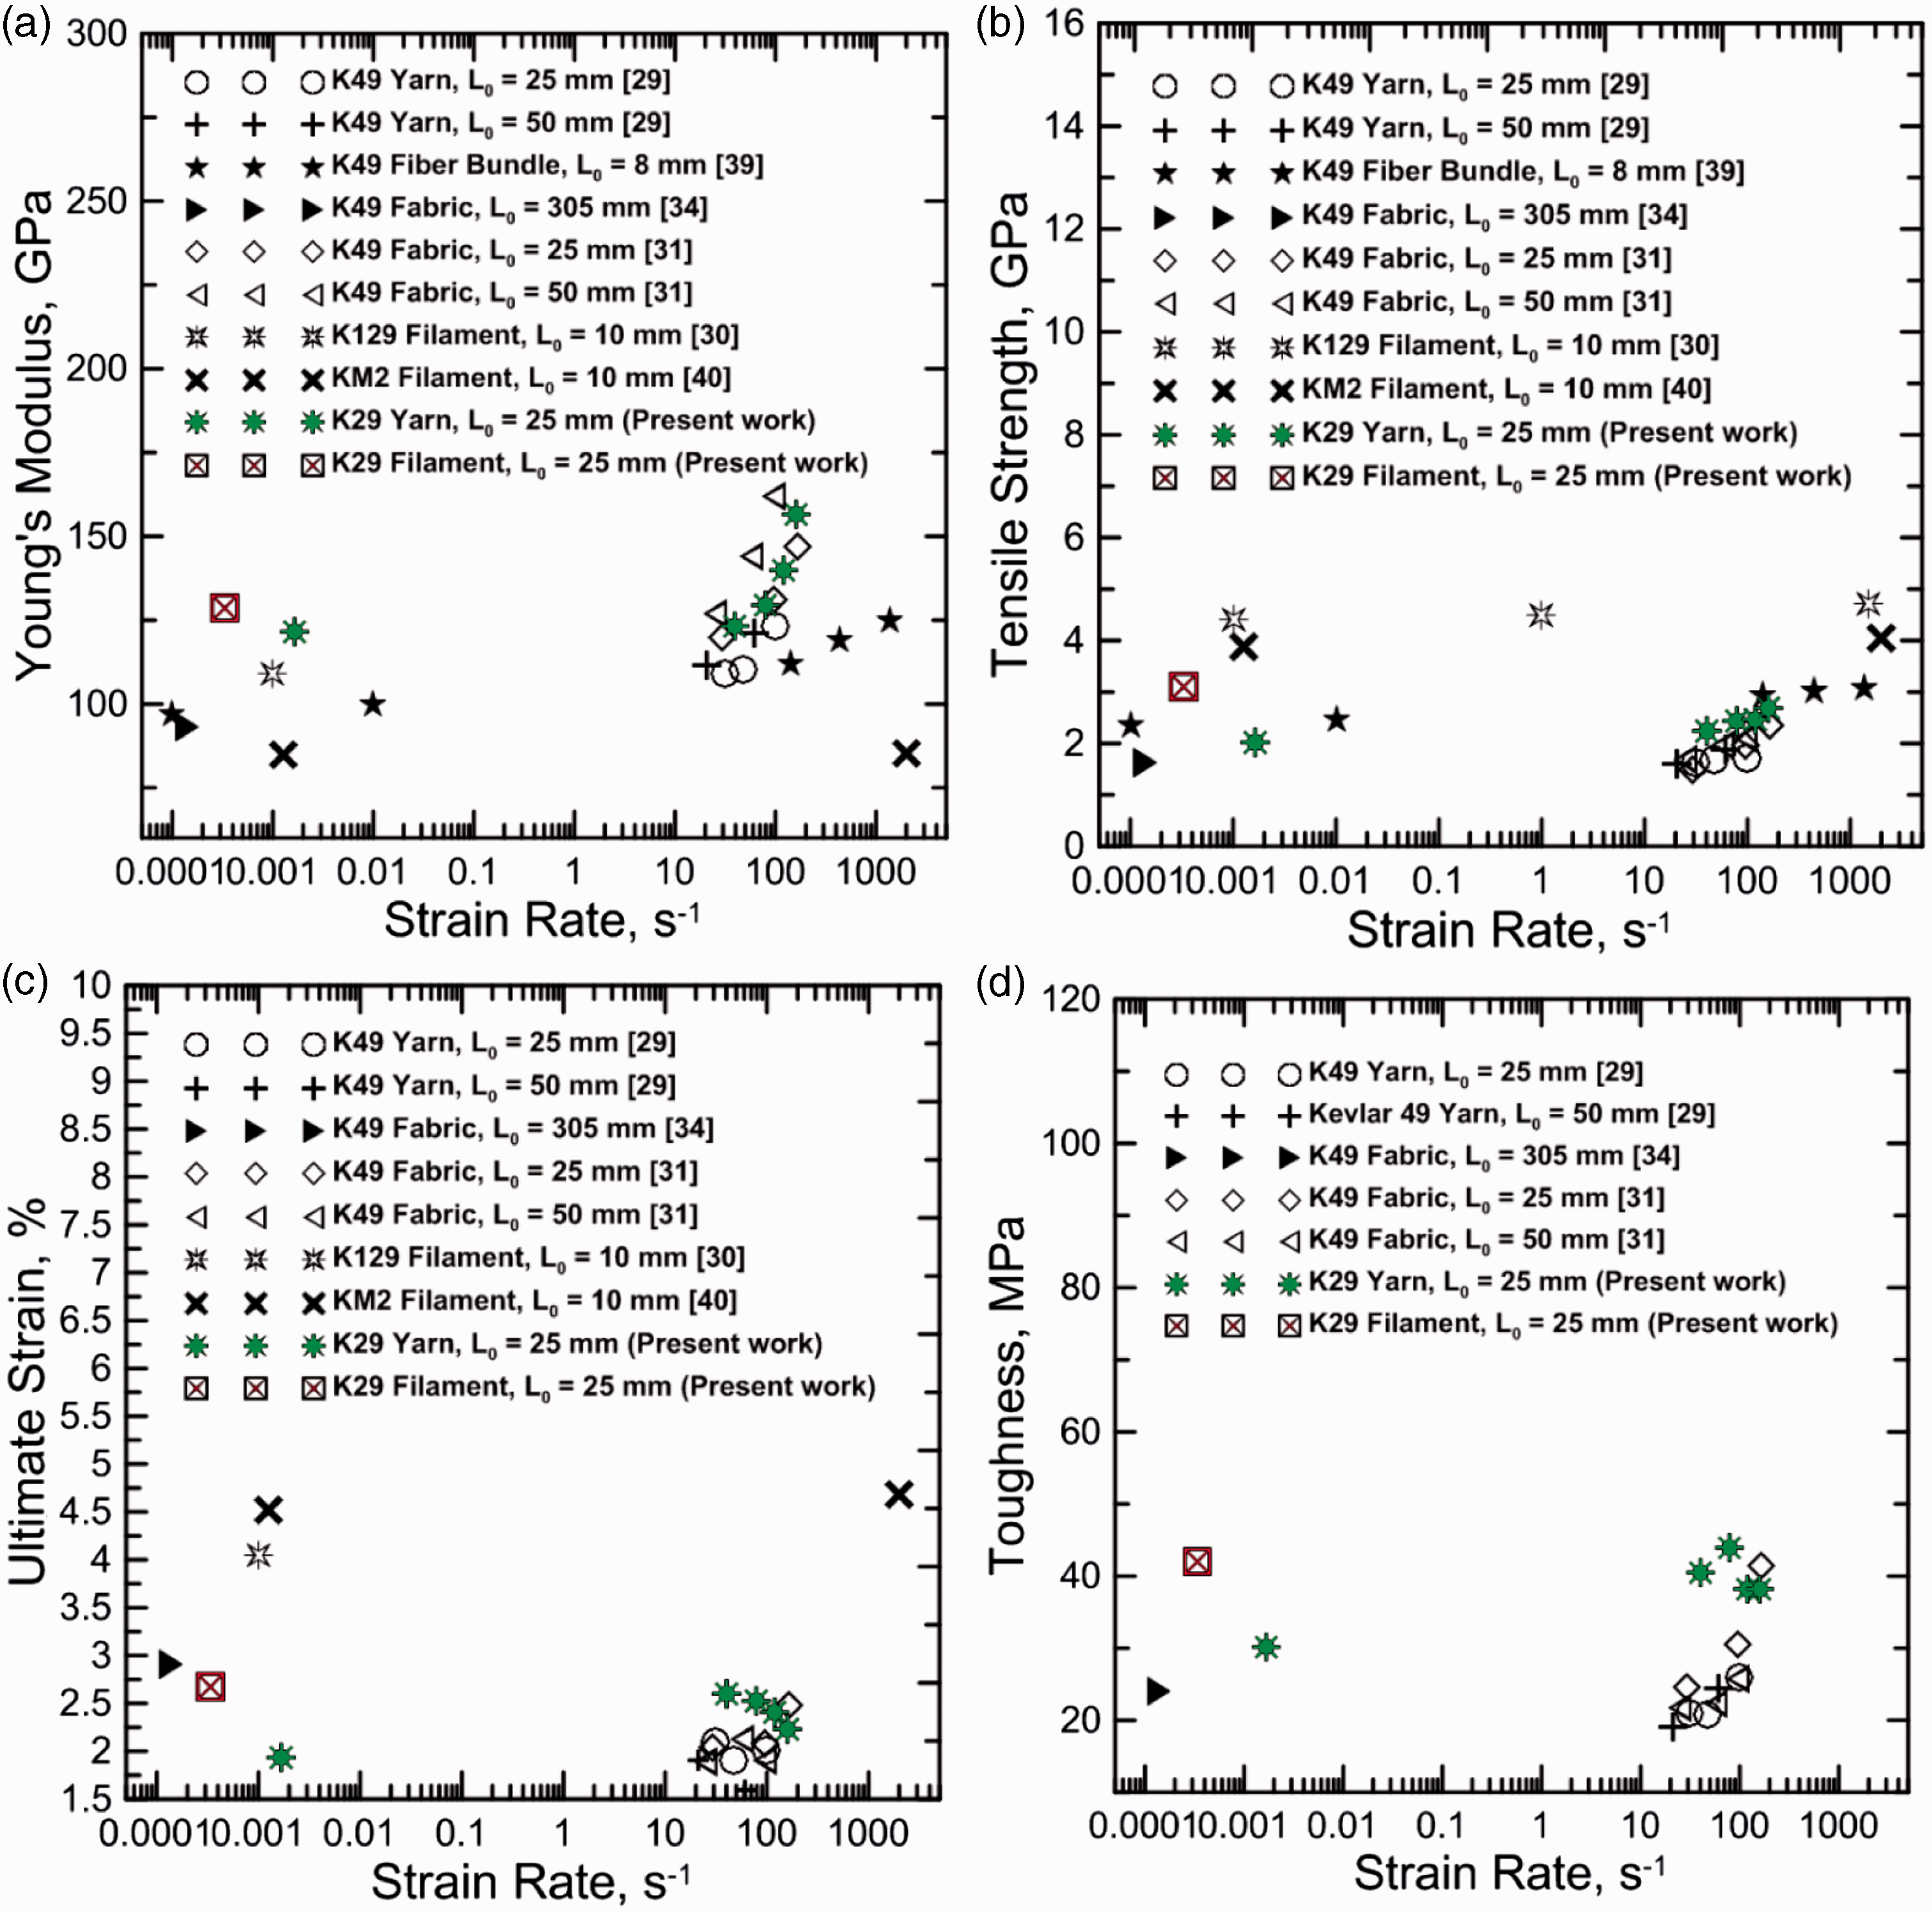
Simulation of static and dynamic behaviors
Weibull analysis
In the experiments to determine the tensile strengths of fibers and yarns, considerable scatters in the results are usually observed as discussed above. Several statistical distributions have been used to describe this variation with the Weibull analysis as the most widely used approach for explaining the variation in the strength of fiber or fiber bundle.28,41,42 The basic form of the two-parameter Weibull equation for cumulative probability density is


Weibull parameters are obtained for each set of quasi-static and dynamic tests using a graphical linear fit to the linearized form of the two-parameter Weibull probability function,
Comparison of cumulative failure probability vs. tensile strength of Kevlar® 29: (a) filaments with different gage length; (b) yarns with different gage length; (c) strain rates; and (d) directions.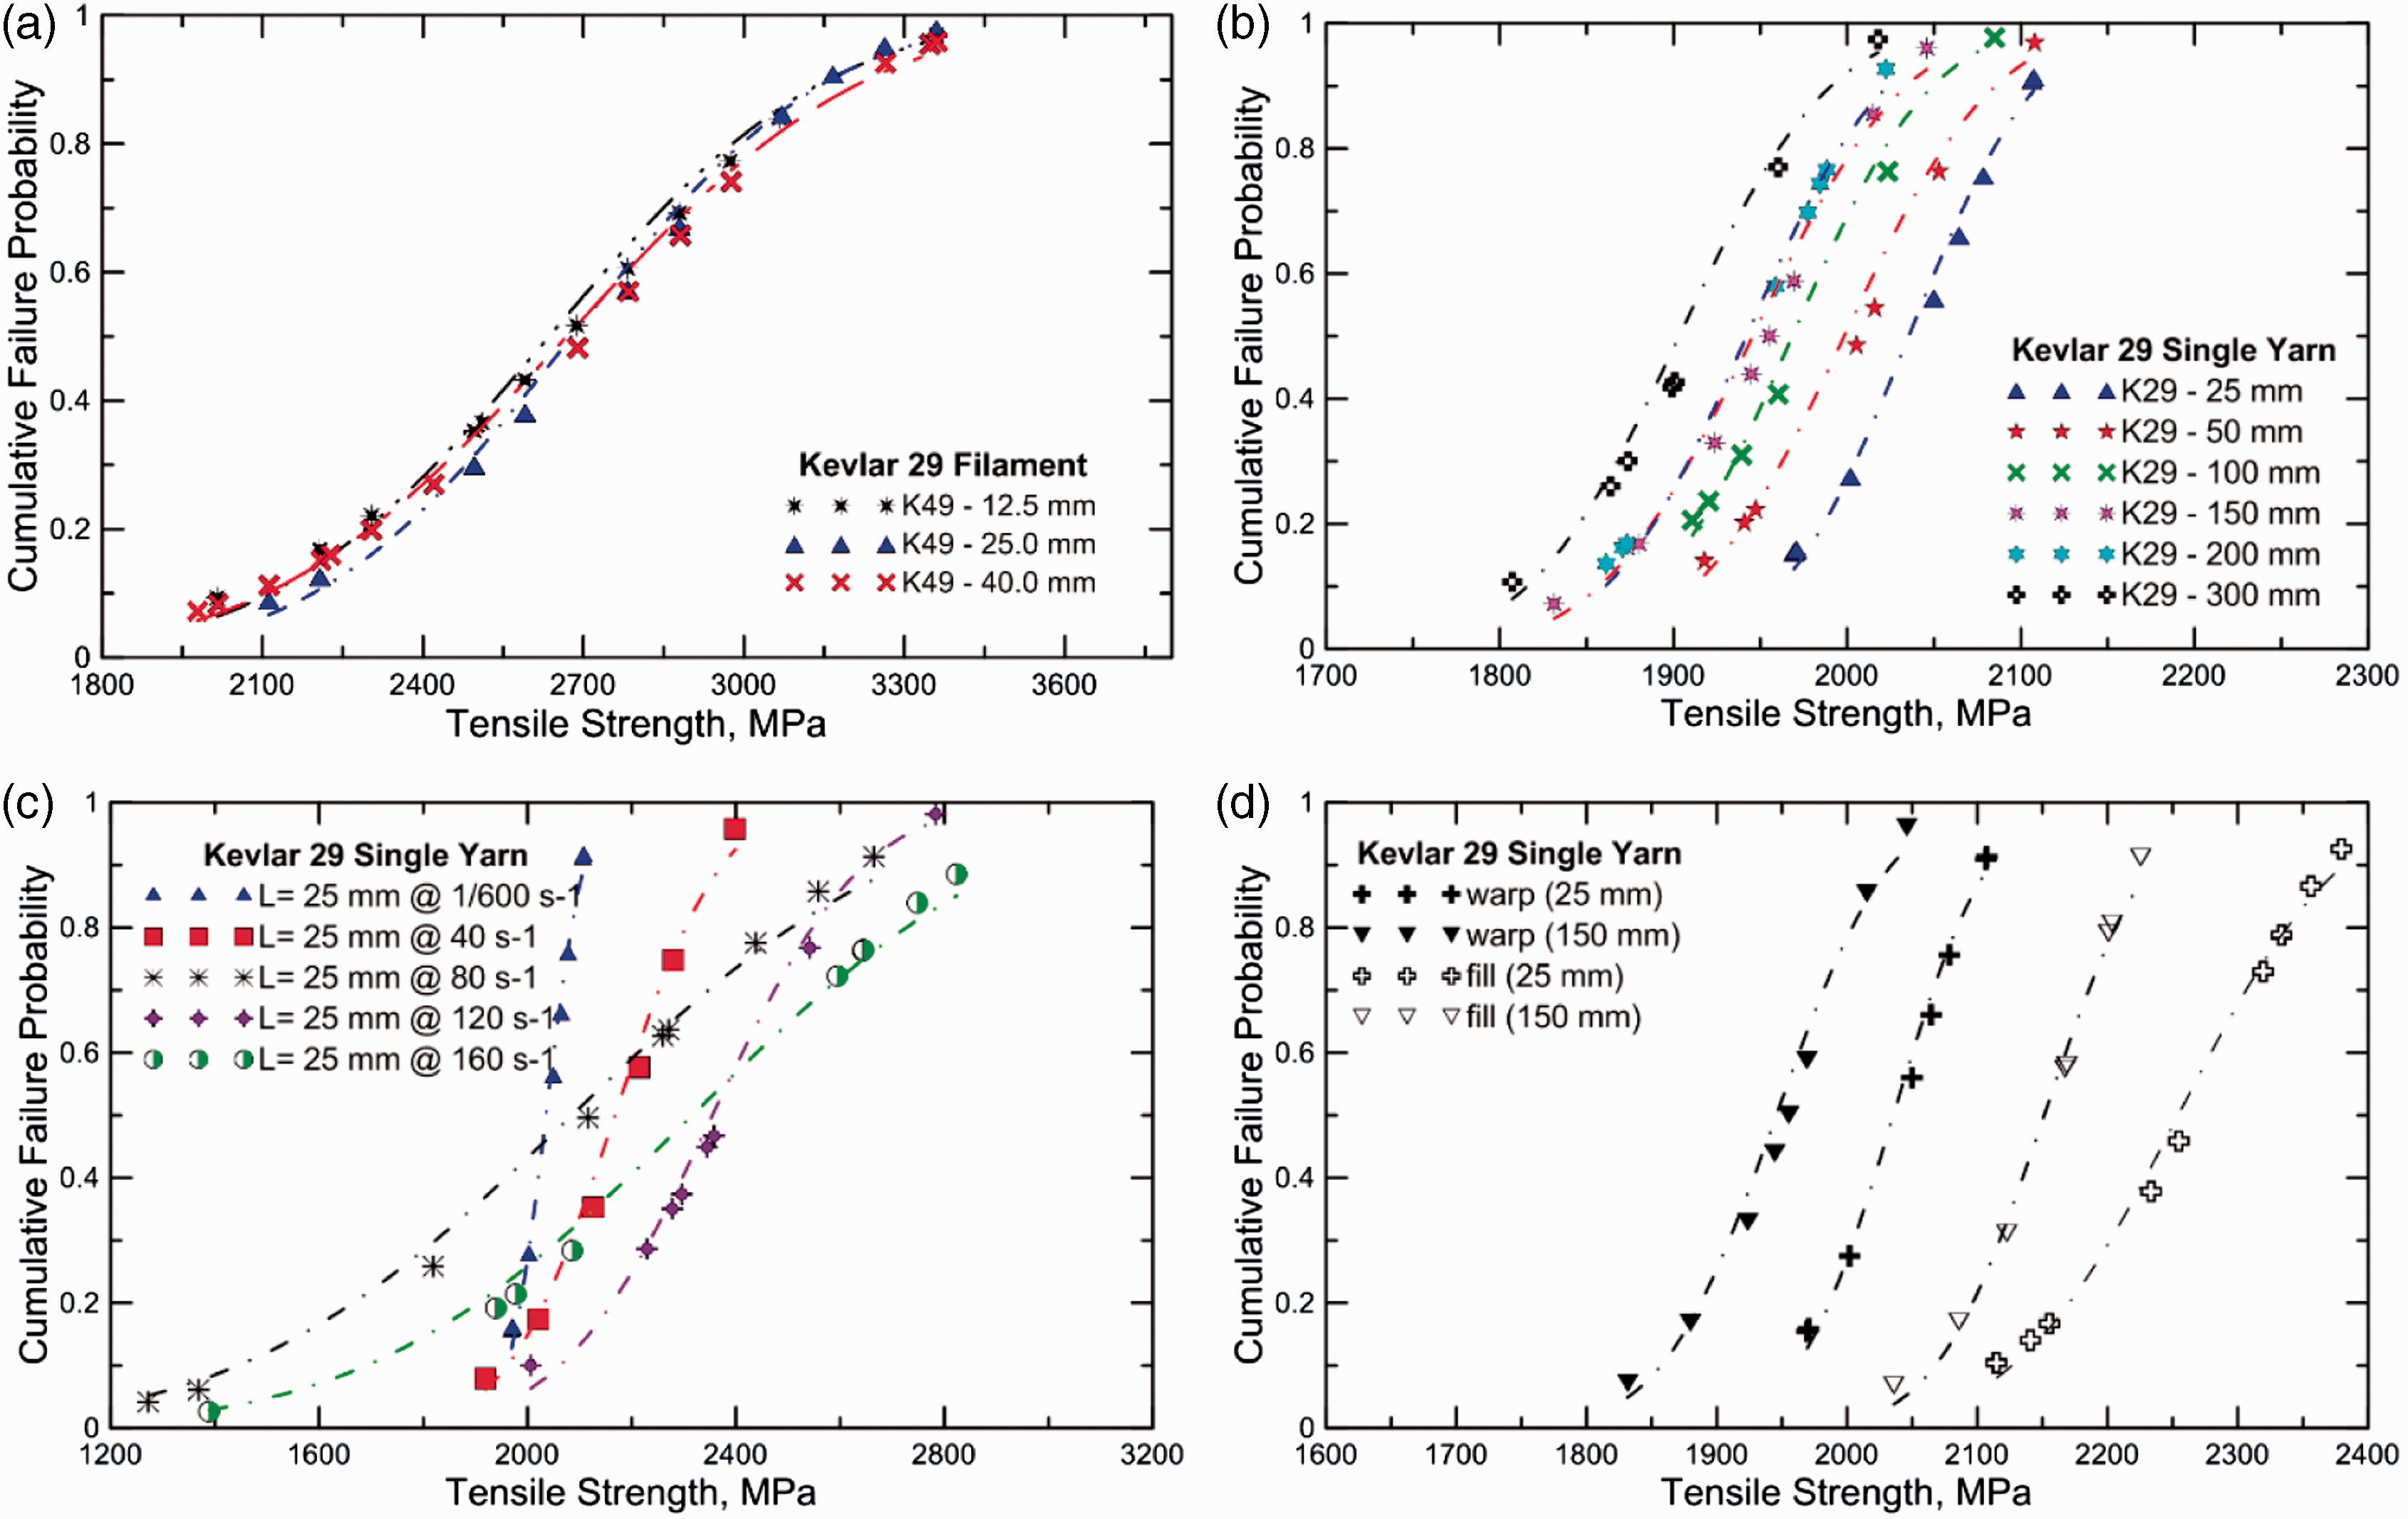


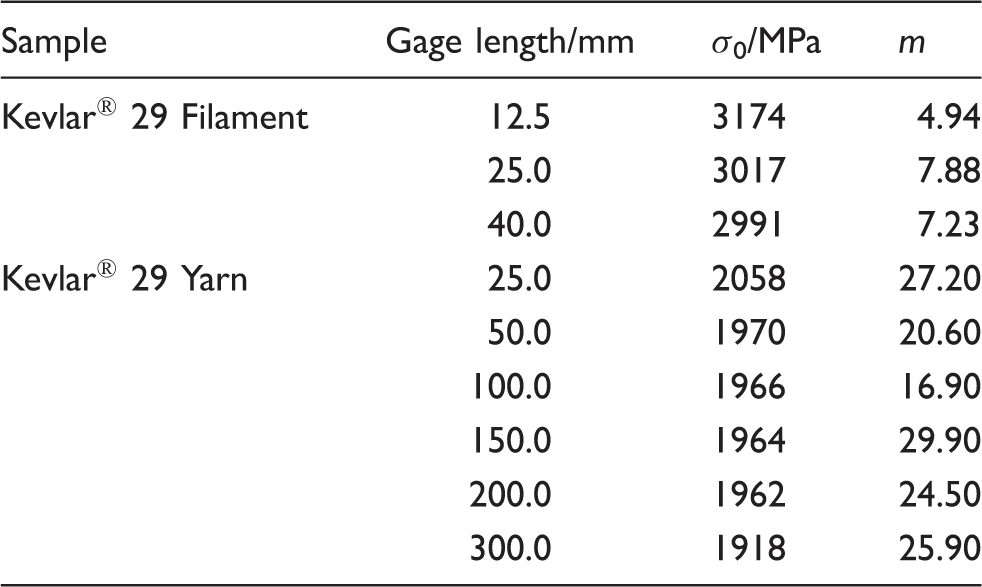
Weibull parameters for tensile strength of Kevlar® 29 single filament and yarn with different gage lengths.
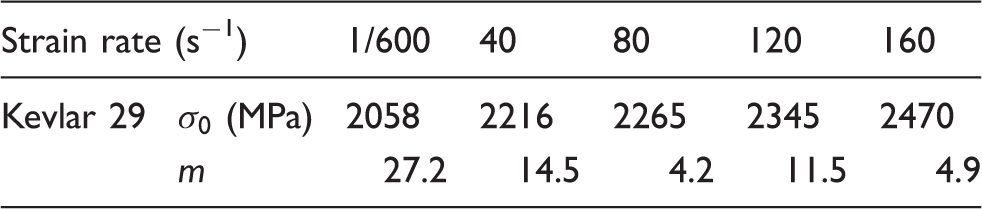
Weibull parameters for tensile strength of Kevlar® 29 yarn with 25 mm gage length at different strain rates.
Analytical model
Based on the orthotropic material behavior, a two-dimensional analytical model was developed, 43 which is also briefly discussed as following.
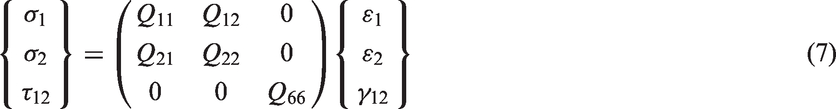
Under plane stress conditions, the stress–strain relation is given by


Simulation results
Based on the Weibull parameters ( Model fitting and experimental stress–strain responses of yarn-specimens with gage lengths of (a) 25, (b) 50, (c) 100, (d) 150, (e) 200, and (f) 300 mm under quasi-static tensile loading.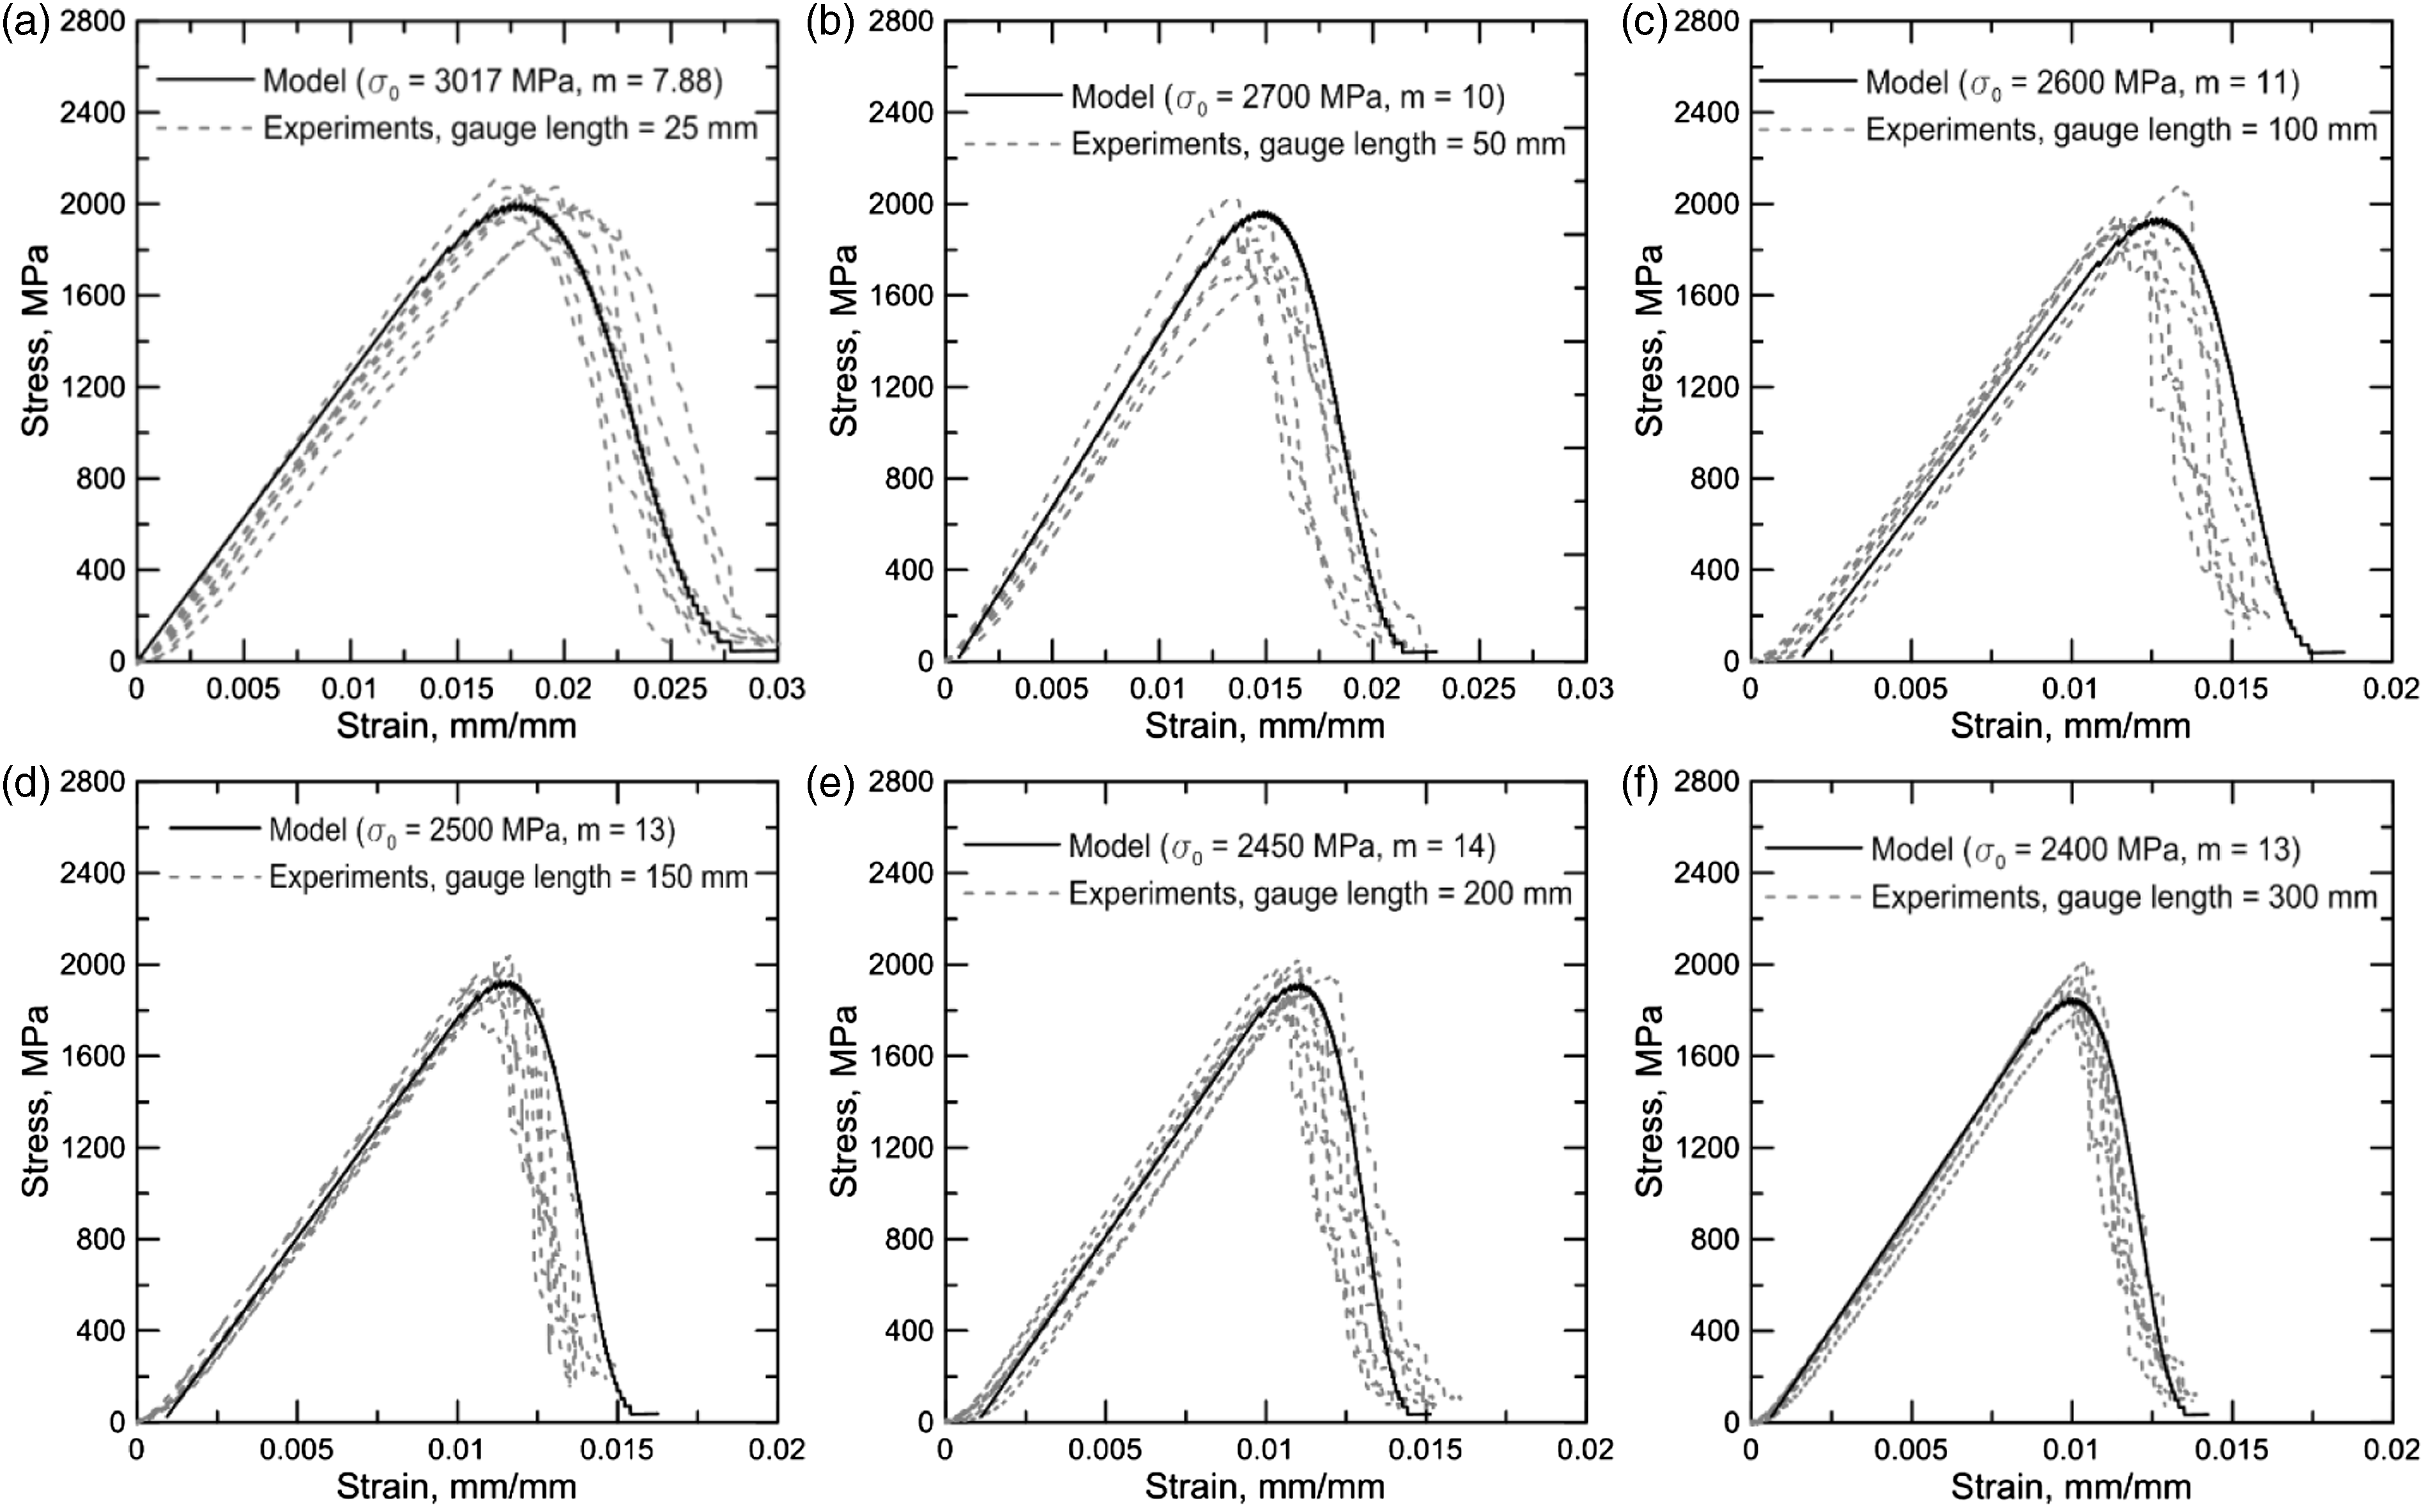
It usually requires dozens of tests on single filaments to obtain Weibull parameters, which needs special equipment and is also time consuming. This number of tests can take weeks to months of careful sample preparation and analysis.
44
In addition, separating the filaments from the bundle would introduce damage that would change the parameters’ values which do not represent the true response of filaments.
45
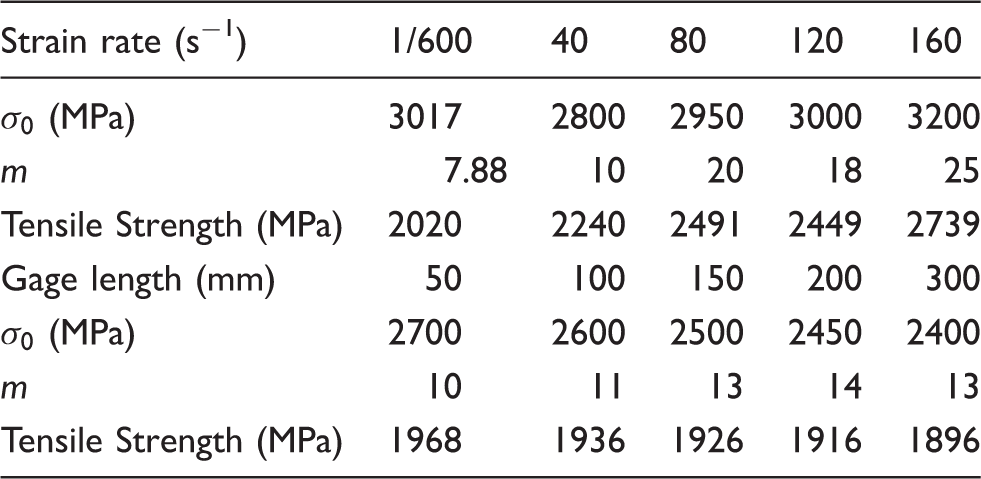
For these reasons, it is an efficient and accurate method to obtain Weibull parameters of single filaments by testing single yarns with different gage lengths or strain rates and using the analytical model which has been verified. So, we used this model to fit the stress–strain curves of single yarns with other gage lengths (except 25 mm) and high strain rates of 40, 80, 120, and 160 s−1, as showed in Figure 14(b) to (f) and Figure 15, and obtained the Weibull parameters at filament level listed in Table 3. All the Model fitting and experimental stress–strain responses of 25 mm gage length yarn specimens subjected to dynamic tensile loading at the strain rates: (a) 40, (b) 80, (c) 120, and (d) 160 s−1. Weibull parameters and tensile strengths of Kevlar® 29 single filament with different gage length and strain rates obtained by the simulations.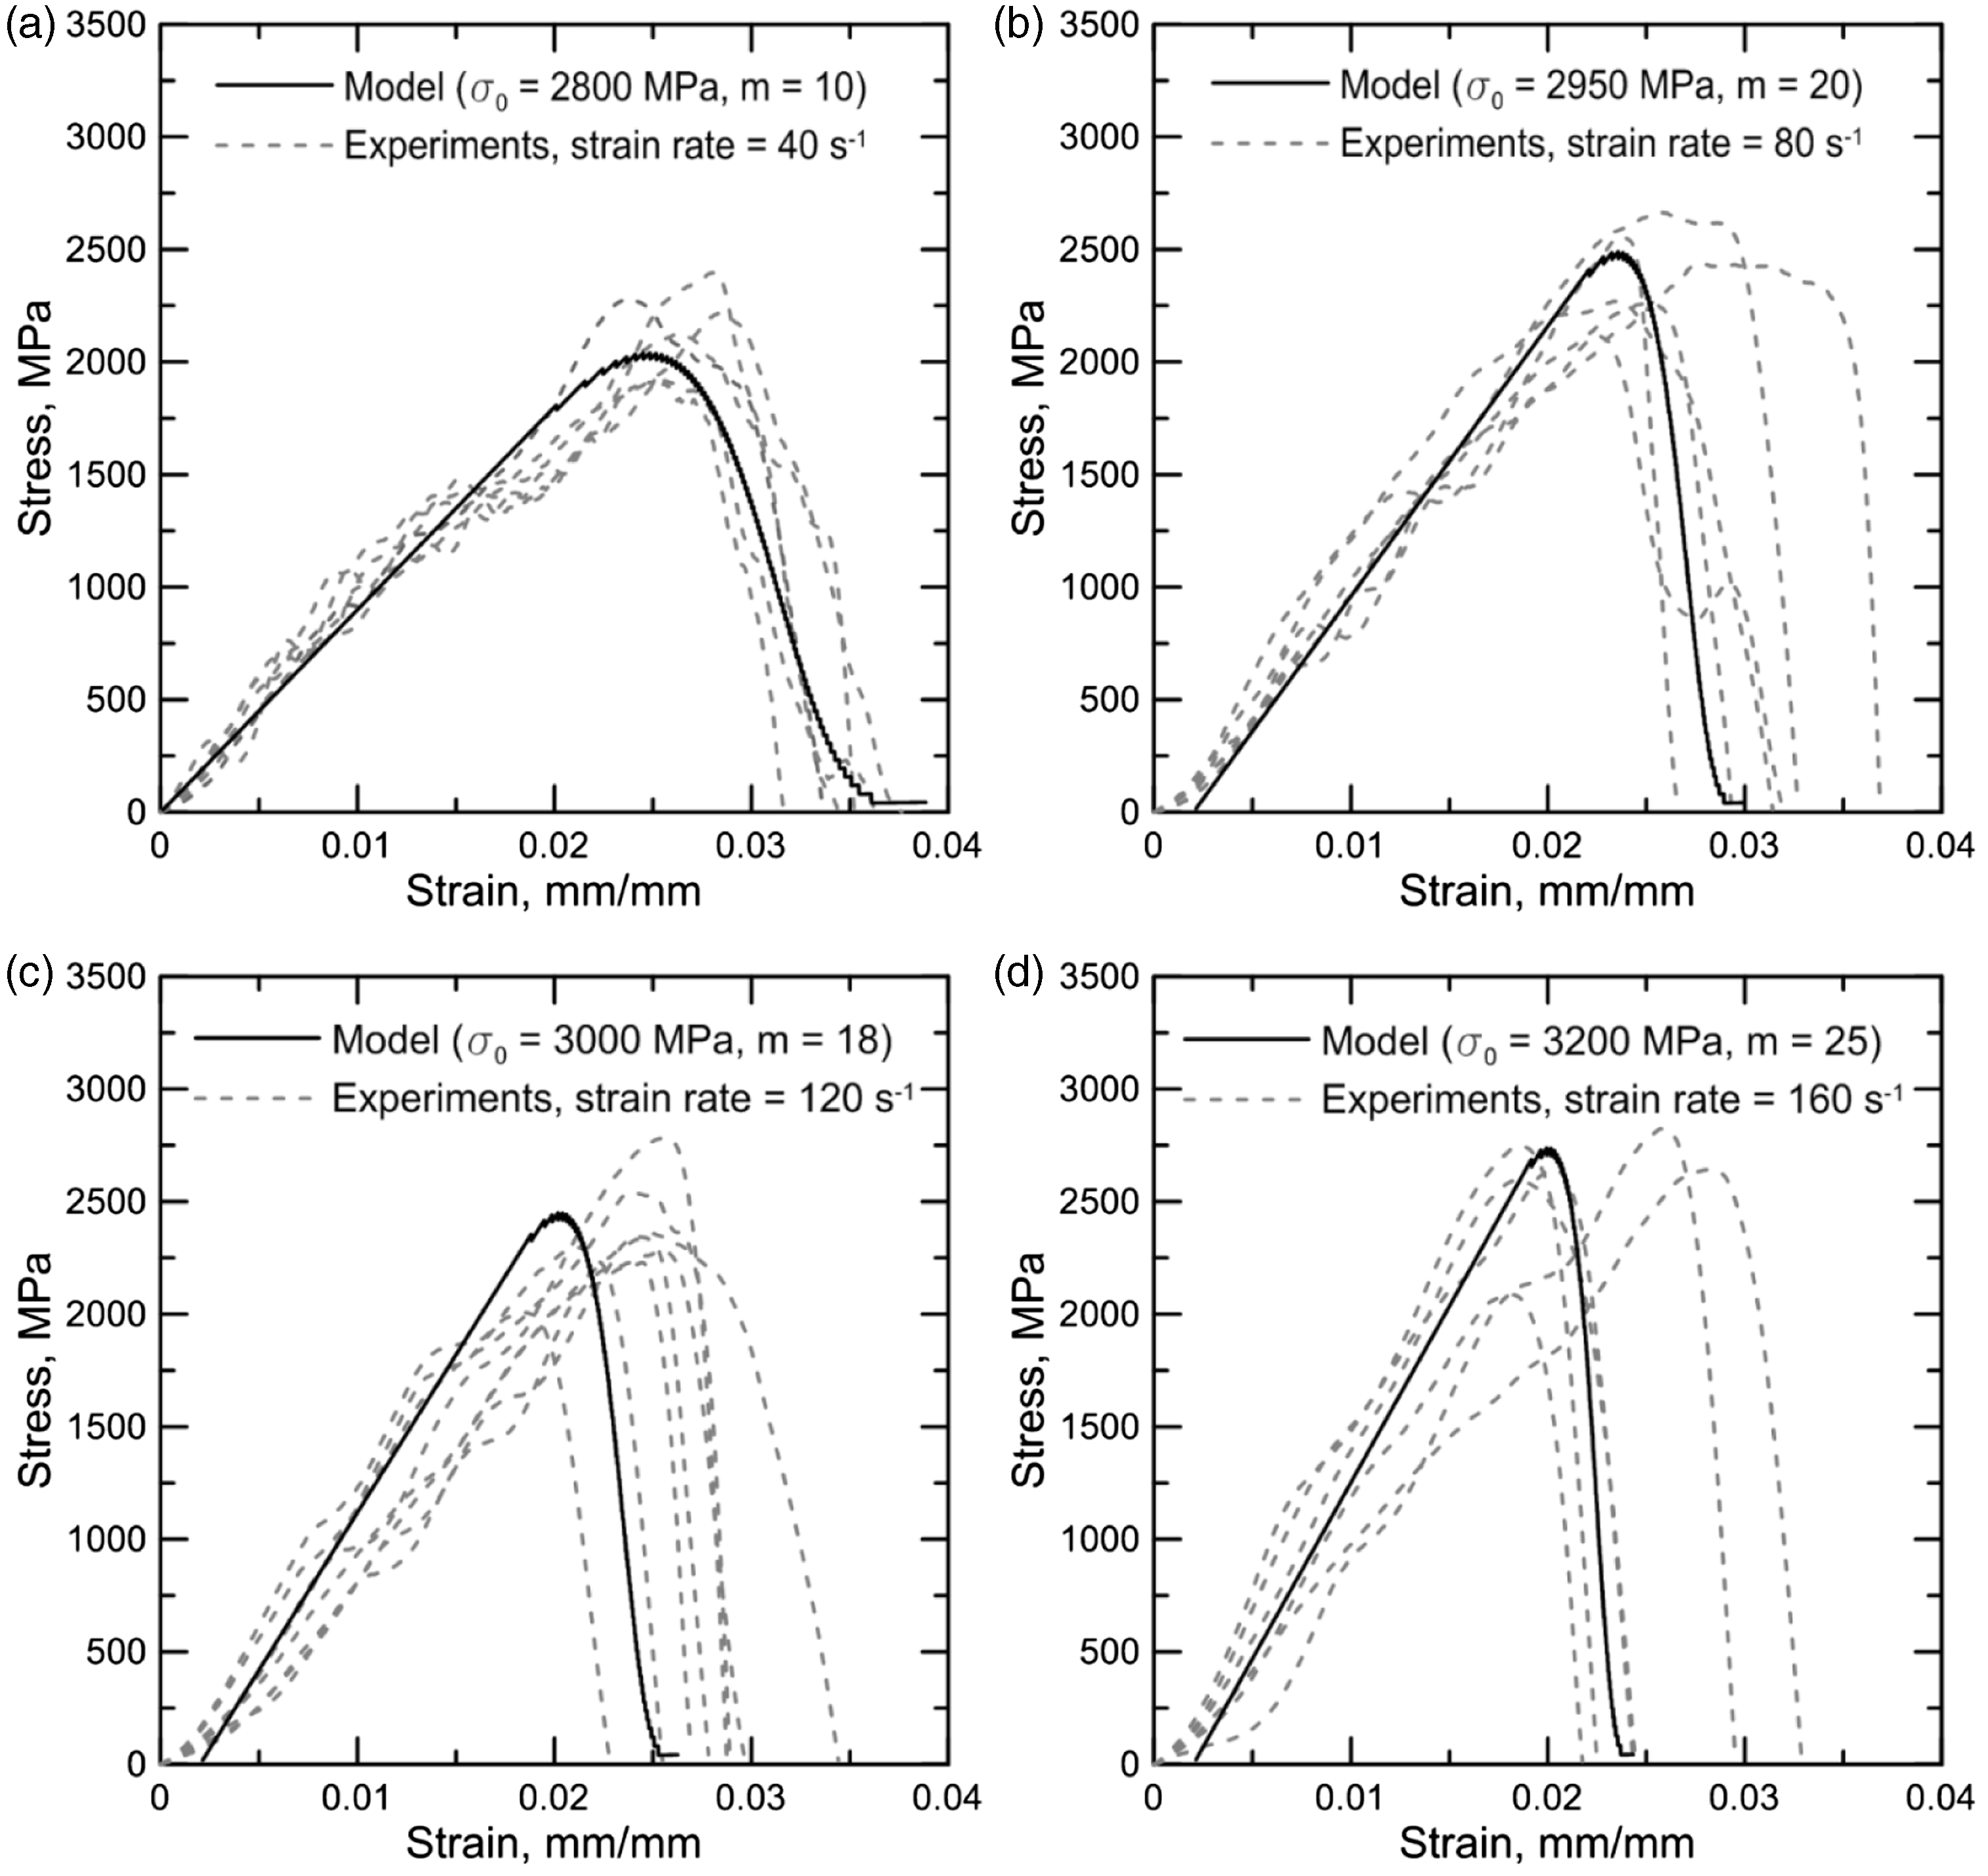
Concluding remarks
Kevlar® 29 single yarn and filament specimens with different gage lengths were tested subjected to quasi-static loading on an MTS load frame and an MTI miniature tester. In addition, yarn specimens with a gage length of 25 mm were also tested under dynamic tensile loading using an Instron drop-weight impact system over a strain rate range of 40 s−1 to 160 s−1. The effects of gage length and strain rate on the material mechanical properties, i.e., Young’s modulus, tensile strength, ultimate strain, maximum strain, and toughness of single filaments and yarns, were discussed.
Under quasi-static loading, the mechanical properties of single filaments are insensitive to gage length with a difference of less than 6%; but those of single yarns are dependent on gage length. The tensile strength, ultimate strain, and toughness decrease with increasing gage length, but Young’s modulus is in opposite trend; however, those values do not change significantly any more when the gage length is larger than 100 mm, which is the critical length for mechanical properties characterization. The tensile strength and ultimate strain of warp yarn are about 9.7% and 34.8% less than those of fill yarn, respectively, but the Young’s modulus of warp yarn is 32.9% higher than that of fill yarn. The structural scale effect is also evident since the tensile strength of single filaments is much larger than that of single yarns. Therefore, the tensile strength of single filaments cannot be scaled up directly for a yarn consisting of many fibers.
The mechanical properties of Kevlar® 29 single yarns are dependent on the strain rate over a range from 1/600 s−1 to 160 s−1. Young’s modulus and tensile strength generally increase, but ultimate strain and maximum strain decrease with increasing strain rate. The toughness increases first up to the strain rate of 80 s−1, and then decrease due to the fact that the ultimate strain decreases at higher strain rates although the tensile strength increases slightly.
Weibull analysis was used to quantify the degree of variability in tensile strengths of single filaments and yarns at different gage lengths and strain rates. The m values of single filaments are lower than those of single yarns with same gage length, which manifests a more random failure distribution in single filaments than single yarns. Moreover, the m values of single yarns under quasi-static loading are higher than those under dynamic loading, which indicates more scatters in the experimental results at higher strain rates.
The obtained Weibull parameters were used in the analytical model considering the probabilistic failure of filaments to simulate the stress–strain response of single yarn. By fitting the experimental curves of single yarns at other gage lengths and strain rates, the Weibull parameters of single filaments are obtained for the corresponding gage length and strain rates. By comparing the
Footnotes
Declaration of Conflicting Interests
The author(s) declared no potential conflicts of interest with respect to the research, authorship, and/or publication of this article.
Funding
The author(s) disclosed receipt of the following financial support for the research, authorship, and/or publication of this article: This work was supported by the funds from National Basic Research Program of China (973 program, Grant No. 2012CB026200); the Sci-Tech Support Plan of Hunan Province (Grant No. 2014WK2026) and the Interdisciplinary Research Project of Hunan University.