
Abstract
There is an emerging interest in the aerospace industry to manufacture components with intricate geometries using discontinuous-fibre carbon/polyether-ether-ketone moulding systems (obtained by cutting unidirectional tape into strands). Great formability and high modulus can be achieved with this type of composites, but the high variability of measured properties can have a detrimental effect on the design allowables. When it comes to prediction of mechanical properties, it is important to capture the average strength and modulus as well as their statistical variability. This article proposes a stochastic finite element technique that uses the concept of randomly oriented strands to model variability, and the application of Hashin’s failure criteria and fracture energies to estimate strength. Overall, the model matches the trends observed during experiments and shows that strength of randomly oriented strand composites is significantly lower than that of continuous-fibre laminates due to the ‘weakest-link’ principle.
Keywords
Introduction
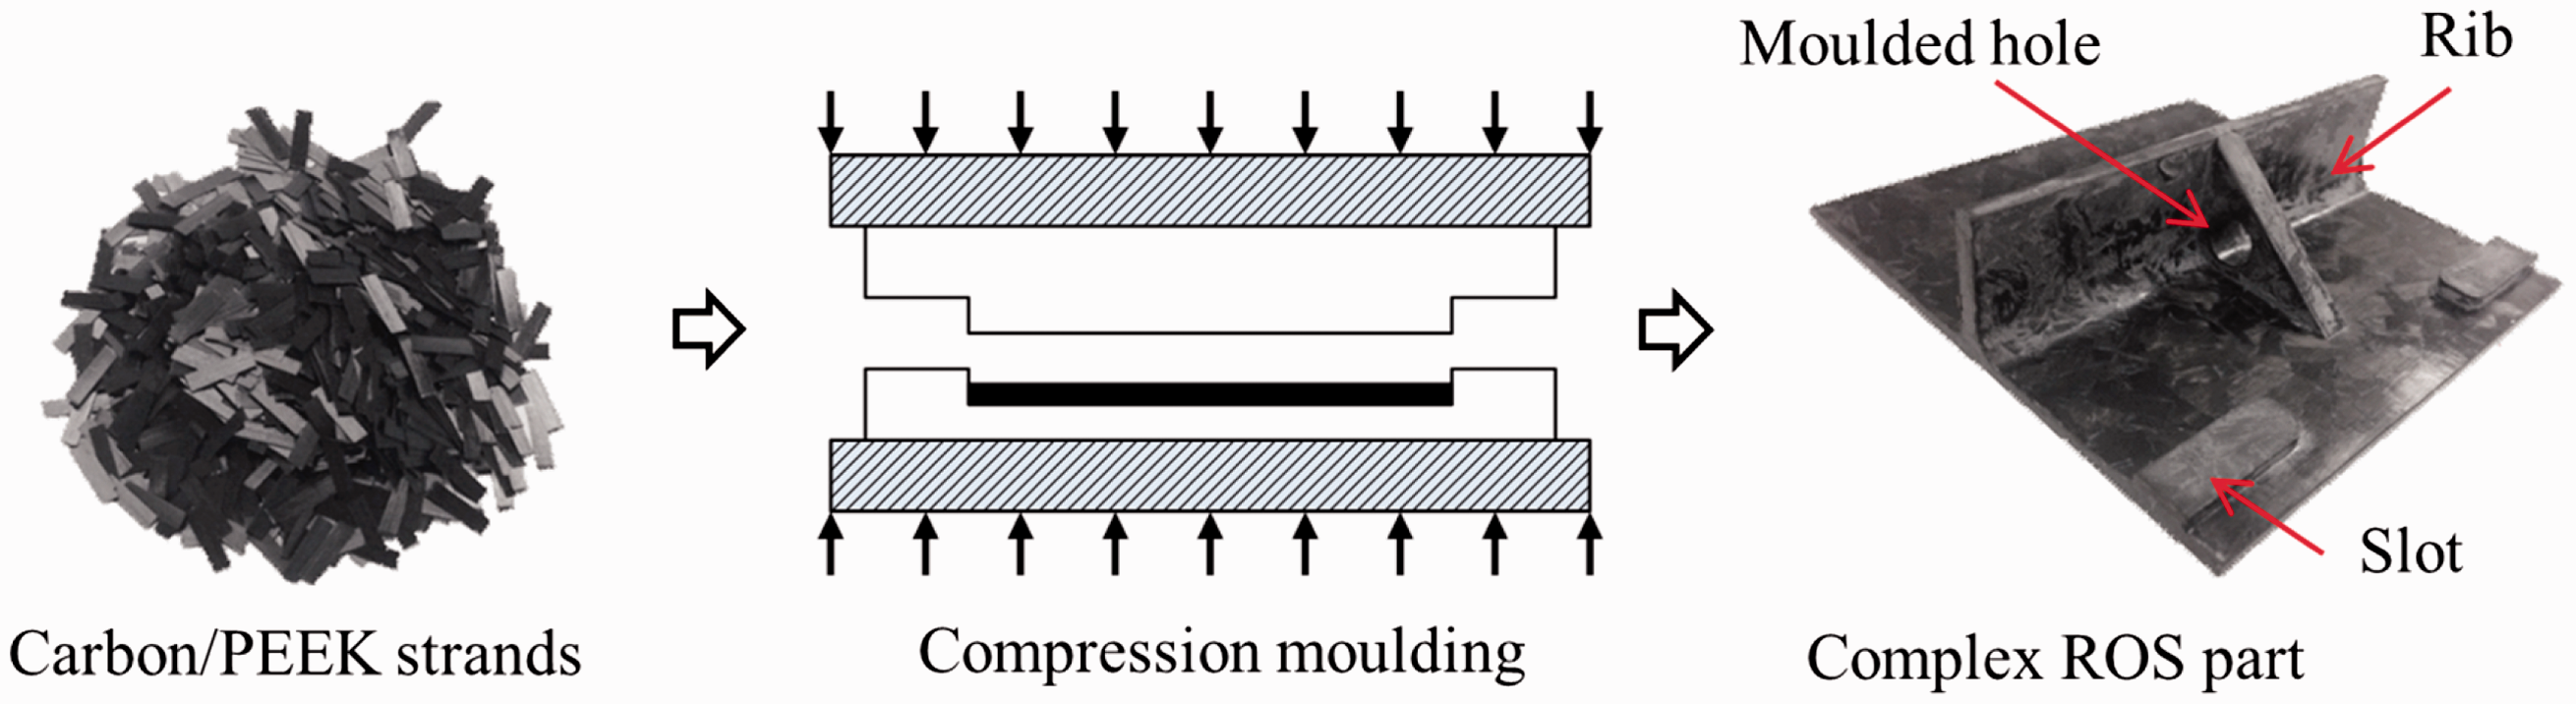
There is an emerging interest in the aerospace industry in manufacturing components with intricate features, such as ribs, using discontinuous-fibre (CF) composite materials. The conventionally used CF composites are difficult to form, while the short fibre preforms used by the automotive industry lack the required mechanical properties. Material systems with long discontinuous-fibres and high fibre volume fraction have the potential of filling the niche between the formability of short fibre preforms and the performance of CF composites. A candidate material system is composed of Randomly Oriented Strands (ROS) that can be used in compression moulding, as shown in Figure 1. This type of material is commercially available from material suppliers, such as Hexcel (HexMC™ with thermoset matrix) and TenCate (Cetex® MC1200 with thermoplastic matrix). The feasibility of moulding complex components from ROS composites has been demonstrated by Greene, Tweed
2
and Cross Composite AG.
3
ROS composites were found to be an attractive alternative to metals, because they do not corrode and are lighter and cheaper to manufacture.
3
However, only a limited number of studies found in the literature discuss processability and mechanical properties of these materials. A new multi-disciplinary study4–8 is being conducted to systematically evaluate, characterize and model the moulding process and mechanical properties of composites manufactured from carbon/polyether-ether-ketone (PEEK) ROS.
Manufacturing process of ROS parts.
1
Literature review
Mechanical properties of ROS composites
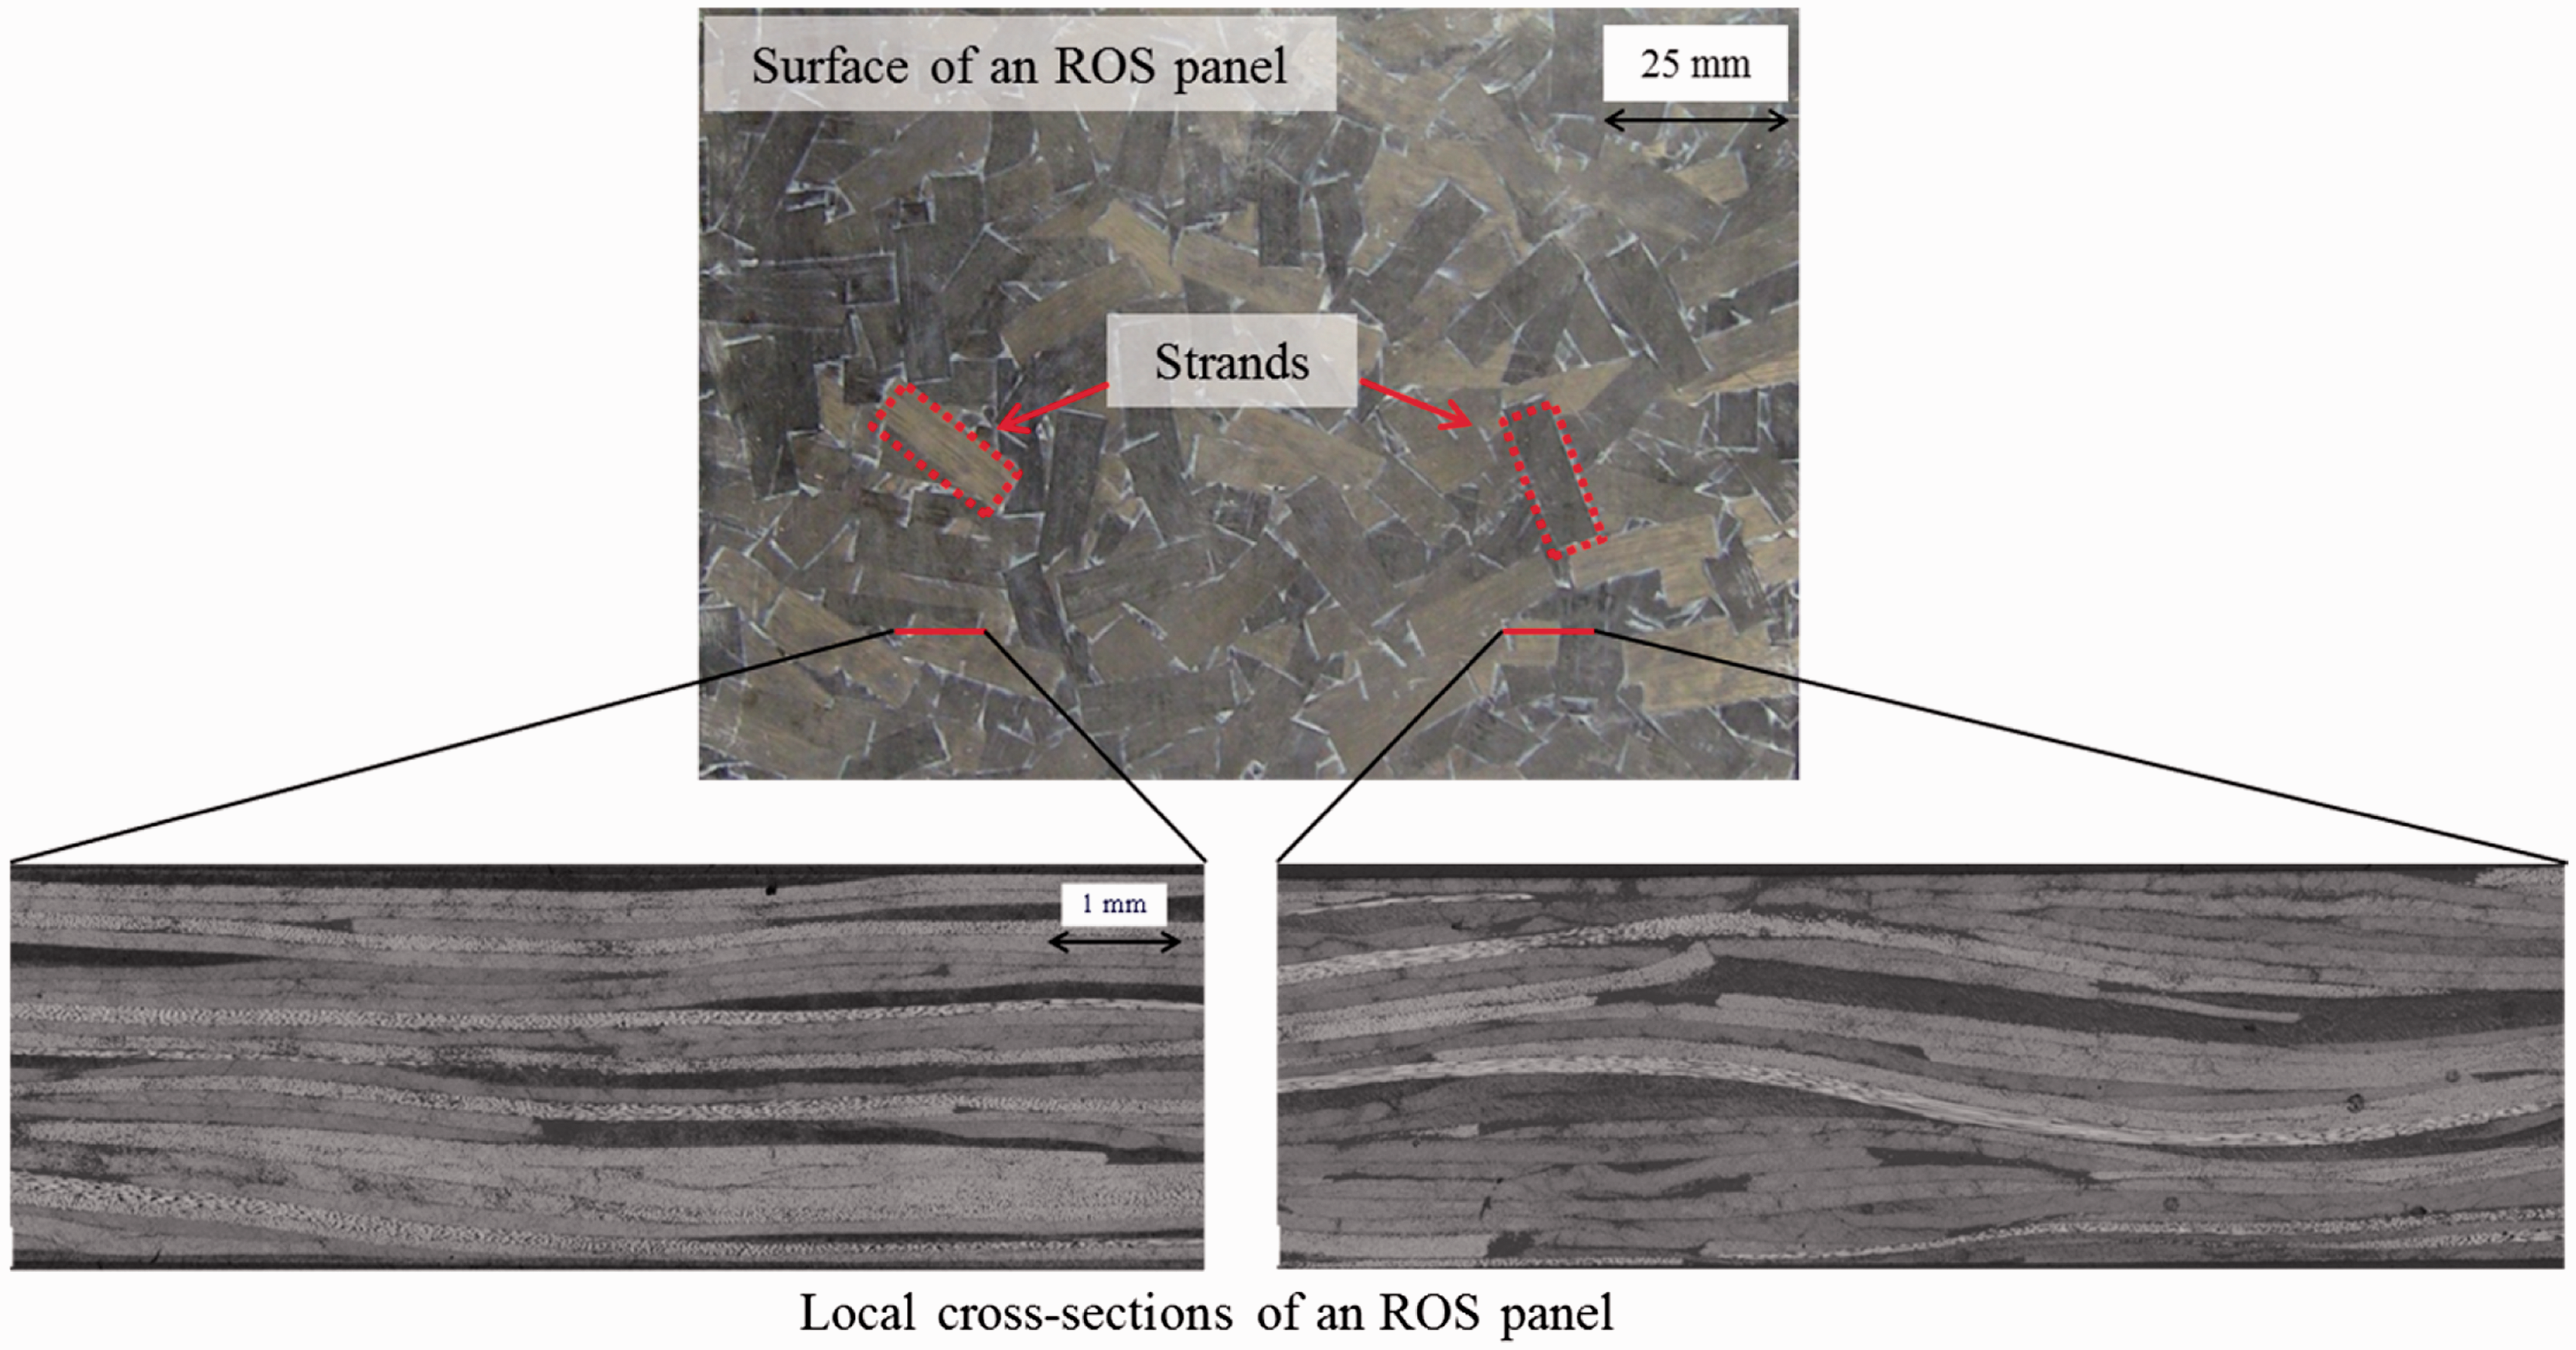
Recent studies investigated mechanical properties,9–12 demonstrated design potential3,9,13,14 and proposed modelling techniques9,15,16 of ROS composites. In comparison with CF and other short fibre composites, ROS composites are characterized by a distinct mesostructure, which is shown in Figure 2. Locally, the microstructure of the material resembles a laminate. However, the apparent layup varies from one location to the other, because the strand size (2–7 cm in length) is relatively large in comparison with the panel (or part) size (10–30 cm) and homogeneity of the material is not attained.
Mesostructure and microstructure of an ROS panel.
5
Feraboli et al. 12 conducted an extensive investigation of mechanical properties of carbon/epoxy ROS composites. They found that strength increased with longer strand lengths but was significantly lower than that of quasi-isotropic CF composites. Modulus showed little dependence on length and was almost as high as that of CF composites. Interestingly, damage propagation appeared to be uninfluenced by microstructural defects, such as voids and resin rich areas. The authors attributed this behaviour to complex interaction between the strands. They also addressed the issue of variability in the modulus data by evaluating different measurement techniques, which include an extensometer, strain gauges of various lengths and the Digital Image Correlation (DIC) technique. 10 Data obtained with the DIC technique depicted large strain variation on the surface of the specimen, which makes extensometers and strain gauges, even large ones, inadequate for global strain measurement. Overall, the DIC technique was found to yield the most accurate and repeatable measurement of modulus by averaging the full-field strain values.
Modelling of ROS properties
Mechanical models that were developed thus far for ROS composites aimed to capture the global stiffness as well as its variability. Sato et al.
15
and Feraboli et al.
16
proposed 2D modelling schemes, in which a specimen was discretized into partitions (or regions) and different ply layups were assigned to each partition. Localized modulus was calculated by applying the classical laminate theory to each partition. Global modulus of the entire specimen was calculated by either analytically superimposing the effect of local moduli in the widthwise and lengthwise directions
15
or by modelling the specimen in a finite element (FE) software.
16
The latter method is shown in Figure 3. These approaches were able to capture the average modulus and its variability. However, as there is complete discontinuity between neighbouring partition layups, the strain-field is highly dependent on the partition size and large strain discontinuities occur between partitions, as illustrated in Figure 3. Moreover, the relationship between the partition size in the model and strand size in the physical specimen is inconsistent. As most strands commercially supplied have an aspect ratio (strand length divided by width) of four to eight, the square partition size does not represent well the continuity of strands sharing multiple partitions. Last, these methods were not used to calculate strength.
(a) Model of an ROS composite proposed by Feraboli in which a specimen is subdivided into regions with different layups and (b) the resultant strain-field under loading (colour map corresponds to strain variability). These images were adapted from Feraboli et al.16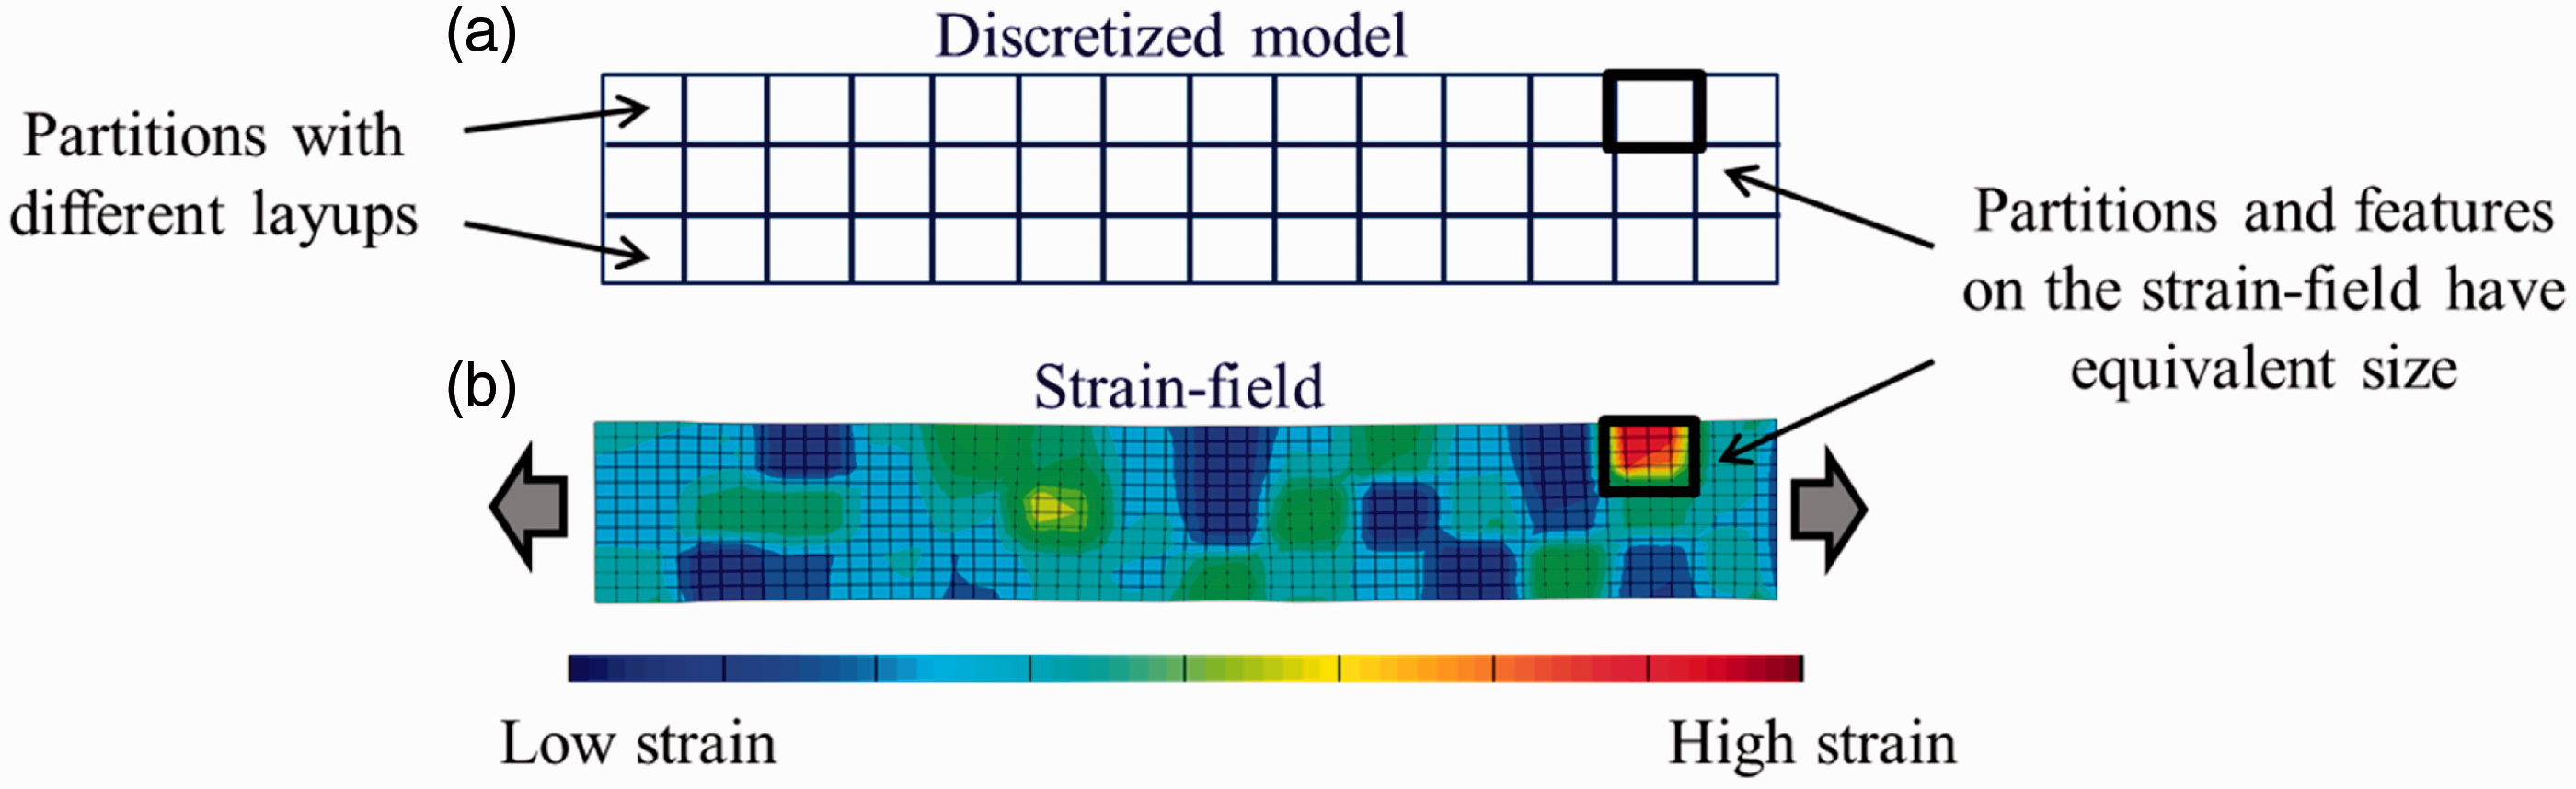
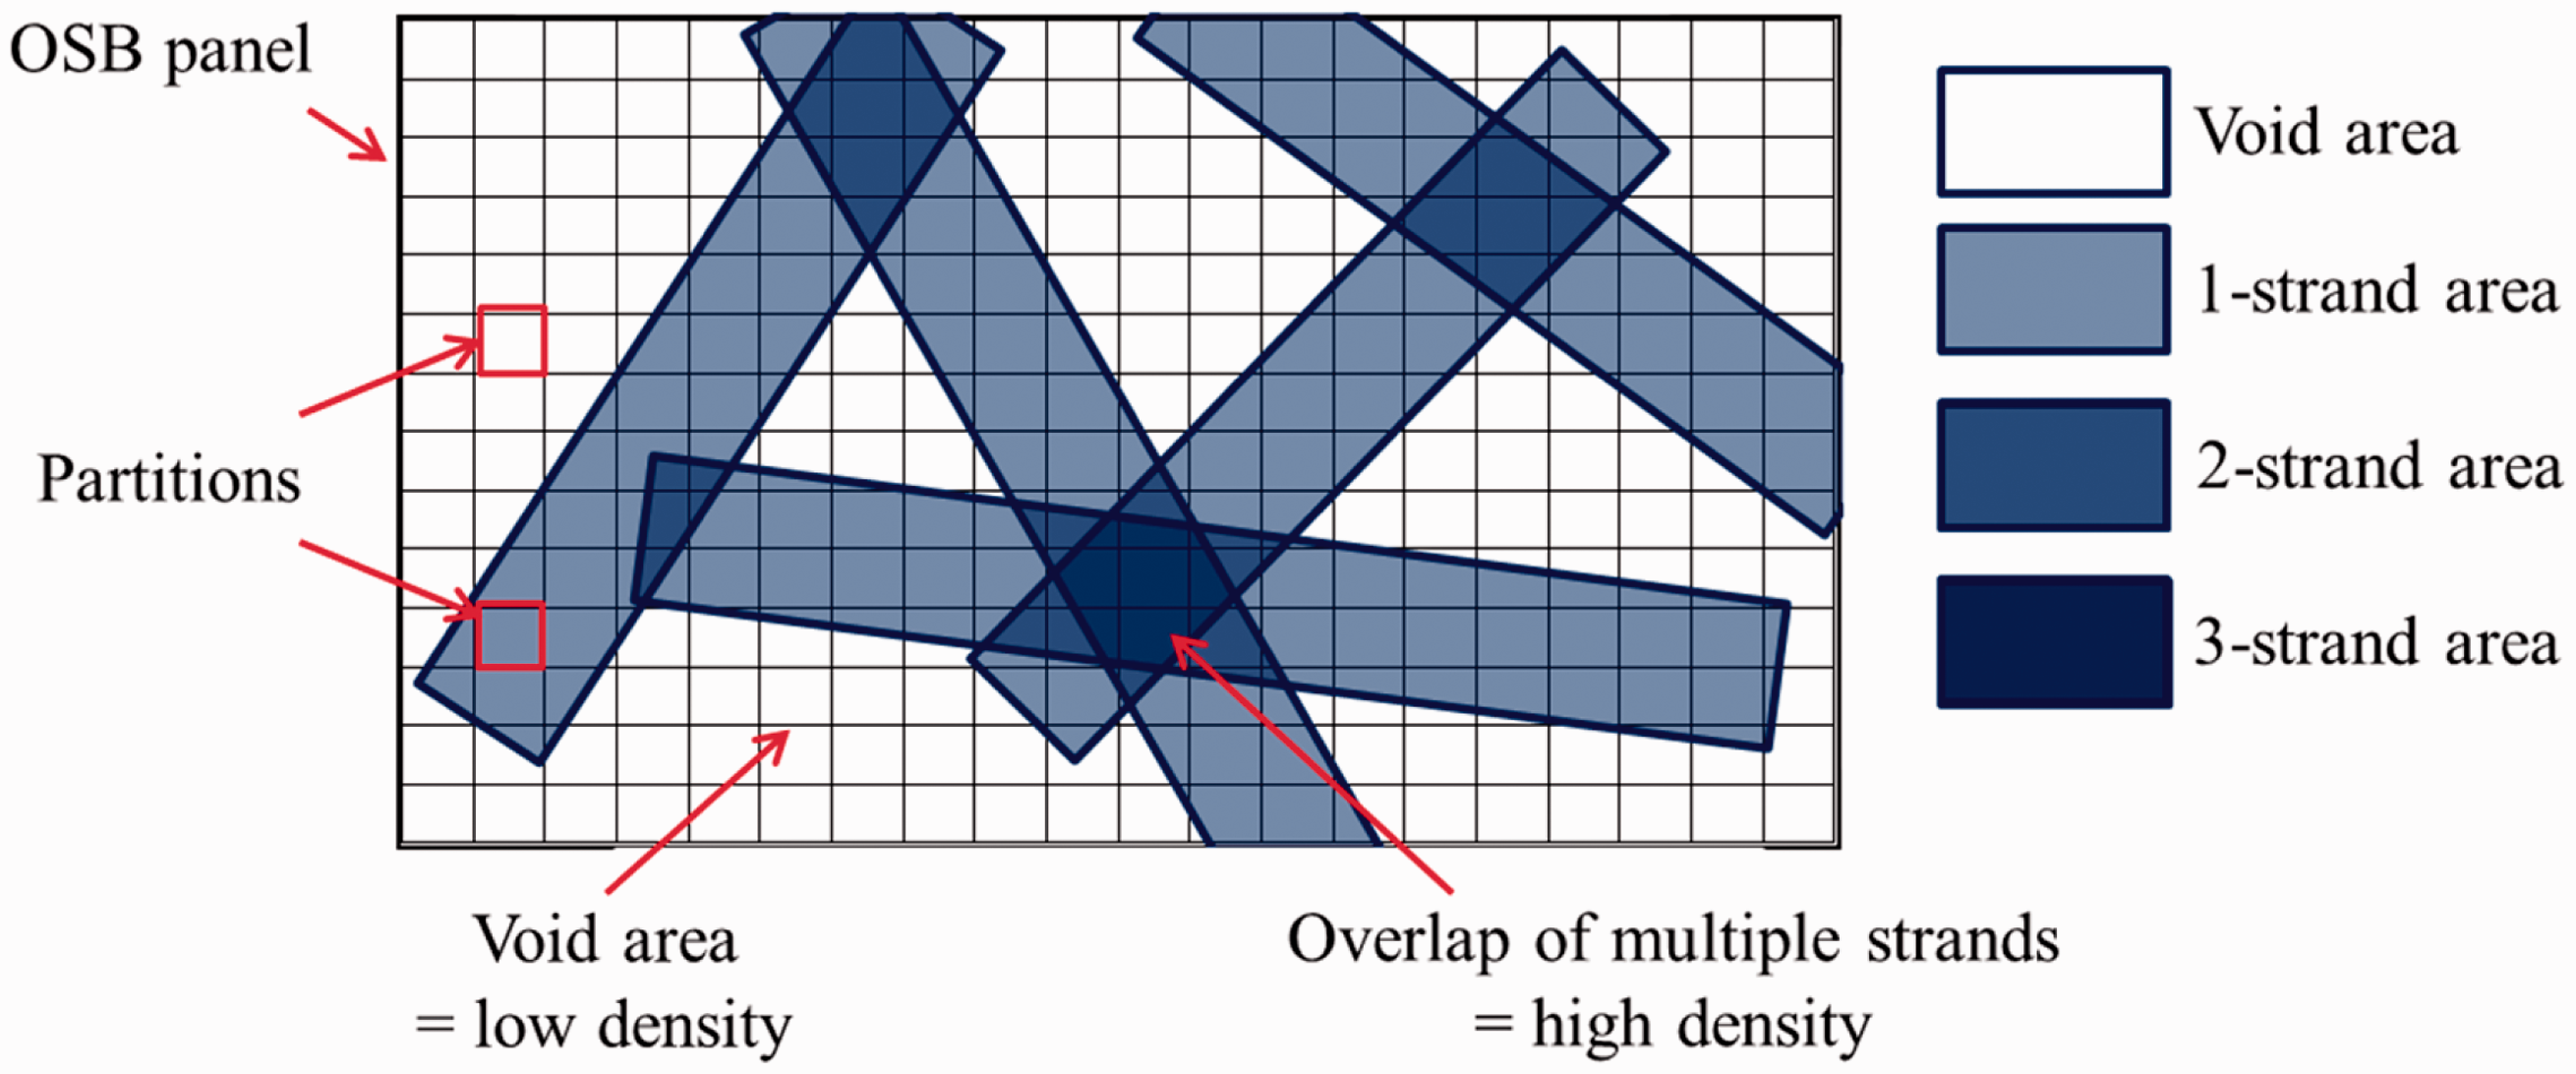
This article employs a different discretization technique, which is inspired by the models developed for Oriented Strandboard (OSB) wood-based composites. OSB and ROS composites have certain geometric similarities. Strand shape, aspect ratio and volume fraction are comparable between the two material systems. Analytical models developed for OSB panels capture the in-plane density variability in the material; density is related to strength and stiffness of OSB composites.17–19 This modelling concept and the discretization technique are depicted in Figure 4, which shows the in-plane view of a panel populated with randomly oriented and positioned strands. The overall thickness of the panel is assumed to be uniform, and hence overlap regions constitute areas of high density, whereas voids lead to low density. It can be noted that partitions in Figure 4 are smaller than the individual strands. This methodology can be summarized as follows: (a) create a network of strands by randomly generating their in-plane orientation and position within a panel, (b) calculate the total number of strands at every partition, (c) convert the number of strands in each partition into localized panel density by assuming constant strand and panel thicknesses, and (d) finally, use density to estimate the strength and the stiffness of that OSB panel.17–19 With some justification and changes, it is believed that this method of strand generation can be applied to ROS composites to generate a layup, which captures the variability of ROS while taking into account strand size.
Method for determining spatial density variability in an OSB panel (adapted from Dai and Steiner.
17
).
Over the years, a number of models were developed to predict failure of composite materials, such as Hashin’s, Tsai-Wu, quadratic and max stress or strain failure criteria. In these models, stresses or strains are considered on the ply-level and are compared with the strength parameters of each ply. While these models have certain limitations, they are still relevant to engineering because of their reasonable accuracy and ease of implementation. While no papers were found that deal specifically with strength modelling of ROS composites, Naderi and Khonsari 20 considered the variability of properties of CF laminates to capture arbitrary crack growth in an open-hole tensile specimen. Random stochastic properties were assigned to elements based on the Gaussian distribution function with 1% variation. Failure initiation and propagation were modelled with Hashin’s failure criteria and fracture energy evolution law. In this work, the strength modelling of ROS is developed using failure initiation and propagation methods 20 coupling with the Hashin’s failure criteria.
To this day, no model can predict the strength of ROS composites from the properties of the constituents. Although the variability of modulus could be captured, 16 a number of important factors such as the discontinuities in the strain-field, the undesired coupling between partition size and strain-field was not reported. In addition, the existing models suffer from the limitations of representing actual strand sizes, which renders them unsuitable for strength modelling. This article presents a new modelling technique that includes strength modelling and provides an improvement over the existing stiffness model by ensuring that results are independent of the partition size, while capturing the variability inherent to the random strand orientation.
Modelling
Overview
In this article, a 2D model is created to determine the in-plane properties of ROS specimens. The specimen is modelled as a flat plate with geometry of a typical tensile specimen. Strands are assumed to have random in-plane orientation and their out-of-plane orientation is ignored. These assumptions will be further discussed in the ‘Scope and assumptions’ section. The outline of the proposed 2D modelling scheme is summarized in Figure 5. The modelled specimen is populated with randomly oriented and positioned strands to account for the variability in the ROS microstructure, as shown in Figure 5 (step 1). This network of strands is then discretized using partitions and each partition contains information about the local layup, as shown in Figure 5 (step 2). Since layups that are assigned to each partition result from the random strand placement, some partitions will have more layers of strands than others. Next, a 2D model is created in ABAQUS software and the layup information associated with each partition is transferred to this FE model, as shown in Figure 5 (step 3). Overall, the adopted modelling approach is typical to that used to model regular laminates (e.g. shell elements are used), with the main difference being that instead of assigning a single layup to the geometry, different layups are assigned to different partitions (i.e. areas) in order to represent the in-plane variability of the ROS microstructure. Finally, strength of the material is determined by applying Hashin’s failure criteria and fracture energy evolution law. This failure criteria was chosen because it is widely accepted for laminates, and it provides information on the mode of failure (i.e. fibre vs. matrix and tension vs. compression) and takes into account the coupling between the normal and shear stress components. The entire procedure is repeated to capture the variability in modulus and strength among the different FE simulations. In this article, modelling results are compared against experimental work, which encompasses testing of CF laminates and ROS composites with different strand sizes.
Overview of the modelling procedure.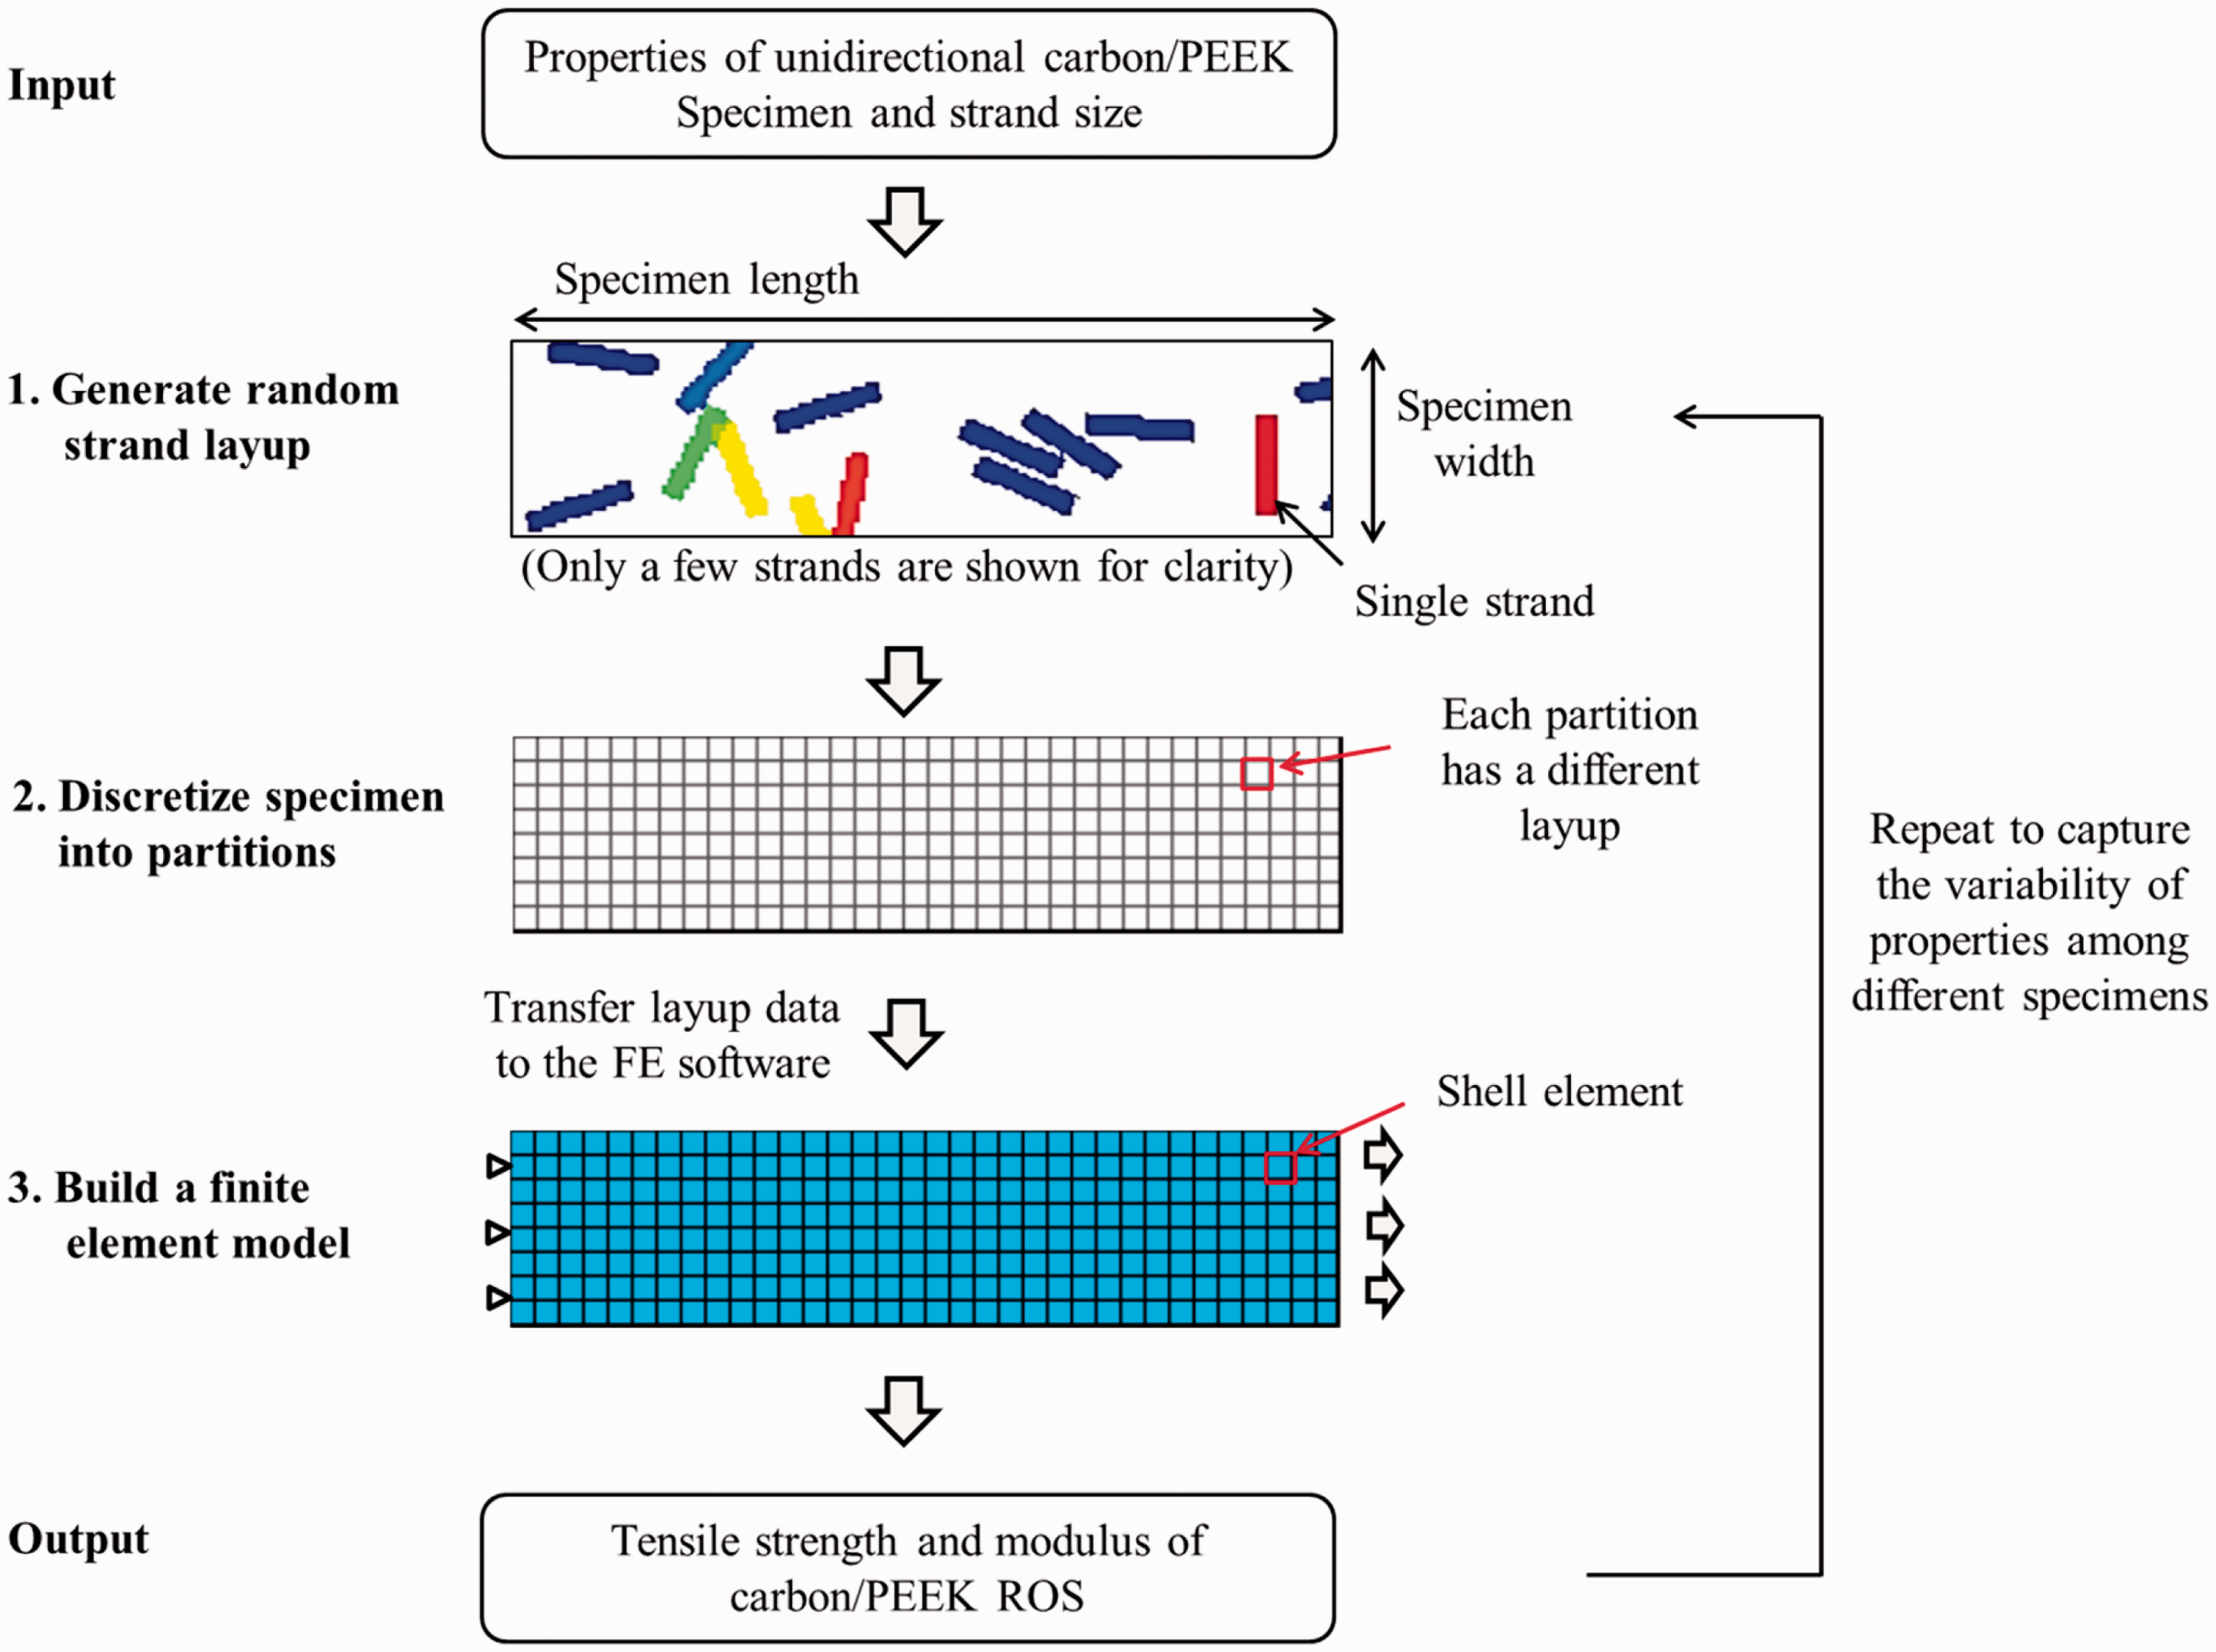
Scope and assumptions
Modelling results are validated using test data generated for CF laminates and ROS composites with different strand sizes (12- to 50-mm long and 6-mm wide). The chosen range of strand length is representative of the values that are used in the industry and were considered in other experimental papers.
A 2D model is created to represent the in-plane properties of a tensile specimen. The model takes into account the specimen length, width and thickness, and the strand size (12–50 mm) and off-axis orientation (with respect to the specimen loading direction), but it ignores the following micro- and macro-structural features:
strand out-of-plane orientation; defects (i.e. voids and resin rich areas); adhesion and interlaminar interaction between strands; edge effects.
Figure 6 shows a cross-sectional image of an ROS composite. Local microstructure of ROS composites resembles that of a CF laminate when it is discretized into smaller sections, as shown by the red rectangles in Figure 6. These micrographs show the randomness of the strand layup and its 3D features such as strand out-of-plane orientation. Despite the randomness of the layup, when observed locally on a smaller scale (e.g. in 1 mm intervals), it resembles a laminate (refer to the red rectangles in Figure 6). The assumptions of planar strand orientation and defect-free microstructure are appropriate for large-strand ROS specimens, because strand placement is fairly orderly and planar as is shown in Figure 6(b). On the other hand, small-strands have a more chaotic placement, which results in large out-of-plane angles and numerous resin-rich areas, as shown in Figure 6(a). The out-of-plane inclination of a strand (or a fibre) reduces its load carrying efficiency under longitudinal loading of the specimen, and the resin-rich areas act as defects or stress-concentrations. These microstructural features are not considered in the model, and thus the proposed model is expected to over-predict strength and modulus of short-strand ROS composites.
Microstructure of (a) short and (b) long strand ROS specimens.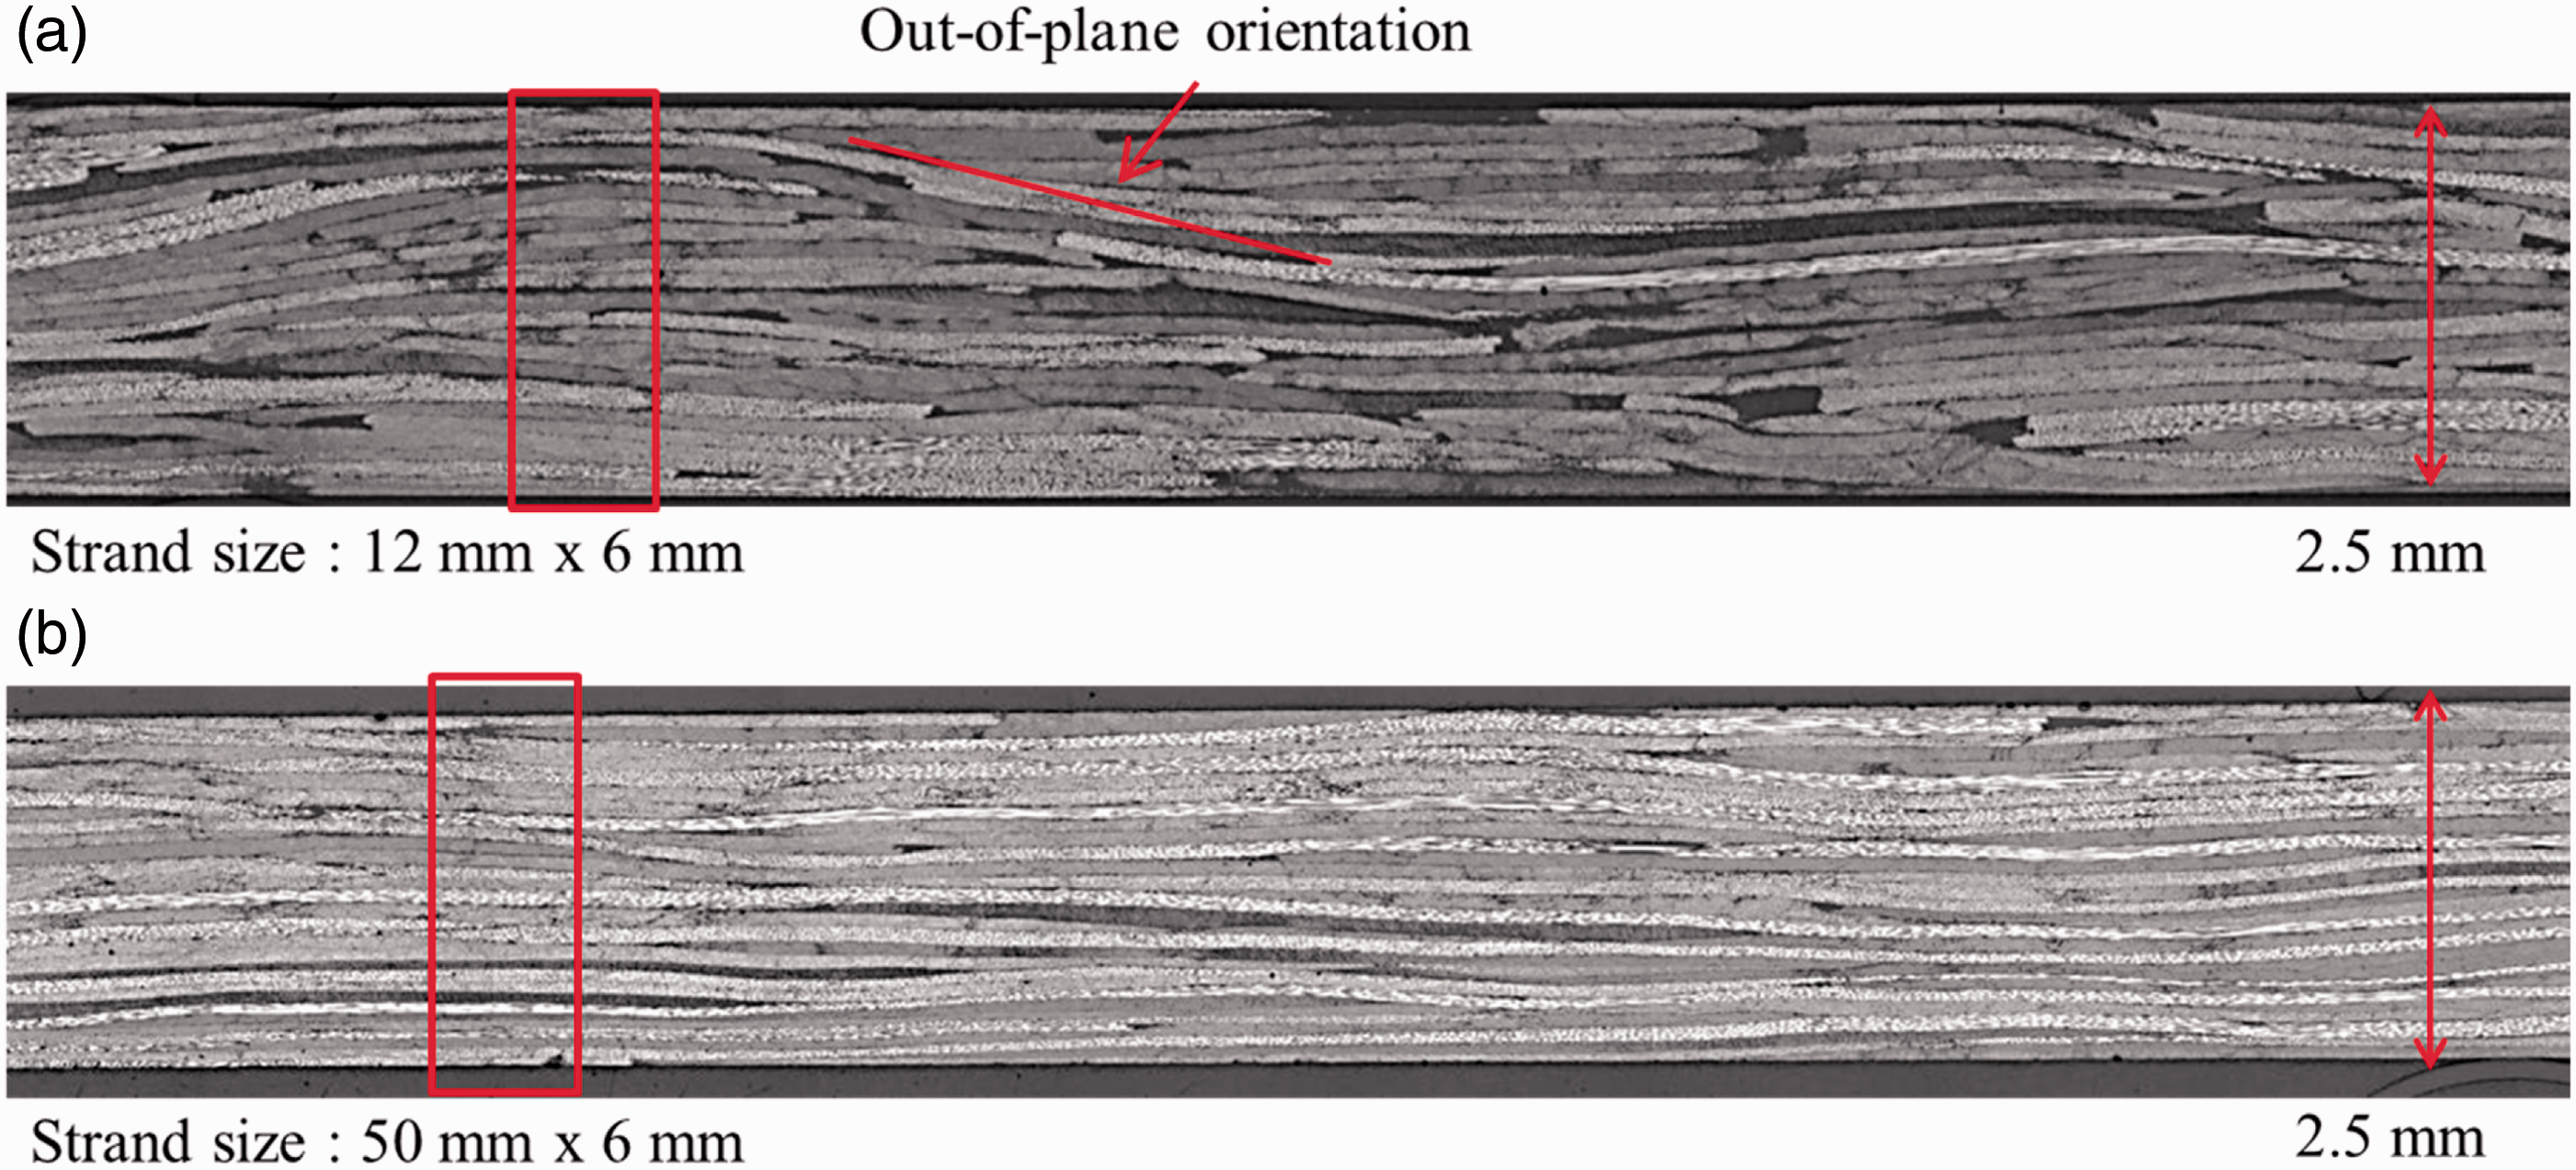
The effect of interlaminar shear properties and fracture mechanisms are without a doubt non-negligible, since strand delamination was shown to be one of the primary failure modes. Overall, the model is expected to over predict strength, since the interlaminar failure modes are not permitted but nonetheless, it would capture the effect of variability on mechanical properties.
Randomization algorithm and laminate analogy
As opposed to CF composites with a uniform layup, ROS materials exhibit an almost infinite amount of different layups. To capture this variability in a model, an algorithm was developed in MATLAB software to generate randomized strand layups and assign them to the geometry or component being simulated. In this article, the simulated geometry corresponds to the gauge section of an actual tensile specimen, which is 150 mm × 25 mm × 2.5 mm (6 in. × 1 in. × 0.1 in.). It is discretized into partitions that store information about strand layups. As more and more strands with random orientation are generated (or laid up) in the model, the layup properties stored in the partitions are automatically getting updated. For example, Figure 7 shows the placement of three strands within the modelled geometry. In this example, some partitions have only one strand associated with them, while others contain information about the overlap regions of two strands ([45 0] and [0 −60]). Since partitions are smaller than the individual strands and each strand spans across multiple partitions, there is a gradual transition of layups from one partition to the next. If a portion of the strand protrudes outside of the simulated geometry, it is cut off and is not reinserted from the other side (i.e. ‘torus conversion’ is not used). This approach is used because the tensile test specimens are cut from a larger panel (i.e. are not net-moulded) and also have cut strands along the edges.
Strand generation algorithm.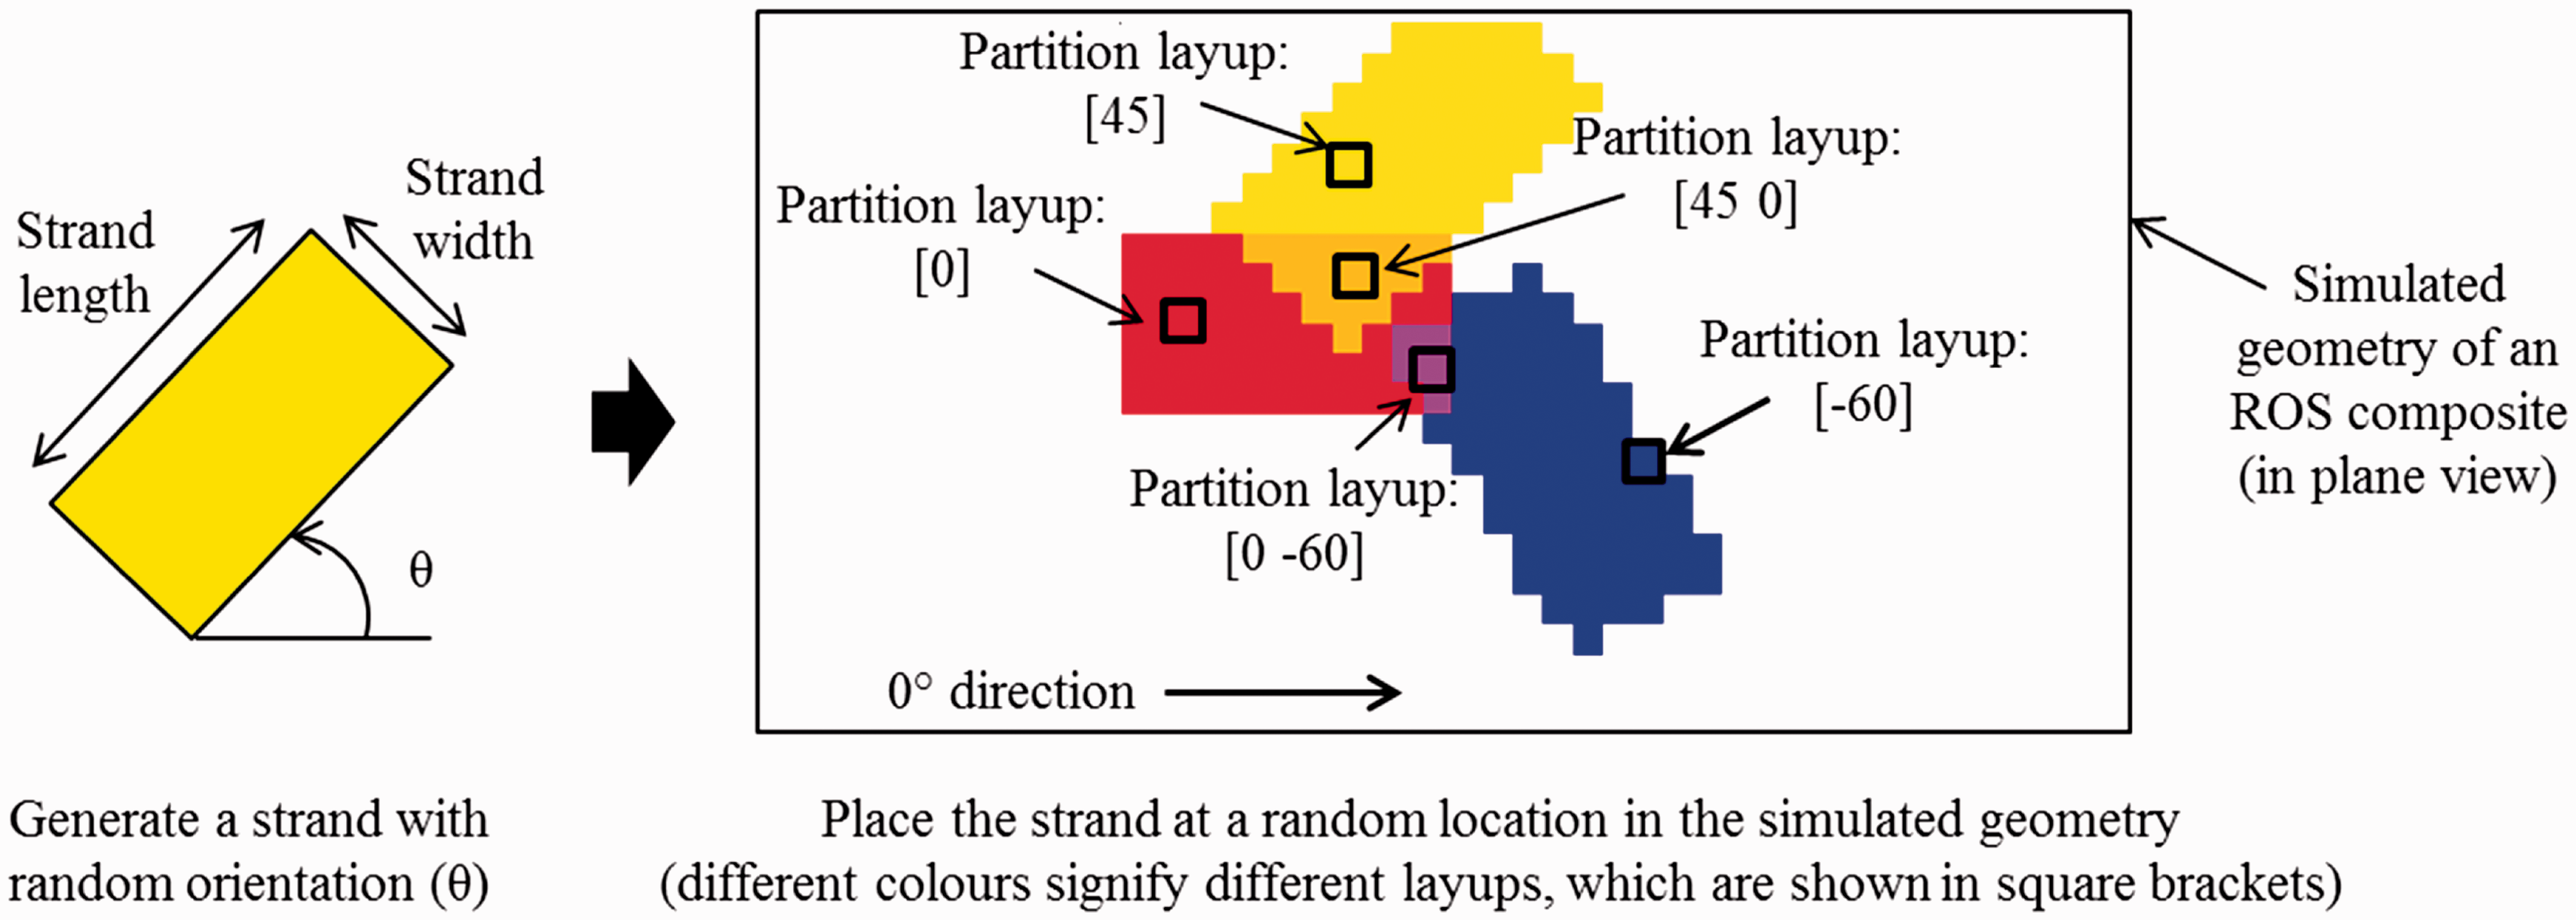
Strand generation is continued until the average number of plies over all the partitions reaches the number of plies that a CF laminate of the same thickness would have. For instance, a 2.5-mm CF laminate would have 18 plies. Thus, on average, a 2.5-mm thick ROS composite is also expected to have 18 strands through-the-thickness, but locally this number will vary, as shown in Figure 8. Once strand generation is complete, thickness of each ply in a given partition is adjusted such that the total partition thickness (h) is 2.5 mm, as shown in Figure 8. This step is implemented to achieve constant thickness everywhere in the simulated geometry. In reality, the strands will flow and deform to fill up the ‘empty’ spaces, but the dynamics of this squeeze flow is currently not considered in the model. Despite the occurrence of flow, the fibre volume fraction is assumed to be constant throughout the material in the model. During moulding strands, which are originally fully impregnated, tend to flow as a homogeneous material, and there is minimal resin flowing out of them. As a result, the fibre volume fraction stays constant. For a more thorough discussion on the physics of squeeze flow of UD carbon/PEEK tapes and ROS composites, the reader is referred to Picher-Martel et al.
7
It is also noteworthy that symmetry and balance of the layups are not enforced during strand generation.
Variability in the number of layers among partitions in 2.5-mm thick simulated ROS composite.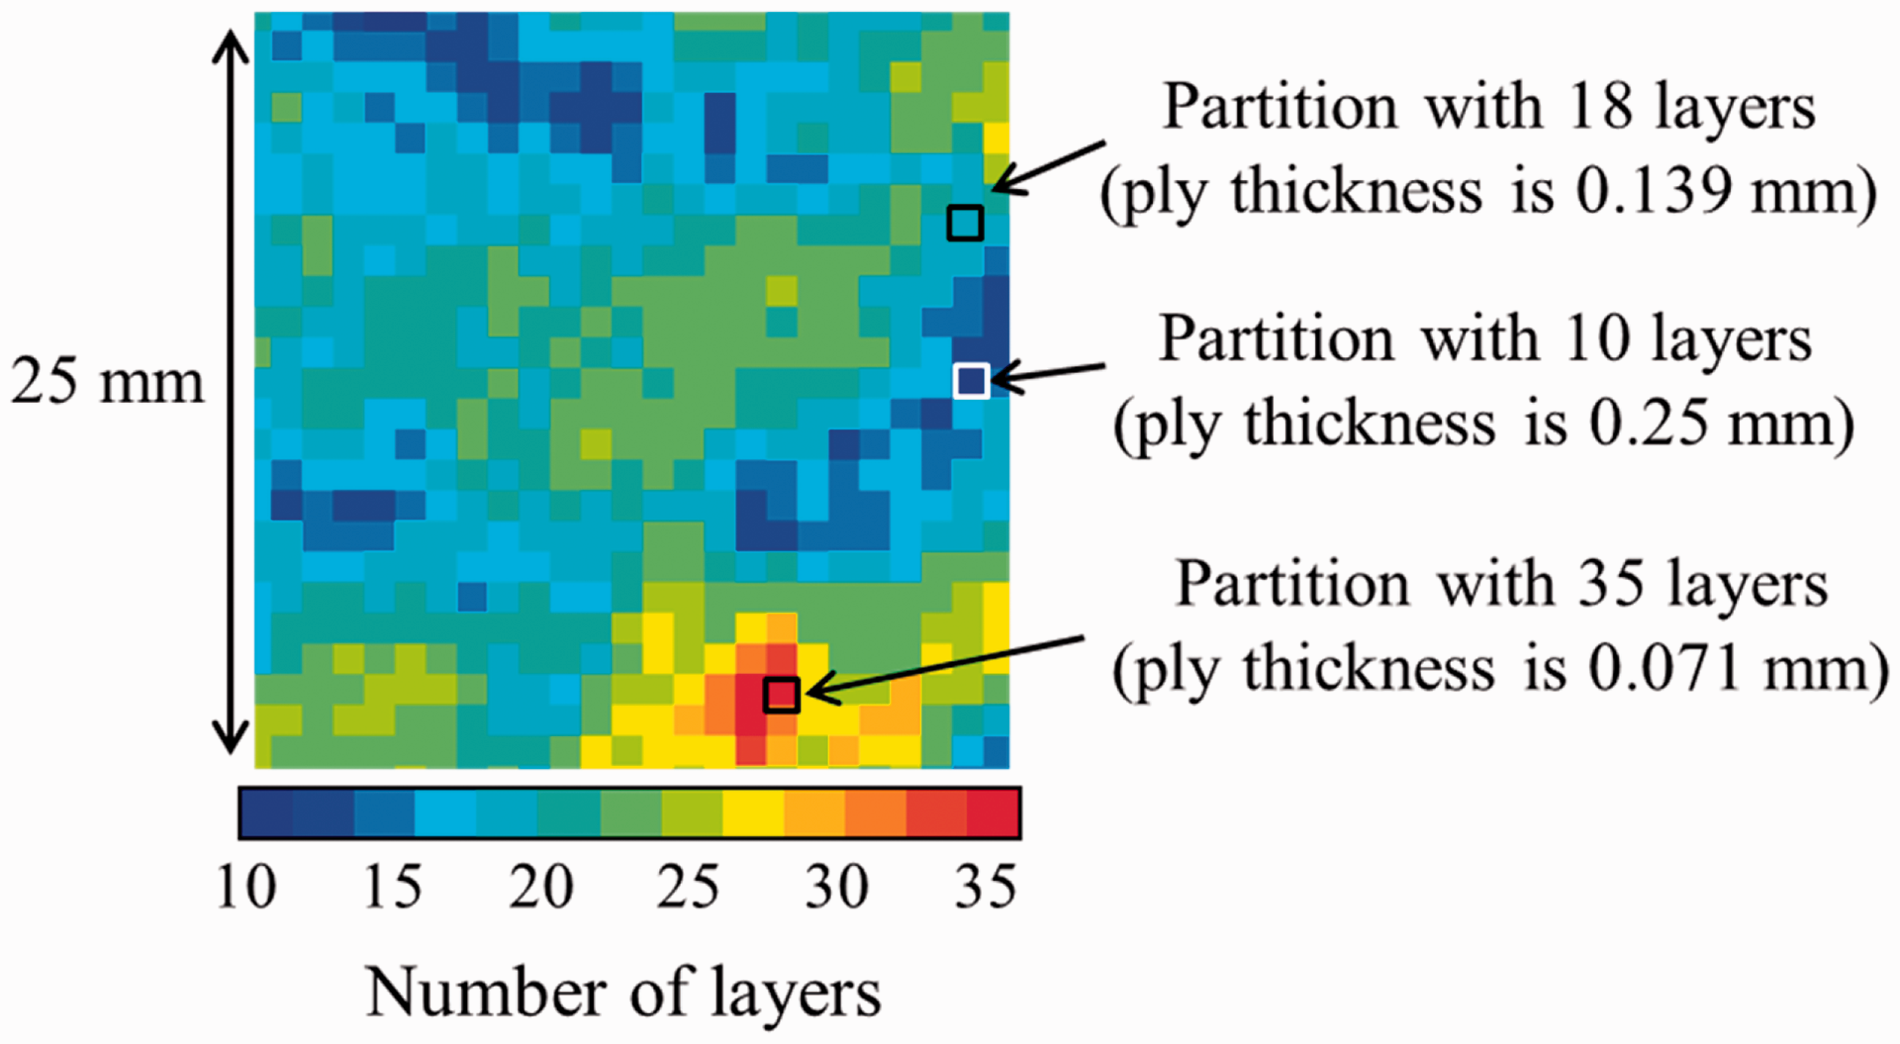
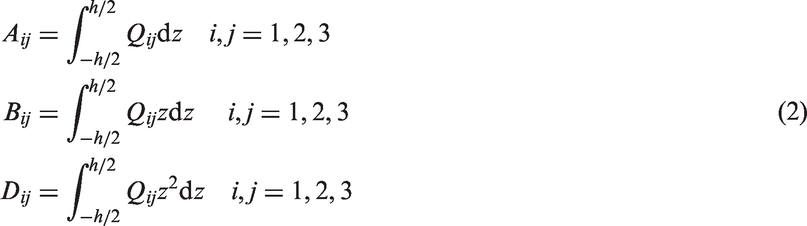
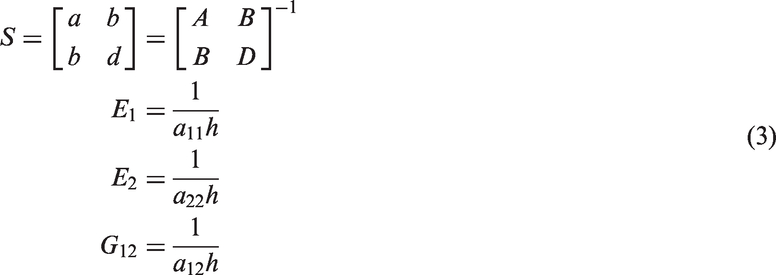
Each partition is evaluated with the classical laminate theory based on 2D plane stress assumptions to calculate the equivalent engineering stiffness. For every partition, the laminate stiffness matrix (K) is computed using equations (1) and (2), and then engineering constants (i.e. equivalent stiffness of a composite material) are computed using equation (3). The laminate stiffness matrix defines a relationship between stress and moment resultants (N, M), and laminate strains and curvatures (ɛ, κ) (equation (1)).
Variability of the local modulus in 2.5-mm thick simulated tensile specimen.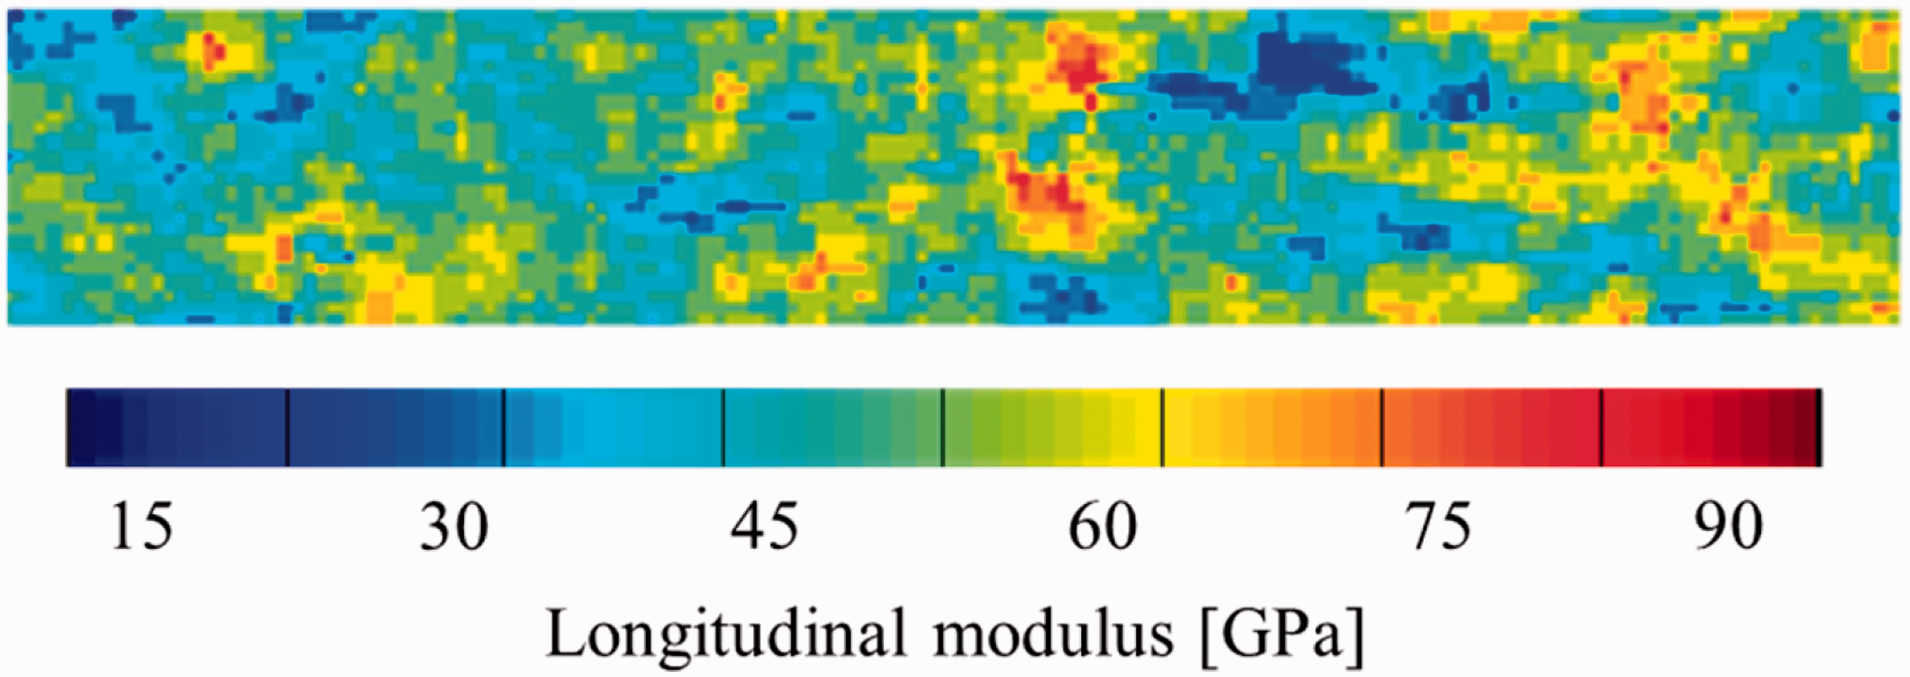

FE model
FE model was created in ABAQUS to evaluate the stress–strain response of ROS composites. A Python script, which is a programming language used to interface with ABAQUS, is used to generate the FE model (geometry, mesh, boundary conditions, etc.) and to assign layups to each partition. Partition refers to an area of the simulated geometry with a distinct layup assigned to it. For this reason, the mesh size has to be the same as the partition size or finer, and each mesh element has to be fully within a partition (i.e. it cannot be split between two partitions with different layups). The same mesh and partition size are used, such that each element is 1 mm × 1 mm and has its own layup. The effect of mesh and partition size will be discussed in the next section. The model is meshed using 4-node quad shell elements (S4). The stress–strain curve of the entire specimen, which is representative of the equivalent or average modulus, is captured by incrementally applying a displacement and measuring the force resultants. For the boundary conditions, a constant displacement is applied along one edge, and the opposite edge is restrained in the longitudinal direction. Two nodes, one along each restraint edge, are fully restrained, and the rest of the specimen is free to deform in any direction, as shown in Figure 10.
Boundary conditions imposed on the simulated tensile specimen. X and Y refer to longitudinal and transverse directions, and u represents displacement.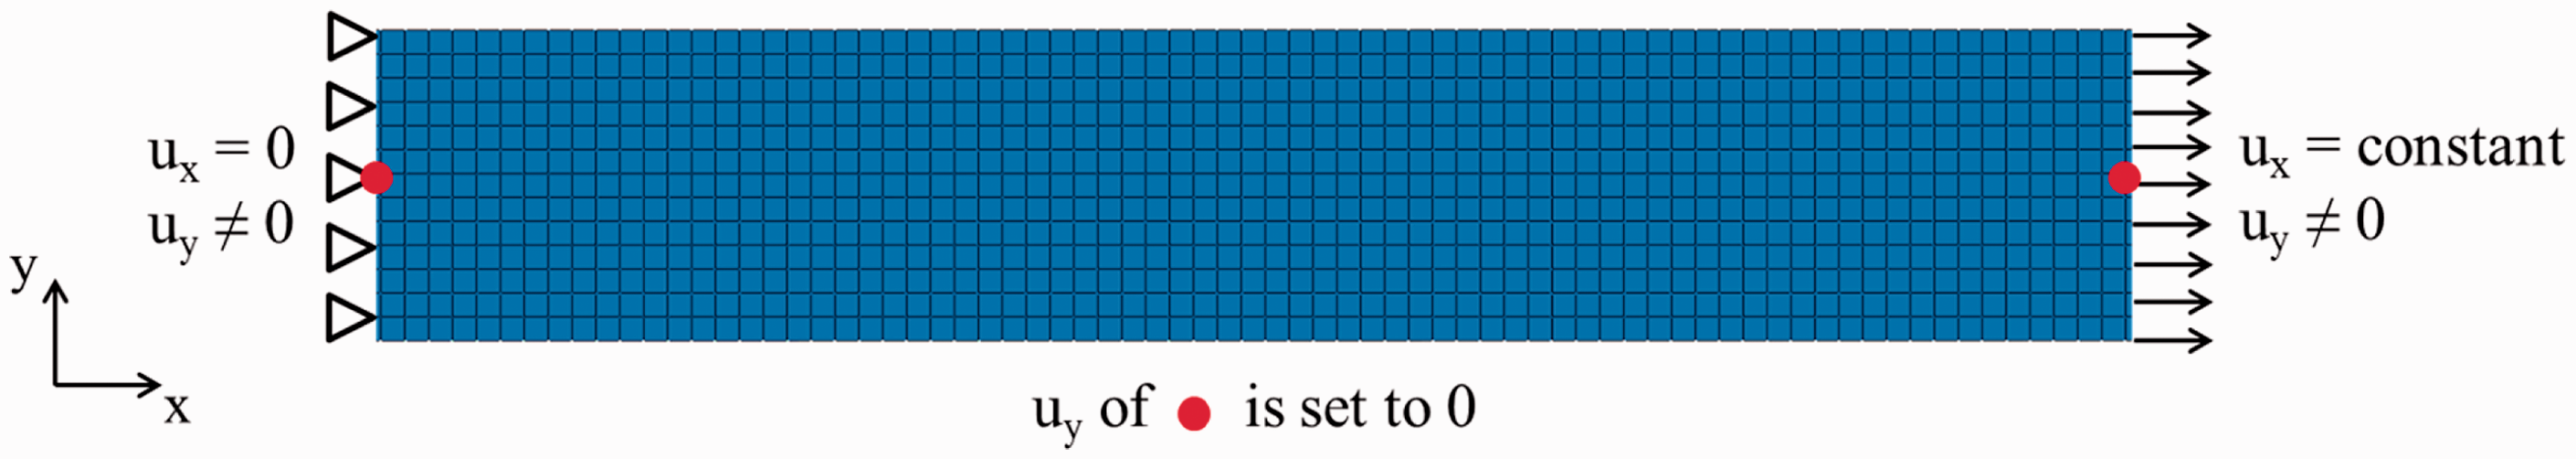
Failure criteria
Damage initiation is determined by the Hashin’s failure criteria (equations (4)–(7)), 21 combined with fracture energy dissipation 22 methods to model damage propagation. These criteria were chosen because they consider the combined effect of different stress components on each failure mode and can differentiate between fibre and matrix failure modes. These are standard failure criteria equations and are readily available in ABAQUS.
Fibre tension (σ11 ≥ 0):


In the above equations, on the left-hand sides, f represents ‘fibre’, m represents ‘matrix’ and F is a failure index, which represents failure when F = 1. On the right-hand sides, σij represents the components of the effective stress tensor; XT and YT denote longitudinal and transverse tensile strength; XC and YC denote longitudinal and transverse compressive strength; SL and ST denote longitudinal and transverse shear strength. In these formulations, longitudinal and transverse refer to the directions parallel and perpendicular to the fibres.
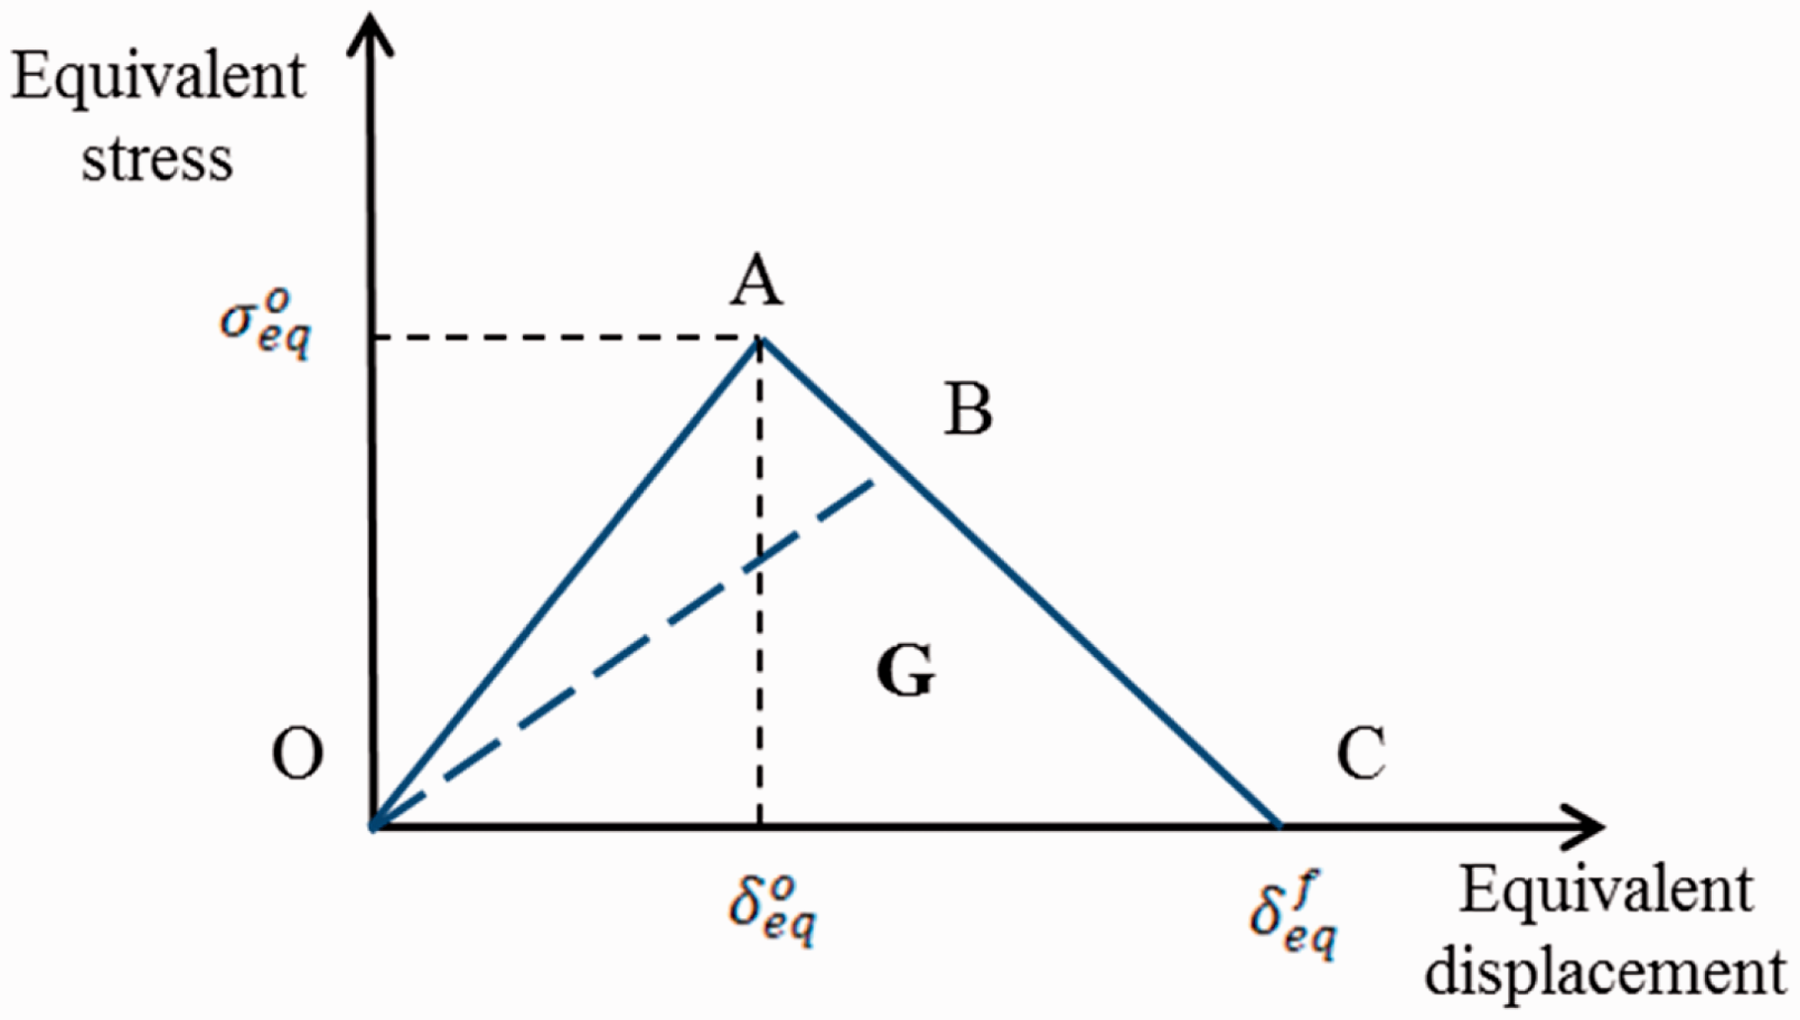
Damage propagation is modelled by linearly softening the material based on the concept of fracture energy (G) dissipation. This method for progressive damage development is readily available in ABAQUS and is intendent for modelling of fibre reinforced composites. However, it is rarely used, as users prefer to develop their own subroutines to define degradation of mechanical behaviour during damage propagation. User-defined subroutines offer more flexibility in how the material properties are adjusted during damage development, but are more work-intensive and also require fitting of the parameters. For these reasons, the modelling scheme that is available in ABAQUS was implemented. In this method, stress-displacement behaviour for each failure mode is represented by the bi-linear relation shown in Figure 11. The slope O-A represents linear elastic behaviour prior to damage initiation (or peak stress). After the onset of damage, material stiffness decreases, which is represented by the line O-B. The area under OAC represents the total fracture energy. Displacement (δeq) is used as an internal variable in ABAQUS to calculate the damage variable (d) corresponding to the each possible failure mode, which is then used to compute the damaged stiffness matrix (Cd), which is defined in equation (9), of the laminate
22
:
Stress-displacement relationship for each damage mode.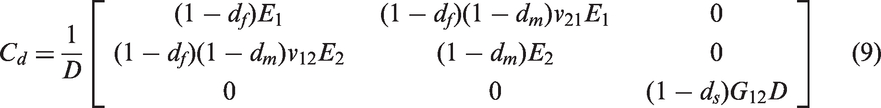
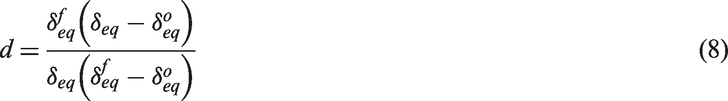

Mechanical properties of unidirectional CF carbon/PEEK laminate are readily available from the manufacturer and are summarized in Table 1. However, no experimentally measured values for fracture energies of carbon/PEEK were found in the literature. In this article, fracture energies were chosen so that stress–strain curves of [0/±60]3S and [90/±30]3S laminates obtained from FE analysis would match the experimental results, as shown in Figure 12. Baseline energy values were taken from the modelling papers,20,23 which relied on approximate values to model progressive crack growth in open-hole GLARE
23
and CF carbon/PEEK laminates.
20
The effect of fracture energies on stress–strain response was the most evident in the case of [0/±60]3S laminates, as shown in Figure 12. With baseline values, there was a dip in the stress–strain curve when the ±60° plies failed; whereas the experimental curve was straight. When fracture energies were increased by a factor of 10, the stress–strain curve became straight but properties degraded too slowly after the failure of 0° plies. Overall, values that gave best results for [0/±60]3S and [90/±30]3S layups are summarized in Table 2.
Effect of fracture energy on the stress–strain curve of [0/±60]3S laminate. Stress values are normalized with respect to the failure load obtained experimentally. Mechanical properties of carbon/PEEK plies as provided by the manufacturer. Out-of-plane shear modulus was calculated based on the transverse isotropic assumption. Transverse tension and compression strengths were assumed to be the same. Fracture energies used to model failure of carbon/PEEK.

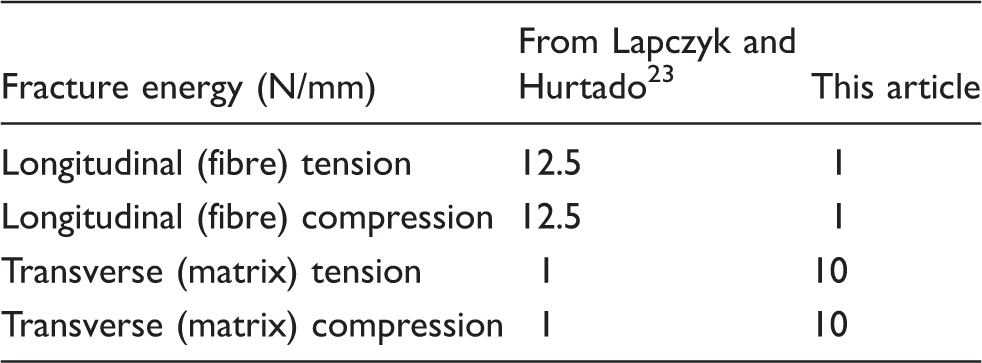
It is notable that the selected fracture energy in the longitudinal (fibre) direction is 10 × lower than that in the transverse (matrix) direction. The higher value of fracture toughness slows the degradation of properties after the onset of damage development, which is desirable for transverse properties, especially, since PEEK is a tough thermoplastic resin. On the contrary, failure of composites in the fibre direction is considered to be brittle and is characterized by a drastic reduction in stiffness (i.e. material’s ability to withstand load). Hence, setting a low value for the longitudinal fracture toughness in the model would trigger an abrupt drop in stiffness after the criterion for fibre failure is met, as shown in Figure 12.
Mesh and partition size
Sensitivity of the model to mesh and partition sizes was evaluated in the range of 0.5–3 mm. All the models showed the same features on the stress, strain and damage plots, and predicted the same modulus. For example, the effect of partition size on the damage state (or the failure index) of a simulated tensile specimen is shown in Figure 13. The only difference among these images is that larger partition size results in a coarser pattern.
Damage state, which is shown in terms of the failure index corresponding to the matrix tension criterion, of a simulated tensile specimen at the time of failure.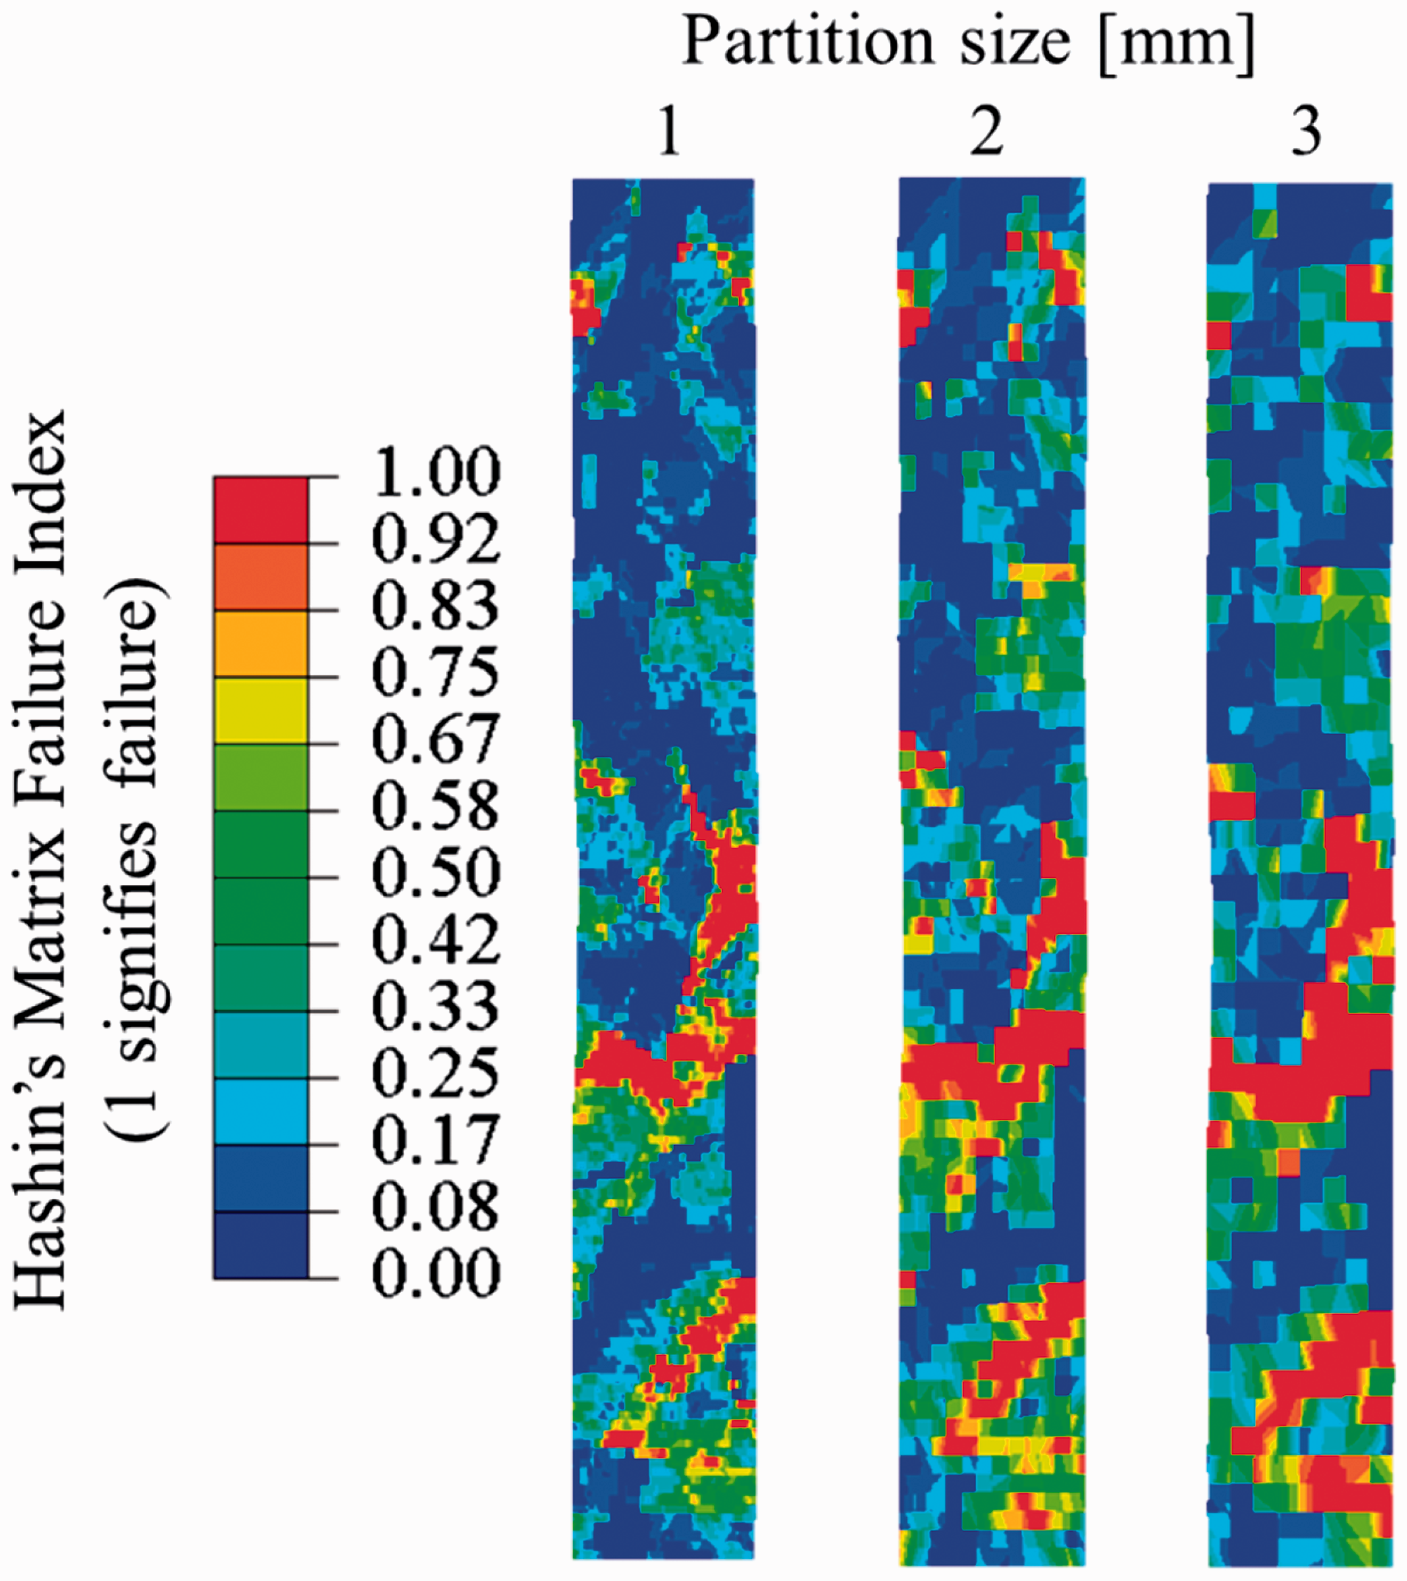
Since the mesh size had no effect on the results, for the sake of consistency, it was kept the same size as the partition size during modelling. Effect of the partition size on the average strength, which was normalized by the strength of CF laminates, is summarized in Figure 14. Overall, partition size (and corresponding mesh size) of 0.5 mm provided the most accurate results as the strength values began to level off and approach the state of convergence. However, partition size of 1 mm was used for the rest of the study, as it required shorter run times and provided results within 6% of the results obtained using 0.5 mm partition size.
Effect of partition size on predicted strength. Strength values are normalized with respect to the strength of CF quasi-isotropic laminates. Partition size is given in mm.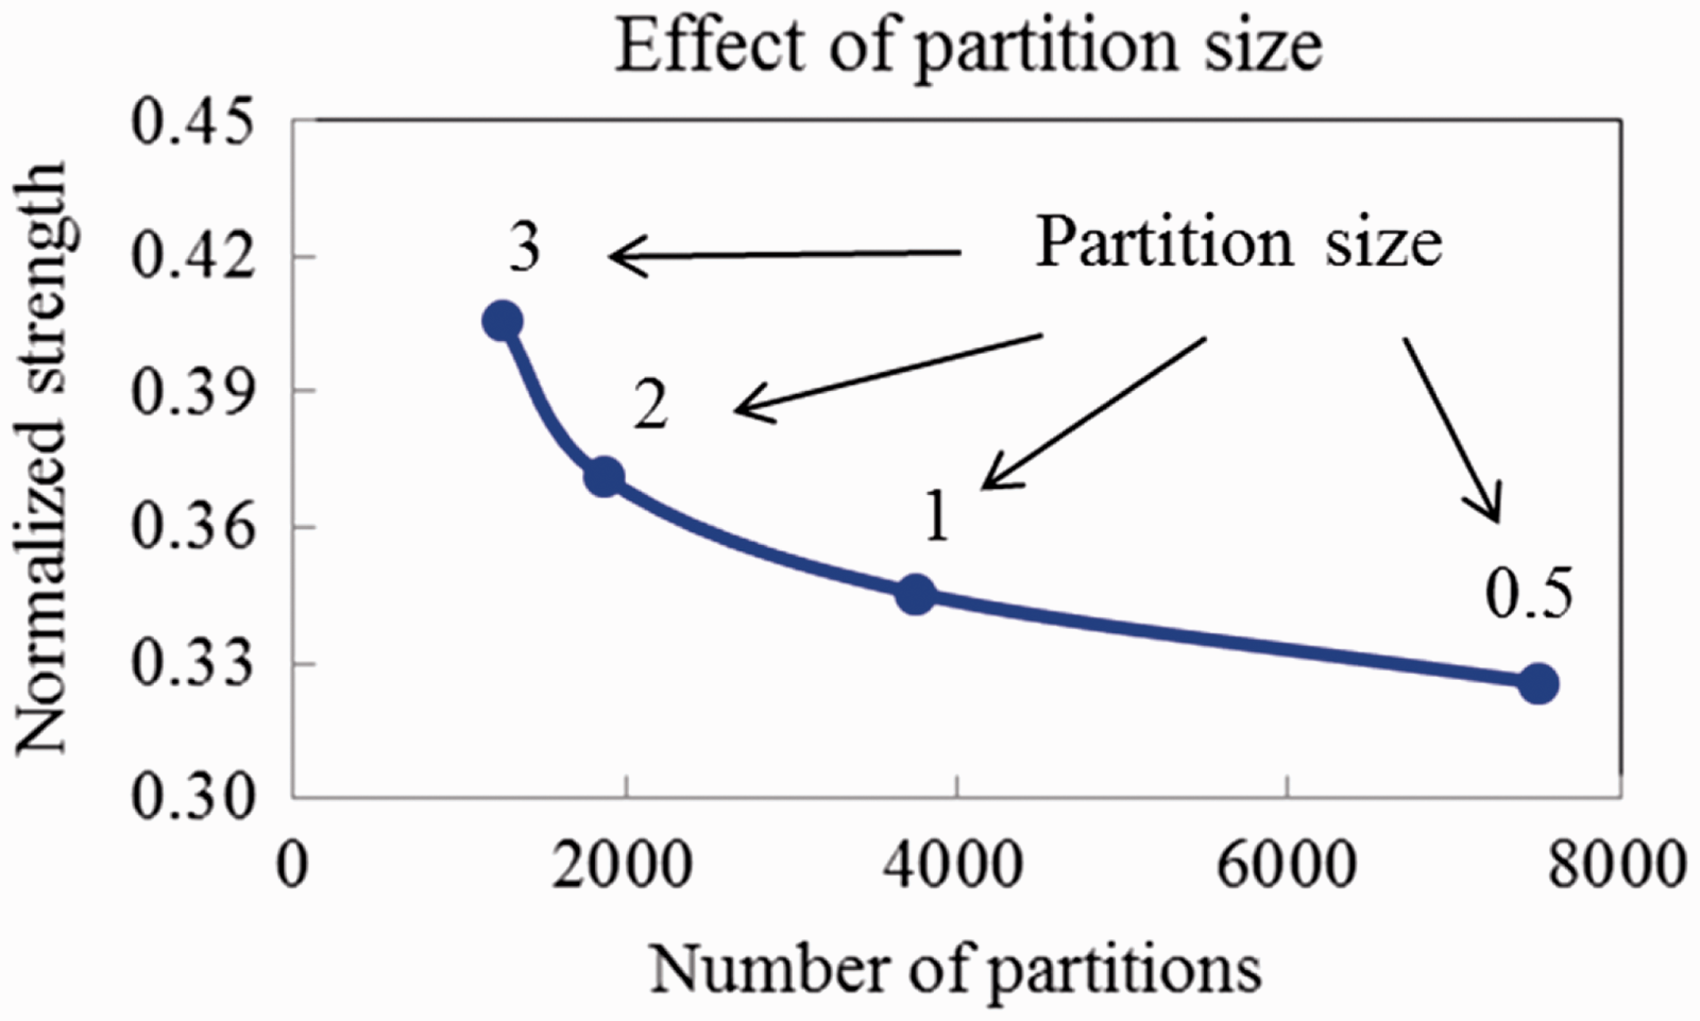
Running the simulation
In the case of ROS composites, eight simulations with different randomized layups were run for each strand size. Loading was applied incrementally with a constant step size, but as the element properties began to degrade, the step size was automatically reduced with the aim to achieve convergence. As noted in ABAQUS,
22
materials that are experiencing stiffness degradation often lead to convergence difficulties in implicit analysis. These difficulties can be mitigated with a viscous regularization scheme, which ensures that the tangent stiffness matrix is positive definite for a sufficiently small step size (i.e. displacement increment). In this case, viscous coefficient is a convergence criteria parameter in ABAQUS rather than a material property. In general, viscous coefficient has a similar effect on results as fracture energy. The higher are the values, the higher is the fracture load. Hence, for simplicity, viscosity coefficient was set to zero and only the effect of fracture energies was considered. Failure of the simulated specimen was assumed to occur when the model experienced numerical problems and could not converge to a solution anymore. Overall, a sample set of stress–strain data obtained from an FE model, shown in Figure 15, demonstrates how the analysis approached the failure load.
Convergence of the stress values to failure strength. Stress values are normalized with respect to the failure load.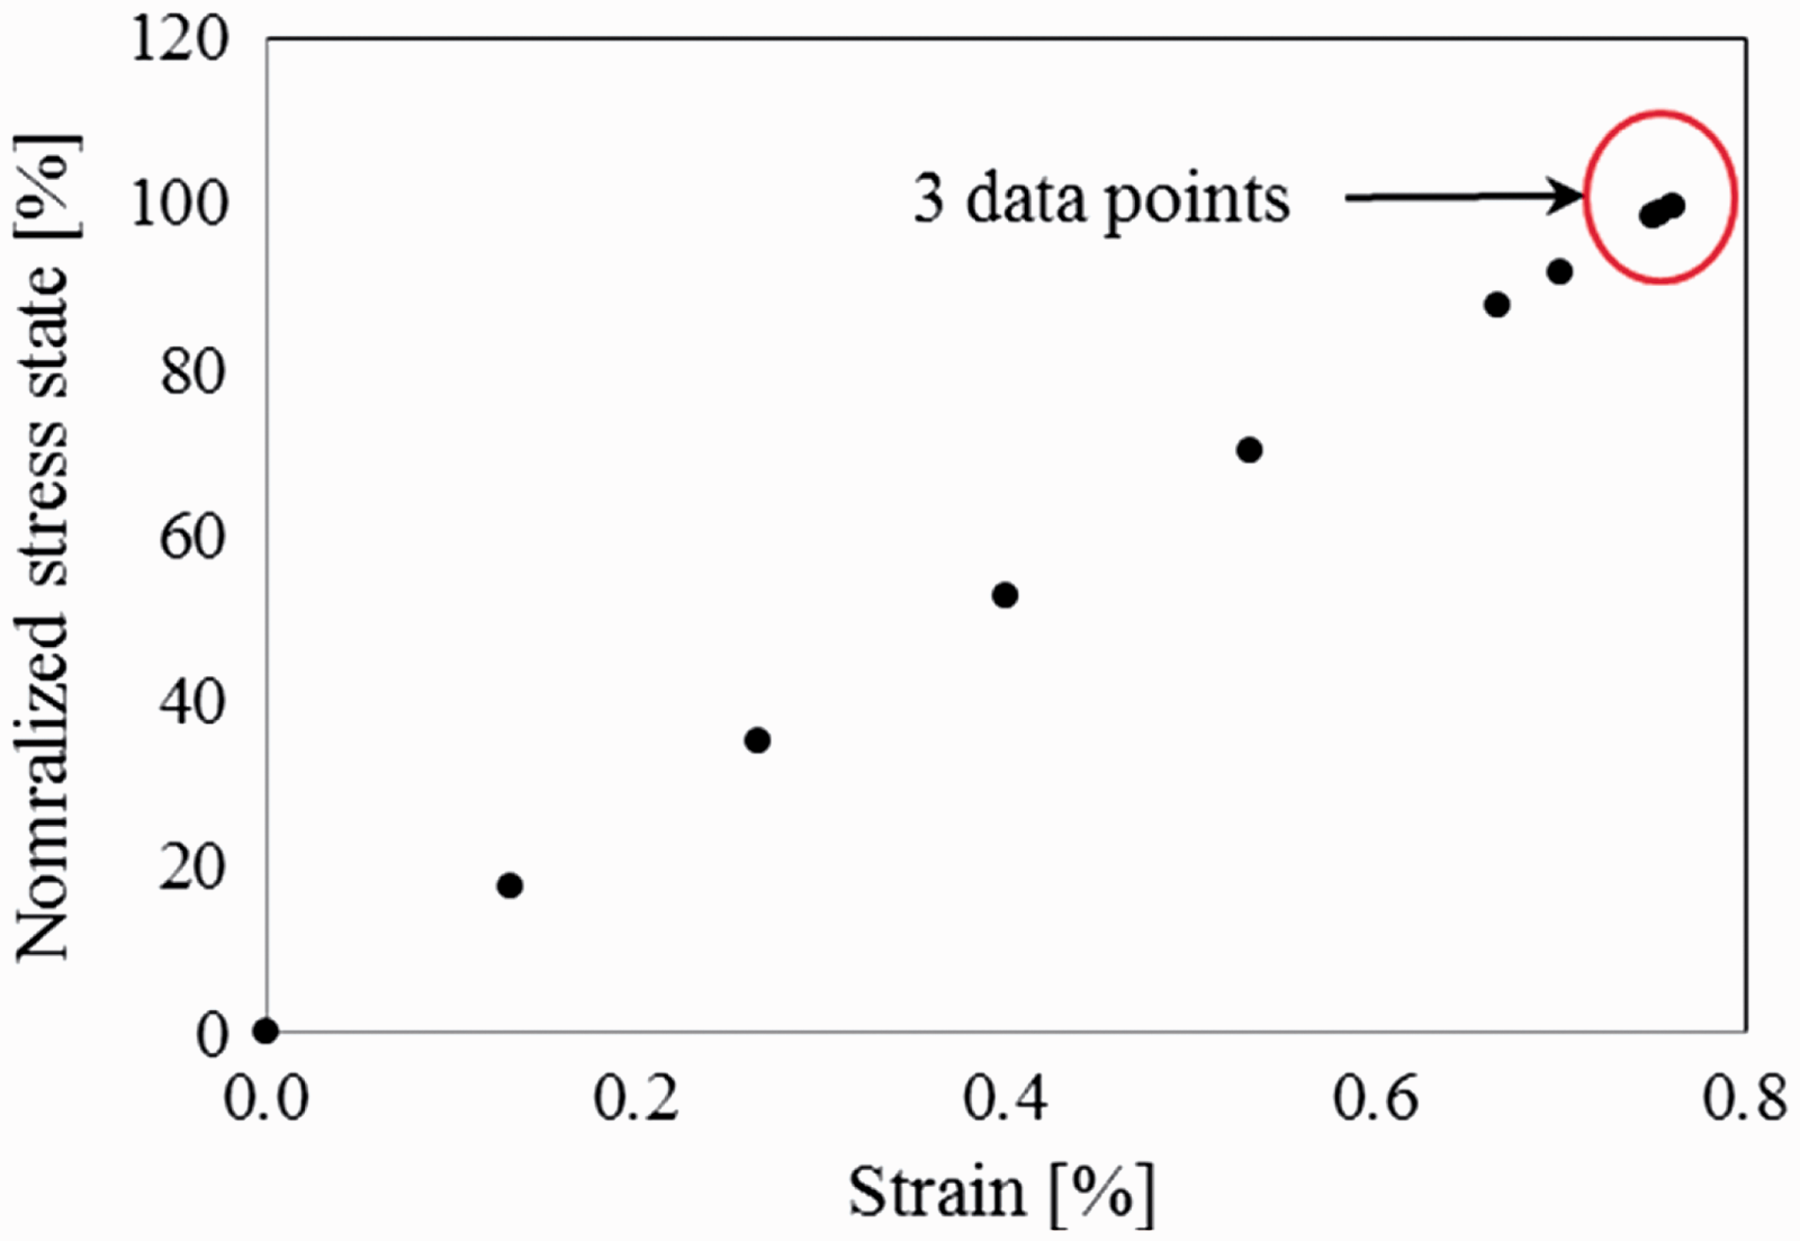
Experimental procedure
Panel fabrication
As it was desired to generate test data for comparison with the model, ROS panels were manufactured using 12, 25 or 50 mm (½ to 2 in.) long strands. CF quasi-isotropic [0/±60]3S panels were manufactured and tested to allow for calibration of the FE model with respect to the fracture energy dissipation and for benchmarking with the ROS data. The material used was carbon/PEEK unidirectional tape that came as 160 mm (6.25 in) and 6.35 mm (¼ in) wide rolls, which were used for fabrication of CF and ROS panels, respectively. An overview of the manufacturing process of ROS panels can be seen in Figure 1. The narrow slit tape (6.35 mm) was cut into strands of desired length by using an automated tape cutter (Kingsing Machinery Co. Limited, model KS-915). Strands were then placed in small batches into a 3-part picture-frame style steel mould (with a cavity of 300 mm × 350 mm or 12 in. × 14 in.) and shuffled back-and-forth each time to minimize their out-of-plane orientation. The mould was placed into a hydraulic heated press (Wabash MPI V150-36-CX) and minimal pressure was applied to close it. Once the processing temperature of 380℃ was reached, full pressure of 35 bars (500 psi) was applied. Following a 15-min dwell, the mould was cooled down at an average rate of 10℃/min. The panel was then demoulded and trimmed by 10 mm (½ in) on each side. The final panels’ dimensions were 280 mm × 330 mm (11 in. × 13 in.) with thicknesses of 2.5 mm. For consistency, the same moulding cycle was used for manufacturing of CF panels.
Test procedure
Tensile specimens were cut from the moulded panels using a diamond saw. The length of the strands along the edge is reduced due to the cutting, hence making that region weaker than the mid-section, which is composed of strands of nominal length. However, the model cannot capture any influences that shorter strands would have on damage development, since interlaminar properties are not modelled. For each strand size, eight specimens were tested in tension as per the ASTM D3039 standard. Specimens were 250-mm long and 25-mm wide (10 in. × 1 in.), and had a gauge section of 150 mm × 25 mm (6 in. × 1 in.). Specimen width of 25 mm was used even though individual strands making up the material were as long as 50 mm. Previous results 4 showed that specimen width (12–50 mm) had no effect on tensile strength and modulus of ROS panels with 25-mm long strands. CF panels were cut such that specimens had [0/±60]3S or [90/±30]3S fibre orientations.
During testing, strain was measured using the DIC technique. The speckle pattern was created by using white spray paint (Rust-Oleum) and black air-brushing paint (Badger, air-opaque). A single 5 megapixel camera (Point Grey, model Flea2 FL2G-50S5M) with AF75-300 mm Tamron lens was used. Specimens were loaded at 2 mm/min, and LVDT data and DIC images were captured at 5 Hz. Image analysis was performed using VIC-2D software from Correlated Solutions. Subset size of 35 pixels was used, which correlates to about 3 mm. The variability of strains through-the-thickness was considered to be negligible, and strain-fields attained with DIC were assumed to be representative of the entire specimen and not just the surface. Equivalent or average modulus of the specimen in the loading direction was calculated by using the average stress sustained by the material (i.e. force divided by cross-sectional area) and using average longitudinal strain from each DIC image, which was representative of the overall elongation of the specimen.
Results and discussion
The DIC technique was used to monitor the evolution of strain-fields with increasing loading in CF and ROS specimens. Sample results, which are shown in Figure 16, demonstrate that strain-fields of ROS composites are significantly more variable than those of CF laminates. The large variability of the strain-field signifies that the modulus of ROS materials is also highly variable. These results also showed that it would be difficult to measure global modulus of the specimen with a strain gauge since it would capture localized strain whereas strain-fields captured with DIC can be averaged out to get mean strain and modulus.
Evolution of the strain-field captured with DIC of (a) CF and (b) ROS (25-mm long strands) specimens. Stress values represent the average stress in the material and are normalized with respect to the failure load.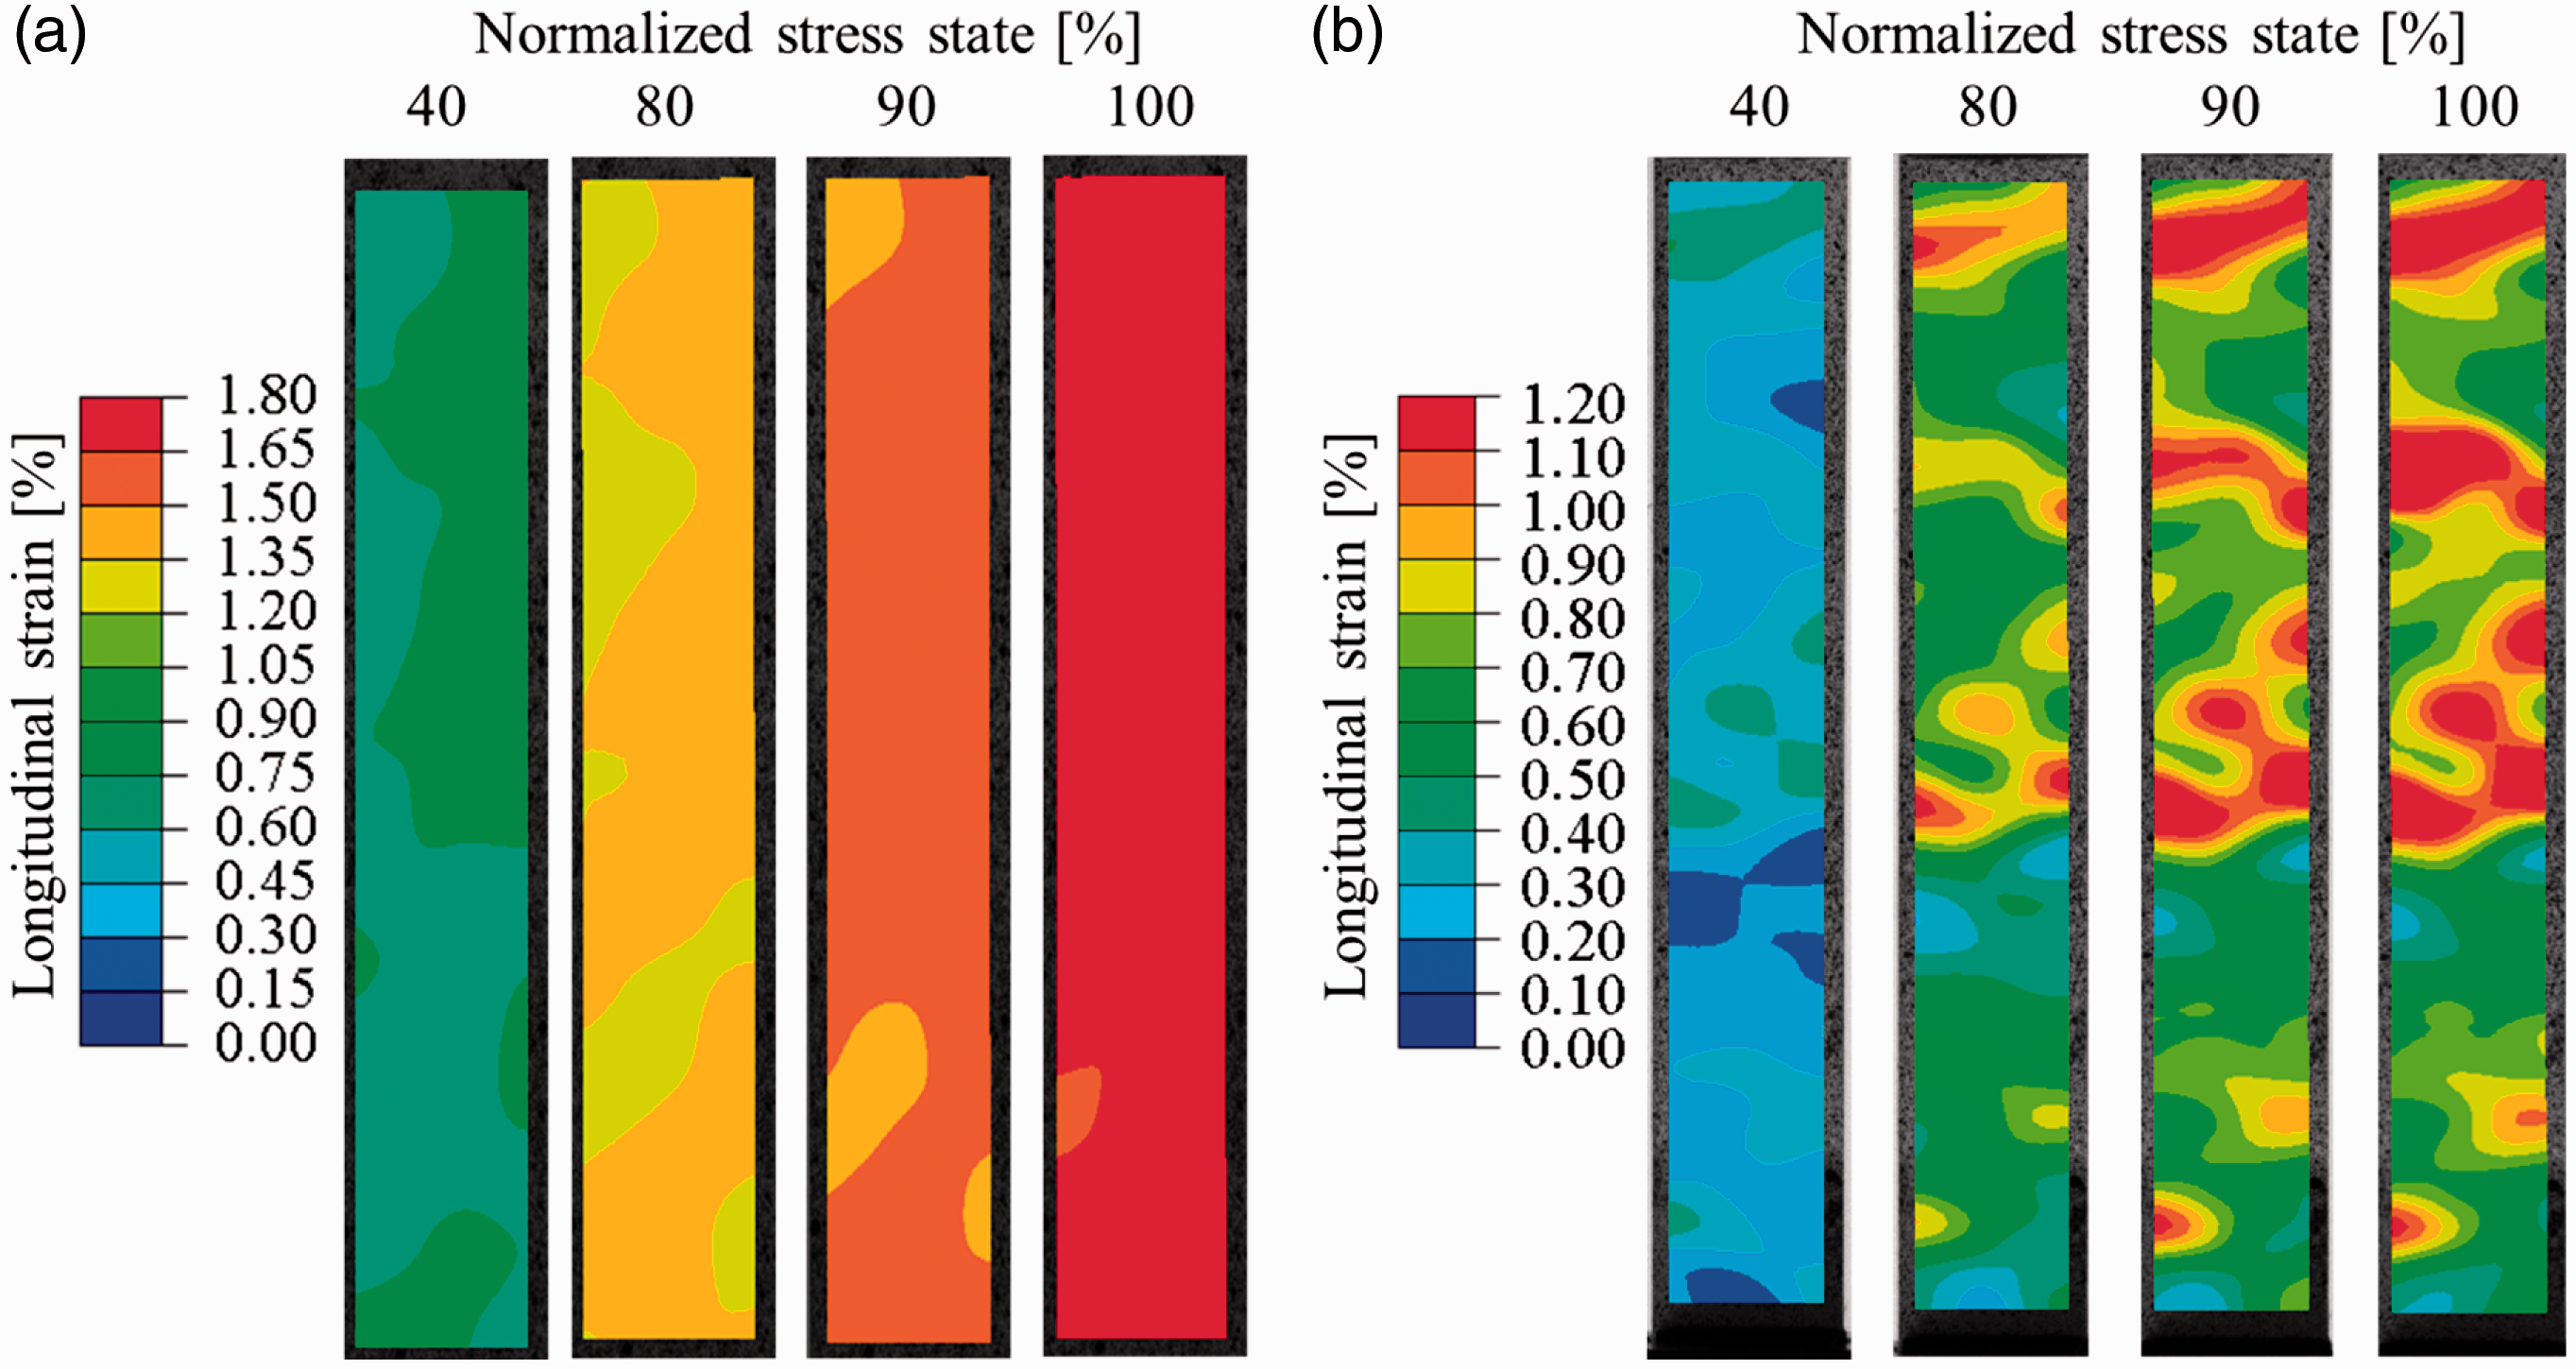
Strain-fields of ROS and CF composites were also obtained from the modelling results and are shown in Figure 17. Analogously to the experimental results, modelling results indicate that ROS composites develop highly variable strain-fields, while CF laminates exhibit uniform ones. In the case of ROS composites, regions of high strain are noticeable even at low loads, while the rest of the specimen experiences significantly lower strains. The earlier model developed by Feraboli et al.
16
was also able to capture regions of high and low strain, but their size and shape depended on the partition size, which is a modelling and not a physical parameter. The current model captures the shape and size of these regions independently of the partition size, since strands span across multiple partitions and the change in layups from one partition to the next is gradual.
Evolution of the strain-field captured with the FE model of (a) CF and (b) ROS (25-mm long strands) specimens. Stress values represent the average stress in the material and are normalized with respect to the failure load.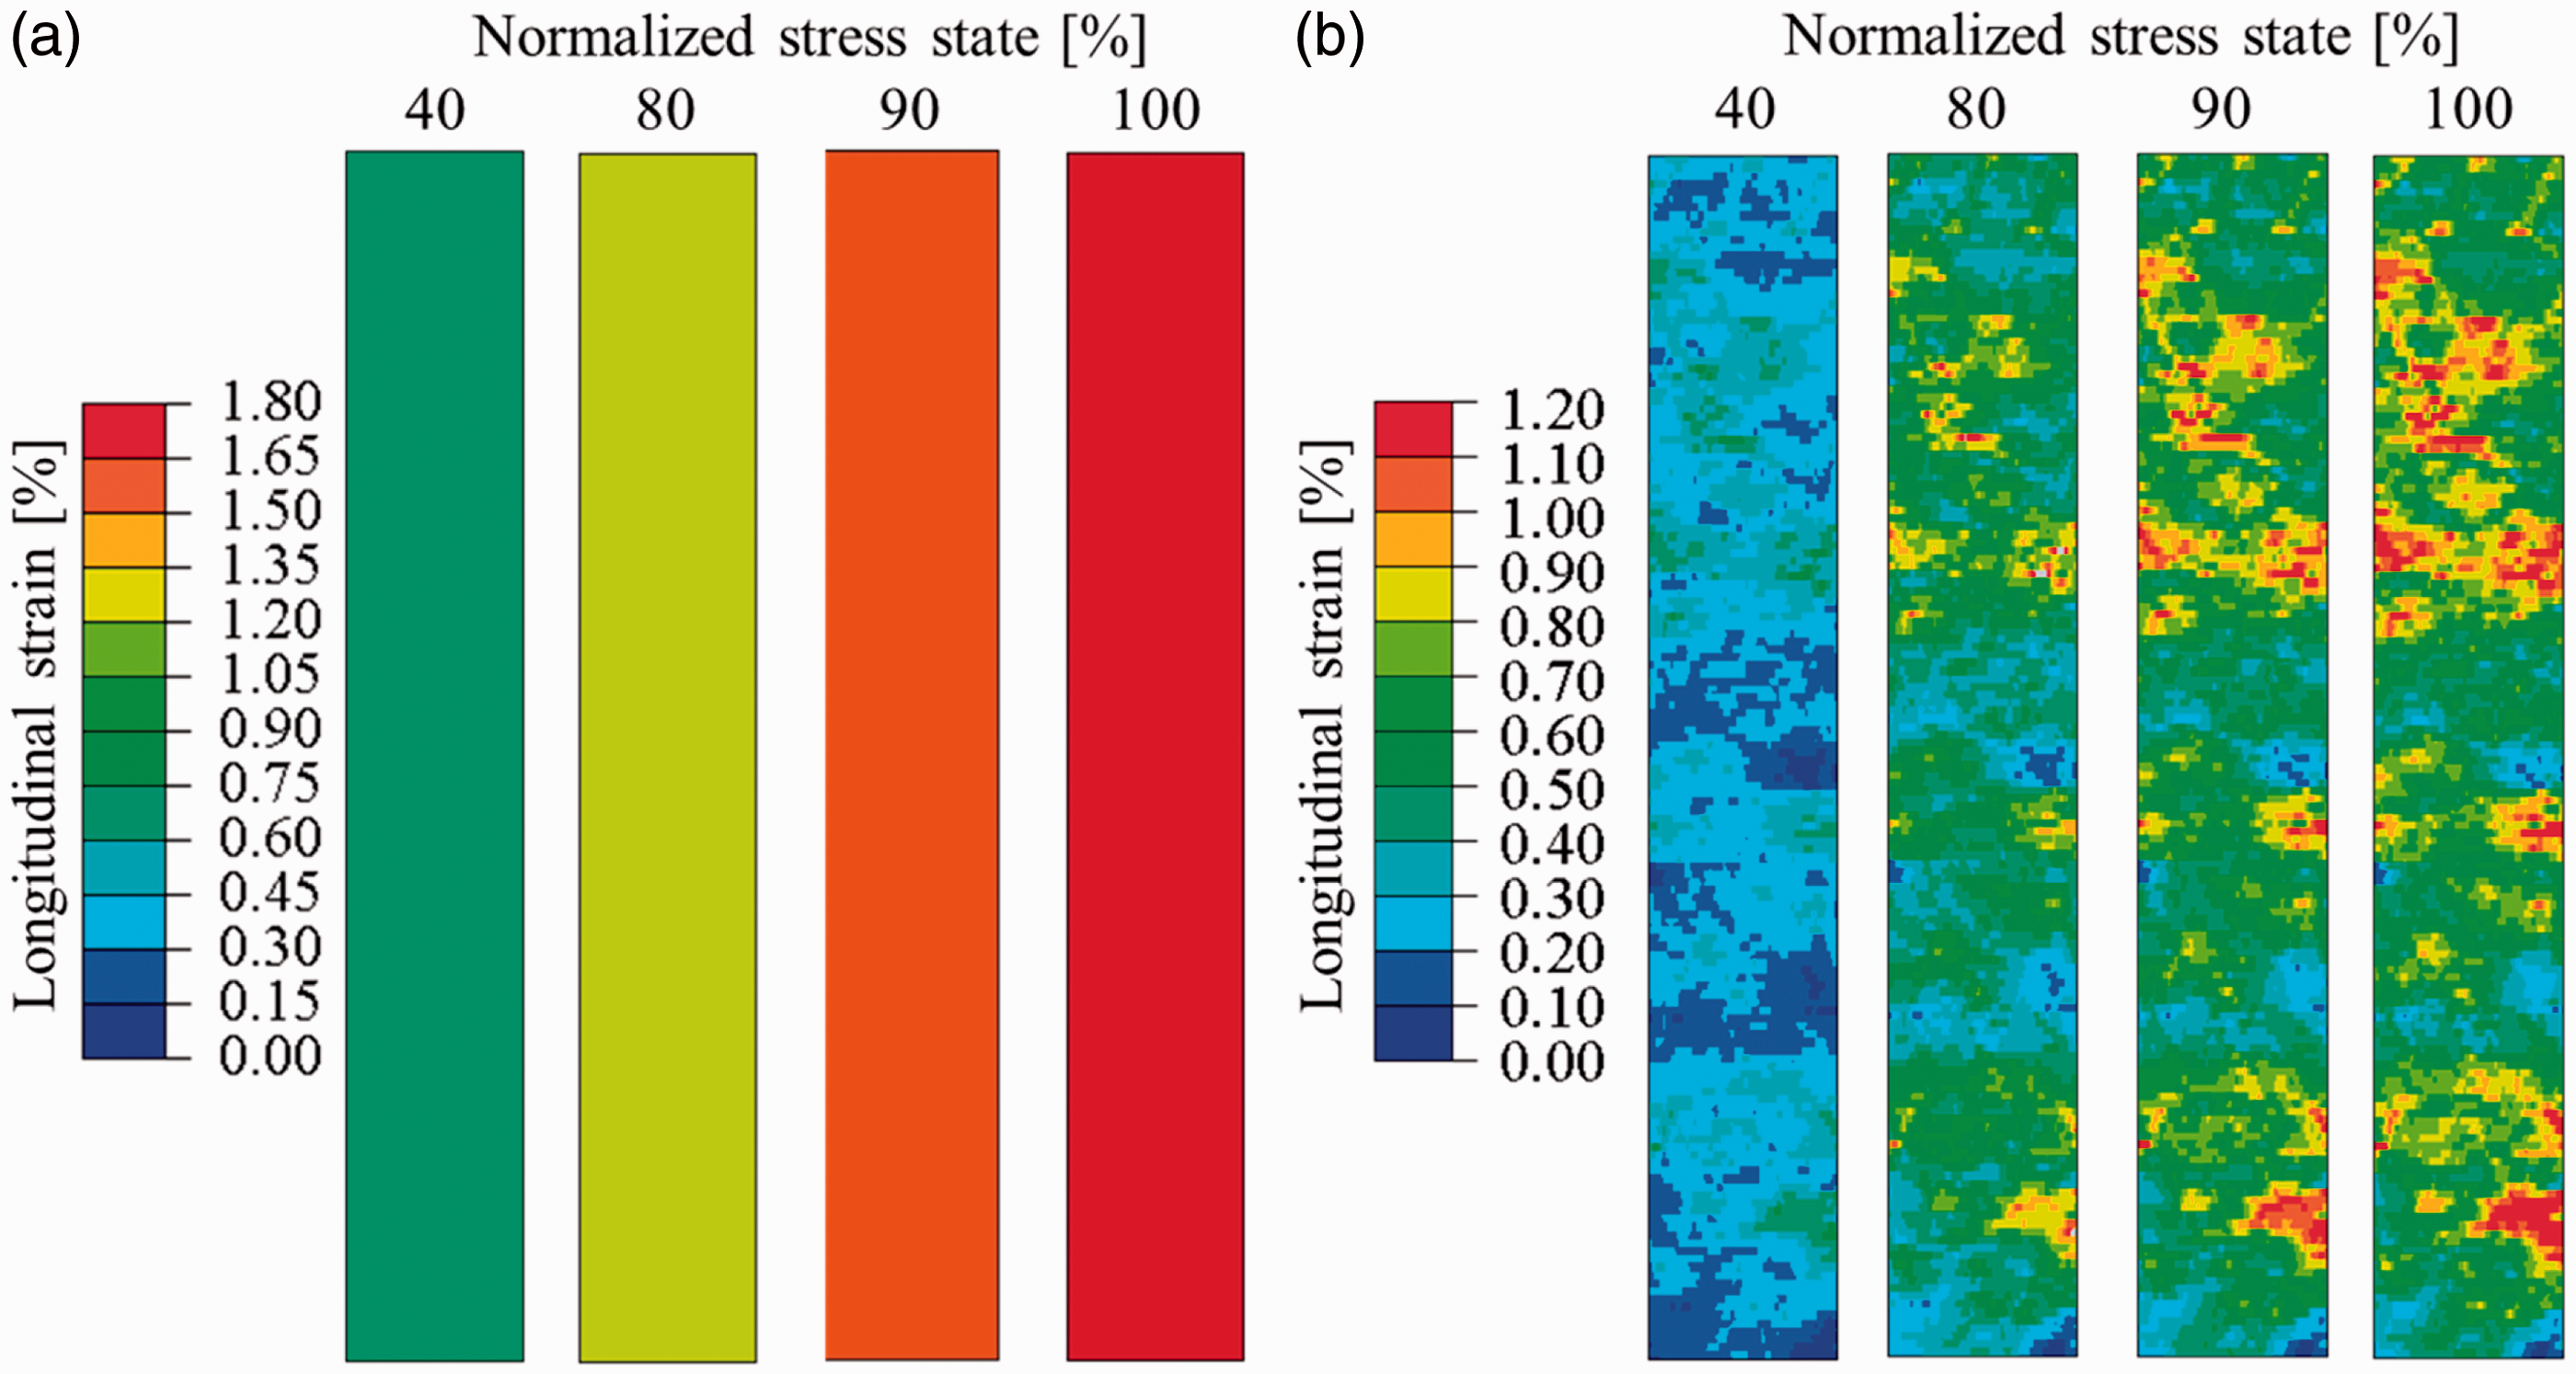
When it comes to part design, localized modulus variability may be unimportant as long as the overall stiffness is within tolerance (i.e. overall stiffness requirements for the part are met). Hence, an analogous stochastic modelling technique can be used to estimate the potential variability of the global stiffness among the moulded parts.
Eight specimens were tested experimentally and eight simulations with different randomized layups were run for each strand length to generate the average and variability results for modulus and strength, which are summarized in Figure 18. First modulus results are examined.
The effect of strand length on (a) modulus and (b) strength. Error bars show the standard deviation.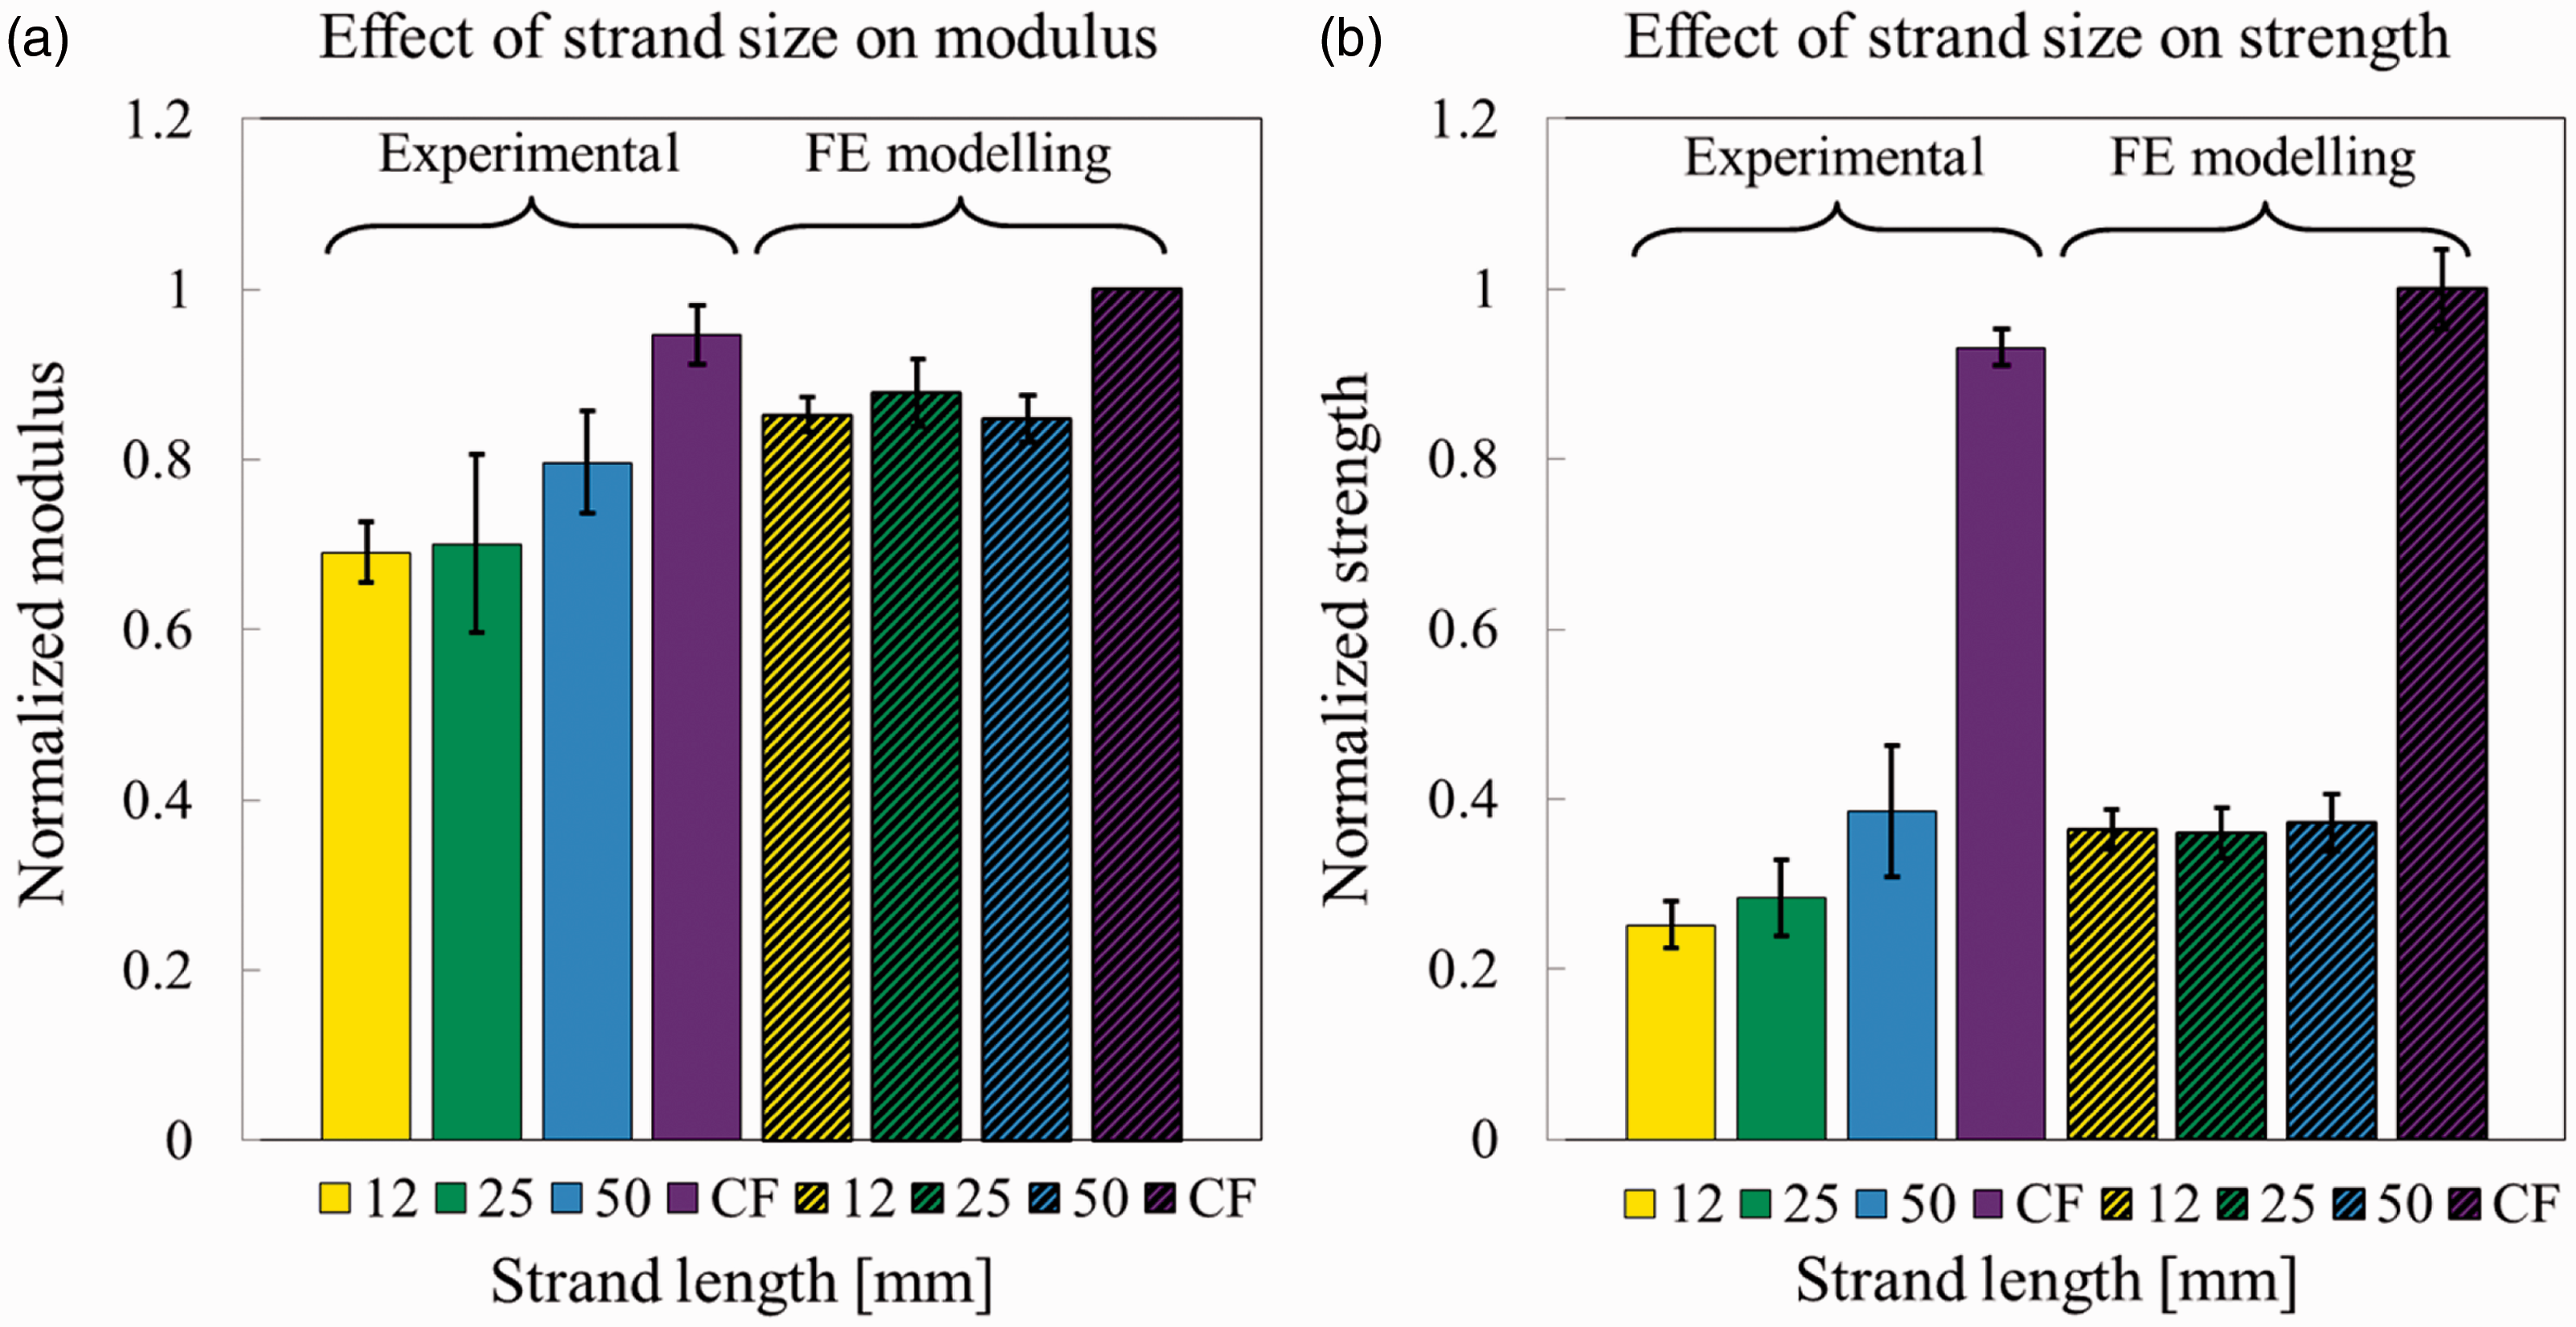
As shown in Figure 18(a), modulus of ROS composites from both experimental and modelling results is lower than that of CF laminates. Further analysis revealed that lower ROS modulus results from unsymmetrical and unbalanced layups, which led to non-zero coupling matrix (B) hence lowering the equivalent modulus, as was derived in Barton and Soden. 24 When the contribution of the coupling matrices is ignored, then the average modulus of ROS is the same as that of CF laminates. Hence, the reduction of modulus associated with ROS composites observed in modelling results is caused by the unsymmetrical and unbalanced layups, and the same is true for experimental results.
The model predicts well the modulus of ROS composites with longer strands and over-predicts for composites with shorter strands. Some of this discrepancy can be explained by the fact that smaller strands are more prone to be oriented out-of-plane, as depicted in the micrograph in Figure 6, and hence have lower in-plane modulus. The most accurate way of accounting for the out-of-plane orientation is to create a 3D model, which would be very complex considering material heterogeneity. One way of improving the proposed 2D model would be to use an orientation efficiency factor (

Measured and predicted strengths of ROS composites are summarized in Figure 18(b). Results for CF laminates were obtained from the average and standard deviation of two different layups: [0/±60]3S and [90/±30]3S. Overall, strength obtained with ROS panels is less than 40% of the strength of CF quasi-isotropic laminates. Performance of discontinuous-fibre composites is expected to be lower than that of CF composites in part due to the reduced ability of short fibres to carry load. Fibre ends have a dual negative effect on performance, they act as stress concentrations and essentially carry no load. Stress-distribution along the fibre varies from zero at the ends and increases towards the middle as the axial load is transferred to it through shear at the interface. As the fibre length increases, the load carrying efficiency also increases and mechanical properties are expected to increase eventually approaching those of CF composites. A simple shear-lag model can be used to estimate the fibre length above which, fibres are considered to be ‘continuous’. Based on that model, even the 12-mm long fibres should attain high properties, as was calculated in Selezneva et al. 4 Hence, there must be other factors besides fibre length that affect strength.
By examining experimental and modelling results, two possible explanations for the large reduction in strength can be suggested: (a) material heterogeneity and (b) matrix-dominated failure mode.
Examination of the cross-sectional micrographs of failed specimens shows that little damage developed away from the main fracture region, signifying that specimens fail at the weakest point while the rest of the specimen is still intact. Similar results were obtained through simulation. For instance, Figure 19 shows progressive failure of a simulated tensile specimen in terms of the evolution of Hashin’s (a) matrix tension and (b) fibre tension criteria. Only the first ply is shown, but it is representative of the general state of the entire specimen. There are a few regions with extensive matrix damage, but little fibre damage can be detected. Overall, it can be said that failure is localized, while a large portion of the specimen remains undamaged.
Progressive damage development depicted by Hashin’s (a) matrix tension and (b) fibre tension failure indices, where the value of ‘1’ signifies failure. Stress values represent the homogenized or average stress in the material and are normalized with respect to the failure load.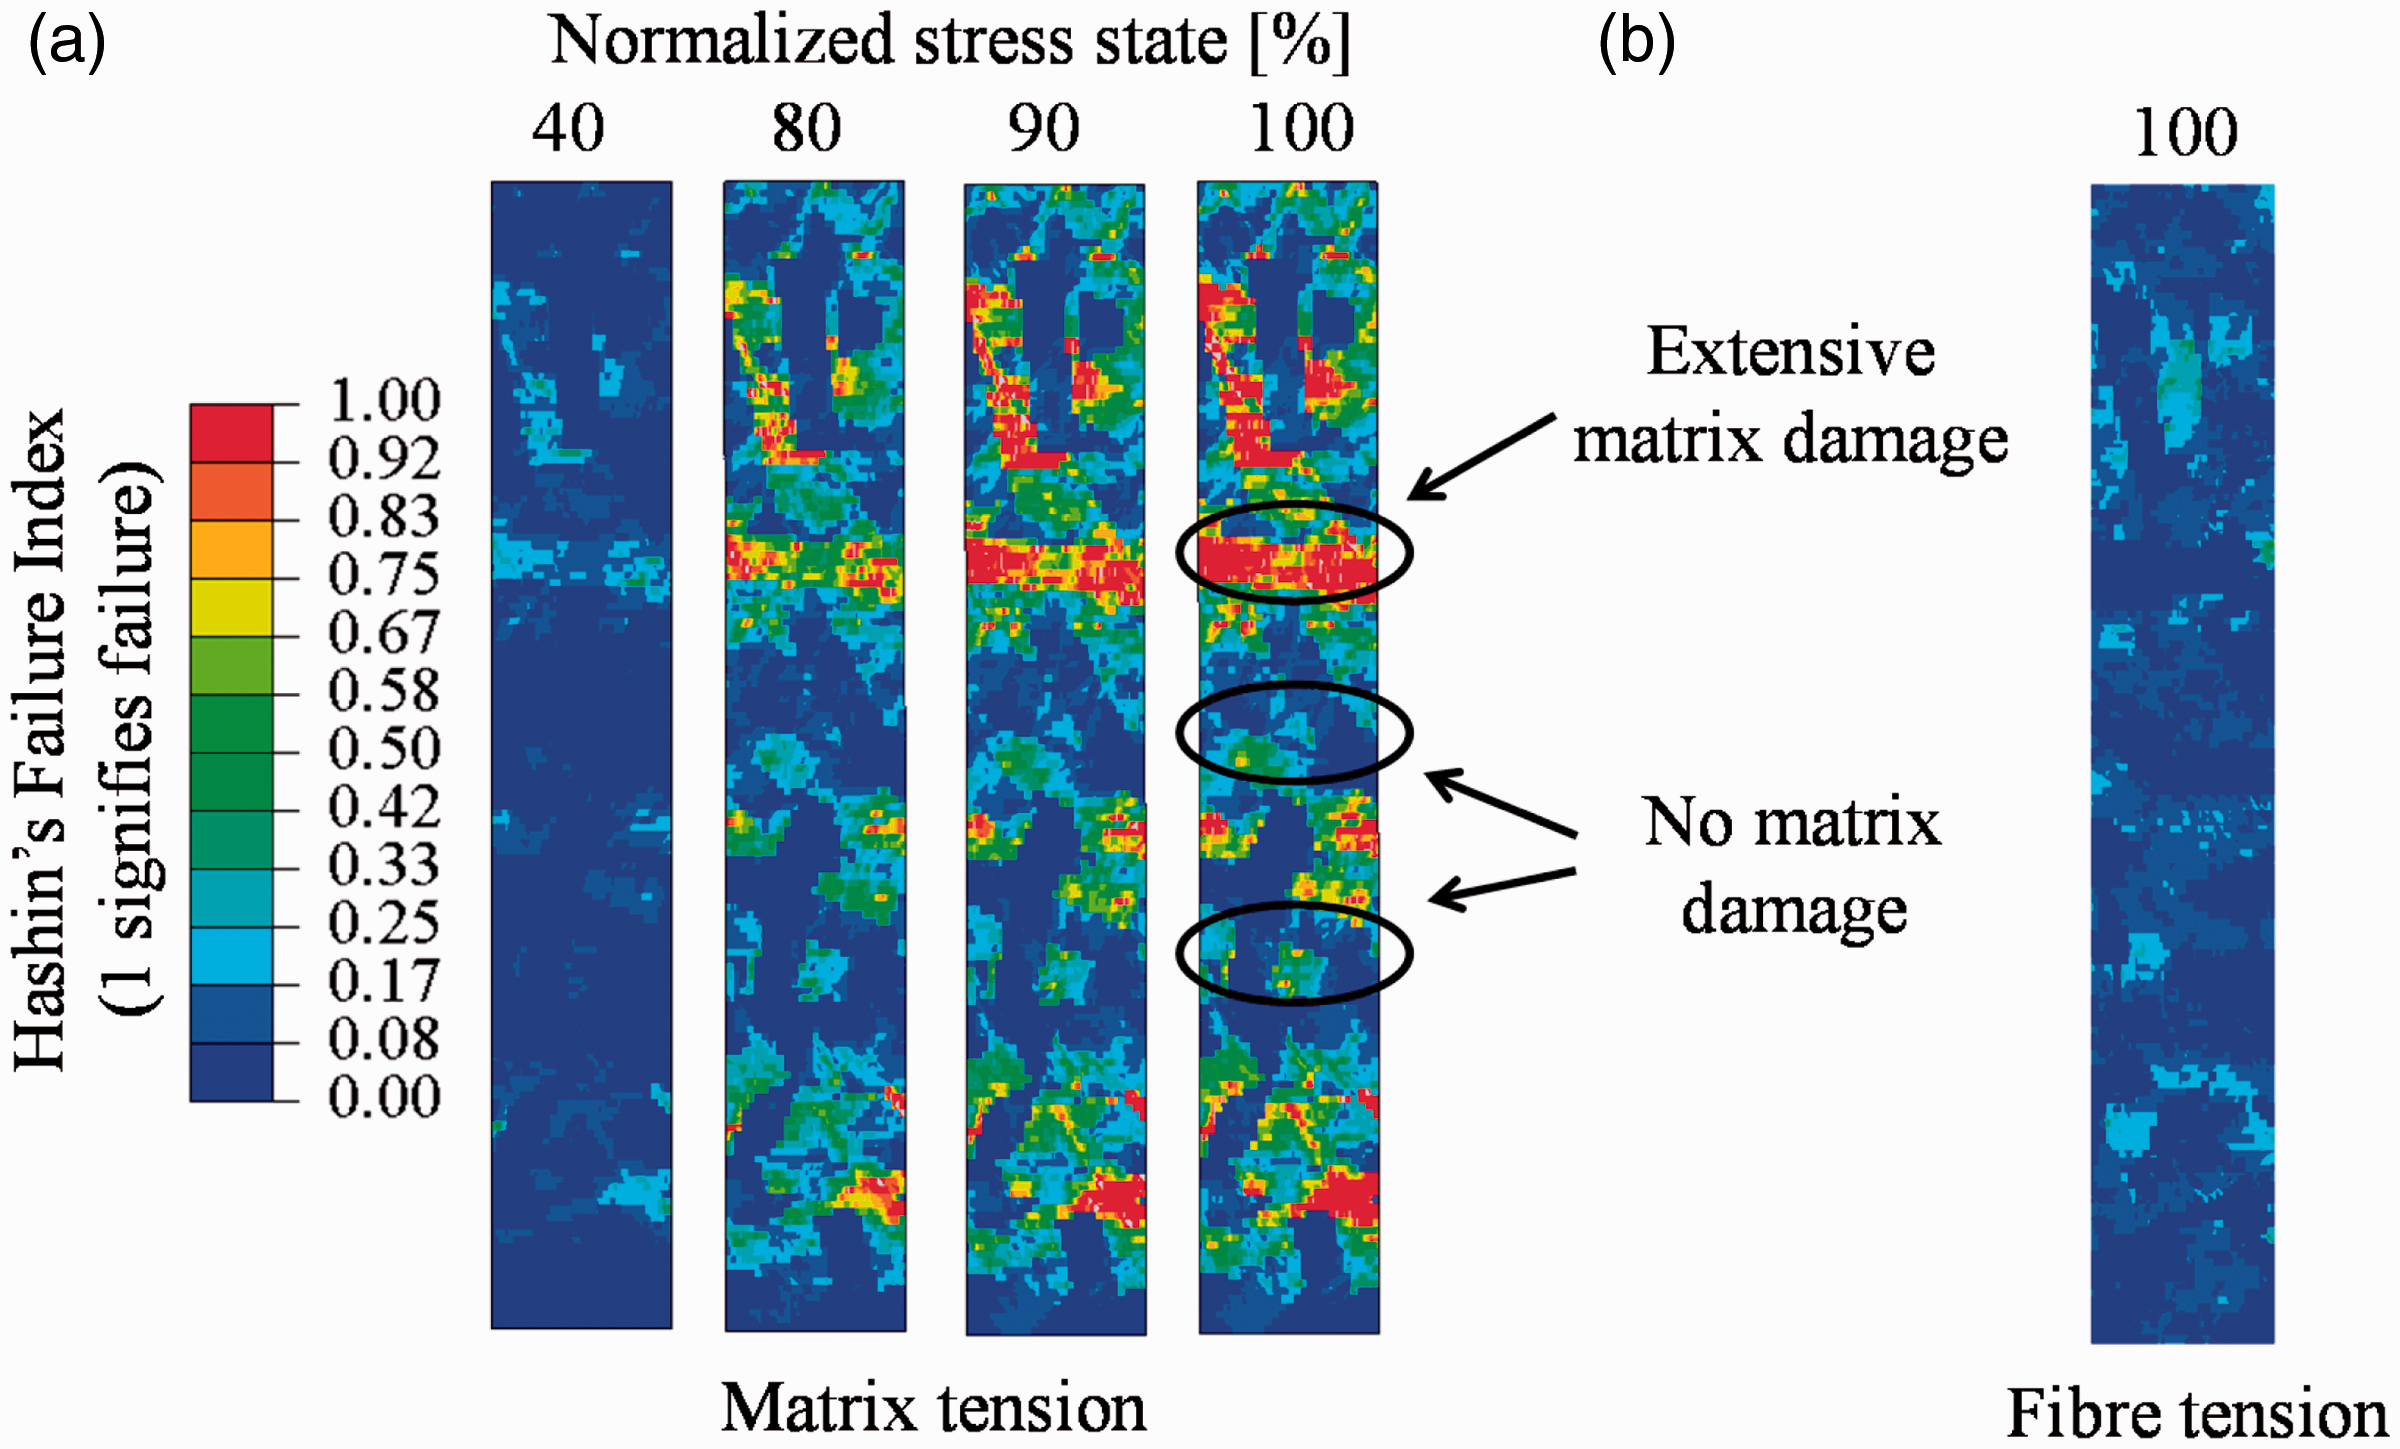
Strength of ROS composites is highly variable and even FE simulations predict a wide range of failure loads, as shown by the error bars in Figure 18(b). Material heterogeneity makes it difficult to predict the exact failure strength of ROS composites, and a statistical method is required to predict the range of possible outcomes. The modelling technique proposed in this article captures the non-uniform damage development within a specimen as well as a difference in load bearing capacity among them. From an industrial standpoint, variability is an important parameter since it is involved in the calculation of design allowables.
Test results also show that strength increases with strand length (Figure 18(b)). There are two possible explanations for this trend: (a) shorter strands have a higher incidence of being oriented out-of-plane and (b) once matrix cracks develop in the material, shorter strands are less able to resist the growth of interlaminar cracks. In fact, out-of-plane strand orientation has a twofold effect on strength; it implies that fibres are misaligned with respect to the loading directions, and it reduces the distance across the thickness that the interlaminar crack has to span. Micrographs of the edge of the failed specimens show that main failure modes in ROS composites are strand fracture (matrix failure) and strand pull-out, as shown in Figure 20. The analytical and experimental works of Pimenta et al.
26
and Czel et al.
27
have demonstrated that strength of unidirectional laminates with staggered strands (or slit-ply laminates) increases with strand or overlap length.
Fracture path in ROS composites.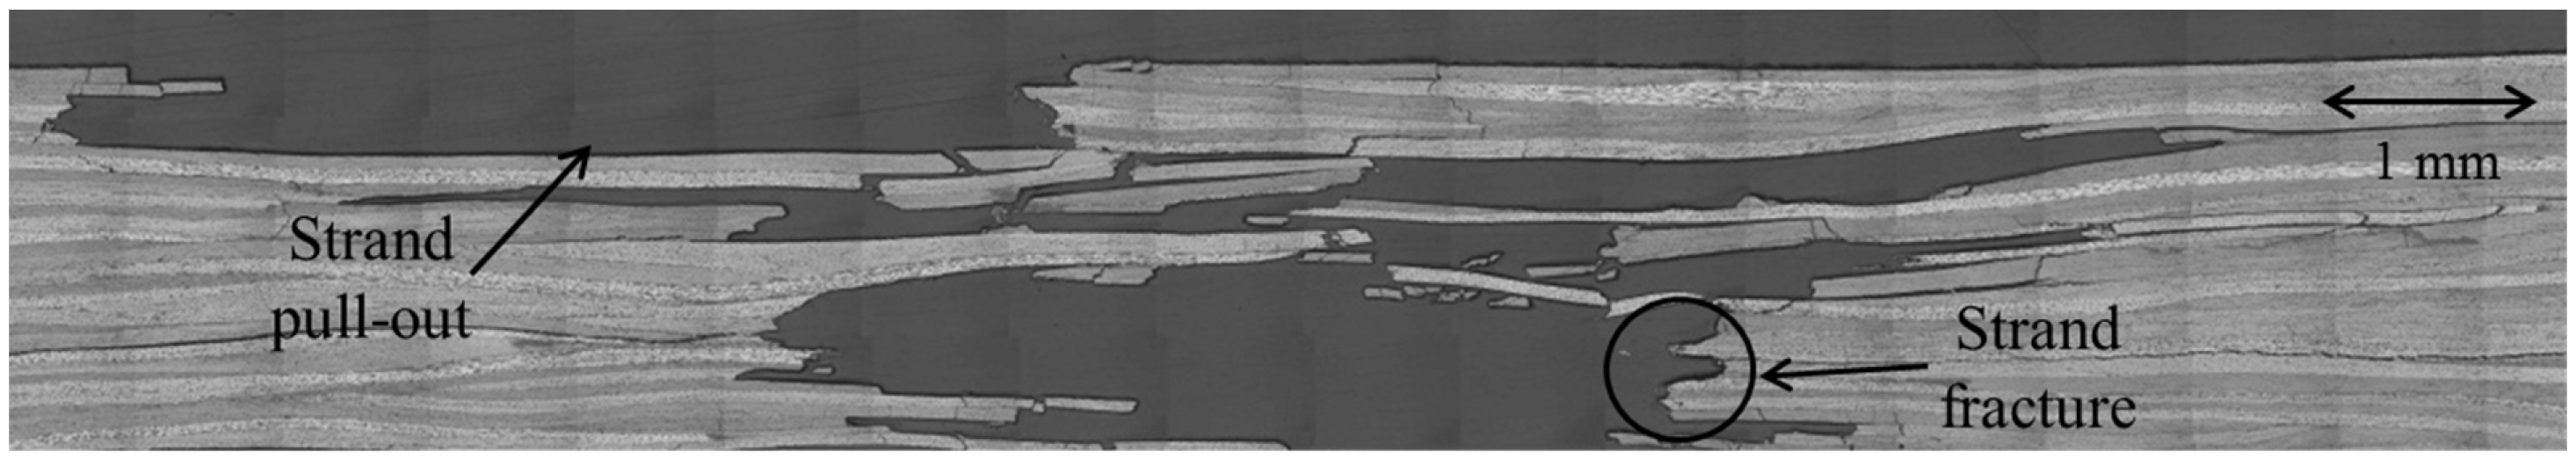
The effect of strand length on strength is not captured with the FE model, because the model does not consider the out-of-plane strand orientation and does not include the possibility of delamination. Nonetheless, the proposed model captures the effect of material heterogeneity and predicts a significant drop in strength when going from CF to ROS layups, and also demonstrates that fracture is a matrix-dominated event. Hence, it can be concluded that while strand size has an effect on strength, the biggest knockdown of strength comes from material heterogeneity, which leads to the presence of ‘weak-spots’.
The proposed model, while offering a simplified representation of the ROS microstructure, captures the major knockdown of strength between the CF and ROS composites and demonstrates that it is induced by the weak-spots from heterogeneity. The limiting aspect of the model is that it does not consider the interlaminar failure mode, which becomes more dominant as the strand length shortens. Further improvement of the model can be achieved by including out-of-plane strand orientation and interlaminar crack propagation or more realistic damage models, likely by extension to a 3D model.
Conclusion and future work
This article describes a modelling technique for estimation of strength and modulus of ROS composites. Whereas the earlier stiffness model that was proposed by Feraboli 16 predicts strain-fields that are partition size dependent, the current model alleviates this problem. This is the first strength model in the literature to be developed specifically for ROS composites. The main concept of the model is to discretize the simulated geometry into small regions or partitions, which can have different layup and effective properties, in order to account for the material heterogeneity. To achieve this, strands with random orientation and position are generated and placed within the geometry being simulated. Strands span across many partitions, enabling continuity between partitions. Strength and modulus are estimated by building an FE model in ABAQUS, applying a displacement to obtain modulus and using Hashin’s failure criteria and fracture energies to predict failure.
Experimental and modelling results showed that strength and modulus of ROS composites is variable from one specimen to another due to the heterogeneity of the material. Also, ROS composites fail at relatively low loads in comparison with CF laminates, mainly because failure occurs based on the ‘weakest-link’ principle and is matrix-dominated. Overall, the stochastic approach presented in this article can successfully capture the heterogeneity of strength and stiffness of ROS materials, and it can be implemented into more complex strength models or adapted for other purposes, such as modelling of thermal residual stresses.
Footnotes
Acknowledgement
The authors would like to acknowledge the National Research Council of Canada for providing the facilities, equipment and assistance with fabrication and preparation of the specimens.
Declaration of Conflicting Interests
The author(s) declared no potential conflicts of interest with respect to the research, authorship, and/or publication of this article.
Funding
The author(s) disclosed receipt of the following financial support for the research, authorship, and/or publication of this article: McGill University and the industrial partners: Bell Helicopter Textron Canada Limited, Bombardier Inc., Pratt and Whitney Canada Corp., Marquez Transtech Limited, Delastek Inc. and Avior Integrated Products Inc; Natural Sciences and Engineering Research Council (NSERC) and the Consortium for Research and Innovation in Aerospace in Quebec (CRIAQ).