
Abstract
The increasing use of composite in the aircraft industry has raised the interest for a better understanding of the failure process in these materials, which can be also influenced by the manufacturing process of the laminate. Some materials used in vacuum assisted resin transfer molding process have been studied in the open literature but very few data have been published for resin transfer molding-6 epoxy based laminates, in particular studies showing the influence of the temperature on the interlaminar fracture behavior of this type of laminates. The aim of this article is to investigate the interlaminar fracture behavior of resin transfer molding-6 based carbon composite laminates manufactured by vacuum assisted resin transfer molding subjected to Modes I and II at 25℃ and 80℃. The results show the influence of the temperature on the interlaminar fracture toughness of composites and provide a database to design composite aerostructures subjected to temperatures commonly experienced in civil aviation. The fracture aspects of the tested laminates were also investigated and directly related to the trend in results found for the fracture toughness values.
Keywords
Introduction
Composite materials have significant advantages over conventional metal alloys because of their high strength-to-weight ratio, energy absorption capabilities, flexibility in tailoring directional properties, and ability to take complex shapes. Globally, composites are being extensively used for aerospace, defense, transportation, and many other industries. 1 However, one the main drawbacks of composites for aerospace applications is the high costs of production. Traditional manufacturing processes based on autoclave are very expensive. 2
Therefore, new techniques have been developed to maintain and/or, if possible, to improve the composite materials properties, reducing the manufacturing costs. One such technique with low cost is the vacuum assisted resin transfer molding (VARTM). 3
The VARTM is widely used as an alternative to the open mold techniques to produce large components. The VARTM has being widely used by boat and wind turbine blades manufacturers. Significant advances in VARTM research all around the world led to improved quality of this technique. VARTM has been considered promising to replace high-cost conventional fabrication techniques based on autoclave in aerospace industry. 4
During the processing of composites obtained by VARTM, the components may exhibit the voids formation in their interior and on the surface. These voids are formed due to potential problems during manufacturing process, such as vacuum bag leakage, low resin permeability, and low compaction pressure between layers. 5 The presence of voids in the polymer matrix can influence directly the shear strength, interlaminar, compression and transversal tensile strengths, where the matrix dominated mechanical properties have a greater influence on the composite behavior.6,7
Generally, in this process, the main role of resin is filling the void between preform fibers, so that the resin can permeate and fill these gaps effectively, but the resin must have low viscosity. The low viscosity may be related to the total infusion time that it must be determined by the viscosity change with time and/or temperature. Because of this, the thermoplastic matrices have greater difficulty for use in infusion processes and they are not indicated for this use. This is mainly because of their high molecular weight and, consequently, high viscosity. Since the thermoset resins are preferred, they have better processability. 8 These have a higher viscosity variation with time/temperature. Initially, during the isothermal curing treatment, a transition from rubber to glassy state takes place, this transition increases the system viscosity progressively. After this process, the resin transforms to glassy state during curing indicating that the crosslinking process was completed. 9
Many thermosetting resins, as epoxy and vinyl ester, have been used in different studies that comprise the VARTM technology, such as hygrothermal behavior, 10 correlation of void distribution, 11 flow rate control, 12 tension–compression fatigue behavior, 13 bearing properties of composite materials, 14 and others.
However, the RTM-6 is a one component system especially developed for the aerospace industry and is widely used as a matrix in composite materials. In particular, the system is designed for the resin transfer molding (RTM) production processes. 15
Cioffi et al. 16 studied the fatigue strength of carbon fiber/RTM-6 laminates comparing with the aluminum alloy Al 7050 T7451. They obtained better fatigue behavior for the NC2/RTM6 laminate when compared with the aluminum alloy.
Verdiere et al. 17 investigated the dynamic delamination Mode II on tufted and untufted NCF/RTM-6 composites. They observed that the untufted specimens show unstable failure once damage is initiated. Tufts are beneficial on the dynamic Mode II response as they increased the energy absorption considerably and reduced the crack speed significantly. GIIC for the tufted composites is slightly positively dependent on the ELS specimen (End Loaded Split) loading velocity.
Gerlach et al. 15 characterized the RTM-6 using the quasi-uniaxial compression, uniaxial tension, and 3-point bending and compared with a FE model. The results generated data that contributed to the understanding of the observed differences between compressive and tensile behavior at high rates of strain.
Terekhina et al. 18 measured the elastic modulus of epoxy resin RTM-6 as a function of temperature, using an indirect sphere/plane indentation methodology, which consists in applying a given normal force followed by few tiny partial slip fretting cycles to mark the contact area. These results were compared with dynamic mechanical analysis (DMA) data and a very good agreement was found between these fretting results and data given by DMA. The epoxy resin RTM-6 was specifically developed to fulfill the requirements of the aerospace and space industries in RTM processes. It is a premixed epoxy system of the tetraglycidyl-diamino-diphenyl-methane (TGDDM) type suitable for service temperatures from −60 up to 180℃.18,19
As cited, the RTM-6 resin has been widely studied, but no data for RTM-6 laminates have been published showing the temperature influence on the interlaminar fracture behavior in the quasi-static loading regime. Consequently, to increase the reliability of the use of these materials, it is important to better understand the delamination mechanism and characterize the interlaminar fracture toughness.
This paper investigates the interlaminar fracture toughness of carbon/RTM-6 composite specimens manufactured by VARTM when they are subjected to temperatures equivalent to those that the composites whilst in service, mainly in aeronautical applications. For this purpose, specimens were tested in Modes I and II loading at different operating temperatures: 25℃ and 80℃ in order to investigate the influence of temperature and the specimens processing type on the toughness values. The fractographic analysis and DMA were carried out in other to assist the interpretation of the experimental data.
Experimental procedure
Specimen preparation
VARTM
The materials used to prepare the laminated specimens by VARTM process were a plain weave carbon fiber HexTow® AS4 and a bicomponent epoxy resin HexFlow® RTM6-2 both manufactured by Hexcel Composites.
The plain weave carbon fiber layers were laid down in a plain mold forming a rectangular panel (300 mm ×400 mm) with 24 layers (0/90°) of dry carbon fabric and a Teflon® film 0.085 mm thick inserted in the midplane to represent the initial crack required by the test. A vacuum bagging was placed around the stack. After that, the vacuum bag was tested to observe any air intake.
The components of resin was degassed during 2 h, mixed and heated at 80℃ during 30 min. The mixture was injected by gravity action combined with the vacuum pressure into the bag. After the injection, the stack was covered by a thermal blanket heated at 160℃ during 75 min and then the infusion arrangement was brought to a heated oven at 180℃ during 120 min (heating rate: 1℃/min) to post cure process. Then, the panel was demolded and inspected by ultrasonic scanning to observe any discontinuity in the panel. The volume fraction of AS4 carbon fibers laminate was verified in the order of 54.8% and was obtained by using the method of chemical digestion of epoxy resin RTM6-2, according to ASTM D3171-11. 20
Specimens' dimensions.
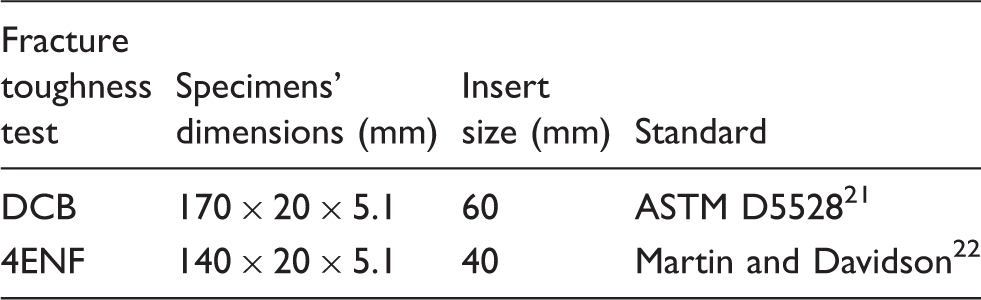
To measure with accuracy, the delamination extension, the lateral surfaces of each specimen was painted white. After the ink drying, initial marks were made on the painted surface of 1 mm increments for the first 50 mm of growth from the delamination front and then in 5 mm increments for a further 30 mm of crack extent.
Test procedures
DMAs
Dynamic mechanical measurements were performed with a NETZSCH DMA 242C. Samples were prepared as rectangular shapes suitable for DMA tests. Dimensions of the cut specimens were 35 mm ×2.5 mm × 1.5 mm. All the experiments were carried-out in single point bending mode with a frequency of 1 Hz, dynamic force 4 N, amplitude of 30 µm and the temperature range 25–250℃. The temperature heating rate was 5℃/min. The DMA calibration have different post processing procedures, these automatic post processing procedures allow calibrating the height, furnace temperature, and force. The temperature calibration was made using the melting point of high purity indium.
DCB tests
The DCB specimens were loaded by using aluminum alloy end blocks. The aluminum blocks were polished, cleaned, and bonded with epoxy adhesive to the each side of specimens where there was the Teflon® film.
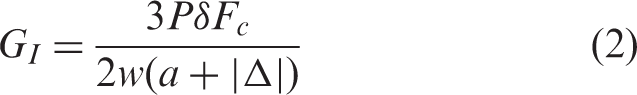
The specimen was attached to the grip of a mechanical testing machine INSTRON model 5500R eletromechanical equipped with a load cell of 2 kN. The load was applied at a rate of 1 mm/min. The tests were performed at 25℃ and 80℃, relative humidity of 50%. A thermal chamber was coupled to the testing machine to carry out high temperature tests (80℃). The whole test setup is depicted in Figure 1.
Experimental apparatus used to characterize interlaminar fracture toughness.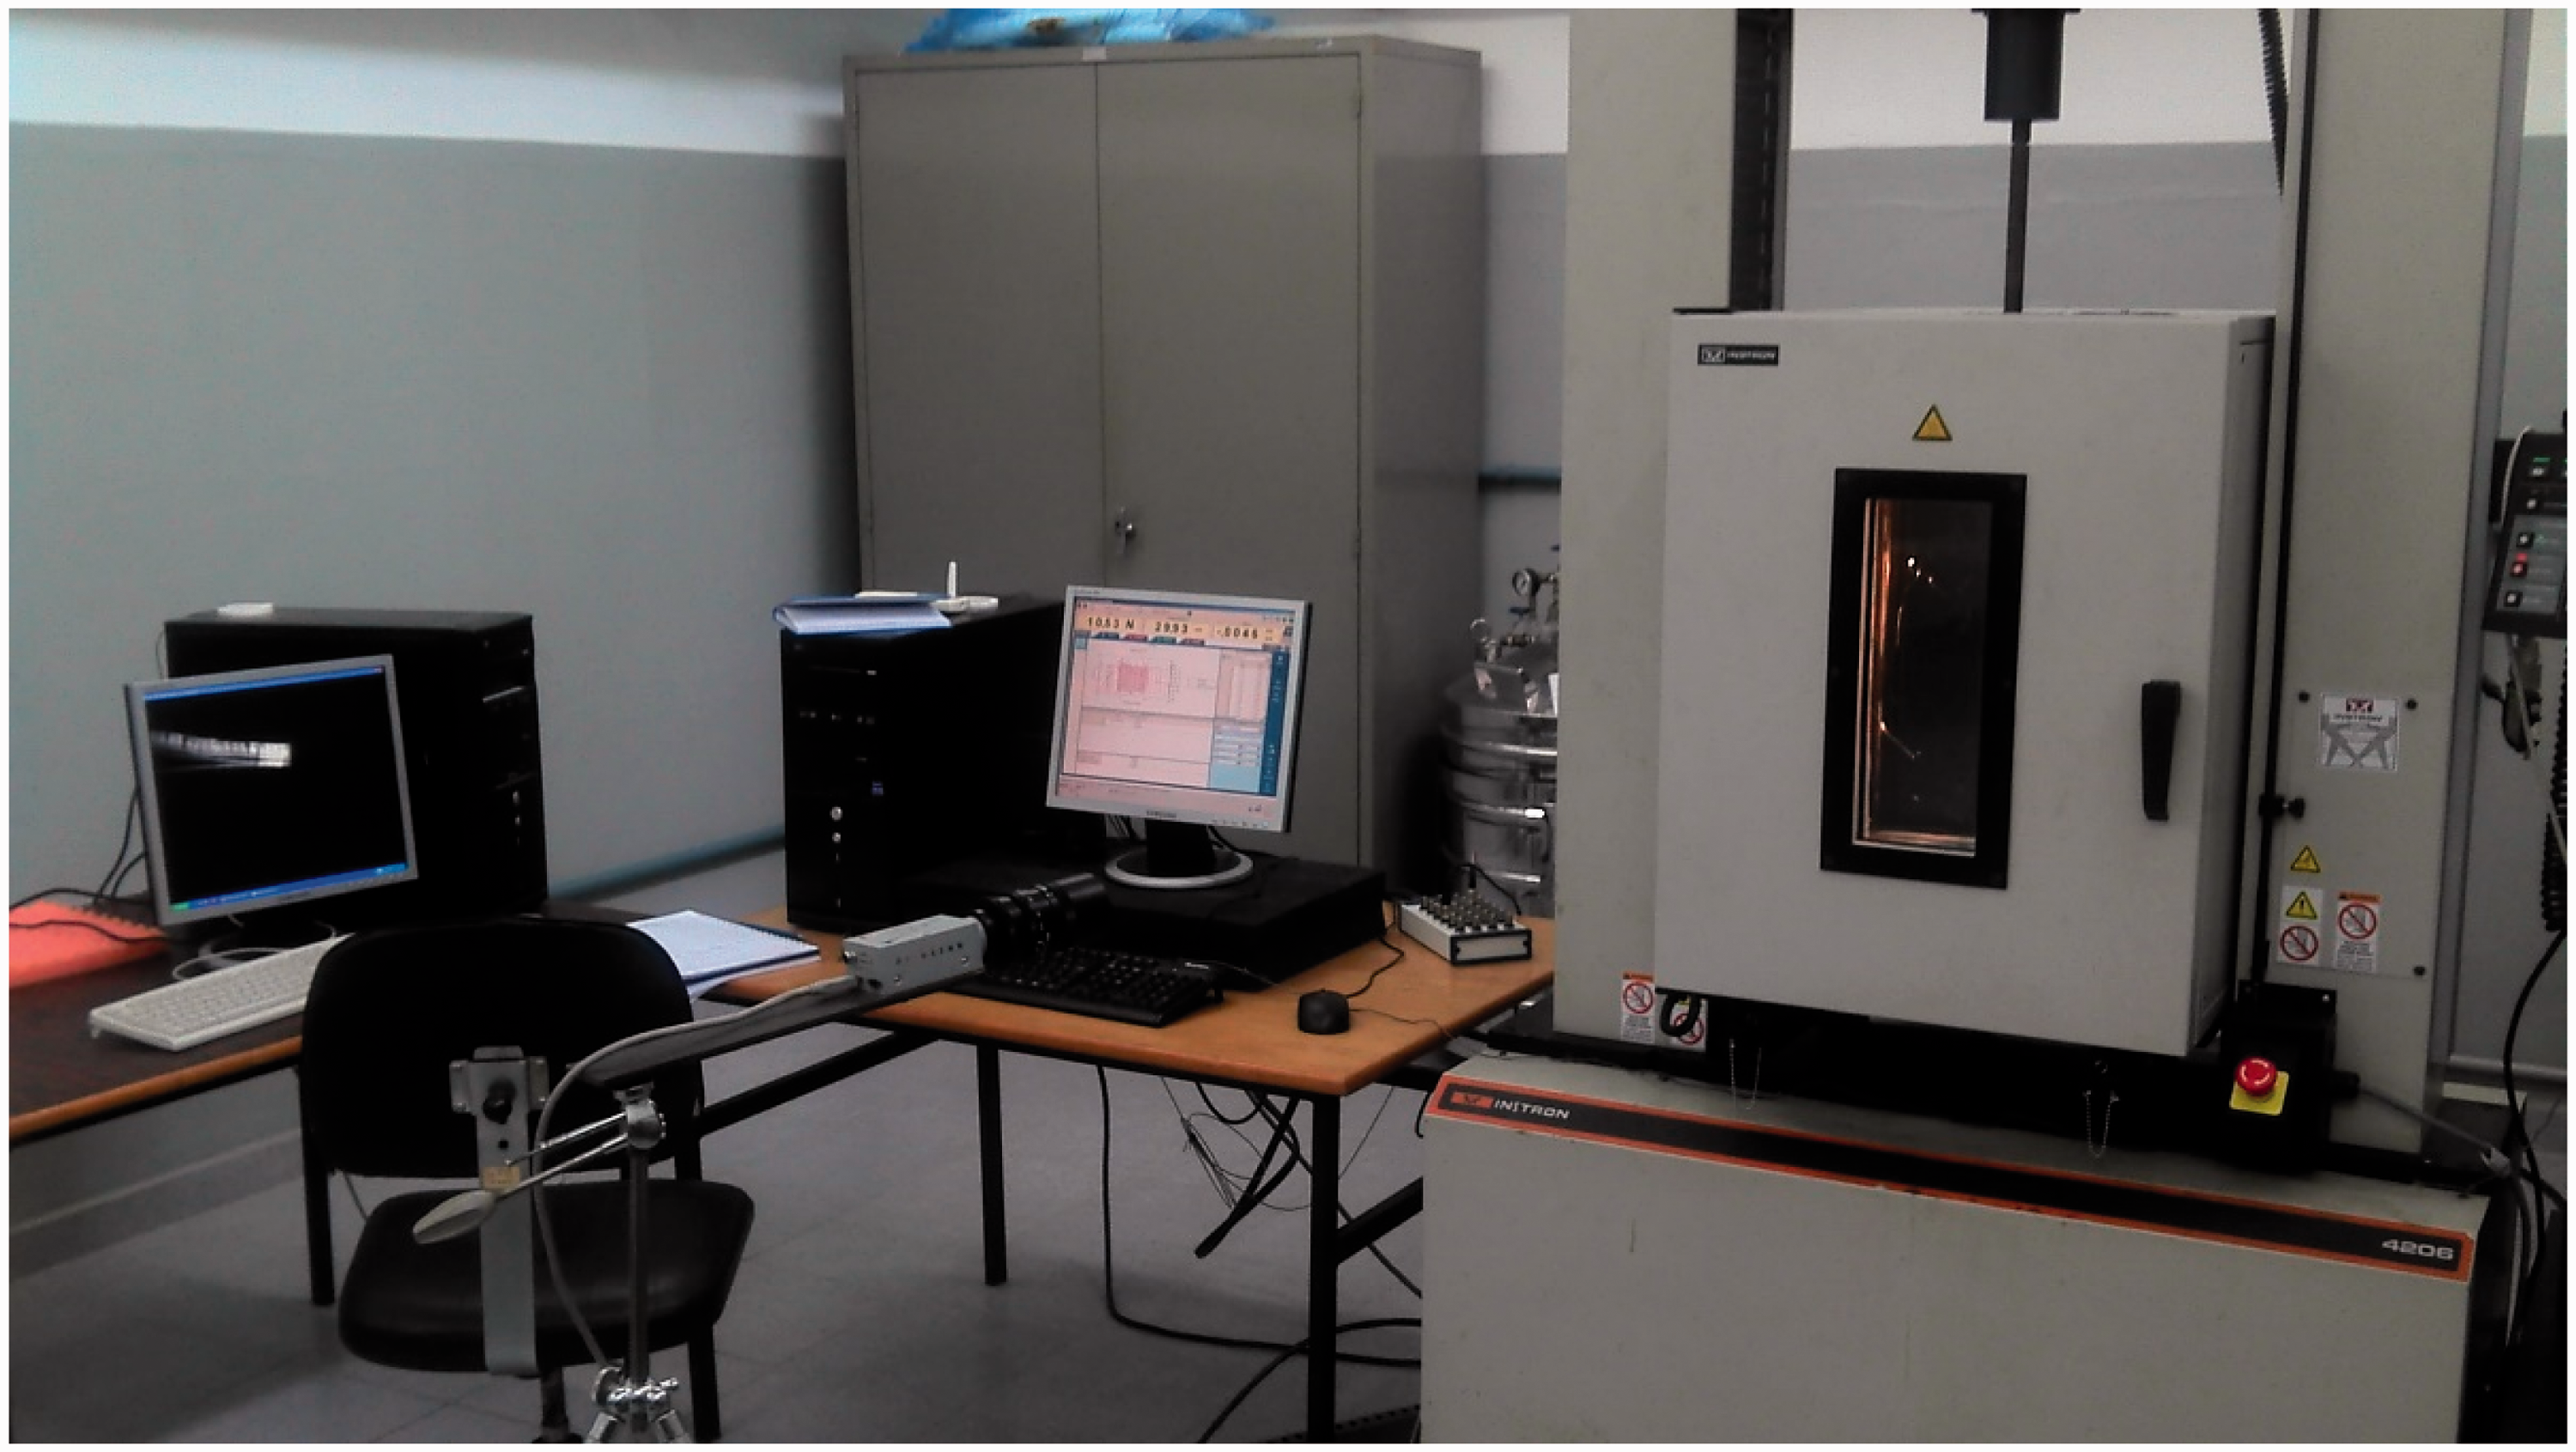
The delamination front extension, in function of load and displacement, was recorded by a crack marker that was pressed every time the crack had crossed a vertical line marked on specimen. A CCD camera was positioned on one side of the specimens to improve the observation of the delamination front (crack tip).
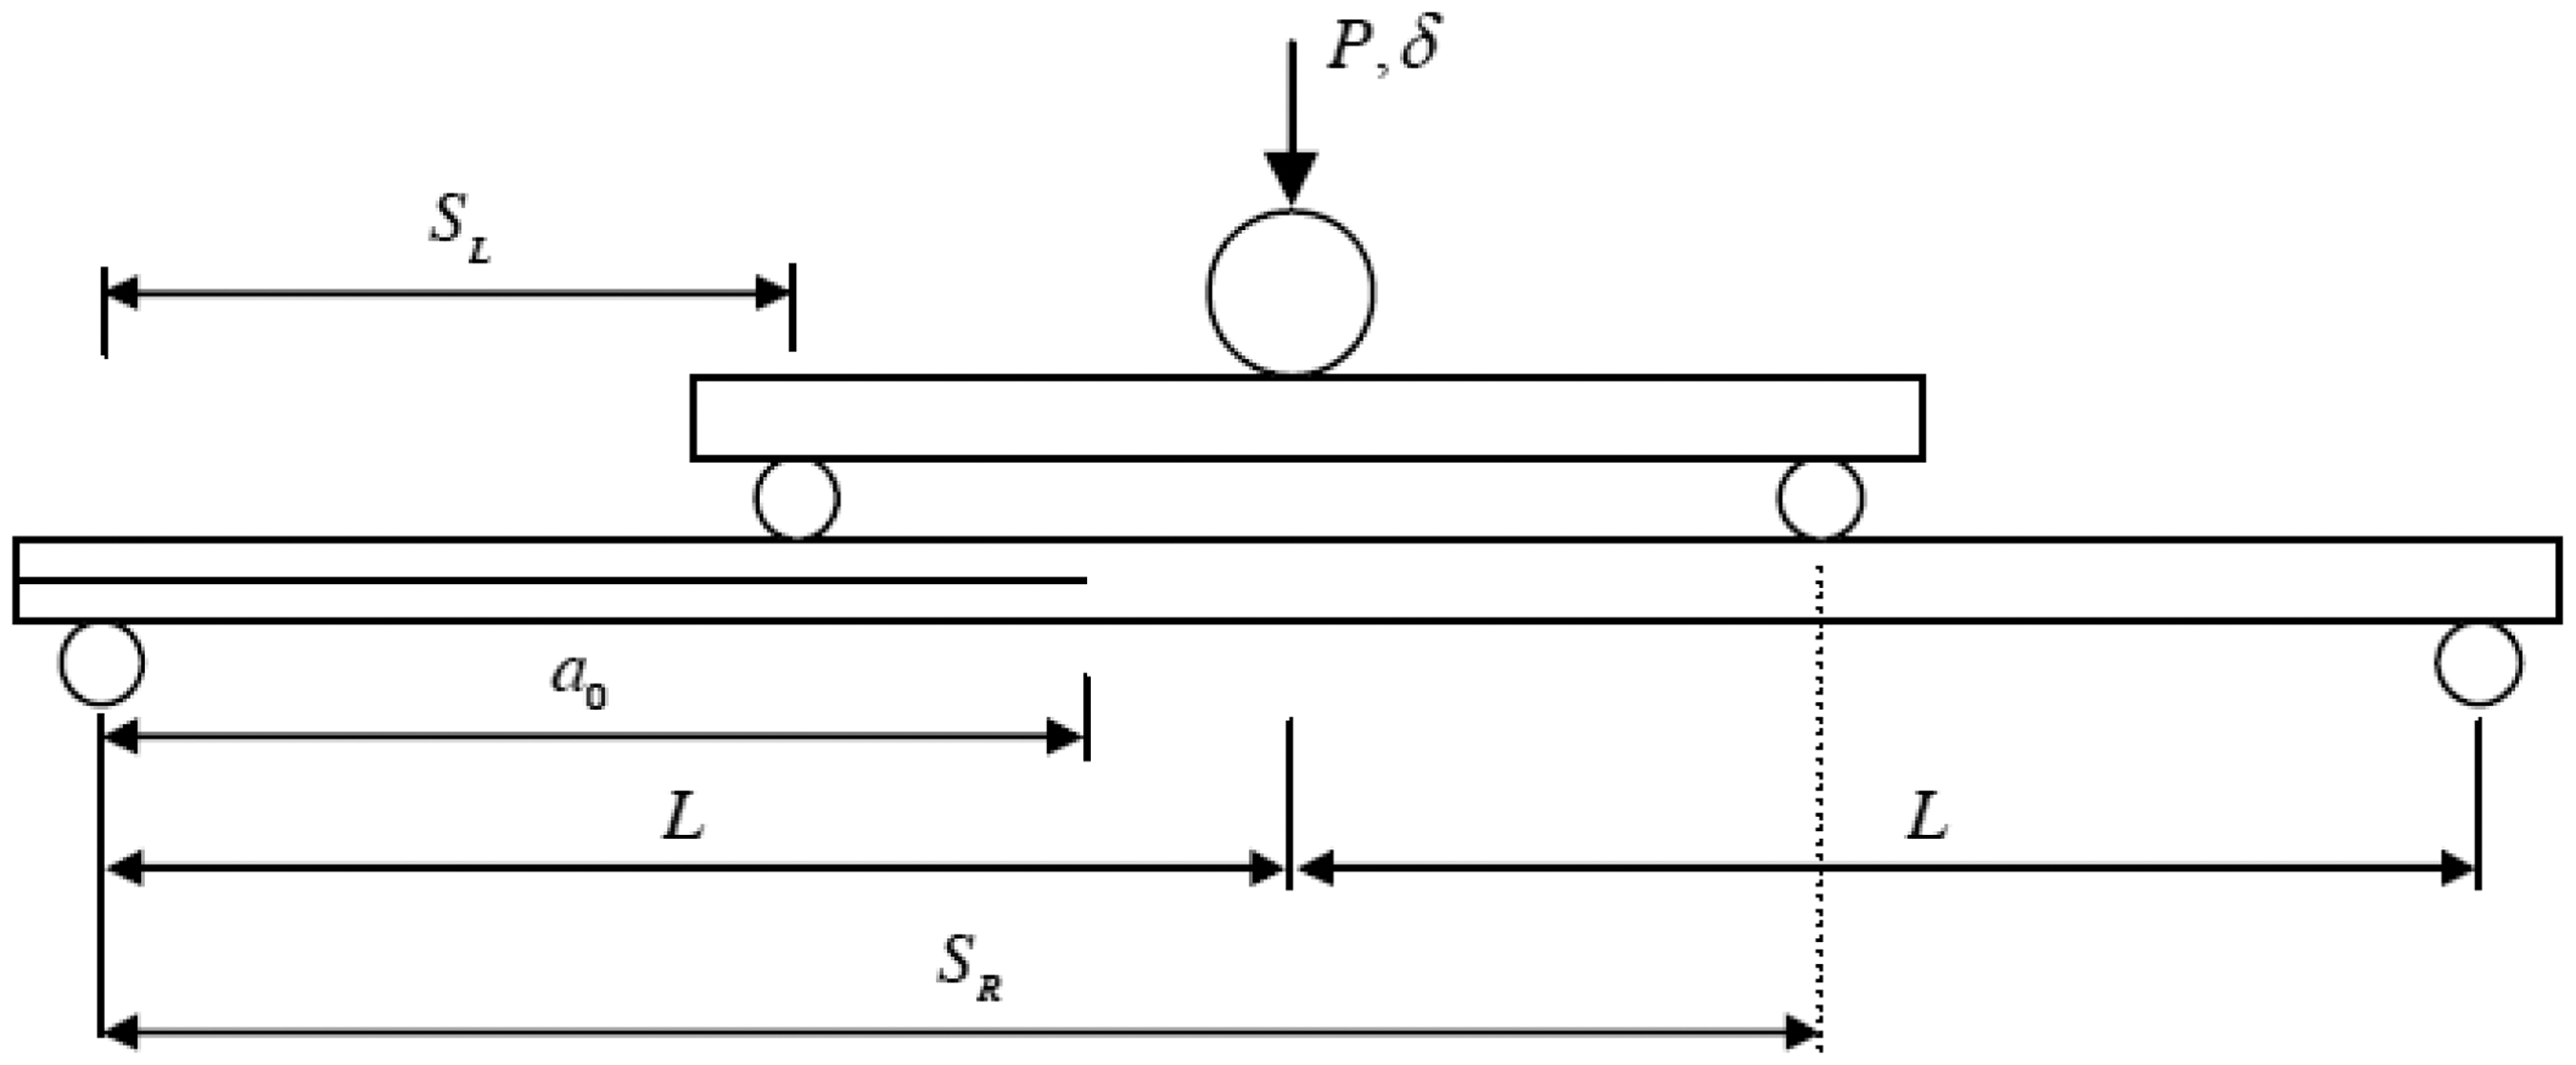
Figure 2 shows the loading configuration for the DCB tests, where P, e, and δ are symbols that represent, respectively, the applied load and the load point transversal displacement, α the delamination extension, and w the specimen width.
21
Loading configuration for DCB tests.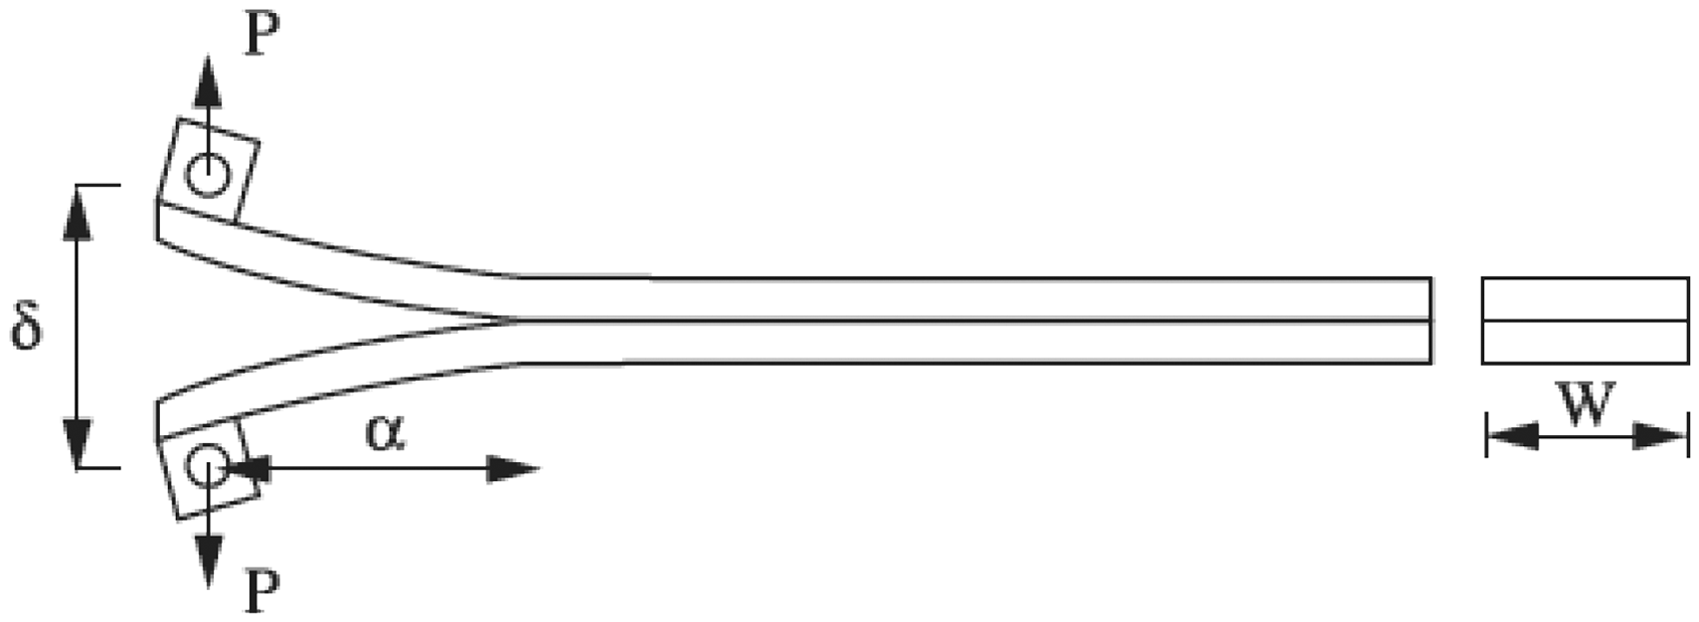
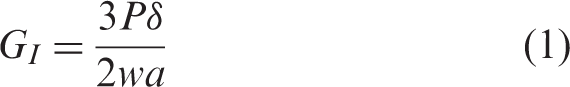
The strain energy release rate of a double cantilever beam was determined based on the modified beam theory, given as follows (equation (1))
21
:
In practice, this expression will overestimate GI because the beam is not perfectly built-in (that is, rotation may occur at the delamination front). One way of correcting for this rotation is to treat the DCB as if it contained a slightly longer delamination, a + |Δ|, where Δ may be determined experimentally by generating a least squares plot of the cubic root of compliance, C1/3, as a function of delamination length. The compliance, C, is the ratio of the load point displacement to the applied load, δ/P and Fc are the correction factor associated to larger displacements. The values used to generate this plot should be the load and displacements corresponding to the visually observed delamination onset on the edge and all the propagation values. The expression to compute the Mode I interlaminar fracture toughness including the corrections for large displacements and rotations is given by
21
:
4ENF tests
In these tests, the specimens were positioned in a four-point bending test apparatus shown in Figure 3. The testing apparatus was connected to an INSTRON model 5500R eletromechanical testing machine equipped with a load cell of 30 kN. The load was applied at a rate of 1 mm/min. The tests were conducted at 25℃ and 80℃, relative humidity of 50%. A thermal chamber was coupled to the testing machine to carry out the high temperature tests (80℃).
Experimental apparatus used in 4ENF tests.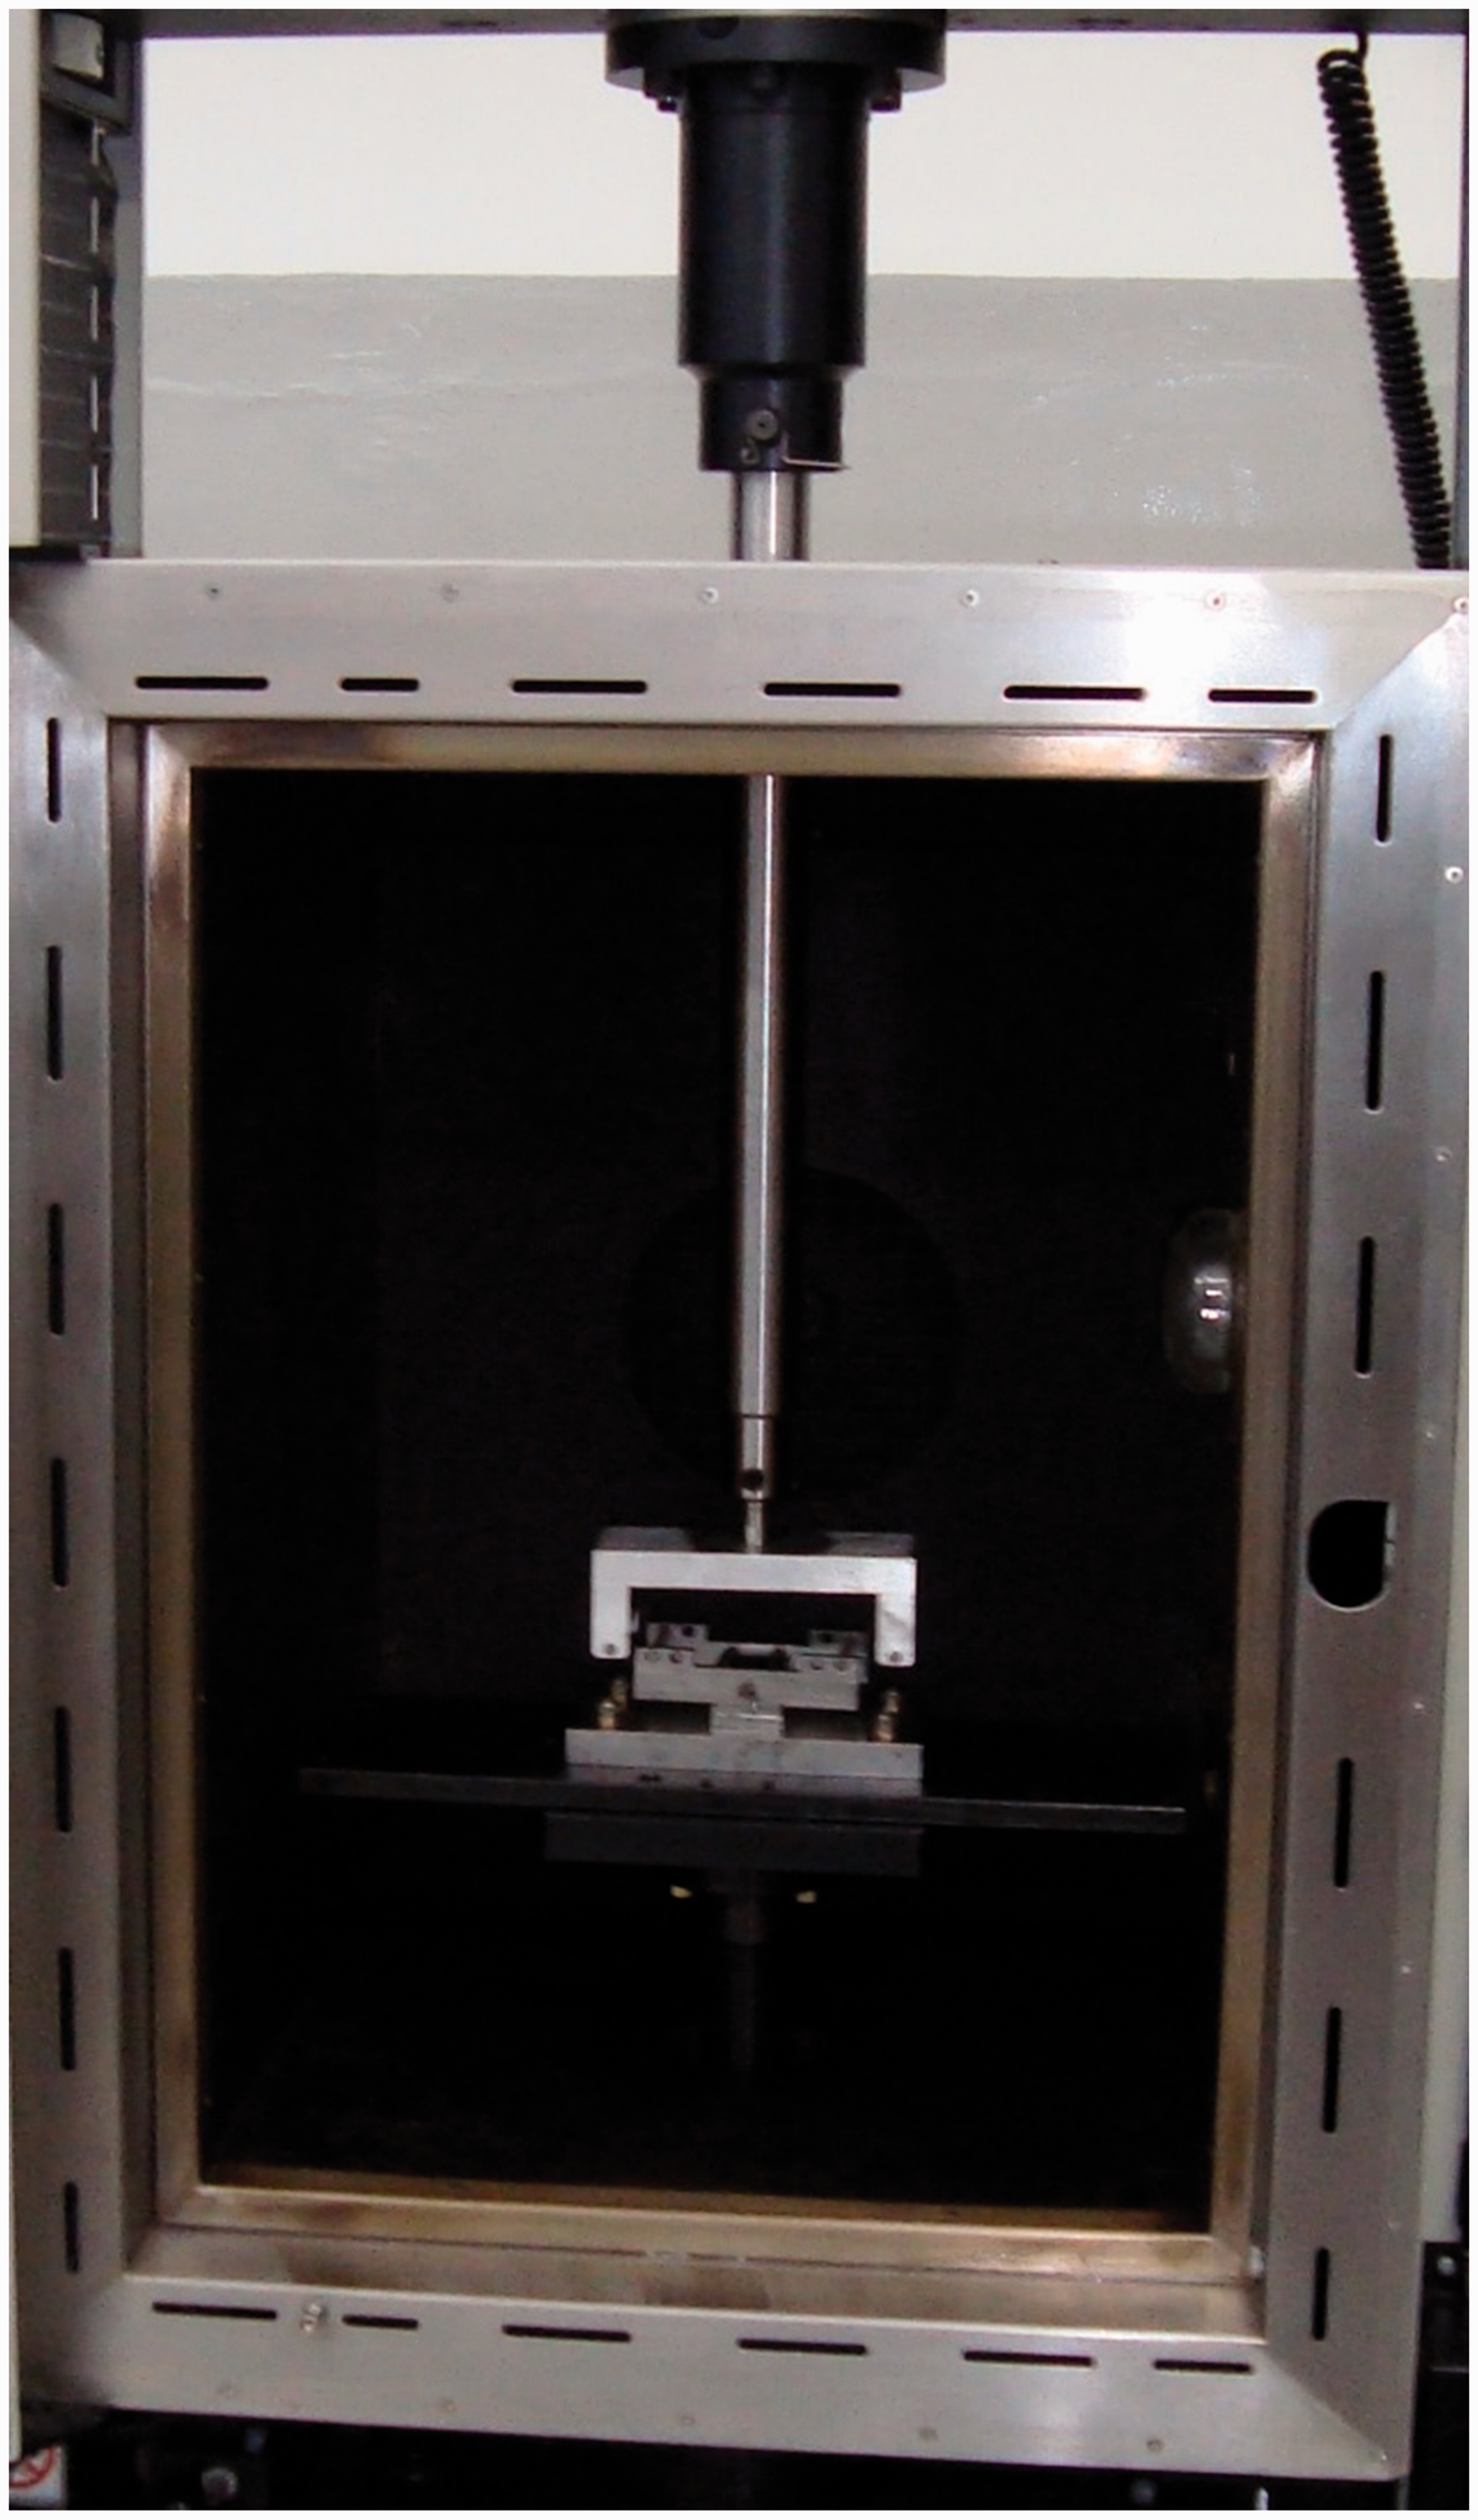
The delamination front extension, in function of load and displacement, was recorded by a crack marker in a similar way as described in “DCB tests” section.
Figure 4 shows loading configuration used in the 4ENF specimens, where P and δ are symbols that represent, respectively, the applied load and the vertical point displacement, a0 is the initial crack length.
Scheme of specimen loading apparatus used in the 4ENF tests.
22
The data reduction for 4ENF test were carried out in accordance with Martin and Davidson.
23
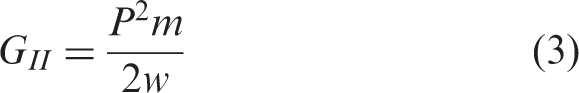
The Mode II interlaminar fracture toughness GIIc was calculated as follows (equation (3)):
Scanning electron microscopy
After the mechanical tests, fractured surface samples were cut out from the regions of the specimens where crack propagation was observed (Figure 5).
Specimen regions: (a) Initial specimen region and (b) final specimen region selected to MEV analyses.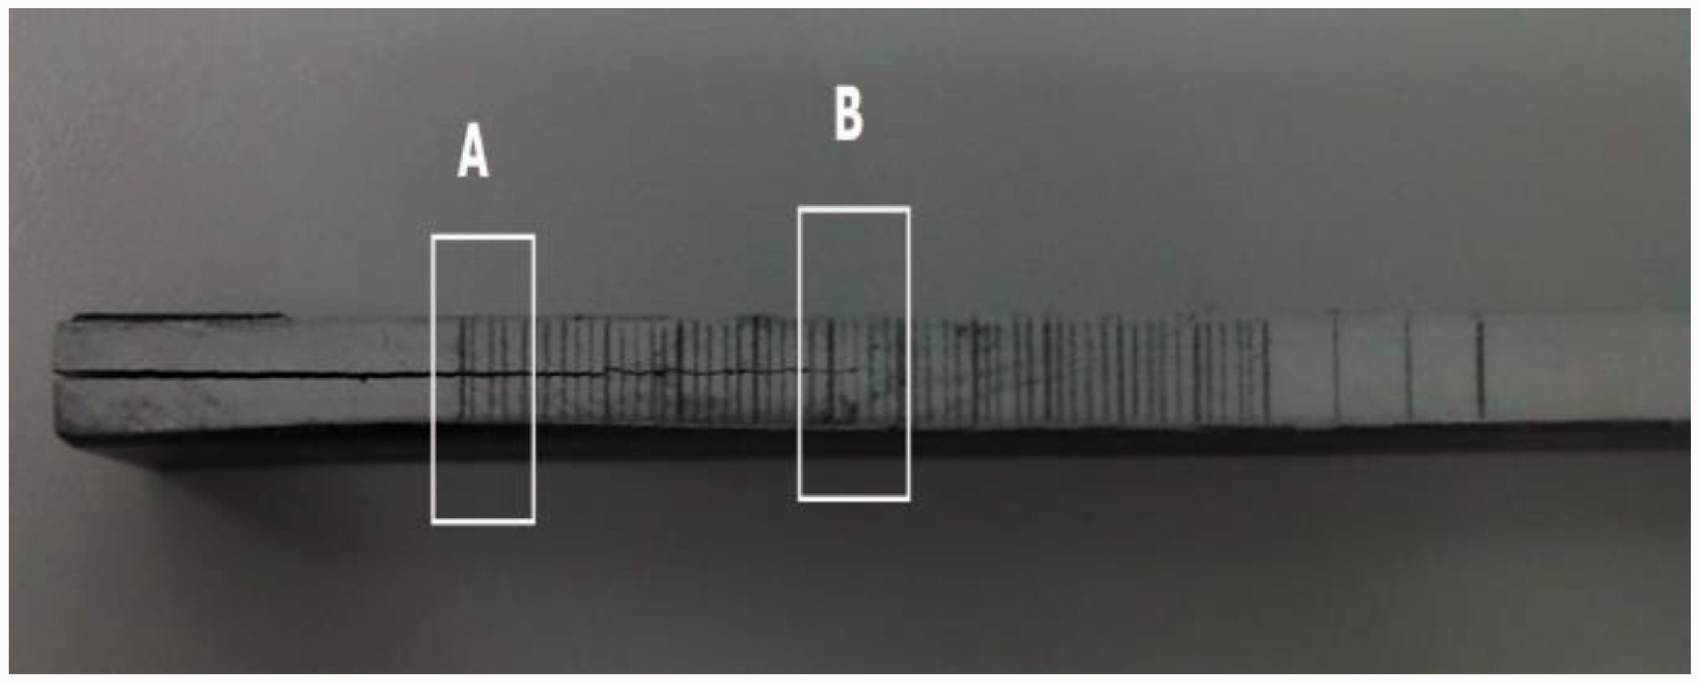
The samples' preparation consisted in cleaning the specimens in an ultrasonic bath, drying, and fixation in aluminum holder with a carbon ribbon for covering with a thin film of gold by sputtering process using the equipment QUORUM–Q150RE5. The fracture morphology analyses were performed on a scanning electron microscope VEGA3 XMU TESCAN.
Results and discussion
DMA results
The samples were submitted to the DMA to better understanding their behavior when submitted to a dynamic scanning temperature.
Figure 6 shows the dynamic mechanical curves of three laminated samples manufactured by VARTM process. The glass transition temperature was obtained by inflexion of storage modulus (E′), in accordance to the ASTM D 7028-07.
24
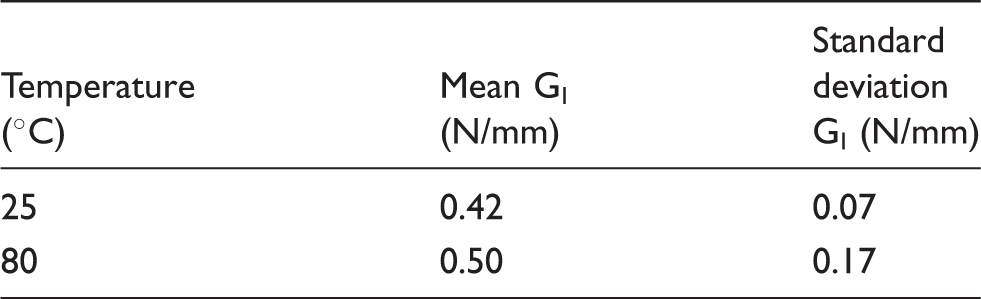
The values obtained were used to observe changes in polymeric matrix when submitted to temperature variation. Table 2 summarizes the Tg of samples from the storage modulus submitted to DMAs.
Glass transitions obtained from DMA: (a) E′, (b) tan δ e, and (c) E″. Glass transition temperature obtained from DMA.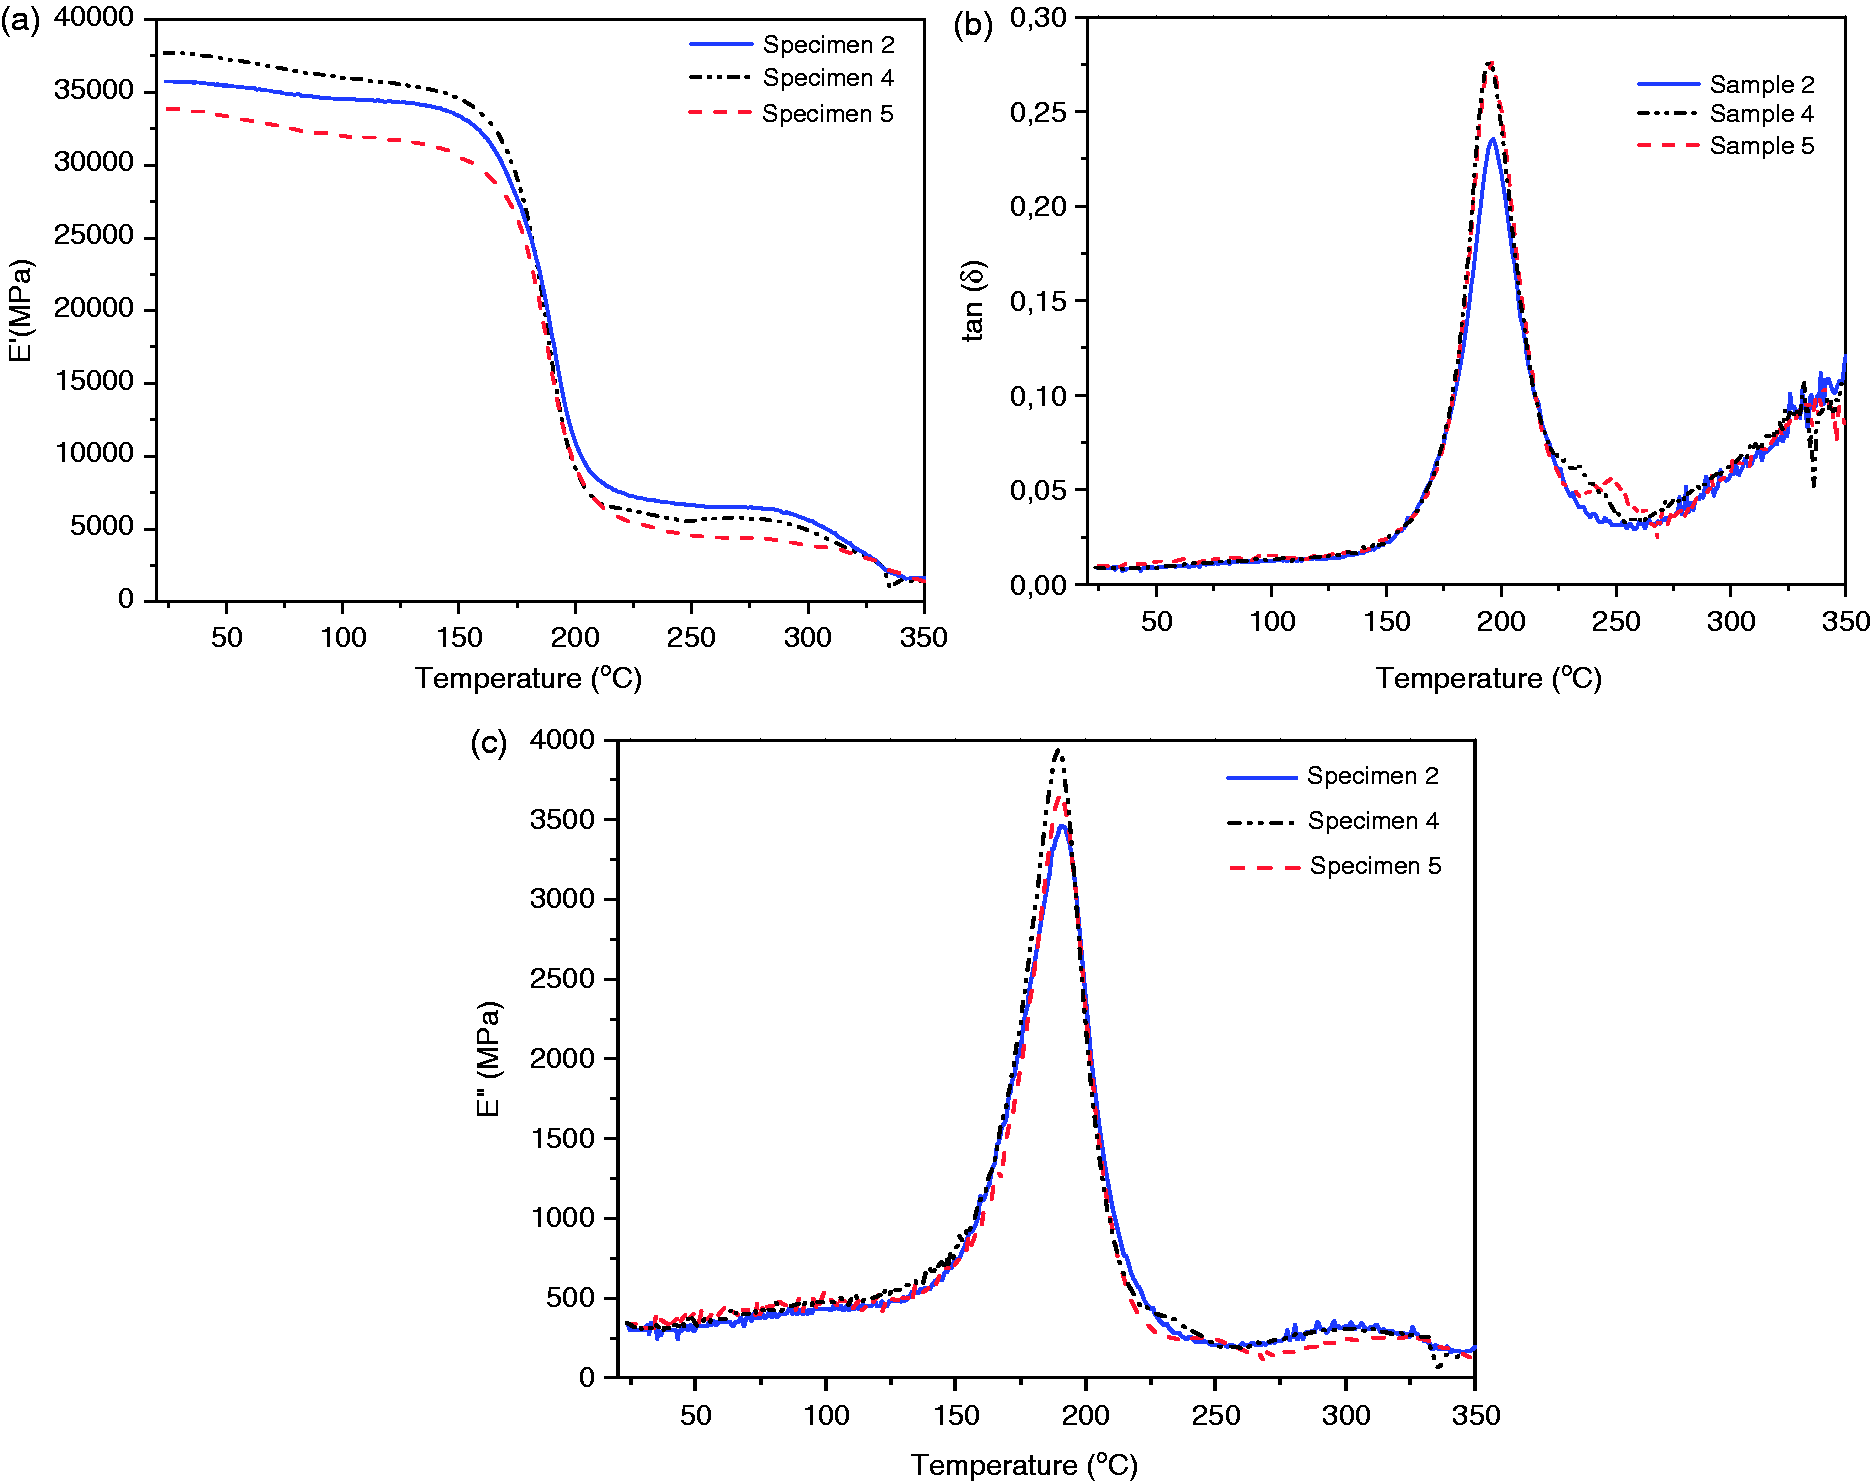
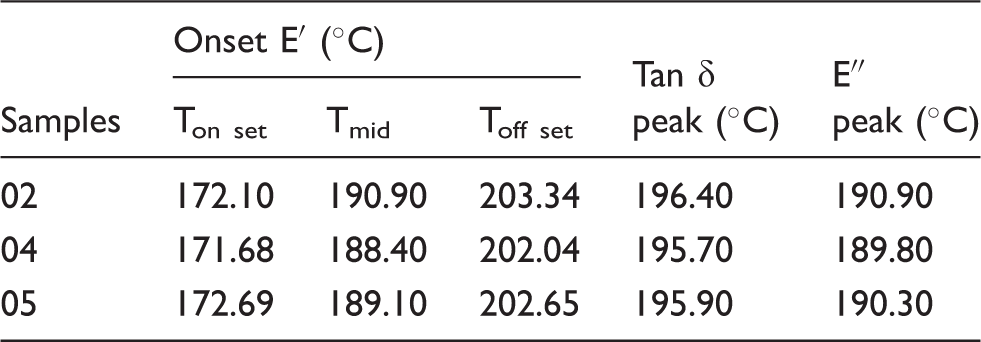
In Figure 6(a), the E′ curves are presented, where it is possible to observe the typical behavior of rigid materials before the glass transition. With the increase of temperature, about 53℃, it is possible to notice a decrease of storage modulus, which can be associated to the secondary relaxations related to amorphous phase that occurs in lower temperature when compared with the glass transition temperature. 25 This decreasing can be related to the relaxations of lateral groups. One of the effects of these secondary relaxations in macroscopic properties is the toughness and high impact resistance.
Besides that, it is possible to observe as the storage modulus decrease (E′) (Figure 6(a)) the loss modulus increases (E″) (Figure 6(b)) and it was also observed an increasing of mechanical damping or internal friction of a viscoelastic (tan δ) (Figure 6(c)), that corresponds the relation E″/E′. 26
Double cantilever beam tests
Figures 7 and 8 show the results obtained for specimens manufactured by VARTM process and submitted to the DCB tests at 25℃ and 80℃, respectively.
Mode I results: (a) Curve P versus δ, (b) Mode I results: (a) Curve P versus δ (b) 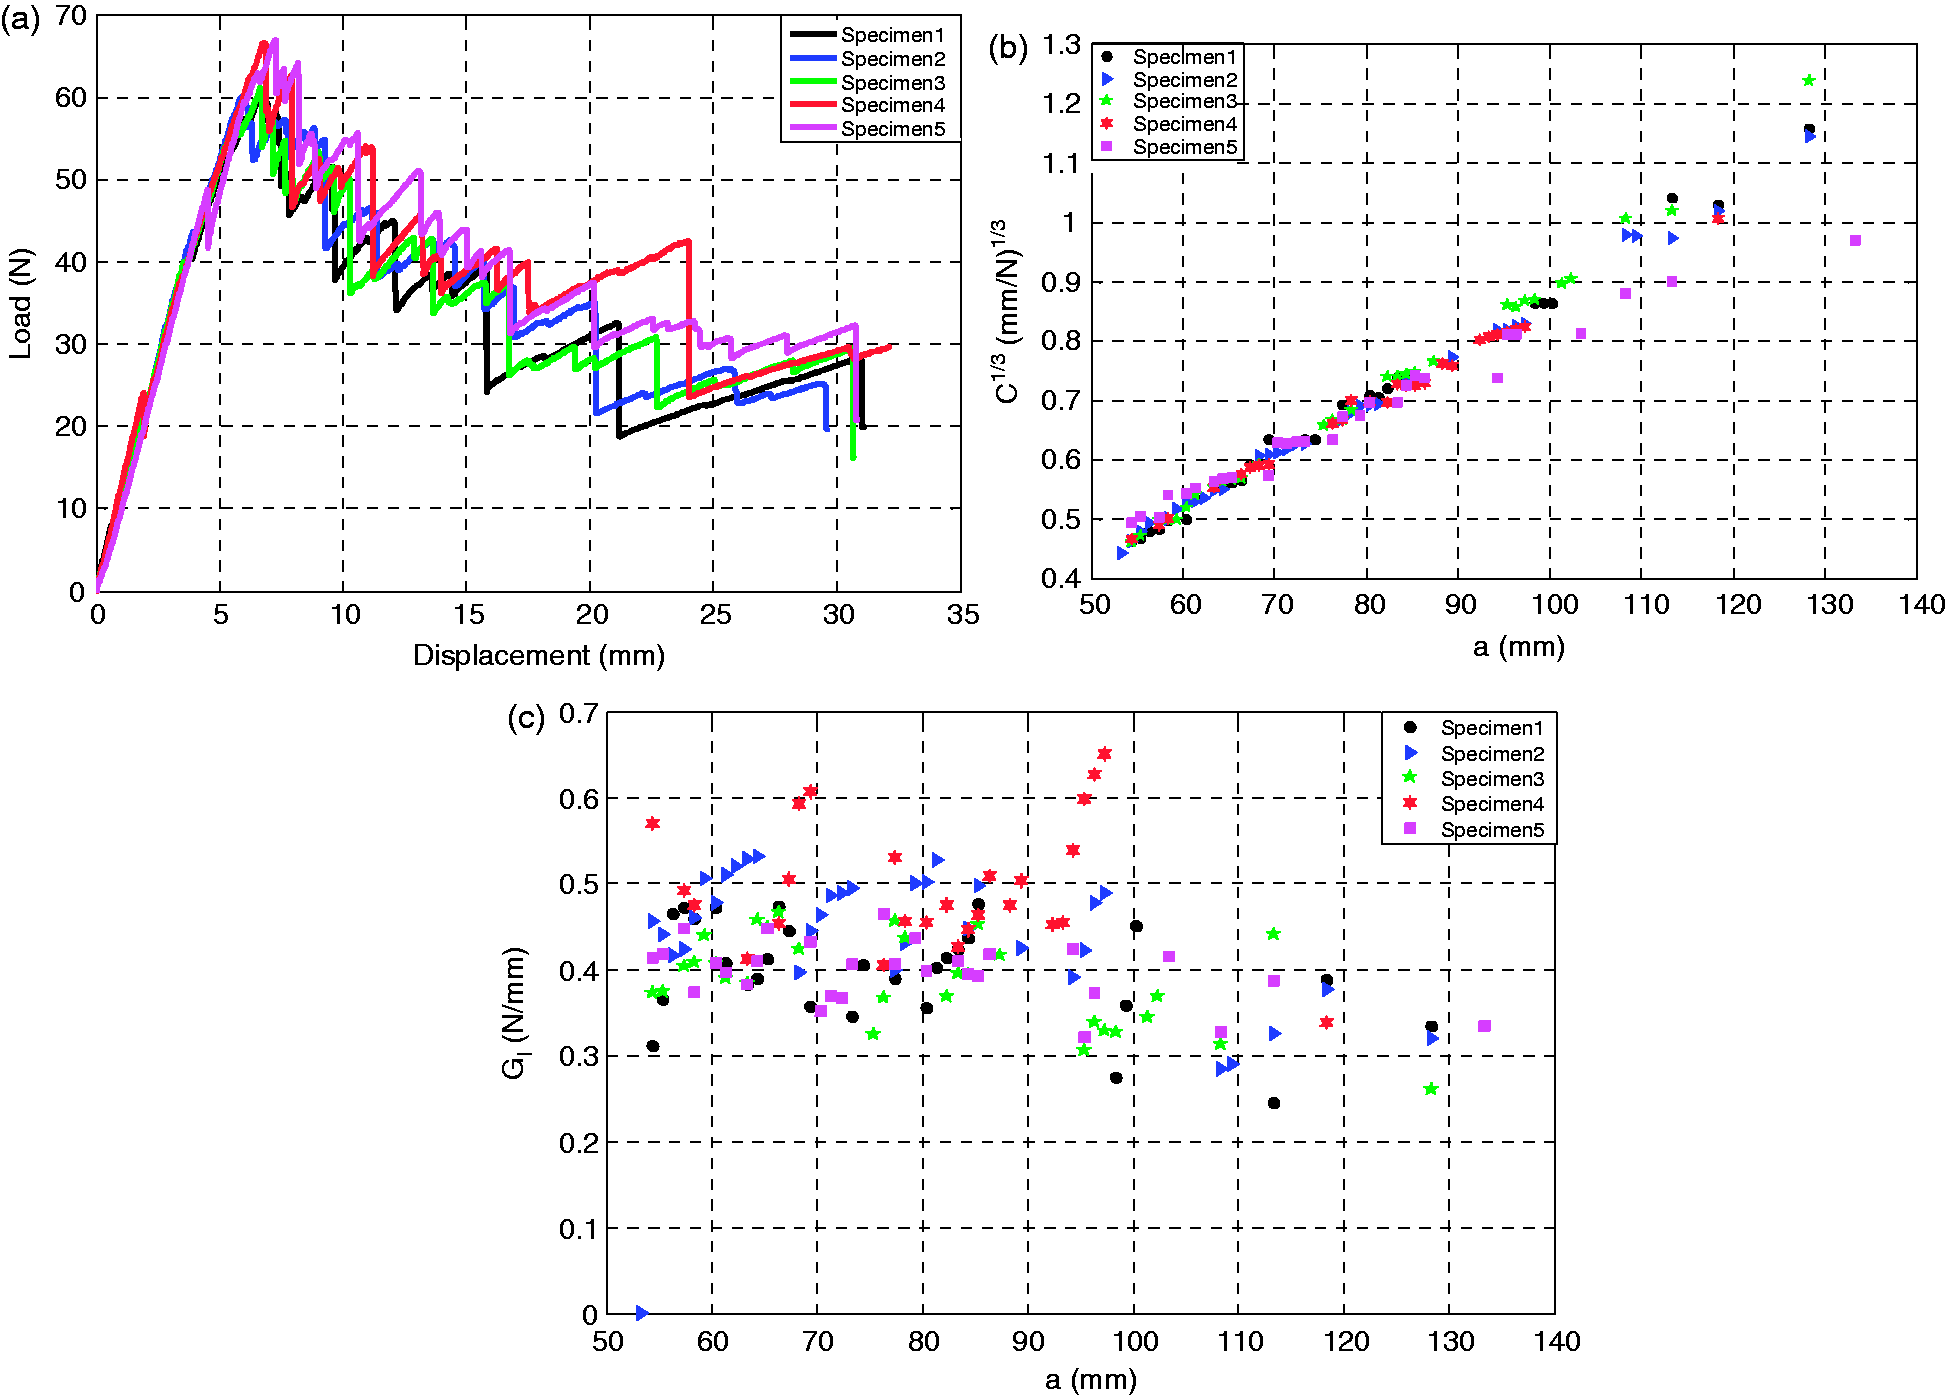
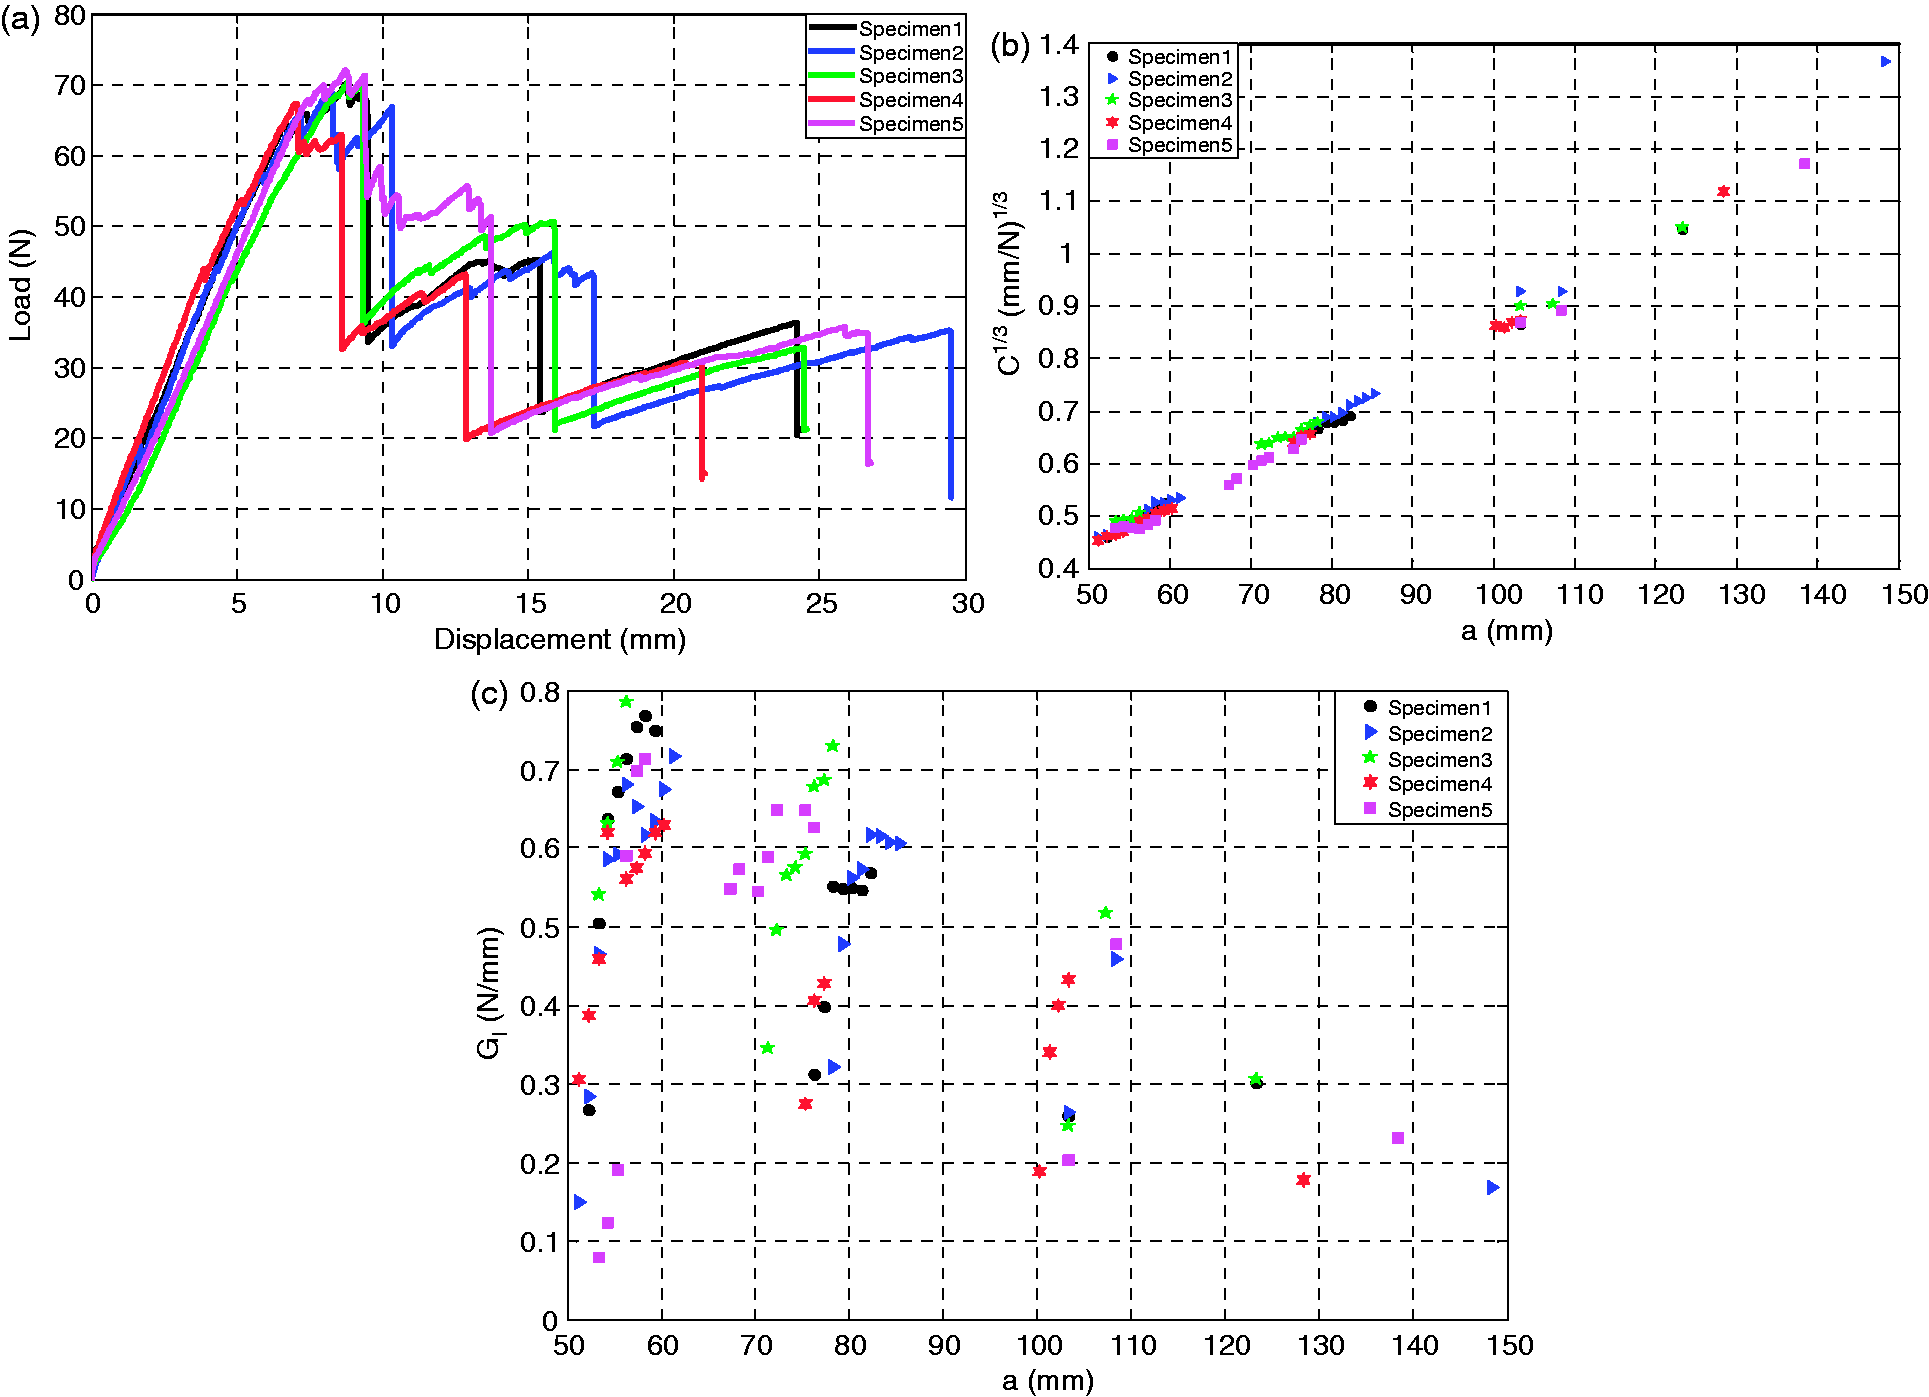
In Figures 7(a) and 8(a), it is observed that the load increases linearly until it reaches the maximum load where the crack starts, which is followed by a gradual decrease due to crack propagation. It is also observed some “stick–slip” behavior, in all cases, due to local variations of the material systems, particularly on the first increment; where there was an artificially high toughness induced by the region rich in resin ahead the crack tip.22,26 Other variations can influence this phenomenon such as fiber-rich region along the longitudinal direction, misalignment of fibers, and void as well as fiber bridging or fibers bundles.27,28
Comparing the GI values variation obtained to different temperatures (Figures 7(c) and 8(c)), it is possible to observe a decrease in the GI values with the crack length mainly in the specimens tested at 80℃ (Figure 8(c)). This decrease has been observed because of a slight decrease in specimen stiffness as the test temperature increases, 29 as observed in the DMA results presented in “DMA results” section.
Mode I interlaminar fracture toughness values for different temperatures.
Four-point end-notched flexure tests
GII value was calculated as total fracture toughness energy at the maximum load sustained by the material as the delamination length increases. All the results obtained for specimens manufactured by VARTM process and submitted to the 4ENF tests at 25℃ and 80℃ are shown in Figures 9 and 10, respectively.
Mode II results: (a) Curve P versus δ, (b) Mode II results: (a) Curve P versus δ, (b) 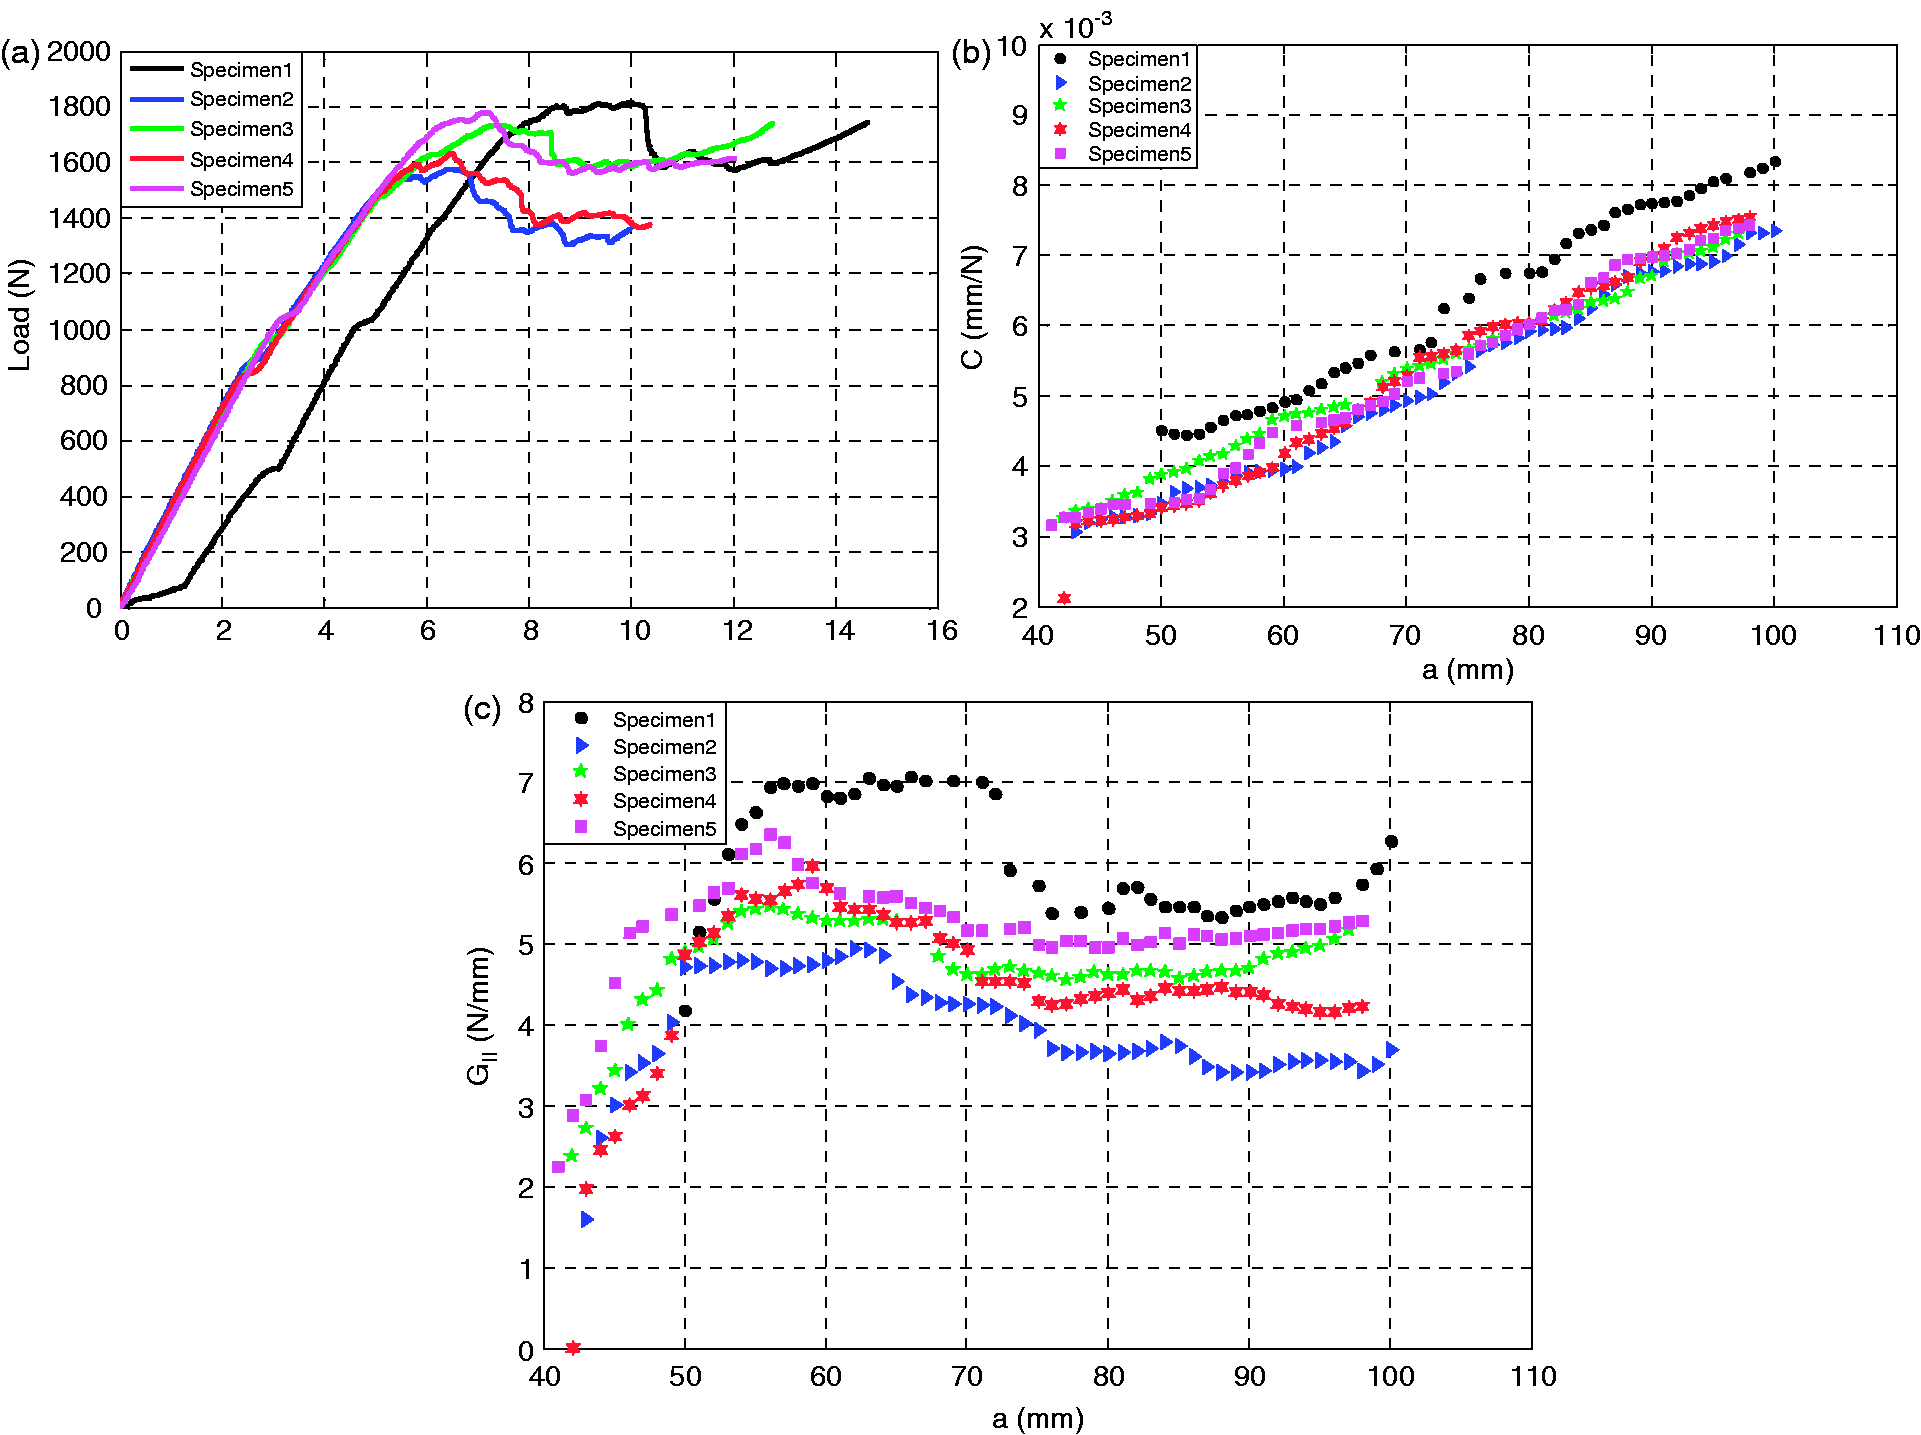
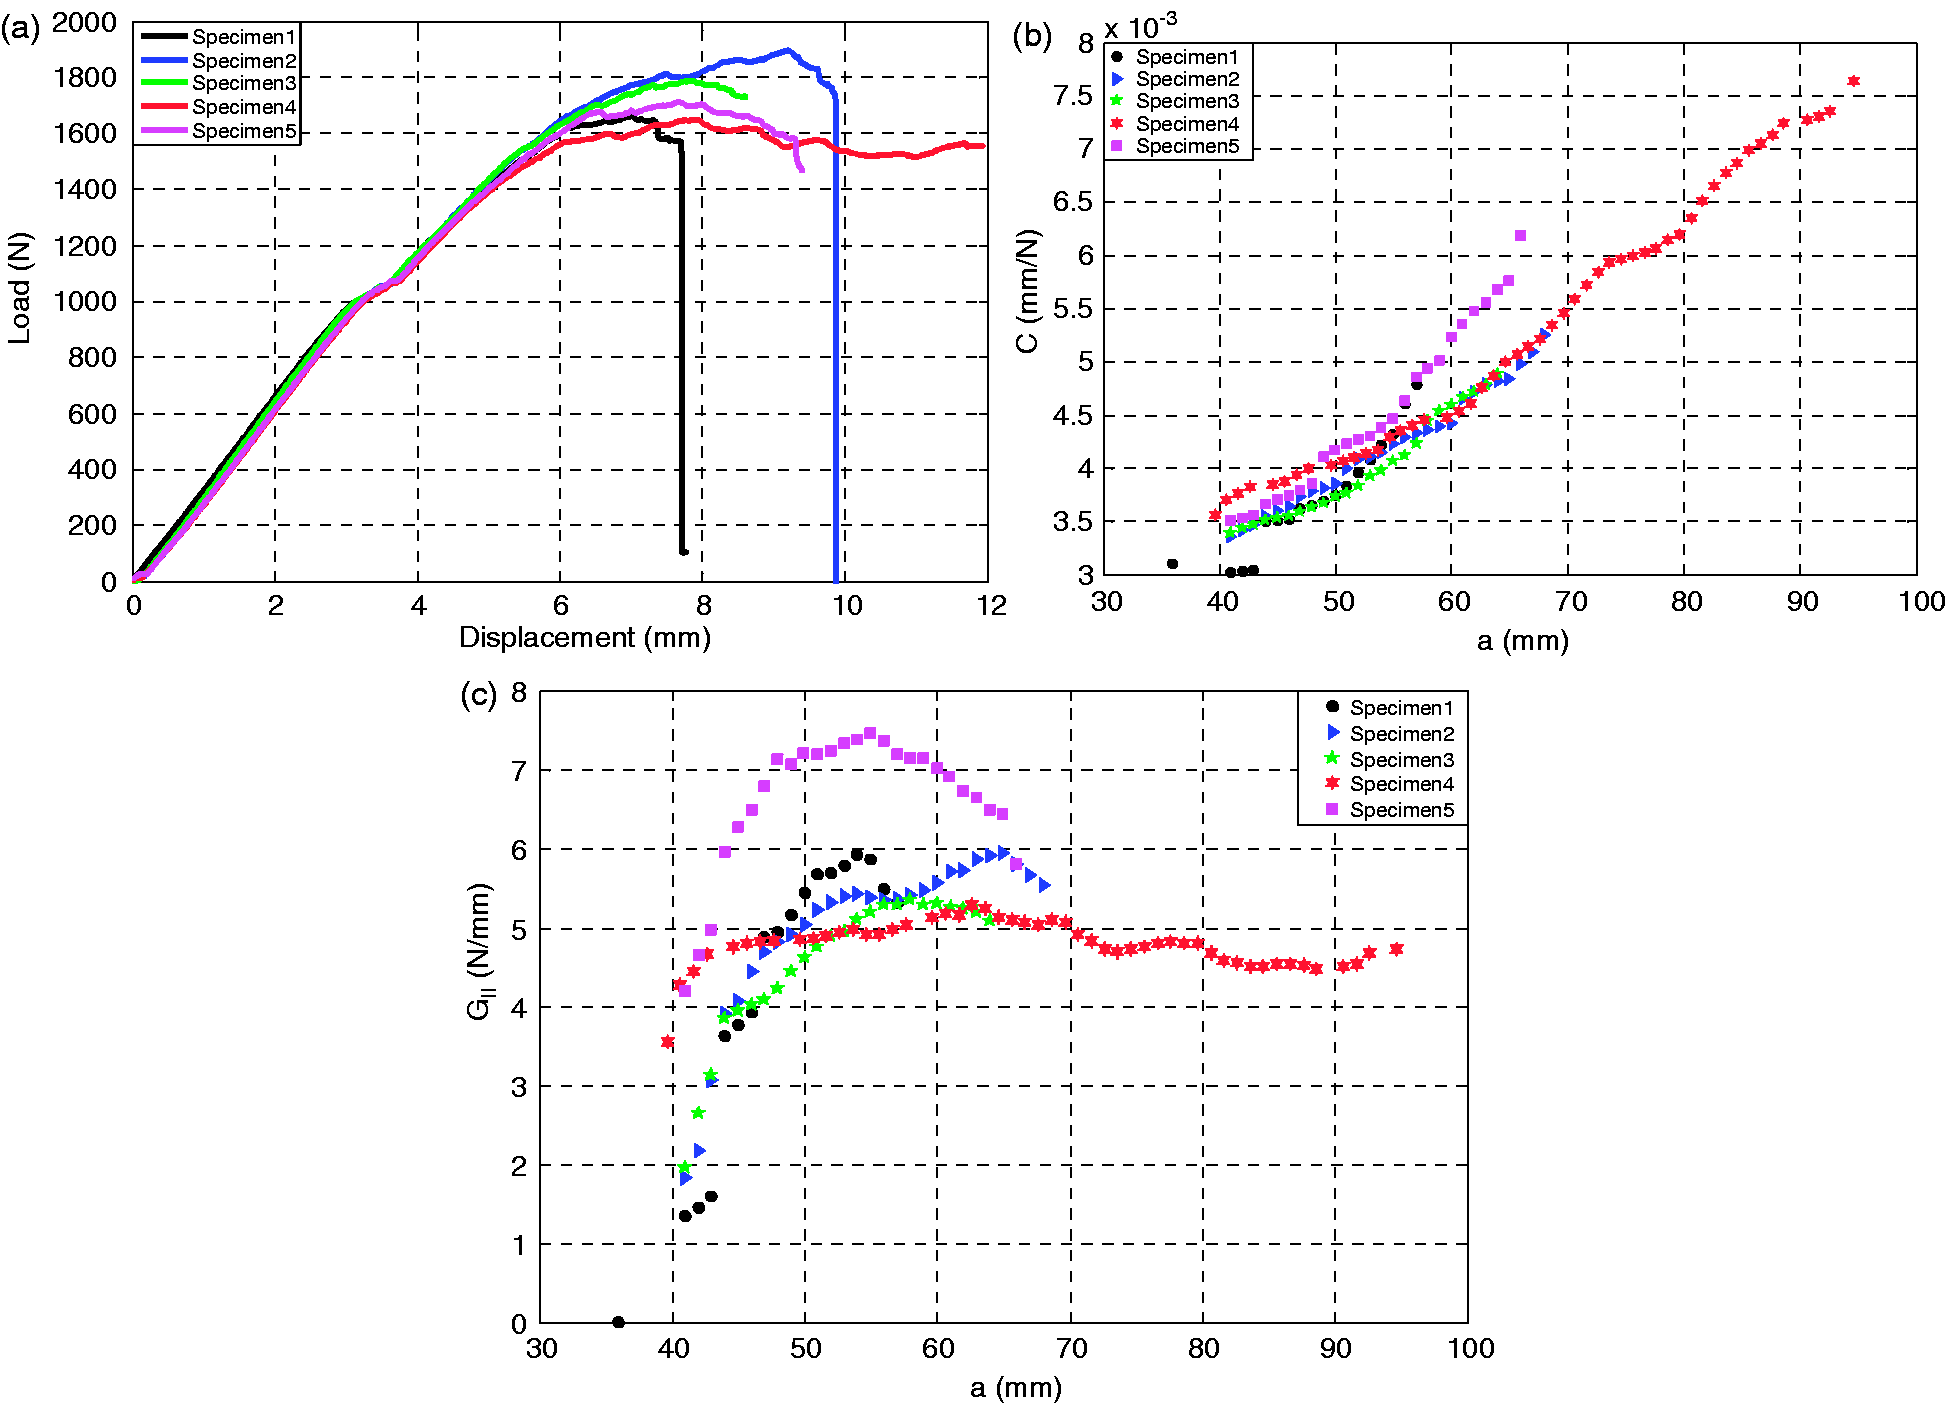
In Figures 9(a) and 10(a), it can be noticed that the load increases linearly until it reaches the maximum load where the crack subtly initiated and the “stick-slip” appears. Once the lamination had grown a small amount, the load was observed to remain constant with the delamination length and with minor evidence the “stick-slip” phenomenon.22,26 The “stick-slip” behavior is less pronounced in the specimens submitted to tests at 80℃. This phenomenon may be explained due to a significant increase in the ductility of the matrix as the temperature increases as observed in the DMA tests.
The compliance calculation was used to incorporate the transverse shear deformation providing more realistic model for advanced composites that typically have low interlaminar shear stiffness. 31 Significant changes are not observed in compliance curves with the increasing of temperature (Figures 9(b) and 10(b)), indicating that the temperature changes have not influenced the compliance of the specimens loaded in Mode II. This is mainly due to flexural stiffness of the specimens, which is more dependent on the fiber properties and these properties are not significantly affected by the temperature.
Mode II interlaminar fracture toughness values for different temperatures.
Fractography images
Scanning electron microscopy (SEM) analyses were also carried out to better understand the mechanical behavior of the specimens loaded in Modes I and II at different temperatures (25℃ and 80℃).
Specimen fracture surfaces exposed to the condition of room temperature
DCB results
Figure 11(a) (Region A) presents the specimen fracture surface obtained by SEM, after the mechanical tests on Mode I. It is possible to observe an area near the limit of the insert Teflon® marked on the flat part of sample, which was inserted for imitating delamination of initial area. It can also be viewed that the style of plain wave fabric type where warp strands passes alternately above and below of weft strands, misaligning the fiber and forming empty interstitials on the strands web.
Morphology of the transition region between the edge of the simulated failure of the Teflon® insert and the onset of delamination in Mode I manufactured via VARTM and tested on Mode I at 25℃ specimen: (a) 50× and (b) 30×.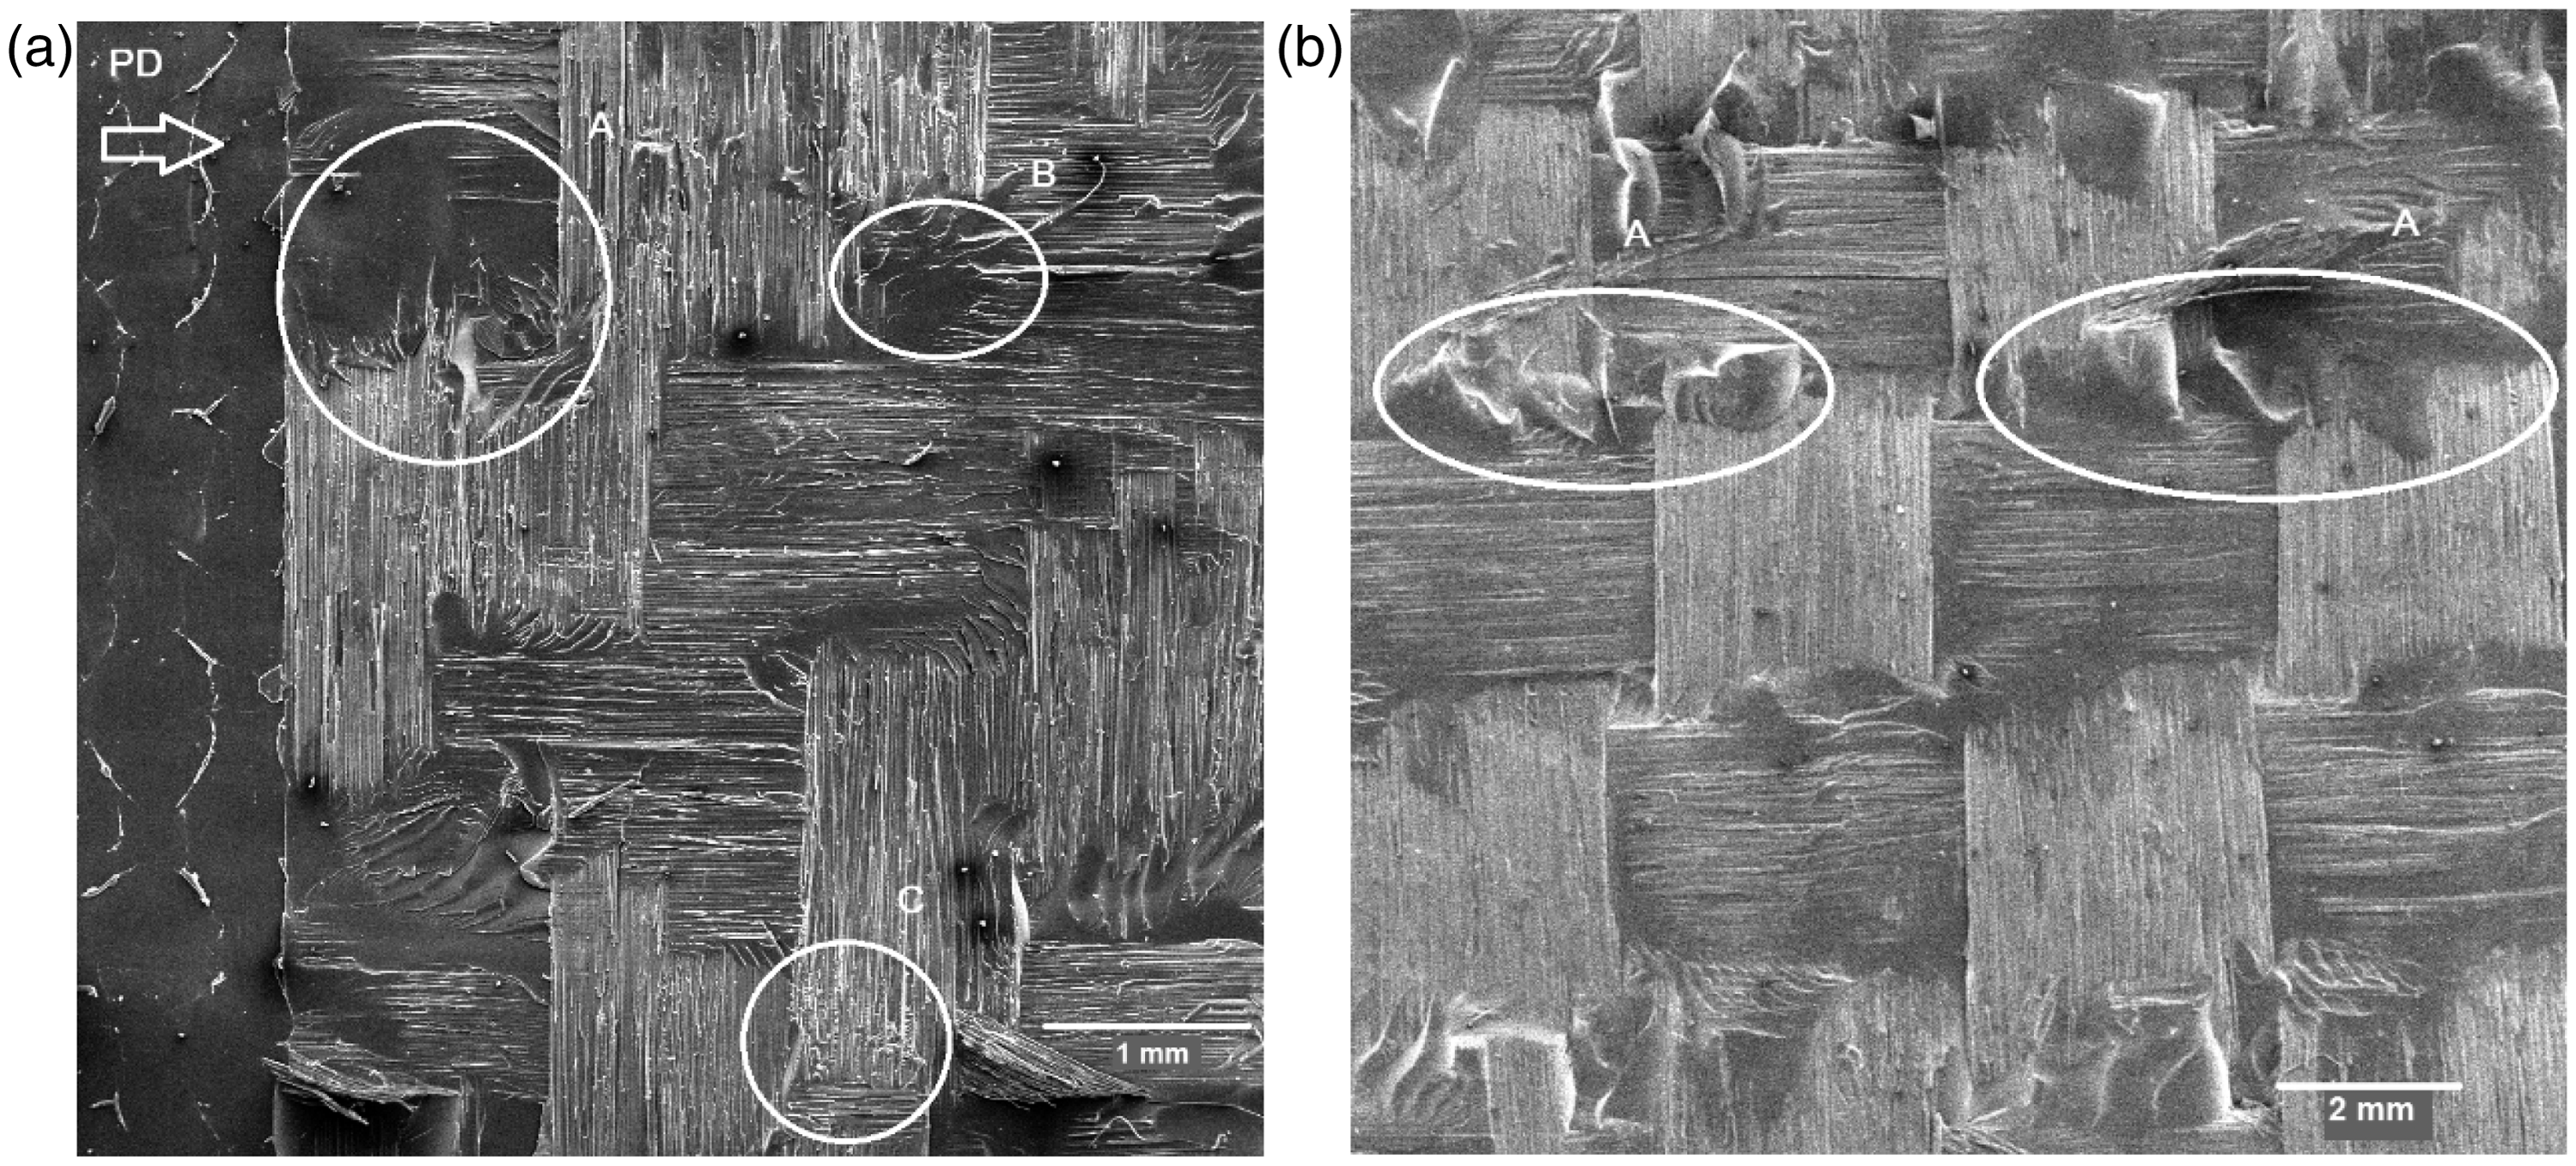
The surface aspects revealed resin bags in interstitials on the strands web (Figure 11(a) (Region A) and river marks that follows the direction of delamination propagation and the resin plastic deformation (Figure 11(a) (Region B). 32
According to Hiley, 32 these river marks occur on different planes due to a local variations in the matrix properties and they are formed where adjacent planes of fracture meet. This tendency causes the river lines to coalesce in the direction of crack propagation.
Figure 11(b) shows a fracture surface image where it is possible to observe some characteristics of VARTM manufacture process due to low compaction between layers, in this case, occurs the formation of thicker resin bags near interstitial regions (Figure 11(b) (Region A)).
In Mode I, the fracture aspects in the resin rich region shows evidence of plastic deformation, this plastic deformation is attributed to the tougher effects due to the additives that is added to thermosetting resins.33,34 Likewise, it can be observed that fractographic aspects in scarps form (Figure 12(a) (Region B)) and cusps (Figure 12(b) (Region D)). The cusps presence between the fibers neighborhoods are caused by impulses of applied loading in the fiber surface during the sample opening process, disposing the transversal interlaminar shear on the interface fiber/matrix.
35
It is also possible to notice the fiber exposition of neighborhood layer (Figure 12(a) and (c)) and fiber imprint on the fractured face of resin rich regions.
Fracture aspects of specimen manufactured by VARTM and tested on Mode I at 25℃. (a) 100× and (b) 500×.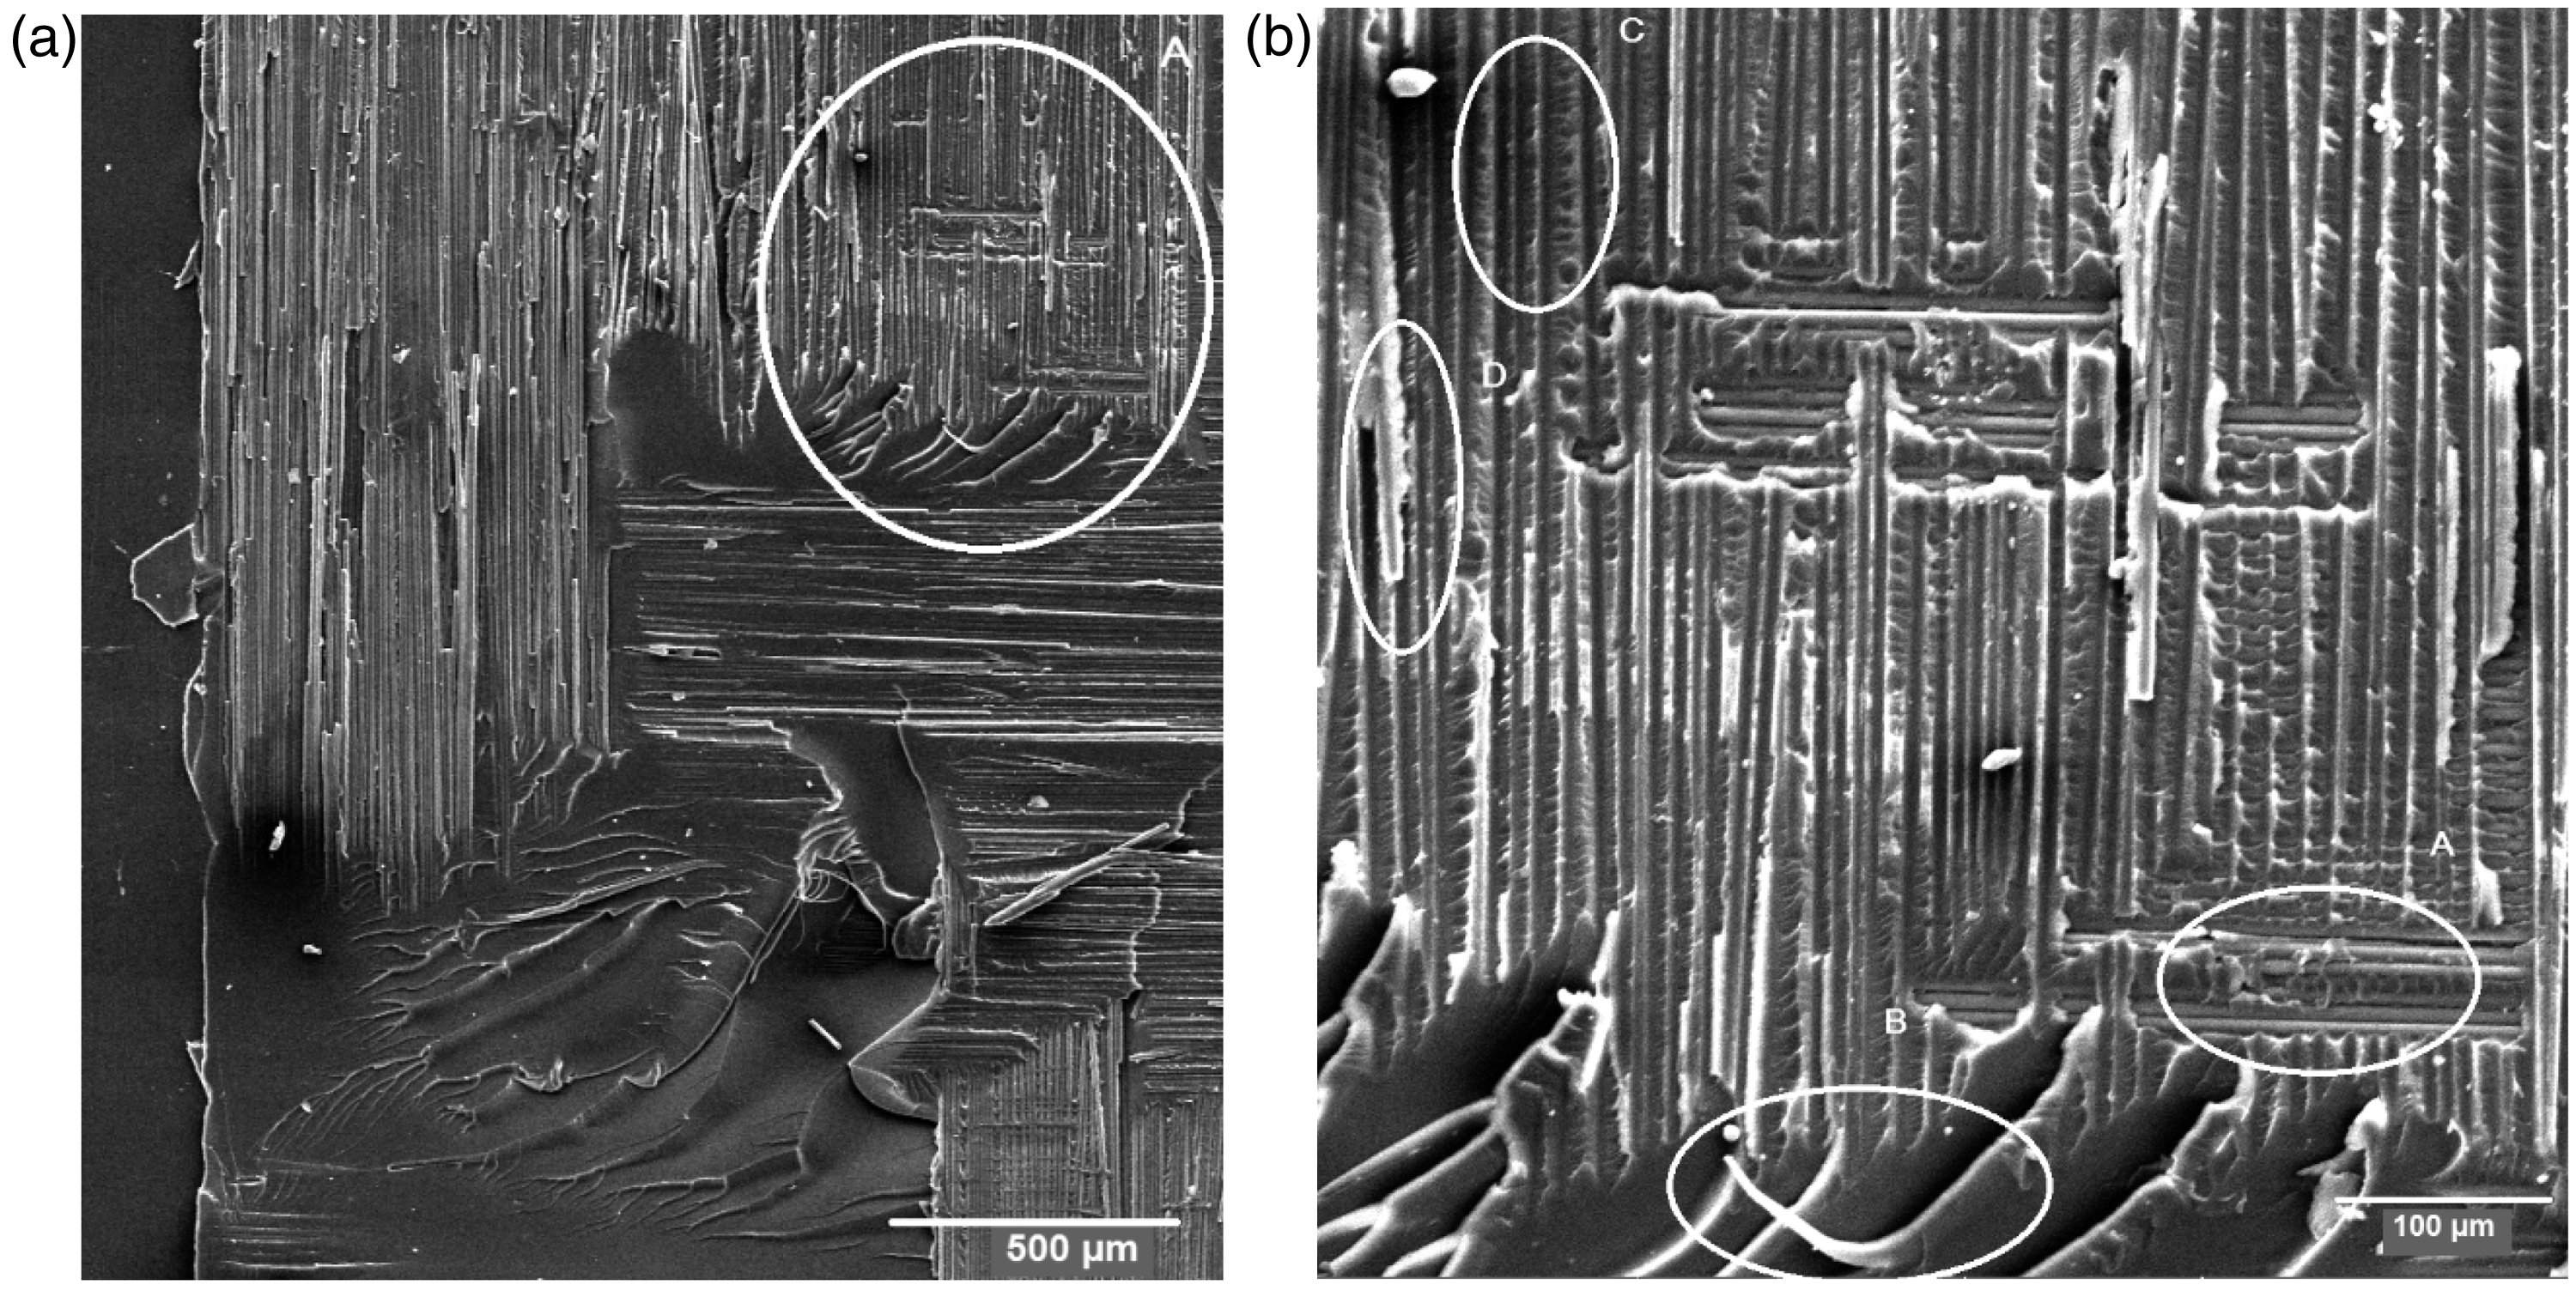
Figure 13 is representative of damage region in weft direction. It is possible to observe in this fracture region that the fiber is fully covered with resin, and some cracks happens in matrix indicating a good interface between matrix and fiber (Figure 13 (Region A)). Some fracture aspects can also be observed such as river marks and less pronounced cusps (Figure 13 (Region B)) and cusps formation well-marked (Figure 13 (Region C)), but it is not possible to observe the resin shear deformation.
Fracture aspects of specimen manufactured by VARTM and tested on Mode I at 25℃ (1000×).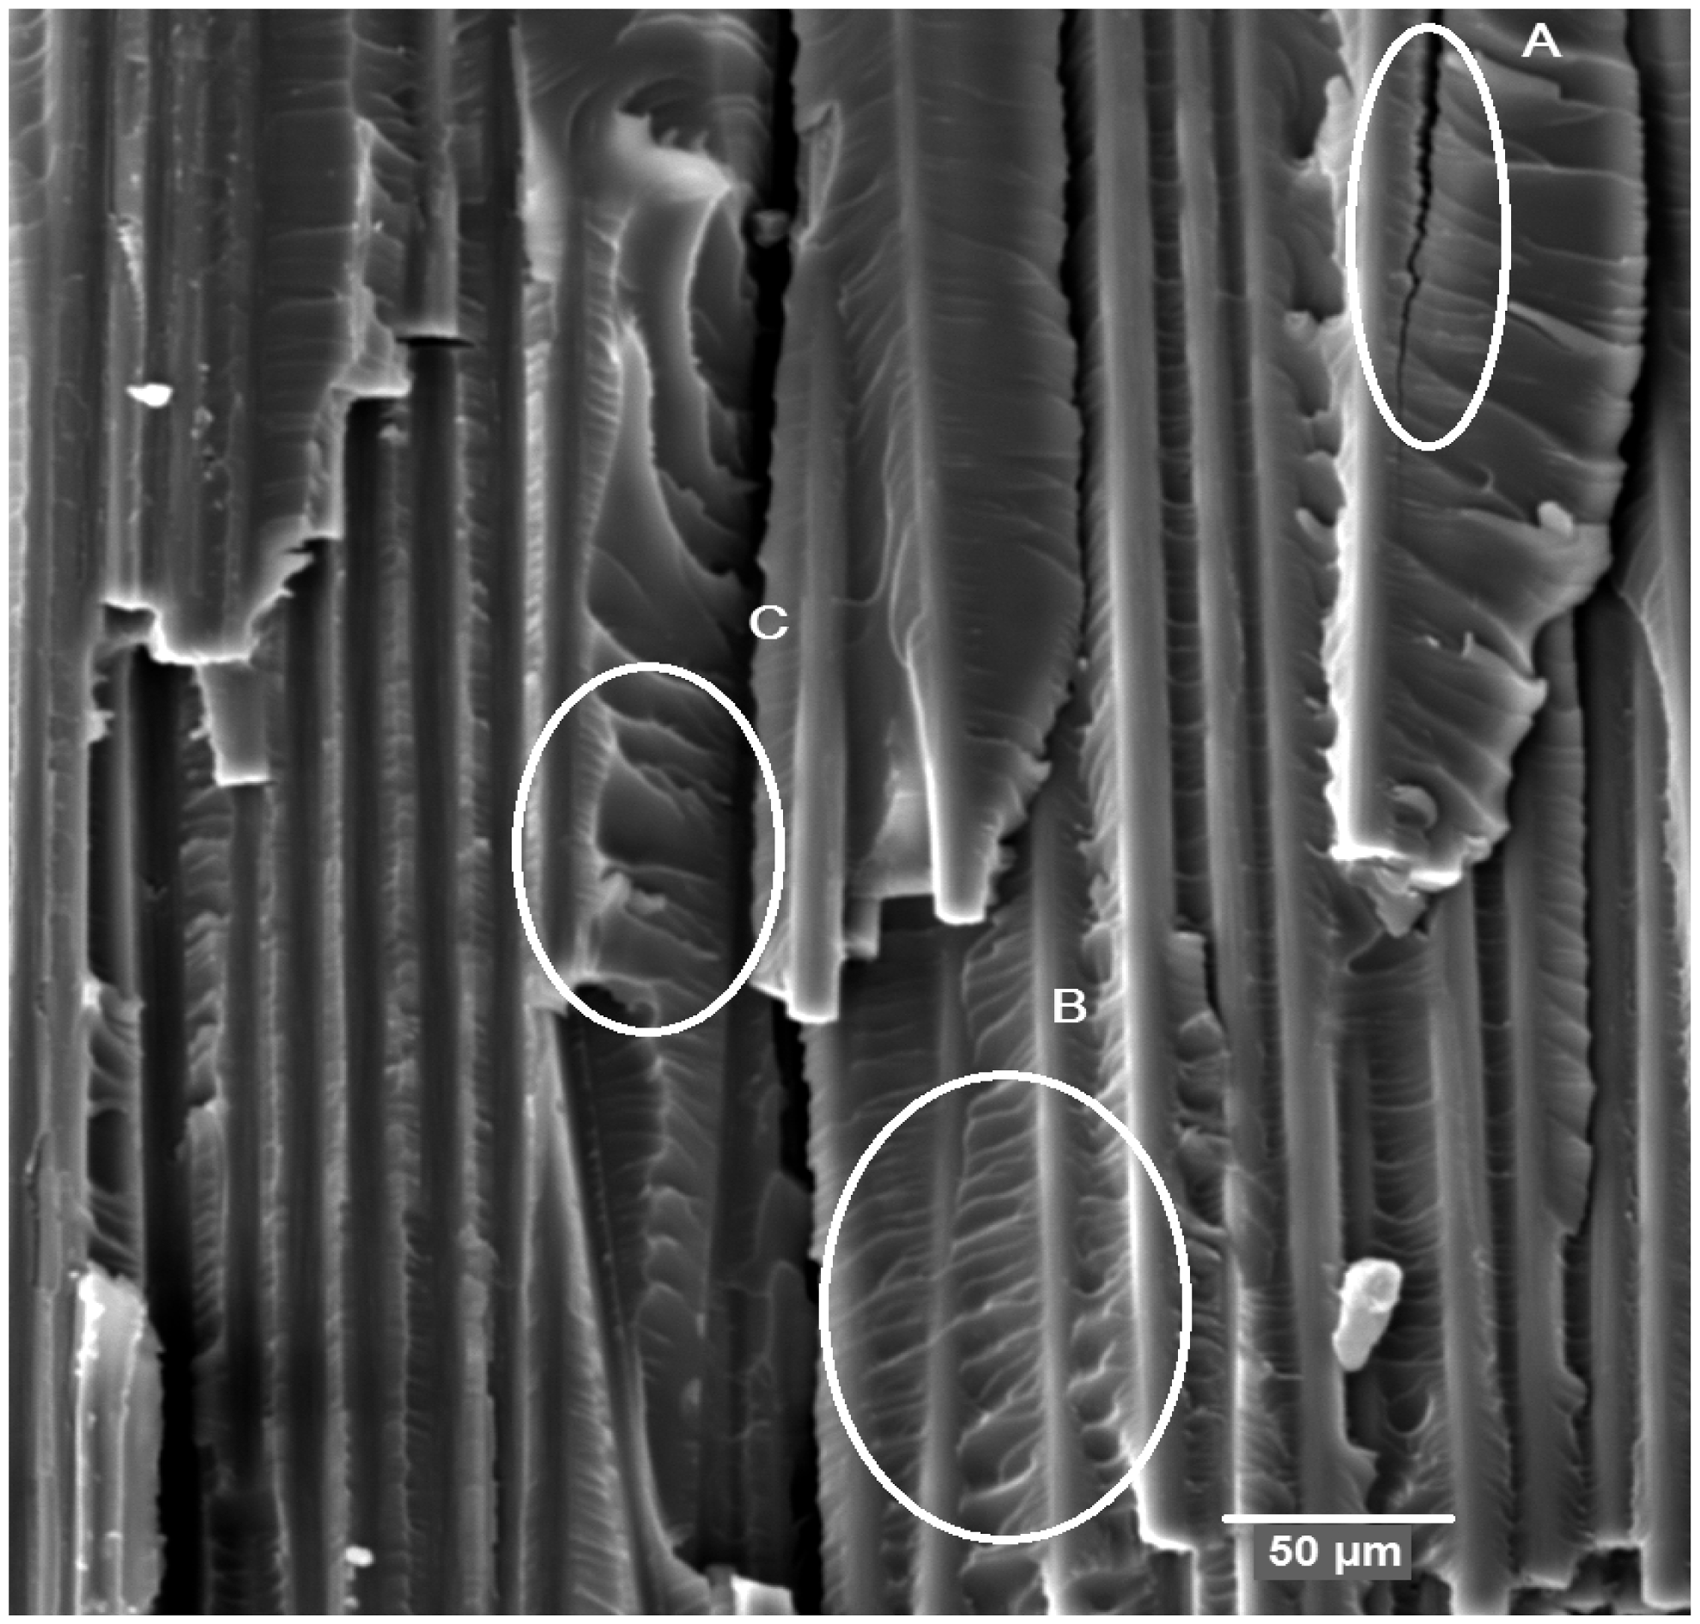
Figure 14 represents the specimen tested at 80℃. It is important to highlight that, during the tests, all the oven environment and the specimens were maintained at 80℃. According to DMA results, in this temperature, the storage modulus was already reduced indicating some epoxy chain movements. The fracture morphology at this temperature is significantly different from the fracture morphology of the specimens tested at 25℃. It is possible to notice that the good interface between fiber and matrix was preserved at 80℃, the crack propagation occurs near the interface differently that showed at 25℃ (Figure 14 (Region A)). Besides the fracture aspects already well-known as river marks, cusps, broken fiber, indicating crack propagation parallel to each individual fiber and plastic deformations (Figure 14 (Regions B and C)), it is possible to notice new fracture aspects the shear deformation of resin (Figure 14 (Region D)) due to the load acting on the specimen during the tests. Depending on the temperature, the fracture aspects are well-marked and pronounced and the interlaminar fracture toughness GII values are larger.
Fracture aspects of specimen manufactured by VARTM and tested on Mode I at 80℃ (1000×).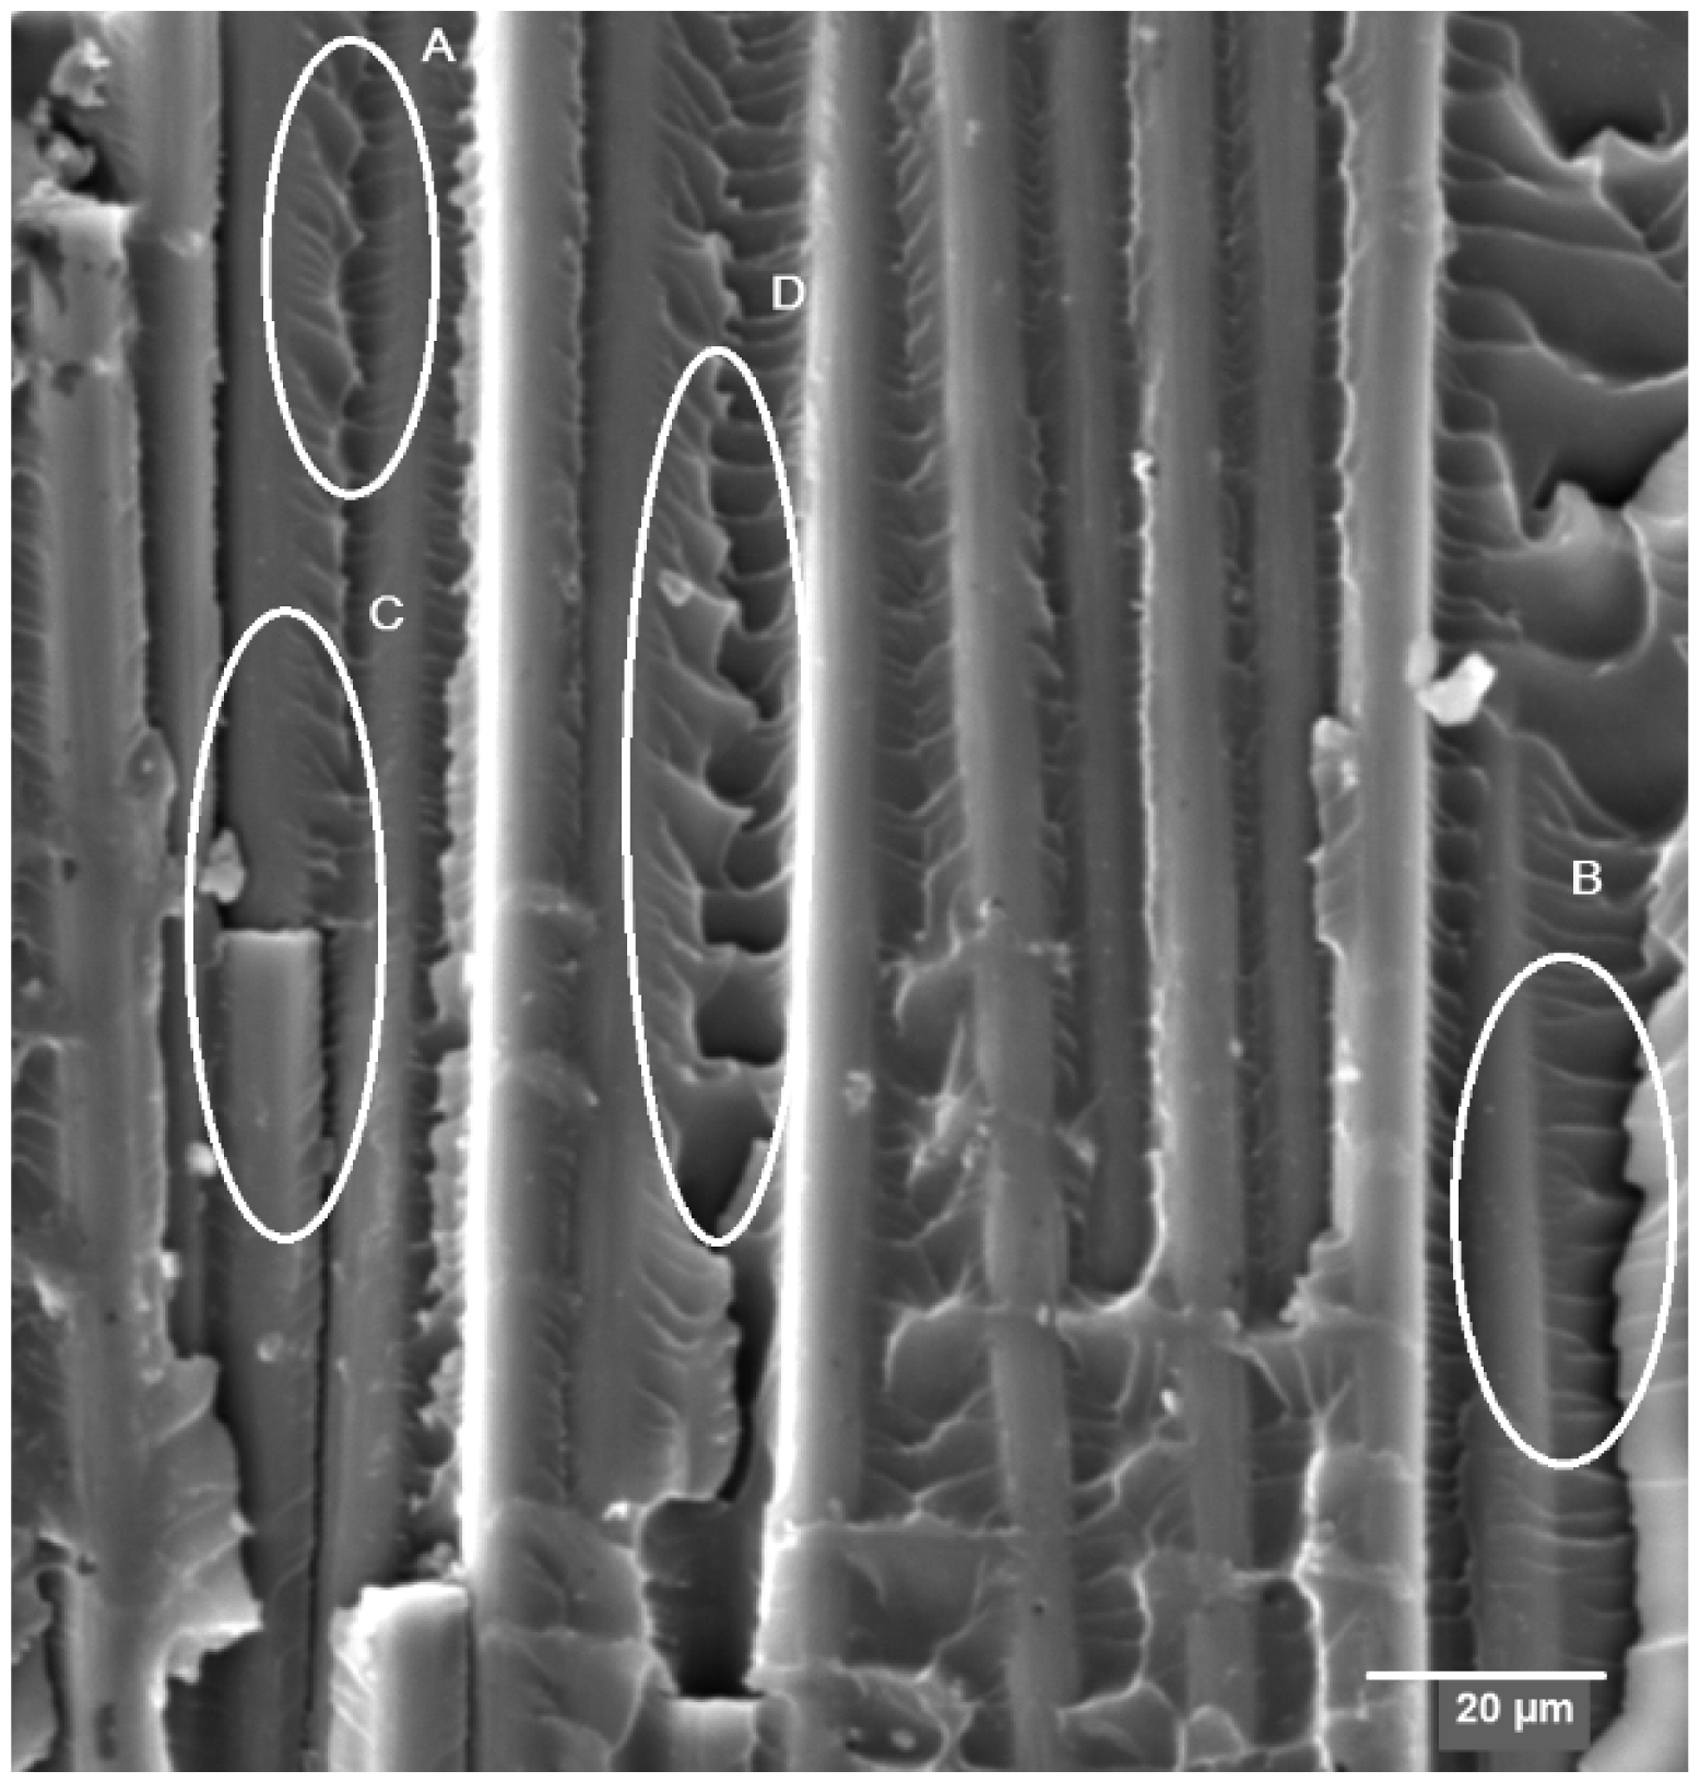
4ENF results
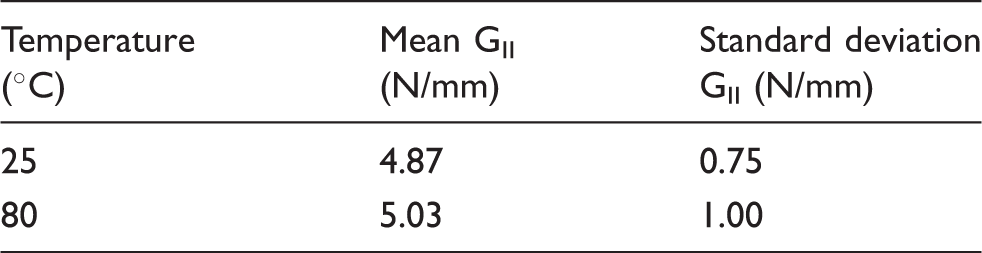
Fracture aspects of specimens tested on Mode II was carefully analyzed. The fracture morphology in specimen tested at 25℃ is typical of Mode II. At the surface, it is possible to observe perpendicular cracks in matrix due to the flexure loading (Figure 15 (Region A)), some cusps and shells formation (Figure 15 (Region B)), fiber imprints and fiber cracks on weft direction (Figure 15 (Regions C and D)). The fracture surface under Mode II revealed numerous inclined platelets (cusps) characteristic of cohesive resin fracture,
36
which is shown by warp fiber imprints on surface. According to Greenhalgh and Hiley,
37
as the Mode II (shear) component increases, these cracks are reoriented such that they develop at an angle to the laminate plane; under pure Mode II, they are inclined at 45° to this plane. These cracks consequently coalesce, leading to the formation of cusps, a characteristic morphology associated with delamination.
Fracture aspects of specimen manufactured by VARTM and tested on Mode II at 25℃ (500×).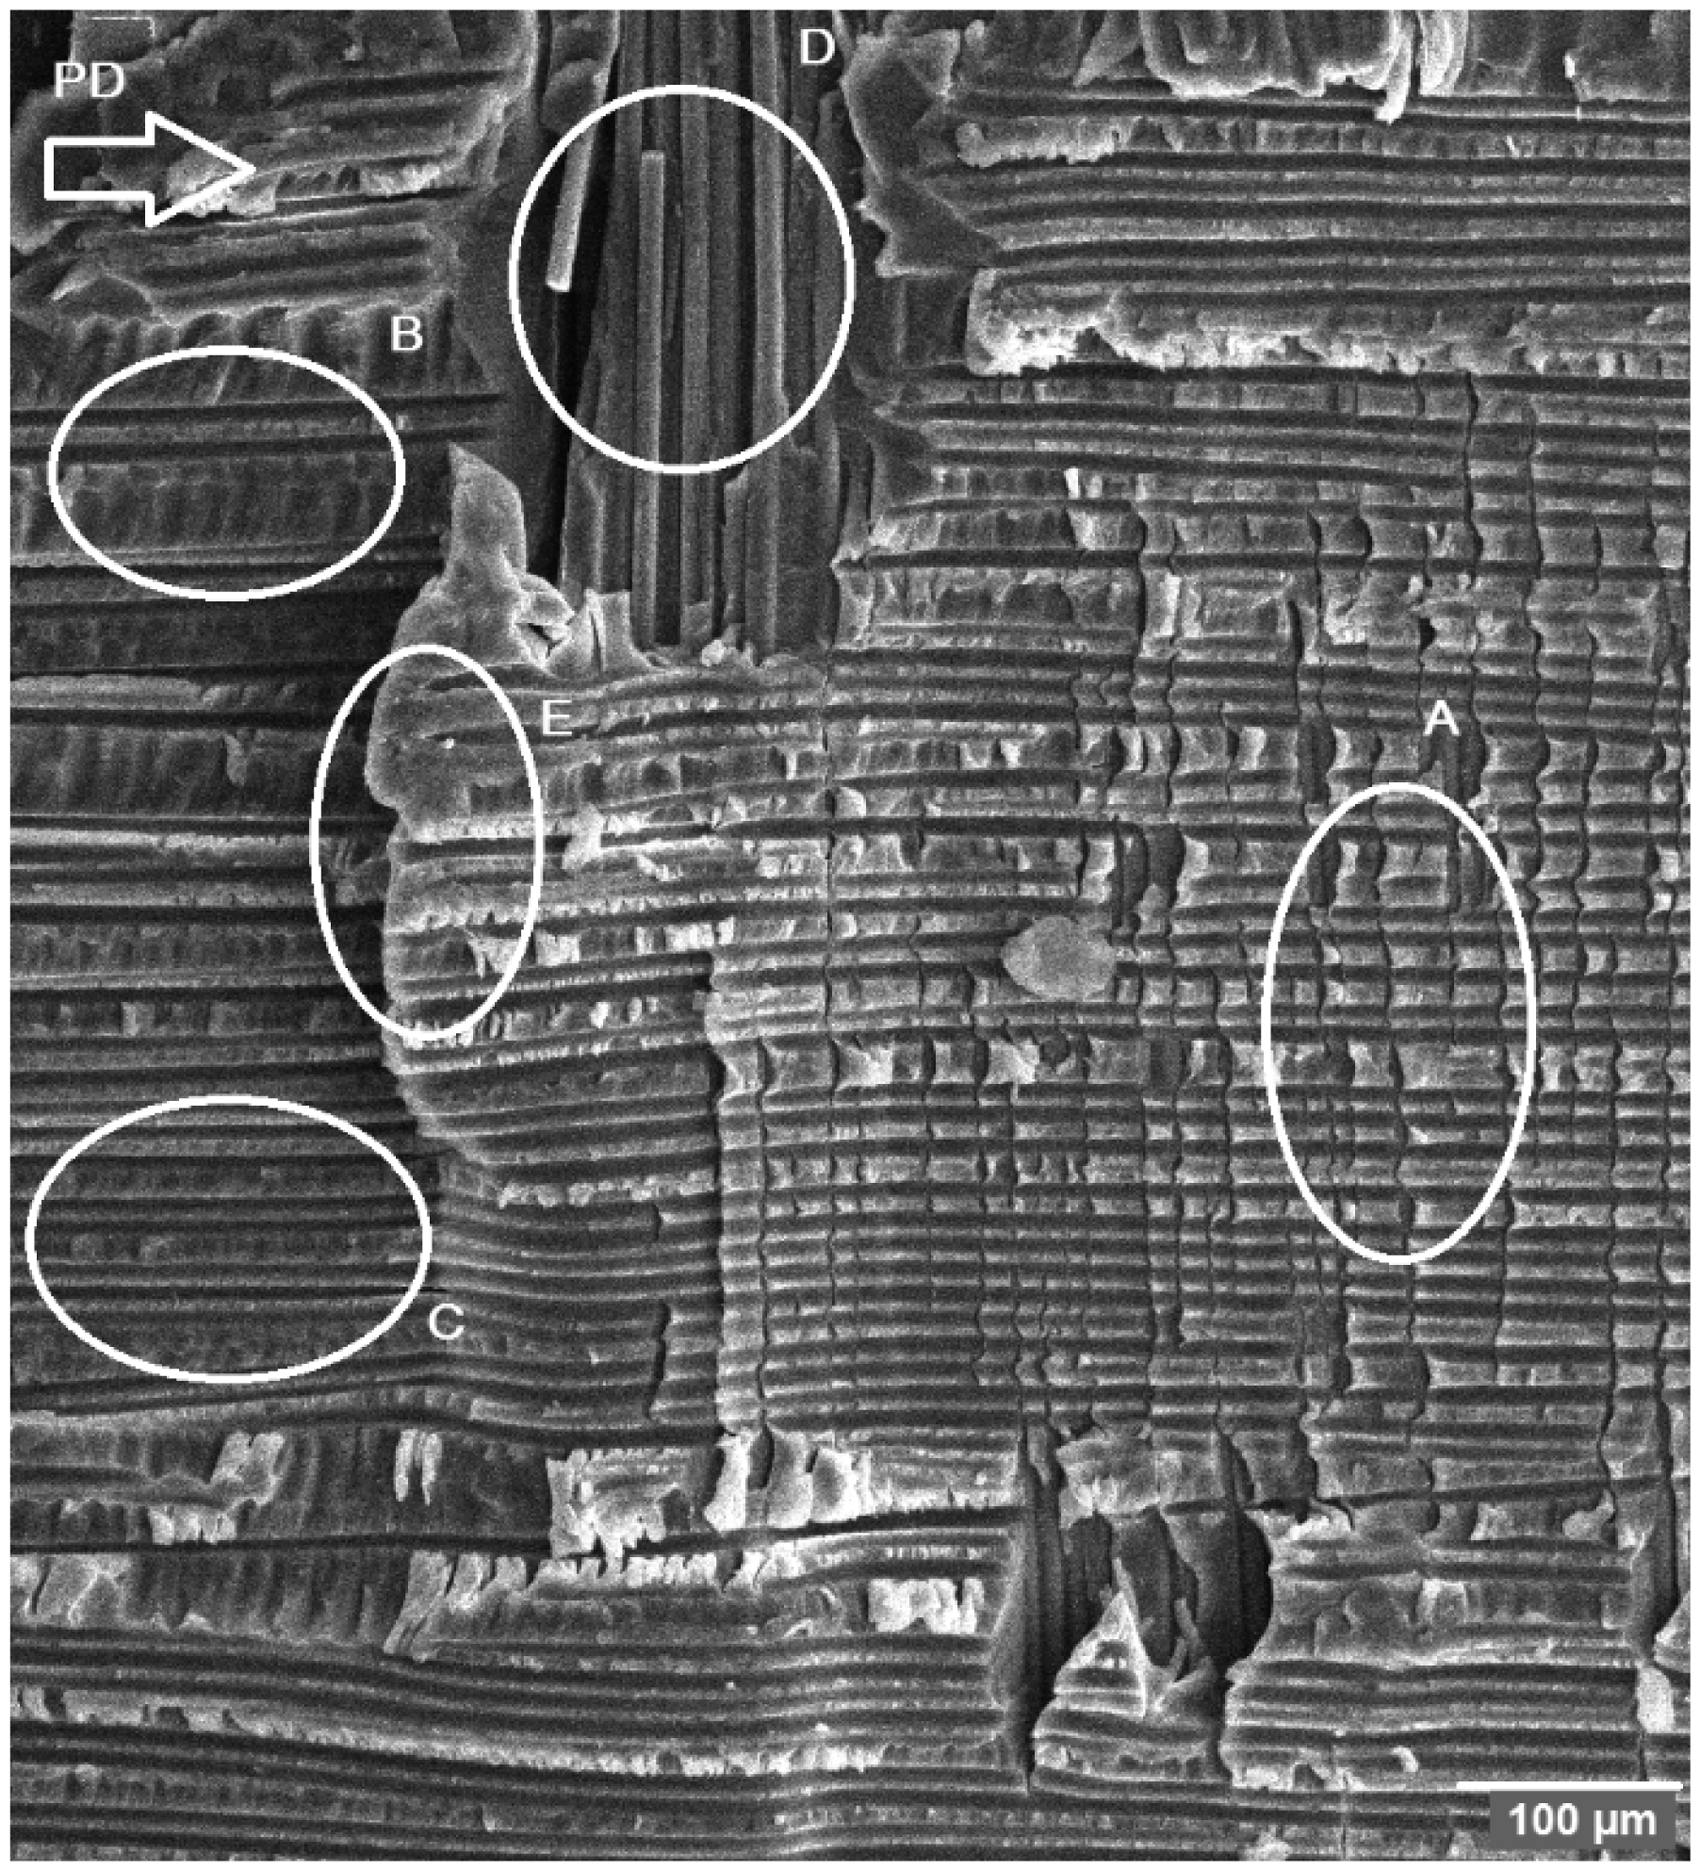
It is possible to see that in the frontier between weft and warp strands appears a crack in the matrix (Figure 15 (Region E)), this phenomenon can be due to macrocracks appearance that promotes a detachment of matrix due to the bending load.
At 80℃, the fracture morphology is quite different from the fracture morphology at 25℃. Besides the well-known fracture aspects such as: perpendicular cracks in matrix due to the flexure loading (Figure 16 (Region A)), some cusps and shells formation (Figure 16 (Region B)), fiber imprints and fiber cracks on weft direction (Figure 16 (Regions C and D)), the fracture surface presents also some plastic deformation of resin. The fracture surface presents some plastic deformation of resin. It is possible to notice the regular plastic deformation (elongation of resin) and also some deformation with torsion aspects of matrix can be observed (Figure 16(e)). This behavior is due to the fact that the specimen is maintained at 80℃ during all the test time. At this temperature, the movements of polymeric chain following the softening of matrix that can deformed without no breaking can occur.
Fracture aspects of specimen manufactured by VARTM and tested on Mode II at 80℃ (500×).
Conclusions
This article investigated the interlaminar fracture toughness and delamination crack growth behavior at 25℃ and 80℃ in RTM-6 carbon/epoxy composite specimens manufactured by VARTM process.
The results of DCB and 4ENF tests indicated that at higher temperatures, the GI and GII values are higher than at room temperature, because the higher temperature increased both toughness values at test temperatures near Tg due to the strongest bond between the fibers and the matrix.
In the fracture aspects, it is possible to notice the influence of temperature on the matrix properties during the tests. At 80℃, besides the well-known fracture aspects on Mode I as river marks, cusps, and broken fiber, indicating crack propagation over the fiber length and plastic deformations, it is possible to notice new fracture aspects of the shear deformation of resin due to the load acting on the specimen during the tests due to the increasing of GII.
The fracture surface of the specimen tested at 80℃ on Mode II the fracture surface showed a plastic deformation of resin and some torsion without no breaking, because in this temperature, the polymeric chain of the matrix acquire mobility getting more ductile.
Footnotes
Acknowledgments
The authors acknowledge EMBRAER for providing the specimens.
Declaration of Conflicting Interests
The author(s) declared no potential conflicts of interest with respect to the research, authorship, and/or publication of this article.
Funding
The author(s) disclosed receipt of the following financial support for the research, authorship, and/or publication of this article: This work was partially funded by the Brazilian Agency CNPq through Grants 300990/2013-8, 157781/2012-7, 103671/2014-5 and FAPESP (2006/61257-5).