Nonlinear material behavior of FRPs under shear loading is widely observed and investigated. In case of combined stress states under tension and shear, an interaction between the macroscopic shear stress–strain curve evolution and the applied tension has been observed and described by several publications in the past. In the present work, the available experimental data with combined stress states are evaluated and a specific threshold shear stress is found, above which nonlinear material behavior occurs for all stress states. Further, a new simplified phenomenological model is derived to model the nonlinear behavior of FRPs when the threshold shear stress is exceeded. This simplified model only needs the threshold shear stress and one evolution parameter, both derived from a pure shear test, to model nonlinear behavior for all combined stress states. A comparison with the available experimental results and with the predictions of the WWFE-III participants for WWFE-III test case 1 shows a very good agreement.
In the past, there have been many attempts to understand and model the nonlinearity of fiber-reinforced plastics (FRPs) deformation behavior when in-plane shear stress is applied. Some theories assessed in the “World Wide Failure Exercise III (WWFE III)”1 as well as most of the currently available FE software use a linear elastic, an exponential or a specified curve approach to describe the shear behavior. Other shear theories are based on micro-mechanics, internal thermodynamic forces or hardening approaches. If nonlinearity is not considered, inter-fiber fracture (IFF) is predicted at much lower shear strains than in reality. Therefore, the full potential of FRPs cannot be achieved if linear elastic behavior is assumed.
To estimate the complex stress states of FRPs, the stresses at IFF have been widely evaluated and many existing failure criteria2–5 are able to predict the failure stresses with sufficient accuracy.6,7 However, these stress-based failure criteria do not consider failure strain. Many approaches have been developed to describe the stress–strain relation up to failure. Using micro-mechanics calculations and separating fiber and matrix, Chamis et al.8 developed a workflow to determine nonlinear behavior in FRPs and to transfer the results to macroscopic level. Other authors9,10 used the Mori-Tanaka method11 to define the micro-damage evolution in FRPs until IFF. Daghia and Ladeveze12 used a diffuse damage formulation to determine fiber–matrix interface separations and matrix damage.
The effect of superimposed in-plane normal stresses on in-plane shear stress-strain curves is rarely evaluated. The nonlinear behavior of in-plane transverse compression (transverse to fibers) with superimposed in-plane shear has been investigated and modeled by Vogler and Kyriakides13 and Hsu et al.14 In the experimental tests on flat long strips of unidirectional composites, a load path dependent nonlinear behavior of the in-plane shear and the in-plane transverse compression was observed. If pure shear (or pure compression) was applied first and afterwards compression (or shear), no interaction between compression and shear was observed. On the other hand, if shear and compression were applied simultaneously, an interaction between both stresses was observed in progression of the nonlinear behavior. The maximum stresses at IFF, however, were not affected by the loading path. Totry et al.15 performed micro-mechanical investigations using statistical representative volume elements (SRVE) and showed that the failure locus is independent of the loading path for out-of-plane shear with superimposed transverse compression. Melro et al.16,17 developed a constitutive model for polymer composites and analyzed different load cases using SRVEs. In a micro-mechanical model-based study, a combined load case with compression and transverse shear has shown considerable nonlinear behavior of the composite. Swanson et al.18 presented experimental results for tension and compression with superimposed shear. Since the experimental procedure was similar to the sequential tests by and Kyriakides,13 no interaction between tension/compression and shear was observed. Contrary to sequential load paths, Kopp19 and Schröder20 (both presented in Puck et al.21) have performed experimental tests on hoop wounds, where transverse tension or compression was applied simultaneously with shear. As for the simultaneous loading tests in Vogler and Kyriakides,13 the experimental results showed an interaction between shear and transverse stress. Summarizing, the effect of the superimposed in-plane transverse stress on the nonlinear shear stress behavior is not always present. If there is no interaction, two separated curves for the two different modes are sufficient to model the nonlinear behavior. On the other hand, a number of failure models13,21–23 include the interacting behavior between in-plane shear and in-plane transverse tension. To model this interaction for nonlinear shear deformation, the nonlinear approach needs to consider different stress ratios. Finally, it can be said that based on experimental observations, an interaction between tension and shear must be modeled, if both stresses are applied simultaneously and neglected if the loads are applied sequentially.
Damage mechanics approaches using a damage variable d are well-established methods to model nonlinear material behavior. The nonlinear stress–strain-progression of FRPs under shear can be described by such an approach using , where d defines the reduction of the shear modulus depending on the shear strain. Puck and Mannigel21 proposed an analytical definition for the reduction of the in-plane shear and in-plane transverse compression stresses using Puck’s failure criterion3 and the corresponding stress exposure (subsequently called fE) for inter-fiber fracture. This analytical function was successfully applied to several composite materials to model nonlinear behavior under in-plane shear.
In the present work, the available published experimental data for nonlinear behavior of in-plane shear with superimposed tension are evaluated and new conclusions are drawn. Based on the presented observations, a new approach is presented for combined shear-tension loads, where all needed material parameters can be determined from the pure shear stress curve and can be used for combined shear and tension. Finally, the predicted stress–strain curves are compared with the available experimental results and with numerical results of the WWFE-III.1
Experimental data for in-plane shear with superimposed tension and derived conclusions for modeling nonlinear behavior
Available experimental data
To observe and suitably model nonlinear material behavior, experimental data are essential. However, there is a lack of experimental data for combined tension and shear, where both tension and shear strain have been measured. Most of the published results only contain pure shear stress–strain curves.24–26 To describe the interaction between nonlinear behavior due to shear and due to transverse tension , at least two further stress–strain curves with different stress ratios are needed. Such experimental data for shear with superimposed tension (where an interaction between shear and tension is present) can be obtained from Kopp19 and Schröder20 both are also presented in Puck et al.21
Evaluation of the experimental data and deduction of a linear correlation and a resulting threshold stress ratio
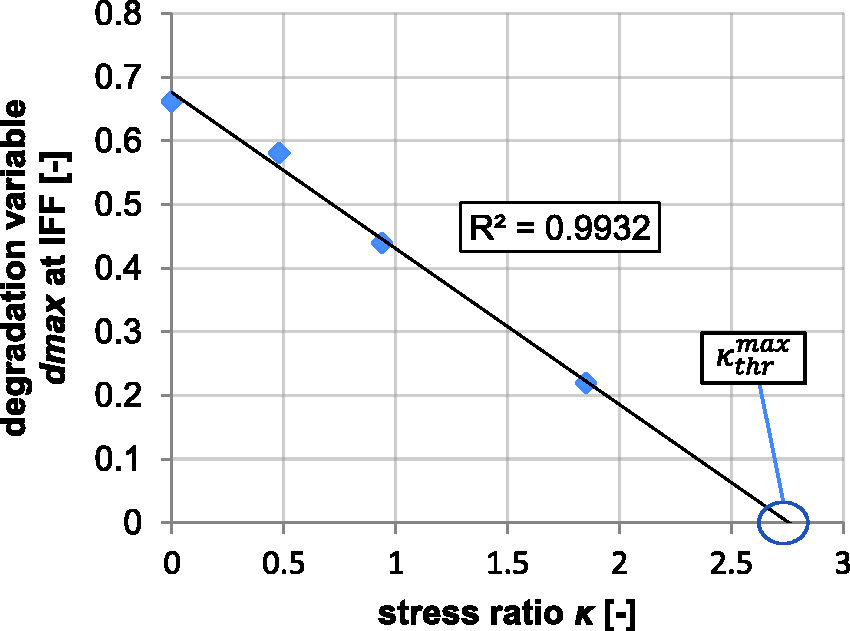
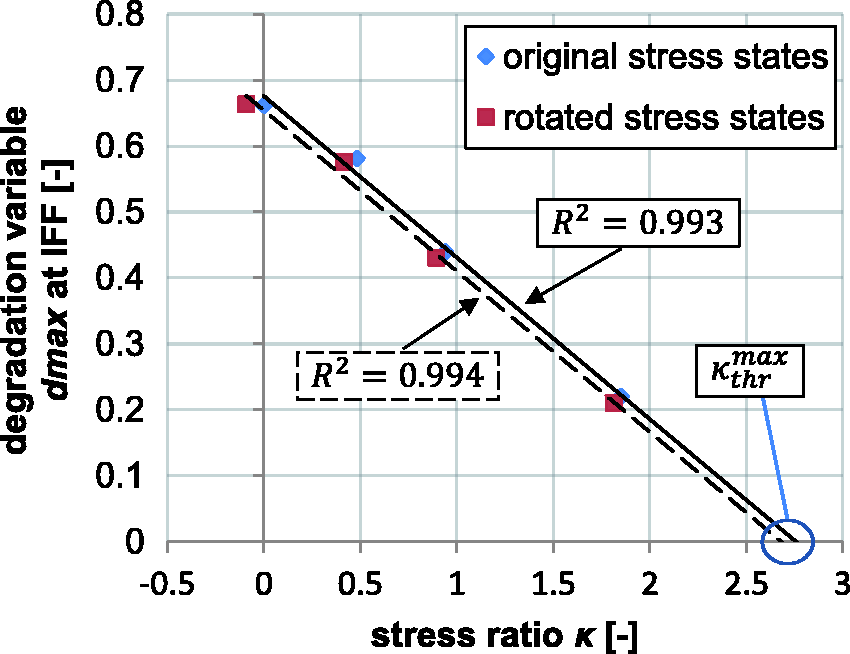
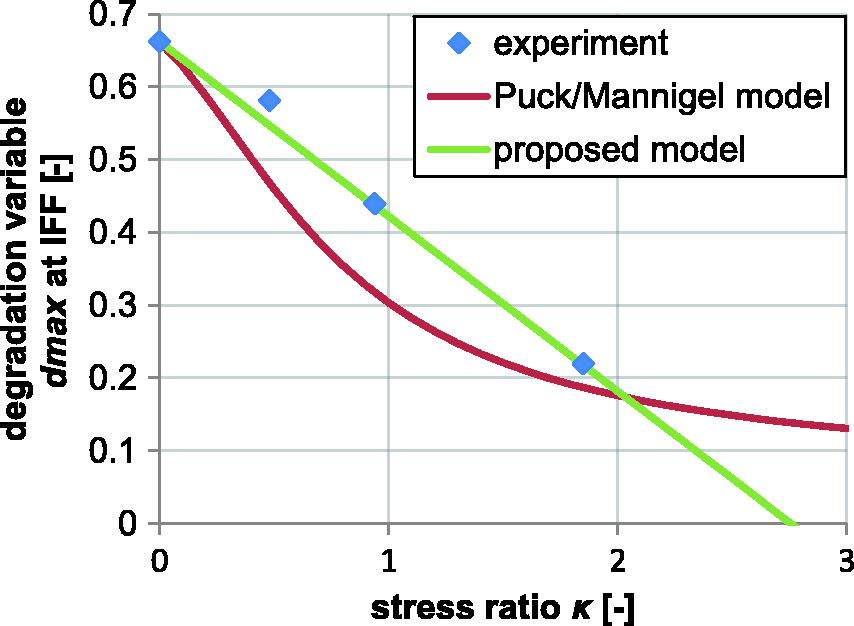
The experimental study in Schröder20 includes four different stress ratios to evaluate the influence of transverse tension on the nonlinear shear behavior of E-glass/LY556/HY917/DY070. From the stress–strain curve given in Puck et al.,21 the initial shear modulus was determined to and the shear strength to . The transverse tension strength of E-glass/LY556/HY917/DY070 was measured by Bleier.27 The variable at onset of macroscopic inter-fiber failure (failure of a UD lamina) can be computed by for each stress ratio , where is the shear stress and is the corresponding shear strain at macroscopic failure. The resulting degradation variables at onset of IFF are summarized in Table 1 and show a decreasing degradation state for an increasing stress ratio. More specific, a linear correlation between variable and stress ratio κ can be assumed, see Figure 1. If this linear function is extended until it crosses the stress-ratio-axis, a threshold stress ratio value can be determined defining the maximum stress ratio above in which no reduction () of the shear stress will occur prior to macroscopic IFF. From the experimental data given in Schröder,20 the threshold stress ratio is calculated to , see Figure 1. For the given correlation, the linear function can be formulated by
where the interception of the -axis can be approximated by , see Table 1. The coefficient of determination for the linear function equals to , which indicates a very good estimation of the correlation between and κ.
Degradation variables at onset of IFF depending on the stress ratio κ using experimental results from.20
(-)
0
0.48
0.94
1.85
(-)
0.045
0.0294
0.0176
0.007
(-)
0.662
0.5811
0.4392
0.2195
Observed linear relation between degradation variable at macroscopic IFF and stress ratio κ, illustrated for experimental data given in Schröder.20
The material properties of T300/LY556/HY917/DY070 in Kopp19 were determined to , and . However, the experimental results have only two different stress ratios, at and . In this case, the linear correlation between degradation variable d and stress ratio κ can be neither confirmed nor disproved. To verify that the correlation can be assumed to be linear, at least three different stress ratios are necessary. A linear assumption, however, might be an admissible assumption owing to the lack of more experimental data. With and , the threshold stress ratio is calculated to . However, this value seems to be too low and therefore not feasible. This condition of the experimental results in Kopp 19 will be discussed in the following section and in the validation section.
Deduction of a threshold shear stress
To calculate the stresses at the threshold stress ratio , a failure criterion is needed which allows calculating the transverse and shear stress at IFF. A well-established IFF failure criterion with sufficient agreement with experimental results is the Puck failure criterion3 with
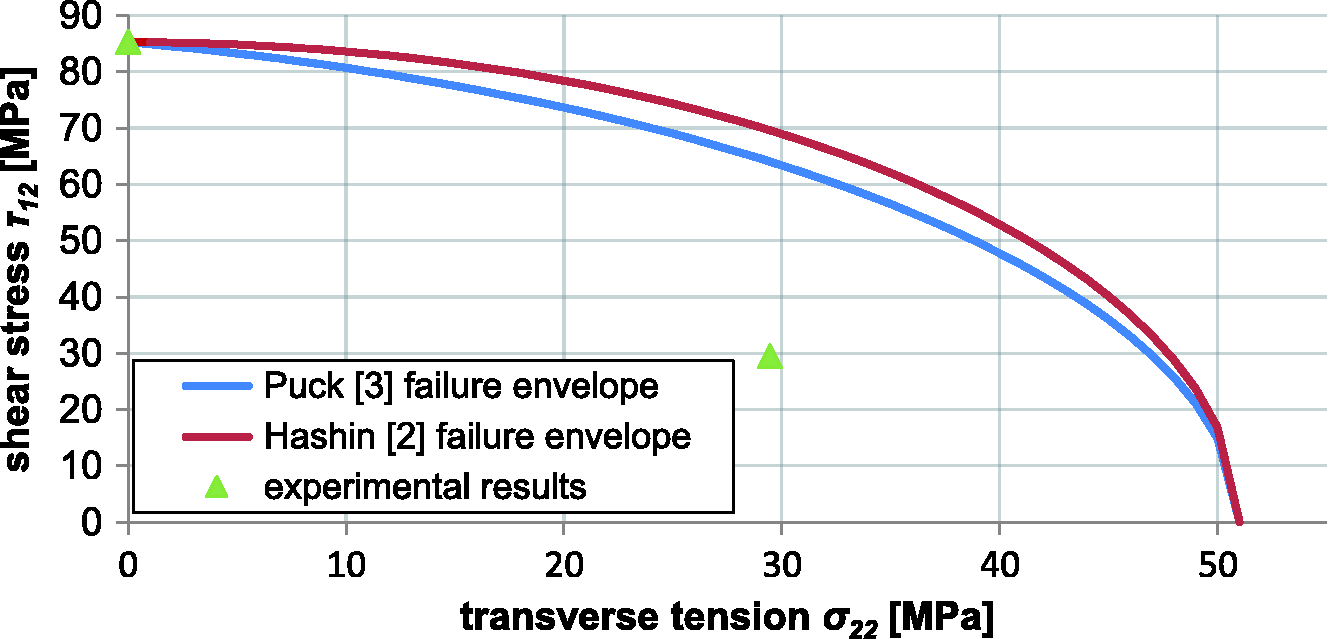
for IFF mode A, where fE is the stress exposure, SL is the shear strength, YT is the transverse tension strength and the inclination parameter28 defining the negative tangent at . The experimental results from Schröder20 agree well with Puck’s failure criterion for IFF mode A, using the recommended inclination parameter . On the other hand, if Puck’s failure criterion is applied to the experimental results from Kopp19 for stress ratio , the stress exposure yields only , when macroscopic failure is already reached in experiments. For other established failure criteria like Hashin2 or Tsai–Wu,28 the predicted failure stresses are also higher than the measured ones (see Figure 2). Therefore, the results from Kopp cannot be taken into account to derive a suitable model to describe the nonlinear behavior of a UD-lamina for combined load cases.
Experimental results from Kopp19 for T300/LY556 compared to the failure envelopes of Hashin and Puck.2
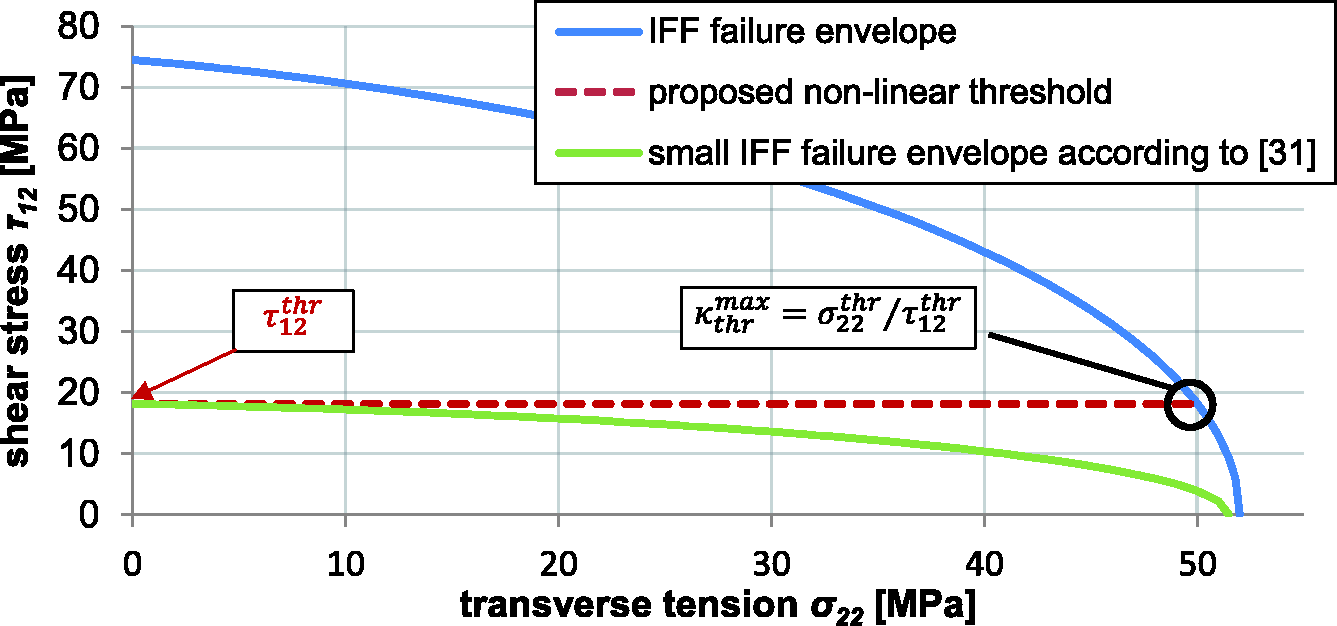
Since all values at the different stress ratios in Table 1 are given at IFF, the threshold stress ratio must lay on the IFF failure envelope. Using Puck’s failure criterion (see equation (2)) and the experimental results from Schröder20 with threshold stress ratio and stress exposure , the threshold shear stress can be calculated to . Furthermore, if the calculated threshold shear stress at the maximum threshold stress ratio is compared with the beginning of nonlinear behavior for pure in-plane shear (stress ratio ), the values are approximately the same (see Figure 3). Using the linear correlation of , stress ratios will lead to shear stresses smaller than at IFF. Therefore, the maximum threshold stress ratio denotes the limit stress ratio above which no nonlinear behavior occurs. At this point, the transverse tension stress is much higher than the shear stress. The threshold transverse tension stress, which corresponds to for the threshold stress ratio , yields . This is very close to the pure transverse tension strength . Puck and Mannigel21 have calculated that the start of nonlinear behavior for pure shear is at . This will result in a threshold shear stress of for pure shear, which is close to the threshold shear stress calculated at the maximum threshold stress ratio .
IFF failure envelope of E-glass/LY556/HY917/DY070 according to experimental data from Schröder,20 complemented by the proposed threshold shear stress.
Proposition of a constant threshold shear stress
For a given correlation between the degradation variable d and stress ratio κ, the resulting maximum threshold stress ratio leads to a threshold shear stress . This implies that above or below , no nonlinear behavior occurs. With increasing stress exposure fE between and failure stress , it is assumed that the transverse tension stress remains linear elastic until ply failure of the UD-lamina. This assumption results from pure transverse tension tests using UD-laminates, where no nonlinearity is observed in the stress–strain curve. Puck and Mannigel21 also use this assumption. On the other hand, experiments with cross-ply laminates show nonlinear behavior of the laminate under transverse tension due to transverse matrix cracking of the 90° plies.29,30 Since the threshold shear stress is approximately the same at the threshold stress ratio and at the beginning of the nonlinear behavior for pure shear load, it is assumed that remains constant for all stress ratios κ between (see Figure 3). With this assumption, the IFF failure area can be divided in two regions, the linear-elastic region (below ) and the nonlinear region (above and below IFF). This assumption differs from the damage onset curve proposed by Schuecker and Pettermann,31 which is estimated as a ‘small IFF failure envelope’ using Puck’s failure criterion and replacing the strengths YT and SL by and , see Figure 3. However, the assumption of a ‘small IFF failure envelope’ builds on supposed threshold shear stresses at several stress ratios which are not provided by experimental data in Schuecker and Pettermann.31
Influence of fiber rotation on the threshold shear stress
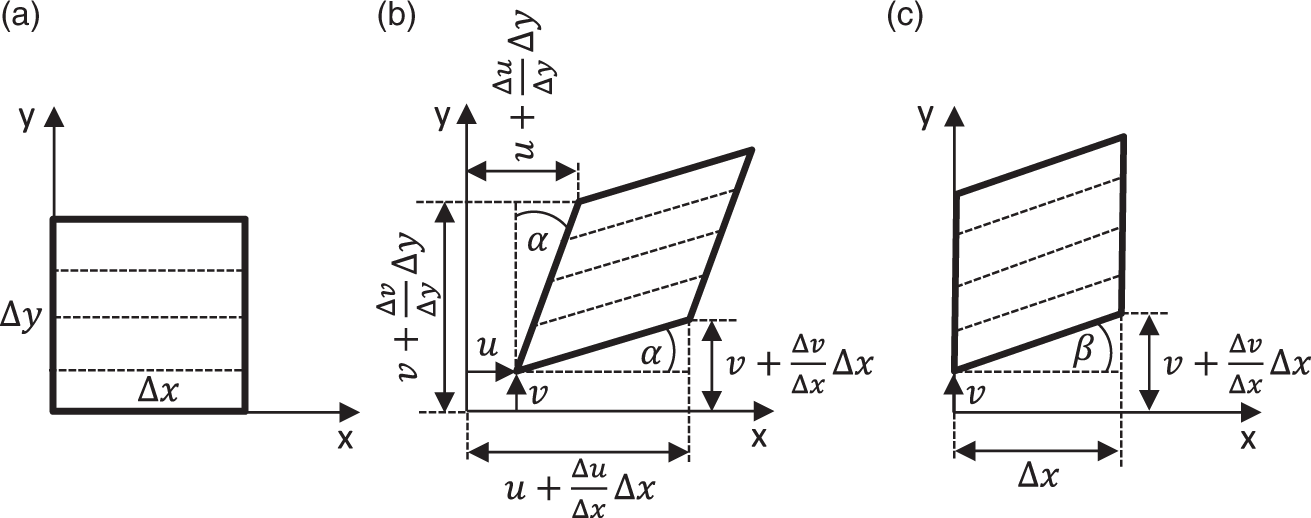
Since shear deformation leads to a fiber rotation of the micro structure, it must be considered while modeling FRPs. If a unit cell is deformed by shear, it has to be distinguished between pure shear and simple shear (see Figure 4).
Deformation of a unit cell: (a) initial state, (b) pure shear deformation, (c) simple shear deformation.
In the case of pure shear, the fiber rotates by an angle α, and in the case of simple shear by an angle β. For the same shear strain, the simple shear case will induce a greater fiber rotation than the pure shear case. An unrestricted deformation of a homogenized isotropic material leads to a pure shear deformation. In the case of fiber-reinforced composites, the shear deformation can be a combination of pure and simple shear. Since simple shear leads to greater fiber rotations, it is considered as upper bound to evaluate the effect of fiber rotation on the threshold shear stress. For small deformations,32 the estimation of the rotation angle can be calculated by
The failure shear strains for different stress ratios are given in Table 1. With increasing stress ratio, the failure shear strain reduces and, therefore, the angle of the fiber rotation also reduces. The rotation angle varies between 0.4° () and 2.6° (). To calculate the associated stress components, the stress tensor must be rotated. The rotated stresses and are calculated by
with rotation angle β corresponding to the stress ratio κ. If the degradation variable d for each rotated stress ratio κ is calculated and plotted over the stress ratio, it can be seen that the correlation between d and κ remains the same. The curve is slightly rotated and shifted horizontally (see Figure 5). The coefficient of determination for the new curve leads to very good estimation of the correlation and is very close to from the curve which does not consider fiber rotation. The threshold stress ratio results in (compared to without considering fiber rotation) and the corresponding threshold shear stress yields (compared to ). The threshold shear stress resulting from rotated stress states is approximately 0.5 MPa higher than the threshold shear stress calculated directly from the experimental results. Therefore, if the fiber rotation is small, the experimental results can be used directly to determine the threshold shear stress on macroscopic scale without considering fiber rotation.
Comparison of the resulting degradation variable d at different stress ratios κ if fiber rotation is considered (dashed line) and not considered (continuous line).
New approach to model nonlinear behavior
Nonlinear behavior for pure in-plane shear stress
According to Puck and Mannigel,21 the current degradation variable d for pure in-plane shear load can be obtained from
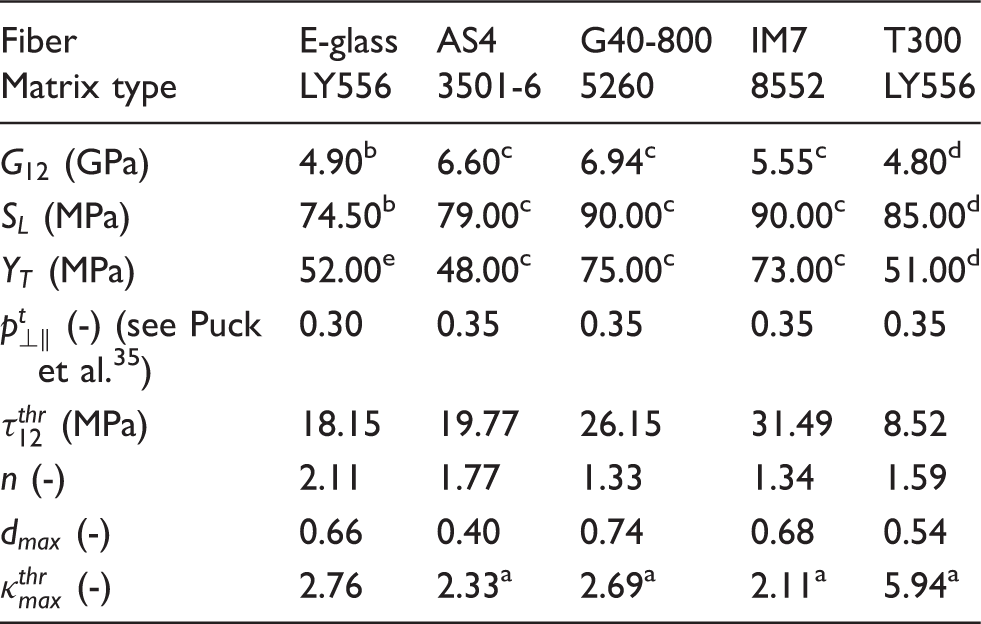
where fE is the current stress exposure, is the threshold stress exposure, which defines the beginning of the nonlinear behavior at pure shear stress, is the degradation variable at macroscopic failure () and n is a fitting parameter. The fitting parameter n can be estimated by using a least square fitting algorithm. This material-dependent parameter has been estimated in the present work to for several materials (see Table 2). With the given equation (5), an analytical function is given, which connects every stress exposure fE, and thus every current shear stress , with the corresponding degradation variable d. In Puck et al.,21 is estimated by fitting the value to stress-strain curves of pure shear stress test. To model nonlinear behavior not only for in-plane shear, but also for combined shear and tension, the threshold shear stress needs to be estimated under consideration of experimental results with several stress ratios , see the following section.
Material parameters to describe the non-linear behavior.
Note: Parameters are partly taken from literature19,21,26,27,35 and partly computed by the proposed model.
Nonlinear behavior for in-plane shear with superimposed tension
To account for the influence of transverse tension on the growing nonlinear behavior, Puck and Mannigel21 propose the evolution
of the damage variable, including a pre-factor , which is estimated by fitting the stress–strain curves to all experimental curves with . The constant pre-factor depends on the number of available tests with different stress ratios. Therefore, many tests are needed to estimate this factor. In Puck et al., 21 the pre-factor is given with values between . For very small shear stresses , the shear-specific stress exposure value can be neglected, which leads to a degradation variable greater zero for all stress ratios, even for pure transverse tension. This condition is not discussed in Puck et al.21 and would need further experiments with higher stress ratios to be validated.
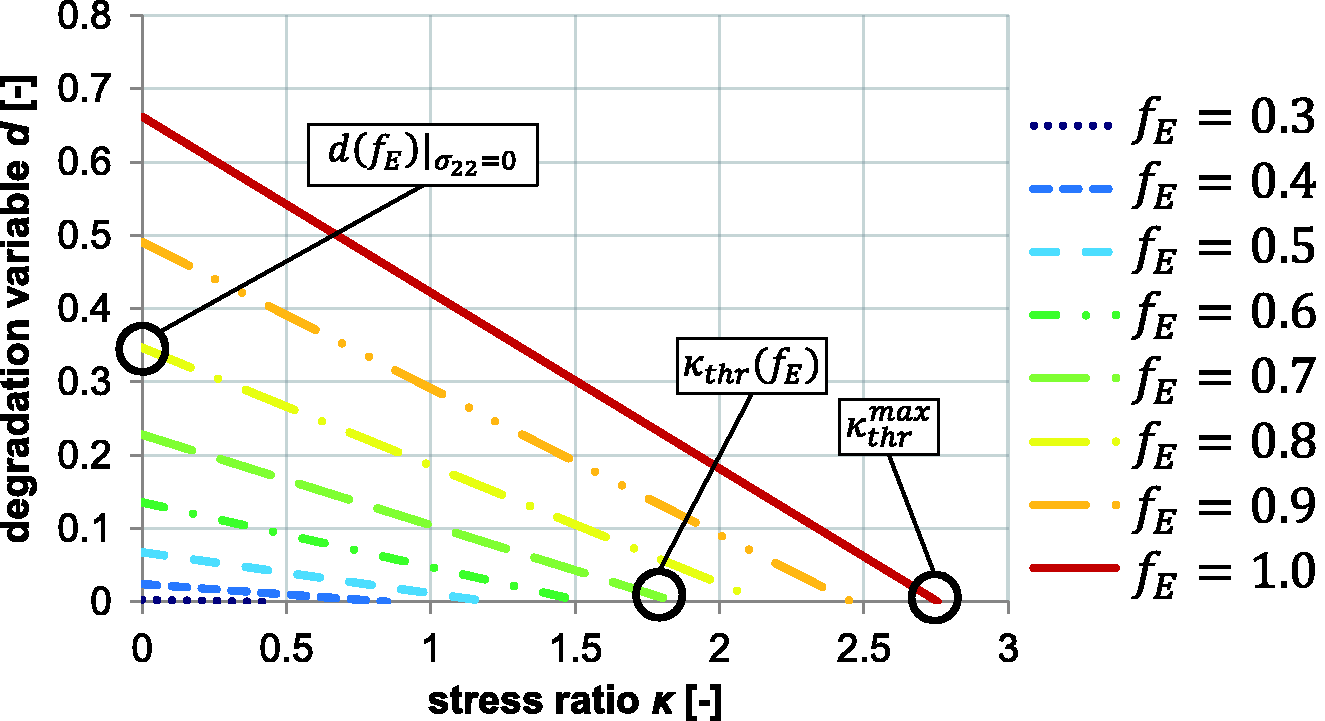
The present work proposes an approach to account for the interaction of shear and tension by utilizing the above described linear correlation between degradation variable d and stress ratio κ (cf. Figure 1). Furthermore, the assumption of a constant (independent of κ) is used (cf. Figure 3). The assumption of linear correlation can be extended to be defined not only for , but also for each constant stress exposure (see Figure 6). For each fE, this extended linear assumption can be determined by two intersection points: The degradation variable at pure shear (at , d-axis) which is given by equation (5) and the fE-specific threshold stress ratio (κ-axis). define the stress ratio of a certain fE above which no nonlinear behavior occurs before reaching fE. Formulated the other way around: nonlinear behavior starts at stress values and . Consequently, the threshold stress ratio can be determined from the IFF mode A failure criterion (see equation (2)), by utilizing the assumption of a constant which is independent of κ (cf. Figure 3):
with
Evolution of the degradation variable d depending on current stress exposure fE and stress ratio κ.
According to Figure 6, the resulting function to define each degradation variable depending on the current stress exposure fE and stress ratio κ can be expressed as follows
where is the theoretical degradation variable at pure shear stress taken from equation (5) and is the threshold stress ratio taken from equation (7). To account for unloading/reloading, the updated value of the degradation variable is defined by
Achievements of the new approach
The limitation of phenomenological models due to oversimplification of the complex material behavior is obvious. For a better understanding of the real material behavior, the interaction of transverse tension with shear stress can be analyzed by a micro-mechanics based model. This allows to capture effects on the micro scale which cannot be explained from experimental results. However, very detailed knowledge of the structure mechanical behavior of fiber and matrix is essential for micro-mechanical based models. This requires reliable input data for each constituent, which are not always available. Therefore, the usage of phenomenological models based on experimental observations for complex stress combinations may be legitimate.
The presented phenomenological model is quite simple and fast to parametrize. For a fast designing process of composite parts, such models are very useful. In the present model, all needed parameters to model nonlinear behavior for combines stress states can be determined by a pure shear test. Since the shear strength is needed to define the onset of macroscopic IFF, the pure shear test is essential to have reliable strength data. Therefore, no additional experiments are needed to model combined stress states. On the other hand, Puck and Mannigel21 need several other stress states to model the nonlinear behavior for combined stress states. From the pure shear test data, the threshold shear stress and the fitting parameter n in equation (5) can be determined. Knowing , the threshold stress ratio can be computed by equation (7) and, thus, the nonlinear stress evolution until macroscopic failure follows from equation (9). This approach can be used to model the single ply behavior in a multi-directional laminate until first ply failure. First ply failure can be detected based on the computed stresses and an in-situ strength-based criterion.
Validation
Comparison of the nonlinear stress evolution model with experimental results
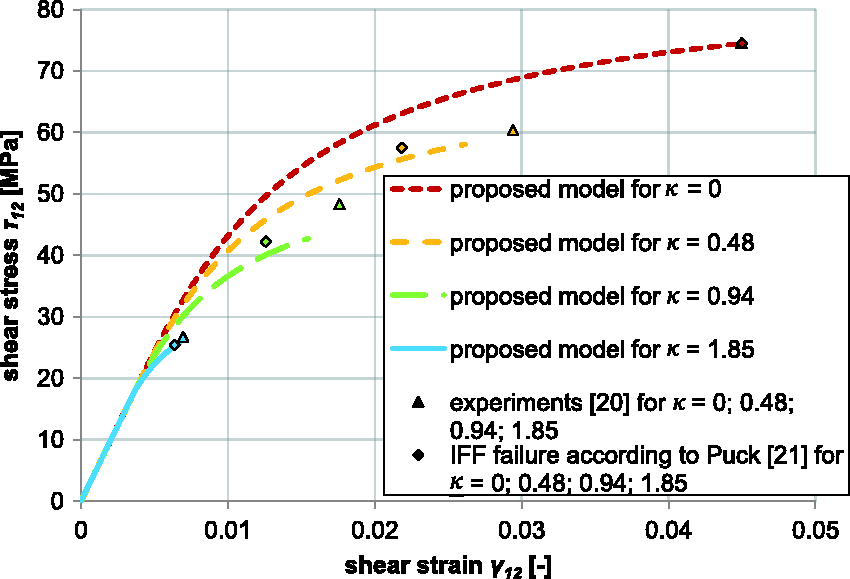
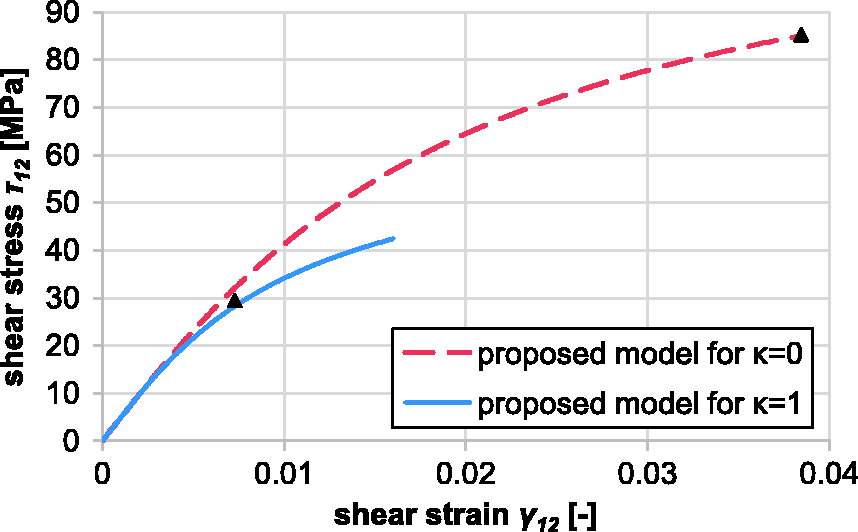
The available experimental results from Kopp19 (T300/LY556) and Schröder20 (E-glass/LY556) with interaction between in-plane shear and superimposed transverse tension are taken for validation. The experimental IFF stress–strain values of the E-glass/LY55620 are given for four stress ratios, see Table 1 and small triangles in Figure 7. Using the described approach, four stress–strain curves can be calculated, each for one stress ratio, see Figure 7. The maximum shear stresses result directly from the failure criterion at and are equal to the results presented in Puck et al., 21 see diamonds in Figure 7. The IFF failure strain, on the other hand, differs considerably. The reason for the deviation is the envelope for the relation. Using the provided data from Puck and Mannigel21 (, and ), the relation can be plotted (see Figure 8). Besides the pure shear stress (), the failure strains predicted by Puck and Mannigel are 9% to 25% lower than the experimental results, see Figure 7. In the nonlinear model presented here, the failure strains are only 4% to 13% lower than the experimental results.
Proposed failure envelope and stress–strain curves for different stress ratios for E-glass/LY556/HY917/DY070, compared with experimental results (only end points are provided in Schröder20) and with the approach from Puck and Mannigel.21
Comparison of damage variable d at IFF () for the model predictions by Puck/Mannigel, the present model and experimental results.
The experimental results in Kopp19 for the T300/LY556 have only two stress ratios in the shear vs. tension area. The threshold shear stress can be deduced from the pure shear test and is, therefore, taken from the fitting result of as determined by Puck and Mannigel.21 Using the given threshold stress exposure, the threshold shear stress yields and the corresponding maximum threshold stress ratio yields . The predicted results for both stress ratios ( and ) are shown in Figure 9. As discussed above and illustrated in Figure 2, the measured failure stress for (29.5 MPa) is smaller than predicted by established failure criteria (42.4 MPa), which corresponds to a stress exposure of instead of . Consequently, the predicted result for stress ratio crosses the experimental result at stress exposure and exceeds until IFF is predicted by the failure criterion.
Stress–strain curves of the proposed model for T300/LY556/HY917/DY070 at two different stress ratios compared to experimental results (only the end points are given in Kopp).19
Application of the nonlinear stress evolution model to WWFE-III load case
Using the described method, a stress–strain curve is calculated for test case 1 in WWFE-III1,26,33 and compared to the predicted results of the WWFE participants, see Figure 10. In test case 1, an AS4/3501-6 material is loaded first by transverse tension of 14 MPa, afterwards shear stress is induced. If transverse tension is applied without any shear stress, the stress ratio κ is infinite. With the induced shear stress, the stress ratio decreases until IFF occurs. The evaluated stress–strain curves from the participants1 indicate that there are two groups of models: one group predicts an influence of the transverse tension, the other group predicts no interaction between shear and transverse tension. However, the differences between the models in the predictions (except the one from Sapozhnikov and Cheremnykh34) are small. All predicted stress–strain curves are taken from the references in Kaddour et al.1
Stress–strain curve predictions of the participants of WWFE-III26 for test case 1, compared to the prediction of the proposed model.
Using the given material data26 (see Table 2) and equation (2), for and , the IFF occurs at a shear stress of and a stress ratio of . The proposed model is used to determine the maximum shear stress and maximum shear strain (see Figure 10). The maximum stress is 71.8 MPa, since the stress–strain curve is limited by IFF from equation (2). The maximum strain yields 1.72% which is comparable to the predictions of the participants of the WWFE-III. The results of the proposed model using only the threshold shear stress as an input parameter for in-plane shear with superimposed transverse tension show a very good agreement with the predictions of the other participants of the WWFE-III.1
Conclusion
The prediction of nonlinear behavior for pure or combined shear loads in FRP is essential to determine the actual physical strain at onset of macroscopic damage. Therefore, experimental results of different stress ratios have been evaluated in this work. For the investigated experiments, a linear correlation was found between the degradation variable d, which denotes the degradation of the shear modulus at IFF (stress exposure ), and the stress ratio . This linear correlation leads to the conclusion that for stress ratios greater than a maximum threshold stress ratio , no nonlinear behavior occurs prior to macroscopic IFF (thus ). For stress ratios smaller than , a threshold shear stress can be specified, at which nonlinear behavior starts. This threshold shear stress can be determined from pure shear test results or if experimental results for different stress ratios are available directly from . Furthermore, the linear correlation is extended to describe the evolution of the nonlinear behavior linearly not only for full stress exposure , but also for . Using this area of linear correlations in conjunction with the nonlinear evolution of a pure shear stress test and the stress-exposure dependent threshold stress ratio , the complete nonlinear evolution can be easily described for IFF mode A.
The main advantage of this approach is that it needs only one shear stress–strain curve, in addition to the basic material values (shear and transverse tension strength), to determine all required model parameters. These model-specific parameters are the threshold shear stress , which denotes the start of nonlinearity in a pure in-plane shear test, and the parameter n, which defines the exponent of the nonlinear evolution.
Using the presented approach to calculate test case 1 of the WWFE-III shows that the results have a good agreement with the predictions presented by the participants of the WWFE-III. The presented approach is simple, effective and very fast to parametrize. The method can also be applied to multi-directional laminates and can be combined with failure criteria using in situ-strengths.
Footnotes
Declaration of Conflicting Interests
The author(s) declared no potential conflicts of interest with respect to the research, authorship, and/or publication of this article.
Funding
The author(s) disclosed receipt of the following financial support for the research, authorship, and/or publication of this article: The presented work has been performed within the Young Investigator Group (YIG) “Tailored Materials for Lightweight Vehicles” funded by the Vector Stiftung. Additionally, we would like to thank the Deutsche Forschungsgemeinschaft (DFG) for the financial support of the research project “Experimental and virtual analysis of draping effects and their impact on the mechanical behavior of composite components” (KA4224/1-1, GU614/11-1).
References
1.
KaddourASHintonMJSmithPAet al.A comparison between the predictive capability of matrix cracking, damage and failure criteria for fibre reinforced composite laminates: part A of the third world-wide failure exercise. J Compos Mater2013; 47: 2749–2779.
PuckASchürmannH. Failure analysis of FRP laminates by means of physically based phenomenological models. Compos Sci Technol1998; 58: 1045–1067.
4.
CuntzeRGFreundA. The predictive capability of failure mode concept-based strength criteria for multidirectional laminates. Compos Sci Technol2004; 64: 343–377.
5.
PinhoSTDarvizehRRobinsonPet al.Material and structural response of polymer-matrix fibre-reinforced composites. J Compos Mater2012; 46: 2313–2341.
6.
SodenPHintonMJKaddourAS. A comparison of the predictive capabilities of current failure theories for composite laminates. Compos Sci Technol1998; 58: 1225–1254.
7.
KaddourASHintonMJ. Benchmarking of triaxial failure criteria for composite laminates: comparison between models of ‘Part (A)’ of ‘WWFE-II’. J Compos Mater2012; 46: 2595–2634.
8.
ChamisCCAbdiFGargMet al.Micromechanics-based progressive failure analysis prediction for WWFE-III composite coupon test cases. J Compos Mater2013; 47: 2695–2712.
9.
LaurinFCarrereNHuchetteCMaireJ-F. A multiscale hybrid approach for damage and final failure predictions of composite structures. J Compos Mater2013; 47: 2713–2747.
10.
FlatscherTSchueckerCPettermannHE. A constitutive ply model for stiffness degradation and plastic strain accumulation: its application to the Third World Wide Failure Exercise (Part A). J Compos Mater2013; 47: 2575–2593.
11.
MoriTTanakaK. Average stress in matrix and average elastic energy of materials with misfitting inclusions. Acta Metall1973; 21: 571–574.
12.
DaghiaFLadevezeP. Identification and validation of an enhanced mesomodel for laminated composites within the WWFE-III. J Compos Mater2013; 47: 2675–2693.
13.
VoglerTKyriakidesS. Inelastic behavior of an AS4/PEEK composite under combined transverse compression and shear. Part I: experiments. Int J Plast1999; 15: 783–806.
14.
HsuS-YVoglerTKyriakidesS. Inelastic behavior of an AS4/PEEK composite under combined transverse compressionand shear. Part II: modeling. Int J Plast1999; 15: 807–836.
15.
TotryEGonzálezCLLorcaJ. Influence of the loading path on the strength of fiber-reinforced composites subjected to transverse compression and shear. Int J Solids Struct2008; 45: 1663–1675.
16.
MelroARCamanhoPPAndrade PiresFMet al.Micromechanical analysis of polymer composites reinforced by unidirectional fibres: part I – constitutive modelling. Int J Solids Struct2013; 50: 1897–1905.
17.
MelroARCamanhoPPAndrade PiresFMet al.Micromechanical analysis of polymer composites reinforced by unidirectional fibres: part II – micromechanical analyses. Int J Solids Struct2013; 50: 1906–1915.
18.
SwansonSRMessickMJTianZ. Failure of carbon/epoxy lamina under combined stress. J Compos Mater1987; 21: 619–630.
19.
Kopp JW. Zur Spannungs- und Festigkeitsanalyse von unidirektionalen Faserverbundkunststoffen. PhD Thesis, RWTH Aachen University, Aachen, 1999.
20.
Schröder B. Untersuchungen zum Spannungs-Verformungs-Verhalten von unidirektional faserverstärkten Kunststoffen bei Querzugbelastung, bei Schubbelastung und bei kombinierter Belastung aus Querzug und Schub. Diploma Thesis, University Kassel, Kassel, 1983.
21.
PuckAMannigelM. Physically based non-linear stress–strain relations for the inter-fibre fracture analysis of FRP laminates. Compos Sci Technol2007; 67: 1955–1964.
22.
VyasGMPinhoSTRobinsonP. Constitutive modelling of fibre-reinforced composites with unidirectional plies using a plasticity-based approach. Compos Sci Technol2011; 71: 1068–1074.
23.
CamanhoPPDávilaCGPinhoSTIannucciLRobinsonP. Prediction of in situ strengths and matrix cracking in composites under transverse tension and in-plane shear. Compos Part A2006; 37: 165–176.
24.
SodenPHintonMJKaddourAS. Lamina properties, lay-up configurations and loading conditions for a range of fibre-reinforced composite laminates. Compos Sci Technol1998; 58: 1011–1022.
25.
KaddourASHintonMJ. Input data for test cases used in benchmarking triaxial failure theories of composites. J Compos Mater2012; 46: 2295–2312.
26.
KaddourASHintonMJSmithPALiS. Mechanical properties and details of composite laminates for the test cases used in the third world-wide failure exercise. J Compos Mater2013; 47: 2427–2442.
27.
Bleier A. Prüfverfahren zur Ermittlung exakter Werkstoffkennwerte einer unidirektionalen Schicht unter besonderer Berücksichtigung physikalischer Nichtlinearitäten. PhD Thesis, RWTH Aachen University, Aachen, 2011.
28.
TsaiSWWuEM. A general theory of strength for anisotropic materials. J Compos Mater1971; 5: 58–80.
29.
BoisCMalenfantJ-CWahlJ-CDanisM. A multiscale damage and crack opening model for the prediction of flow path in laminated composite. Compos Sci Technol2014; 97: 81–89.
30.
HuchetteCLévêqueDCarrèreNA multiscale damage model for composite laminate based on numerical and experimental complementary tests. In: UmedaSNakanoMMizuyamaHet al. (eds). Advances in production management systems: innovative production management towards sustainable growth, Cham: Springer International Publishing, 2015, pp. 241–248.
31.
SchueckerCPettermannHE. Constitutive ply damage modeling, FEM implementation, and analyses of laminated structures. Comput Struct2008; 86: 908–918.
32.
BrinsonHF. Polymer engineering science and viscoelasticity: An Introduction, 2nd edition. New York, Heidelberg, Dordrecht, London: Springer, 2015.
33.
KaddourASHintonMJSmithPAet al.The background to the third world-wide failure exercise. Compos Mater2013; 47: 2417–2426.
34.
SapozhnikovSBCheremnykhSI. The strength of fibre reinforced polymer under a complex loading. Compos Mater2013; 47: 2525–2552.
35.
PuckAKoppJKnopsM. Guidelines for the determination of the parameters in Puck’s action plane strength criterion. Compos Sci Technol2002; 62: 371–378.