
Abstract
Sandwich structures, due to their high stiffness versus lightness ratio, are used progressively in high performance products. In order to design these structures with the most appropriate dimensions and material combinations, relevant mechanical properties must be well understood. This work aims to estimate the elastic properties of composite sandwiches from a curved structure taking into account the manufacturing process. In the case of filament winding process, specimens are necessarily cylindrical or barrel extracted. In our case, these types of structures are tested in 3- and 4-point bending to analyze their behavior experimentally using predictive models and design rules. Different configurations are adopted for bending tests to analyze and discuss global mechanical behavior. Furthermore, the acoustic emission technique is used to detect the initial appearance of damage mechanisms and to examine their evolution in terms of amplitude peaks and localization. Finally, a correlation between these acoustic emission signals and the damage initiation mechanisms is proposed, considering their effects on the mechanical behavior of each tested material.
Keywords
Introduction
Automotive companies have been driven to reduce weight while pushing performance boundaries. There is an increasing demand for lightweight and functional materials to enhance the properties of advanced composites. To achieve this goal, the adoption of this type of materials is an obvious choice. Knowing that they are generally designed to support bending forces, sandwich structures represent powerful materials for that and must meet other requirements such as corrosion, abrasion, fire resistance and thermal insulation.1–3 Basically, the choice of the type of sandwich depends on its application, like structures or structural parts requiring high stiffness and strength. When designed to be used in cylindrical structures like tanks, curved composite sandwiches are mostly subject to flexural and compressive loadings. These highly efficient multi-layered materials are designed to support radial and bending loads. They consist of a low-density core bonded between two thin and relatively rigid skins. 4 The behavior of this type of structure constitutes the aim of the Huygens theorem: the resistance of a mechanically loaded section along a given axis varies with its quadratic moment along this axis. It should be noted that the geometry of a section is more significant than its corresponding mass. The high flexural performance is the major advantage of this type of multilayer material which requires additional information on its quasi static properties. The different polyethylene terephthalate- (PET), polyurethane- (PU) and polypropylene (PP)-based foams have numerous applications in diverse areas of engineering. 3 In fact, a high structural strength with a low weight, an excellent fatigue resistance, and a very good temperature stability are the important factors that enable these materials to substitute more traditional core materials such as PVC or Balsa. 5 For example, apart from the skins of sandwich structures which often do not allow that, the closed cell structure of PET foams ensures minimal humidity absorption and keeps the risk of physical degradation very low. 6 Their ability to be recycled makes them very attractive for applications, focusing on “green aspects”. With the basic properties of being a thermoplastic, PET foams have wide processing possibilities. Having both thermoset and thermoplastic properties allows this type of foam to be easily thermoformed, and thus tremendously extends the possibilities in design (3D-shape). Same as PET foams, PU- and PP-based foams are extremely low-weight hybrid core materials with mechanical properties that can be individually optimized. 7 This offers a multitude of benefits for the production process.
Although many experimental and numerical works have been conducted on bending behavior of sandwich materials, they were limited to flat structures and not to curved ones. Several researchers have explored the failure modes of sandwich structures in flexure.8,9 Triantafillou and Gibson 10 studied failure modes of sandwich beams with aluminum face sheets and a rigid PU foam core. Failure maps for various core densities and deflection ratios were constructed for face yielding, face wrinkling, core yield in shear, and core yield in tension and compression. Based on similar failure equations, a weight optimum design of composite sandwich structures was proposed by Yoshii. 9 A summary of design approaches to sandwich construction is done by ZENKERT and may be found in Humer et al. 11 while information on cellular solids is available in Shindo et al. 12
In the present study, a description of materials manufacturing method was firstly made to give a general idea of the context. Next, a mechanical characterization was carried out on the sandwich curved specimens made by filament winding process with PET-, PU- and PP-based foams and glass-fiber/vinyl-ester composite laminated skins, focusing on flexural deformation mechanisms. The obtained composite was subjected to quasi-static flexural loading with full coupling of skin–core interaction to investigate its mechanical behavior. The main objective was to elucidate the deformation and failure damages regarding the different real specimens in parallel with an acoustic emission monitoring (AE).13,14 In addition, the experimental results have been compared with the classical beam theory to ascertain the reliability of the investigation findings.15,16
Materials manufacturing
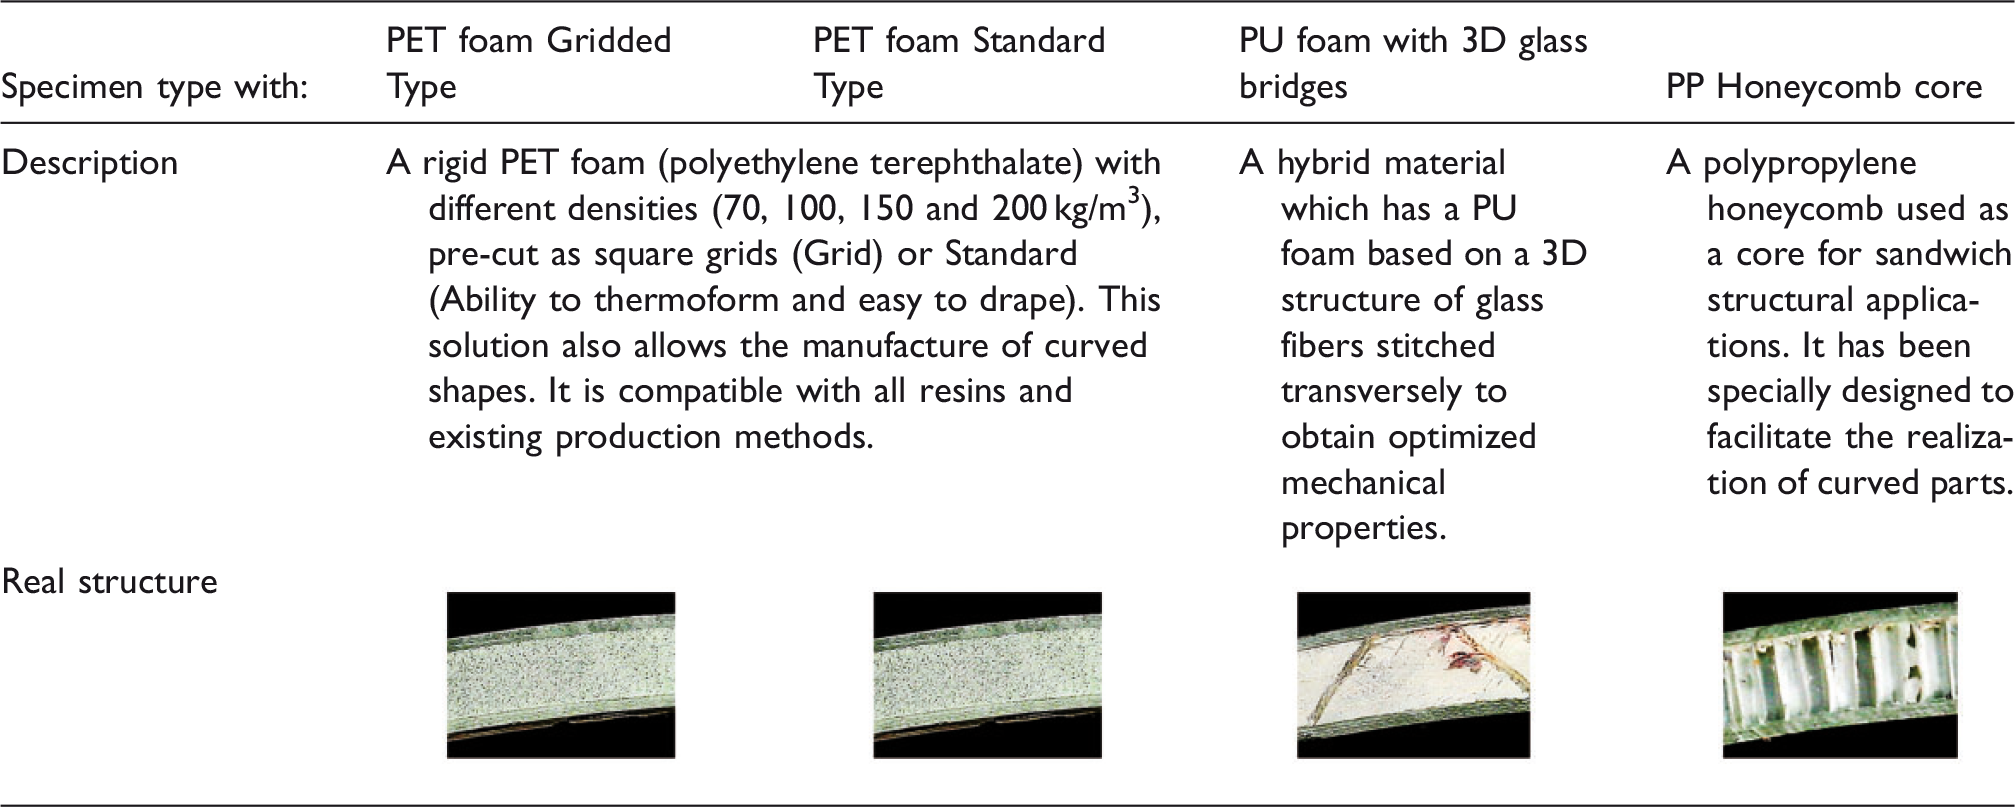
Description of different types of manufactured sandwich materials.
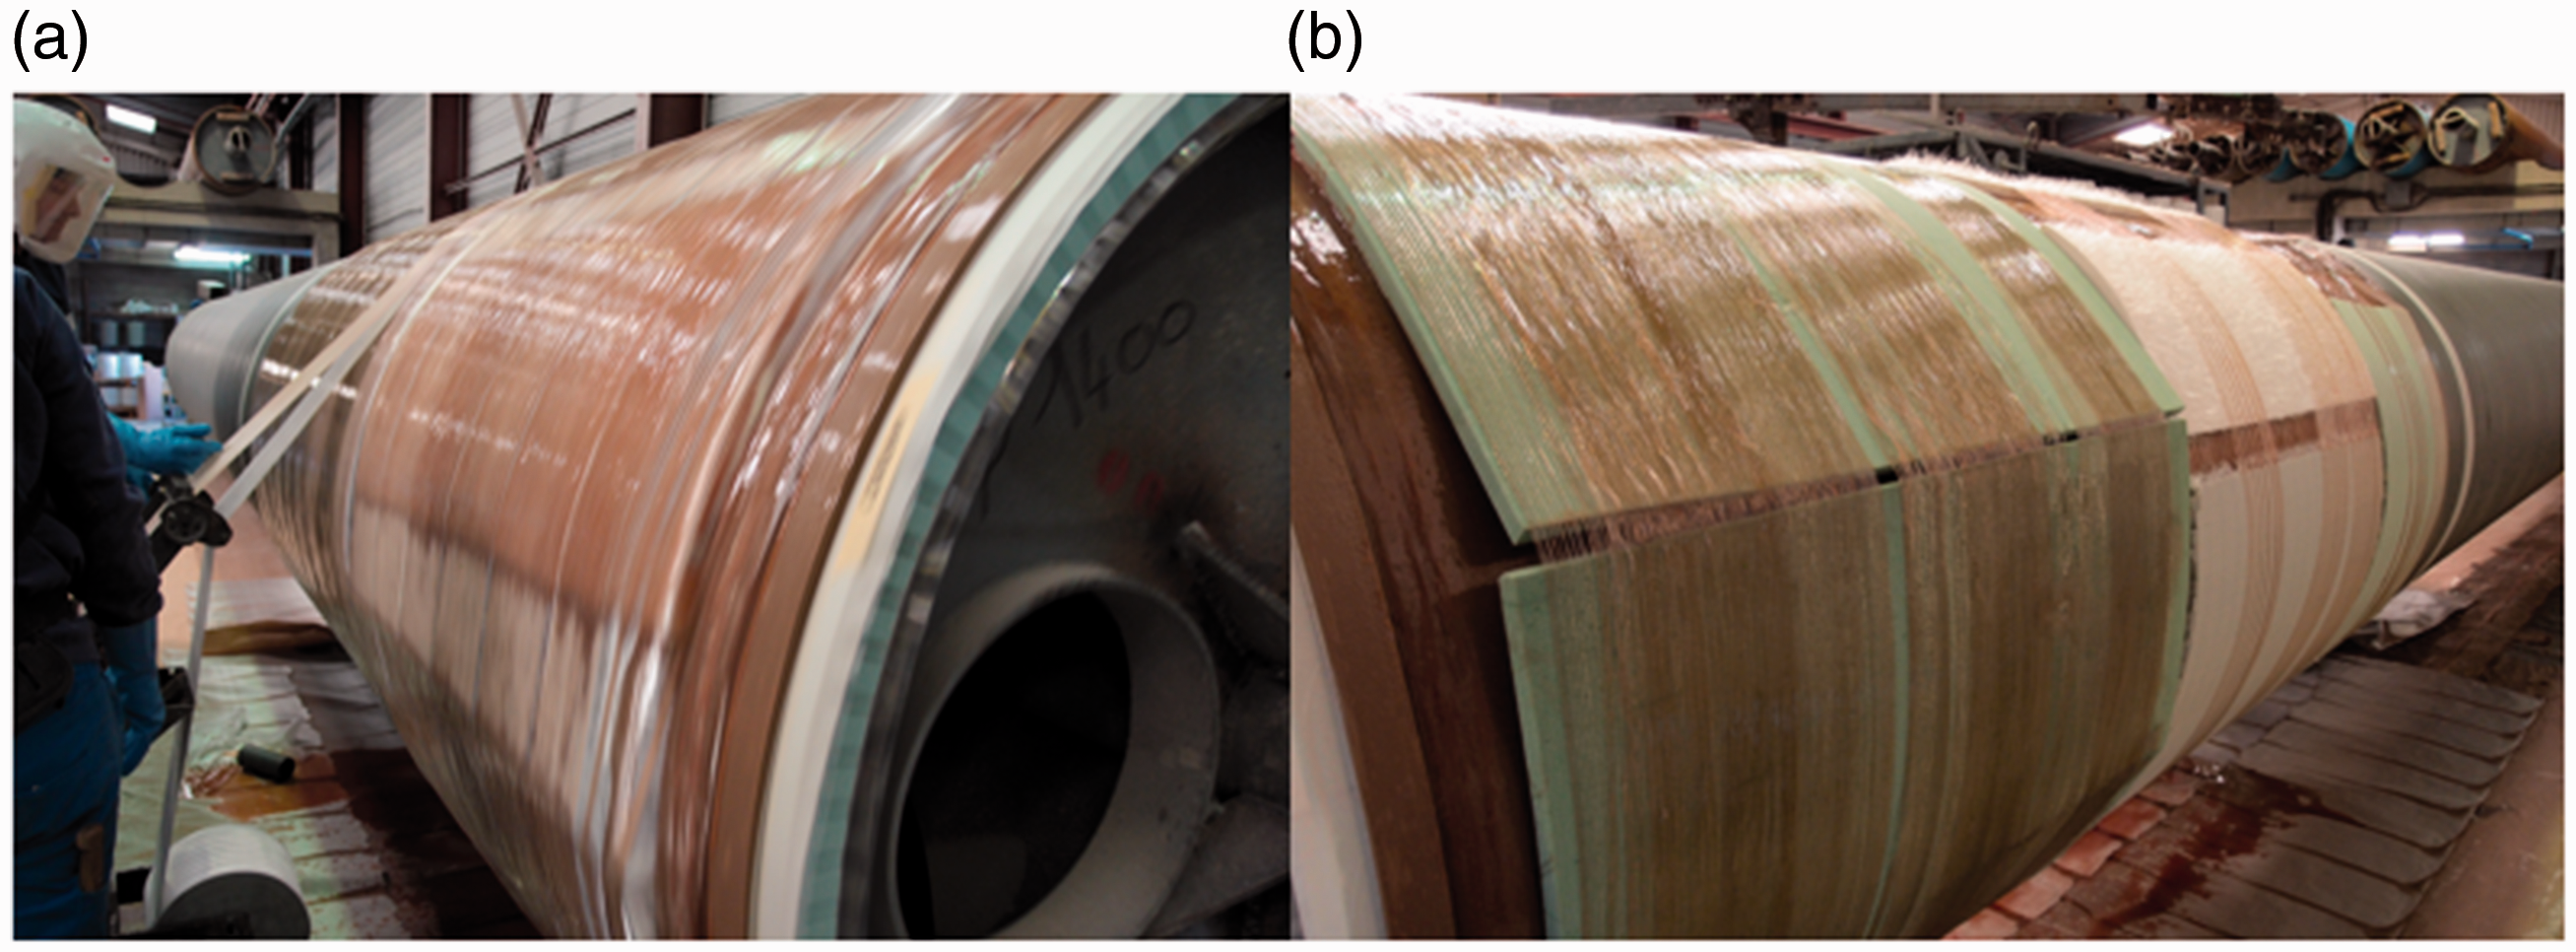
Manufacturing of sandwich structures using filament winding process. (a) Lower skin and (b) upper skin.
The insertion of the light core material between the two facings allows an increase in thickness while limiting the increase in mass. Moreover, the positioning of the faces, which are often very rigid, as far as possible from the median plane, allows to maximize the quadratic moment and therefore the flexural rigidity. In some cases, functional properties are also desired such as energy absorption during shocks. Thus, the choice of the core material makes it possible to satisfy this type of multifunctional specifications, using in particular architectural materials (for example foams, trellises, embossed sheets). It is by considering these structural and functional specifications that the choice of constituent materials and geometric parameters should take place in an integrated approach.
Using the actual filament winding process on a mandrel with a diameter of 1500 mm, our industrial partner was able to produce sandwich samples, using the selected candidate cores after a good research and study on the previously described materials. In fact, manufacturing has occurred in three phases:
Winding the first skin of the sandwich structure by depositing several layers of glass fibers to form 4 mm of thickness; A manual putting in each type of sandwich core on the mandrel. For this step, a process design has been proposed to the company (described later), which facilitates the preparation task of the foams before their implementation into process (see Figure 3). Winding of the outer skin (4 mm of thickness as well) and finish of the upper layer.
It was necessary to wait 2–3 h for the polymerization between each step. Finally, the extraction of the materials from the mandrel requires waiting at least 3 h after the end of the top skin. According to our industrial partner, all types of foams were well wound because of their drapeability, and even the standard PET foam took the curved shape well.
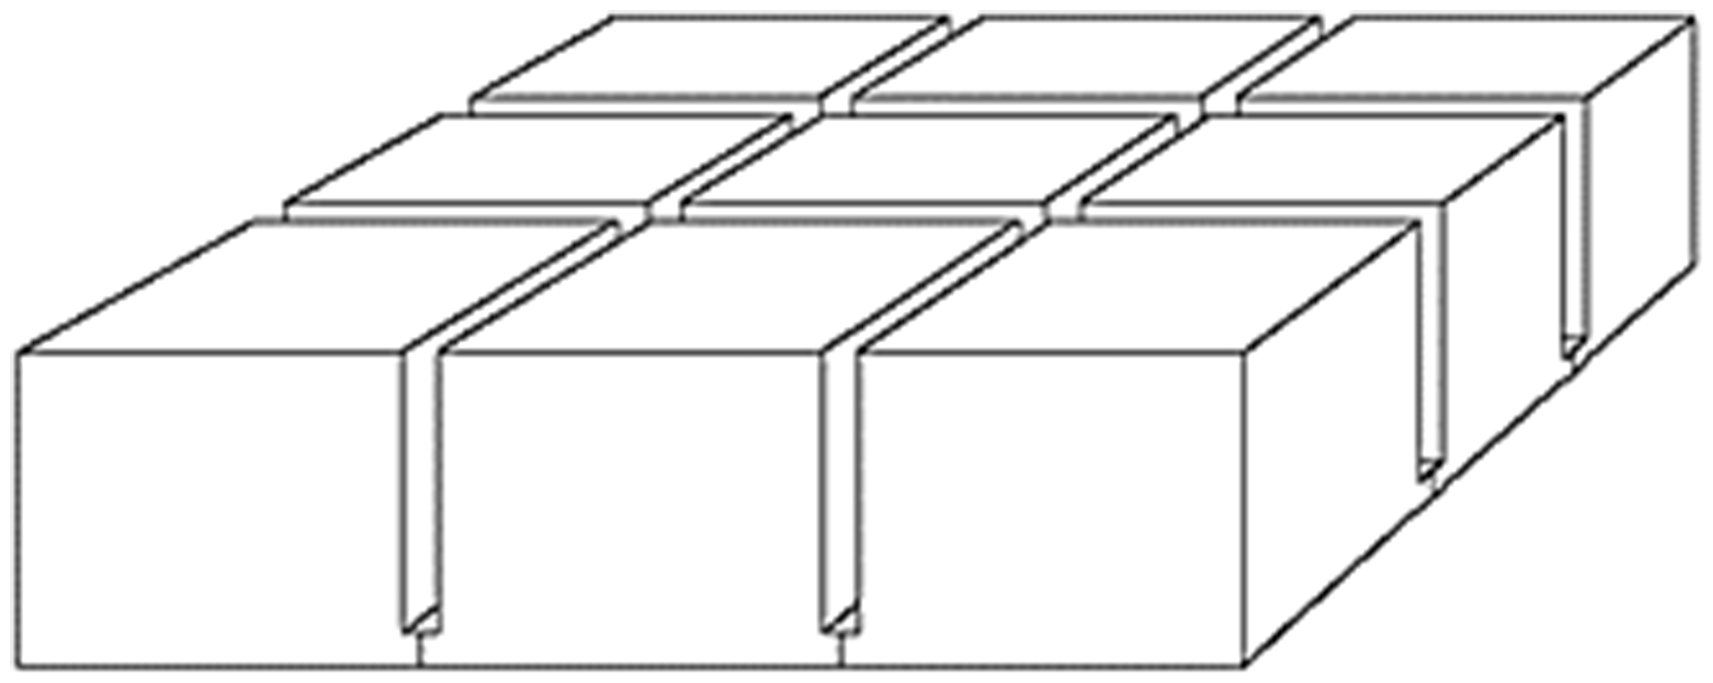
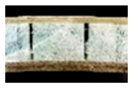
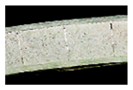
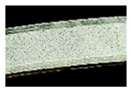
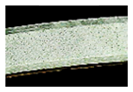
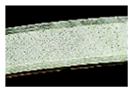
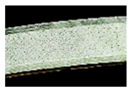
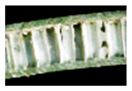
It should be noted that PET foams (Gridded Type) and PP Honeycomb foams have a particular asset. As shown in Figure 2, grid sawn cores are often used for production of curved sandwich structures. The width of the sawed cuts is 1.5 mm for both materials. A thin net made of glass fiber is glued to the underside of the core. The nets function is to keep the blocks in place.
PET foams with grids for curved structures. Comparison of the principal mechanical properties of PET, PU and PP sandwich cores (Supplier datasheets).
6
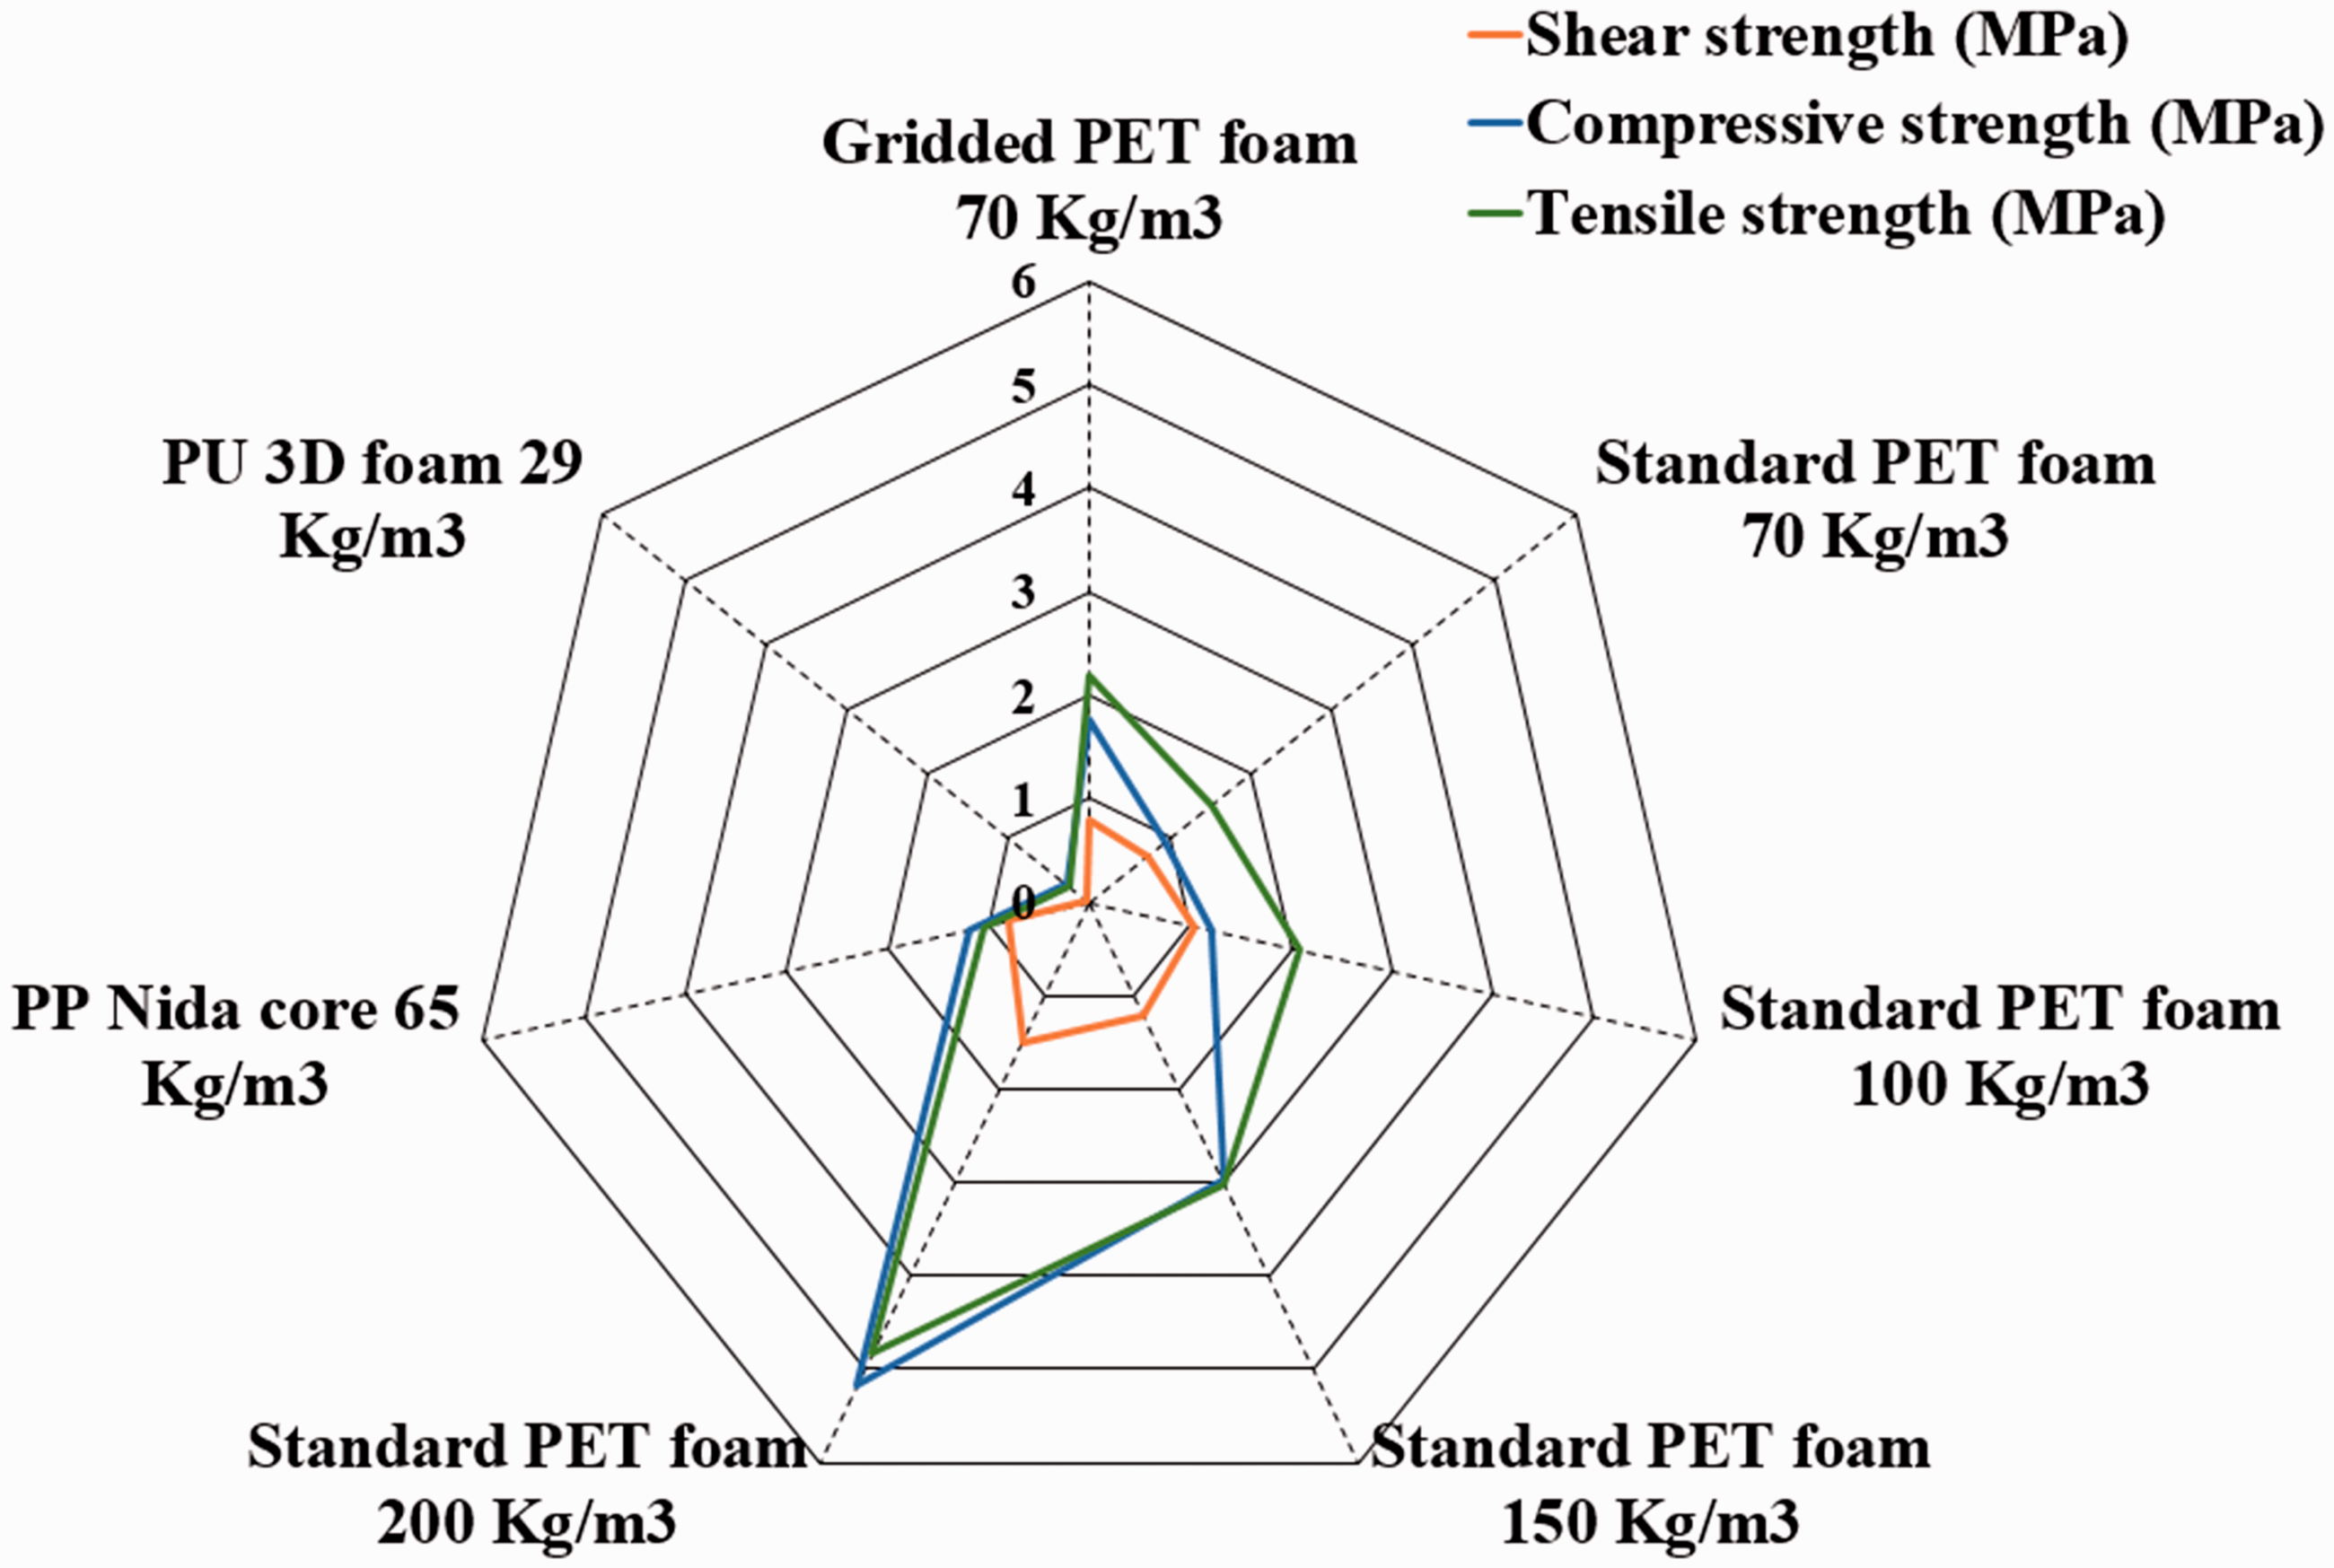
To continue with, the standard type of PET foams has many advantages as a sandwich core material. Compared to other candidate materials, it is easier to recycle, extremely resistant to variations in temperature, in addition to having excellent fatigue properties. Figure 3 presents a comparison of some mechanical characteristics of the various materials mentioned below, using a scale ranging from 1 to 6 in terms of shear, compressive and tensile relative strengths (MPa).
In order to carry out the manufacture of the sandwich structures by filament winding, a new process has been designed which mainly concerns thermoformable standard PET cores. As shown in Figure 4, the foam block is shaped by heating the material to its softening point and forcing it against the surface of a male or female mold. It takes shape easily since it is a pure thermoplastic material with closed cells. It can be adapted even to double curved surfaces for different thicknesses. This solution seems to be relevant for use in filament winding; however, it requires an important and very specific tooling.
Proposed design of the thermoforming process (Standard PET foams).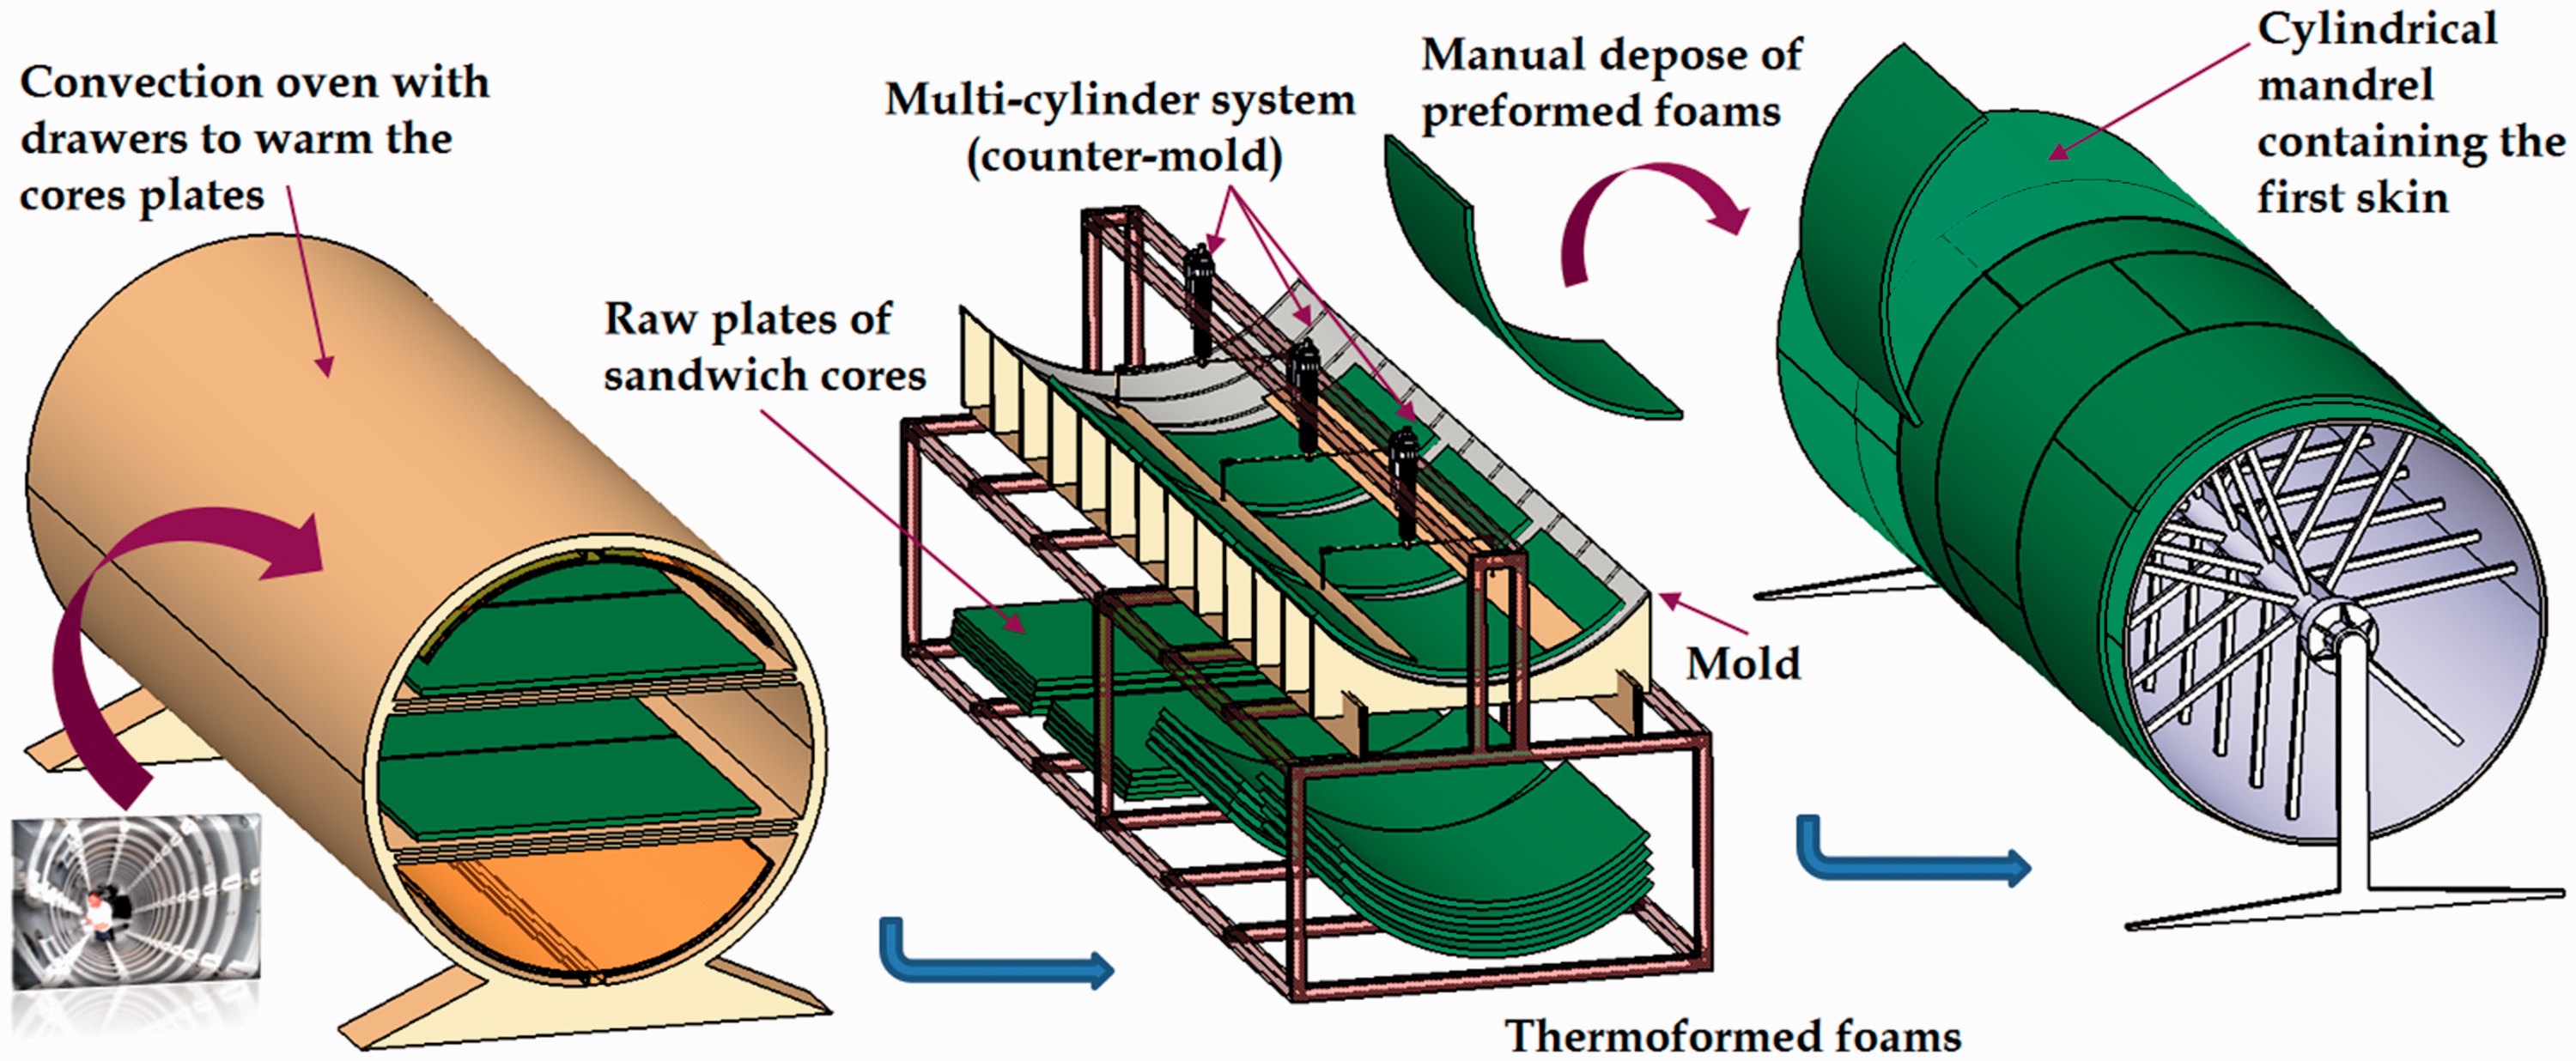
Since the sandwich structure is used most often for its lightness, an important characteristic is the mass per unit area. Given the thickness of each facing “ep” and the total thickness of the structure “h”, this mass can be written as follows
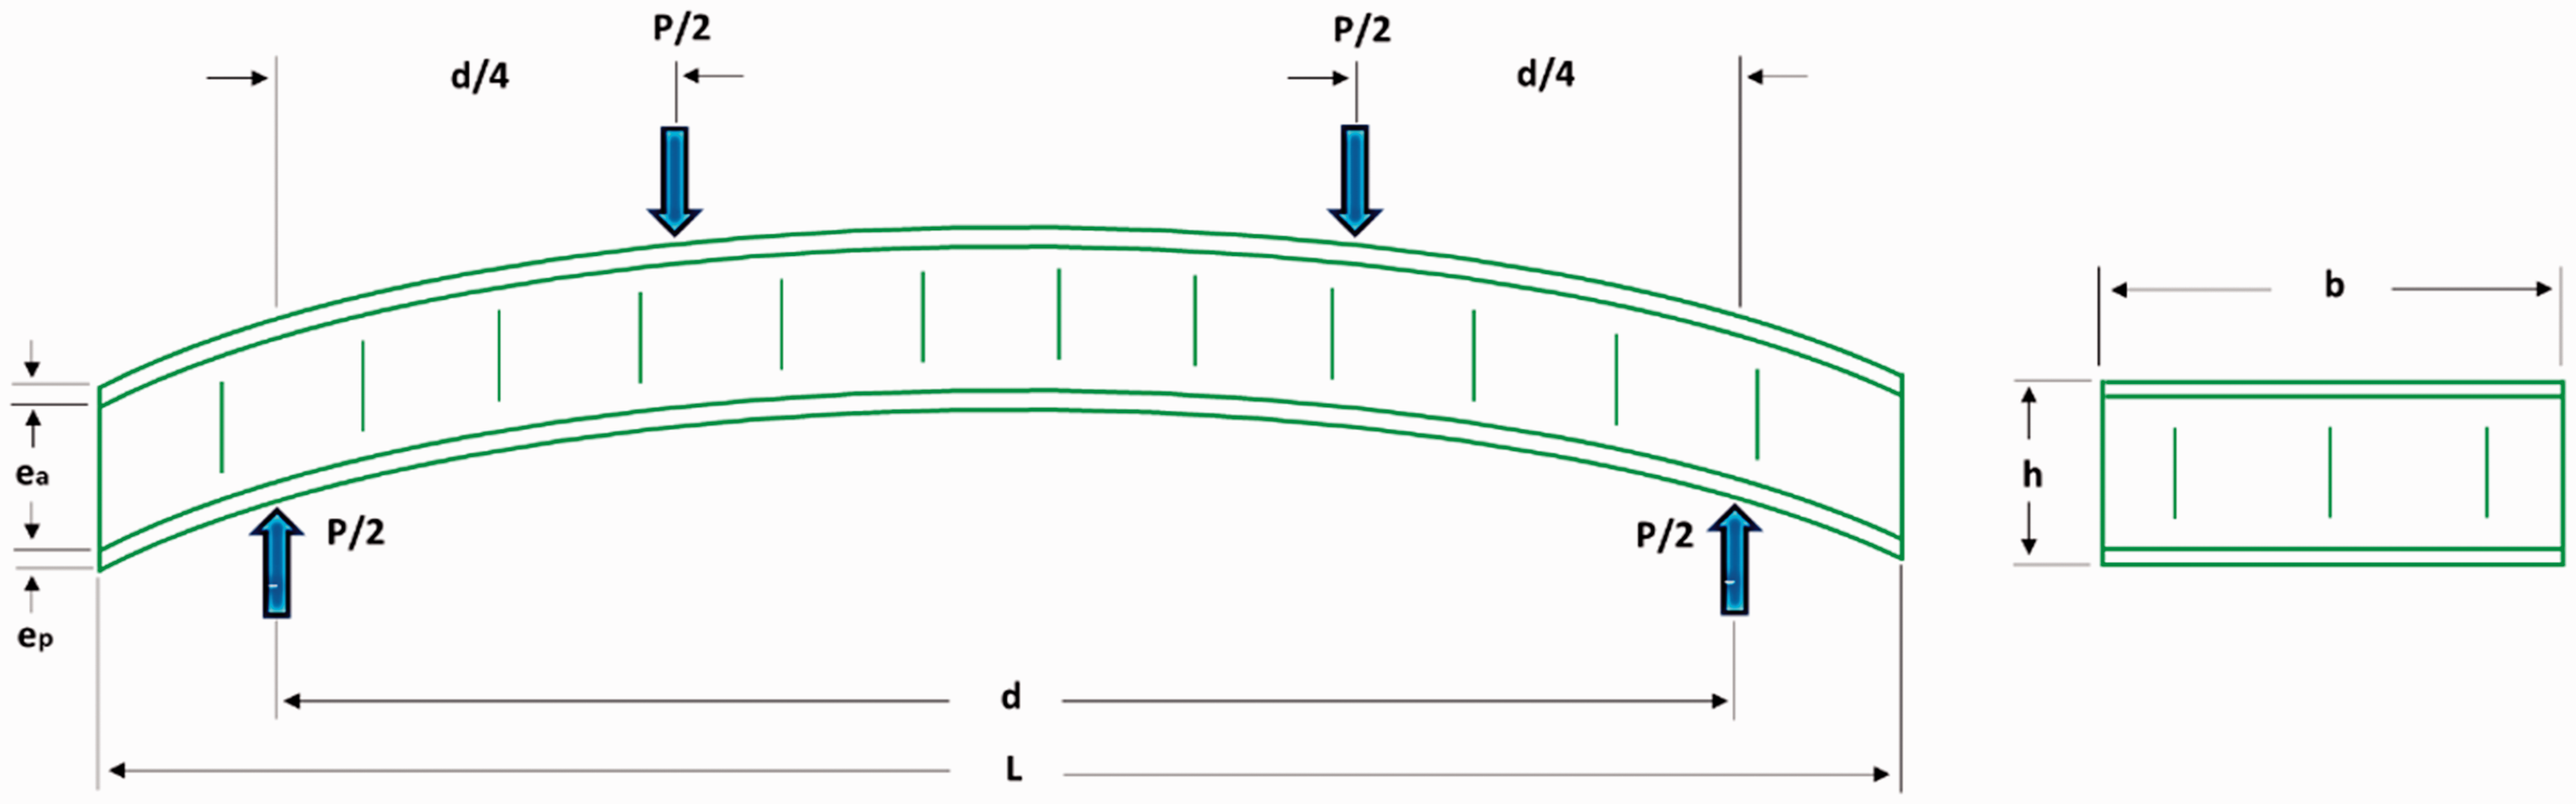
Schematic illustration of the bending test of sandwich structure with its characteristics.
Apparatus
Testing procedure
A first batch of curved specimens is fabricated from a tank to represent the intended real structure. They were subjected to three- and four-point bending test to determine their overall stiffness and that of the different constituents in flexion and transverse shear. These configurations have the advantage of making the appearance of certain zones in pure bending ideal for the characterization of the predominant damage mode. After structural studies carried out by the partners of this project, it was decided that the skins constituting the structure should have several unidirectional plies of glass fibers placed in the two directions 0° and 90°, with a total thickness of each skin ep ≈ 4 mm. The constituent core must have a thickness of 25 mm to form an overall thickness of the structure equal to 33 mm. It should be recalled that all specimens were manufactured on a cylindrical mandrel with a curvature radius of 750 mm (Figure 1) as recommended by the industrial specification. To begin with, different types of sandwich core with variable densities between 29 and 200 kg/m3 were used and chosen for their drapeability and their adaptability with our manufacturing method. In accordance with the standard, 17 the length “L” of tested samples is 400 mm for a width “b” of 50 mm (Figure 5).
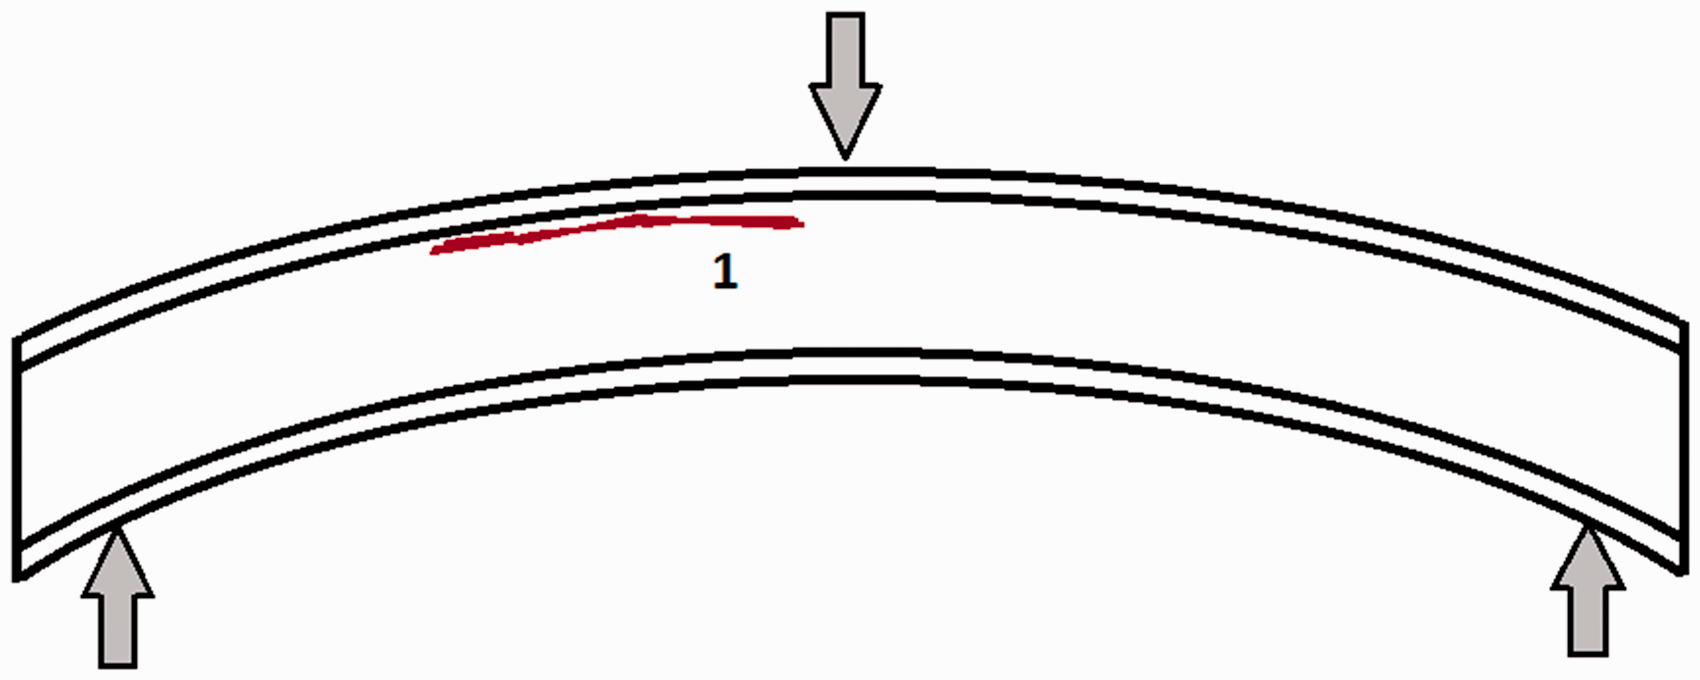
According to ASTM standards,17–19 each type of sandwich specimens was cut into required dimensions and tested for its quasi-static flexural properties by three and four-point bending test, on a properly calibrated testing machine from Zwick-Roell equipped with a 100 kN force sensor. The test was operated in a displacement control mode with a constant crosshead speed of 5 mm/min, while the load output was recorded using a built-in load cell in the testing machine. The loading pins and the supports had a diameter of 25 mm. To enrich our study, we highlight the correlations between acoustic signatures delivered by the two sensors placed on the specimens during mechanical testing (Figure 6), and the nature of the damage observed at the macrostructural scale and eventually the critical damage thresholds.
Sandwich specimen in experimental bending test with acoustic emission sensors (1) and (2).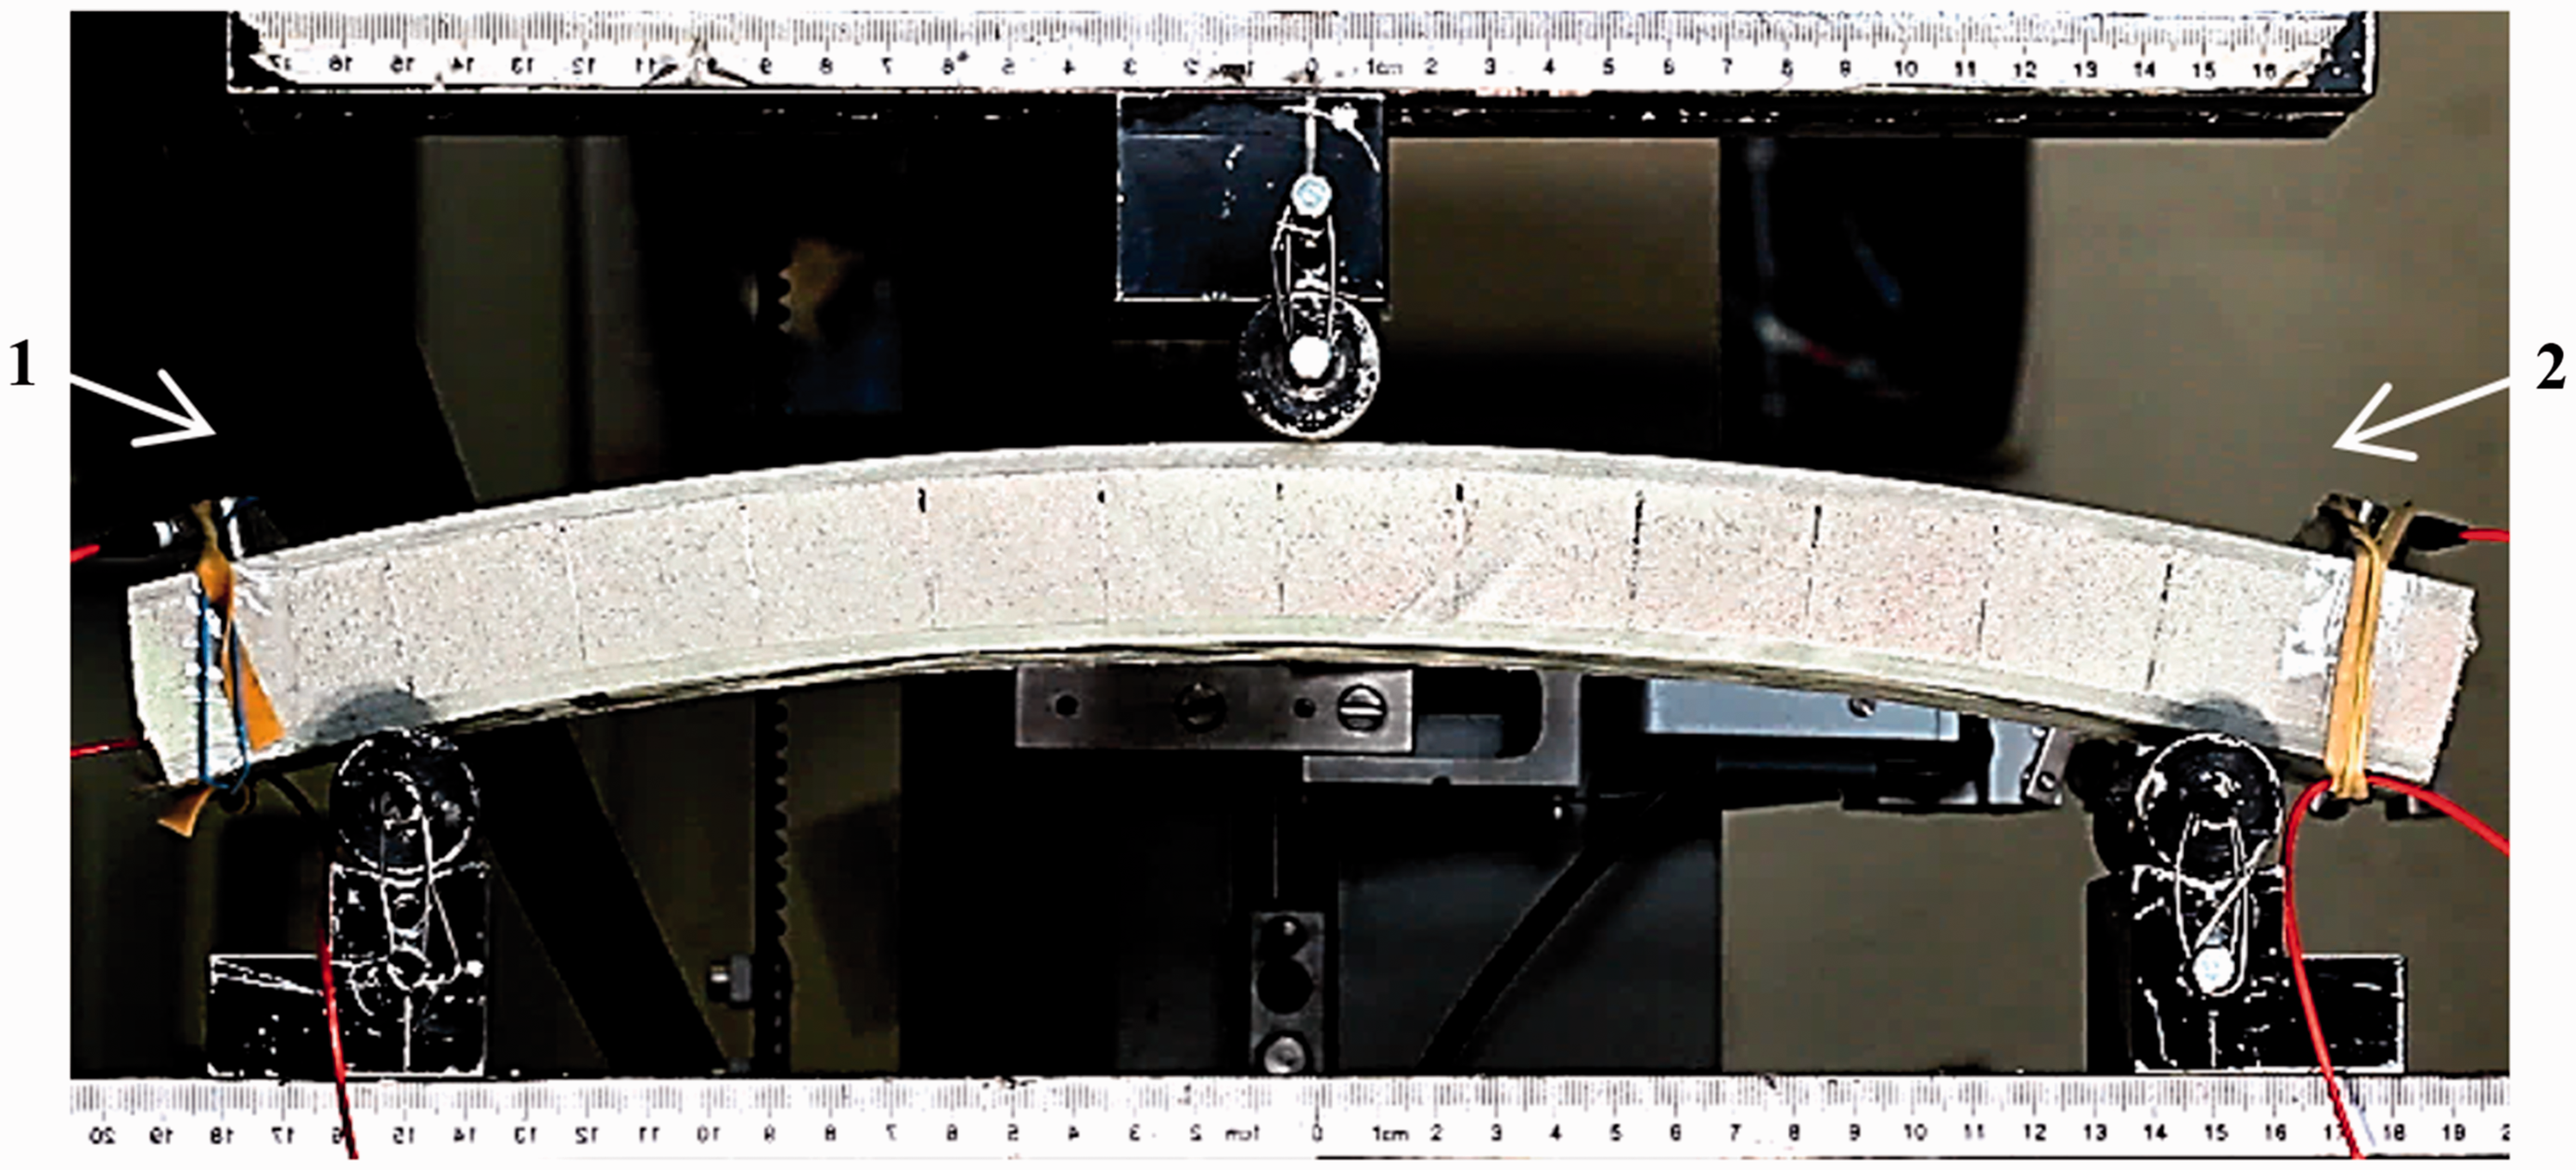
AE equipment
The Acoustic Emission software AEwin™ from MISTRAS GROUP and a real-time data acquisition system were used for recording AE events. AE measurements are achieved by two piezoelectric sensors with a frequency range of 100 kHz–1 MHz. The surface of each sensor was covered with grease in order to provide good acoustic coupling between the specimen and the sensor. The gain selector of each pre-amplifier was set to 50 dB (Figure 7). The amplitude of AE signals covers the range at 0–100 dB.
Device of control and characterization of material damage: Acoustic Emission.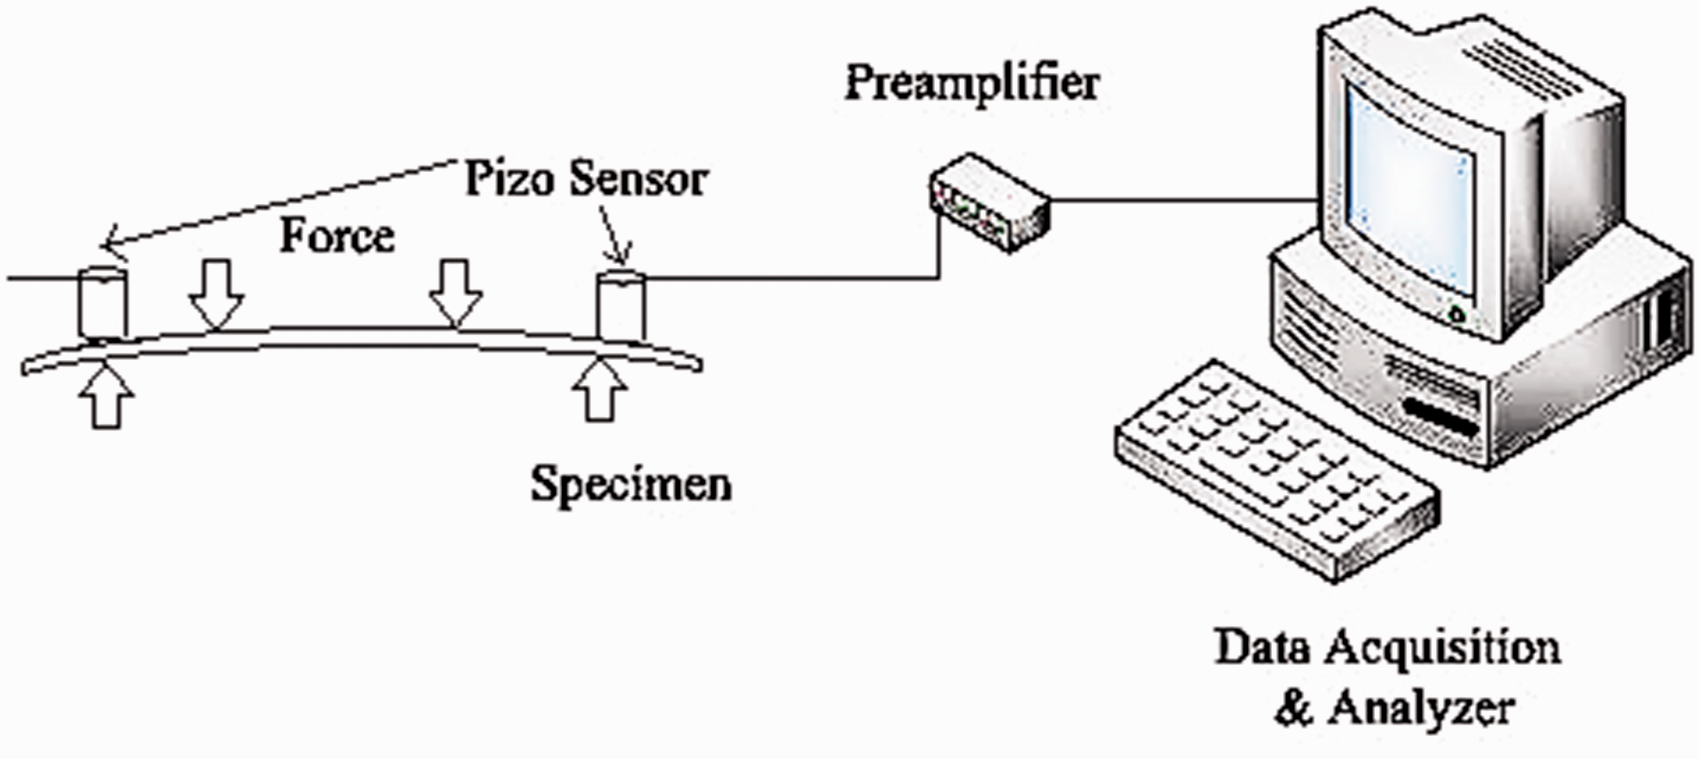
Figure 8 shows a typical AE signal and the parameters commonly used for analysis. These are explained below:
Threshold (in dB): the threshold voltage level is generally set to distinguish signal from noise. An AE event or a part of it is counted only if the signal crosses the threshold level. Duration: is the time difference between the beginning of an event (marked when the signal crosses the threshold) and the end (marked when it falls below the threshold). Peak amplitude: highest amplitude attained by signal in an event which covers the range of 0–100 dB. Counts: the number of times the signal crosses the threshold between the peak amplitude and the threshold. Rise time: time taken for signal to reach peak amplitude from the time it first crossed the threshold. Energy: the area under time versus amplitude squared curve for an event. Defect location: when more than one sensor is used, the AE source can be located and so will be the defective area. Location is based on the wave propagation principles within the materials and is effectuated by measuring the signal's arrival time to each sensor.
Common waveform parameters calculated by the acquisition system for each AE event.
As shown in Figure 8, numerous parameters are calculated by the acquisition system for each AE event: amplitude, duration, rise time, counts, etc. Only the amplitude of the signal is measured in real time by the data acquisition system. All the other parameters are calculated from the waveforms and they are dependent on the amplitude threshold. Preliminary to damage check, the data acquisition system must be calibrated for each kind of specimens, according to a pencil lead break procedure (this procedure is explained in Shindo et al.
20
). Then, a repeatable acoustic wave is generated in the specimen by a lead breakage on its surface. At the same time, velocity and attenuation of the AE waves are measured. For that, the lead breakage operation was repeated several times and at different locations between the sensors. After the calibration step, AE signals are captured during mechanical testing. Signal descriptors such as amplitude, duration, rise time, counts, and defect location are then calculated by the AE software.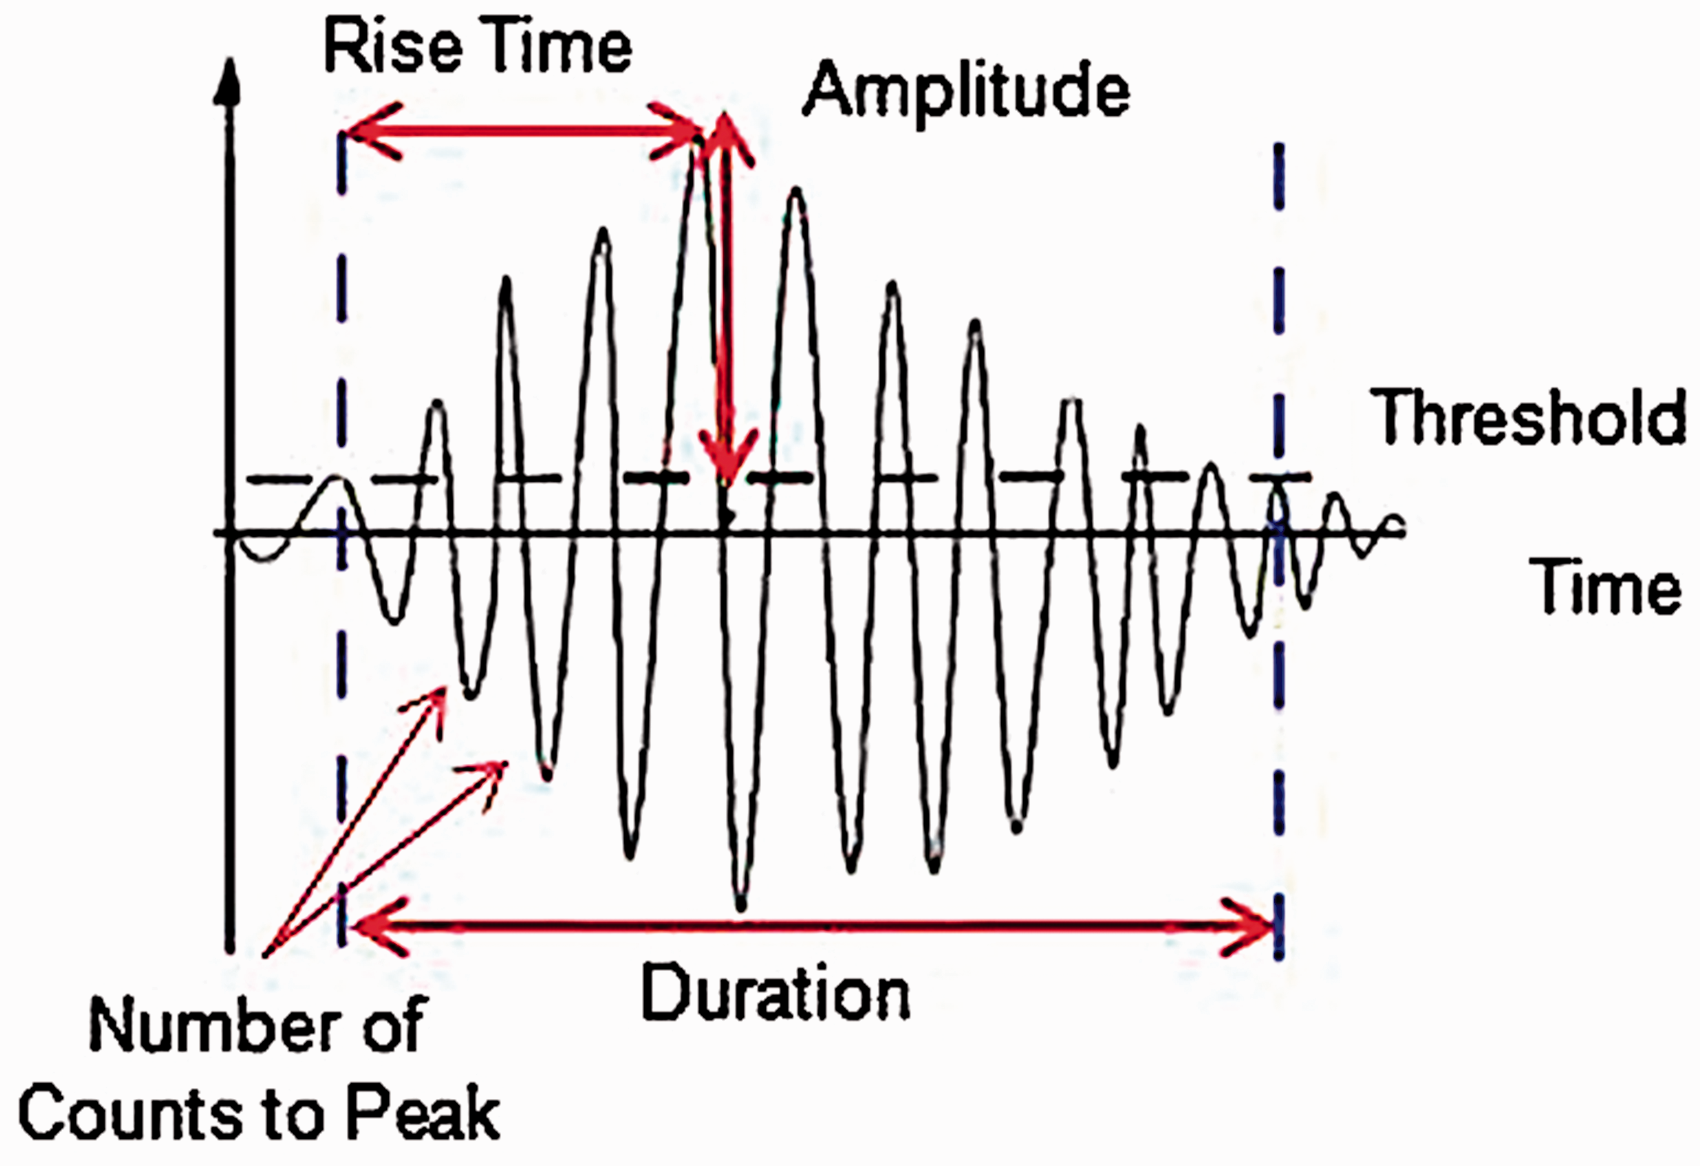
Results and discussions
Mechanical behavior
The main idea is to establish the mechanical flexural behavior and discriminate, in real time, the different types of damage and failure in the composite to understand the involved mechanisms that lead to the ruin of the structure.21,22 At the beginning of the test campaign, the response of the Zwick-Roell machine displacement sensor was compared with response acquired from LVDT sensor (see Figure 9(a) and (b)) to verify the possibility of using this method of measurement often unreliable in the case of assembly with low compliance.
Equipment used for the acquisition of the comparison results between sensors: (a) LVDT and (b) machine sensor.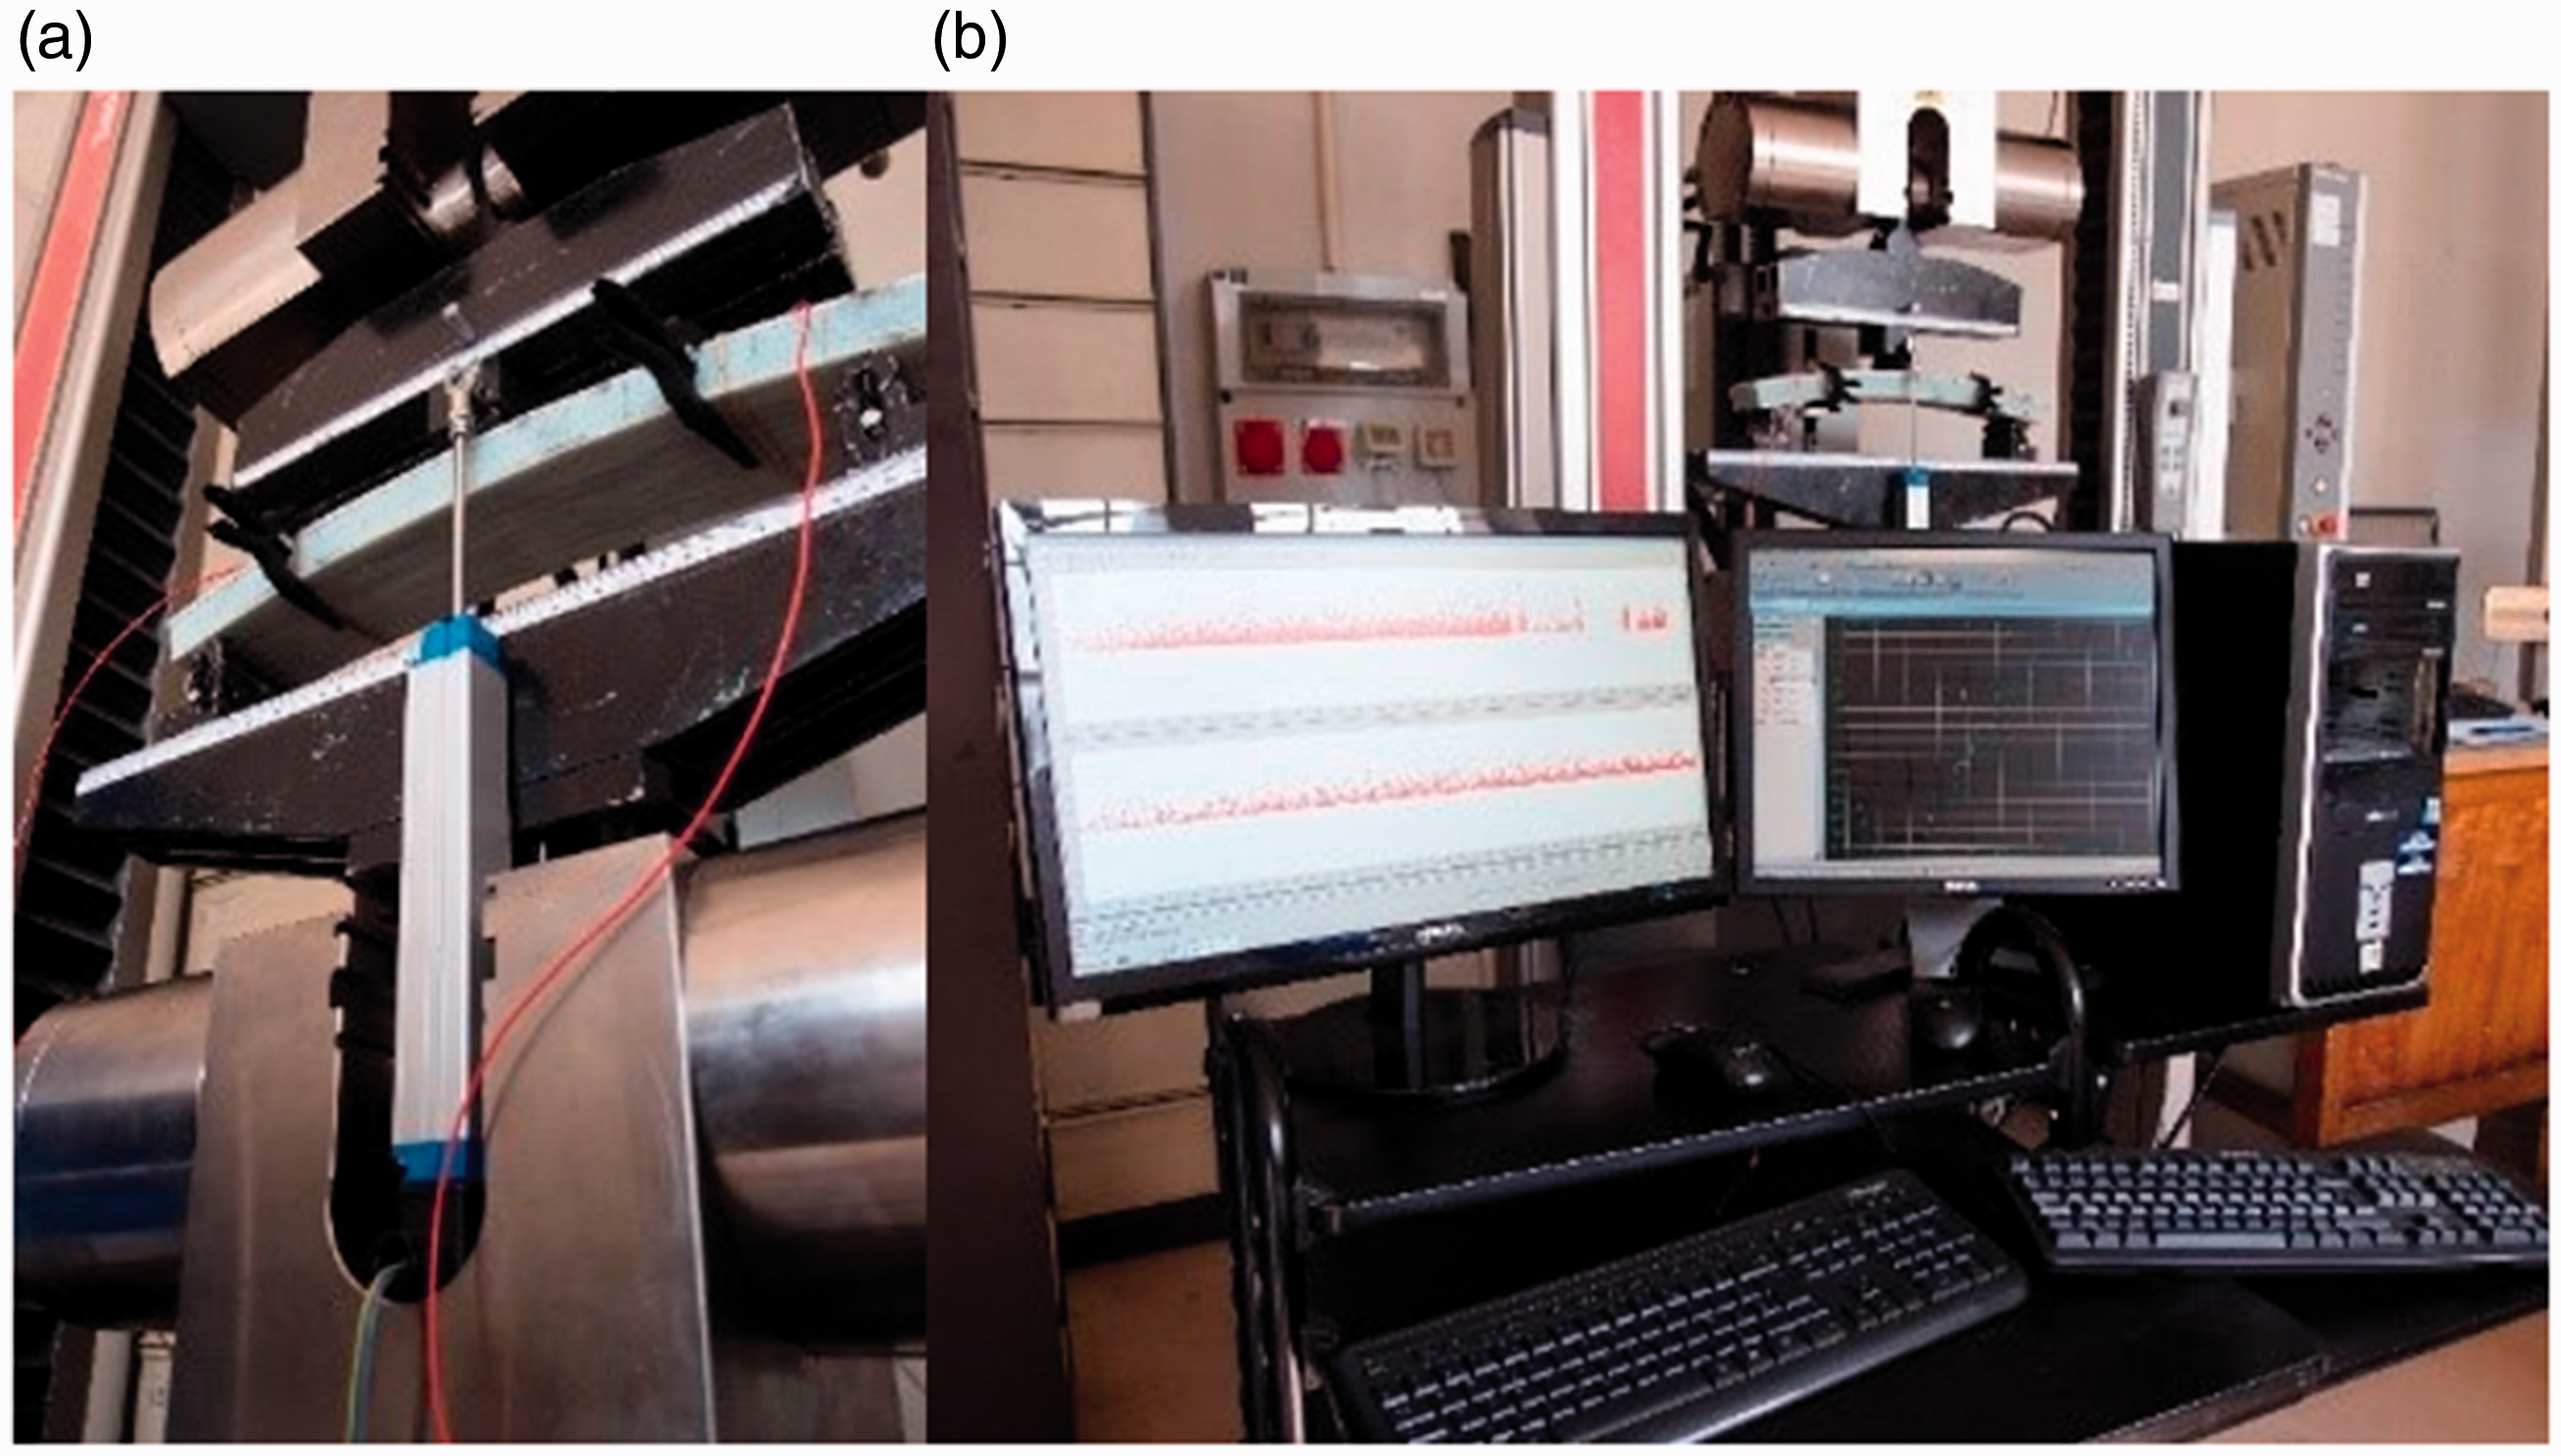
As a conclusion from Figure 10, there is a good correlation with ∼2% of difference between slopes of the two curves, and therefore, the sensor following the displacement of the machine can be used in the bending tests of sandwich composites.
Comparison between the machine displacement sensor and LVDT sensor.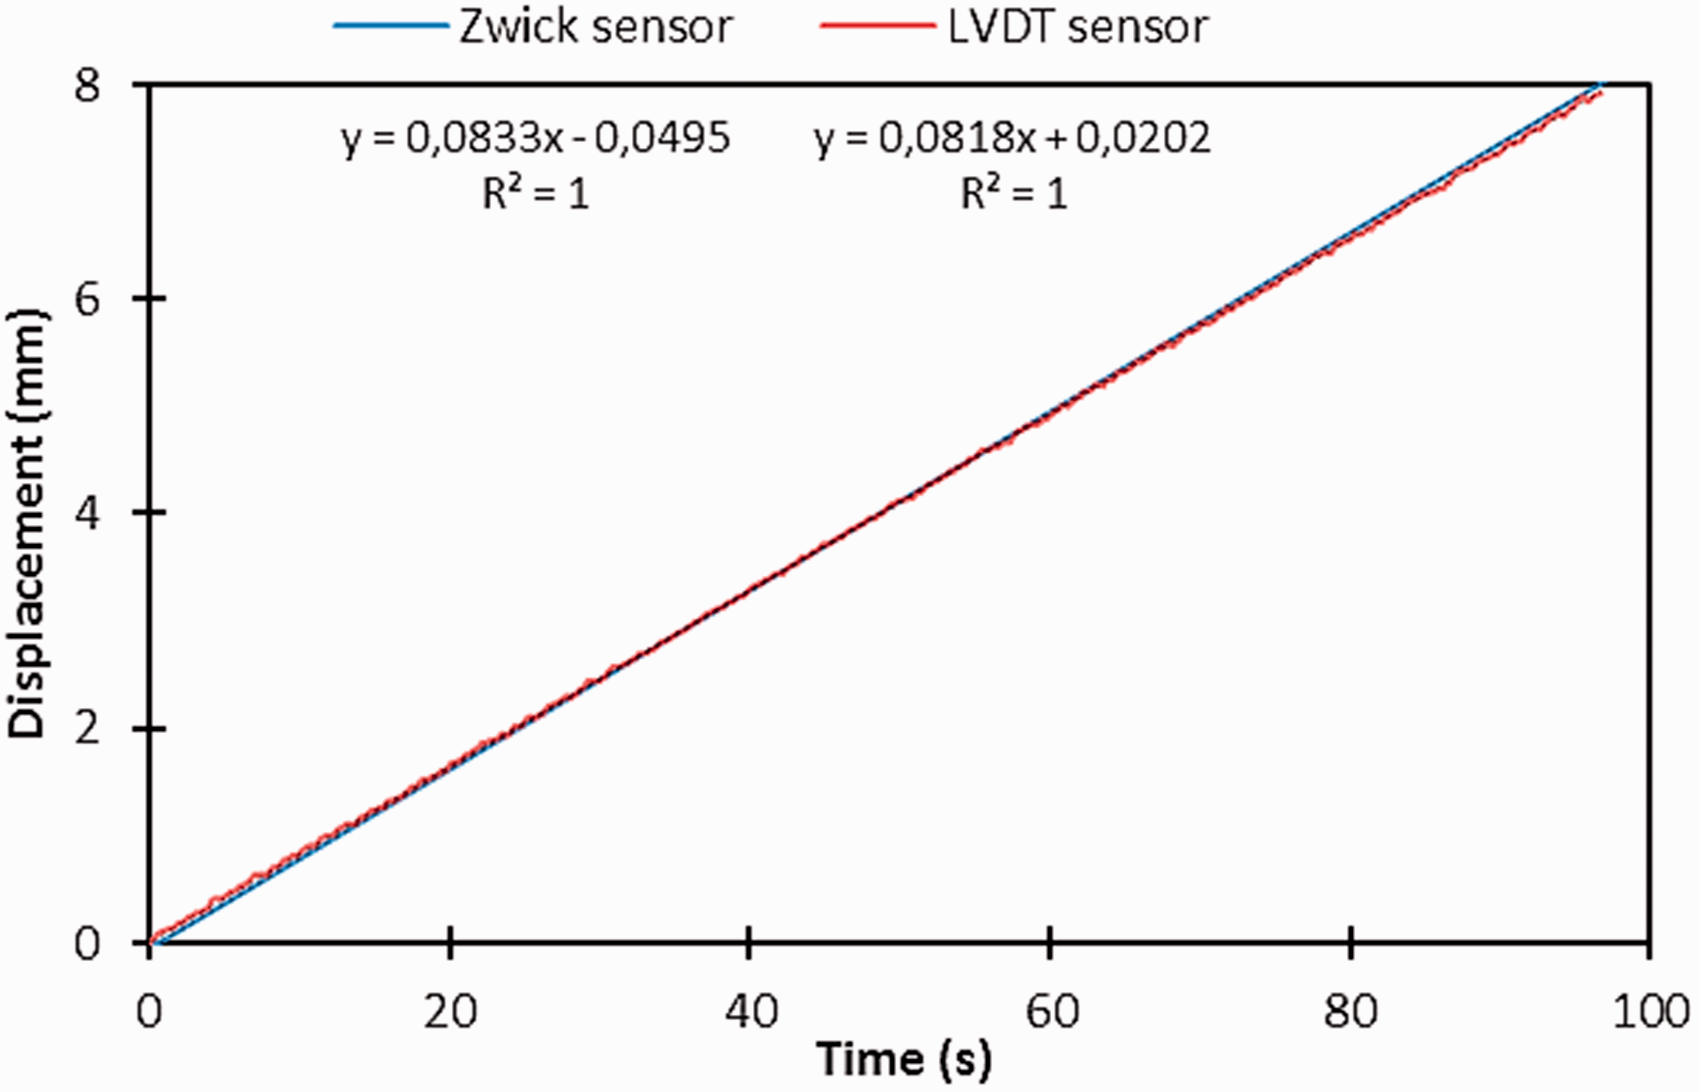
To properly compare the bending test results of the studied sandwich materials, the different curves have been normalized to their peak loads (Figure 11(a) and (b)). Total deflection W (mm) of all sandwich specimens is 30 mm in the case of three-point bending and 24 mm for the four-point bending. Thus, we observe evolutions of bending stress–strain relationships for the different types of sandwich structures presented in Table 1. The specimens were subject to three-point and four-point bending in order to observe the evolution of the stiffness of each material in accordance with the recommendations of the standards by Mathews and Swanson
17
and Kalarikkal et al.
23
Quasi-static flexural test results in 3 and 4-point bending: (a) and (b): normalized stress–strain relationship for specimens described above.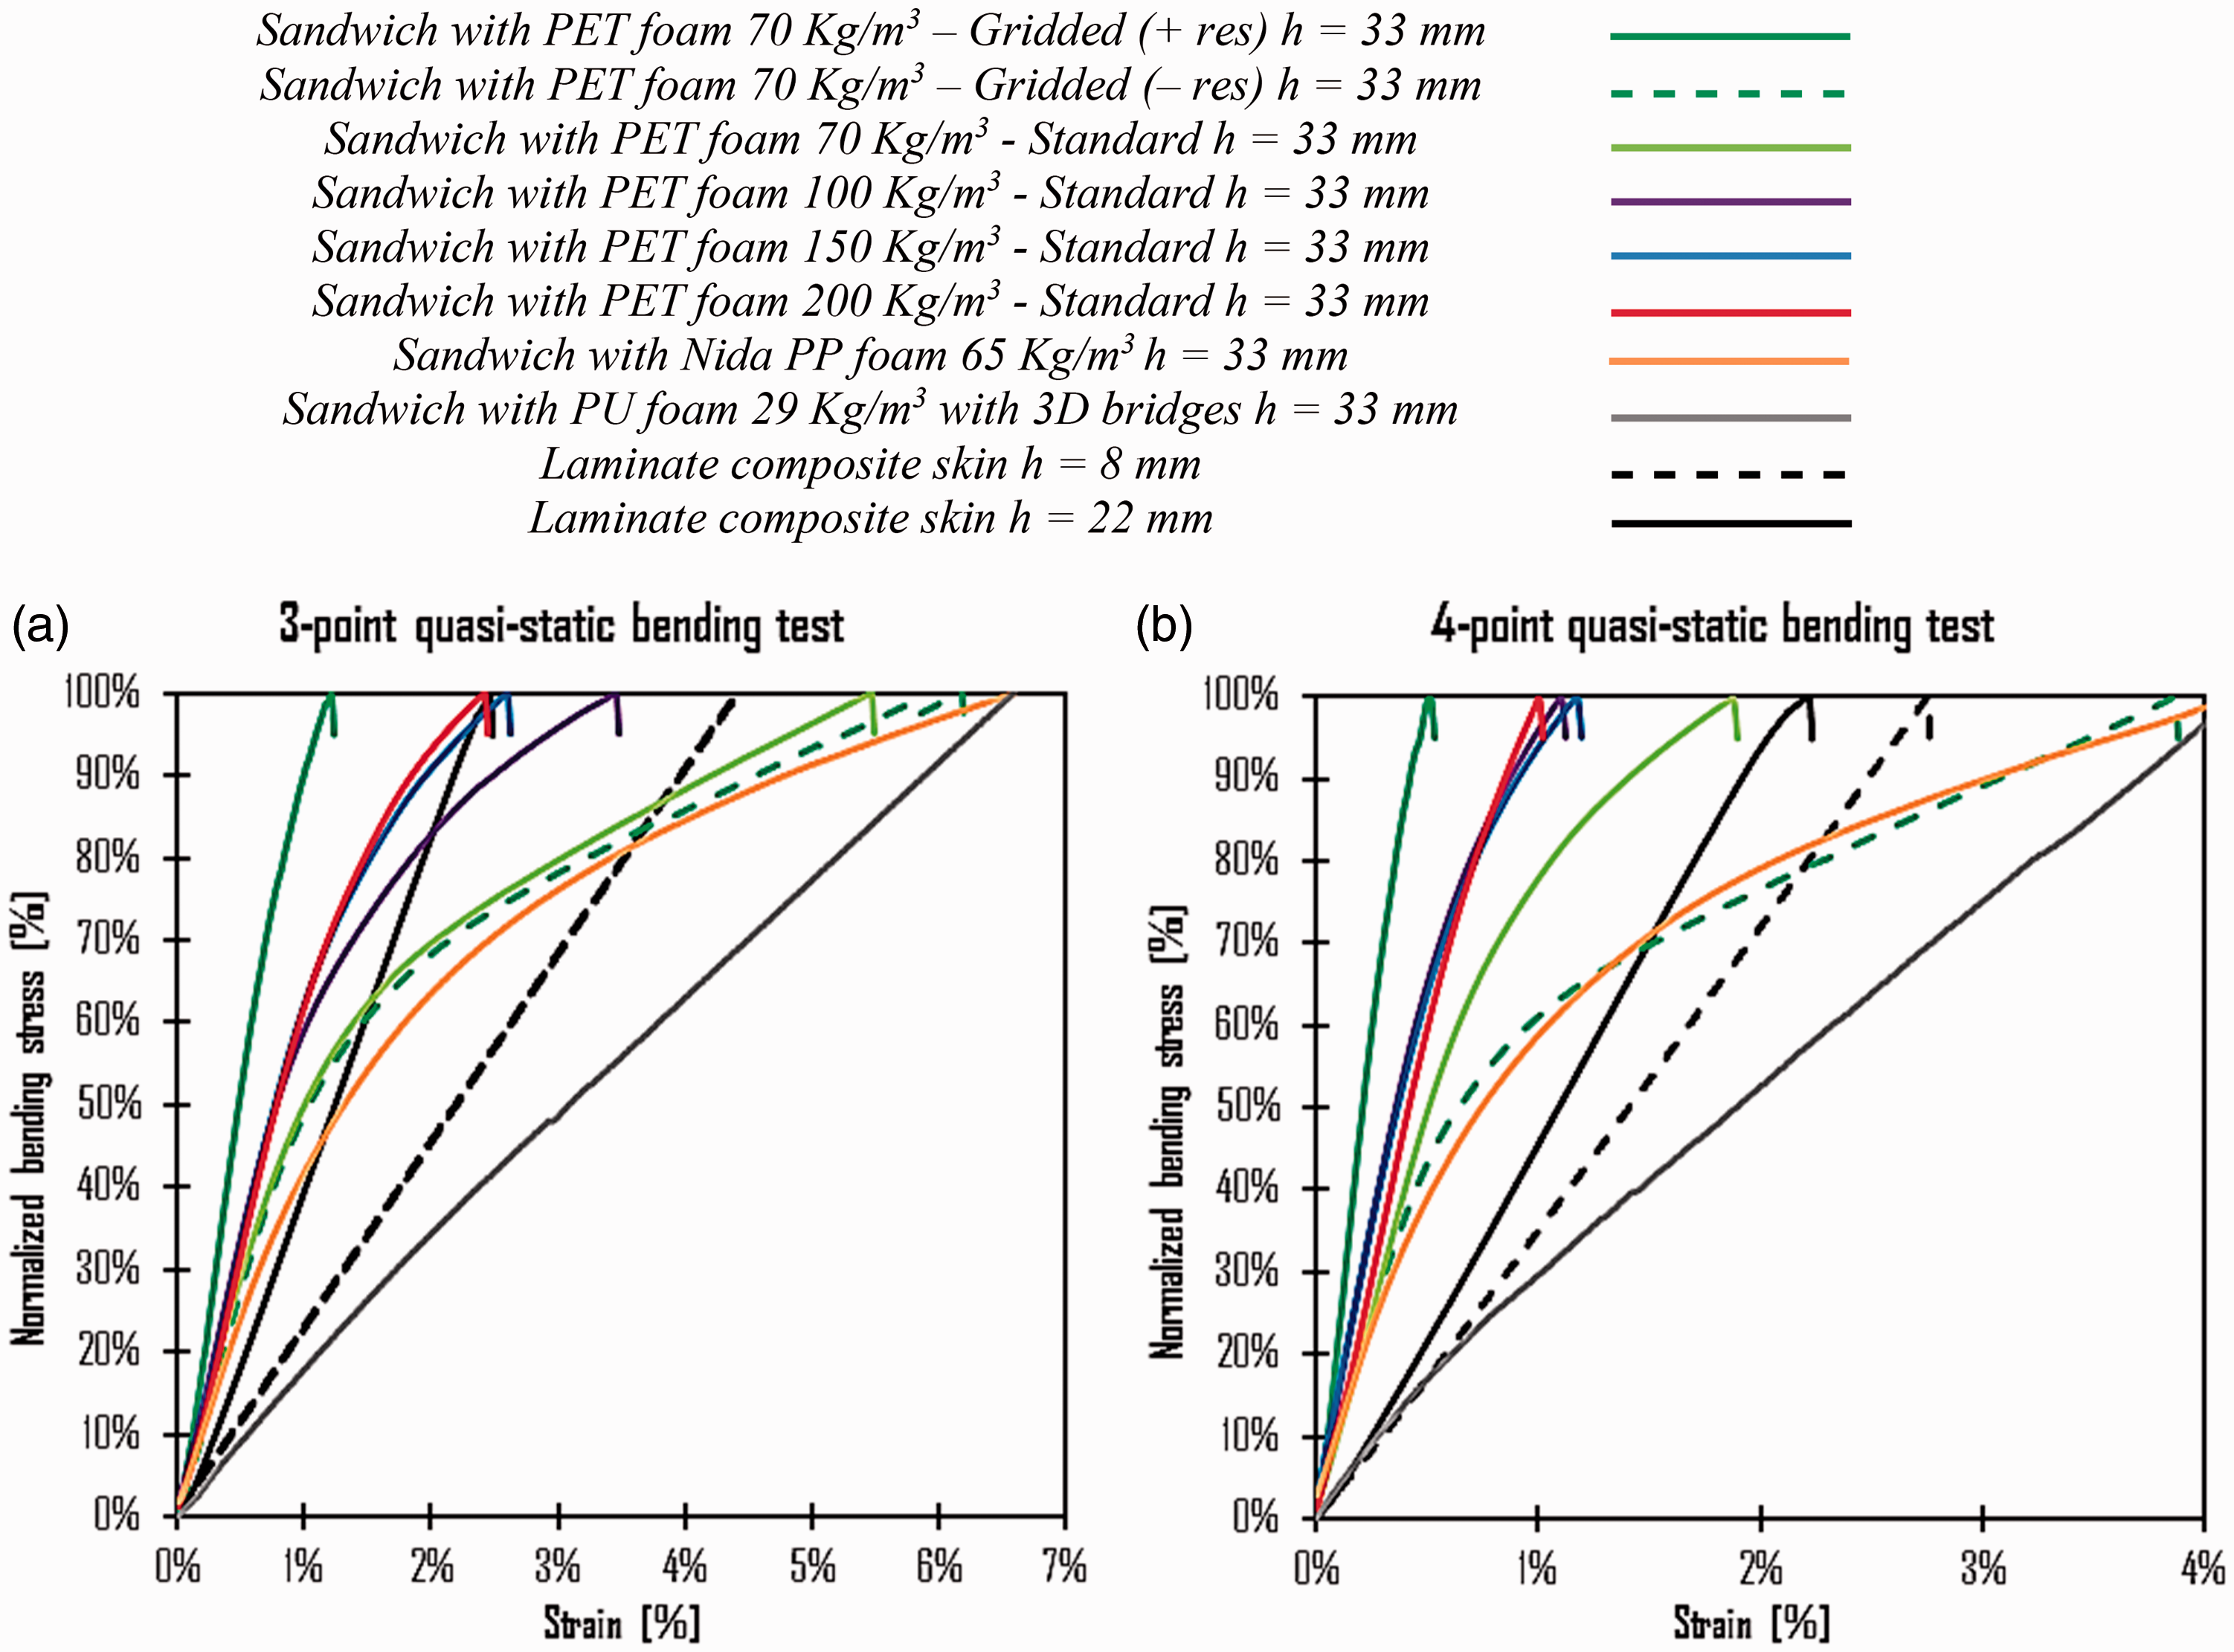
Mechanical characteristics obtained in flexural static tests.
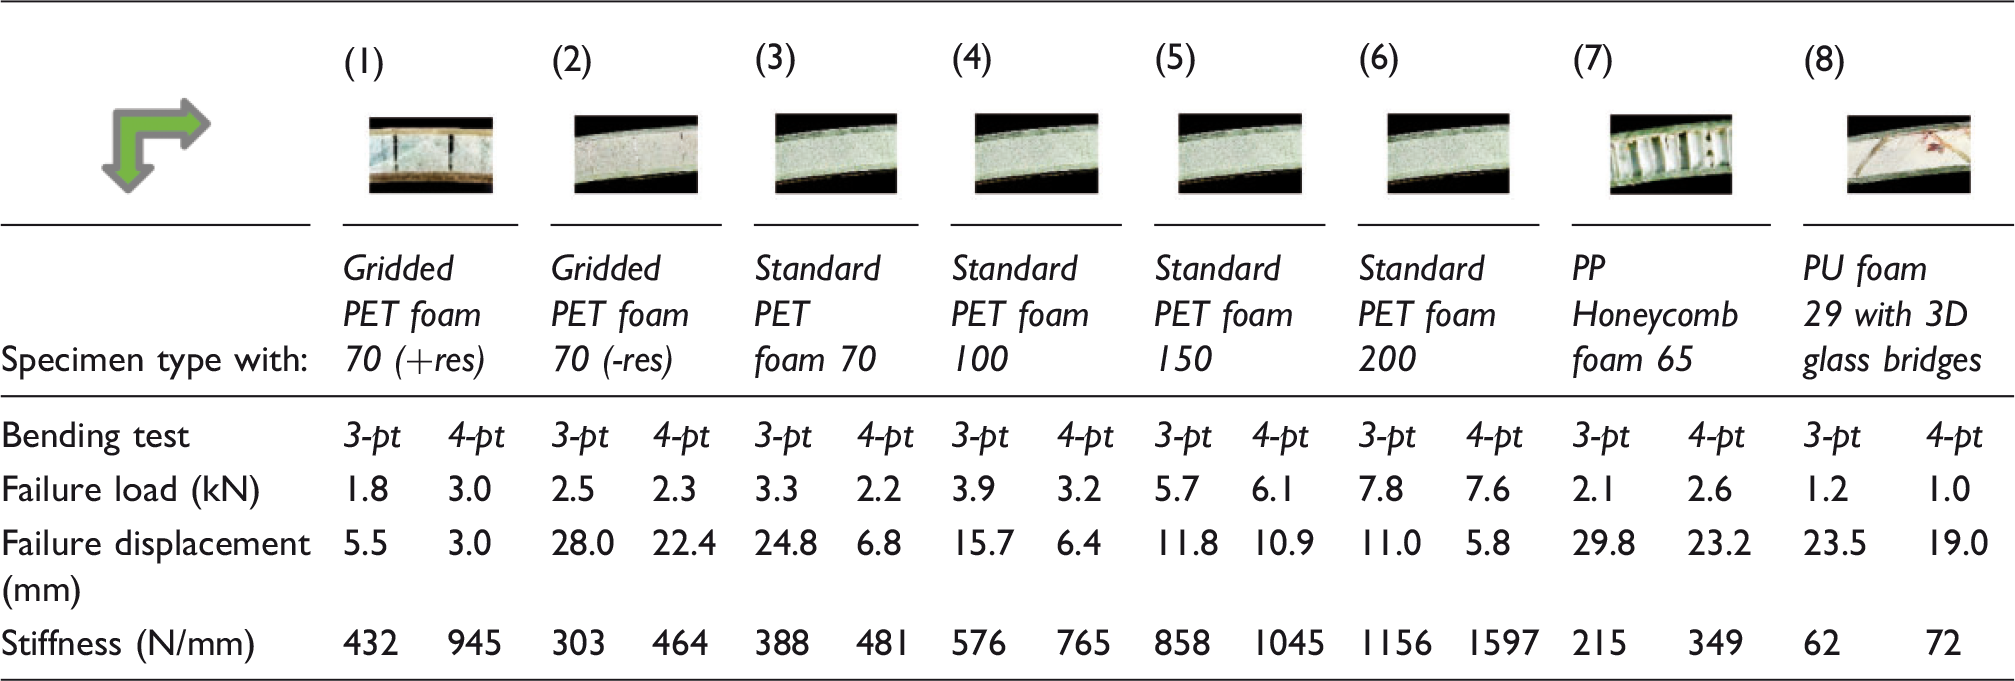

So, compared to those with gridded PET foam type with a high presence of resin, the stiffness of the specimens with less resin into grids represents a decrease of 29% in three-point bending test, while an important decrease of 50% was observed in four-pt bending. The damage initiation begins near areas where there is a strong presence of resin. Also, the crack of the material is a consequence of that, as described in Figure 20.
Theoretical and experimental evaluation of the flexural response
Flexural stiffness and lightweight mass are the main reasons for the use of sandwich structures. However, pure bending stiffness is often not sufficient to quantify the performance of a structure since this solicitation never intervenes alone. Behavior in in-plane tension, out-of-plane compression, or transverse shear must not be neglected. In this section, we aim to express the characteristic properties of rigidity of the sandwich structure as a function of the material properties of the facings and the core. Two categories of properties are used depending on the context: the equivalent properties of the material and the macroscopic specimen properties. They are substitutable and easily deduced from each other considering the thickness of the structure. The equivalent properties of the material will tend more easily to the comparison and the selection of the materials. The properties of the specimen are more suitable for structural calculations.
Concerning our current experimental study, the ASTM test standard D725017 was used. Considering that equations (2) and (3) form a system of two equations with two unknown parameters, it is possible to use the results obtained by the three- and four-point bending test to solve this system. Thus, the equivalent rigidities are given below:
The flexural stiffness of the Sandwich structure (N.mm2) is given by
17

The transverse shear rigidity of the sandwich structure (N) is given by
17

The core shear modulus (MPa) can be deduced by
17

On the other hand, and as explained at the beginning of this article, the theory of sandwich plates makes it possible to connect the characteristics of the constituents with the flexural rigidity. According to Lhuissier and Laszczyk,
24
we can determine the flexural stiffness D and the transverse shear stiffness N of flat sandwich structures, while the shear modulus Ga is given by the technical datasheets of the studied foams. Analytically, the transverse shear stiffness (N) can be written as

The first-order shear theory has been used to predict the flexural response of the sandwich structures assuming elastic linear response of all the constituents as well as full coupling constraints between the skin and the core. Using the measured elastic properties of each tested material, the expected failure mode could be specified as follow25–28: compressive/tensile failure of the skin, shear failure of the core and compressive/ tensile failure of the core.
The in-plane failure (tension/compression) of the skin occurs when the applied load reached the ultimate strength of the skin material.
29
It is expected that the failure of the sandwich structures will occur due to compressive failure of the top skin since the skins have higher tensile strength than the compressive strength. The failure of the sandwich specimen due to compressive failure of the skin is calculated by equating the moments within the sandwich specimen to the applied external bending moment. This gives a relation
30


The ultimate shear strength of the sandwich structure could be estimated since the shear stress is maximum at the centroidal axis and zero at the top and bottom surfaces. The shear stress τ (MPa) in a specimen can be determined using this relation
31


Therefore, the peak load, Pa (N), for this kind of failure could be expressed by equation (11).
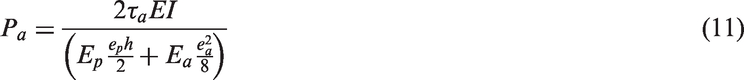
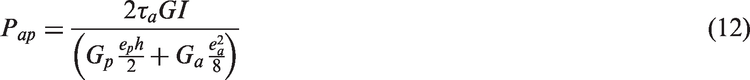
It is noteworthy that the ratio of the core/skin elastic modulus is much higher than the ratio of the core/skin shear modulus. Therefore, the transformed area of the sandwich cross section into an equivalent skin will be bigger than the transformed area using the ratio of the shear modulus. Thus, using the shear moduli ratio might better predict the shear capacity of the composite sandwich panels. The peak strength Pap (N) for composite sandwich structures is predicted using equation (12). In this equation, GI is calculated similarly as equation (8) with the modulus of elasticity of the skin and the core replaced with its corresponding shear modulus.
The core material will fail if the normal stress in tension and/or compression exceeds the ultimate strength. The peak strength Pas (N) for this failure mode can be predicted by equations (13) and (14).


The classical shear theory
32
was used to determine the load–deflection behavior of the composite sandwich structures, in which the total deflection is the sum of the bending and shear deflections. The relatively low shear stiffness of the core compared to that of the skin results in a significant shear deformation that should be accounted for in the total deflection of sandwich structures.
33
Thus, the total deflection of the composite sandwich panels can be written as

For a simply supported beam under four-point static bending with an applied load P and shear span a, the deflection at the mid-span of the beam due to unit and actual bending moments can be calculated by integrating the deflection from the support to the loading point (0 < x < a) and from the loading point to the mid-span (a < x < d/2). This relation can be written as

Simplifying equation (16) leads to equation (17)

By resolving this equation, it becomes

For a simply supported beam, the shear displacement diagram is the same as the bending moment diagram, with a factor k/AG applied to it, with AG often referred to as the shear stiffness of the sandwich beams
34
and k is the shear correction factor.
32
The maximum bending moment occurs at the mid-span of the beam. Consequently, the shear deformation at this location can be calculated as

For the specimen, a = d/3 while the shear correction factor k = 1.0 is assumed in the analysis. The total deflection at the mid-span for the specimen can then be obtained by combining the equations (18) and (19).
This results in equation (20)

The maximum elastic stress for each sandwich structure is given experimentally by the last value of the linear part of each curve, just before the beginning of initial damage. The experimental values corresponding to the detected elastic limit were then introduced into the numerical model and the value of the corresponding stress was deduced, taking into account the geometrical characteristics (curved form) of our test specimens. In parallel, another numerical model was also made with a plane structure in order to be able to compare the results of the two configurations and to deduce thereafter the effect of the curvature of the structures on the mechanical behavior of the studied sandwiches and to highlight the originality of the study carried out in this article. A comparison in terms of relative percentage has been incorporated into the curves to give relative and quantitative results.
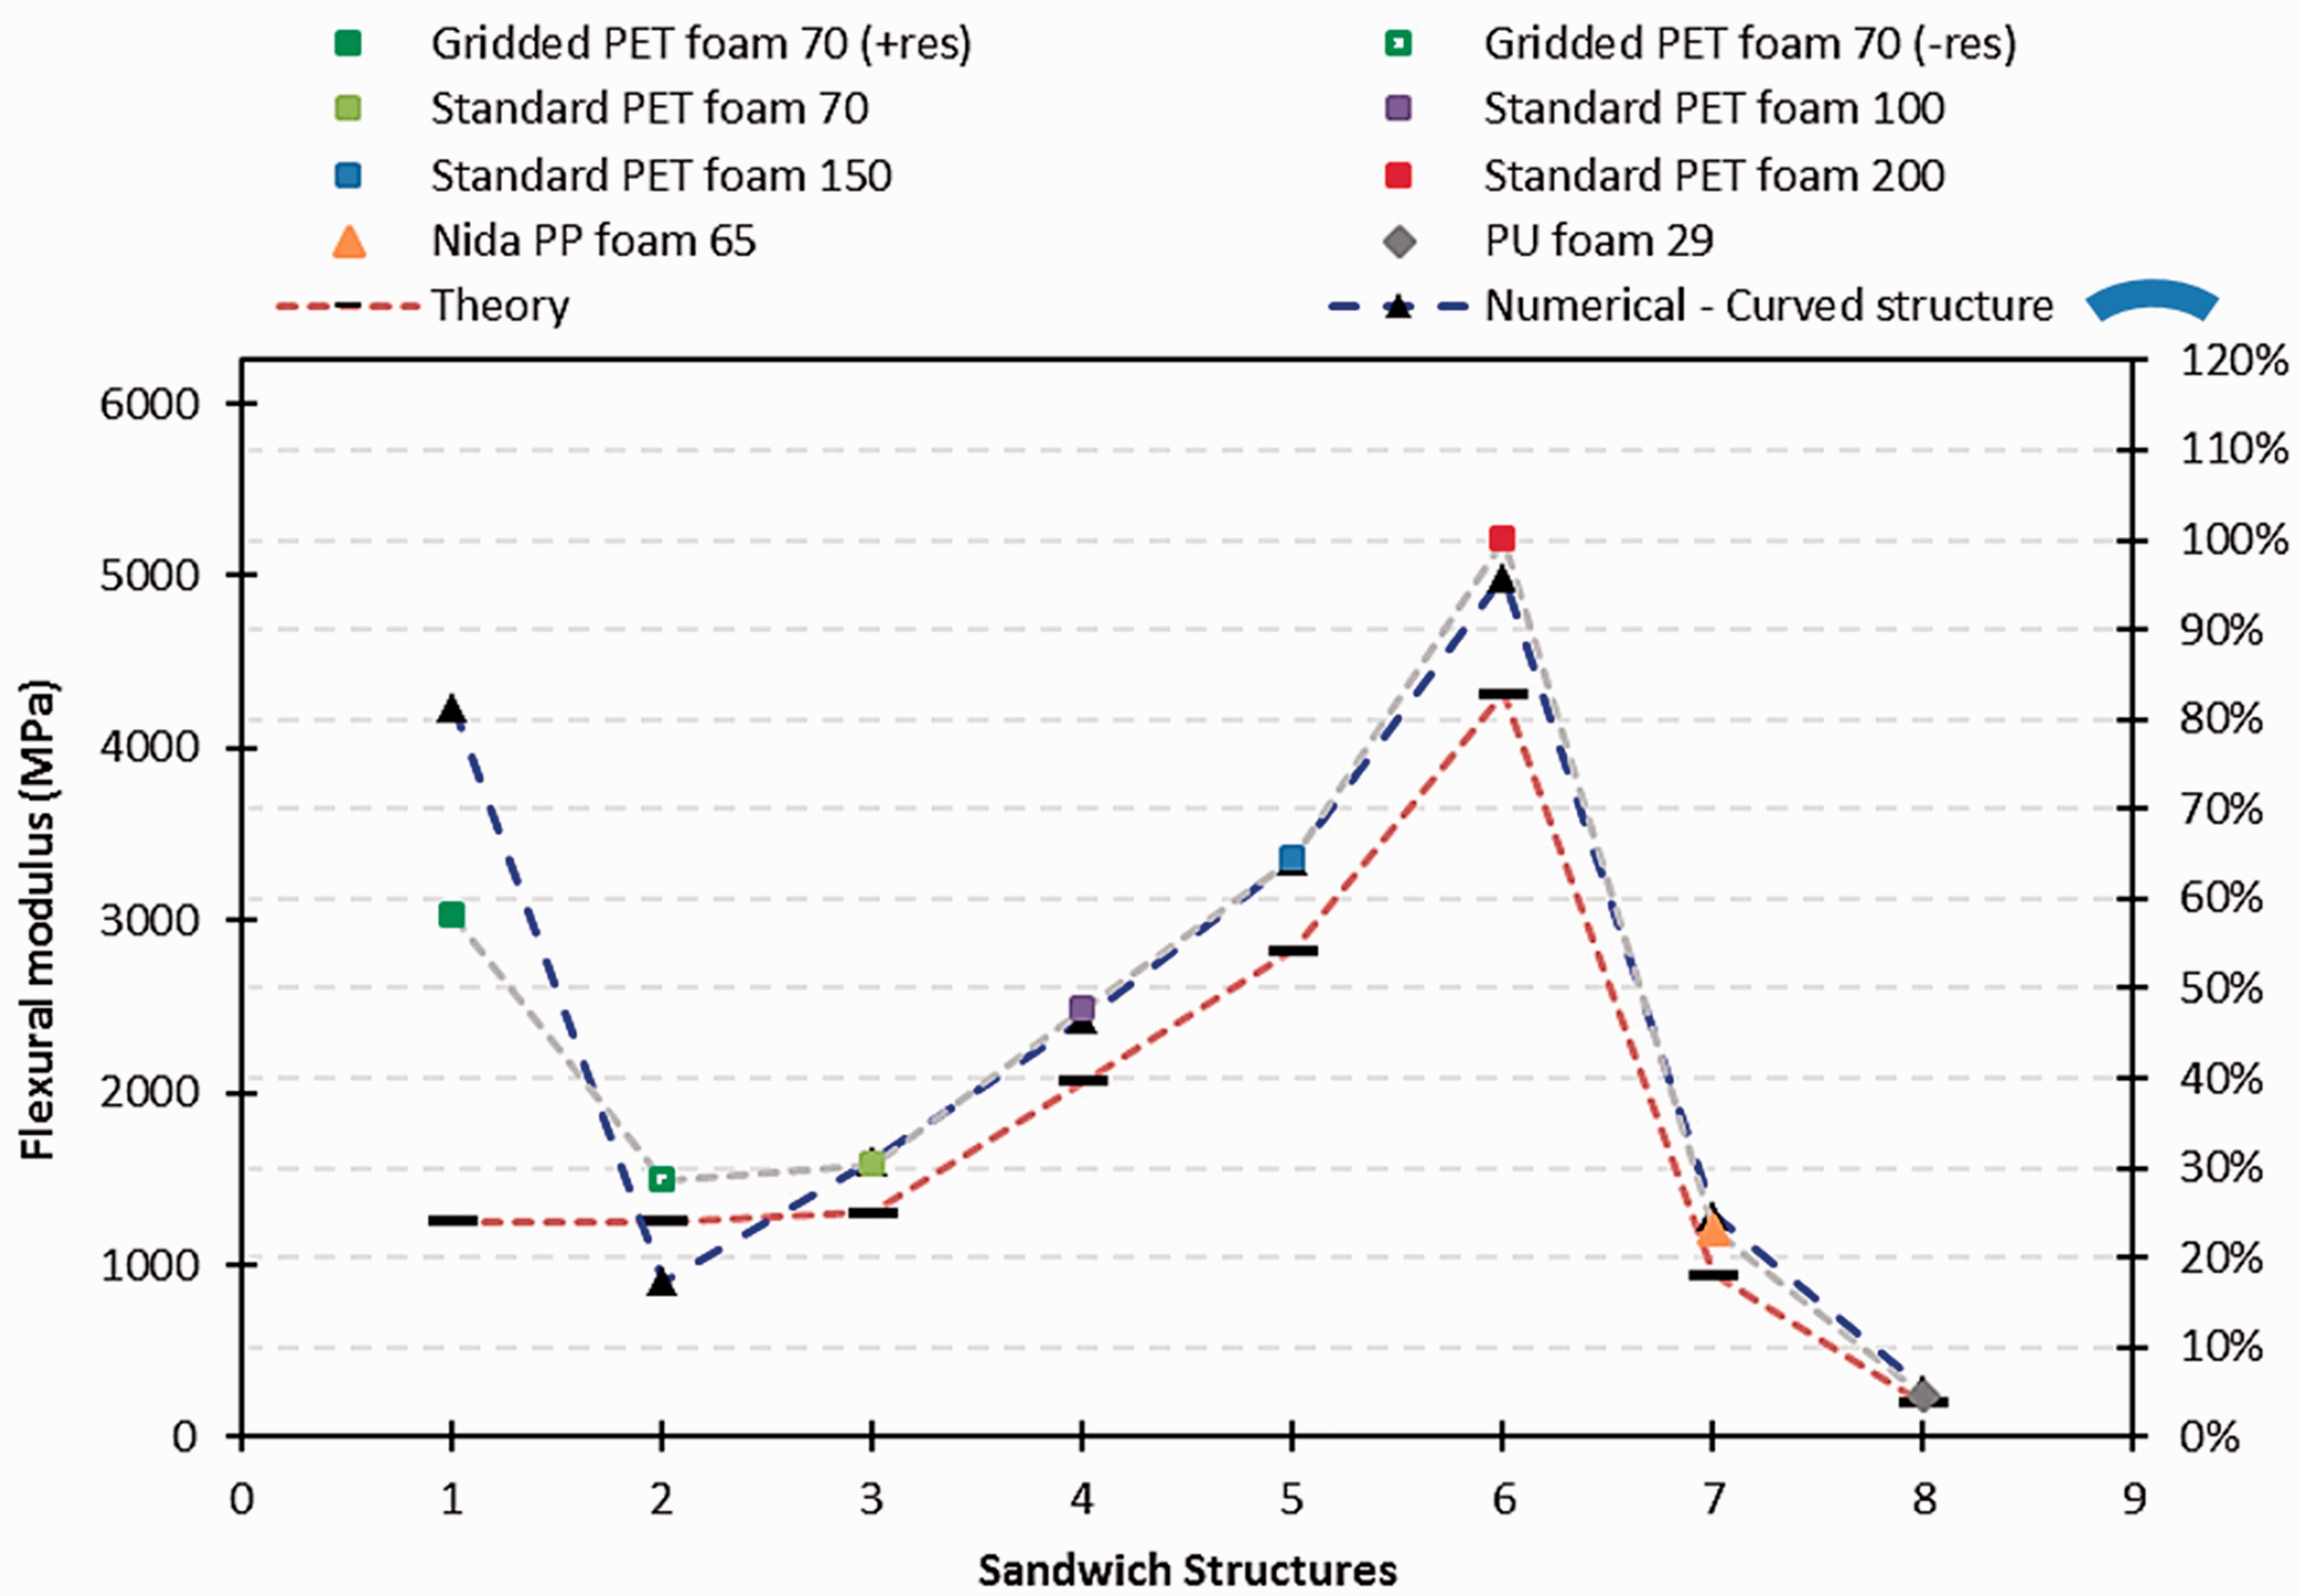
For all types of materials, except structures with PET 70 Gridded foam, there is a good correlation (1–3%) between the experimental and the numerical results relative to the maximum stress that corresponds to the maximum elastic load (Figure 12) and the flexural modulus (Figure 13) for each specimen. The results of the four-point bending tests properly show the flexural rigidity due to the configuration of the supports. In this way and by modeling the curved structure, there is a difference of 1.5% in average between the numerical and experimental values and a significant difference between the curved numerical model and the flat model, which is ∼8% on average. This initial stiffness difference could be reduced by using longer beams to reduce this effect, making it possible to increase the distance between supports to more than 20 times the thickness of the specimen in order to minimize the contribution of the specimen shape in relationship with the flexural stiffness. Therefore, having curved specimens will improve some mechanical characteristics of the structure with particularly a very important role of the residual stresses induced during the manufacturing process.
Maximum elastic stress for each studied structure. Flexural modulus for each studied structure.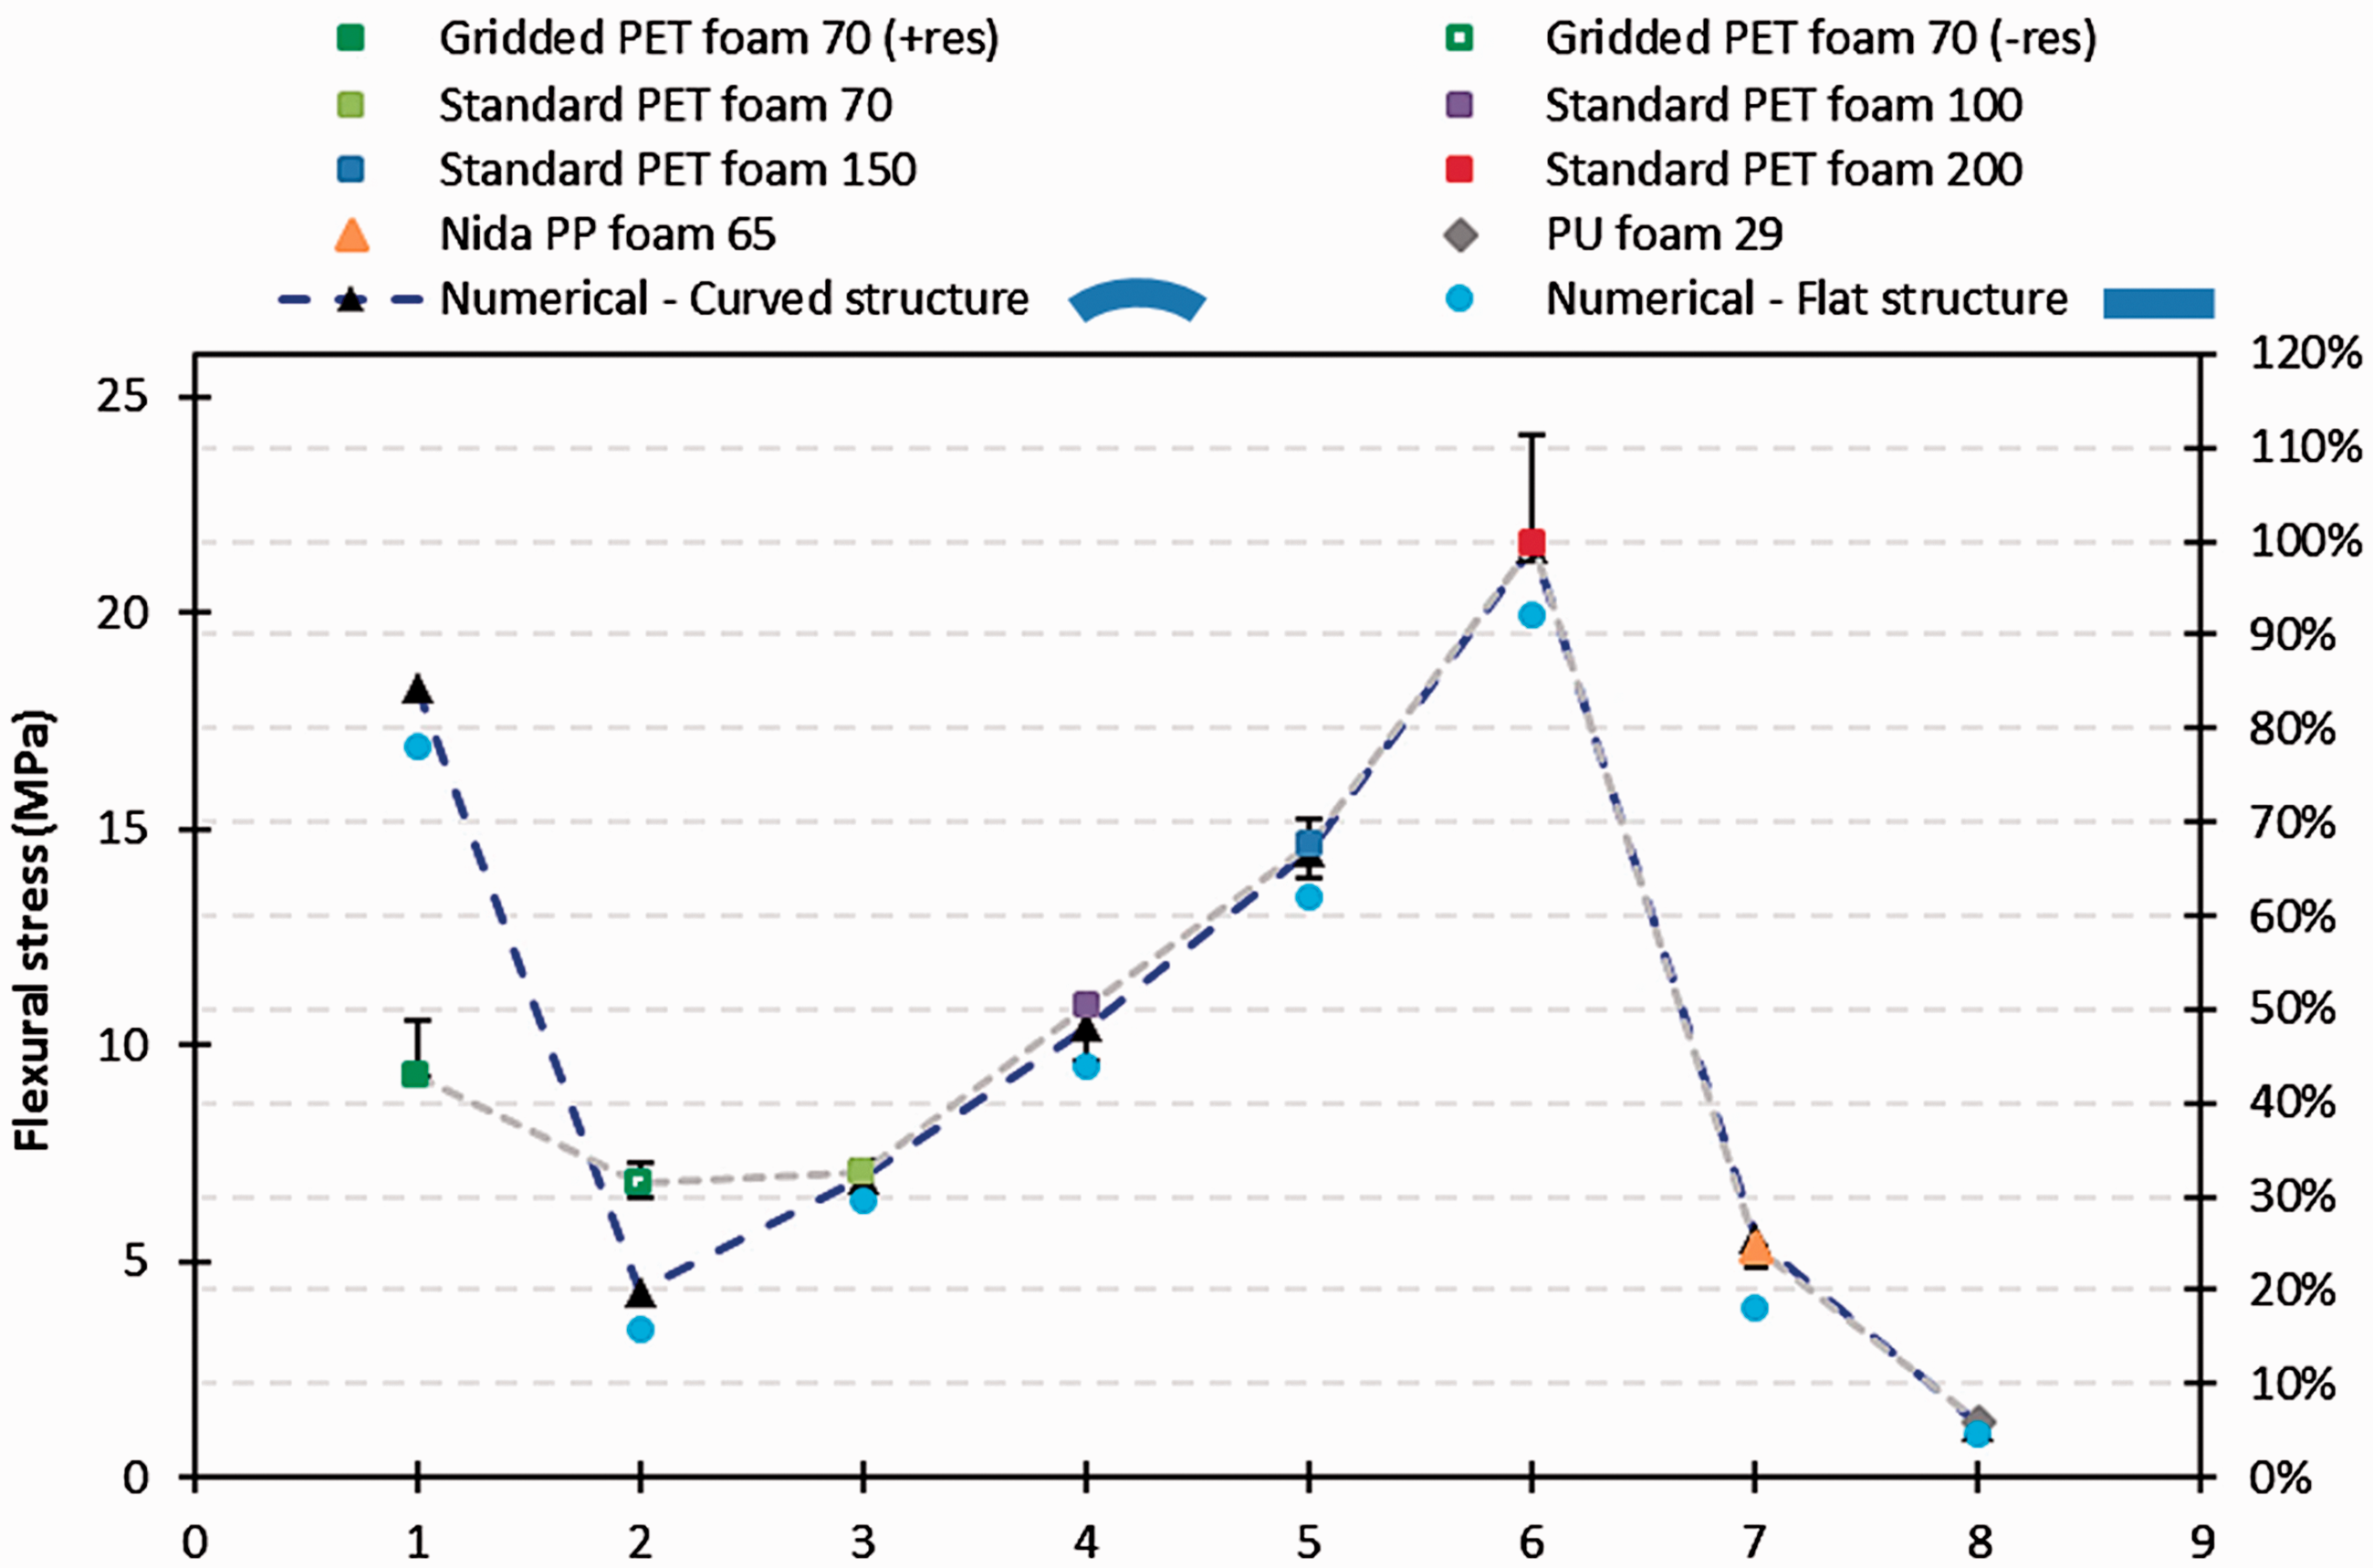
The difference observed for both flexural stress and flexural elastic modulus for the two cases of structures with PET Gridded foam is explained by the fact that in the numerical models the resin content was 100% for the case of (+Res) and 0% in the grids for (−Res). In reality, the estimated resin level is between 15% and 35% depending mainly on the method of winding of the gridded cores and the laying of the fibers already containing the resin, thus penetrating partially between the blocks forming the curved whole structure (Figure 14).
Sample view of a sandwich specimens with PET foam 70: (a) with more open grids (+ Res) and (b) with more closed grids (−Res).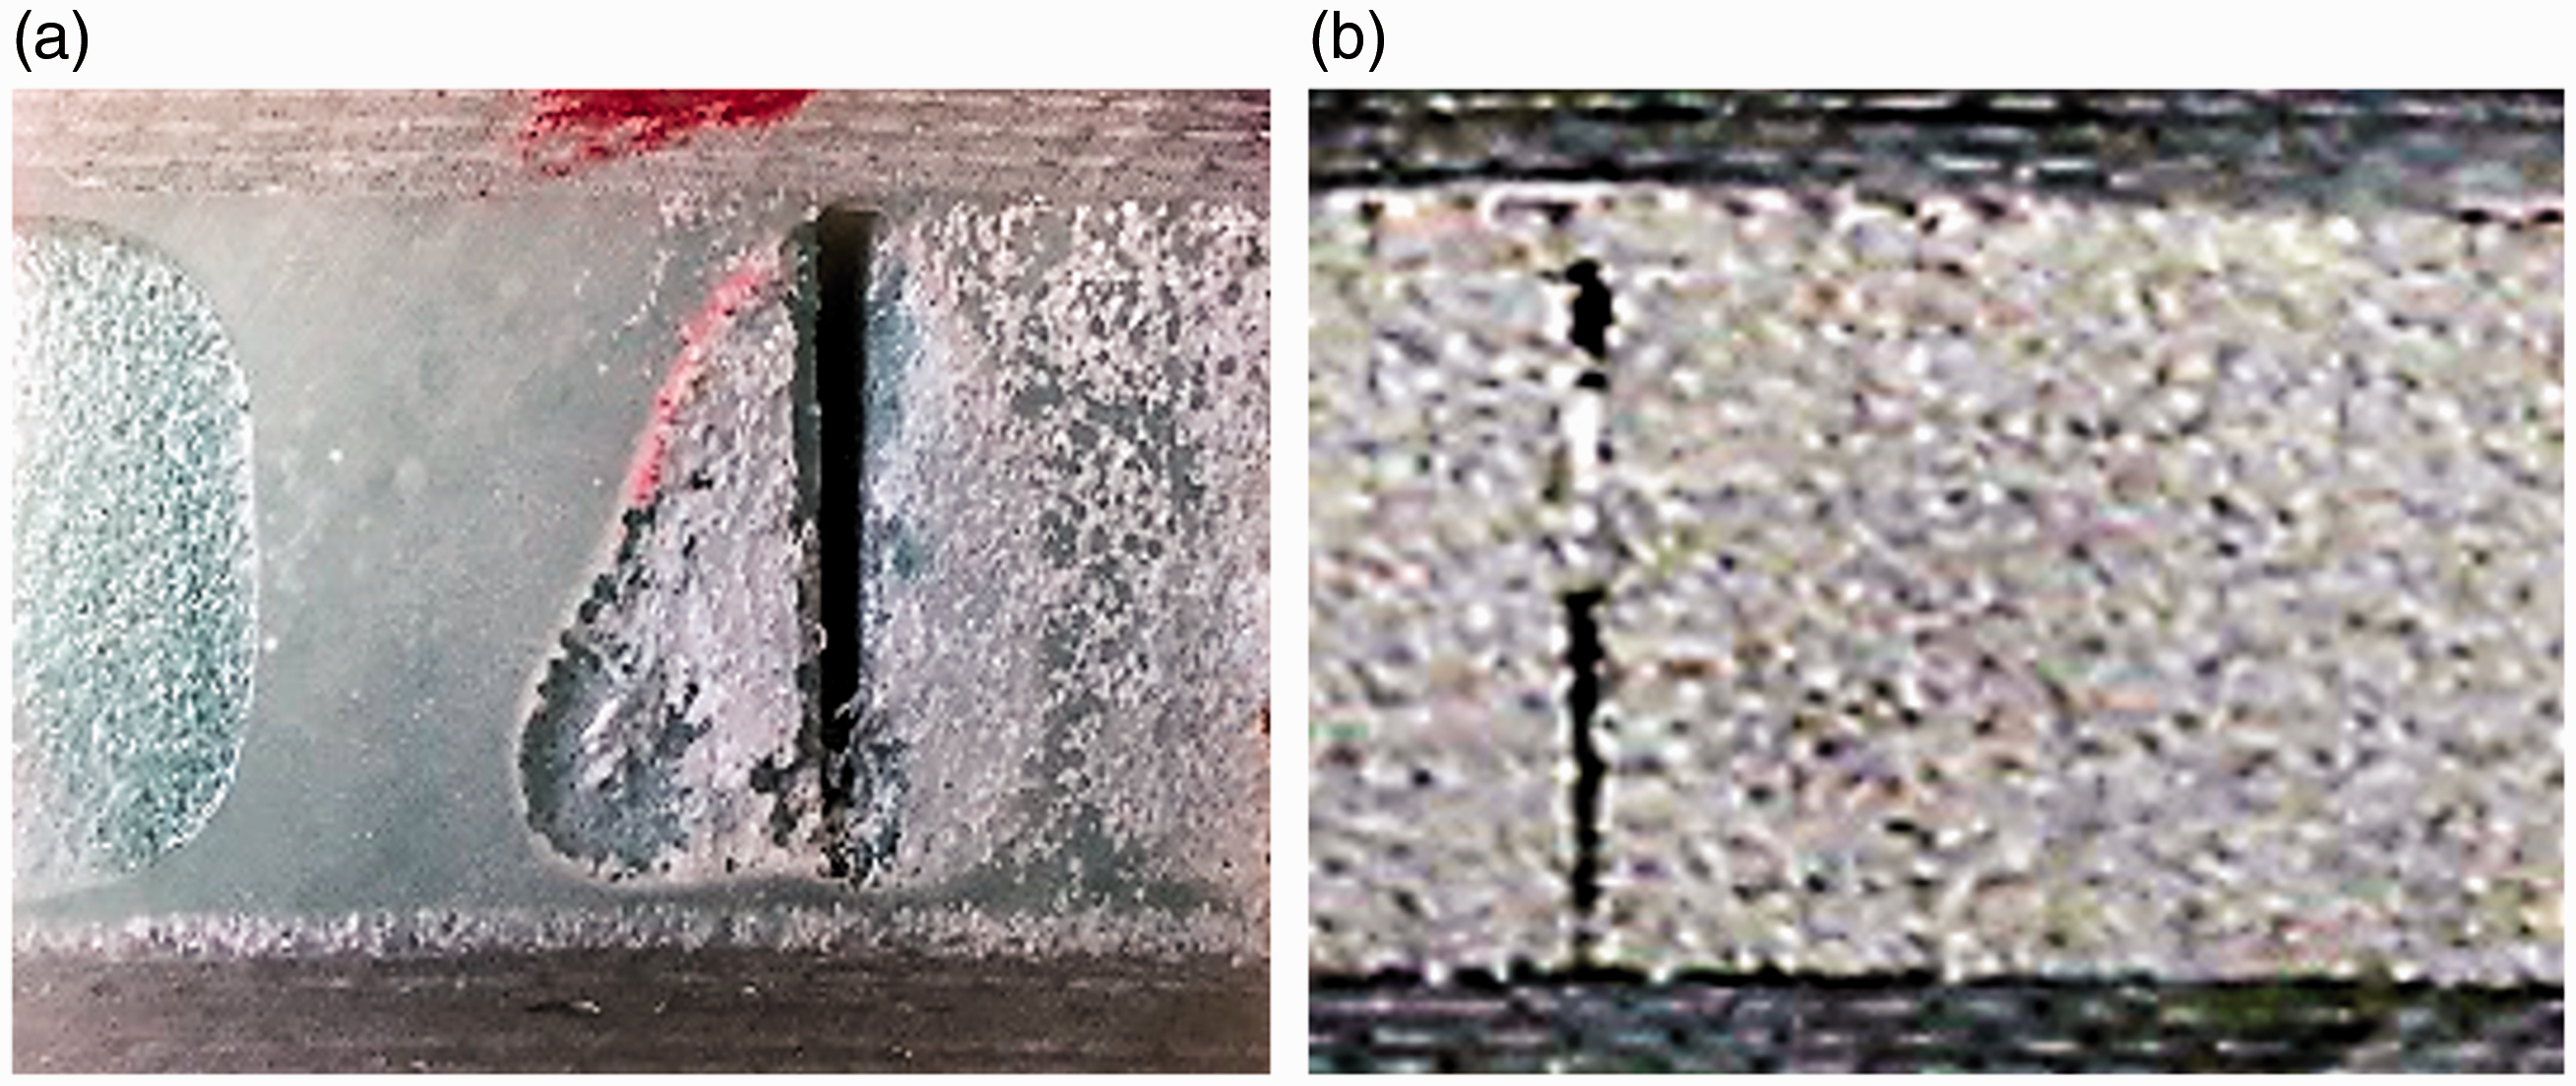
According to the standard by Kalarikkal et al.
23
which relates to flat composite plates, it is possible to determine the flexural elastic modulus Ef expressed in MPa, using equation (21)

The flat plate theory seems to underestimate the flexural modulus of the sandwich structures with an average difference of 12% compared to the experimental results, as shown in Figure 13. In fact, this module increases with the relative density of the constituent cores since the overall stiffness of the structure also increases as a function of this material characteristic.
The comparisons of the stiffness calculations obtained for each type of sandwich material, as well as the analytical estimates and the numerical predictions in flexural tests, are given in Figures 15 and 16. So based on the results presented in the graphs below, we note that specimens with gridded PET foam type that include a high level of resin into grids show a high bending stiffness compared to other types that have the same foam density of 70 kg/m3 into structure. This confirms that the importance of the presence of resin is not to be neglected; on the other hand, it has disadvantages such as the addition of the mass to the structure and therefore the overall weight of the tank. We also have a greater stiffness with a relative increased density for sandwich standard types without grids. Indeed, for this type of foam, the difference in bending stiffness regarding the structures with a standard core is 70% between those of 70 kg/m3 and 200 kg/m3. Also for the transverse shear stiffness, there is almost 65% of difference which is very significant. The importance of the density of the constituent foam for the same structural thickness is thus considered. It is worth noticing that the equations presented earlier have been established within the context of plane plates, which is not the case here. This confirms that the curvature also plays a fundamental role in the discrepancies observed in responses and the behaviors of the studied structures, as we can see in Figures 15 and 16. It has a structural effect as expected. The different characteristic rigidities deduced from these results are very similar to those corresponding to the numerical modeling of each studied curved structure with an error valued between 2% and 5%. These differences can be explained by: i) the local variations of the densities in each type of sandwich core, as well as by a possible stiffening of the foam due to the absorption of resin during the fabrication of the sandwiches by filament winding. ii) the parameters of the boundary conditions for the numerical model and iii) the mechanical properties of the different components, which can slightly change from one sample to another depending on the fiber ratio after winding, etc.
Normalized bending stiffness of studied sandwich structures with various densities. Normalized transverse shear stiffness of studied sandwich structures with various densities.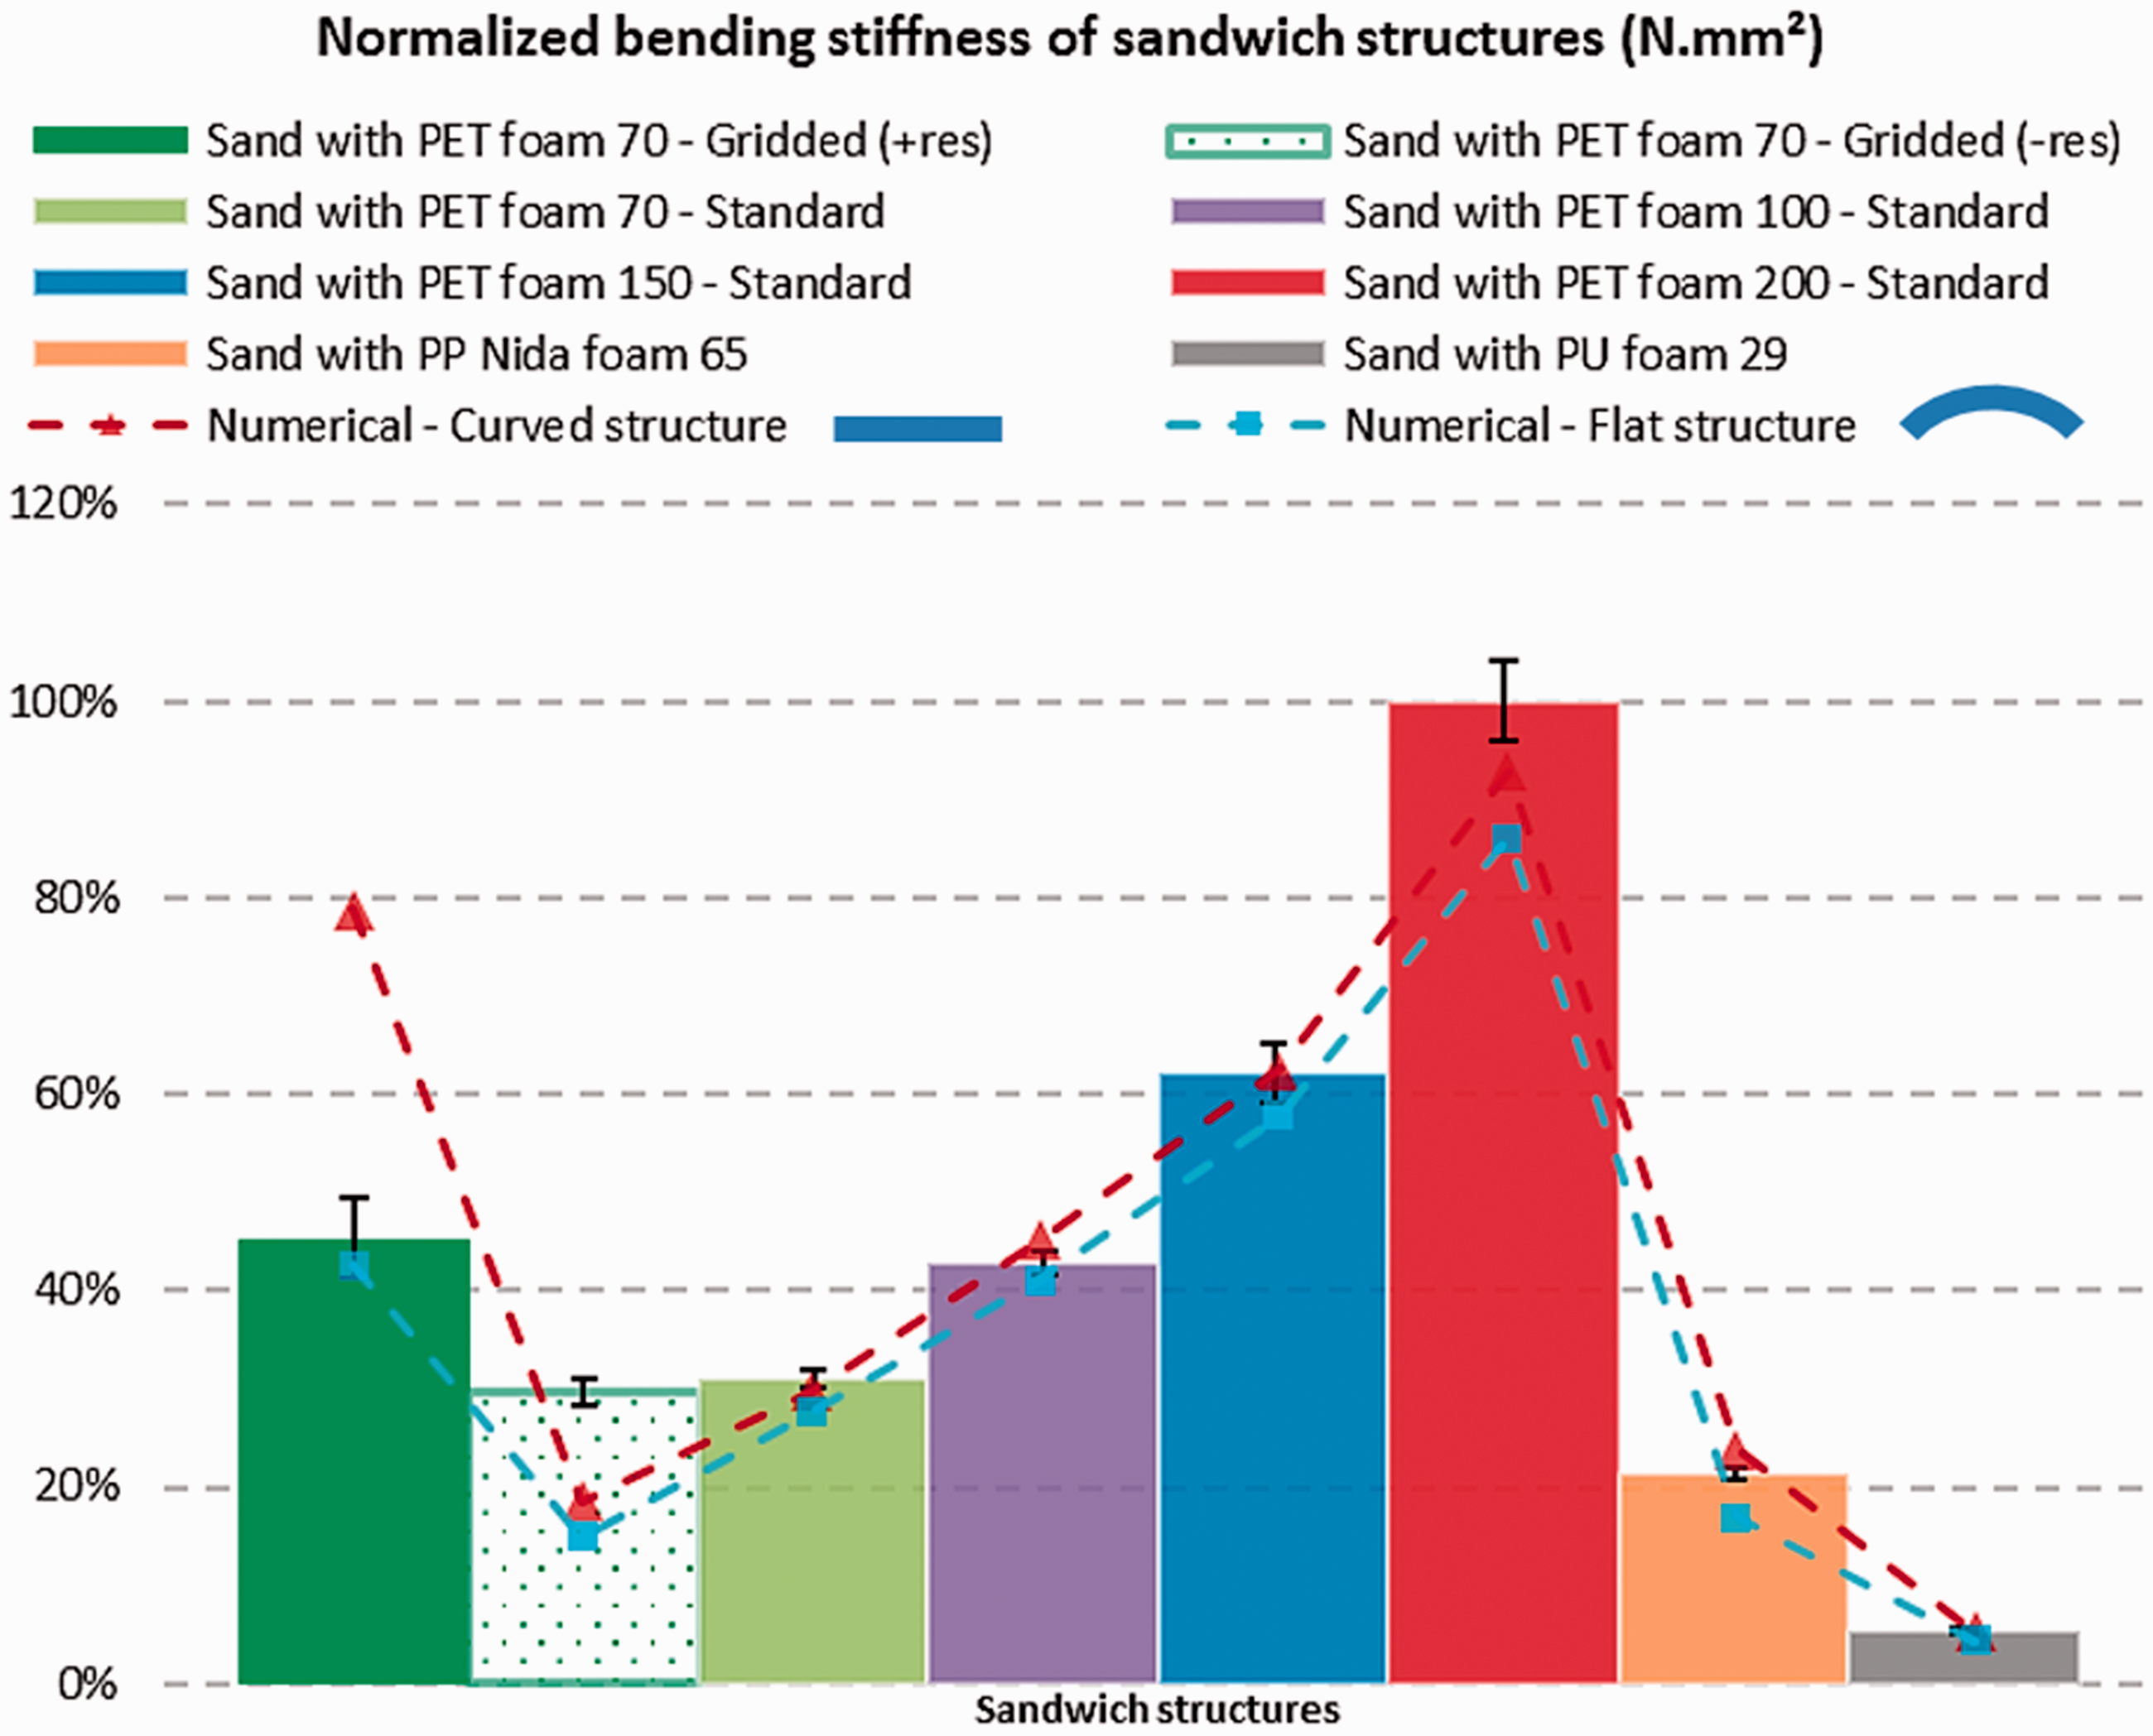
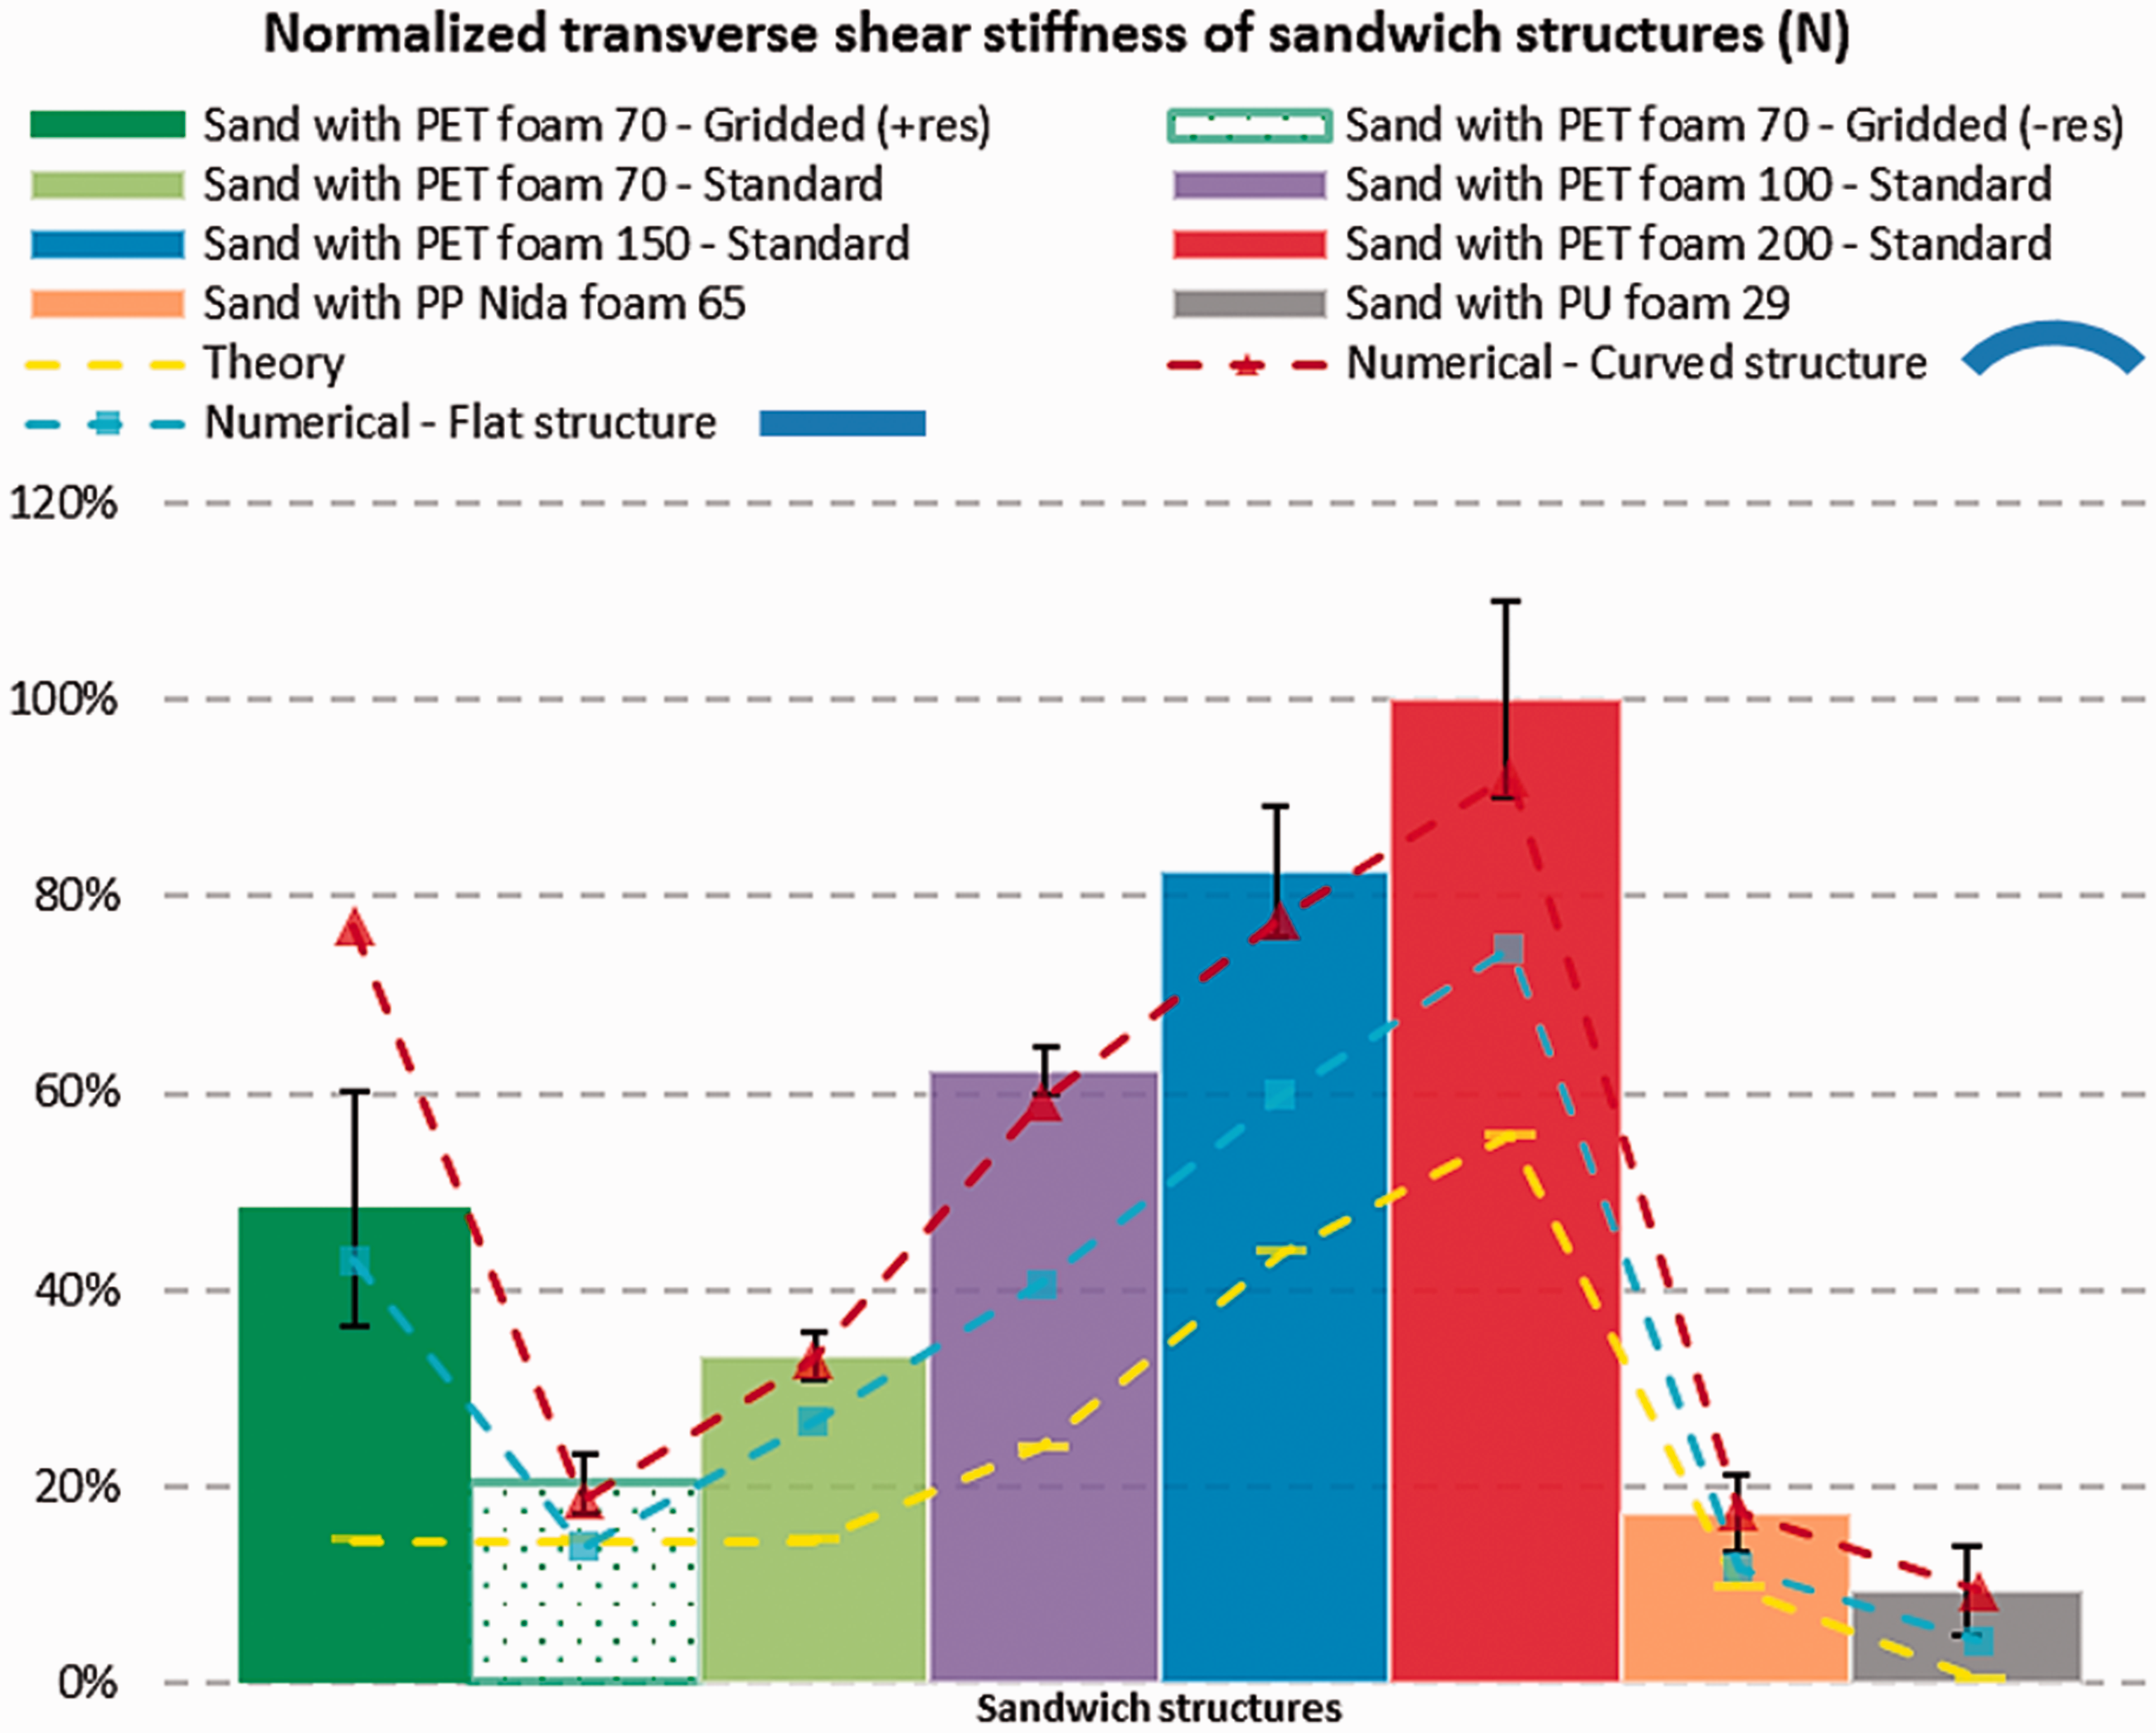
For sandwich structures with PU and PP foams, there is a large difference compared with other sandwiches, especially those with a core of 200 kg/m3, due to the low compressive strength of these types of cores. Moreover, it should be noted that they have a major advantage which is the drape-ability and taking the curved shape with more flexibility.
To conclude, the failure load of the sandwich structure under flexural load depends mainly on the specimen geometry and the mechanical properties of the constituents. Among the most important properties of a core which constitute a real criterion of choice, are its shear resistance and its flexural modulus. Furthermore, especially when thin skins are used, the core must be able to support the compressive loading without premature failure, in order to avoid buckling damage of the skins following their wrinkling initiation.
Predicted results and discussion
The results of the theoretical prediction and numerical simulations of the flexural behavior of the composite sandwich specimens and comparison with the experimental results are discussed in the following section. The normalized stress–strain curves, presented previously in Figure 11(a) and (b), show firstly a quasi-linear behavior of the specimens up to significantly high loads, then a nonlinear behavior up to a maximum load due to initial structural damages occurring roughly. Primarily, the core reaches its elastic limit when the shear load increases. This maximum shear load is significantly lower for bending tests with four-point loading configuration having a certain load span length (distance between the upper load supports). The reason for this finding is that, for this type of test, the rigidity of sandwich materials is affected by the sharp decrease in shear effort. So, for every studied sandwich material, the limit of the elastic behavior is reached essentially when the foam reaches its elastic shear limit. Under these conditions, the materials will be solicited by transverse shear stresses. We observed common cases of shear failure of the core or delamination of core/skin interfaces. The variability of density of the core constituent regarding PET standard structures leads to the modification of the elastic limit and the relative stiffness of sandwich materials. In fact, for some core materials, the core shear modulus is a function of the direction that the core is oriented relative to the length of the specimen. Final cracking was observed on the skin in contact with the supports which drive the load, as shown in Figure 17. It is mainly its resistance to compression which is the most important factor after rupture of the core. Specific geometric factors that affect sandwich facing stiffness and thereby the sandwich flexural stiffness include facing thickness, core cell geometry, and facing surface flatness (toolside or bagside surface in compression).
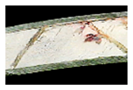
Localized cracking on the upper skin.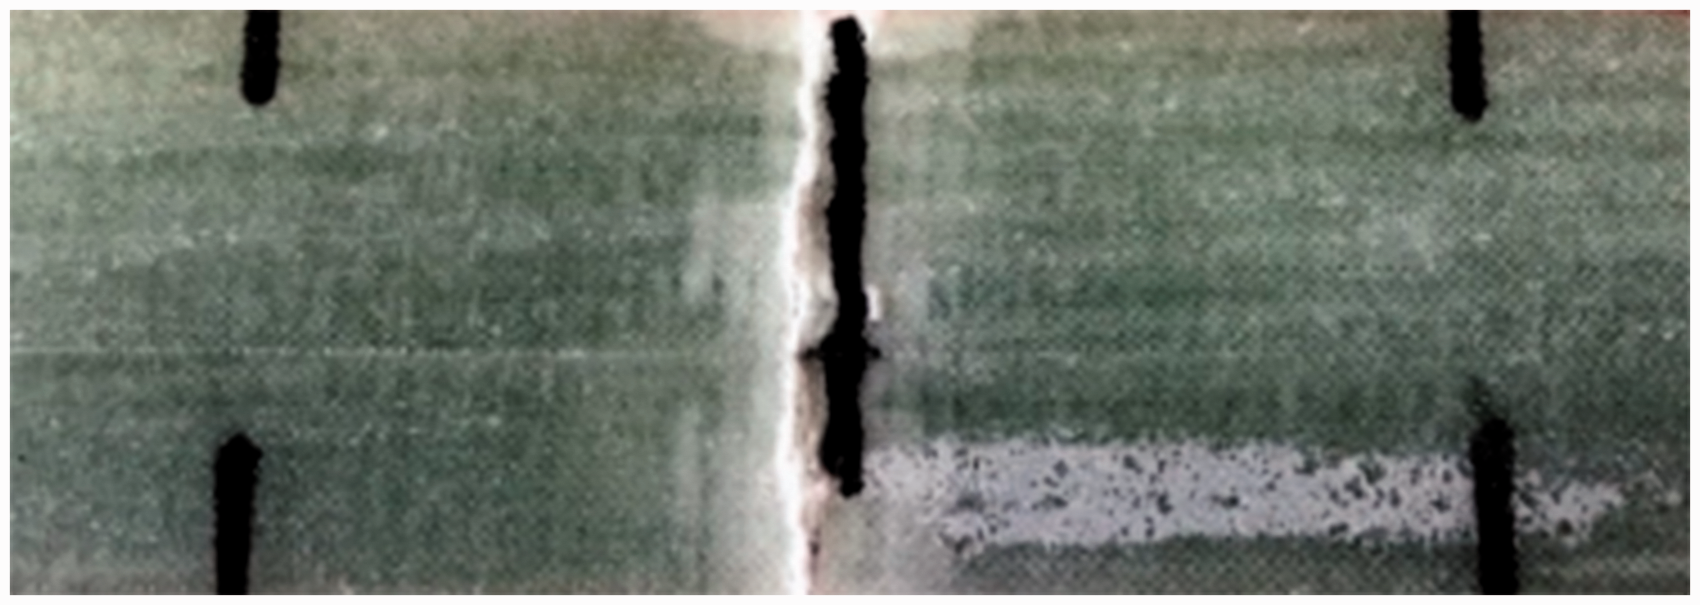
Then, a comparative study between the experimental and numerical results has been carried out, taking into account the various important parameters of the geometry of the material and the associated mechanical characteristics of the data sheets. It can be seen from the table below that the damage modes are predicted in the associated numerical models depending strongly on the type of test and the nature of the material being studied. Figure 18 shows the numerical model used to simulate the three- and four-point static bending tests of the composite sandwich. The loading and the support conditions in specimens are simulated in the finite element analysis by line loads. For reasons of simplification of the model, the structure is assumed to be a rigid body between steel rollers, curved foam and the two skins (Figure 18). When simple rollers simulate the loading and the support conditions, the stress and displacements fields near the region of the applied load are not affected in case that a static finite element analysis is applied to the sandwich beam without considering contact analysis.
35
On the other hand, contact analysis must be applied between the cylinders and the sandwich beam, which is out of the scope of this study. As shown in Figure 18(a), the displacement is applied to lines belonging to the partitioned faces and therefore no contact technique is used to further simplify the model. Another point that has been checked is the mesh size. In fact, the variation of this parameter has little effect on the numerical results because of the linear displacement that has been imposed in the model and the simplicity of the geometry which allowed a rapid computational time.
The 3D geometric model with its boundary conditions (a) and mesh size (b) used into the numerical analysis of the flexural test.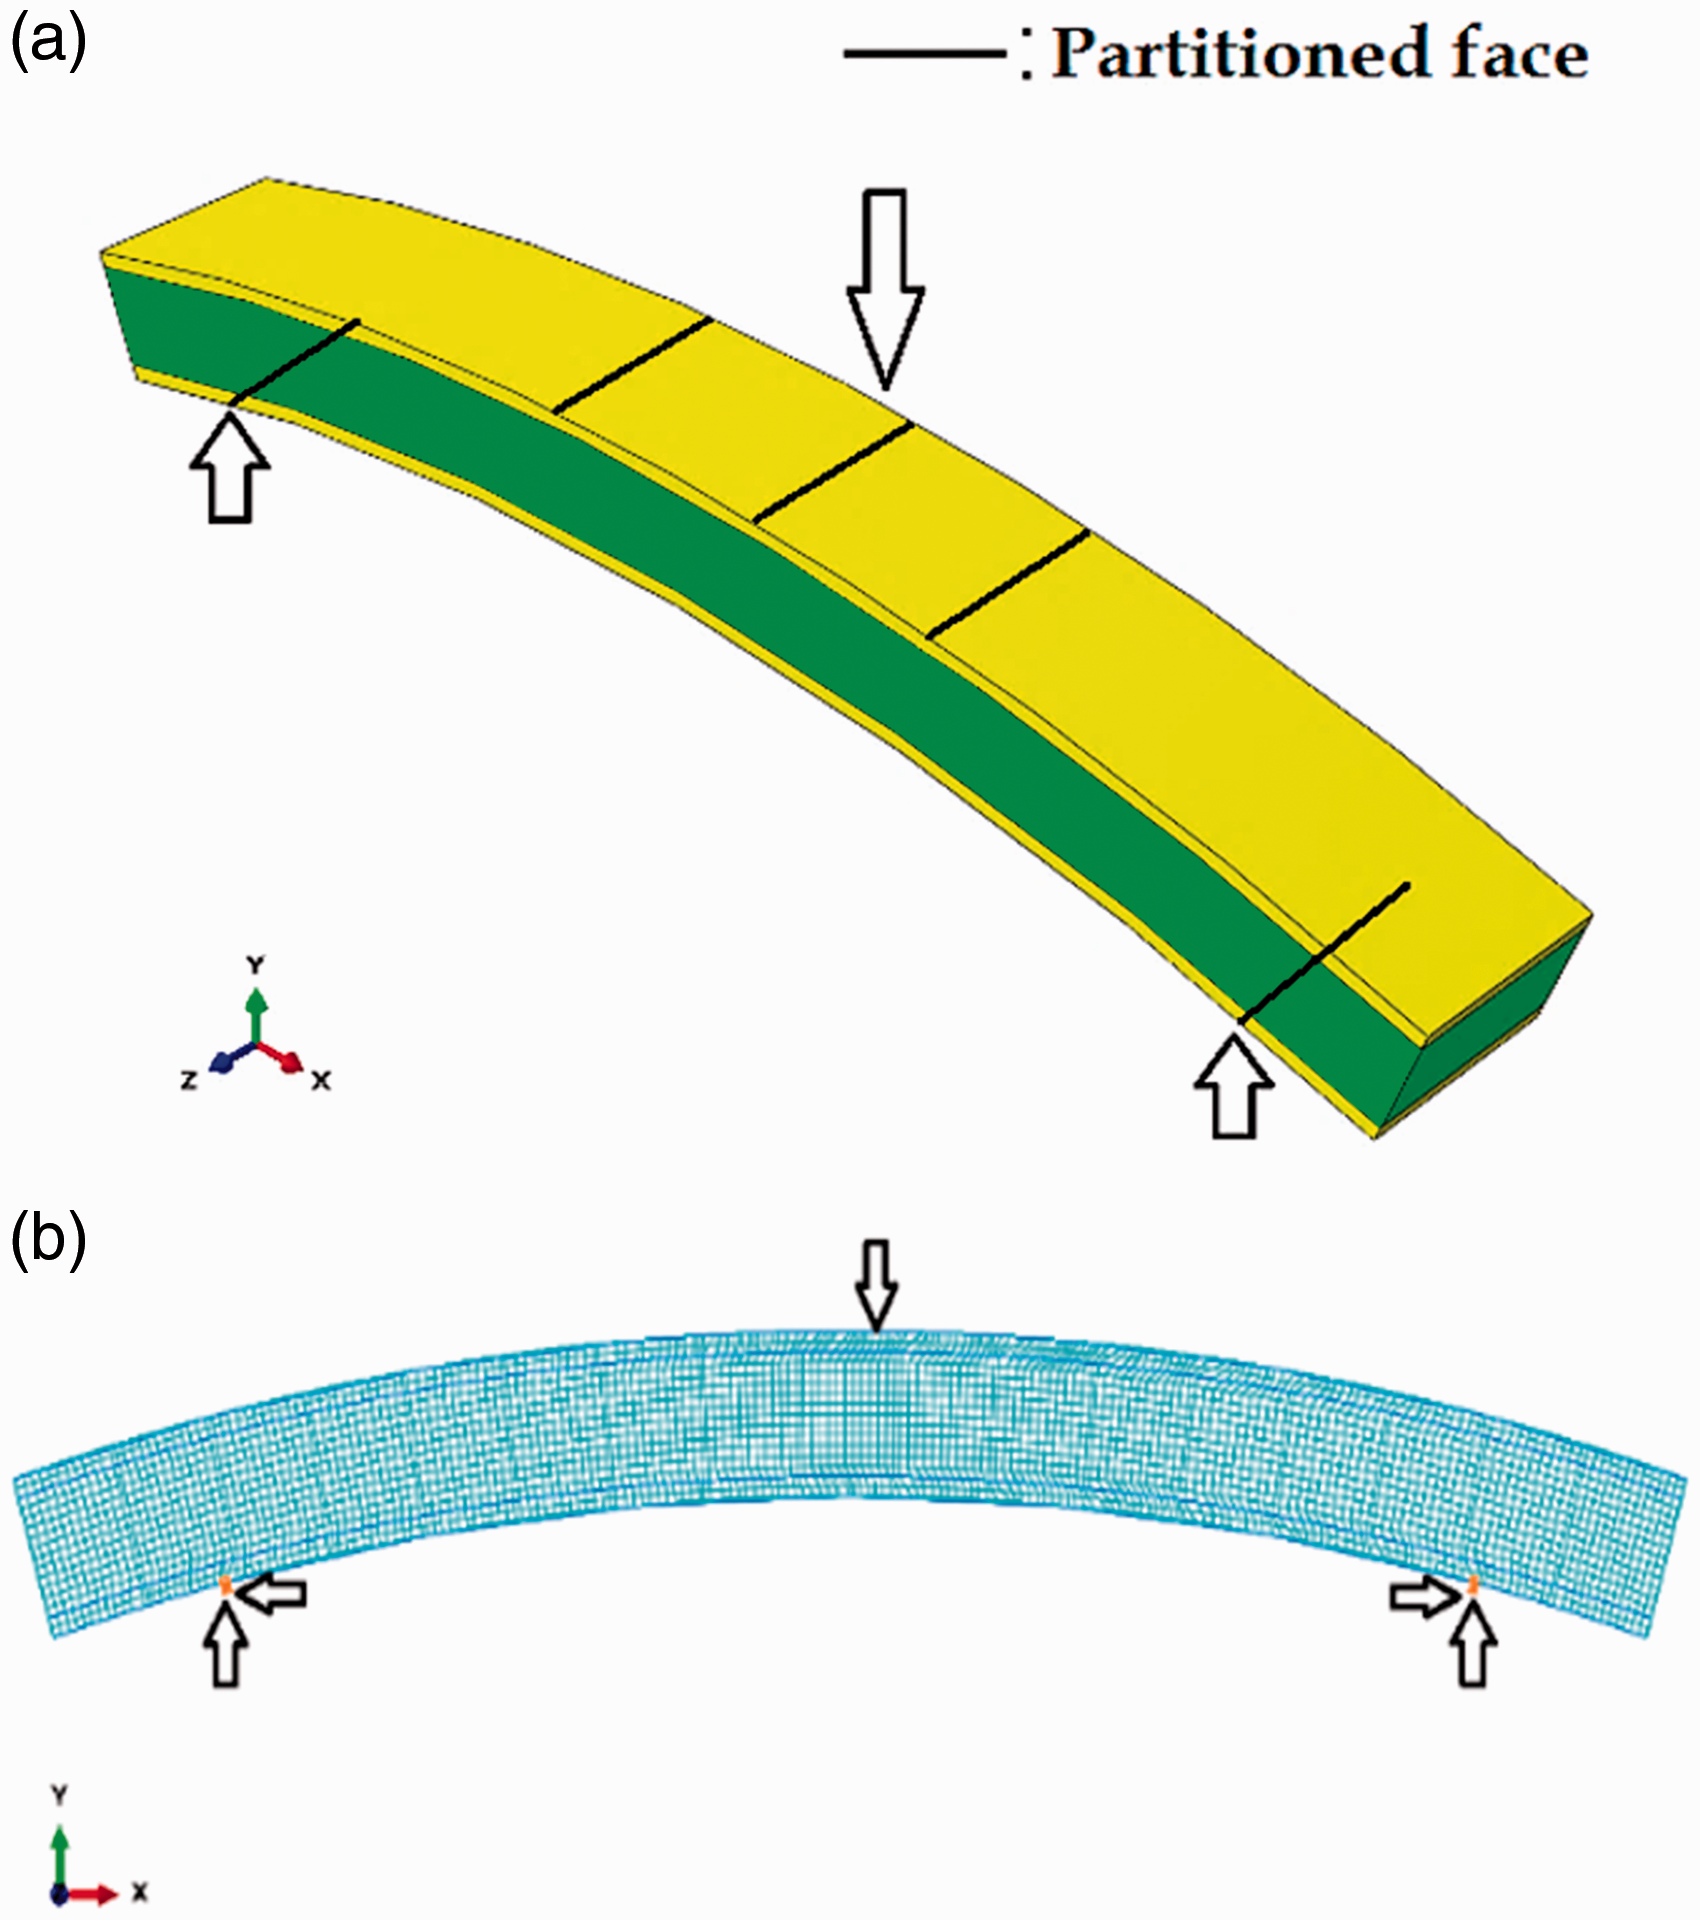
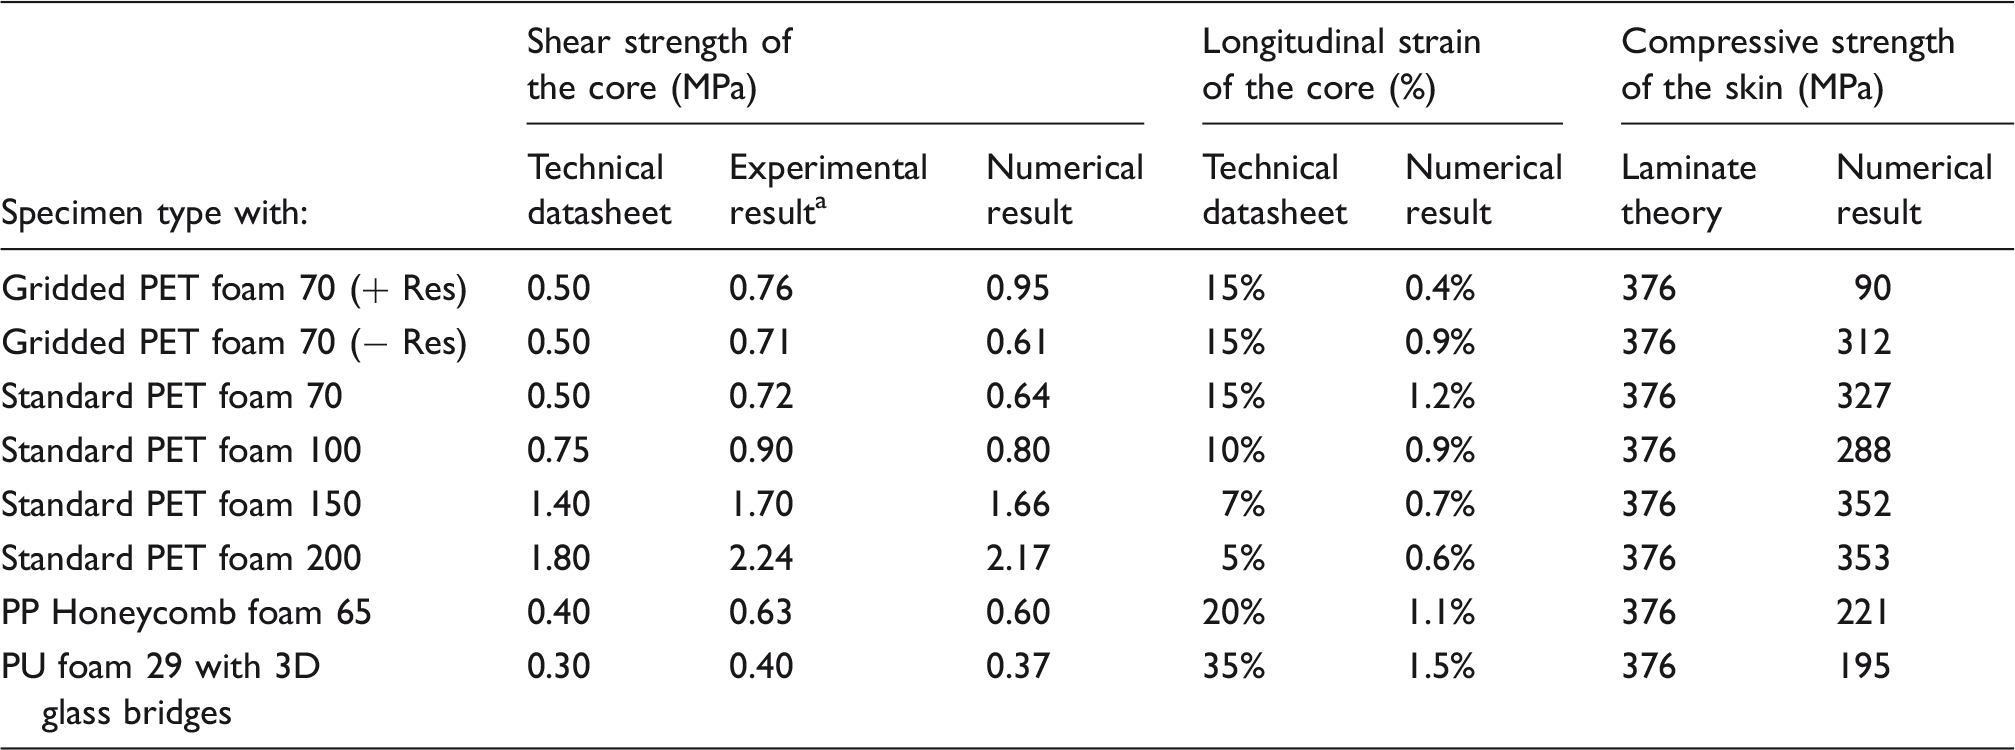
Based on numerical simulations, the principle mechanisms of failure initiation into specimens under three-point and four-point bending tests are shown in Figure 19. They were studied numerically based on experimental results. The FE analysis results, which concerns just the elastic linear behavior, showed a good agreement with the elastic experimental results. Using the maximum deflection value as an input in the model, which corresponds to the maximum critical constraint limit obtained experimentally (point from which either the skin or the core begin to fail), the FE analysis was successful in prediction of the maximum elastic constraints for all studied structures with the corresponding localization into each specimen. In fact, the shear failure of the different constituent cores in the constant shear force region occurred at different loads (Table 3) depending on mechanical properties of each studied core material (Figure 19(a) and (b)), associated with a skin–core debonding where the maximum traction damage initiation is reached. It was demonstrated in Table 4 that the foam core failed before the skin as noticed in the experimental tests. Also, to confirm this ascertainment, the compressive stress (S22) of the skin has been monitored up to the maximum elastic limit. It has been observed that the compressive stress does not reach the critical value at the top skin (Table 4) which means that the skin still sustains compressive load while the core is already failed (Figure 19(e) to (f)). Moreover, the longitudinal strain (LE11) concerning each core material shows a minor value compared to the ultimate tensile strain obtained from materials' datasheets, which indicates that the tensile failure of the core does not occur (Figure 19(c) and (d)). It should be noted likewise that there is some variability in sandwich specimens cracking, and that the arithmetic mean of each result was used as a reference.
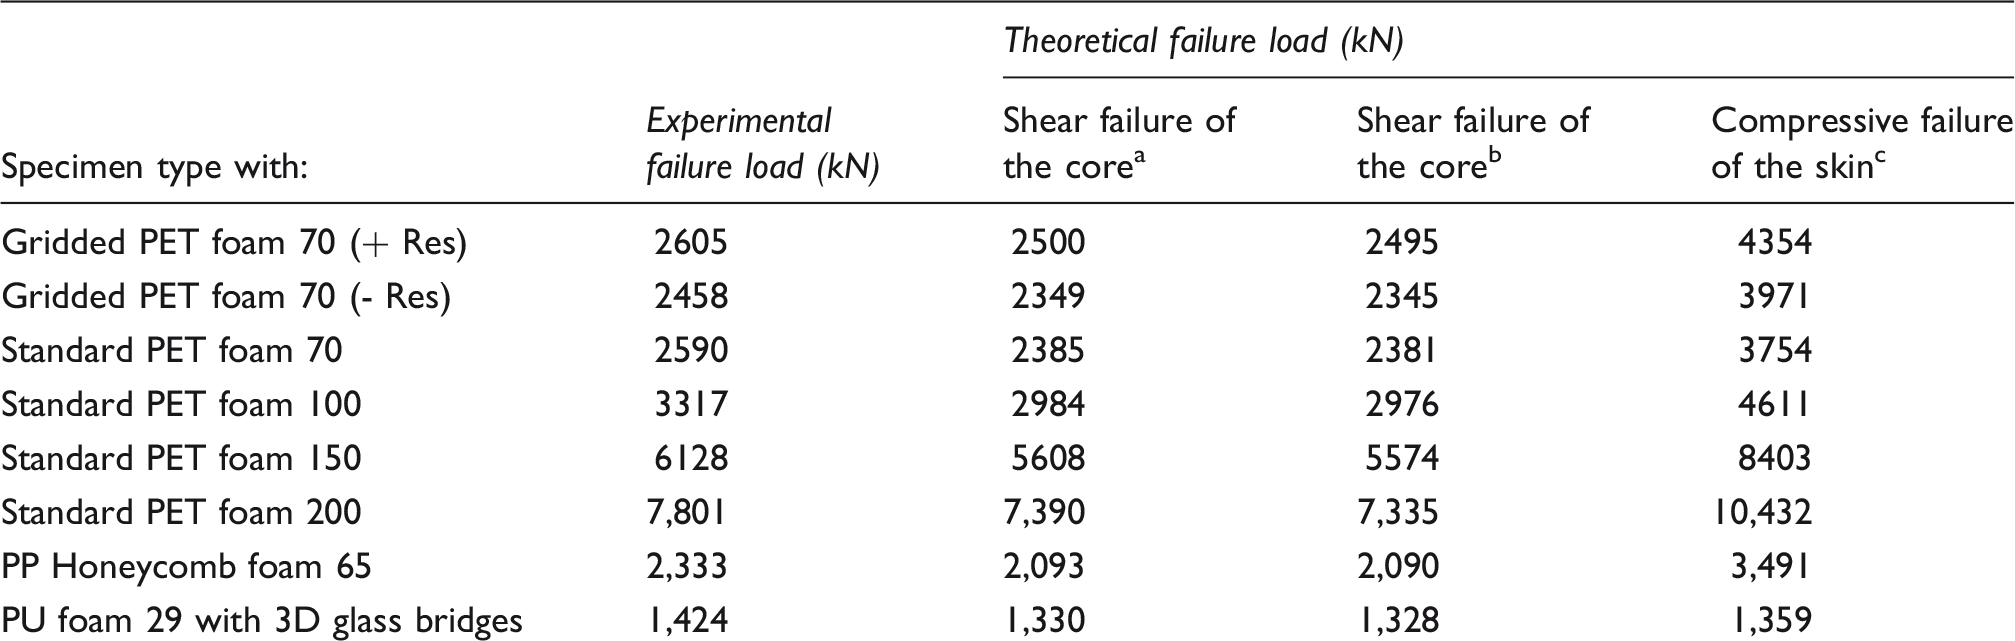
Most observed damage failures in sandwich structures under applied bending load. (a) Tension/compression strains on the skins; (b) damage shear cracking into sandwich cores. Experimental and predicted maximum elastic load of the composite sandwich structures under flexural bending. Calculated using equation (11). Calculated using equation (12). Calculated using equation (7). Experimental and numerical characteristics of each foam and corresponding skins of sandwiches under flexural bending. Calculated using equation (10).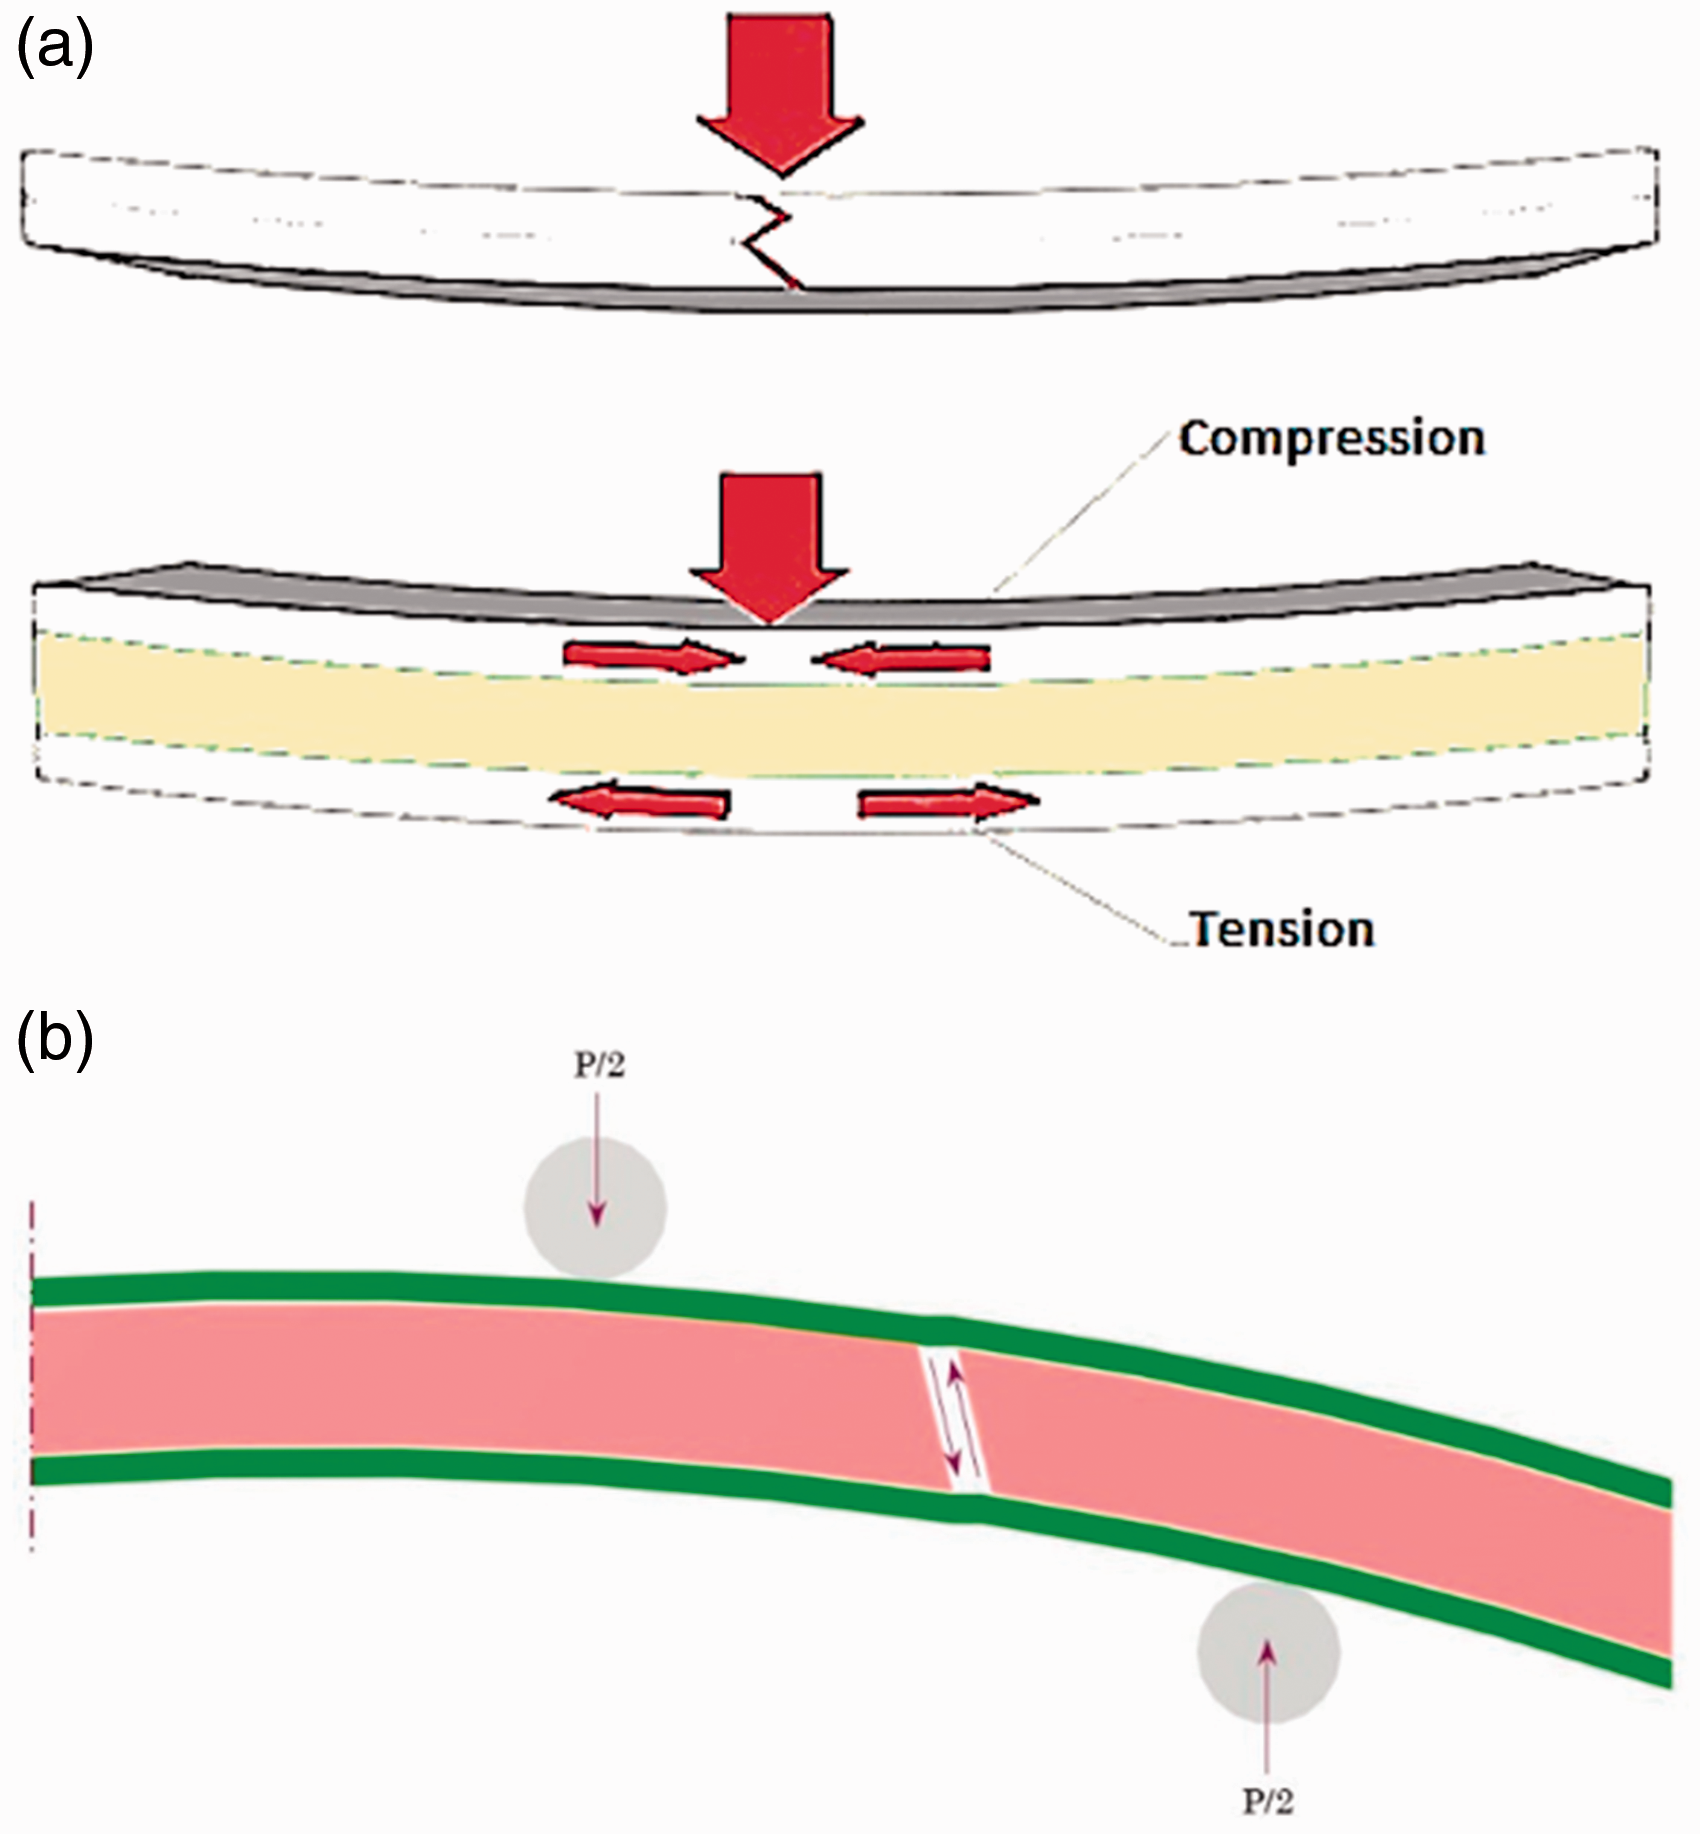
To summarize, the different failure initiation modes that were observed experimentally are mainly caused by the densities variability of the studied cores and by the bending configuration (three or four-point bending). Indeed, it is primarily the constituent core that is loaded in shear, from where we observe the appearance of the initial shear failure mode. For most test cases, the structure is loaded in both tension/compression of the upper and lower skins as described in Figure 20(a), and shear of the core that causes a random structure break (Figure 20(b)) in terms of damage location. In some cases, there has been a break of the core–skin interface which shows that this element must be optimized during the filament winding process, by increasing the polymerization time and the applied tension on the fibers during fabrication.
The prediction equations in the Theoretical and experimental evaluation of the flexural response section were used to determine the maximum load and the governing initial failure for the composite sandwich structures. The dominant initial failure mode was predicted to be core shear (Figure 20(b)). The estimated maximum load due to core shear failure and compressive failure of the skin was also calculated. Table 3 shows the theoretical failure load and the maximum load of the sandwich specimens based on experimental investigations. The theoretical load of shear failure predicted using equations (11) and (12) is between 4% and 12% lower than the actual failure initiation load. These results further show that the curved structures can better resist to bending stresses due to their geometry, and that the associated core shear failure load cannot be predicted by using the theoretical analysis, generally used for flat structures. The difference between the predicted and the actual failure load could be due also to the combined effect of the flexural stresses on the sandwich specimens resulting in a slightly higher failure load and the constituent materials non-linearity as well. In general, it has been demonstrated that the failure load of the composite sandwich structures can be reasonably predicted using the mechanical properties of each constituent material established from coupon tests. Similarly, the results indicated that the failure mode of the composite sandwich specimens tested in this study depends largely on the shear strength of the foam core and compressive strength of the composite skins.
Using the materials linear behavior determined from the coupon tests, the FE model has provided results in good agreement with the experiments. On the contrary, the theoretical result underestimated the failure initiation load with a good match on the experimental curve only in the initial slope. However, when increasing the applied load up to failure, a high divergence between the experimental and theoretical response was observed which attributed to the assumption of linear elastic behavior of the constituent materials that does not agree with their actual responses. In order of that, another analytical approach using the actual experimental stress–strain curves of all materials will be considered in the future publications to overcome the accuracy issue.
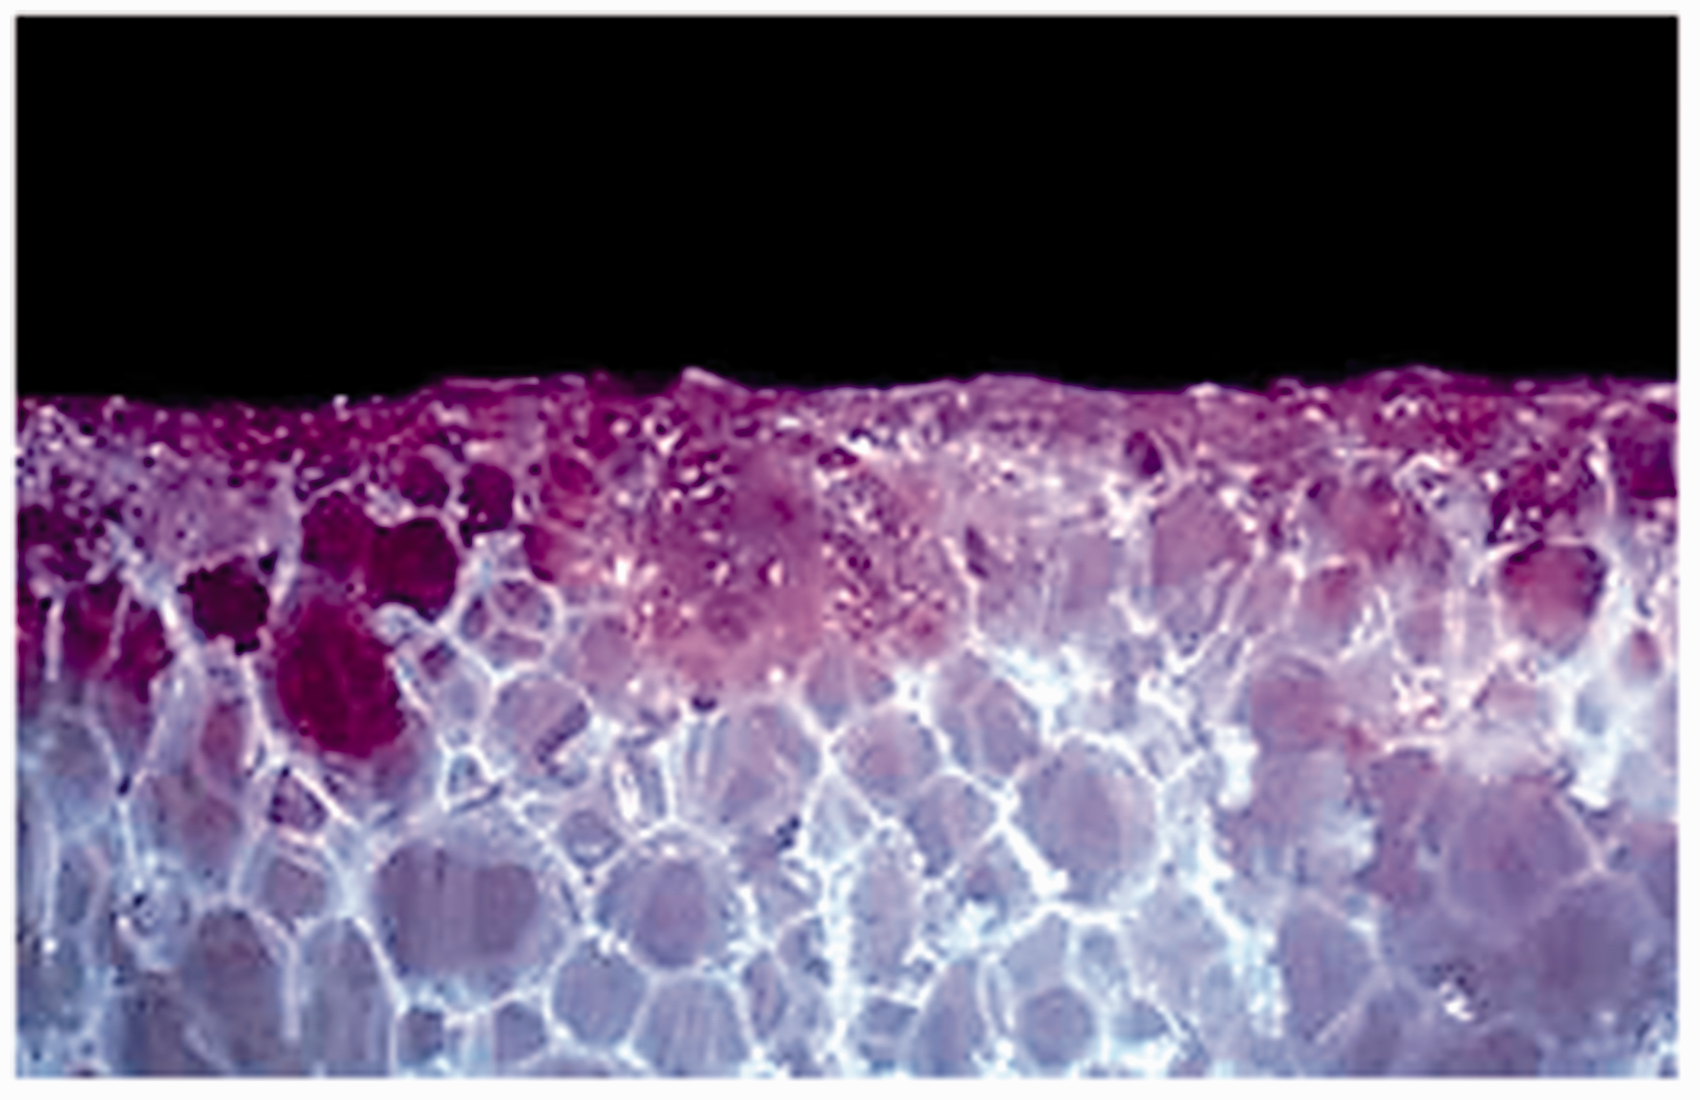
It was observed that three distinct damage events have taken place, respectively, before the final specimen failure which is facing break. Damage event-1 was the crack initiation and propagation on the compression side just below the top face sheet–core interface. It was noticed that this delamination crack was never at the core–skin interface but about 1–1.5 mm below the interface. After several examinations, it was revealed that the resin penetrated/soaked into the core material by this depth as illustrated in Figure 21. It was observed that the crack always initiated at the sub-interface created by the resin-soaked, and the dry cells below the actual core–skin interface. This crack runs parallel to the beam axis from the point of initiation towards the end support, as shown in Figure 22. Damage event-1 occupied about 55% of whole test time.
Principle mechanisms of failure initiation into specimens under bending tests based on numerical simulations: (a, b) in-plane shear stress (S12), (c, d) longitudinal strain (L11) and (e, f) compressive stress (S22). Illustration of the resin uptake in a PET foam core. Damage event 1.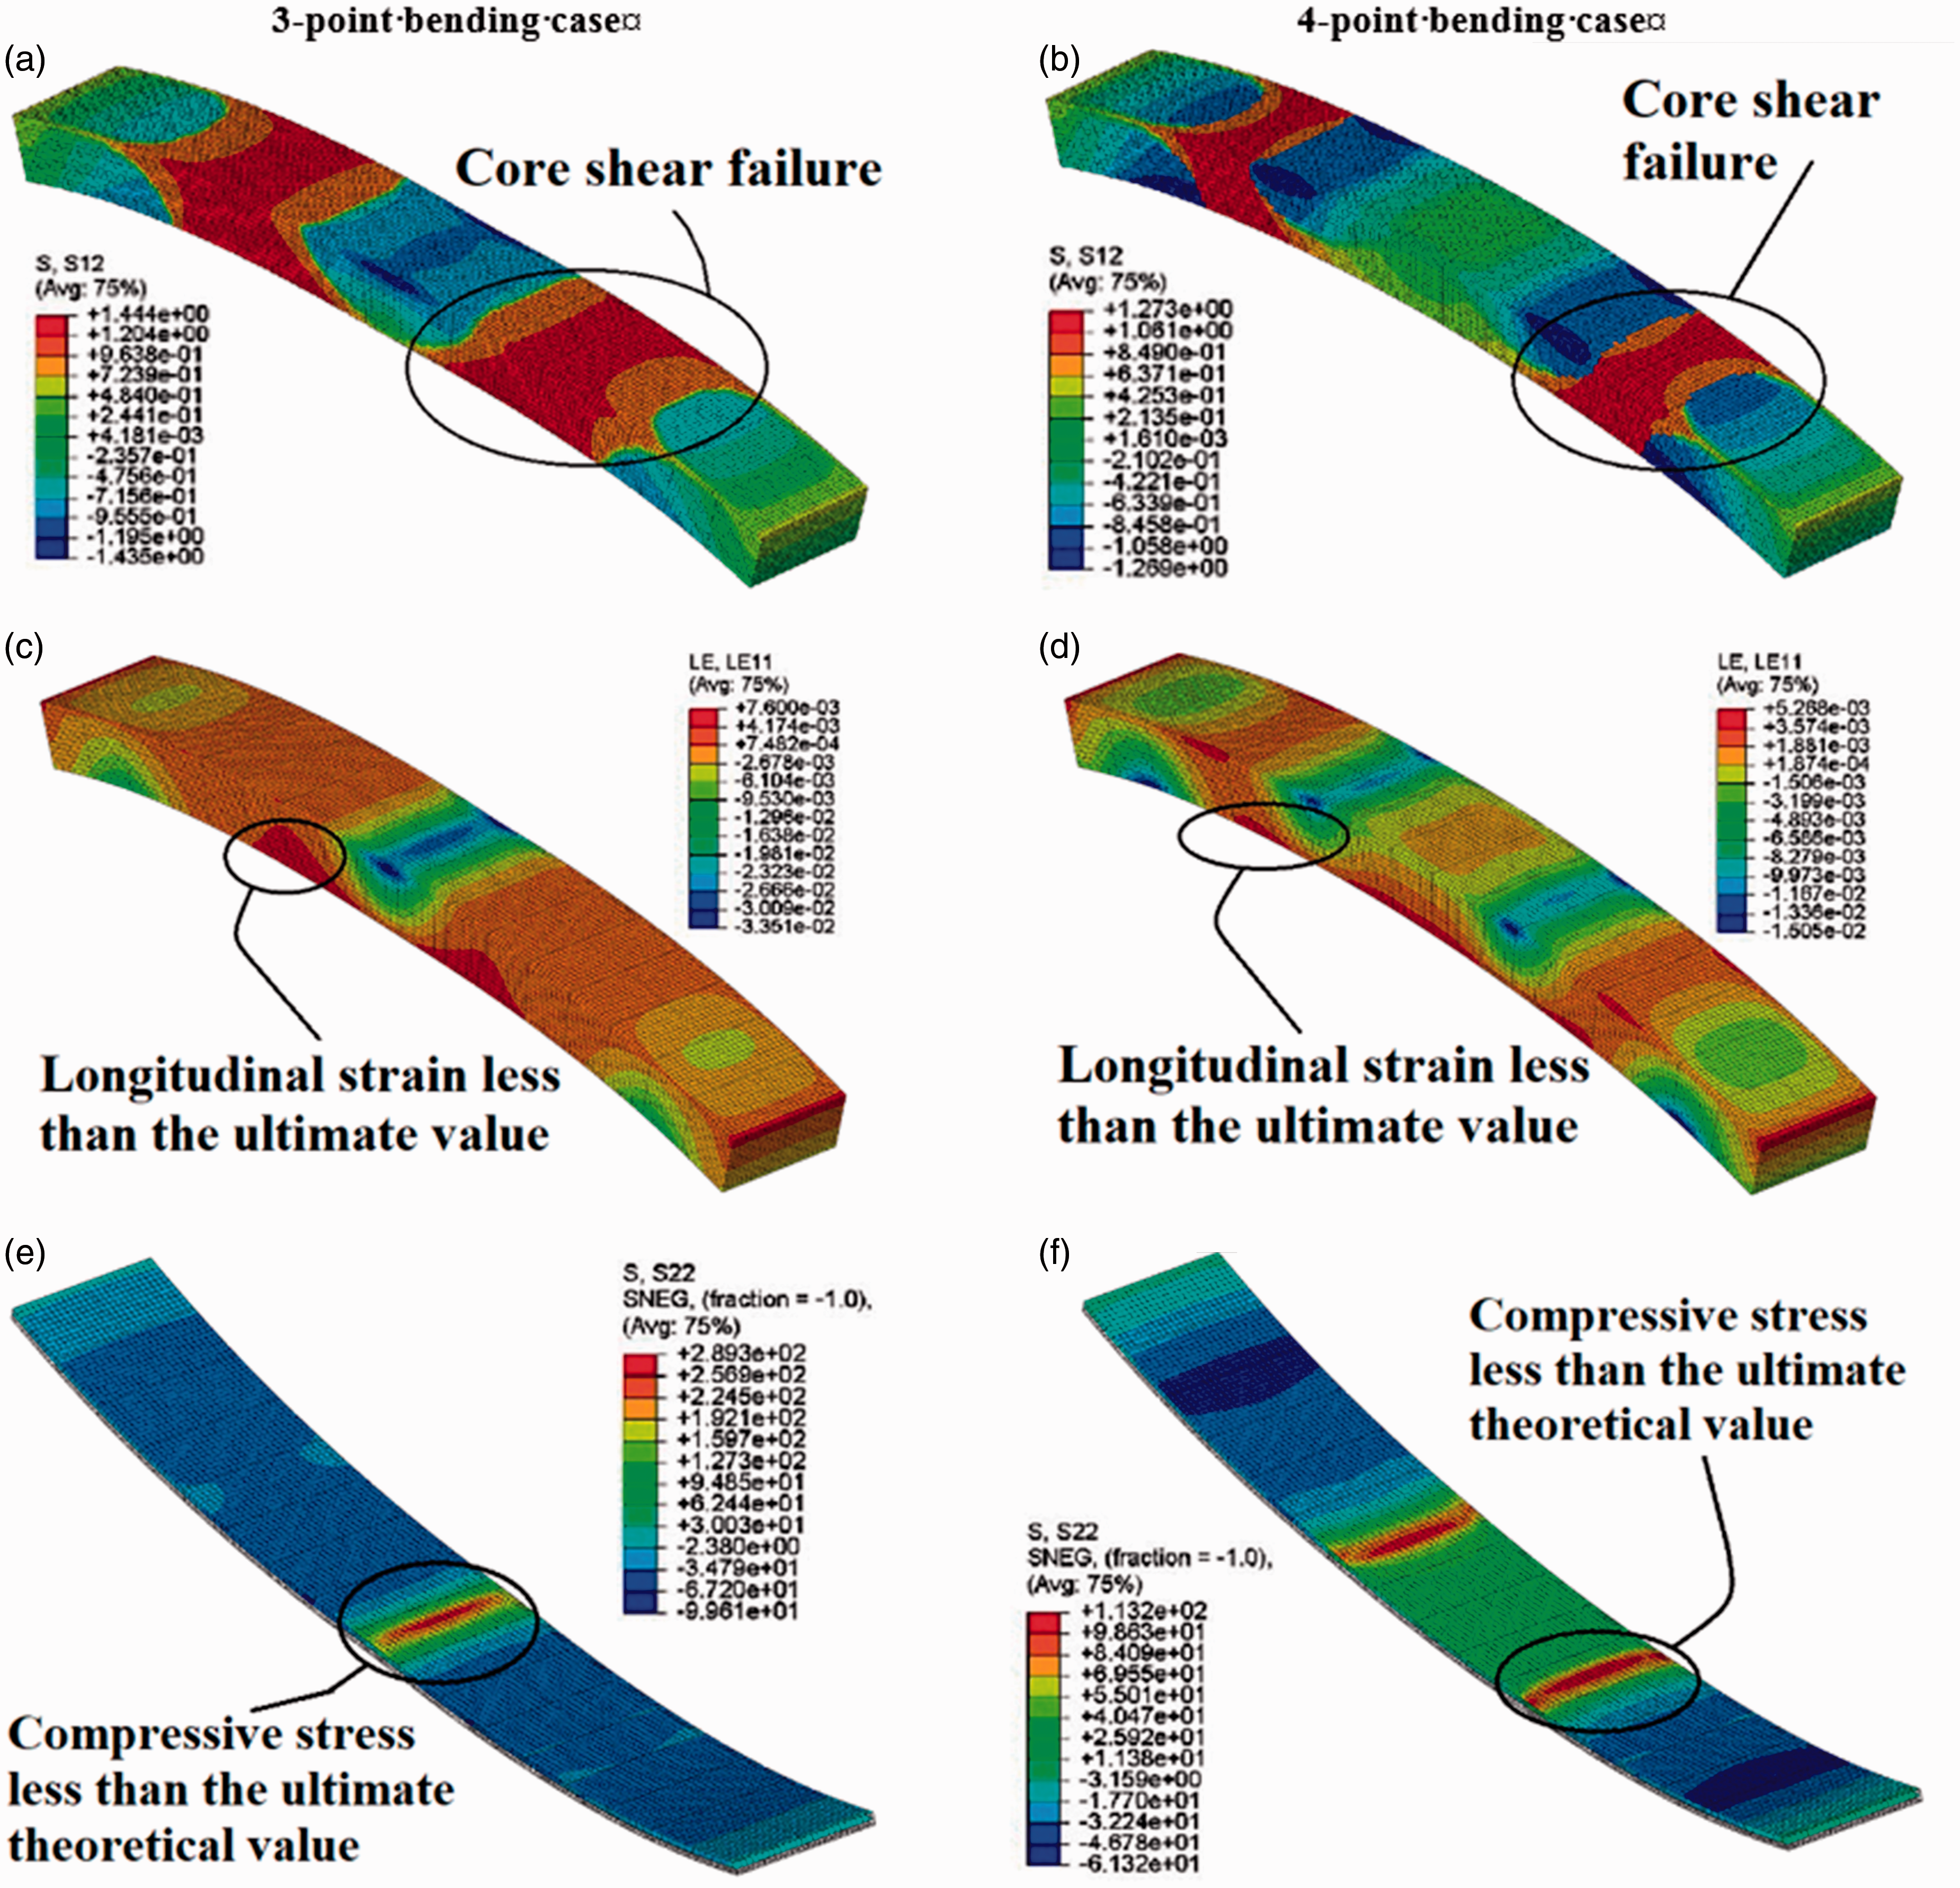
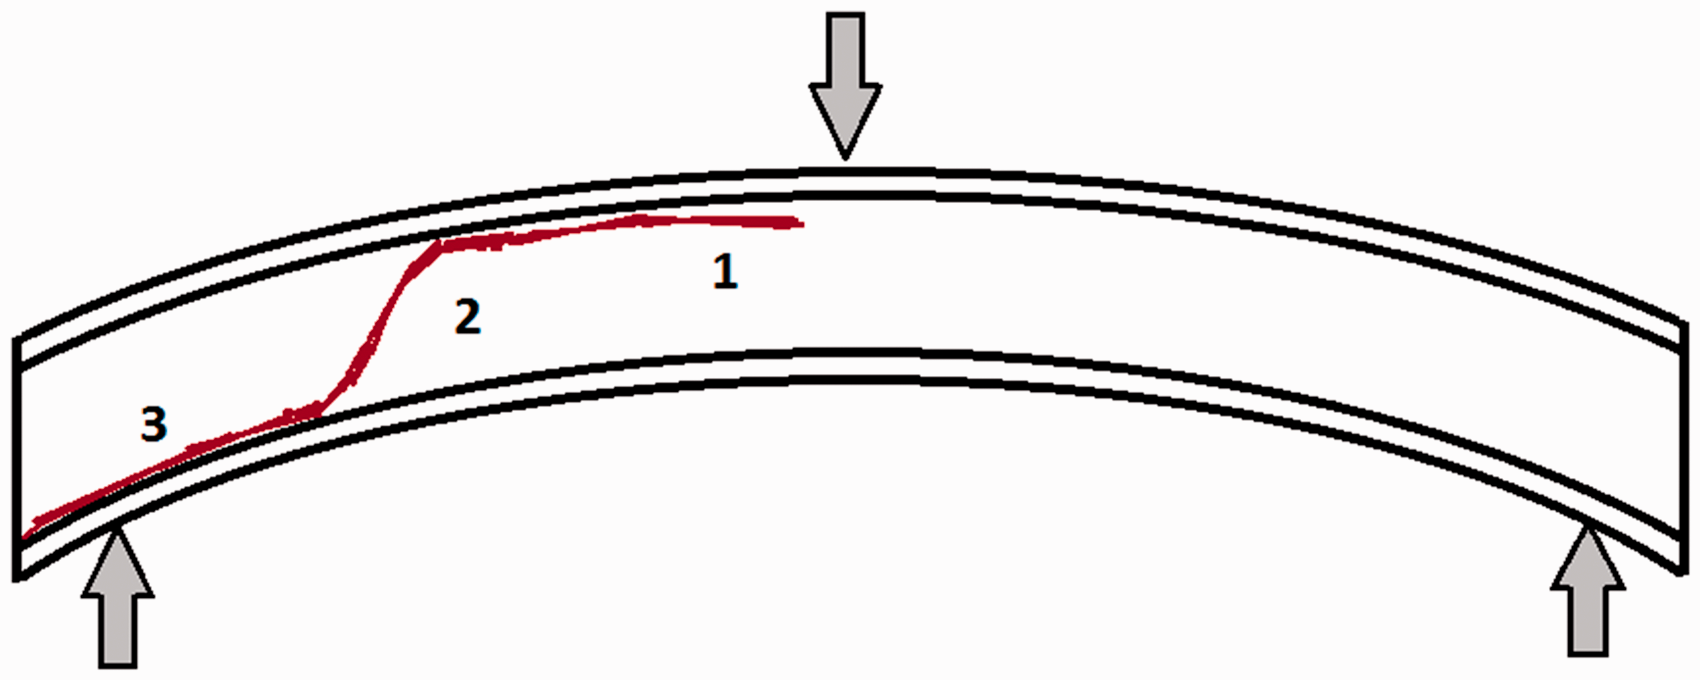
Damage event-2 was the core shear initiation. The propagated crack in event-1 kinks at a certain distance depending on the load level, and shears through the core thickness, as shown in Figure 23. The crack reaches the bottom skin–core interface at the end of this event. Damage event-3 is the continuation of the previous event. As shown in Figure 24, it follows the core shear and consists of delamination at bottom face/core interface causing the separation of the core from the face-sheet. As the core shear propagates at a faster rate, the energy at the crack tip is sufficiently high to crisscross through the sub-interface and it reaches the much stiffer face sheet where it gets deflected along the core–skin interface. This is the reason why the delamination during damage event-3 is not at the sub-interface, rather it is along the core–skin interface.
Damage event 2. Damage event 3.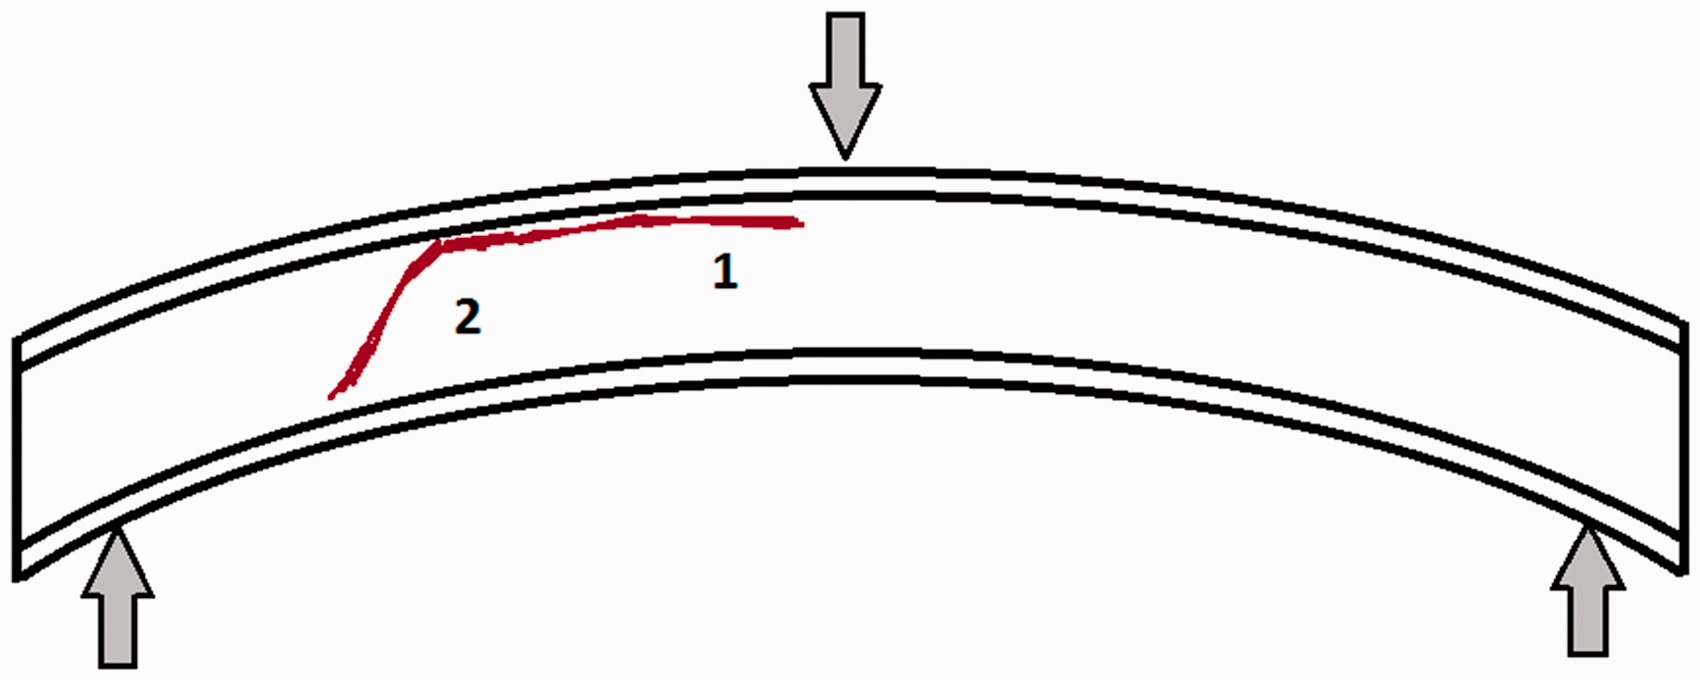
The final damage event is also a rapid event and occupies the remaining 7–8% of test time before final big crack. Finally, the specimen ultimately fails after this event and it is only the skins that must totally resist to loading until their damage initiation. The principle failure mechanisms of all specimens are shown in Figure 19. All damage events 1, 2 and 3 are predicted numerically. It can be observed that the crack in damage event-1 initiates at the sub-interface whereas for damage events-3, the delamination takes place at the face–core interface separating the core from the face-sheet (Figure 25).
Typical final break on sandwiches with PET foams.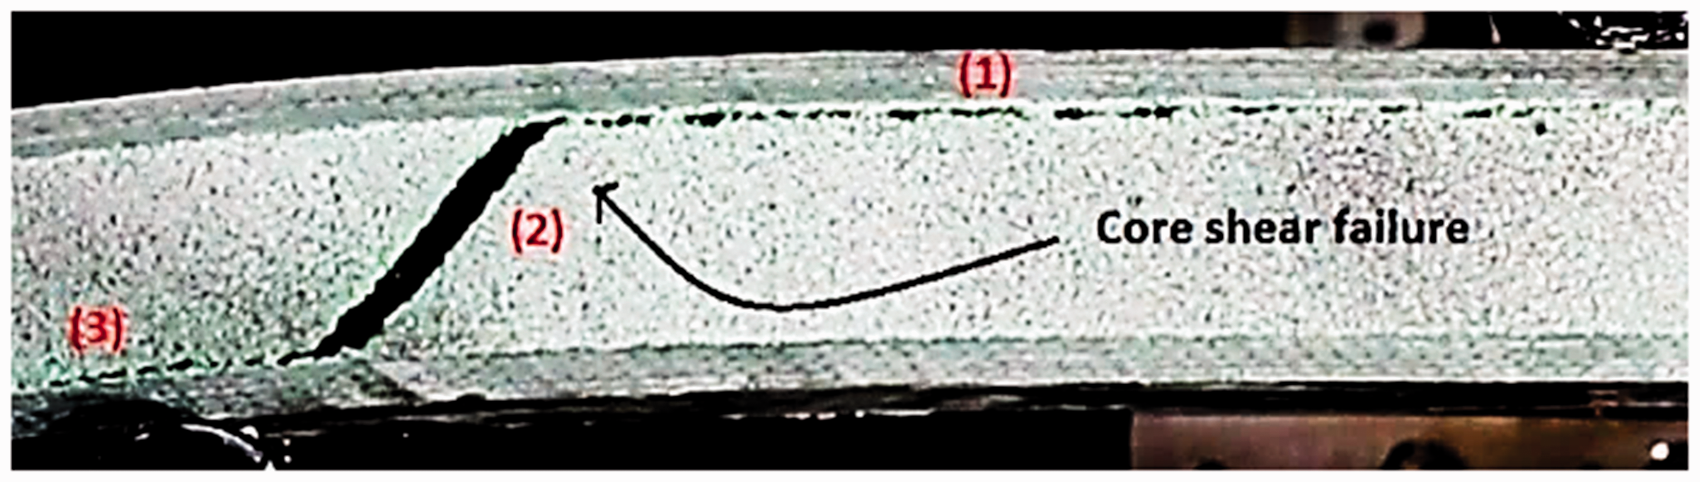
Damage mechanisms identification by AE data processing
With Acoustic Emission, you can “listen” to the sounds of cracks growing, fibers breaking, and many other modes of active damage in stressed materials. In general, the AE technique was used to discriminate the different damage mechanisms from the detected AE signals in composite materials. A study of the main parameters extracted from AE signals is increasingly used to separate and identify the sources of different mechanisms. In this context, many studies36,37 were conducted on composite materials. The damage mechanisms of sandwich materials which are very complex composite materials (two skins and core) are less investigated. Moreover, there are a few studies on the non-destructive evaluation of sandwich materials by AE technique. For example, Quispitupa et al.38,39 investigated the damage modes in sandwich composites subjected to static loading.
In relation with our approach, a detailed study was carried out on skins laminates and sandwich specimens with PET, PU and PP foams using an AE real-time monitoring system in terms of amplitude and counts, especially when the mechanical behavior of the structure varies nonlinearly, and by linear location determination modes to detect longitudinally the damage in each tested specimen. In addition, the acoustic emission analysis allows us to understand the contribution of different types of damage to the non-linear behavior.
Amplitude and cumulative counts
The acoustic emission data was analyzed using two temporal parameters of the acoustic signals: amplitude and cumulative number of counts. After multiple initial trials, these parameters have proved to allow a good repeatability of the data processing, as illustrated in Figure 8. In this way, monitoring the amplitude of the acoustic emission signals collected at each step of damage gave the results presented hereafter. The corresponding value of force of the initial observed damage is associated with an important decrease of this force. This concept is better understood by the exploitation of acoustic emission results that shows an initial cumulative number of hits detected before the decrease of the force, in four-point bending (Figure 26(a) to (t)). Compared to non-destructive testing of sandwich structures in mechanical tests, the figures shown above clearly illustrate that an acoustic activity starts well before a sudden important decrease of the elastic force limit indicating a major damage.
4-point bending study of sandwich structures by acoustic emission – amplitudes.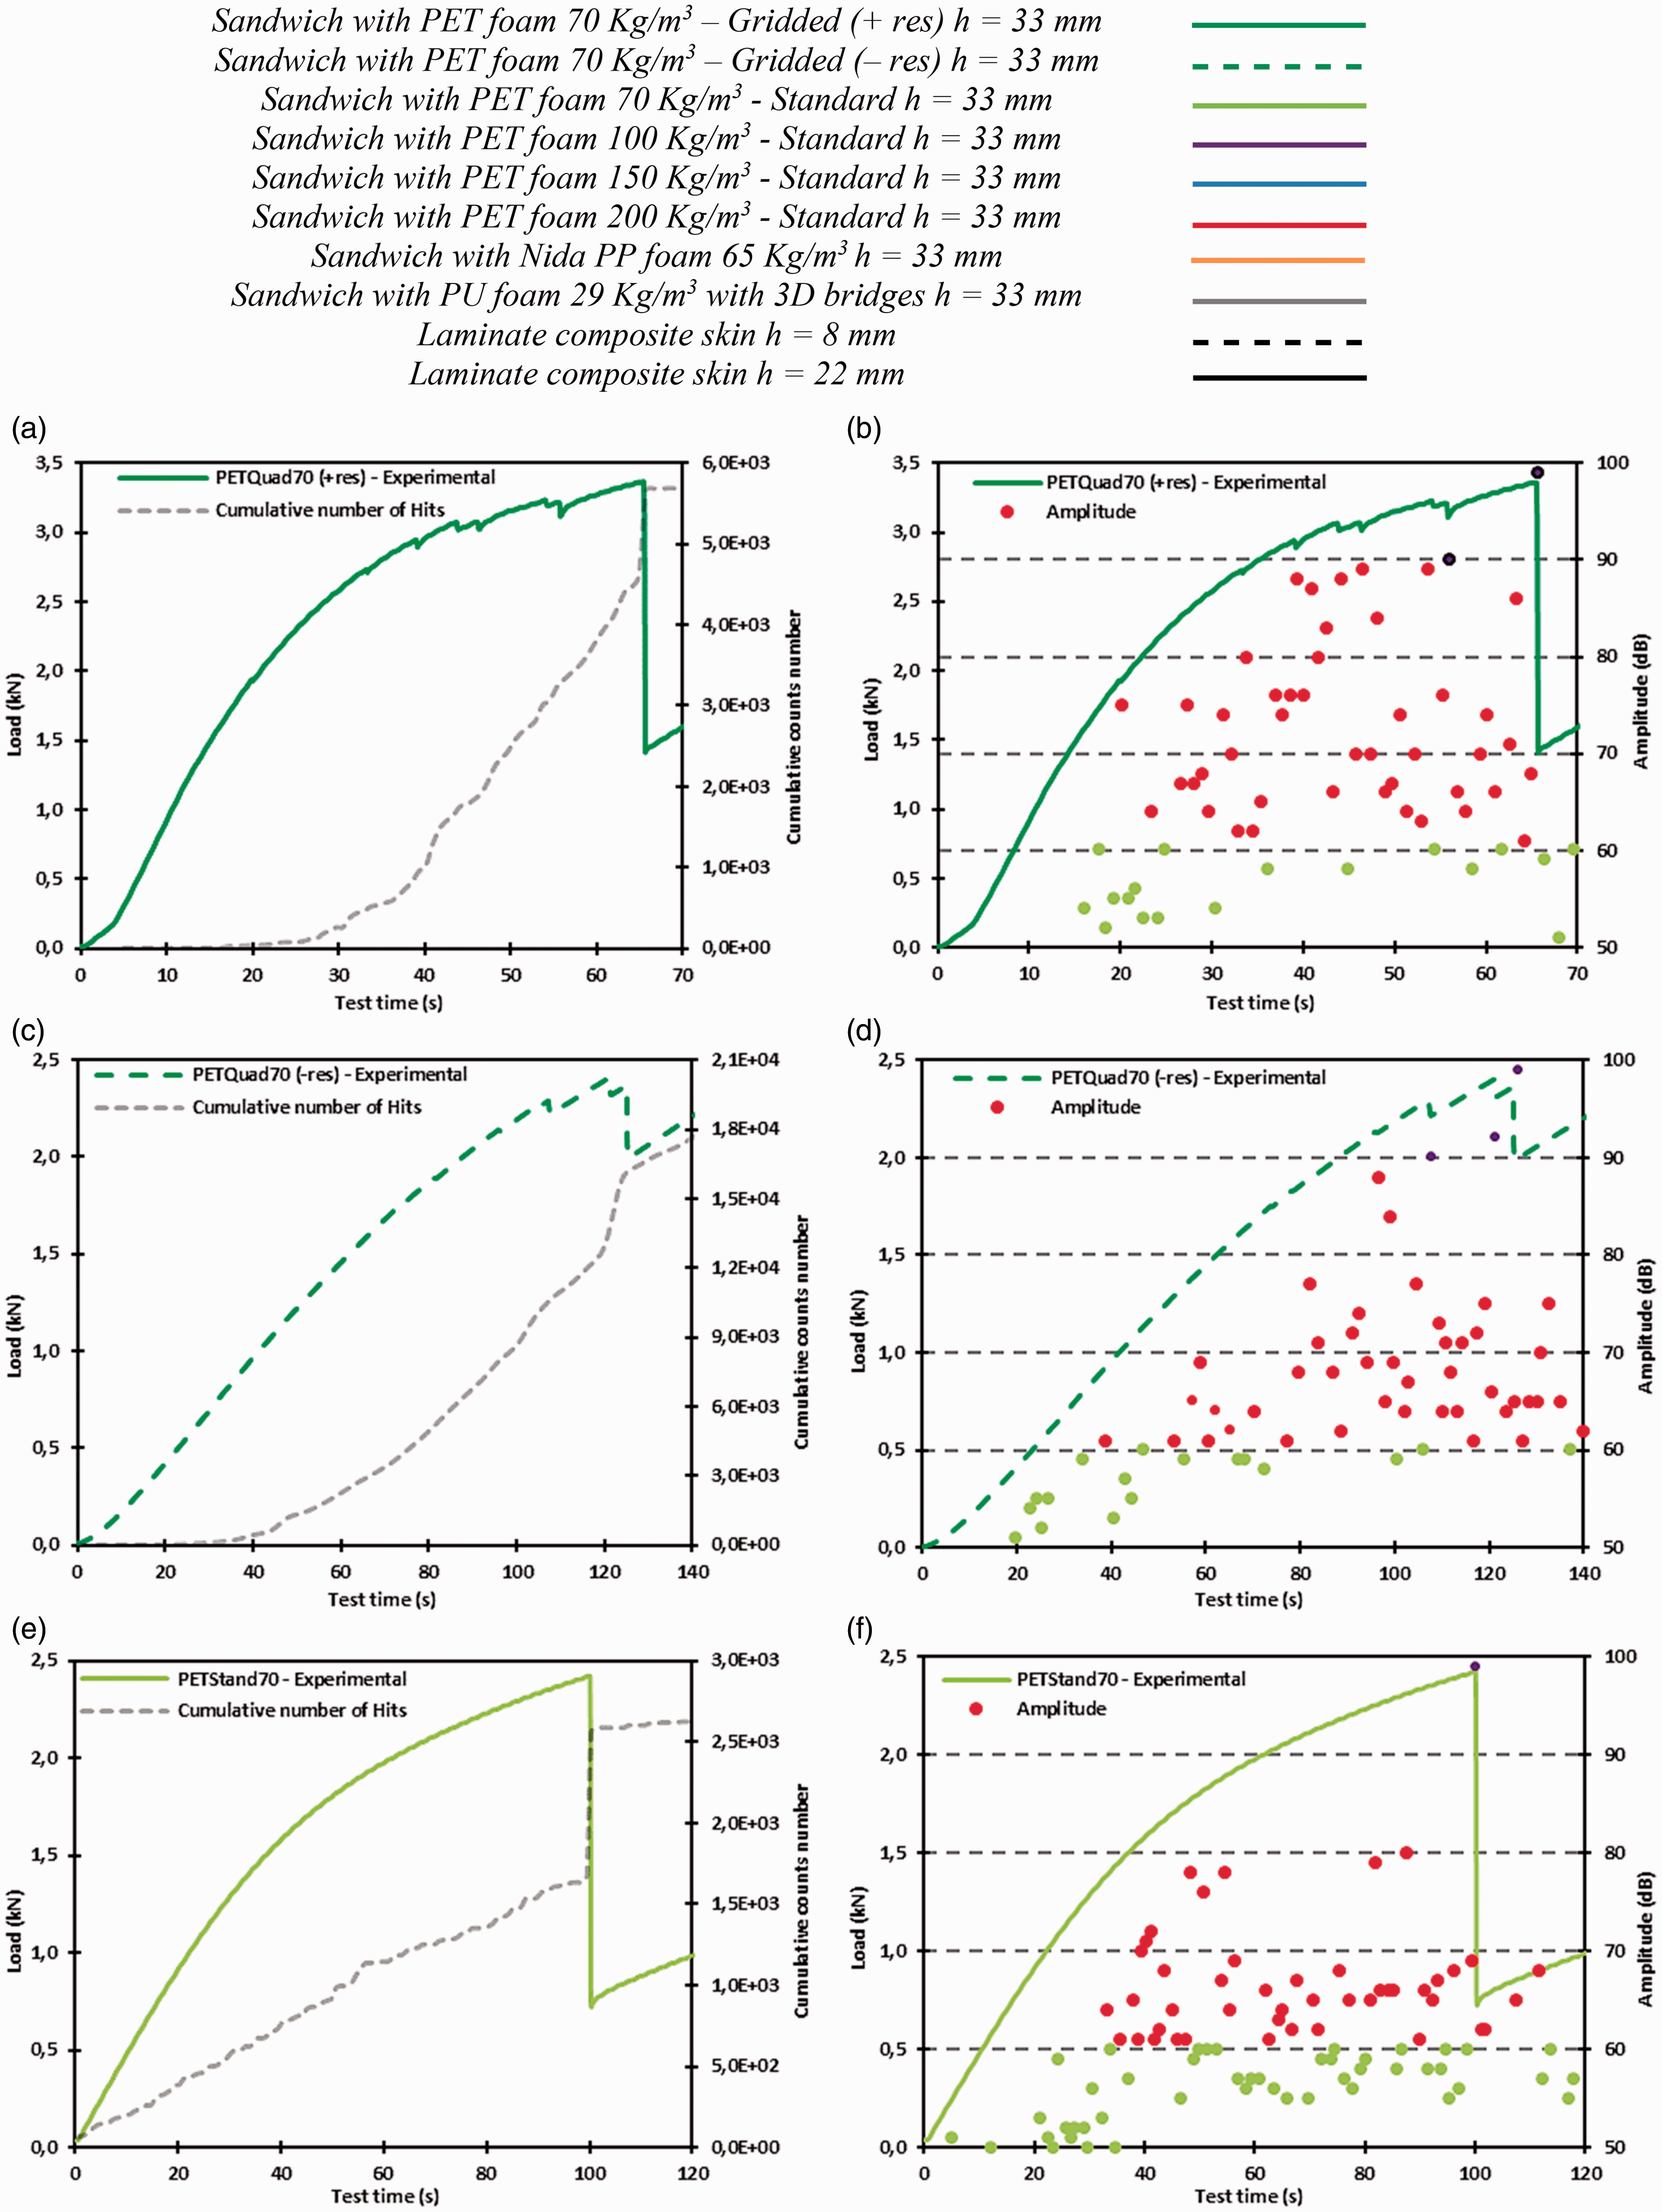
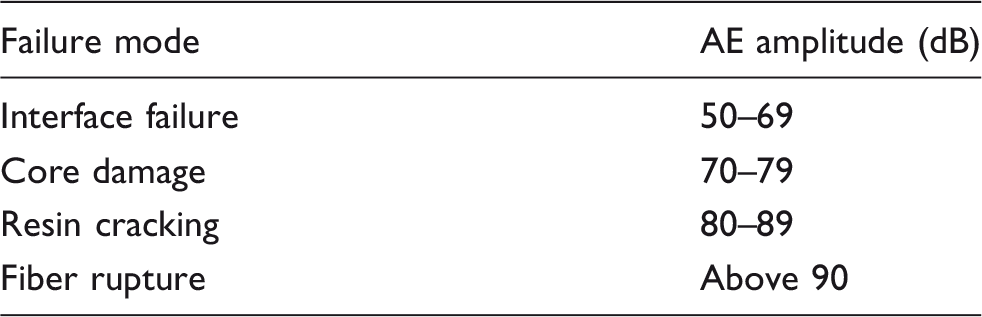
More localized damage begins and progresses during loading to a level of instability that causes the sudden crack of the foam. Through the load–amplitude plots as a function of the test time for each step of damage exposed in Figure 26, we usually notice the existence of two distinct groups of acoustic emission signals with amplitudes varying between 50–60 dB (group A in light green color) and 90–100 dB (group B in purple color). So, based on the results found in the literature, 40 the high amplitude signals correspond to fiber failure in the skin and/or local sandwich break in the foam, while those of low amplitudes are from different failures in the polymer matrix and fiber/matrix debonding in the skin. Especially for sandwiches with PET standard and gridded foams, it is noted during the tests that it always has the presence of the break mode in compression of the core comprising inter-laminar shear stress. In this case, the length of delamination was very great. This mode is illustrated mainly by the sudden increase in the curve slope of the cumulative number of hits. This is accompanied by the appearance of the amplitude ratio of more than 90 dB, colored in light purple on the corresponding curves. In the other hand, materials with PP NIDA and PU cores are characterized by a quasi-linear increase in amplitudes and cumulative number of hits, due to the nature of the constituent materials, which have mainly undergone a break mode by a successive compression of the layers. For the composite material constituting the skins, a strong acoustic activity is detected in the tests because of the matrix–fiber interaction break in the material as well as the tensile rupture of the fibers of the lower face of the specimen as well as the compression of the upper face. Therefore, the study of AE signals collected during tests made it possible to identify four damage mechanisms: the core damage followed by resin cracking, interfacial debonding and fibers breaking.
AE figures represent dynamic, transient data that is updated continuously throughout the duration of the test. Care must be exercised in interpreting AE graphical presentations. What is significant is the cumulative AE activity during various time intervals as it forms the basis for life prediction modeling. Data shown in Figure 26 (Amplitude vs Time) provides an overall AE statistics during the time; for example, concerning PET standard or gridded foam types with different densities, we can see that the core damage activity occurred 70% of the time, whereas fiber breakage consumed only about 1–3% of the typical static testing time. The load increased linearly with time then a slight decrease in stiffness was observed due to the initiation of shear cracking of the core and the foam non-linear response as well. This point is confirmed by the increase of the cumulative number of hits that changes suddenly when an internal cracking is occurred inside the specimen. The sandwich then failed when the shear cracks propagate diagonally and extend to separate the skin from the core at the interfacial surface. The correlation between the experimental tests and the AE monitoring is verified by visual observation and captured videos.
Concerning the determination of the damage initiation, the noticeable increase in the amplitude value observed on all the curves at the beginning of the initial linear part allows the verification of the beginning of the internal damage which generally occurs just at the end of the linearity. The increase in the number of hits also shows that there is an acoustic activity from the beginning of the bending test and that is correlated with the amplitude analysis and the visual observation of the tests. Especially for sandwich structures with PP Nida and PU cores, the graphs (n) and (p) in Figure 26 show a high activity of acoustic events from the beginning. This is due to the strong presence of the resin in the characteristic spacing into the PP Nida cores, and the innovative geometry of PU core with 3D glass bridges which contain the resin to reinforce the structure by connecting the two constituent facings.
Location events
In acoustic emission, the time of signals’ arrival at each sensor is a function of the source location and the propagation speed of the acoustic waves. One of the commonly used computed-source location techniques is the linear location principle shown in Figure 27. When the source is located at the midpoint, the time of arrival difference for the wave at the two sensors is zero. If the source is closer to one of the sensors, a difference in arrival times is measured. To calculate the distance of the source location from the midpoint, the arrival time is multiplied by the wave velocity. Whether the location lies to the right or left of the midpoint is determined by which sensor first records the hit. This is a linear relationship and applies to any event sources between the sensors. Because the above scenario implicitly assumes that the source is on a line passing through the two sensors, it is only valid for a linear problem.
Linear location technique by acoustic emission.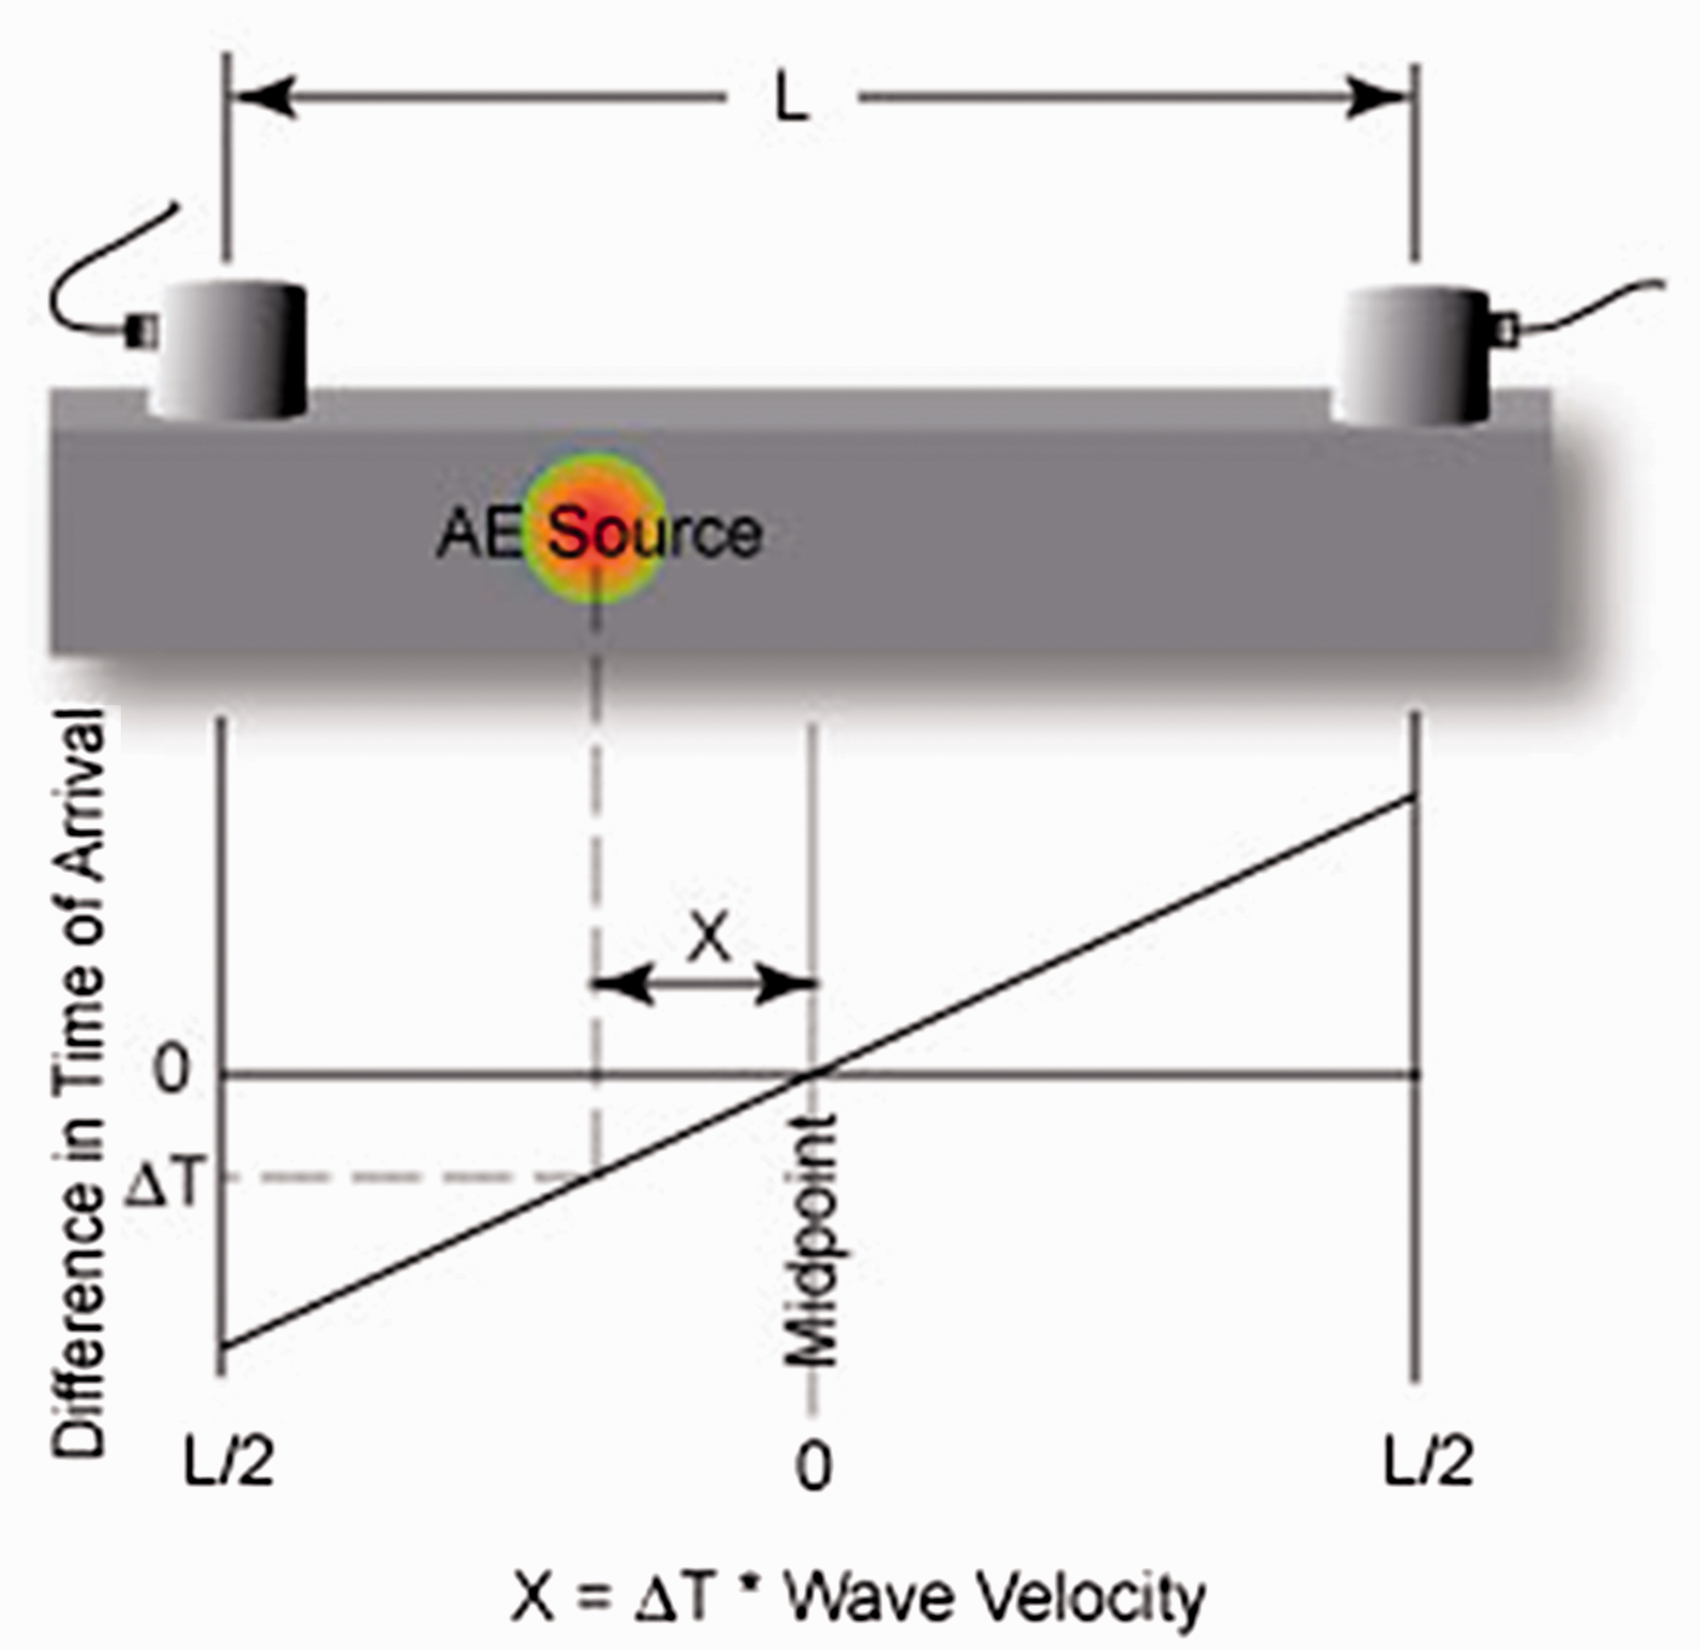
The location events issued from the acoustic emission signals, collected at each step of damage, gave the results presented hereafter (Figure 28(a) to (j)). These results confirm the previous analysis with numerical approach for damage localization. For sandwich structures with PET foams, whether the type is gridded or standard, the different observed failure modes are:
The local buckling of the upper skin that is observed for the three-point bending tests in most cases. This local buckling is sometimes replaced by a shear failure of fibers in the upper skin that spreads by delamination between the skin and the foam. For the three and four-point bending, we observe mainly a shear failure into the two types of PET foams propagating after a catastrophic delamination that occurs between the constituents of sandwich structure (skin–core interface).
Four-point bending study of sandwich structures by acoustic emission – location events.
For specimens with PP Nida and PU cores, a compressive behavior was observed throughout each type of core with a quasi-linear behavior. At the end, the two skins are tightened one against the other since the core material is completely crushed. However, the influence of the presence of the resin into gridded PET foams with a density of 70 kg/m3 (Figure 28(a)) can be noticed. This made the acoustic activity to increase due to the progressive rupture of the resin during the quasi-static bending test, which is also explained by the presence of the grids and therefore the geometric discontinuity in the structural sandwich material. When these grids are less open as shown in Figure 28(b), we notice that the acoustic activity has decreased and the rupture has become more localized compared to the other case where the grids were more open, and therefore we had more resin absorption and a quasi-random fracture.
The sudden break occurs as a function of the density of the core in the studied sandwich structure. In fact, for sandwiches with standard PET foams ranging from 70 to 200 kg/m3, the damage became more localized when the density increased due to having more closed cells and therefore a more solid material. For sandwiches with Nida PP foams and sandwiches with PU foams, damage is visible throughout the whole structure almost equally as well as for laminate composites of different thicknesses. This is due to the rigidity of the studied material and its several constituents which disperse the energy throughout the specimen.
Sequence of failure in sandwich composites with corresponding amplitude.
A high level of AE activity related to distinct crack initiation sites in the core and the interface near supports during the initial stages of the test was observed probably due to energy dispersion as a result of multiple crack initiation and propagation sites. Both opening and shearing modes were observed; however, sudden failure consistently occurred under the second mode (shearing). Substantial crack growth activity was observed in shearing rupture that propagated near the interface between the face-sheets and the core which led to weakening of the two-phase action and subsequent cracking of the face-sheets (Table 5). Somewhat similar failure sequence has been reported in the literature21,22,27,28 for flexural tests on flat sandwich composites; however, unlike the reported results, significant fiber rupture never took place until sudden failure in the current study, as evidenced by AE analysis.
AE activity tended to be high as the stress levels were enhanced. However, almost independent of the stress levels, AE analysis consistently indicated core crushing (localized within a 5 mm radial zone near the point of application of the load), core tearing and core shear failure near the interface with the face-sheets.
Conclusion
This paper deals with a complete mechanical characterization of PET, PU, PP foams/glass fiber composite sandwich structures by means of an extended theoretical, experimental and numerical analysis. Basically, the mechanical behavior of these structures was investigated under three- and four-point bending tests in conjunction with the Acoustic Emission technique (AE). The overall performance of sandwich structures depends clearly on the material properties of the constituents (facings, adhesive and core), geometric dimensions and type of loading. Sandwich beams under general bending, shear and in-plane loading display various failure modes. Failure modes and their initiation can be predicted by conducting a thorough stress analysis and applying appropriate failure criteria in the critical regions of the beam including three-dimensional effects. This analysis is difficult because of the nonlinear and inelastic behavior of the constituent materials and the complex interactions of failure modes. For this reason, properly designed and carefully conducted experiments are important in elucidating the physical phenomena and helping the analysis. It must be emphasized that the key contribution of this paper is to distinguish the sandwich core having a good compromise concerning its mechanical behavior and which will subsequently be used in the manufacture of the final product that meets the needs of the industrial partners. A study of the main performance of the sandwich composites under investigation was depicted by considering multiple variables such as the material properties of the constituents, geometry and loading condition. The following conclusions could be drawn from the study. The experimental stress–strain curves showed an initial linear elastic behavior with a decrease in the slope prior to fracture. The specimens with PET foams with several densities failed due to shear failure of the core accompanied with skin–core delamination at the constant shear region. For specimens with PU and PP cores, there was mainly a quasi-static compression of the both types of cores since the corresponding material differs from that of PET foams. The theoretical analysis reasonably predicted bending stiffness of flat structures, but could not achieve good correlation with the behavior of curved ones. After this first study, the PET foam begins to show good performance compared to other candidate sandwich cores. As the mechanical behavior was described in detail, the FE predictions had good correlation with experimental results up to the elastic limit. To continue with, the results were presented by images of experimental configuration tests and corresponding plots of the distributions of the mechanical and acoustic parameters under study. The AE was used principally to confirm the correlation between damage mechanisms and acoustic emission classes. This study brought interesting considerations regarding the non-linear behavior of PET, PU and PP composite sandwich structures and how the first crack failure occurs for these different curved sandwich composites manufactured by the filament winding process. It should be emphasized that this manufacturing process has a significant influence on the mechanical properties of the core, especially for PET foams with/without grids, due to the presence of a certain quantity of absorbed resin or cast into the gaps, and can remain in foams depending on the nature of manufacturing. In fact, the inherent problem with the core–laminate interface consists on the consumption of this additional resin due to the porosity of the core surface or the cavities created during the forming process. Minimizing the resin consumption is a priority in any design to reduce weight and cost and therefore consideration of the formability and processing techniques are a critical part of the design process. However, the variability of observed results concerning the crack of the specimens is important. This is mainly due to local variations in the properties of each type of structure.
Finally, it is deduced that the PET core with an average density between 100 and 150 kg/m3 is the best solution to be wound on a mandrel and thus to sustain the bending loads during the life cycle of the cylindrical tank. In terms of research and development, a variability approach seems to be essential to better understand the failure initiation of tested specimens. It is obvious from the conclusions that there is an emergent need towards the development of a theoretical model which could represent the curved materials and justify the nonlinear behavior, as well as the development of the numerical model to be able to investigate mechanical properties that cannot be determined experimentally.
Declaration of Conflicting Interests
The author(s) declared no potential conflicts of interest with respect to the research, authorship, and/or publication of this article.
Funding
The author(s) disclosed receipt of the following financial support for the research, authorship, and/or publication of this article: We thank the technicians of “Arts et Métiers ParisTech – CER Angers” who support all the projects of our research laboratory LAMPA and all our partners of FUI Project “SOLLICITERN” for their financial support and assistance during the study, particularly regarding the manufacture of the test specimens.
Highlights
Design and study of a manufacturing Experimental A predictive model to get mechanical The acoustic emission monitoring leads to Influence of resin presence on sandwich stiffness made by