
Abstract
Liquid composite molding has been developed as a high-speed process for manufacturing automotive lightweight parts using new equipment that applies a high pressure for mixing and injection. One of the technical issues is the deformation of fiber preform during the process, which causes defects in the size, mechanical properties and appearance of the final products. In this study, two types of deformation in unidirectional fiber preform during the mold filling process are investigated, which are rigid body deformation and local deformation. Three important forces, namely friction, in-mold stiffness of fiber preform and resin flow, are measured to investigate the mechanism of the fiber deformation. The magnitude of the forces was compared at an instant, which influenced the types of fiber deformation. The effects of the orientation angle and the volume fraction of fiber preform and flow rate were investigated to identify controllable factors to prevent undesired deformation during the process.
Introduction
Carbon fiber reinforced composites have been one of the most promising lightweight materials with superior mechanical properties, which can satisfy strong requirements from the automotive industry for improving fuel efficiency by applying lightweight parts. The automotive industry requires the mass production of composite parts, for which cost reduction and a fast speed for the manufacturing process are mandatory.1,2 In addition to many efforts to reduce the material cost of the carbon fiber and the matrix resin, development of the optimum process for manufacturing composites has been promoted. For example, a high-pressure resin transfer molding (HP-RTM) process has been applied to the mass production of carbon fiber reinforced composite automotive parts in some of the companies.3,4
Advanced equipment for manufacturing composite parts by the liquid molding process have been developed, in which high pressure is often applied for efficient mixing and fast injection of resin into the mold. Several engineering issues in the liquid molding process with high pressure should be solved for successful production of composite parts with high quality. One of the remaining technical issues in RTM is the deformation of the fiber preform during the manufacturing process, which causes defects in size, mechanical properties and appearance of the final composite products.5–7 Therefore, the factors that cause the deformation of the fiber preform should be strictly controlled in order to increase the yield of the composite process. There are two important processes related to the fiber deformation, which are the preforming process of fiber and mold-filling process of resin. In the preforming process, fiber mats form their shapes along the mold surface by pressing force from the upper mold. Several important changes in the local orientation, the volume fraction and the permeability of the fiber preform are observed to occur by compaction, a nesting effect in the preforming process.8–12 Deformation in this stage can be predicted by a draping simulation of the fiber preform with the properly measured data in shear and tensile tests.13–16 During the molding filling process, fiber preforms are impregnated by pressure-driven resin flows and the numerical simulation of the flow through the porous media can predict the development of flow and the pressure distribution during the process.17–19 However, the flow analysis is generally based on the stationary fiber preform without flow-induced deformation, which cannot describe the real flow with the fiber deformation and the flow-induced deformation of fiber preform. Several numerical studies investigated the effect of the deformed fiber preform on flow behavior in RTM or compression RTM process, in which mechanism of fiber deformation by resin flow itself was not strictly considered.20–22 Another important factor is the flow-induced residual stress and deformations. Namely, the local coefficient of thermal expansion depends on the local fiber volume fraction which generates local stress during the process and the “corner thickening” effect due to the fiber bridging caused by the non-uniform flow pressure. 23
In this paper, we will investigate the types of fiber deformation and the corresponding mechanisms in the mold-filling stage. Various types of deformation in fiber preform, such as slip and wrinkle, were observed by changing both structure and process-related factors, and they were classified to two types of deformation modes. The first one is a rigid-body deformation, which describes the movement of the fiber preform without changes in size and shape, and the second one is the local deformation, which includes changes in size and shape of the total fiber preform. The representative example of the former is slipping of fiber preform along the mold surface, and the latter is wrinkling occurring at certain areas of fiber mat.
Theory
The related forces during the mold-filling process were investigated to identify the mechanism of each deformation type. Figure 1 shows the schematic diagram of the related forces during resin impregnation during liquid composite molding process. Fiber preform with the multi-stacked fiber layers are placed between upper and bottom molds, through which resin impregnates by injection pressure. Main driving force to push fiber preform in liquid composite molding is flow force of resin, which is calculated by multiplying the measured pressure and cross-sectional area of fiber preform. The first resisting force to fiber deformation by the flow force is friction between fiber and mold, which is calculated by multiplication of normal force (N) and friction coefficient. To define the instant friction force during resin impregnation into the fiber preform, two types of friction coefficient are necessary. Coulomb friction coefficient (μd) is used in the unfilled (dry) region and hydrodynamic friction coefficient (μw) is used in the filled (wet) region. Hydrodynamic friction coefficient is defined as a function of Hersey number (H), as shown in equation (1), where ηR is viscosity of resin, U is moving velocity and N is normal force onto the fiber preform.
24
Hersey number is generally used for describing friction of lubricant film with two-dimensional geometry, which can also be applied to describe two-dimensional fabric filled with liquid resin. At high Hersey number usually means a relative thick lubricant film, whereas a small number results in a very thin film
25
Schematic diagram of the related forces during resin impregnation in liquid composite molding process.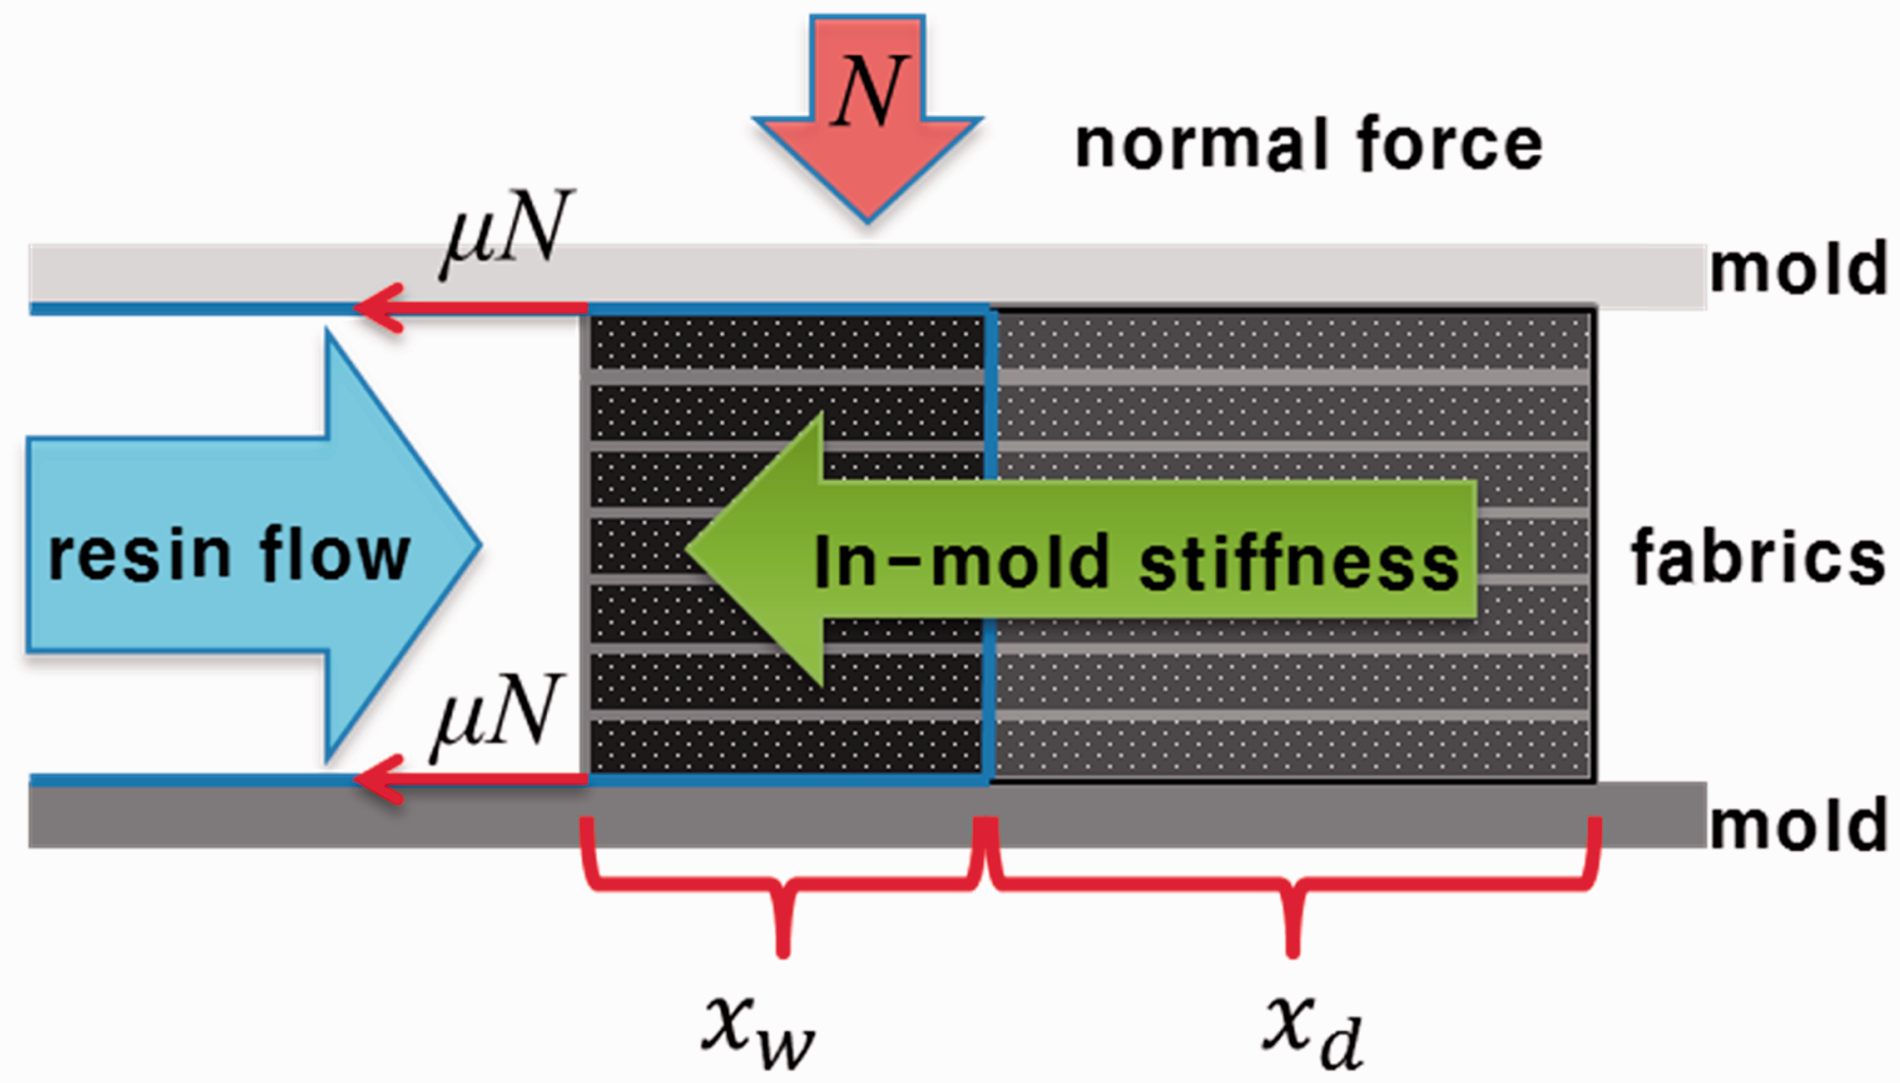

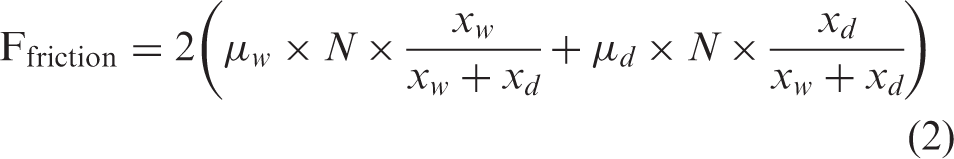
The resultant friction force (Ffriction) between the fiber preform and the mold at the specific time is estimated by applying rule of mixture on friction coefficient and the corresponding areas of the unfilled and filled regions, as shown in equation (2)
The fiber preform is generally not a rigid body but an easily deformable material. In this study, stiffness of fiber preform placed in the mold is defined as in-mold stiffness, which is closely related to local deformation of fiber preform. Resisting forces by the in-mold stiffness can be regarded by “preform buckling force,” which is the force required to cause buckling or wrinkling of the fiber preform. The in-mold stiffness of fiber preform is a so-called compressive modulus, which is derived from compressive stress–strain curve in the mold. For this curve, the mold for liquid composite molding process was slightly modified to mount the universal test machine (UTM) that will be described in the experimental section.
The basic assumption in this study is that deformation of the fiber preform is determined by comparing the magnitude of acting forces to the fiber preform. For example, rigid body deformation such as slip of fiber preform along the mold surface can occur if flow force is larger than the total friction force between fiber and mold. Local deformation can occur if flow force is larger than force by in-mold stiffness even though it is smaller than total friction force. The experimental setup for measuring the three main forces, which are friction, in-mold stiffness and flow force, are prepared, and the forces are measured and compared to verify the relation of fiber deformation and balance between the related forces.
Experiments
Measurement of friction coefficient
Equipment for measuring Coulomb and hydrodynamic friction coefficients was prepared as shown in Figure 2, which was composed of such elements as a measuring frame for the friction force, a pneumatic cylinder for generating the normal force and a step motor controlling the horizontal motion of fiber preform.
26
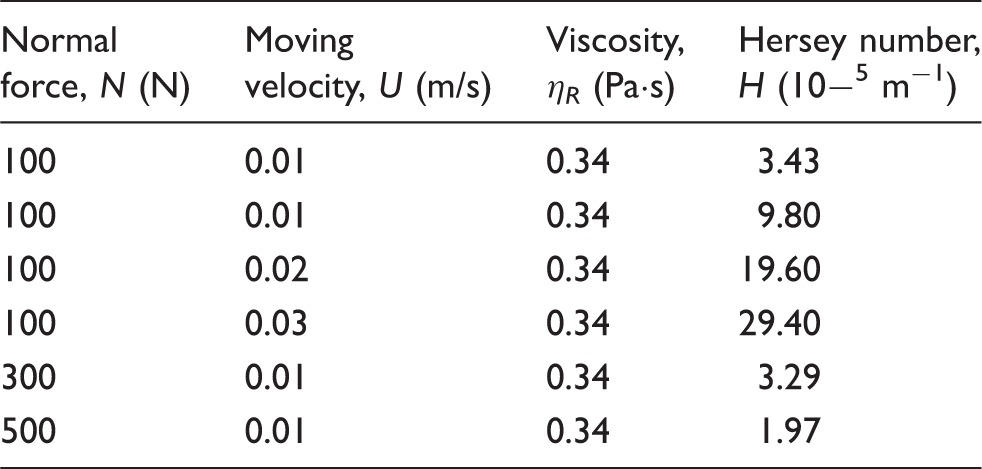
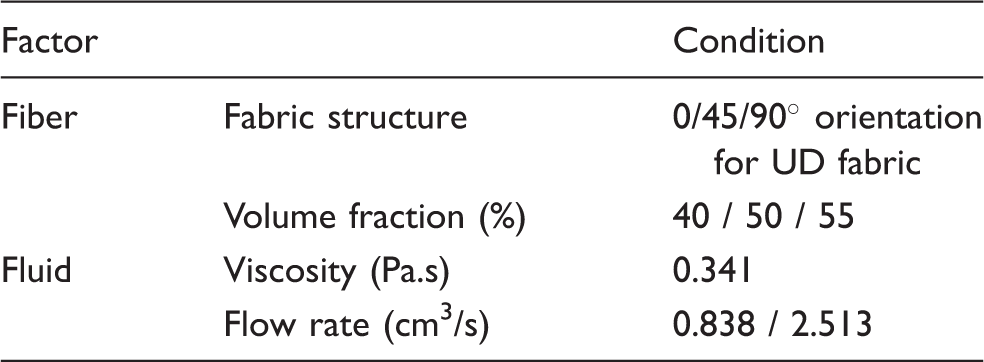
Unidirectional (UD) carbon fabric from Zoltek (PANEX 35 50K UD150) was used for reinforcement, and silicon oil from Shinetsu (KF-96H-350CS) was used for matrix fluid. Coulomb friction coefficients of dry fabric were measured by applying three types of normal forces, 100 N, 300 N and 500 N at a moving speed of 0.01 m/s. Hydrodynamic friction coefficients of wet fabric at several Hersey numbers were investigated by combining several measurement conditions (normal force, viscosity and moving speed), which is represented in Table 1. All measurements were conducted with respect to the orientation angle (0°, 45°, 90°) of UD fabric.
Schematic diagram of equipment for measuring Coulomb and hydrodynamic friction coefficients. Test conditions for measuring hydrodynamic friction coefficient and the corresponding Hersey numbers.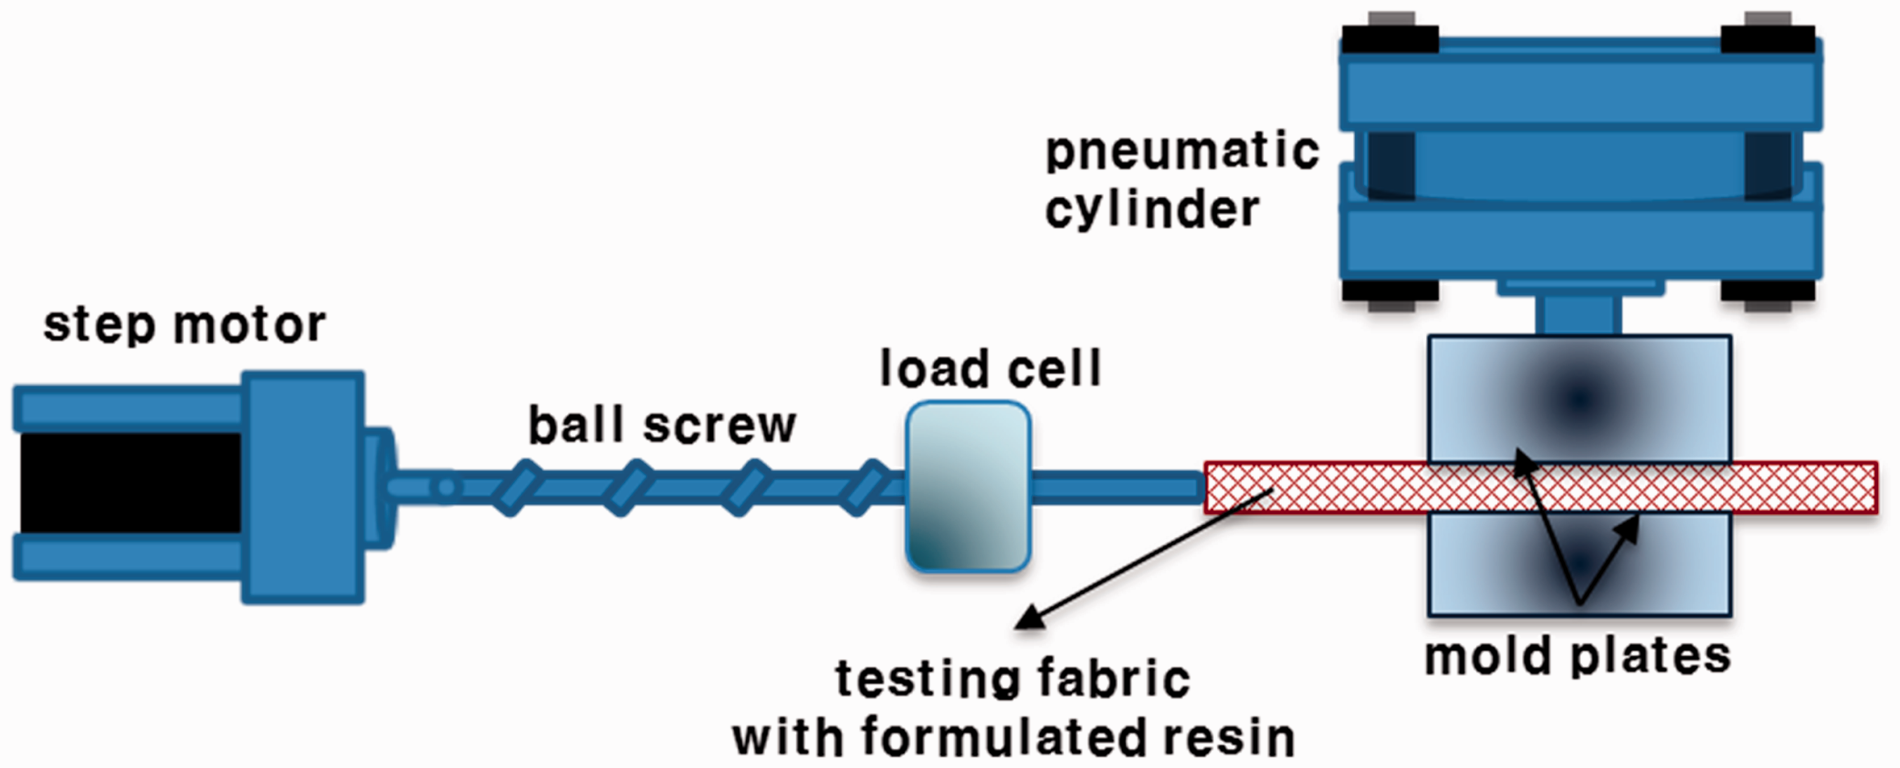
Measurement of in-mold stiffness
The experimental setup for measuring the in-mold stiffness of fiber preform is shown in Figure 3, which was composed of a mold unit and the UTM to apply strain and measure stress in the fiber preform. The mold has the same geometrical structure as that of the liquid composite molding experiment, except the injection gate of resin. Solid block attached to the UTM is used to push fiber preform, which is the same role as resin flow in the liquid composite molding process. Compressive force is measured in the UTM while the solid block is moving at an imposed speed equivalent to average fluid velocity in an open area before the preform. Test conditions for measuring in-mold stiffness of fiber preform are summarized in Table 2, which will be used for liquid composite molding experiment.
Experimental setup for measuring in-mold stiffness of fiber preform. Test condition for measuring the in-mold stiffness and the flow induced deformation of fiber preform. UD: unidirectional.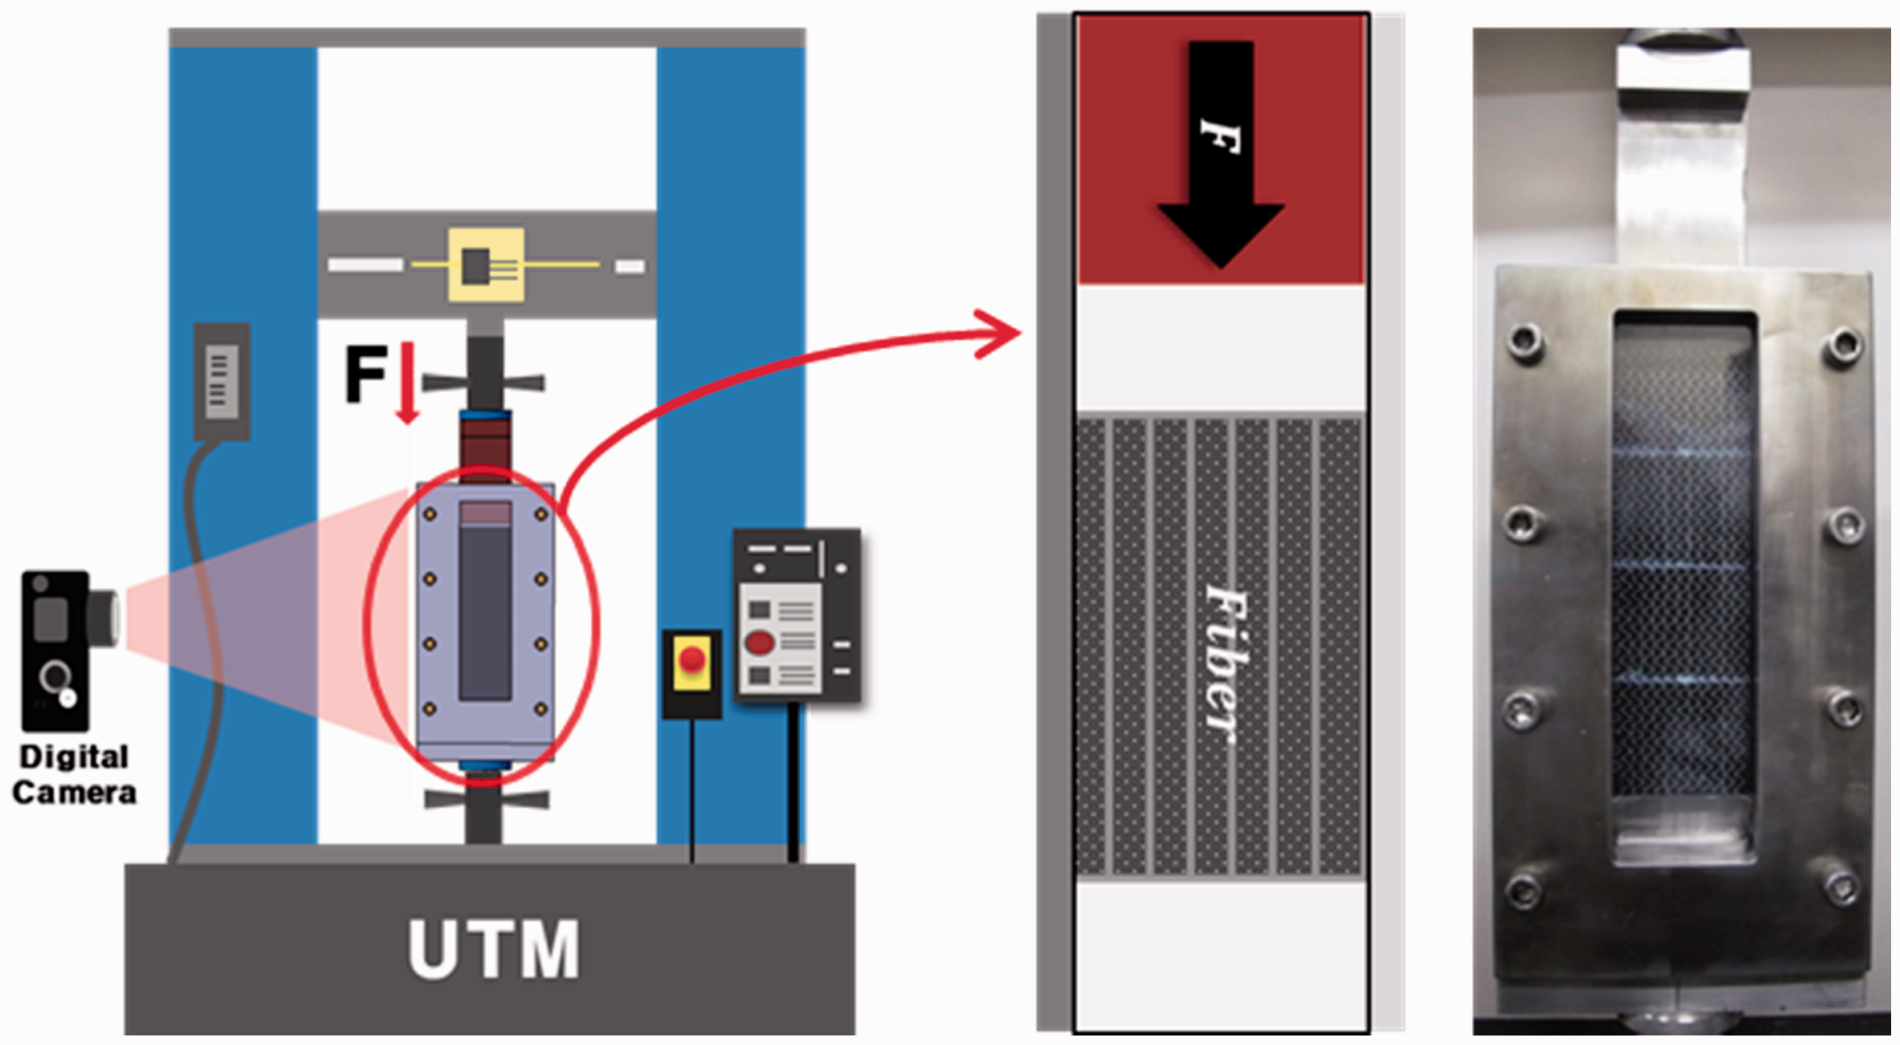
Observation of flow-induced fiber deformation in liquid composite molding
The measurement system for observing the flow-induced deformation of fiber preform in liquid composite molding was equipped as shown in Figure 4. This system is based on UD RTM equipment with a constant flow rate condition and has transparent mold sides with the tempered glass from top and lateral directions, which makes it possible to observe flow front advancement and deformation of fiber preform.
26
The use of tempered glass with the thickness of 38 mm was enough to prevent the flow-induced stress and deflection of the mold. Vacuum grease was painted at the edge area of fiber preform to prevent the race tracking. The position of the flow front and the pressure at the starting point of fiber preform were measured as the flow advanced. Three lines were marked along the width direction of each fiber preform to trace the deformation of four local points, including the edge of fiber preform. This deformation can be determined by plotting and comparing displacement of four positions whether the type of deformation is local or rigid body deformation. At a certain instant, the flow-induced force is calculated by multiplying the measured pressure to cross-sectional area of mold cavity, and the position of flow front is used to divide wet and dry area of fiber preform, which is used for calculating total friction coefficient between fiber preform and mold during the filling process. Several conditions on the orientation angle, the volume fraction of the fiber preform and the flow rate of the fluid were tested, which is equivalent to measurement of in-mold stiffness, as shown in Table 2.
Schematic diagram of equipment for measuring flow induced deformation of fiber preform in liquid composite molding. (a) overall equipment and (b) inside of mold.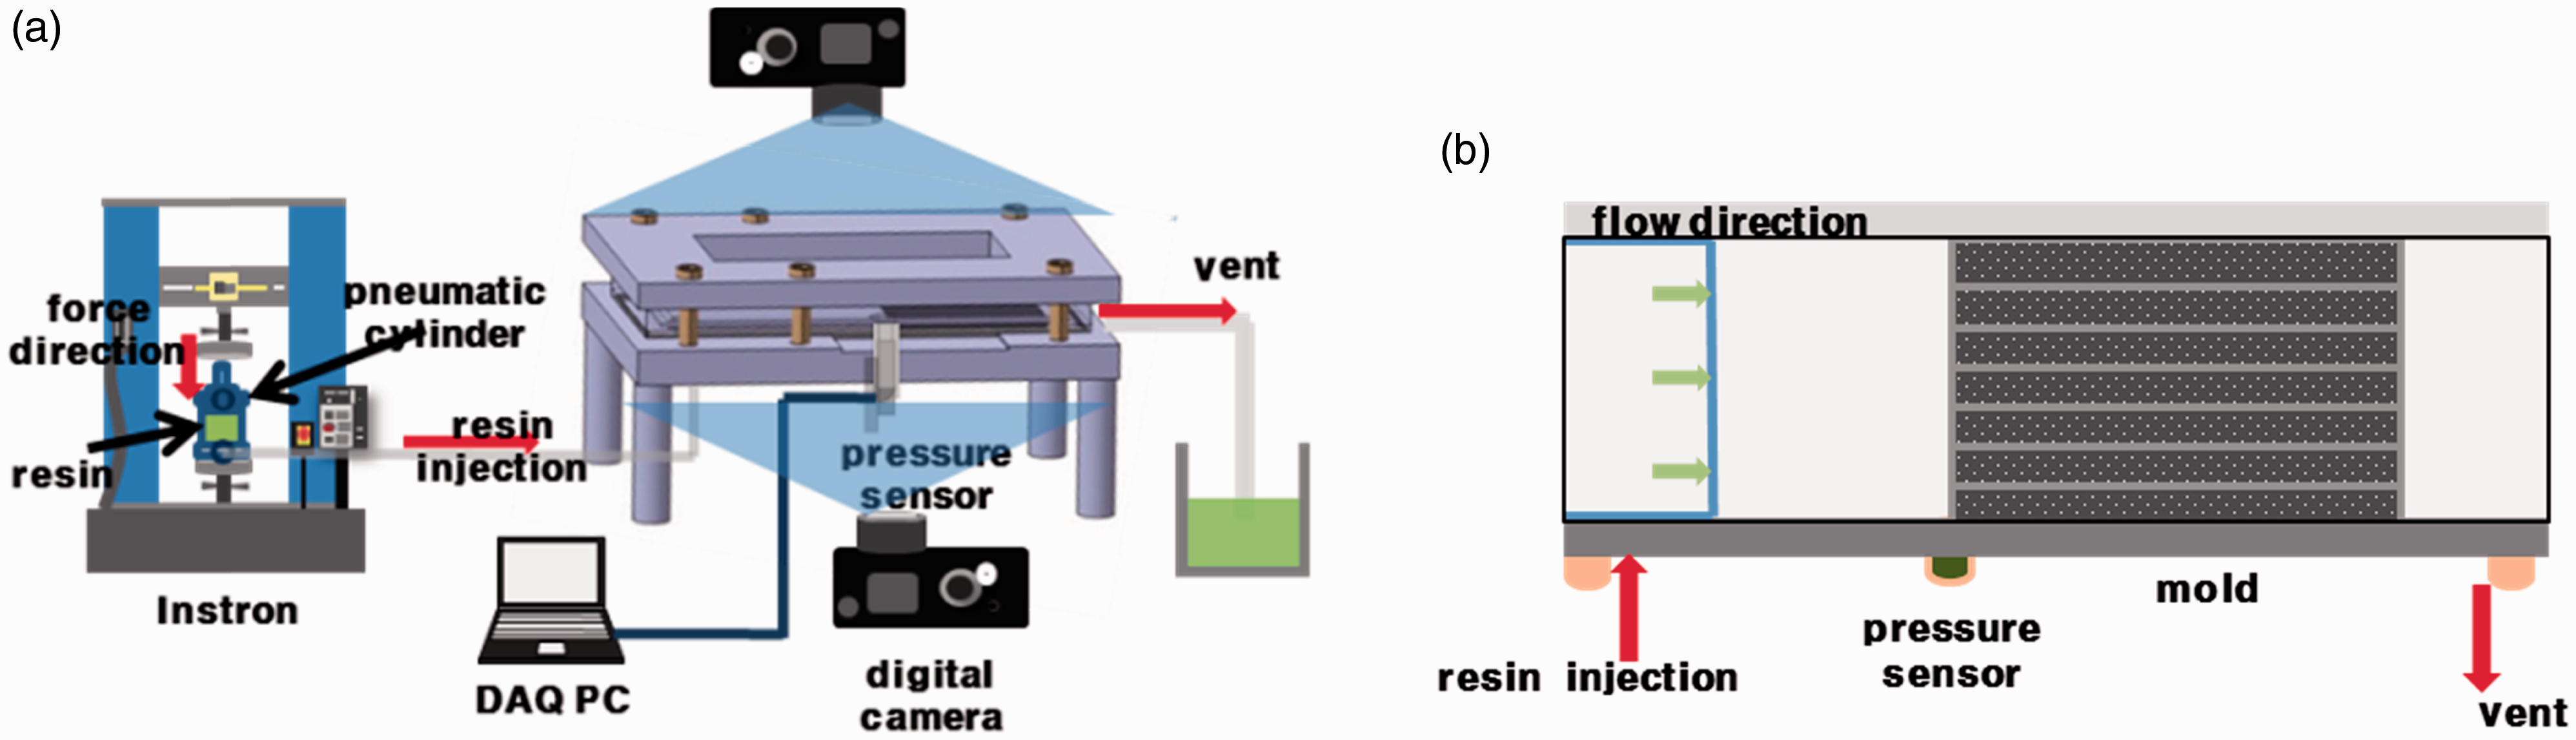
Results and discussion
Friction coefficient
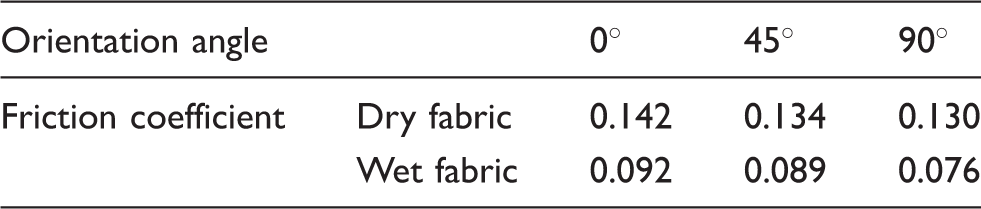
Experimental results of the Coulomb friction coefficients of 0°-, 45°-, 90°-oriented dry UD fabrics are plotted in Figure 5. Friction forces at a constant moving speed of 0.01 m/s were plotted with time at three kinds of normal forces, 100, 200 and 300 N. Friction force was increased at early time and stabilized after reaching an inflection point, at which point the friction coefficient was calculated using the measured friction force and applied normal force. The resultant friction coefficients of dry UD fabric were 0.142, 0.134, 0.130 at the orientation angles of 0°, 45°, 90°. The difference was not large with respect to orientation angle, but 0°-oriented UD fabric had the highest friction coefficient, which might have been caused by the larger contact area along the moving direction.
Friction forces between dry fabric and mold with respect to orientation angle of unidirectional carbon fabric at three types of applied normal force (100 N, 300 N, 500 N). (a) orientation angle 0°, (b) orientation angle 45°, (c) orientation angle 90°.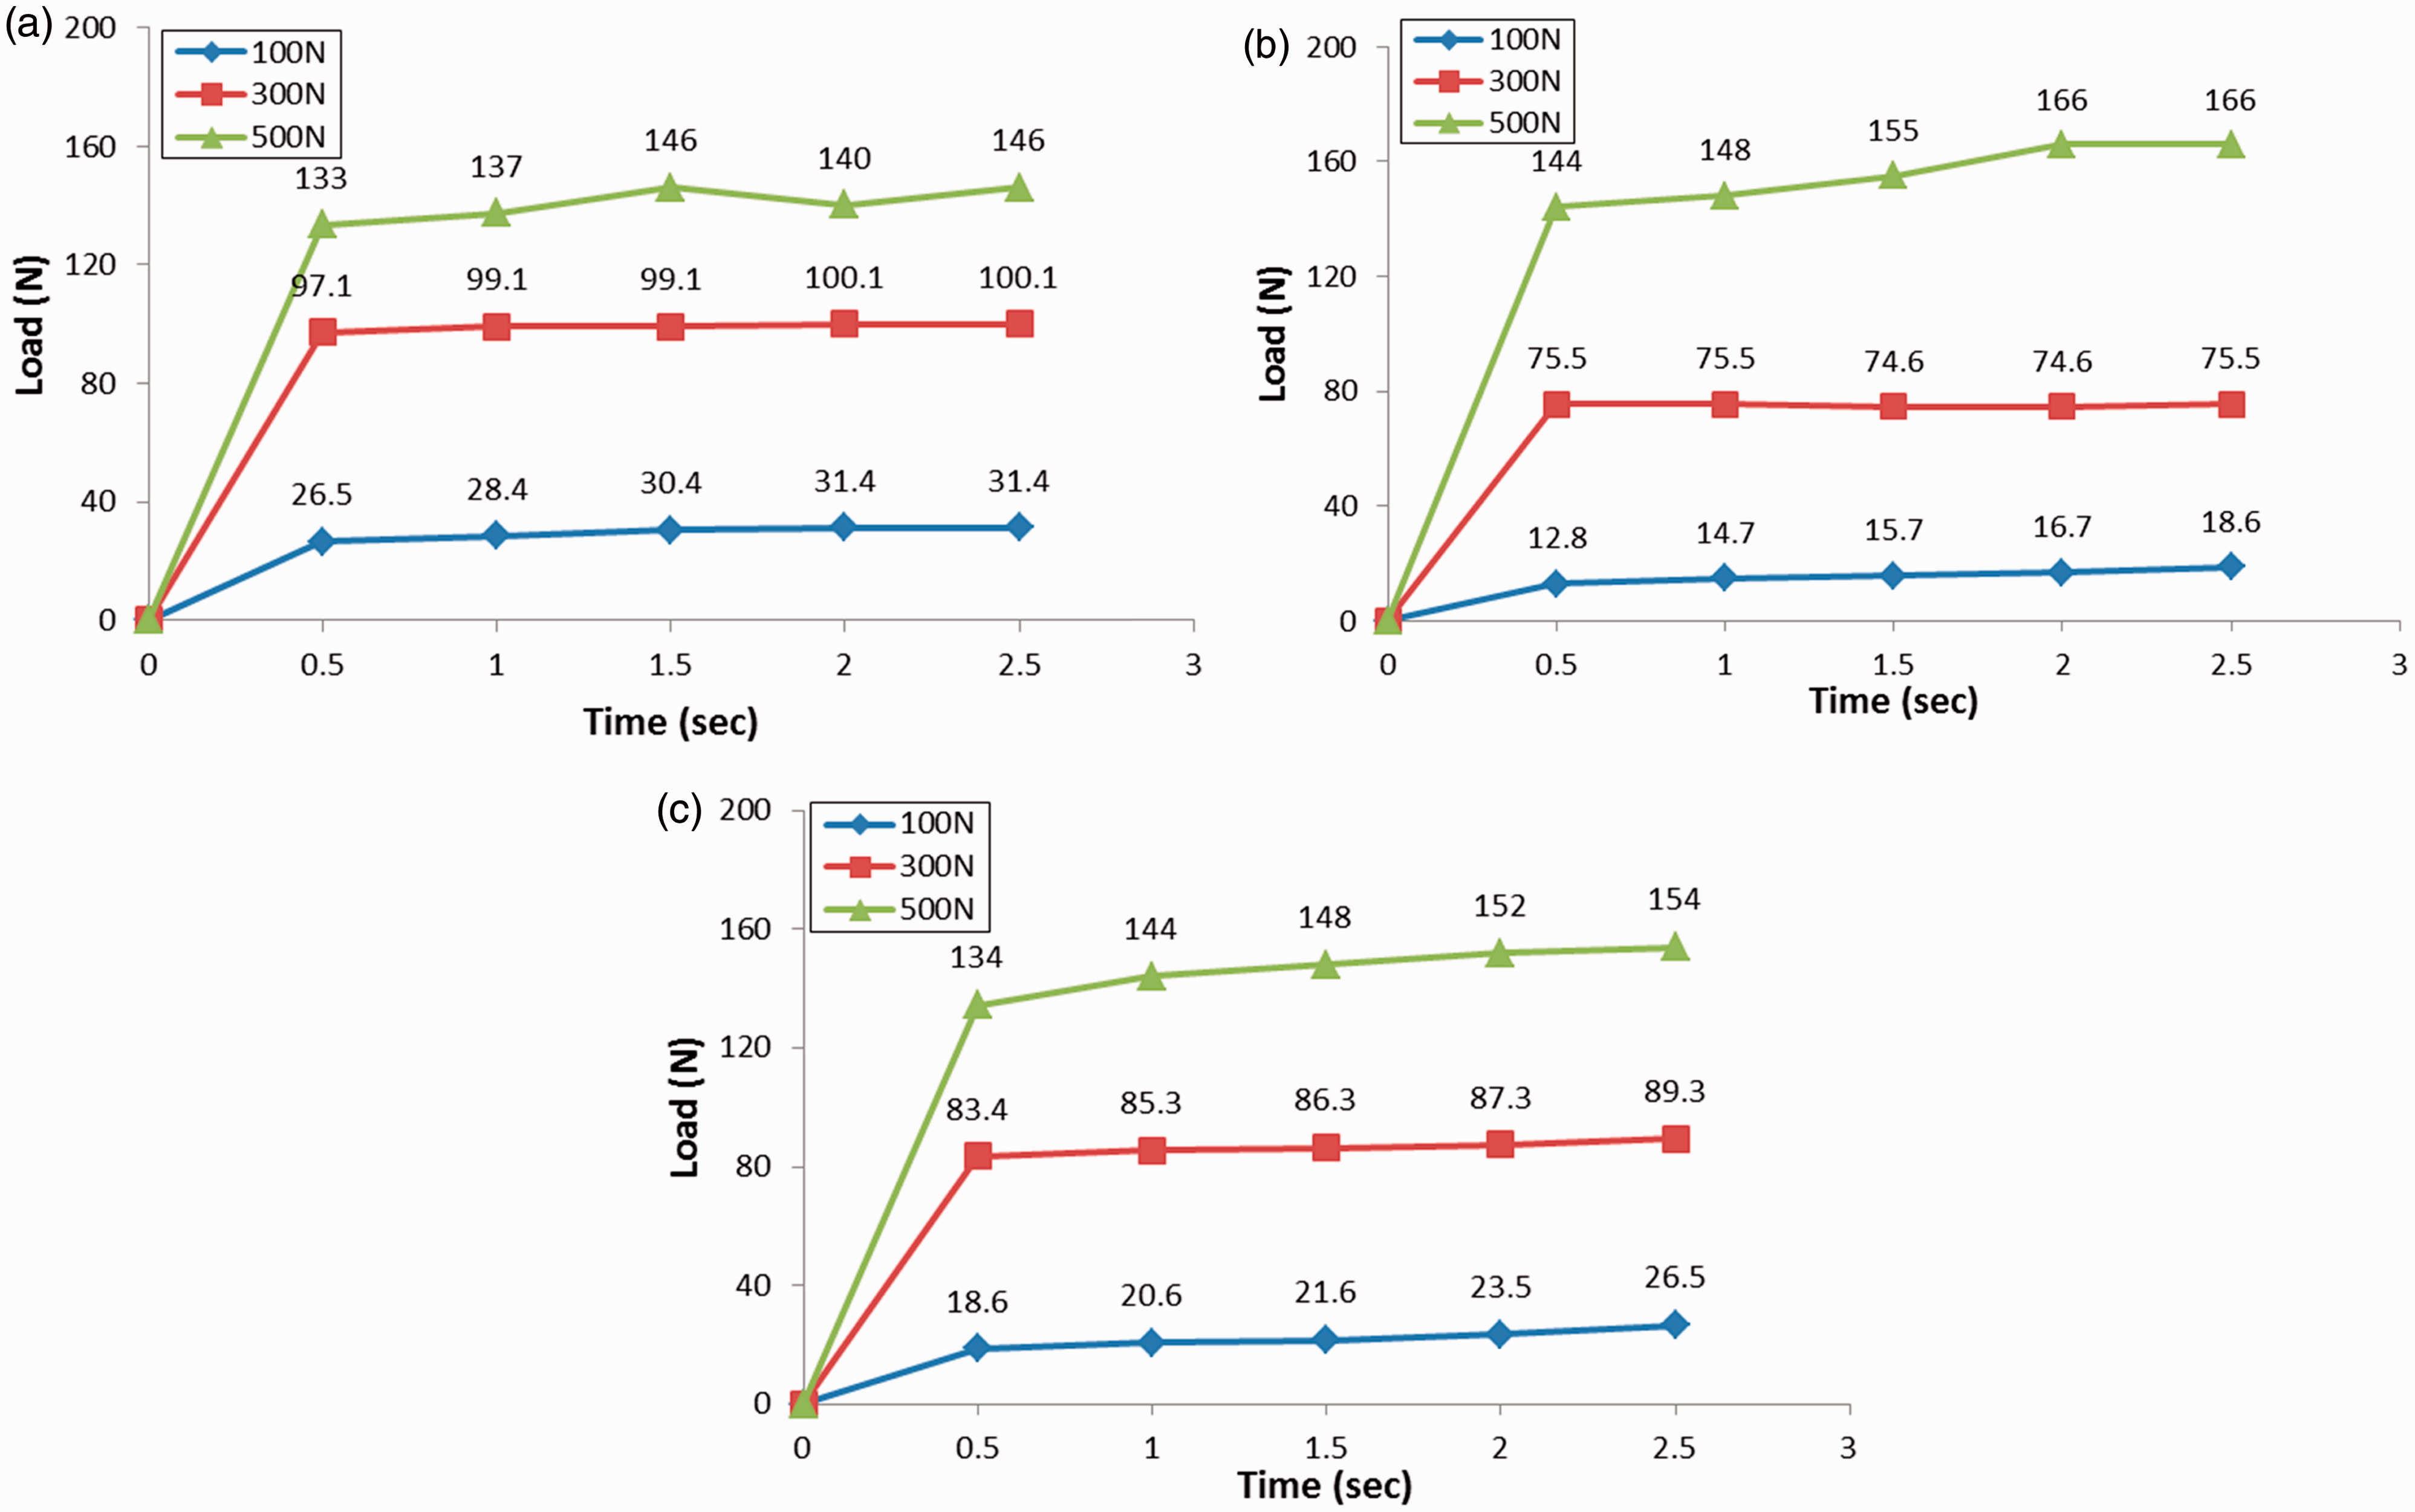
Hydrodynamic friction coefficients of 0°-, 45°-, 90°-oriented wet UD fabrics were plotted with regression curves, in Figure 6, as increasing Hersey number. The friction coefficient increased with increasing Hersey number, which may be included in the hydrodynamic lubrication region of the typical curve between the friction coefficient and the Hersey number, in which the hydrodynamic friction coefficient increases with increasing Hersey number in the hydrodynamic lubrication region after it decreases in the elasto-hydrodynamic lubrication region with the lower Hersey number.
24
Friction coefficients at their dry and wet state are summarized at Table 3 with respect to orientation angle of UD fabrics.
Hydrodynamic friction coefficient as a function of Hersey number with respect to orientation angle of wet UD fabric. (a) orientation angle 0°, (b) orientation angle 45°, (c) orientation angle 90°. UD: unidirectional. Friction coefficients with respect to the orientation angle of the unidirectional carbon fabric in dry and wet states.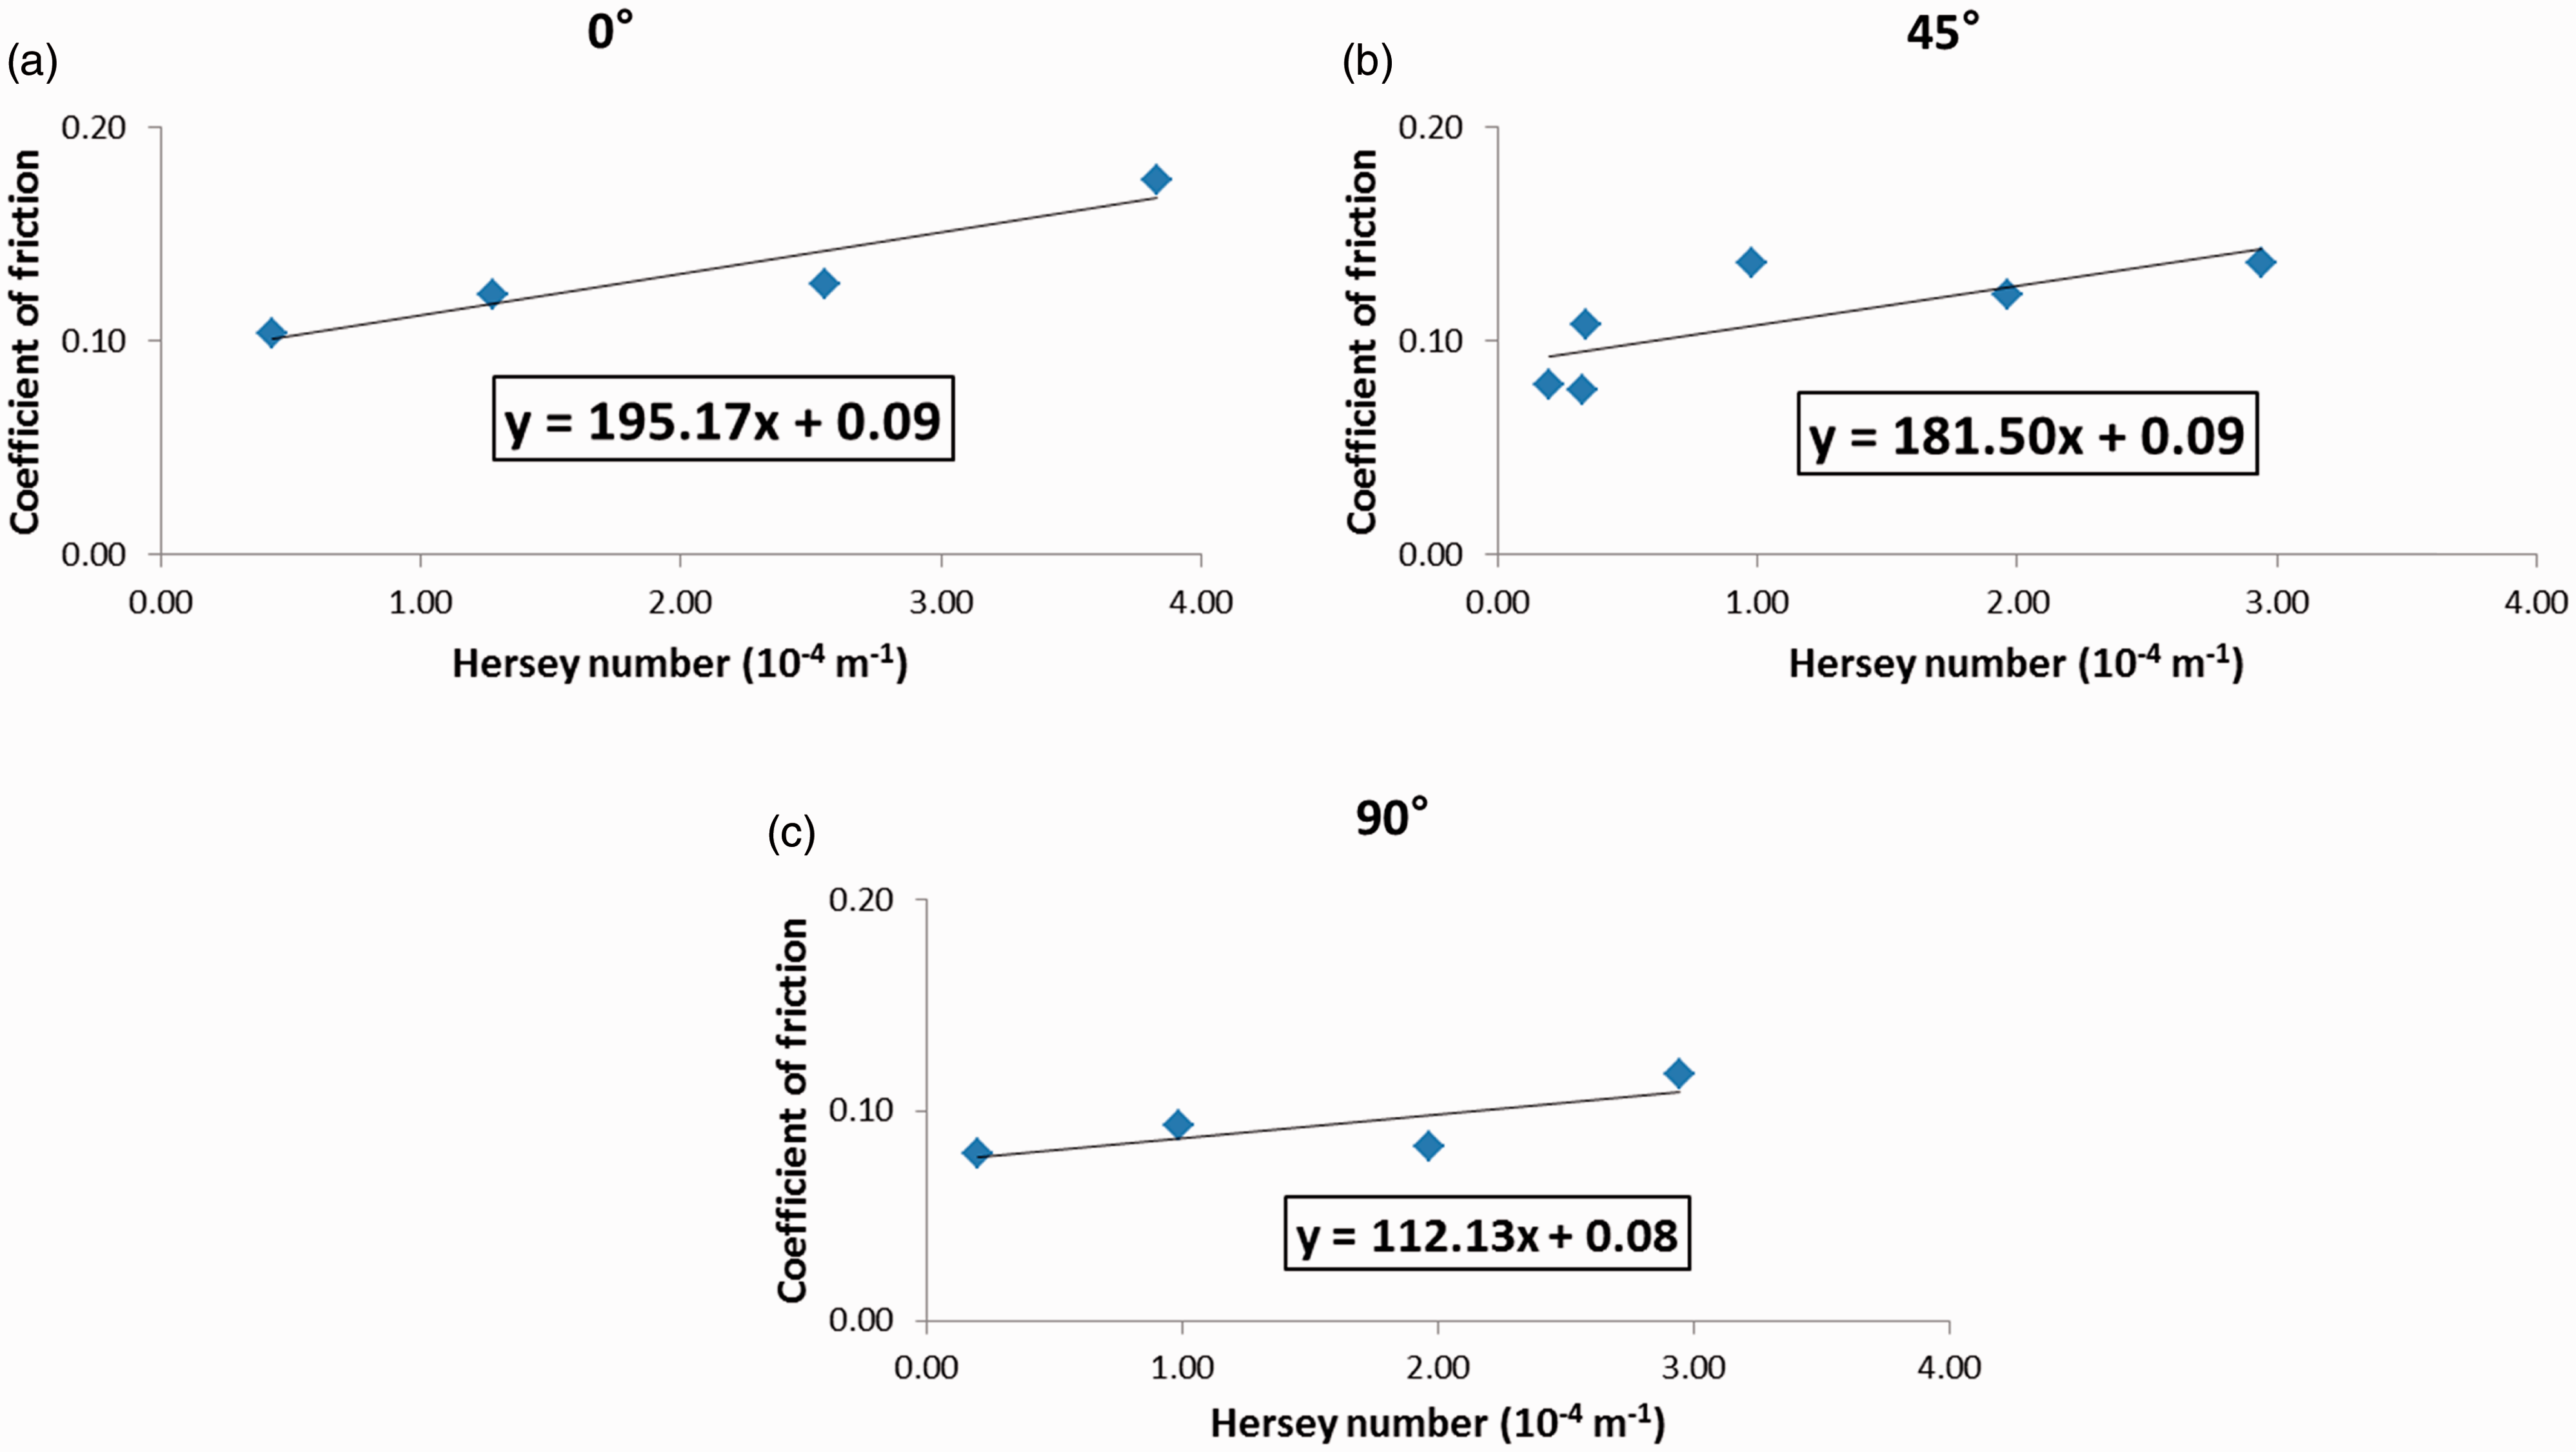
In-mold stiffness
Compressive load of the fiber preform in the mold was measured continuously at a constant compression rate. Load at the inception of deformation of the fiber preform’s one end was determined as the in-mold stiffness force for the local deformation of the fiber preform. Load at the inception of deformation of both ends was determined as the in-mold stiffness force for rigid-body deformation of fiber preform. In this study, the inception is defined as the time that the displacement becomes 1 mm because displacement over 1 mm can be effectively recognized by human eyes, which can be a possible standard for determining defect by fiber deformation. Compressive forces with respect to displacement in the in-mold stiffness measurement of UD fabric with fiber volume fraction of 40, 50, 55% at orientation angles of 0°, 45°, 90° are represented in Figure 7. These two types of forces were compared with force by fluid flow in liquid composite molding.
Compressive force with respect to displacement in the in-mold stiffness measurement of UD fabric. (a–c) Vf = 40, 50, 55% at orientation angle 0°, (d–f) Vf = 40, 50, 55% at orientation angle 45°, (g–i) Vf = 40, 50, 55% at orientation angle 90°. UD: unidirectional.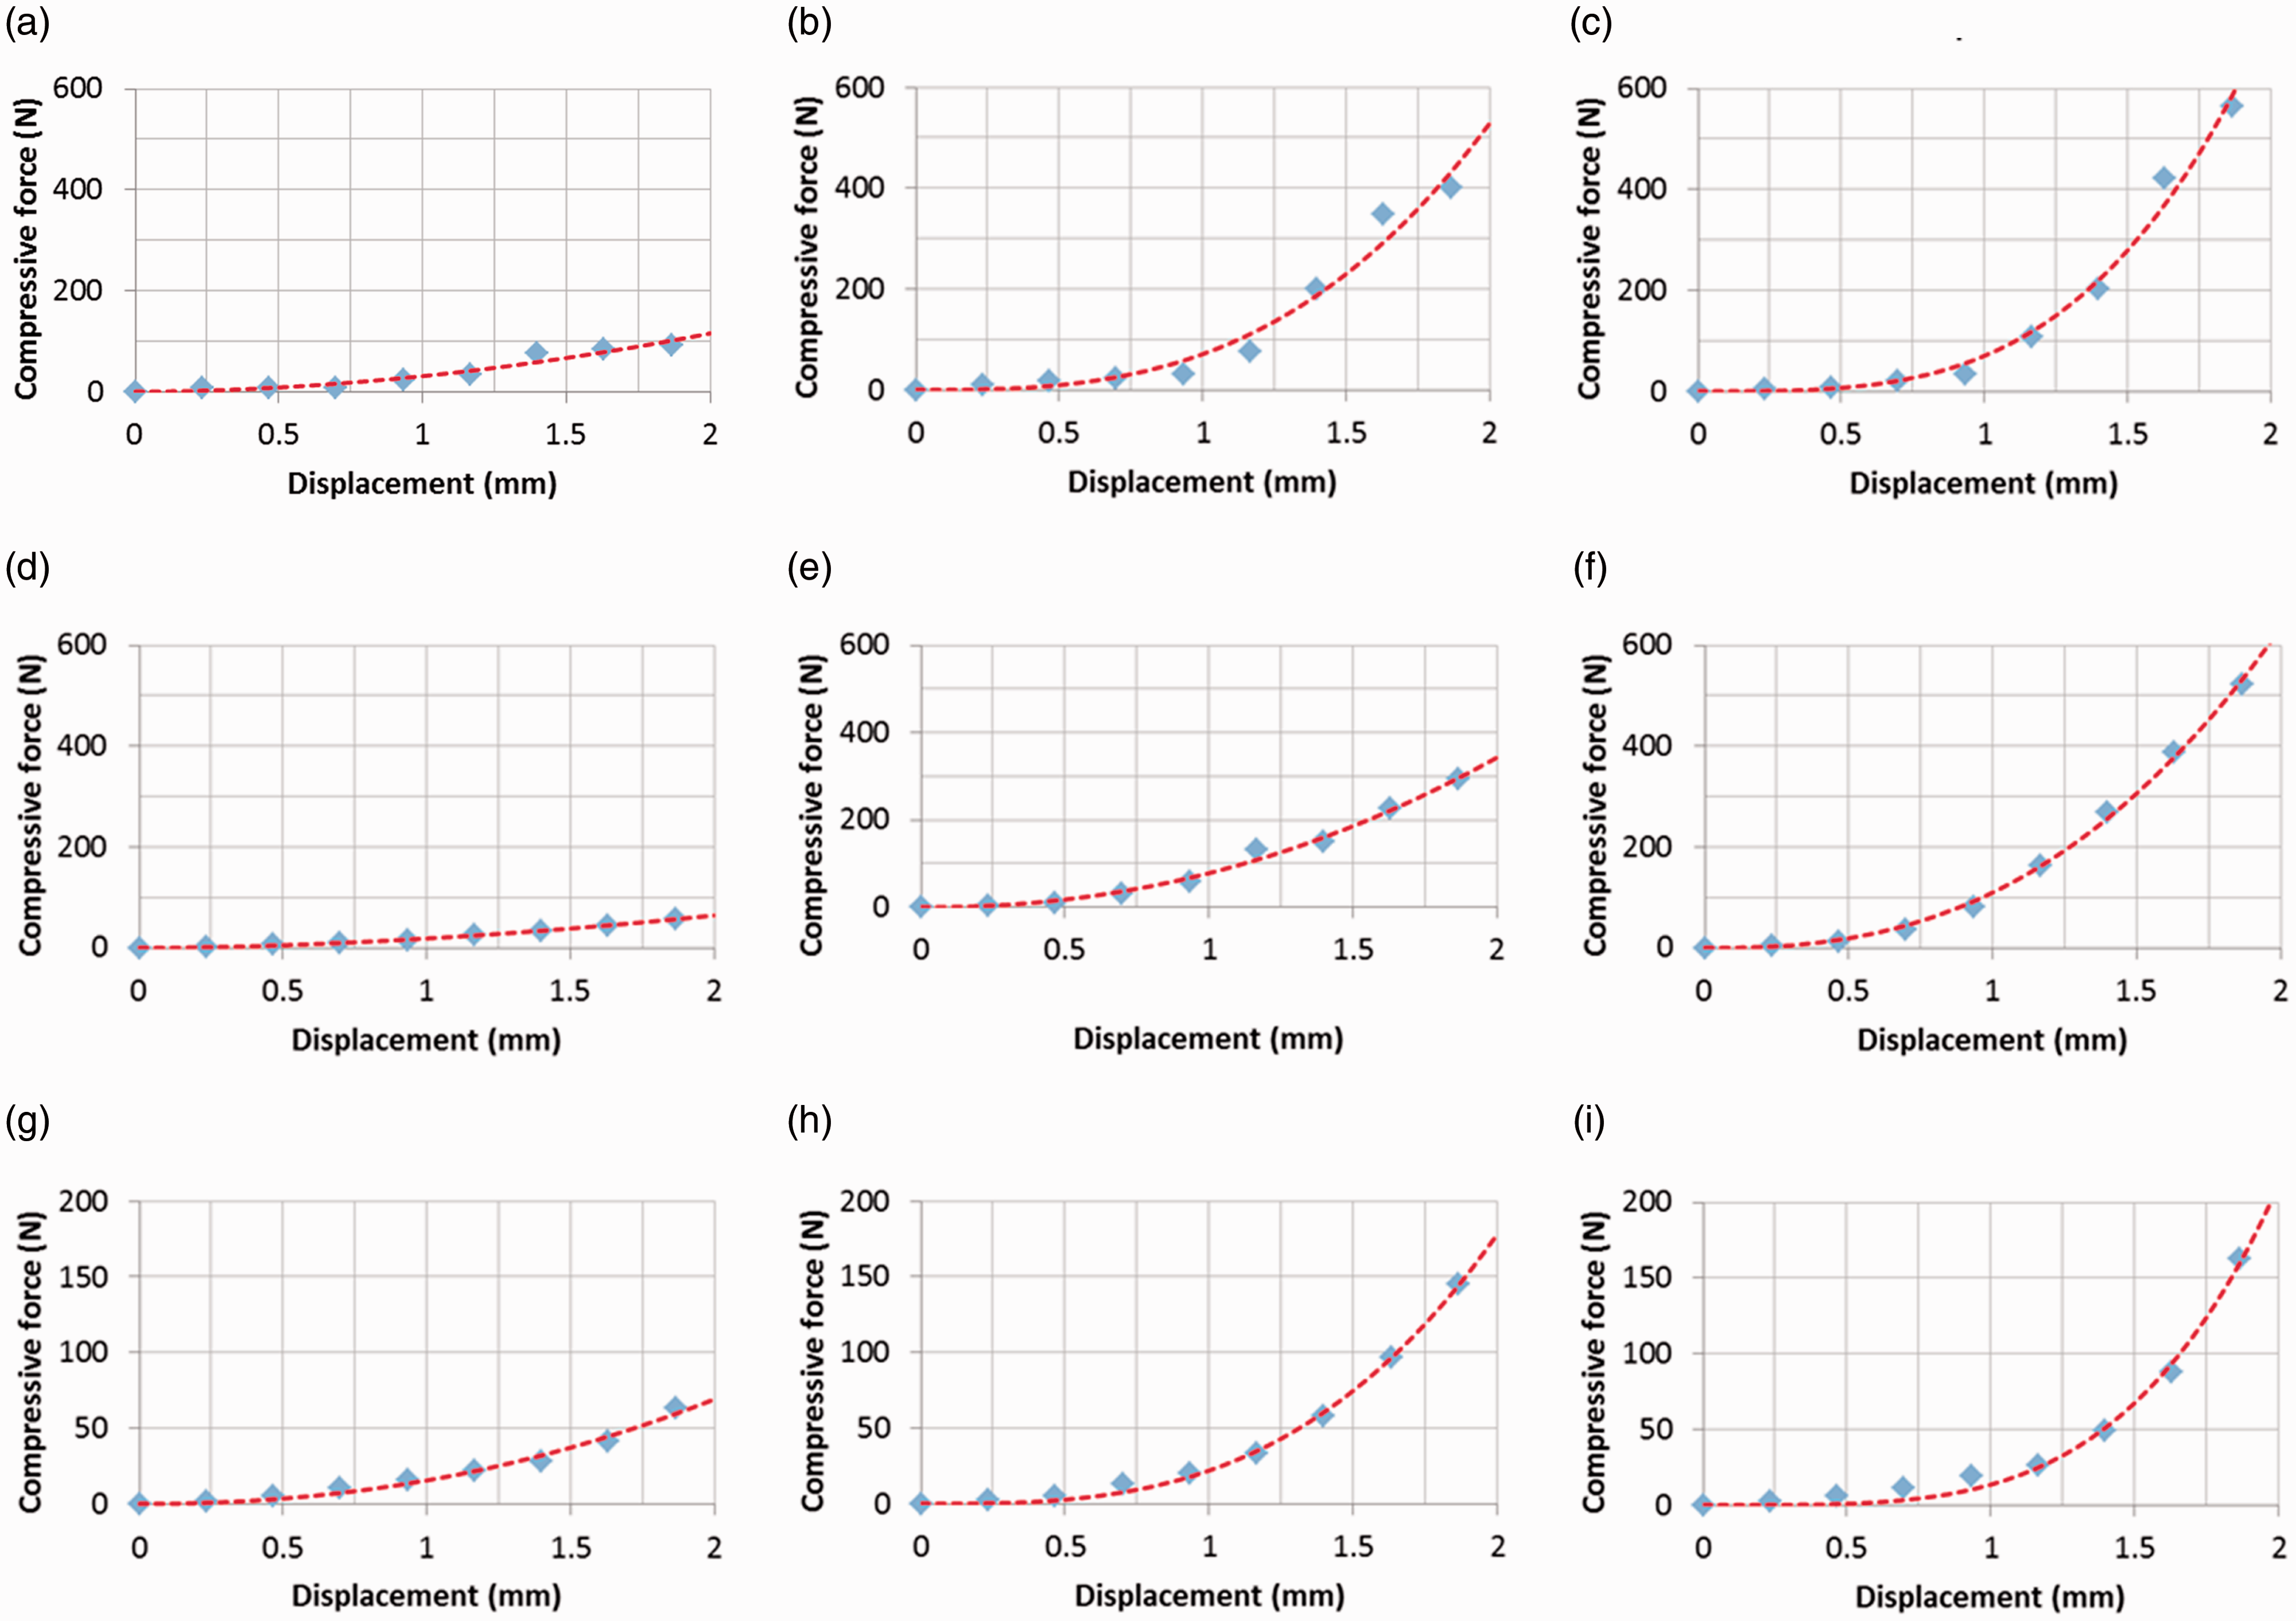
Flow-induced fiber deformation in liquid composite molding
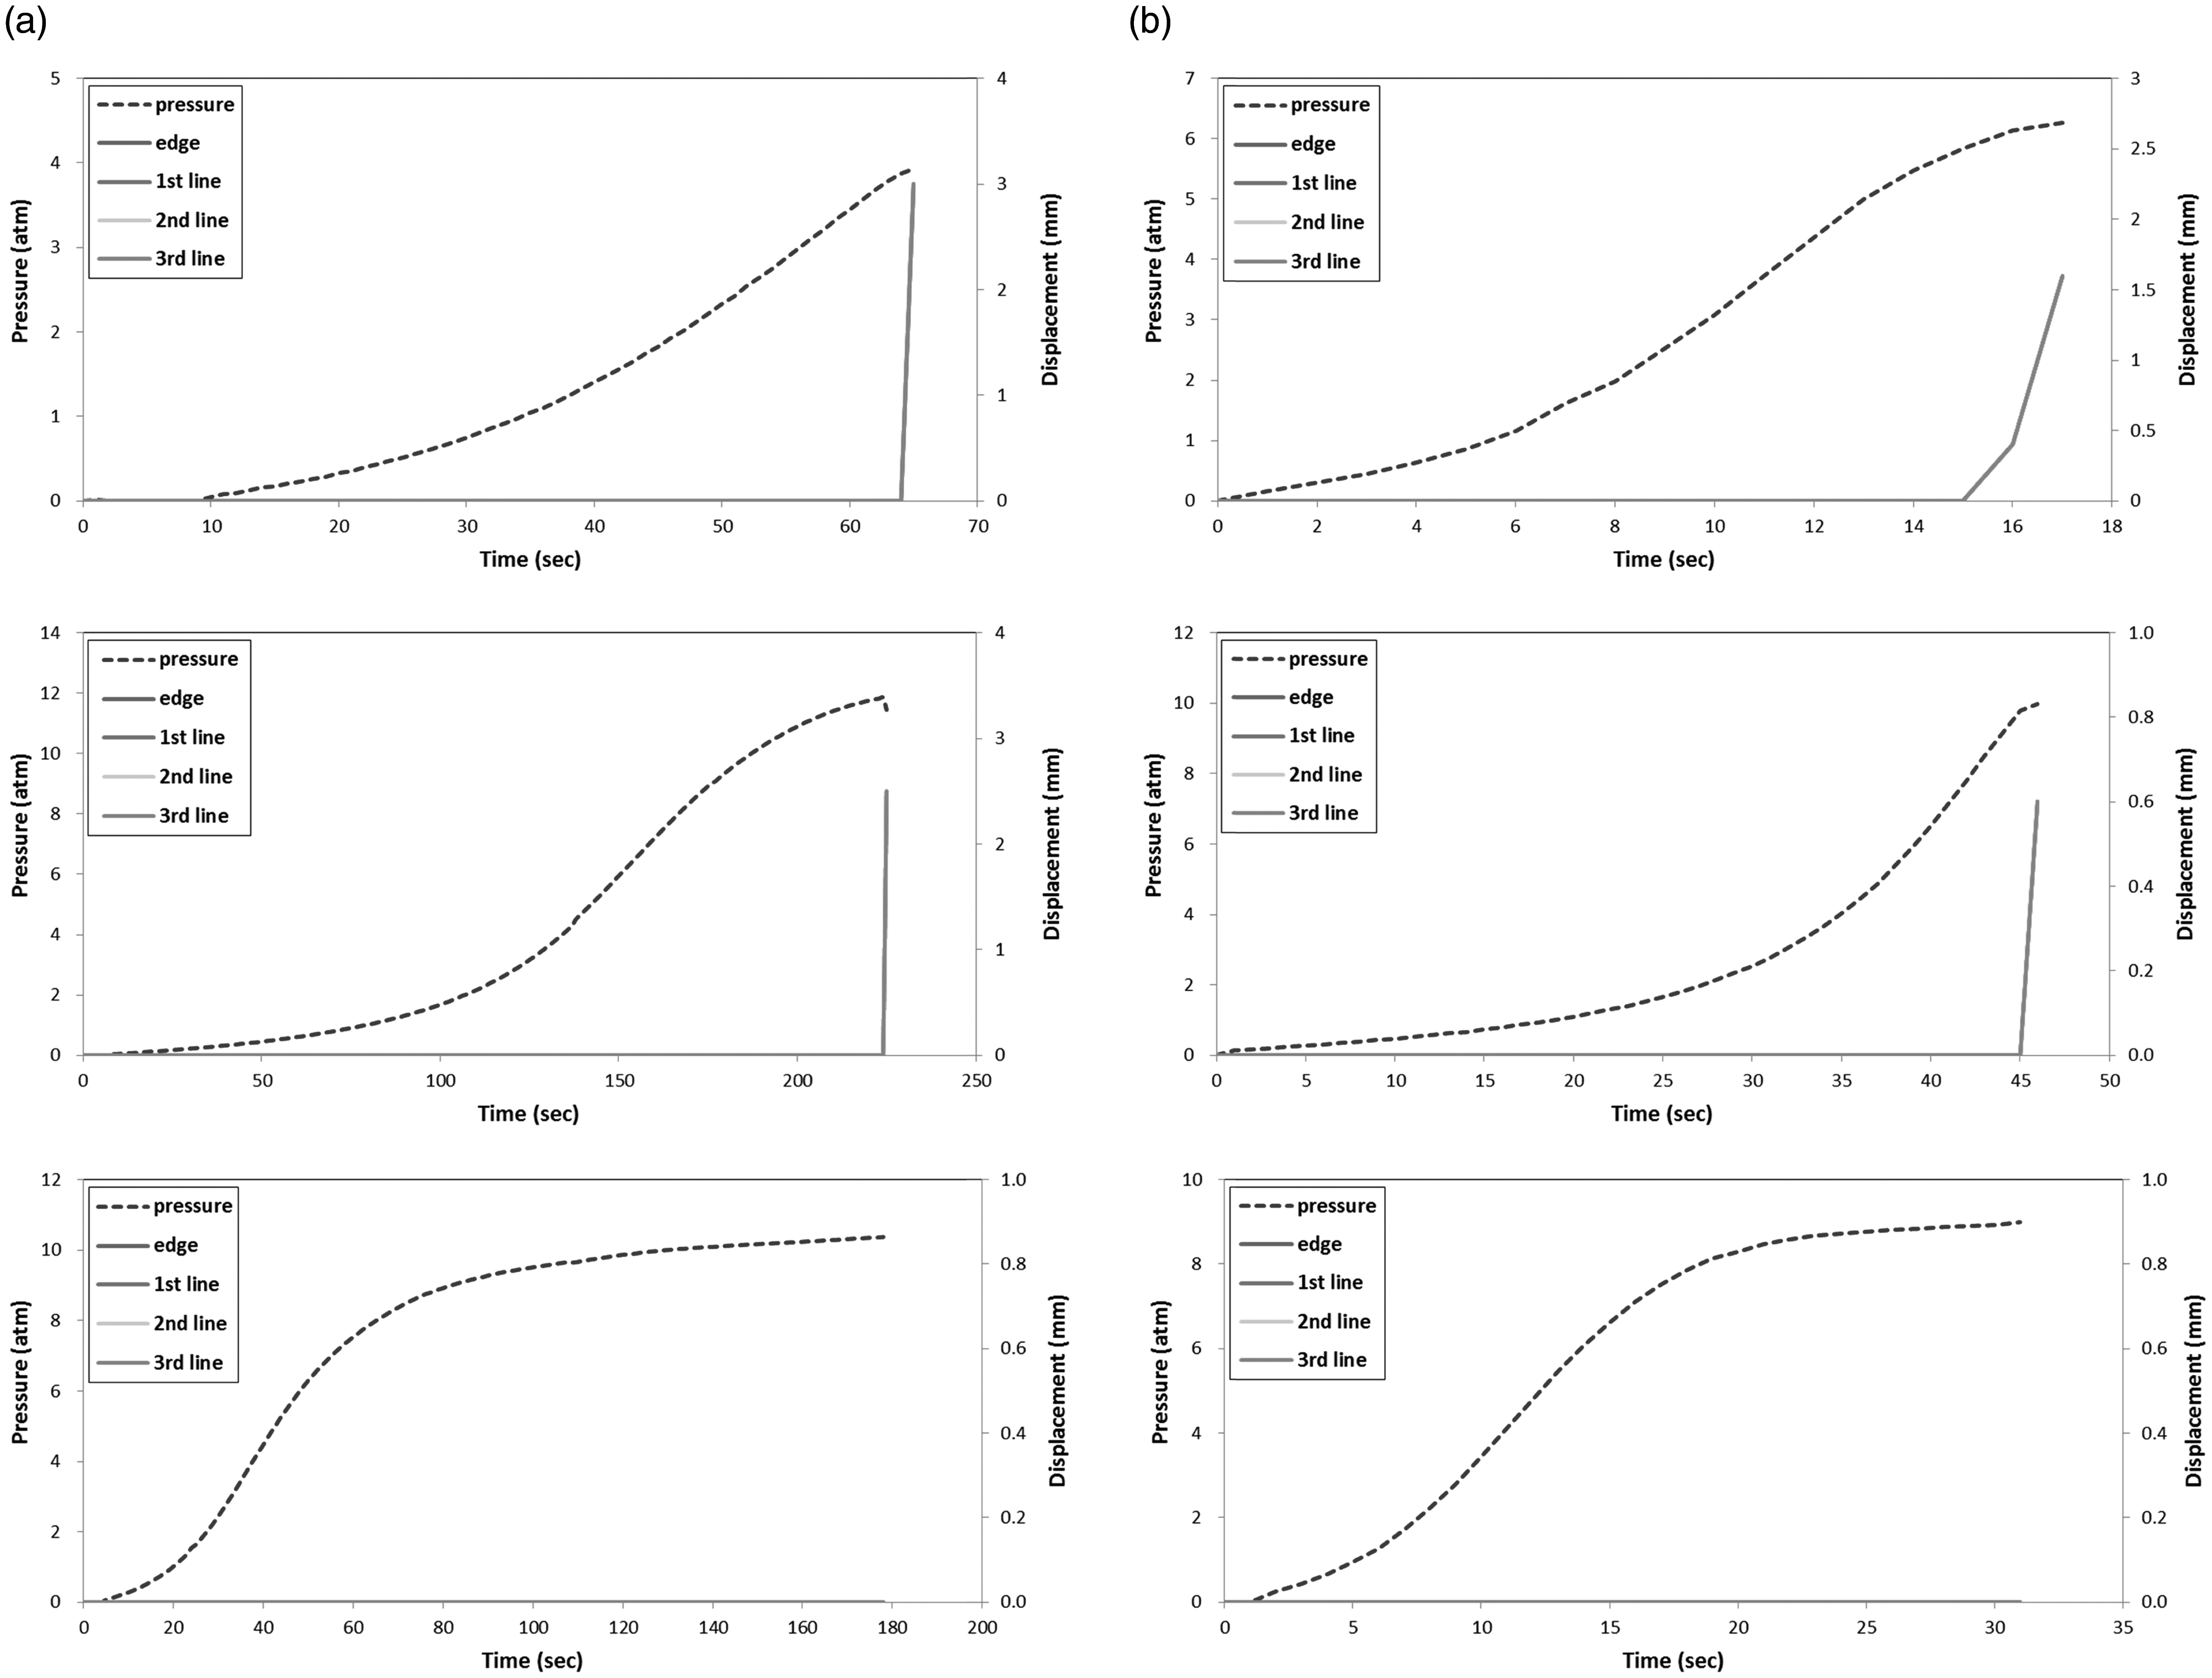
Figure 8 shows typical image of flow-induced deformation of UD fabric with three types of orientation angle (0°, 45°, 90°) during flow front advancement in the liquid composite molding experiment. Pressure measured at the starting point of the fabric and the displacement of four points (edge and three white lines with 50 mm gaps) are plotted in Figures 9–11. Figure 8 shows the development of flow pressure and displacement of 0°-oriented UD fabric with volume fractions of 40, 50, 55% at flow rates of 0.838 and 2.513 cm3/s. As flow front advances, flow pressure is increased, but displacements of all of the positions in the fabric are zero until a certain time, after which the displacements simultaneously increase in an instant. This phenomenon indicates that the UD fabric does not deform until a certain time, after which the rigid body-like deformation occurs without local deformation, which is shown as slip of a whole fabric along the mold surface. But there was no deformation in the volume fraction of 55% because friction force is sufficiently large due to large normal force by high-fiber contents. No deformation is shown when the friction force is larger than the flow force, but rigid body deformation, such as slip, occurs when the flow force by injection pressure is larger than the friction force. The force relationship is shown in Figure 12. We measured the time of occurring of local or rigid body deformation from resin flow experiment, at which three kinds of forces by friction, in-mold stiffness and flow were obtained from each experimental result. Namely, we can compare the magnitude of three forces at the instant of occurring fiber deformation. For example, in-mold stiffness force is the largest, flow force is the second and friction force is the third, which results in the rigid body deformation without any local deformation. However, at low fiber volume fraction of 40%, the distinct local deformation was not observed even though the flow force was the largest as shown in Figure 12(a). This may be caused by very low resistive forces by both friction and in-mold stiffness, by which rigid body deformation occurred at an early time before local deformation clearly occurred. This result indicates that control of preform deformation in the mold-filling process can be very difficult for low fiber volume fraction.
Image of flow-induced deformation of fiber preform during flow front advancement at three types of orientation angle in UD fabric. (a) orientation angle 0°, (b) orientation angle 45°, (c) orientation angle 90°. UD: unidirectional. Plot of pressure and displacement of each marked line in 0°-oriented UD fabric during flow in the liquid composite molding experiment. (a) fiber volume fractions of 40, 50, 55% at a flow rate of 0.838 cm3/s, (b) fiber volume fractions of 40, 50, 55% at a flow rate of 2.513 cm3/s. UD: unidirectional.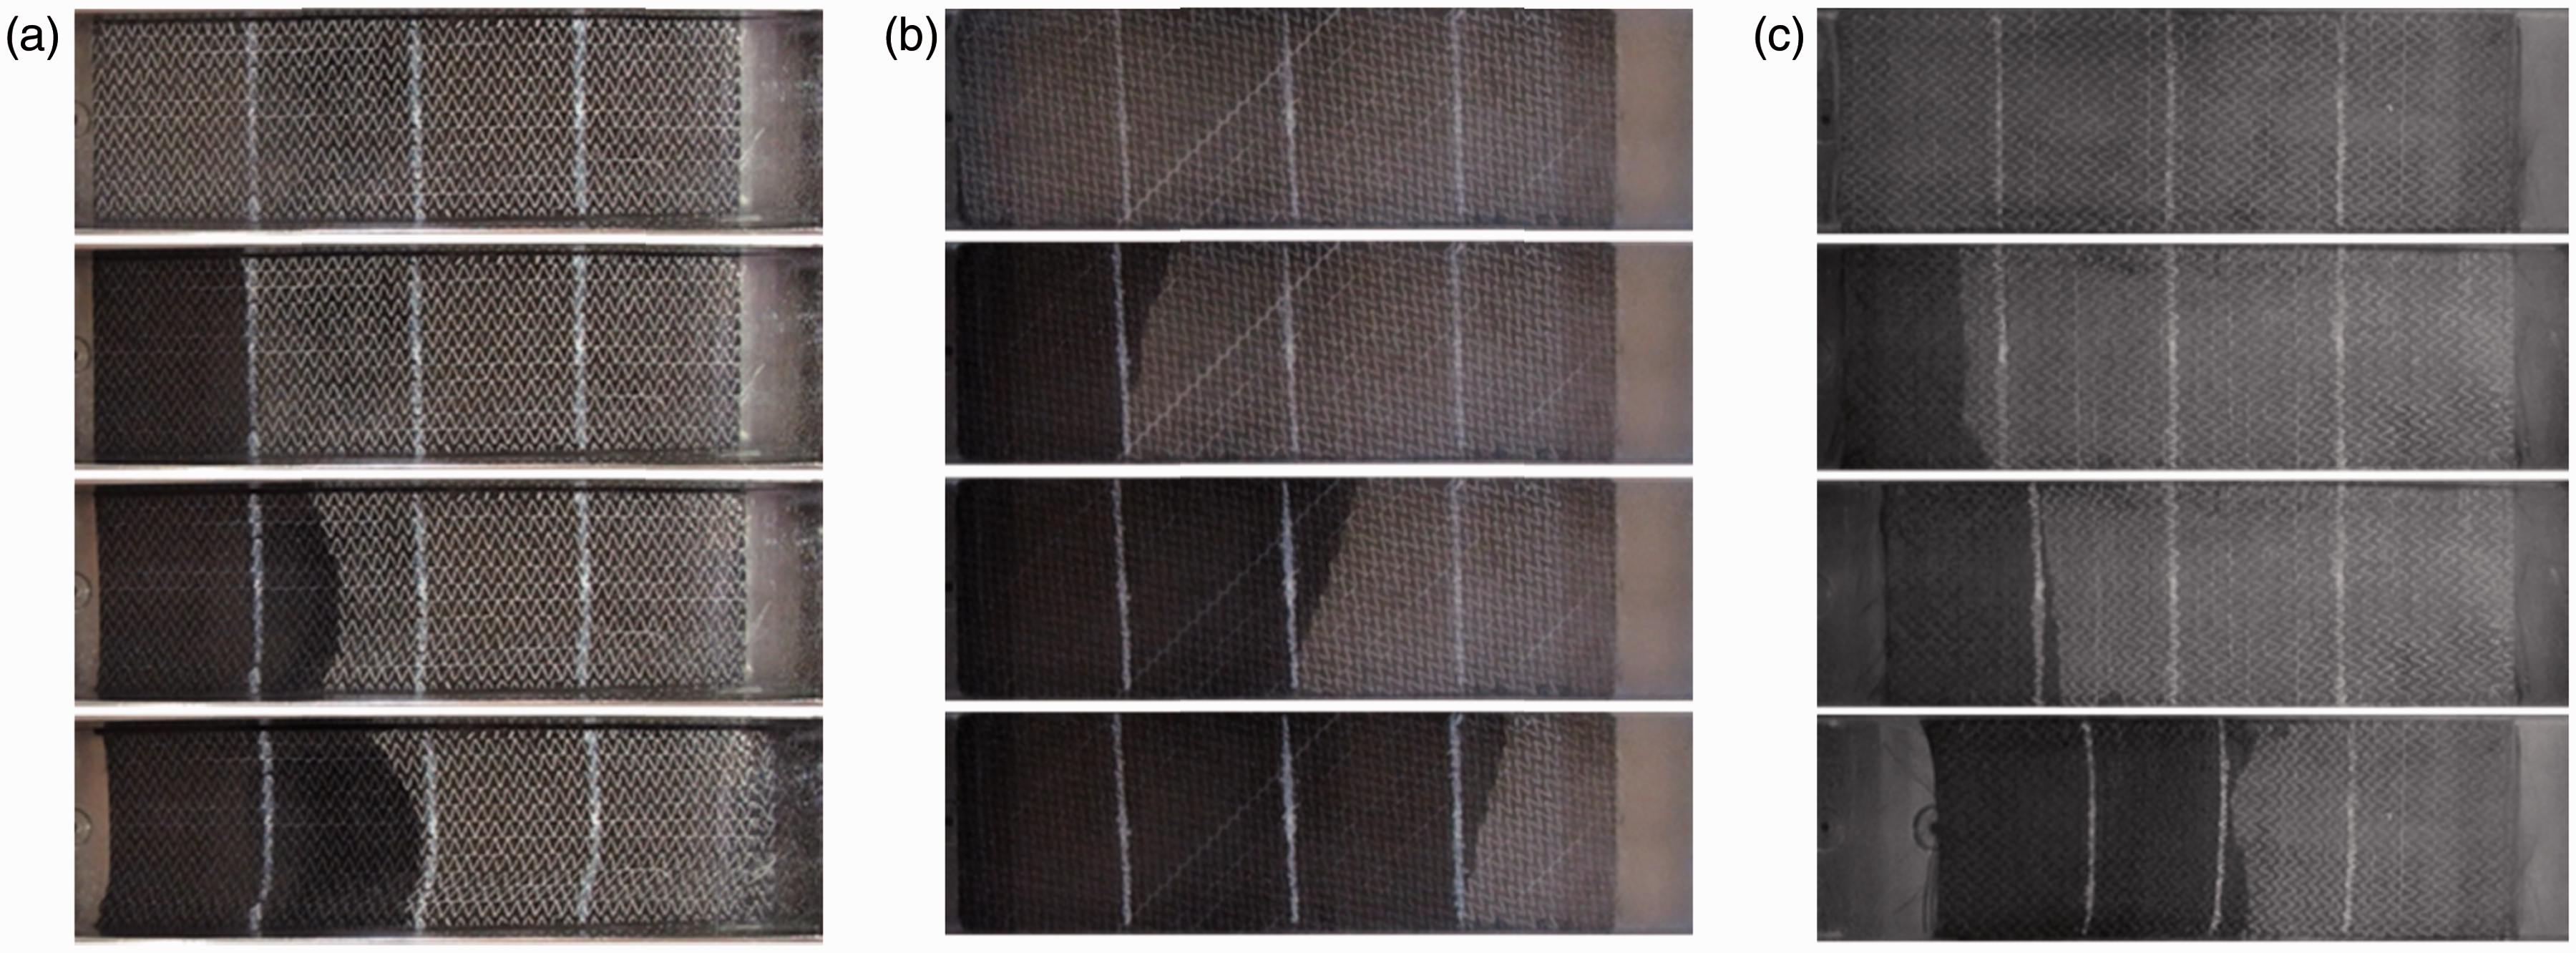
Development of flow pressure and the displacement of 45°-oriented UD fabric with volume fractions of 40, 50, 55% at flow rates of 0.838 and 2.513 cm3/s are shown in Figure 10. At a volume fraction of 40%, displacements of four positions did not coincide with each other at both low and high flow rates. Displacement of the fabric is largest at the edge position and decreased as distance from the edge is increased, which means that local deformation, such as wrinkling, occurs. At the volume fractions of 50% and 55%, local deformation occurs at the higher flow rate of 2.513 cm3/s, while no deformation is shown at the lower flow rate of 0.838 cm3/s. The force relationship at the 45°-oriented case is shown in Figure 13. In the case of local deformation, flow force is larger than that by in-mold stiffness of fabric, even though it is smaller than friction force as shown in the upper plot of Figure 13(b). As flow front further advances after local deformation, flow force becomes larger than the friction force but smaller than the in-mold stiffness force, as shown in the lower plots of Figure 13(a) and (b), which results in slip of a whole fabric. We can observe both local and rigid body deformations with a slight time interval at the specific case such as volume fraction of 40%, which is defined as rigid body deformation after local ones. We can also observe very complex deformation behavior at high flow rate such as 2.513 cm3/s, which is shown in Figure 13(b). The sequence of occurring of each kind of deformation is irregular, which indicates that control of flow-induced fiber deformation is very difficult at high flow rates.
Plot of pressure and displacement of each marked line in 45°-oriented UD fabric during flow in the liquid composite molding experiment. (a) fiber volume fractions of 40, 50, 55% at a flow rate of 0.838 cm3/s, (b) fiber volume fractions of 40, 50, 55% at a flow rate of 2.513 cm3/s. UD: unidirectional. Plot of pressure and displacement of each marked line in 90°-oriented UD fabric during flow in the liquid composite molding experiment. (a) fiber volume fractions of 40, 50, 55% at a flow rate of 0.838 cm3/s, (b) fiber volume fractions of 40, 50, 55% at a flow rate of 2.513 cm3/s. UD: unidirectional. Comparison of the related forces by friction, flow and in-mold stiffness in the liquid molding experiment of 0°-oriented UD fabric at volume fractions of 40, 50, 55%. (a) flow rate of 0.838 cm3/s, (b) flow rate of 2.513 cm3/s. UD: unidirectional. Comparison of the related forces by friction, flow and in-mold stiffness in the liquid molding experiment of 45°-oriented UD fabric at volume fractions of 40, 50, 55%. (a) local deformation (upper) and rigid body deformation (lower) at a flow rate of 0.838 cm3/s, (b) local deformation (upper) and rigid body deformation (lower) at a flow rate of 0.838 cm3/s flow rate of 2.513 cm3/s. UD: unidirectional.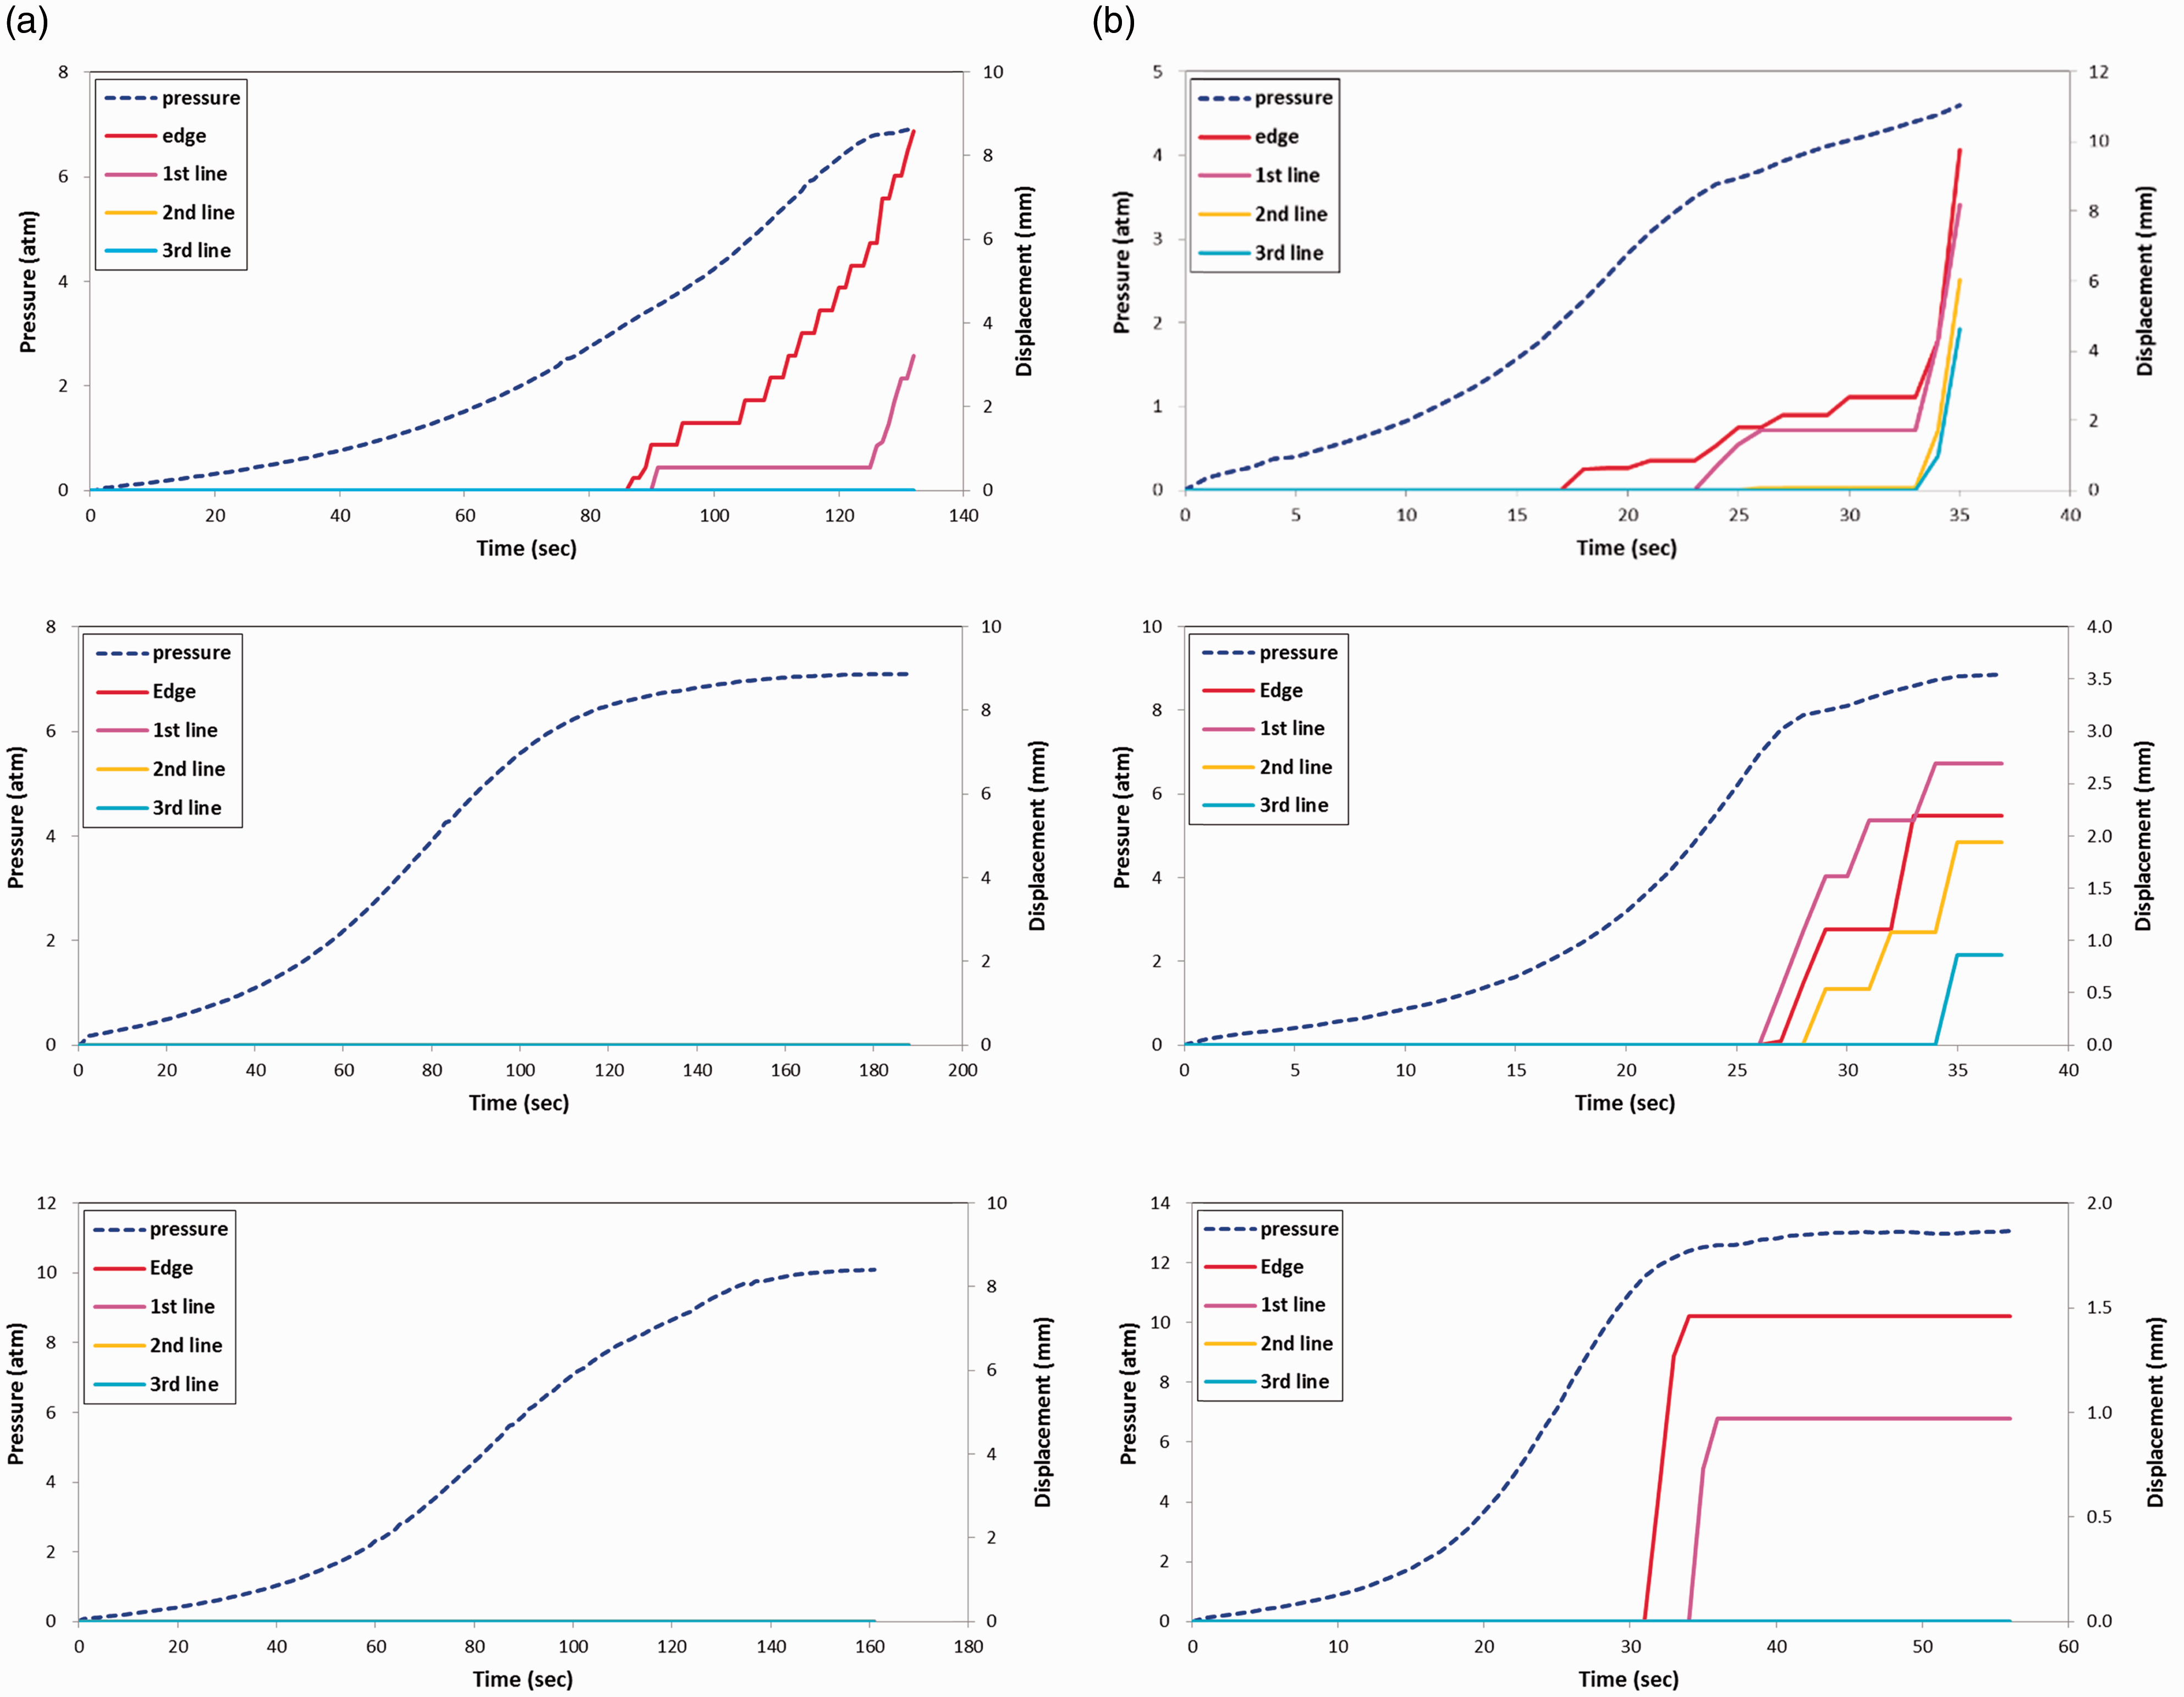
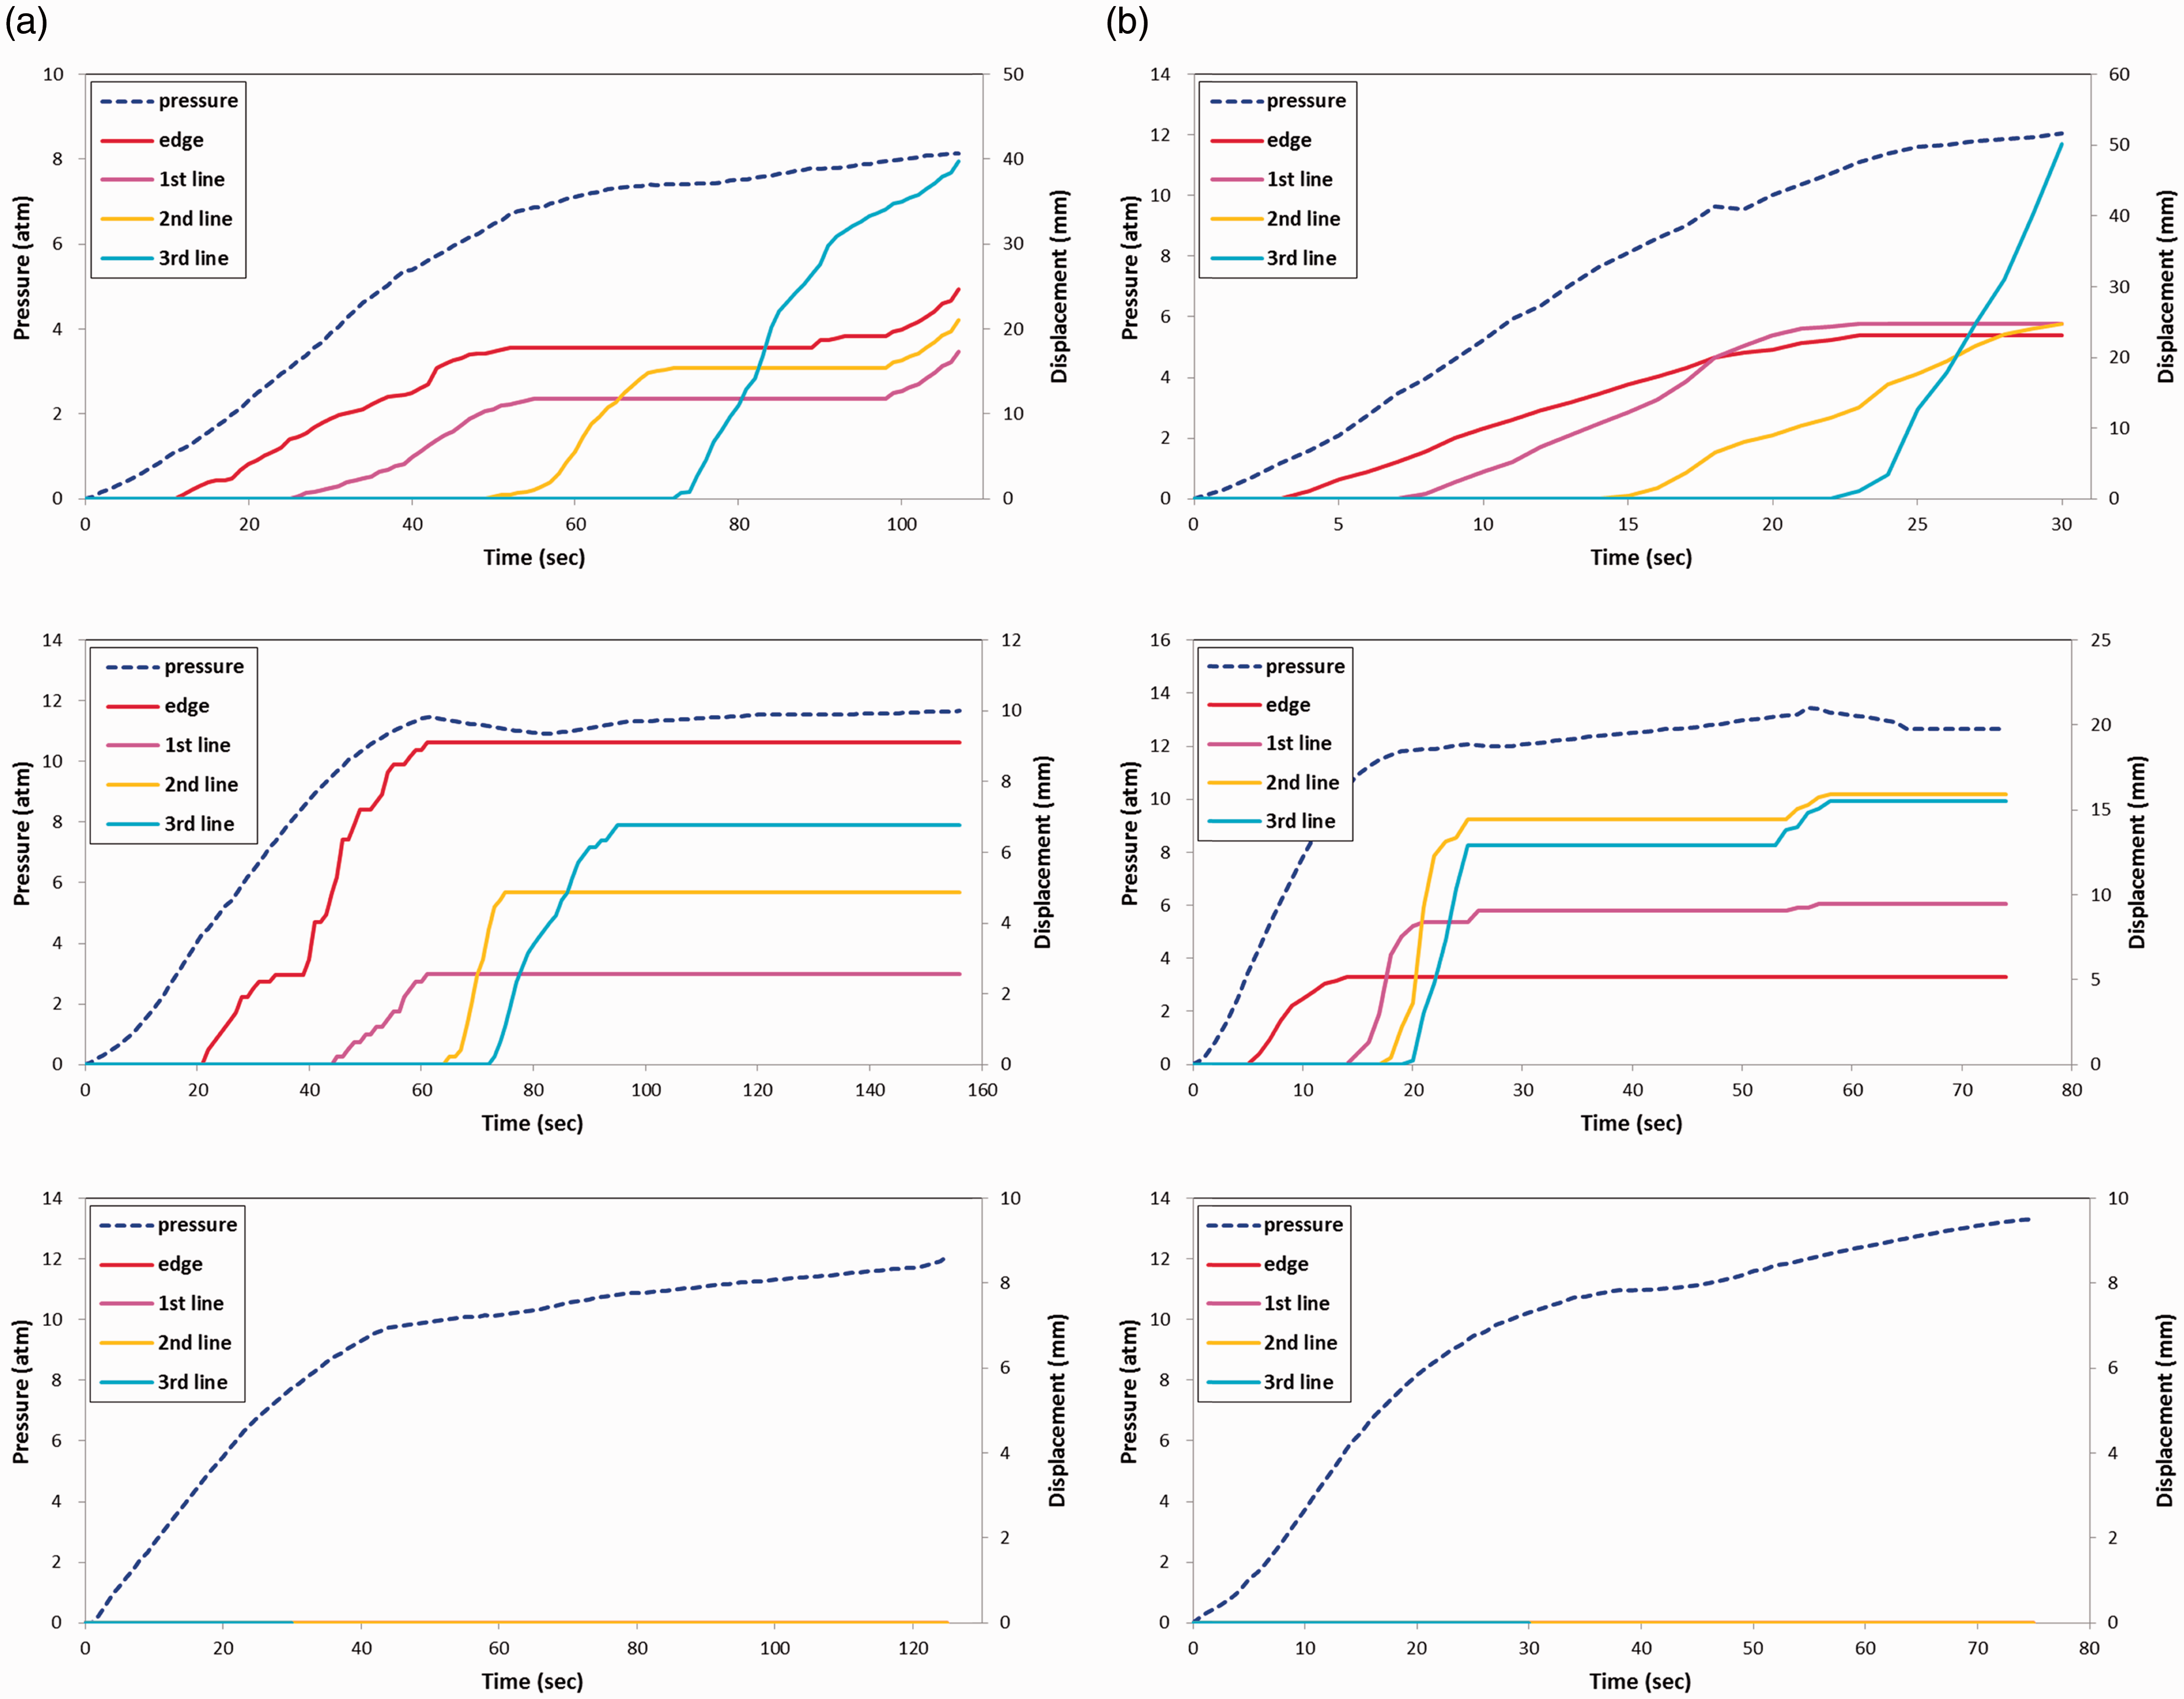
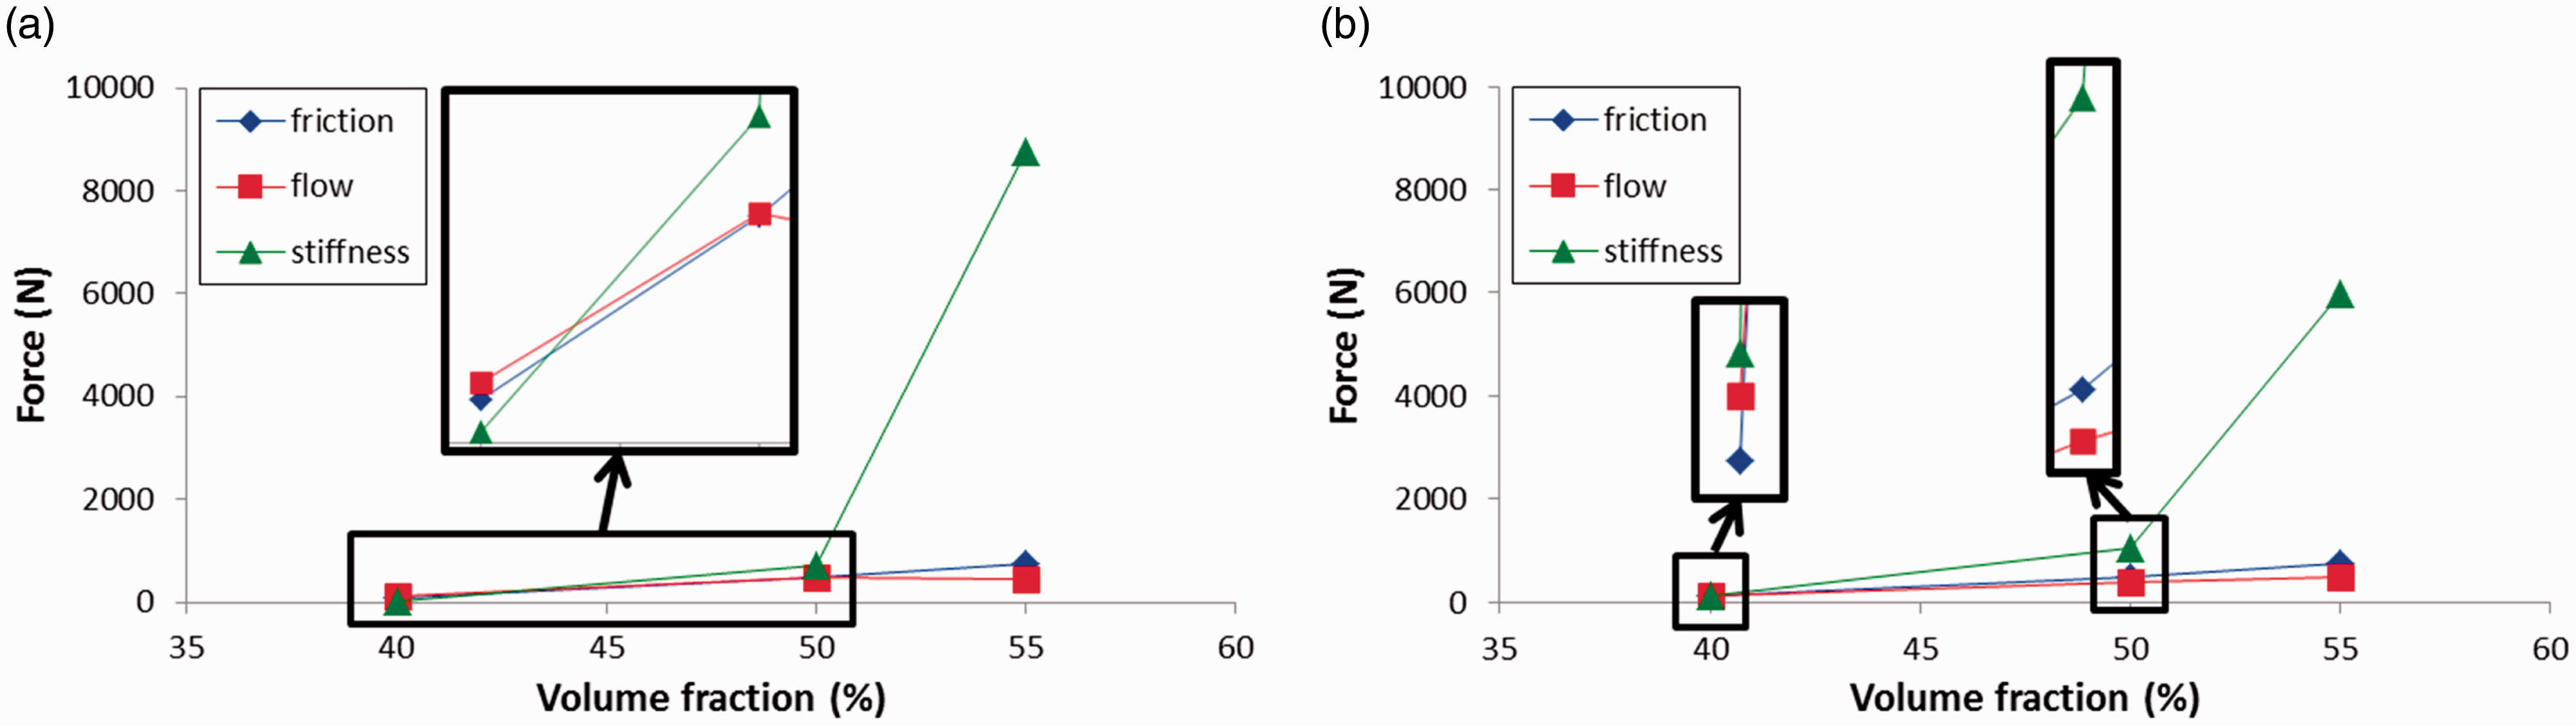
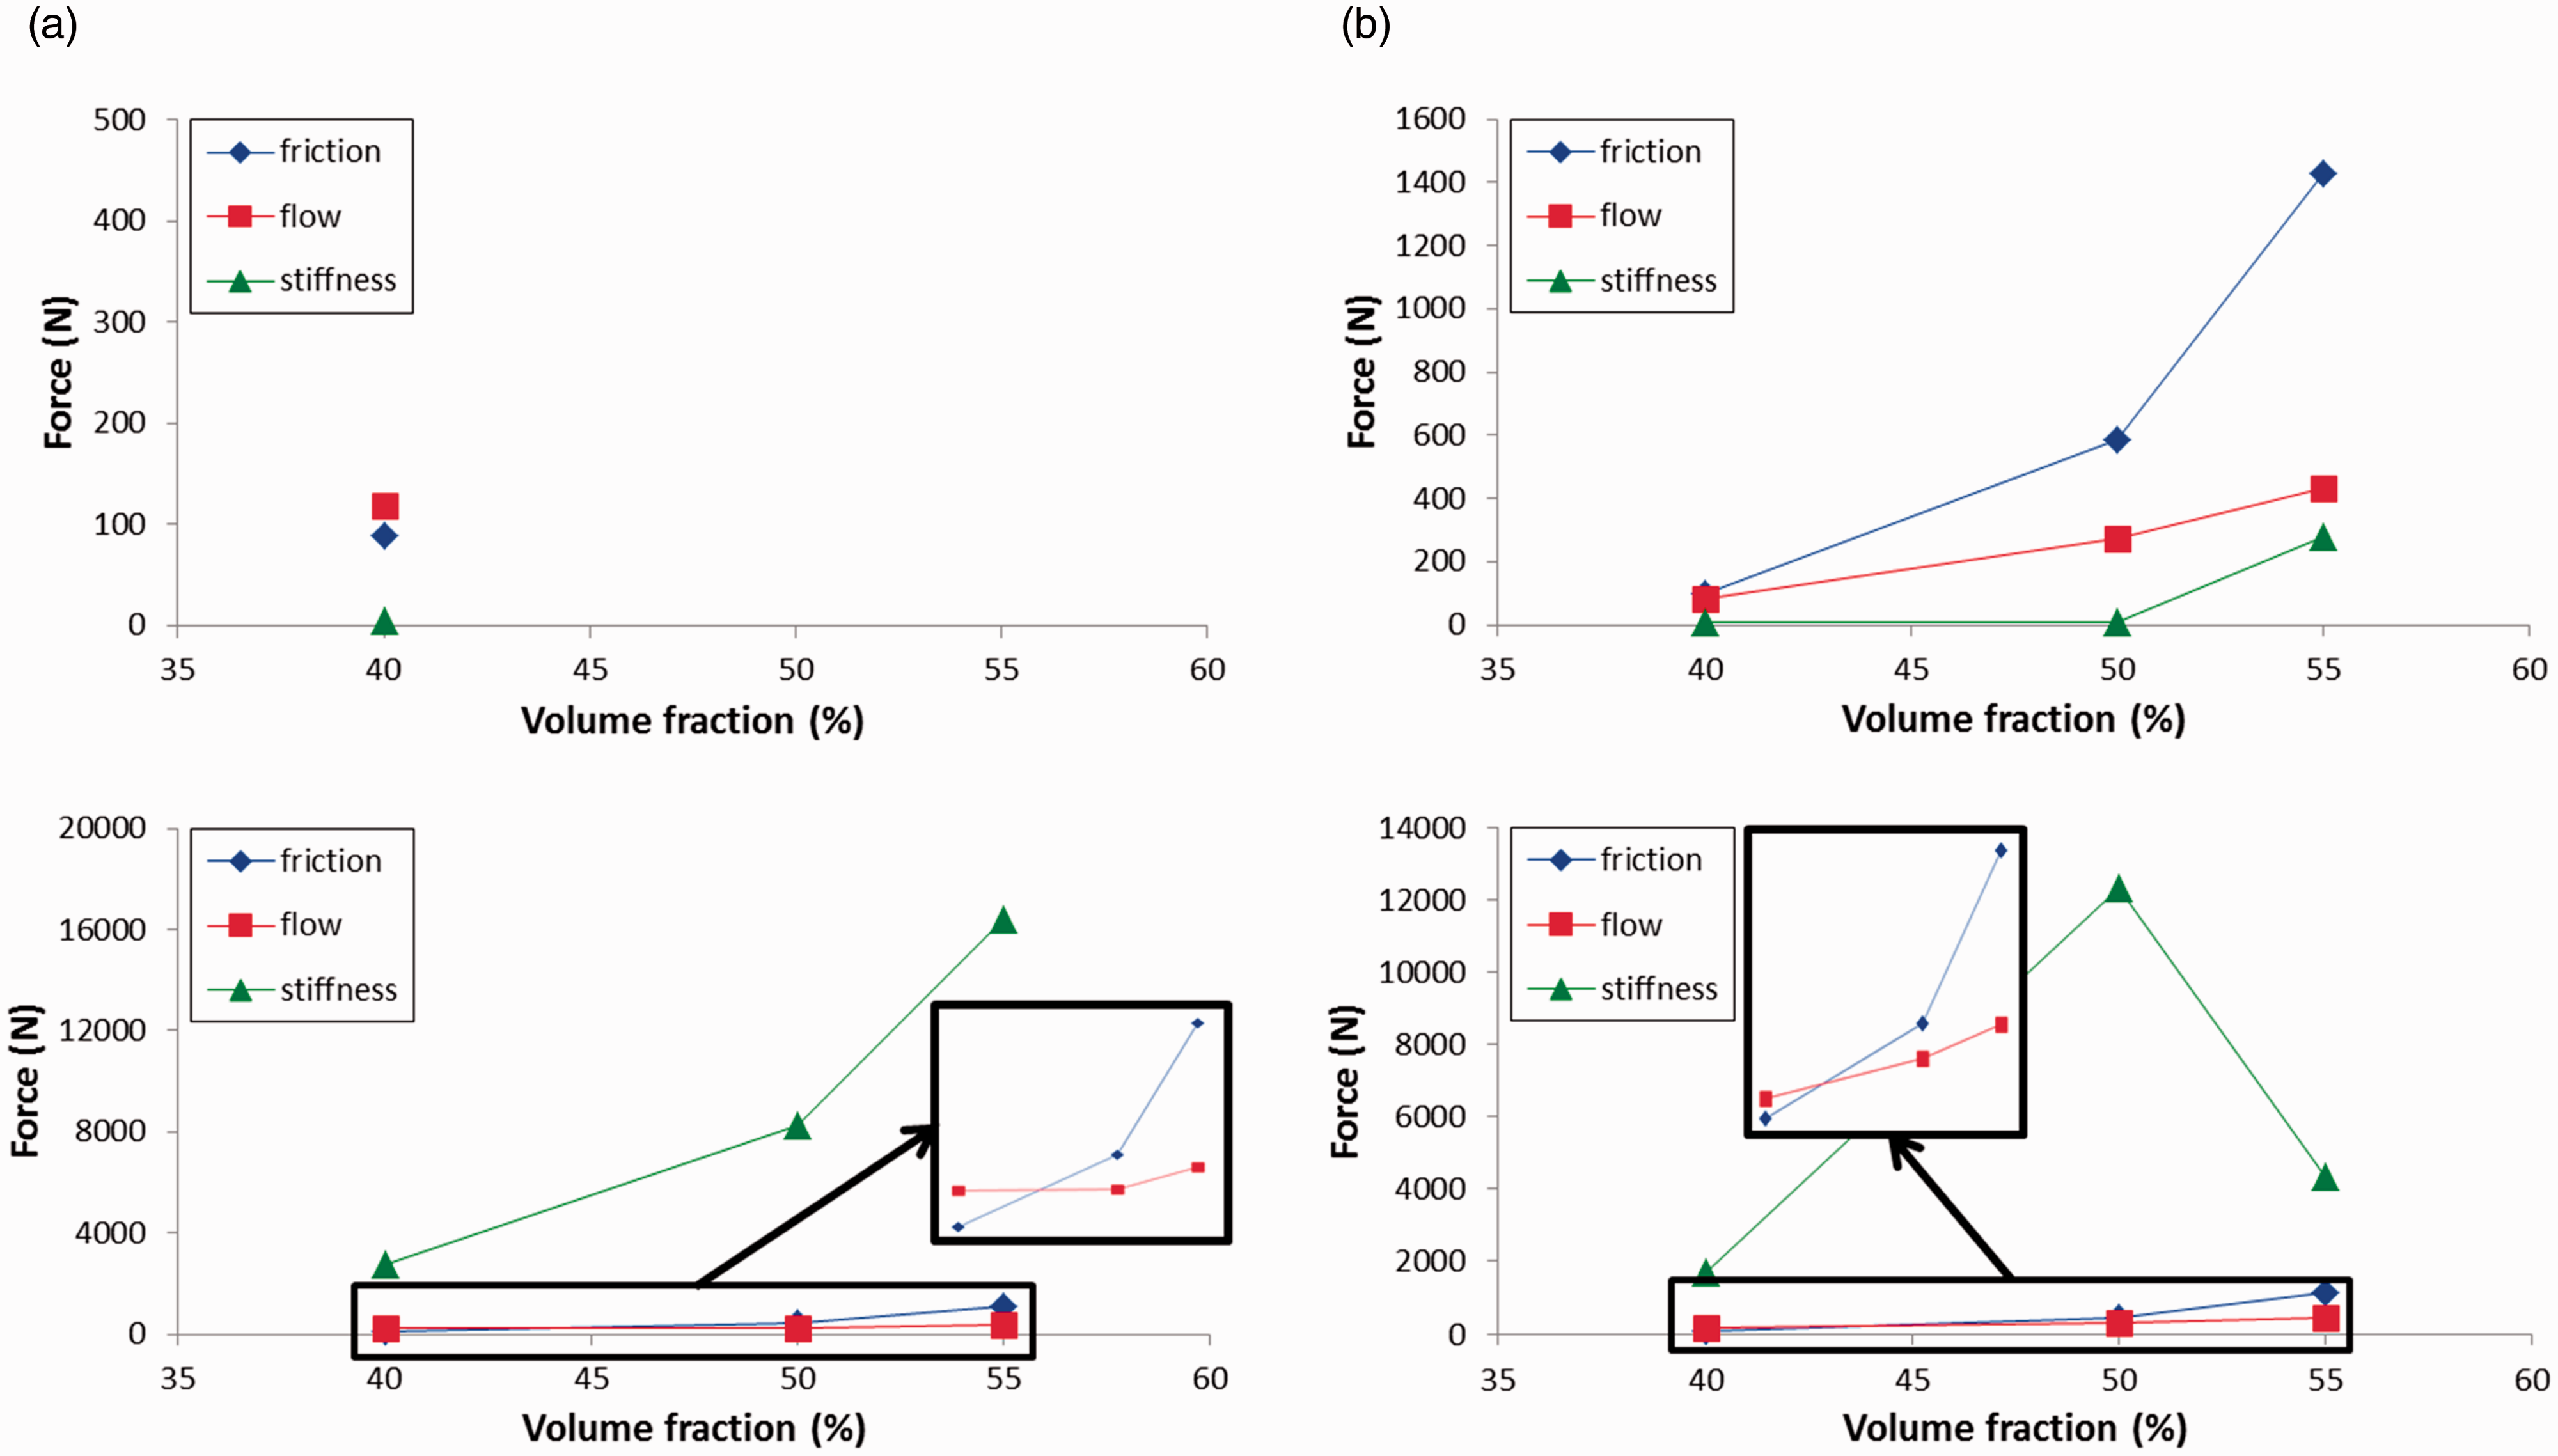
Figure 11 shows the development of flow pressure and the displacement of 90°-oriented UD fabric with volume fractions of 40%, 50%, 55% at flow rates of 0.838 and 2.513 cm3/s. Rigid body deformation after occurrence of local deformation is shown in the volume fraction of 40% and 50%, while no deformation is shown in the case of 55% at both low and high flow rates. The corresponding force relationships are plotted in Figure 14. Local deformation occurs when the flow force is larger than the in-mold stiffness force but smaller than the friction force as shown in the upper plots of Figure 14(a) and (b). The lower plots of Figure 14(a) and (b) show that whether rigid body deformation occurs is determined by a comparison between the magnitudes of the forces exerted by flow and friction when in-mold stiffness force is the largest.
Comparison of the related forces by friction, flow and in-mold stiffness in the liquid molding experiment of 90°-oriented UD fabric at volume fractions of 40, 50, 55%. (a) local deformation (upper) and rigid body deformation (lower) at a flow rate of 0.838 cm3/s, (b) local deformation (upper) and rigid body deformation (lower) at a flow rate of 0.838 cm3/s flow rate of 2.513 cm3/s. UD: unidirectional.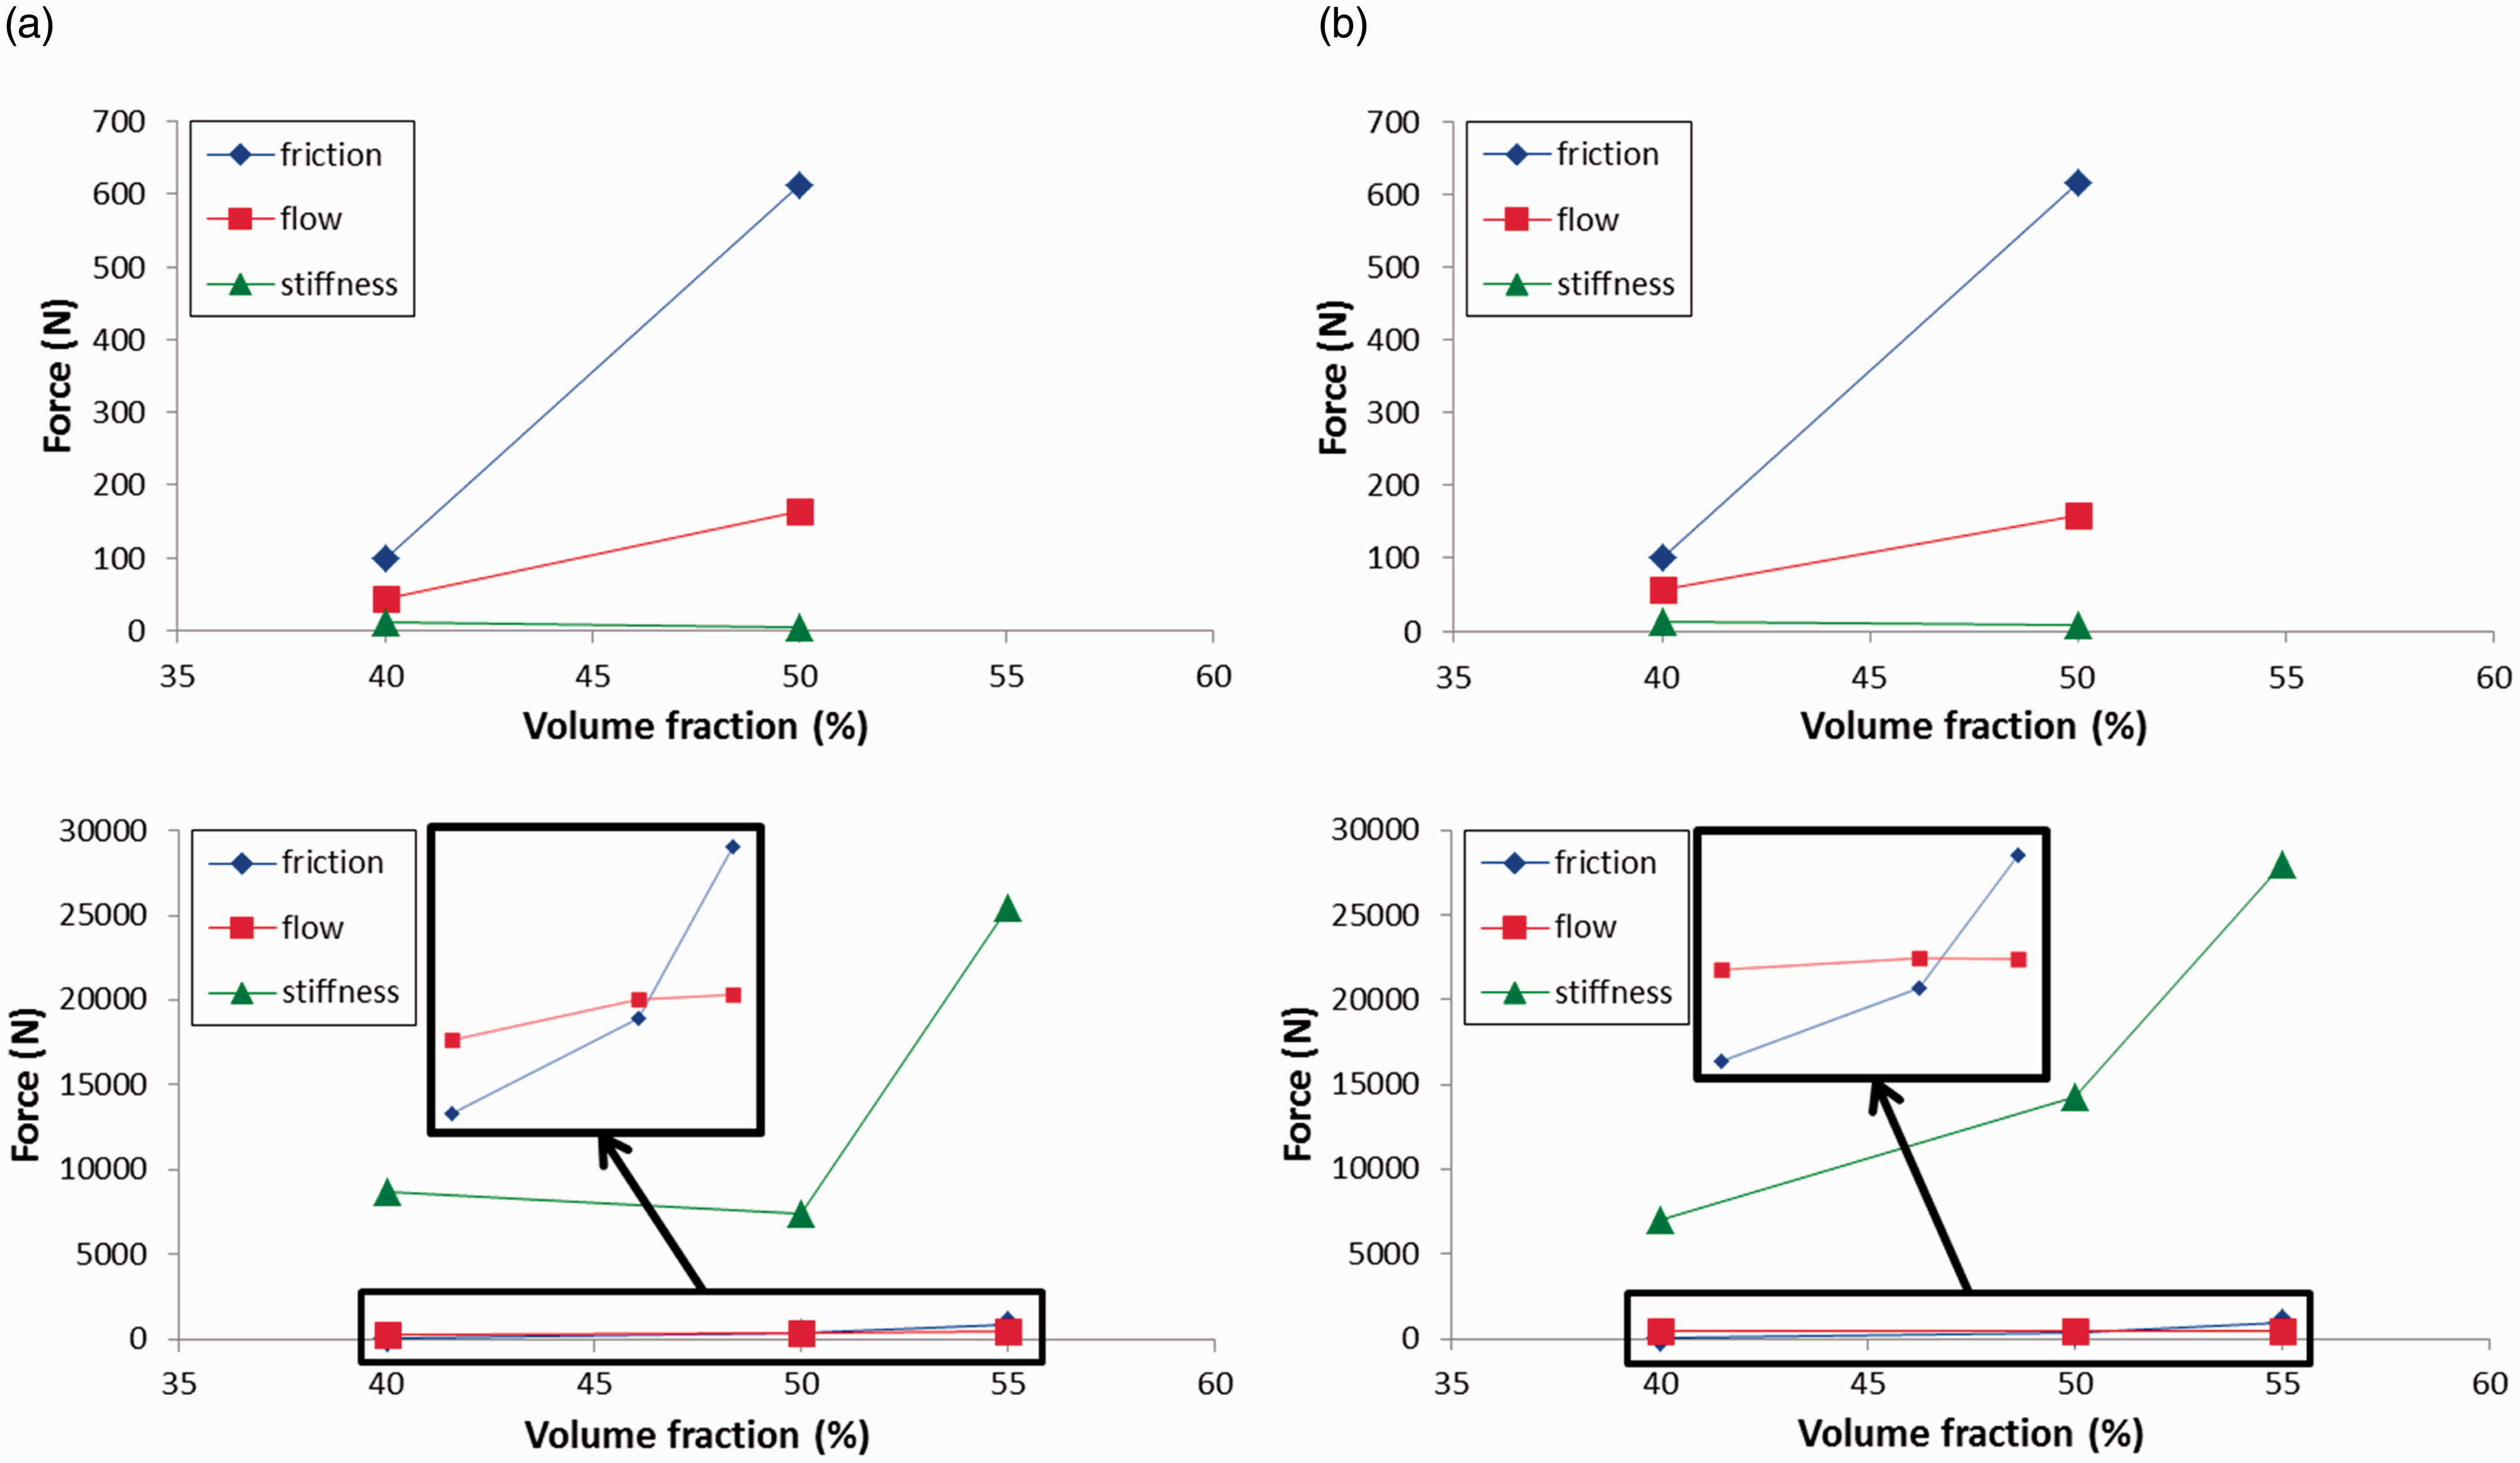
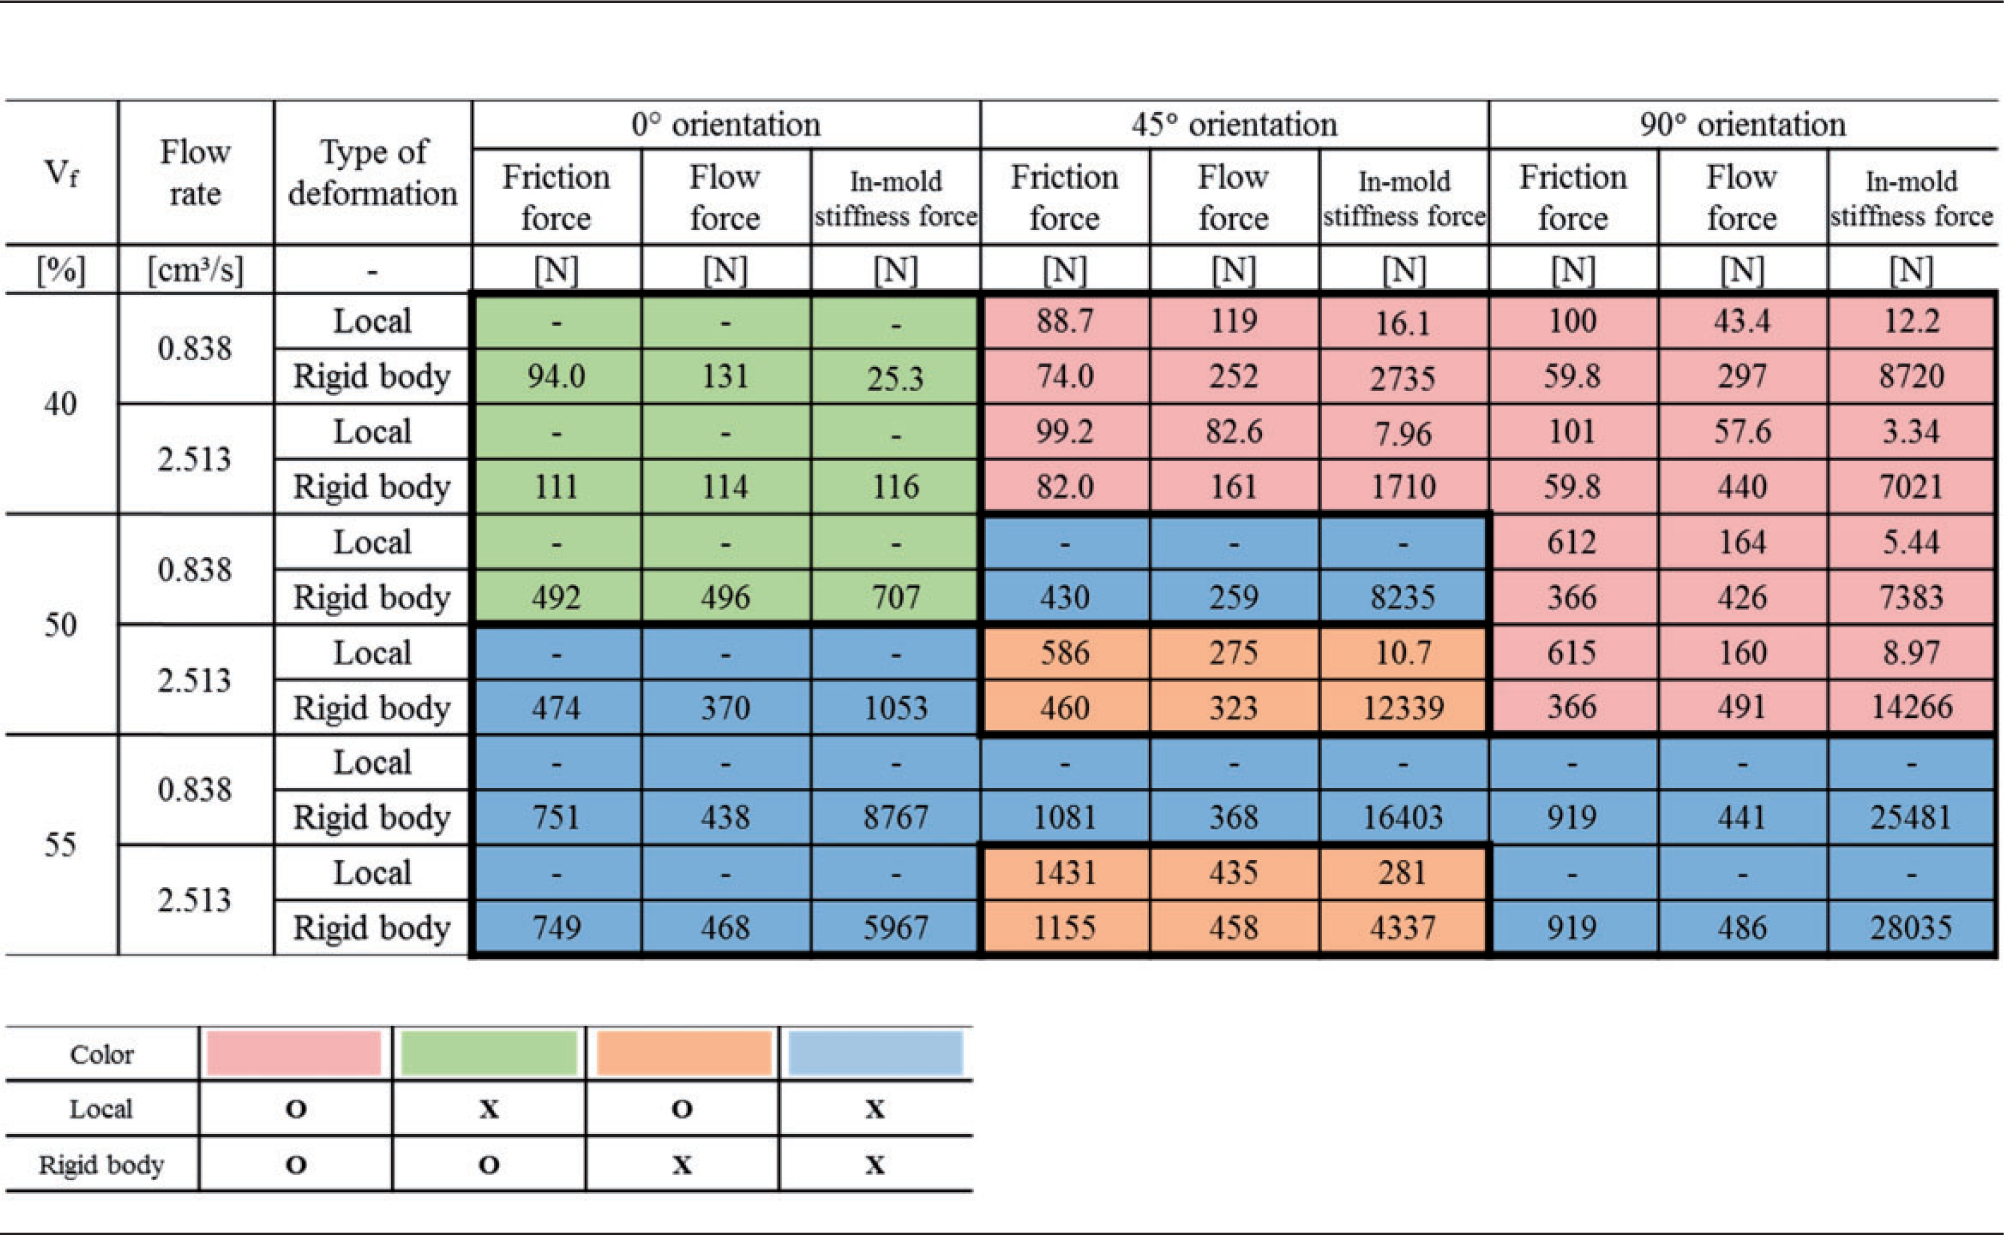
Summary of deformation and the magnitude of the related forces.
Conclusions
Experimental setups for observing the flow-induced deformation of the fiber preform and measuring the related forces in the liquid composite molding process were prepared to understand the mechanism and propose the optimum conditions for preventing the undesired fiber deformation. Three types of related forces, namely friction, in-mold stiffness and resin flow, were measured and compared with the observing result of deformation type of fiber preform. Rigid body deformation, such as slipping, occurred when the flow force was larger than the friction force if the in-mold stiffness force is sufficiently large. Local deformation, such as wrinkling, occurred when the flow force exceeded the in-mold stiffness force, even if it was smaller than friction force. Structural factors, such as volume fraction and orientation of fiber preform, and process conditions, such as flow rate, mainly influenced whether local or rigid body deformations occurred. Lower fiber volume fraction and a larger orientation angle-to-flow direction caused local deformation of the fiber preform, which more likely occurred at higher flow rate. As a result, the laminate structure, including the orientation of the fiber preform, as well as the process condition should be strictly considered to prevent undesired deformation during the liquid composite molding process.
Footnotes
Declaration of Conflicting Interests
The author(s) declared no potential conflicts of interest with respect to the research, authorship, and/or publication of this article.
Funding
The author(s) disclosed receipt of the following financial support for the research, authorship, and/or publication of this article: This research was supported by the Carbon Valley Program by the Ministry of Trade, Industry and Energy (Korea, R0000687) and the Principal Research Program in the Korea Institute of Materials Science (KIMS) through the National Research Foundation of Korea (NRF) funded by the Ministry of Science, ICT and Future Planning (Korea).