
Abstract
We investigated the tribological behavior of polyacetal polyoxymethylenecomposite filled with rice bran ceramics particles under water lubrication, compared to those of polyoxymethylene composites filled with glass beads and glass fibers. Furthermore, the local contact pressure between a particle and the paired ball was calculated based on a simple contact model. The polyoxymethylene/rice bran ceramics composite showed low wear (ws < 10−8 mm2/N) and low friction (μ < 0.10) under water lubrication, irrespective of the normal load and sliding velocity. On a Stribeck curve, the lubrication condition of the polyoxymethylene/rice bran ceramics composite appeared to be near hydrodynamic lubrication. The specific wear rates of the polyoxymethylene/rice bran ceramics composite were the lowest of the composites, regardless of the bearing characteristic number. A smooth worn surface was observed for both the polyoxymethylene/rice bran ceramics composite and the paired ball. The dimensionless roughness parameters of the polyoxymethylene/rice bran ceramics composite were smaller than 1.0, irrespective of the bearing characteristic number. The friction coefficients of the polyoxymethylene composites decreased exponentially with decreasing dimensionless roughness parameter; the low friction of the polyoxymethylene/rice bran ceramics composite resulted from the small roughness parameters. The rice bran ceramics particles indicated a small contact pressure per particle, which was nearly half the Vickers hardness of the steel ball. As a result, the rice bran ceramics particles rarely damaged the steel ball with increasing surface roughness. Therefore, the low friction of the polyoxymethylene composite filled with the rice bran ceramics particles was attributable to the decrease in the roughness, e.g., polishing without the formation of a transfer film and the filler detachment.
Introduction
Water lubrication systems have attracted attention as substitutes for oil or grease lubrication, especially in machines using water as a working fluid. Oil or grease lubrication has the potential for leakage issues. For example in marine applications, there is the possibility of leaks into the seawater due to unexpected incidents. 1 Accordingly, the US Environment Protection Agency (EPA) enacted the 2013 Vessel General Permit, which limits the use of bearing oil, except of environmentally acceptable lubricants, in vessels entering the US. 2 In addition, water lubrication can reduce environmental burdens, simplify machinery, and reduce maintenance costs. However, water lubrication has an issue with low viscosity, and the water film at the contact interface is likely to break. As a consequence of such a breakage, high friction and wear will occur. Even though water lubrication is desirable, it is necessary to select the preferable sliding material carefully and it is important to develop a low friction and low wear tribomaterial under water lubrication, irrespective of the lubrication conditions, under a wide range of normal loads and sliding velocities.
Polyacetal (polyoxymethylene, POM) is an engineering plastic. It possesses high strength, flexural modulus, deflection temperature, creep resistance, and fatigue resistance, excellent resistance against solvents, and low water absorbability. 3 In addition, it has low friction and wear properties, allowing it to be used as a material for bearings, gears, and several tribological elements.4–6 Therefore, POM is a promising as a tribomaterial under water lubrication. In fact, the friction coefficient of pure POM under water lubrication is relatively low: 0.13 at a contact pressure of 5 MPa and a sliding velocity of 0.25 m/s. 7 Polytetrafluoroethylene (PTFE) is often used as a filler to reduce the friction under water lubrication; however, the friction coefficient slightly increases as does the specific wear rate. 7 Furthermore, a POM/PTFE composite filled with glass fiber (GF) has a higher friction coefficient and a higher specific wear rate than POM or the POM/PTFE composite. 7 Therefore, an alternative filler for water lubrication is desired.
To improve the mechanical and tribological properties of polymers, carbon fiber is often used as reinforcement under dry conditions. Omrani et al. 8 revealed that increasing the volume fraction of carbon fibers in epoxy composites led to a decrease in the coefficient of friction and wear loss under dry conditions, while the tribo-surfaces showed a smoother appearance. Natural carbon materials have also attracted attention as reinforcements. 9 Barari et al. 10 introduced nano-cellulose fiber-reinforced bio-epoxy composites, as “Green” composites. Furthermore, they found that the composites formed a uniform tribo-layer during sliding, minimizing the direct contact and therefore resulting in a reduction in both the friction and the wear. Rice bran ceramics (RBCs) have also attracted attention as prospective fillers. The RBCs are hard porous carbon materials made from rice bran. 11 RBC particles are prepared by carbonizing a mixture of defatted rice bran (75% by mass) and resol-type phenolic resin (25% by mass) at 900℃ in an inert gas atmosphere. This ceramic material is composed of soft amorphous carbon corresponding to the defatted rice bran and hard glassy carbon corresponding to the phenol resin. The material is a high-performance and multifunctional material with high hardness, high strength, low density, a porous structure, and a low Young’s modulus. 12 In previous studies, the tribological properties of a RBC particle-filled polyamide 66 (PA66) composite and a glass bead (GB)-filled PA66 composite under dry conditions were investigated.13,14 According to the results, the PA66/RBC and PA66/GB composites show lower friction and wear compared to pure PA66. Furthermore, the wear volume of the PA66/RBC composite is lower than that of the PA66/GB composite. It was revealed that these fillers were effective at preventing plastic flows and roll-shaped wear particles, which affect the wear. According to the results, a resin composite filled with RBC particles could also be a tribomaterial under water lubrication. However, PA66 is difficult to manage in water due to its high hydrolyzability.
Based on this background, we investigated the tribological behavior of a POM composite filled with RBC particles under water lubrication, compared to those of POM composites filled with GBs and GFs.
Experimental details
Material preparation
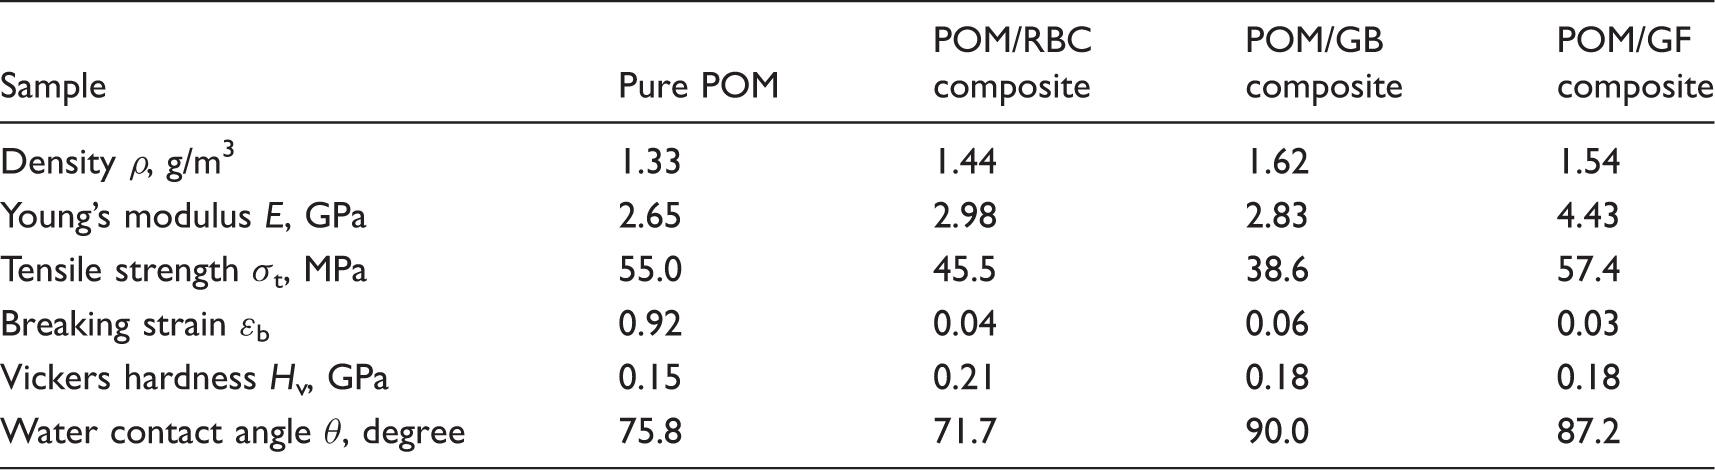
RBC particles and GBs, which are commercially available from Sanwa Yushi Co. Ltd., Japan and Potters-Ballotini Co. Ltd., Japan, respectively, were used as particulate fillers. GFs, which are commercially available from Central Glass Fiber Co. Ltd., Japan, were used as the fibrous filler. Figure 1 shows scanning electron microscopy (SEM) images of the fillers. The mean diameters of the RBC particles and GBs were 4.9 µm and 5.0 µm, respectively. The mean diameter and length of the GFs were 6.0 µm and 50 µm, respectively. The RBC particles, GBs, and GFs had elastic moduli of 21.3 GPa, 58.9 GPa, and 235 GPa, respectively. The elastic modulus of the RBC particles was measured using a nanoindenter; the other values were the catalog specifications given by the filler providers. No agent was used on the surfaces of the fillers. The fillers were individually compounded with pure POM resin via kneading. Then, a disk-shaped composite sample was manufactured via injection molding, ϕ50 × 3.1 mm. The fraction of filler was 20% by volume. A pure POM sample was prepared using the same molding process. The test surfaces of the disk specimens were polished using a waterproof abrasive paper (#2000). The polished surface roughness (Ra) was 0.1 µm. The mechanical properties and the water contact angle of the samples are shown in Table 1. The tensile strength decreased when filling with the particulate fillers and increased slightly when filling with the fibrous filler. This may be because the filler surfaces were not treated with any coupling agents. For the GFs, the Young’s modulus increased considerably compared to the pure resin. The POM/RBC composite showed the highest hardness. Tribomaterials used in industry are usually operated in elastic contact conditions. Therefore, the tribological properties at the elastic contact are important. To consider the contact condition, i.e., elastic or plastic, the critical contact pressure (P*) where plastic deformation starts to occur was calculated. For a spherical indenter, the onset of plastic deformation occurs when P* = 1.1 Y (Y is the yield strength).
15
In addition, the Vickers hardness (Hv) can be calculated from the yield strength (Y) based on Tabor’s relationship for polymers (Hv = 1.4 Y).
15
This calculation indicates that the critical contact pressures of the POM/RBC, POM/GB, and POM/GF composites and pure POM were 165 MPa, 141 MPa, 141 MPa, and 118 MPa, respectively. The friction test conditions were selected so that the actual contact pressures were smaller than the calculated critical contact pressures. Regarding the water contact angle that of the POM/RBC composite was smaller than that of pure POM, while conversely, that of the POM/GB and POM/GF composites was greater. This indicates that the RBC particles improved the water wettability and the GBs and GFs degraded the water wettability. Because the surface roughness was nearly the same value within the materials, the differences in the chemical properties of the fillers affected the wettability.
SEM images of the fillers: (a) RBC particles; (b) GBs; and (c) GFs. Mechanical properties of the samples. POM: polyoxymethylene; RBC: rice bran ceramics; GB: glass bead; GF: glass fiber.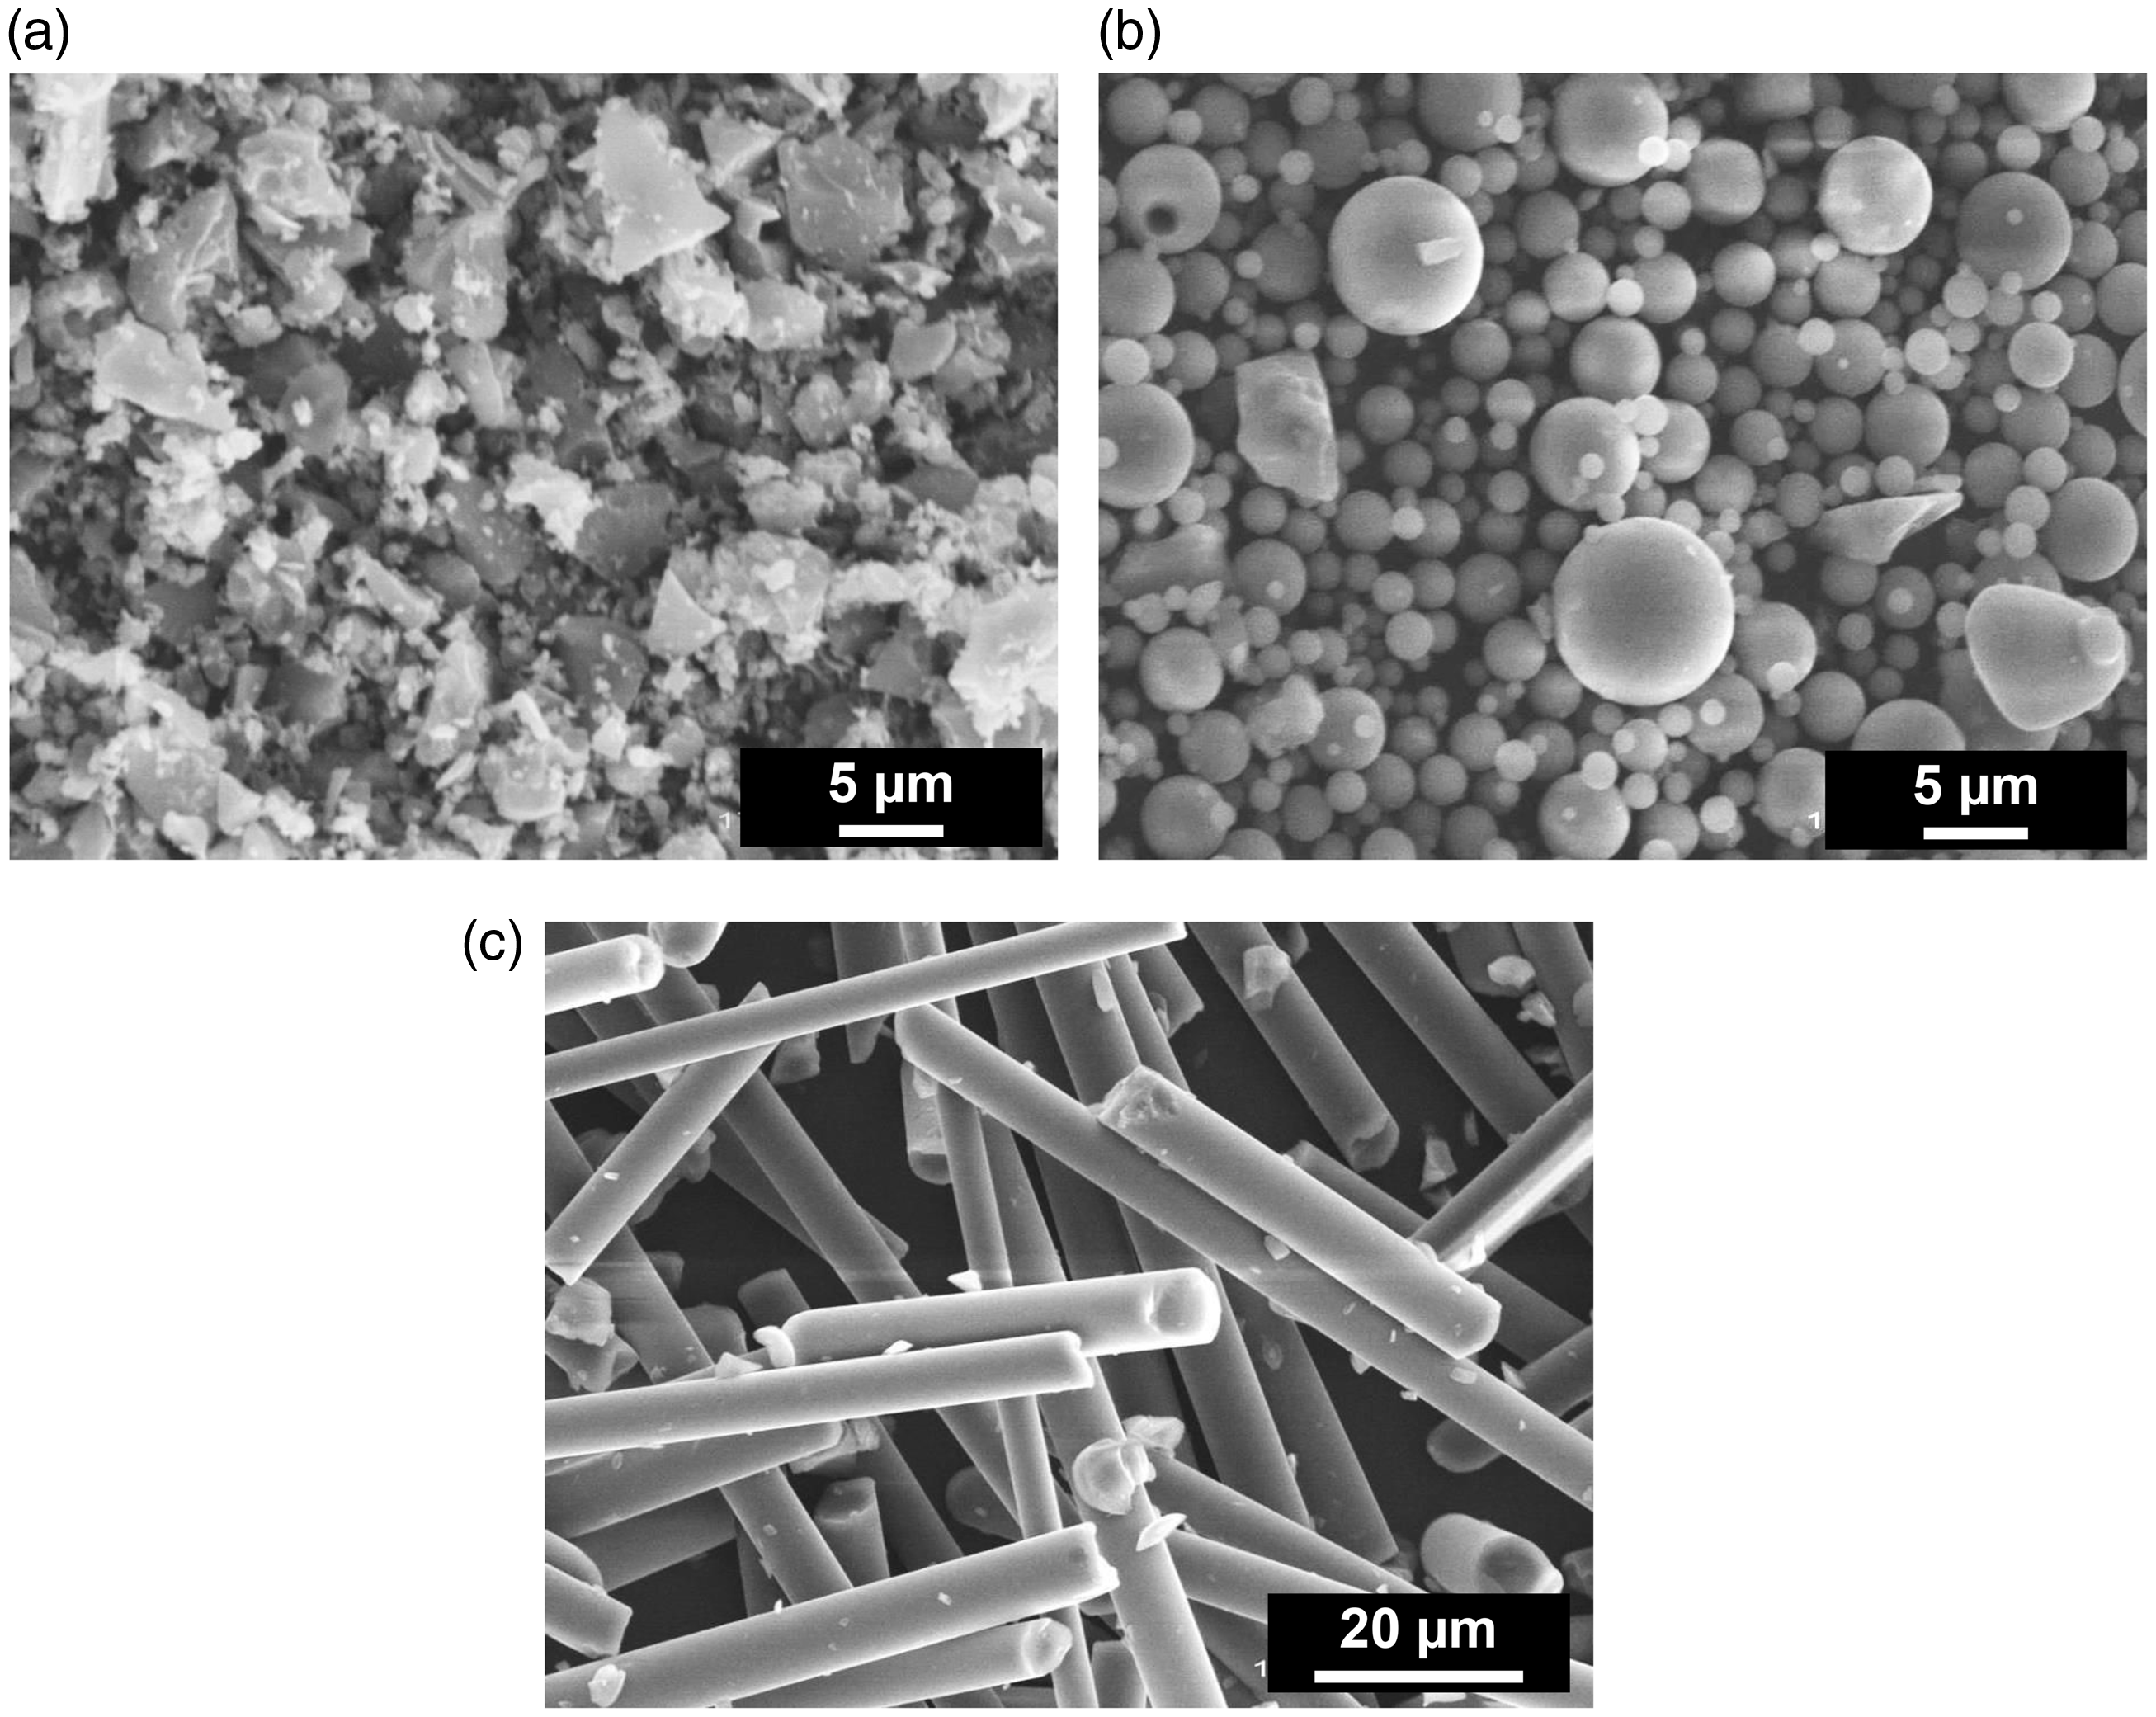
Tribological testing
Friction tests were conducted using a ball-on-disk-type friction tester (TYPE: 20, SHINTO Scientific Co. Ltd., Japan) under water lubrication. The POM/RBC, POM/GB, and POM/GF composites and pure POM were used as disk specimens. The 8-mm diameter ball specimen was made of austenitic stainless steel. The surface roughness (Ra) of the ball was 0.30 µm. The normal loads (W) were 0.98 N, 4.90 N, and 9.81 N, which corresponded to Hertzian mean contact pressures (P) of 35 MPa, 60 MPa, and 75 MPa for the POM/RBC composite, 34 MPa, 58 MPa, and 73 MPa for the POM/GB composite, 45 MPa, 77 MPa, and 98 MPa for the POM/GF composite, and 32 MPa, 55 MPa, and 70 MPa for the pure POM, respectively. Therefore, all the contact pressures were smaller than the critical pressures (P*) calculated in the previous section. The sliding velocities (v) were 0.1 m/s, 0.5 m/s, 1.0 m/s, and 2.0 m/s. The number of friction cycles was 1 × 10⁴. A water bath with disk holders was filled with purified water, and the disk specimens were fixed in the bath. The friction coefficient was calculated based on the friction torque from a torque meter. To eliminate the effect of the potential eccentricity of the shaft of the rotation stage on the friction coefficient, the data were filtered by a 1-Hz low-pass filter. The wear volume of the disk specimens was calculated based on the profile curve of the wear track from a profilometer. The specific wear rate was calculated as the wear volume, which is divided by the sliding distance and the normal load. The environmental temperature of the test room was 21.0 ± 2℃.
Results and discussion
Friction coefficient and specific wear rate
Figure 2 shows the representative variation in the friction coefficient with respect to the friction cycle. At high normal load and low sliding velocity (Figure 2(a)), the POM/RBC composite had stable and low friction coefficients compared to pure POM and the POM/GB and POM/GF composites. At low normal load and high sliding velocity (Figure 2(b)), the friction coefficient of the POM/GB composite was the highest. In addition, the friction coefficient of the POM/RBC composite was comparable to that of the POM/GF composite. In Figure 2(b), the fluctuation of the friction coefficient was emphasized by the low magnitude of the friction force, i.e., the strong effect of the background in the voltage data.
Representative variation in the friction coefficient with respect to the friction cycle.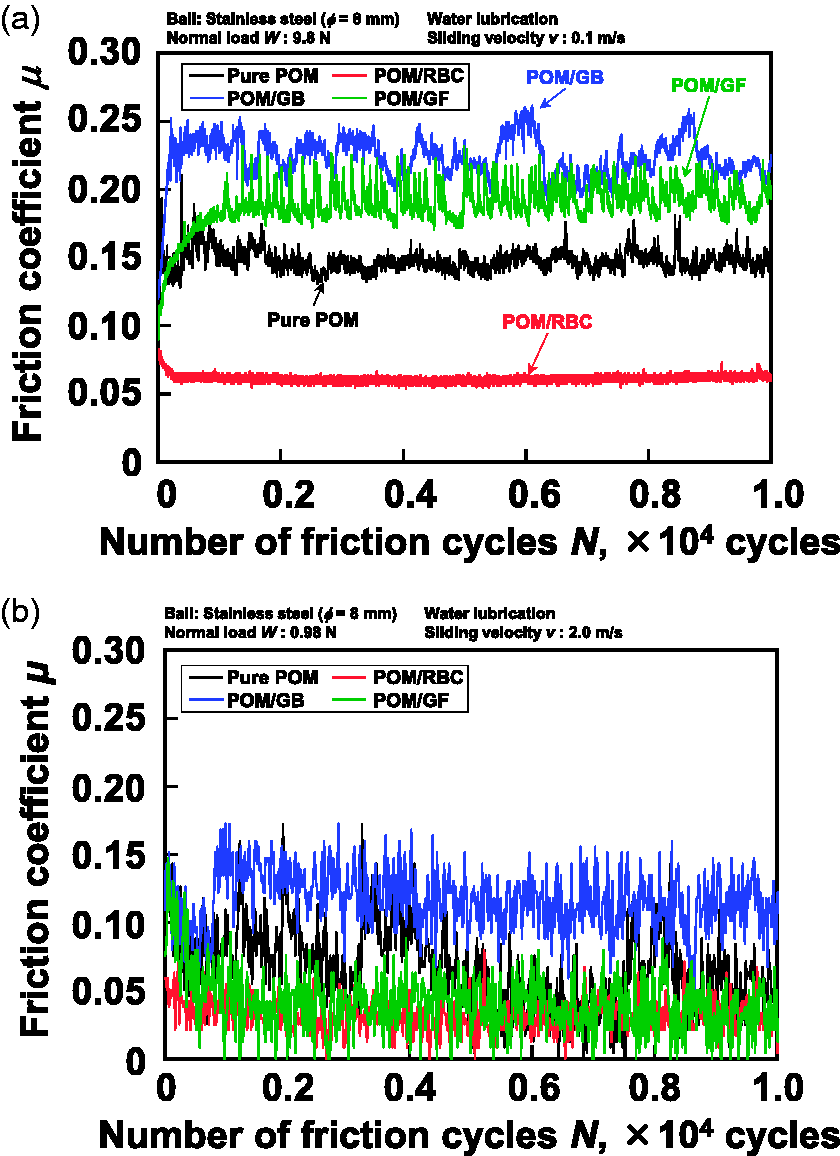
Figure 3 presents the relationship between the mean friction coefficient and the specific wear rate for all the test conditions. The mean friction coefficient was calculated from the data from the entire test period. Pure POM showed relatively low wear (ws < 10−8 mm2/N) but a wide range of friction coefficients (μ = 0.07–0.23). The GB and GF fillers significantly increased the specific wear rates. The maximum wear rates of the POM/GB and POM/GF composites were 2 × 10⁻⁷ mm2/N and 6 × 10⁻⁸ mm2/N, respectively. By contrast, the POM/RBC composite showed low wear (ws < 10−8 mm2/N) and low friction (μ < 0.09), irrespective of the test conditions.
Relationship between the mean friction coefficient and the specific wear rate.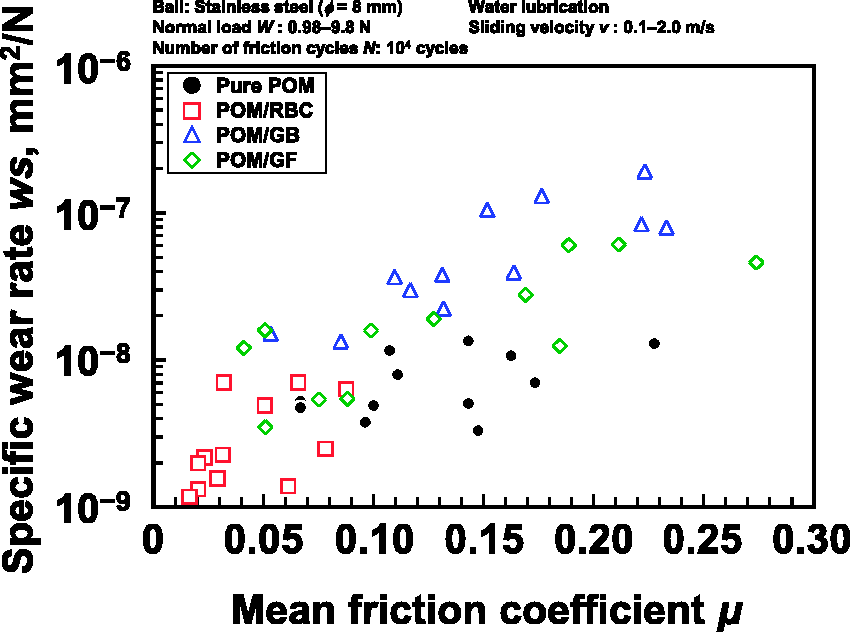
The Stribeck curve
Figure 4 illustrates the relationship between the friction coefficient and the bearing characteristic number, that is, the Stribeck curve.16,17 The bearing characteristic number (G) was calculated using the following equation
Relationship between the mean friction coefficient and the bearing characteristic number (the Stribeck curve).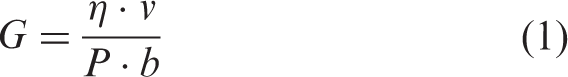
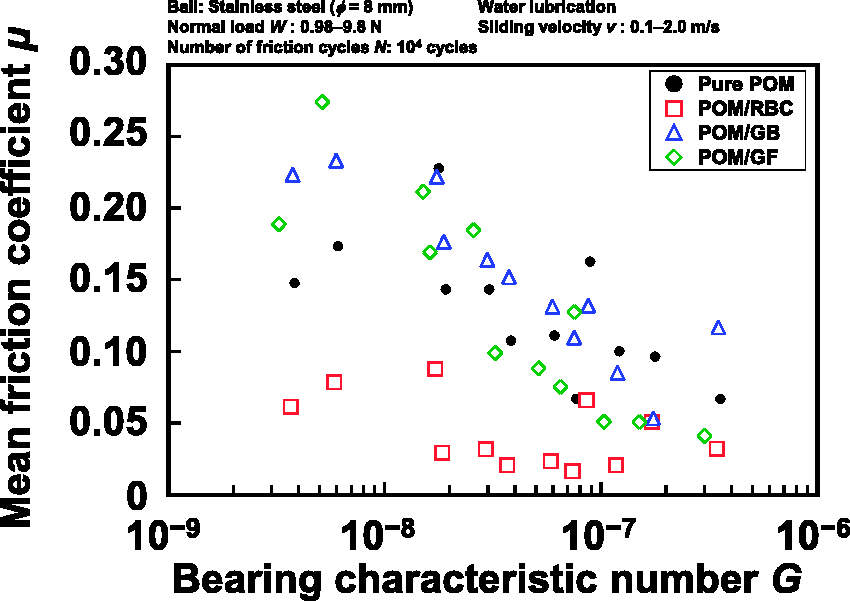
To see the lubrication conditions in detail, the film thickness was calculated from a formula for the isoviscous-elastic regime (soft elastohydrodynamic lubrication (EHL)) presented by Hamrock and Dowson. 18 The calculation indicated that the film thicknesses for all the test conditions were much smaller than the initial surface roughness. Thus, boundary lubrication was determined for all the test conditions according to traditional EHL theory. However, this calculation did not match the Stribeck curve in Figure 4. Other approaches to explain the differences in the materials were therefore required.
Figure 5 depicts the relationship between the specific wear rate and the bearing characteristic number. The specific wear rates of the POM/GB and POM/GF composites decreased with the bearing characteristic number; by contrast, the pure POM and the POM/RBC composite exhibited less variation in the specific wear rate with respect to the bearing characteristic number. The specific wear rates of the POM/GB and POM/GF composites were much larger than those of pure POM and the POM/RBC composite especially at low bearing characteristic number. This indicates that the GB and GF fillers were detached from the surface and that the detached fillers acted as three-body abrasives when the contact condition was severe, i.e., at low bearing characteristic number. Conversely, the specific wear rates of the POM/RBC composite were the lowest measured, irrespective of the bearing characteristic number. This indicates that the RBC particles played the role of an anti-wear filler without being associated with detachment.
Relationship between the specific wear rate and the bearing characteristic number.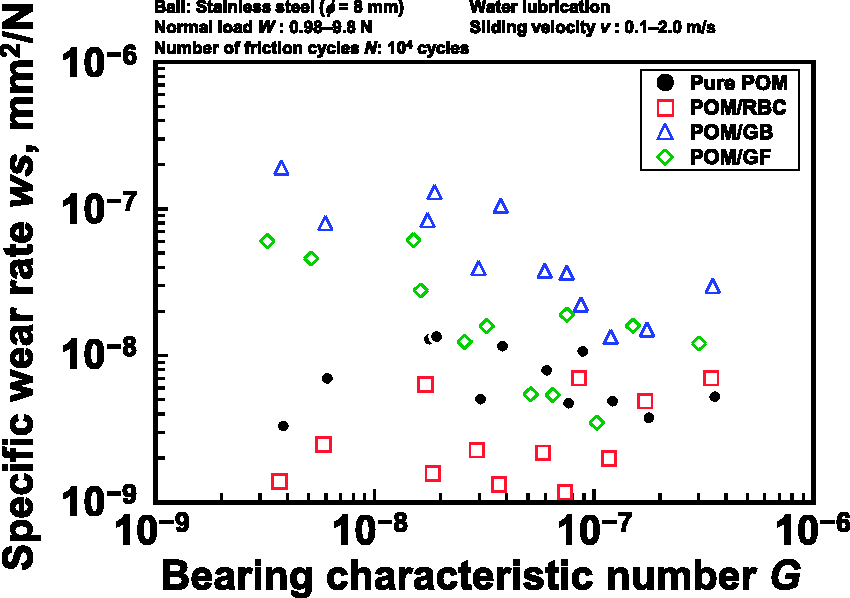
Observations of the sliding surface
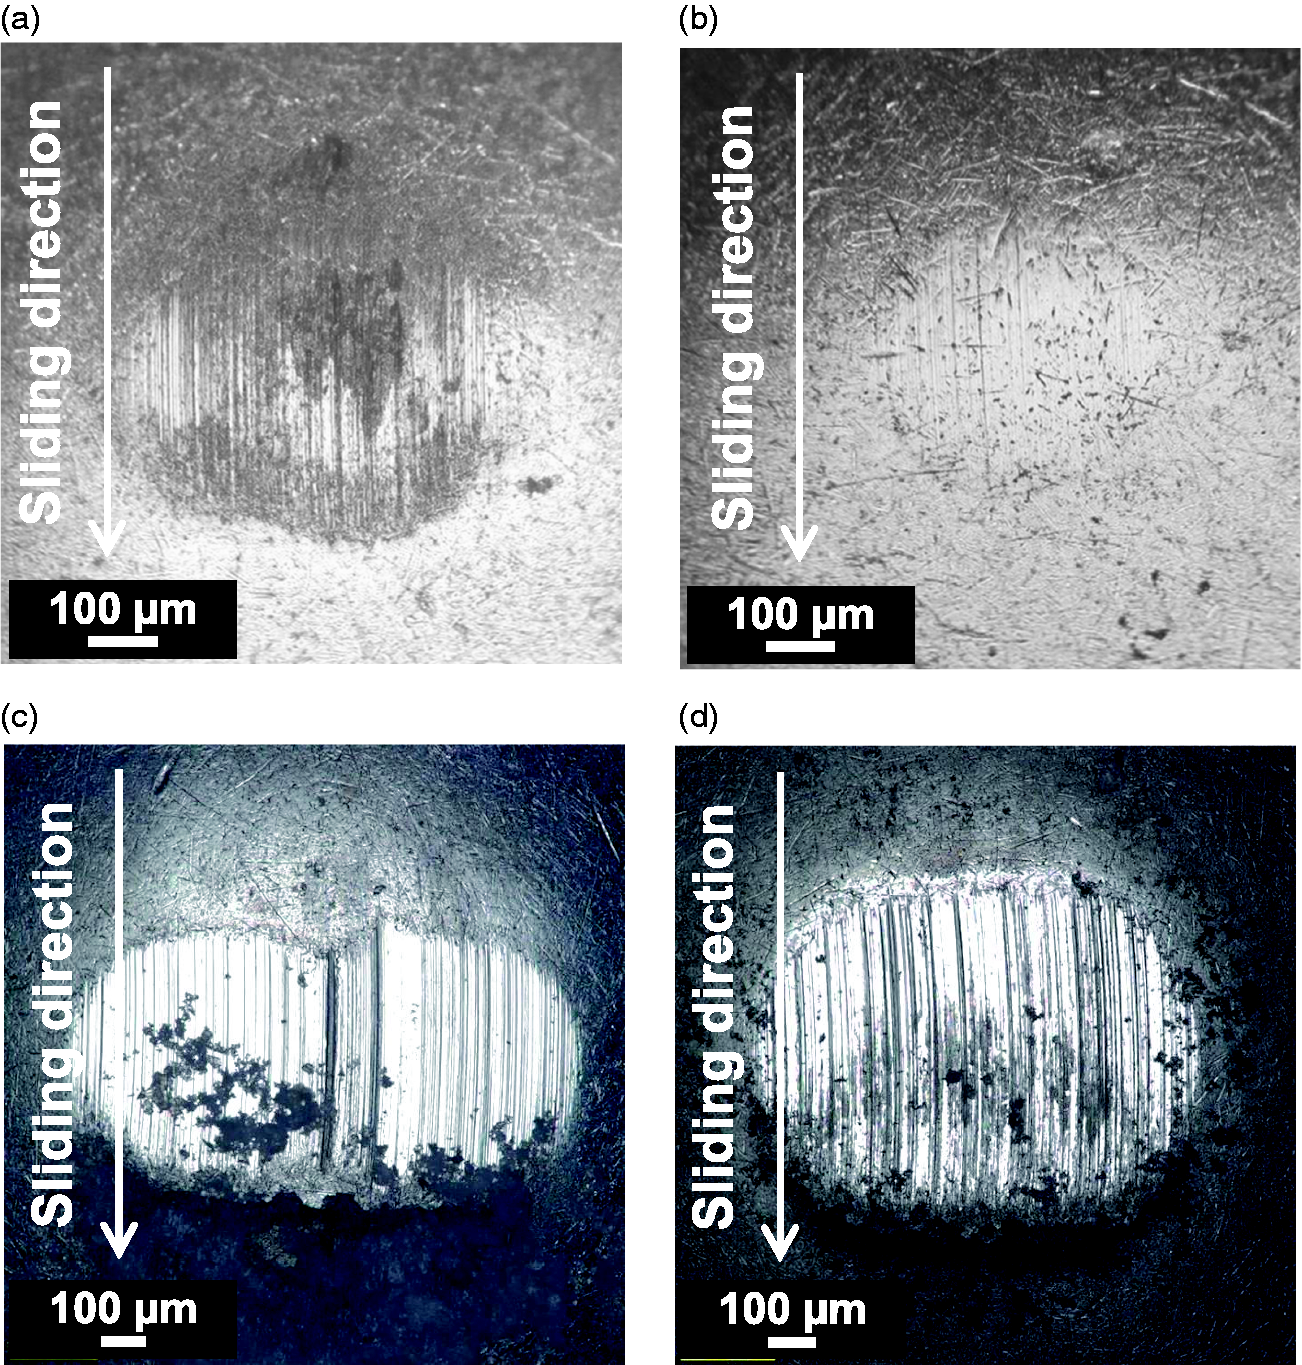
To compare the surface morphologies, SEM observations of the worn surfaces were conducted, as shown in Figure 6, where the normal load was 9.8 N and sliding velocity was 0.1 m/s. Linear marks were observed on the worn surfaces of the pure POM and POM/GB and POM/GF composites. In addition, the detachment of the fillers was observed for the POM/GB and POM/GF composites. By contrast, a smoother worn surface without filler detachmen was observed for the POM/RBC composite. Figure 7 shows the optical images of the worn ball surface at a normal load of 9.8 N and a sliding velocity of 0.1 m/s. For the ball slid against pure POM, transfer films were observed in the contact area. For the ball slid against the POM/GB and POM/GF composites, scratch marks were notably observed. This indicates that the detached fillers acted as three-body abrasives. By contrast, the initial polish marks, which were seen before the tests, remained on the surface of the ball slid against the POM/RBC composite. Figures 6 and 7 demonstrate that the roughnesses of the worn surfaces of both the disk and the ball specimens were clearly different.
SEM observations of the worn surfaces on the disks at W = 9.8 N and v = 0.1 m/s for (a) pure POM and the (b) POM/RBC, (c) POM/GB, and (d) POM/GF composites. Optical images of the worn ball surfaces at W = 9.8 N and v = 0.1 m/s vs (a) pure POM and the (b) POM/RBC, (c) POM/GB, and (d) POM/GF composites.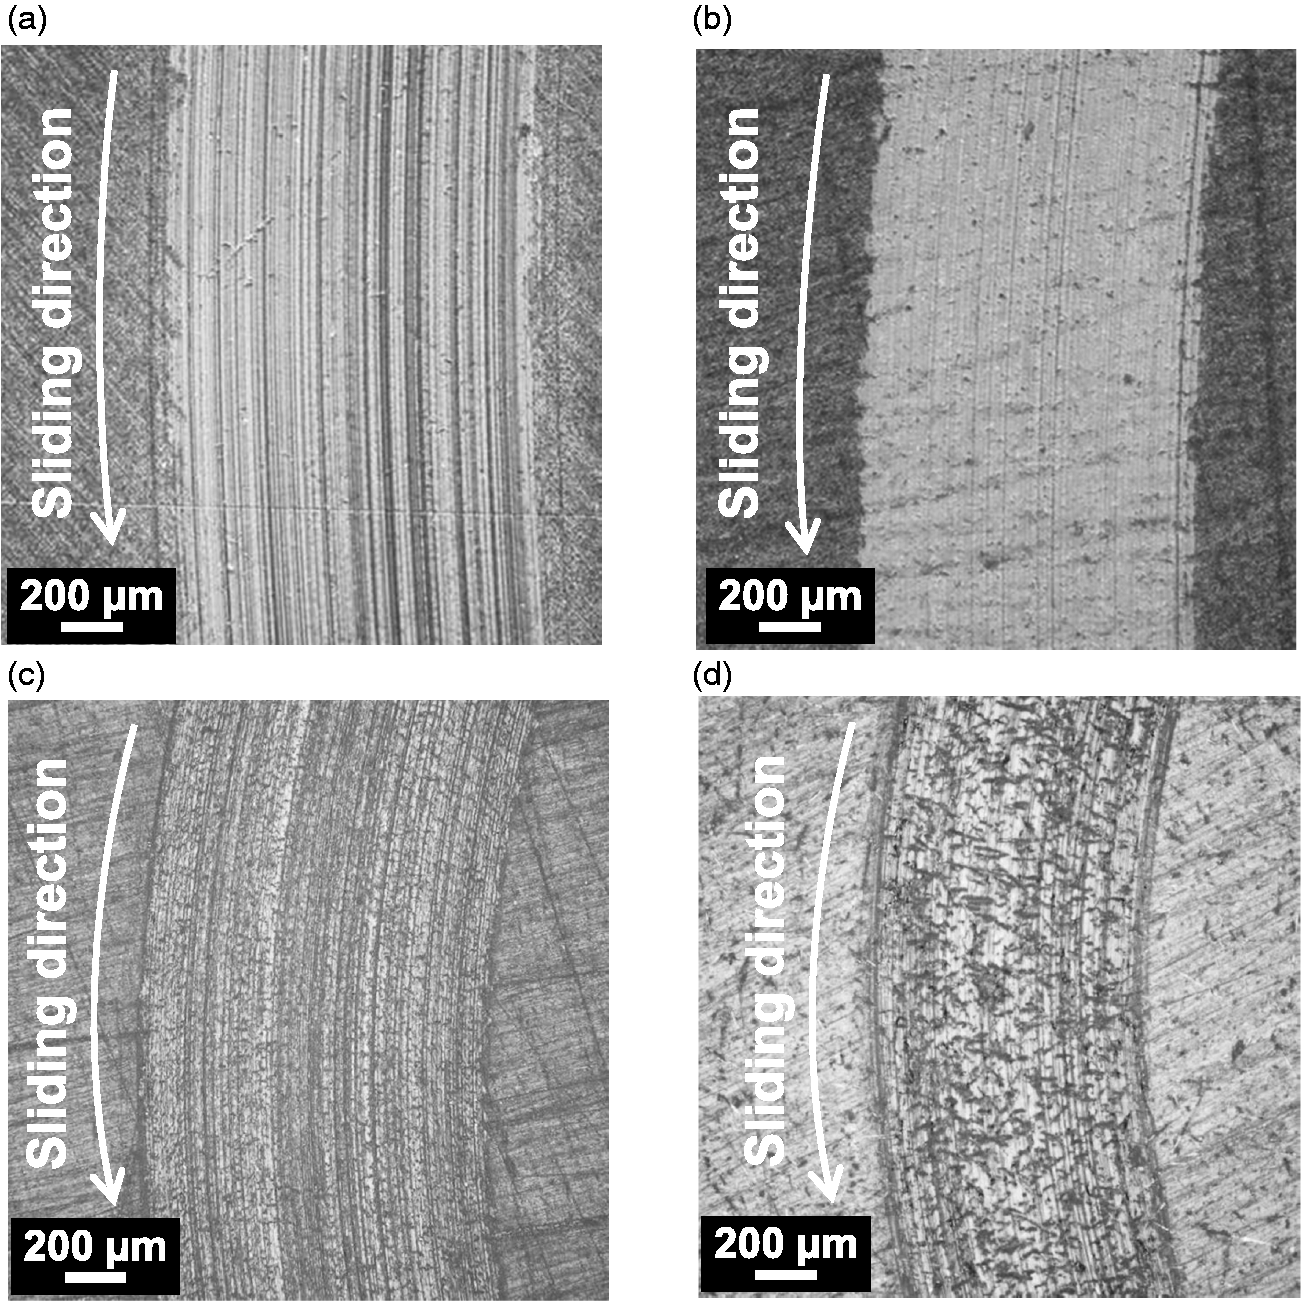
Effect of the surface roughness on the friction coefficient
Figure 8 depicts the relationship between the roughnesses of the wear track of the ball and disks. The worn surface roughnesses of the pure POM and the POM/GB and POM/GF composite disks increased after the tests. Conversely, the surface roughnesses of the POM/RBC composite disk and the paired ball decreased after the tests, which matched the results of the observations in Figures 6 and 7. The RBC particles can therefore polish the worn surface of the paired ball. To see the change in the magnitude of the roughness before and after the tests, a dimensionless roughness parameter was defined via the following equations
Relationship between the roughnesses of the wear tracks of the ball and the disks. Relationship between the dimensionless roughness parameter and the bearing characteristic number.
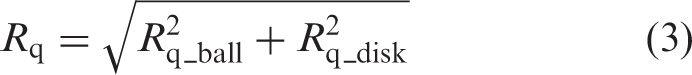

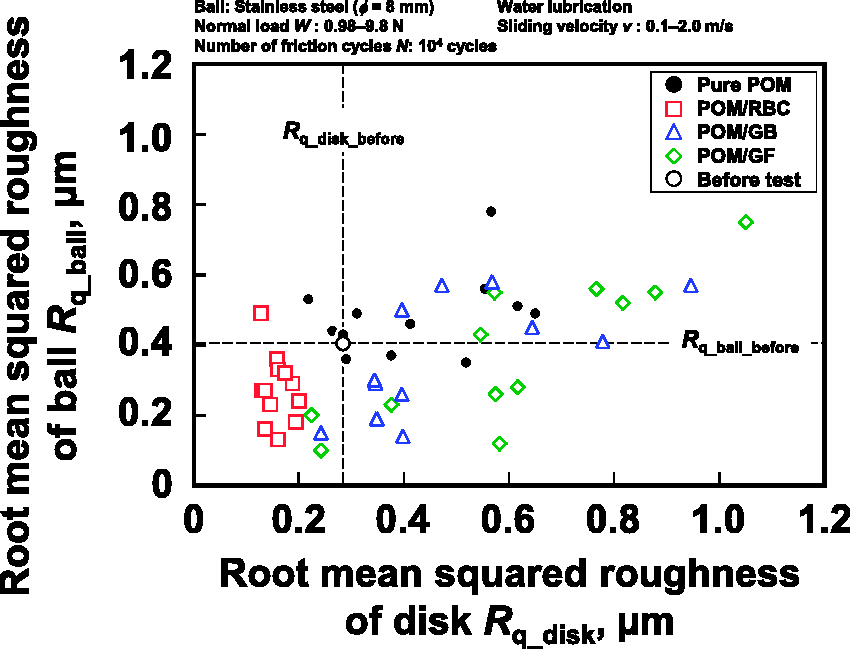
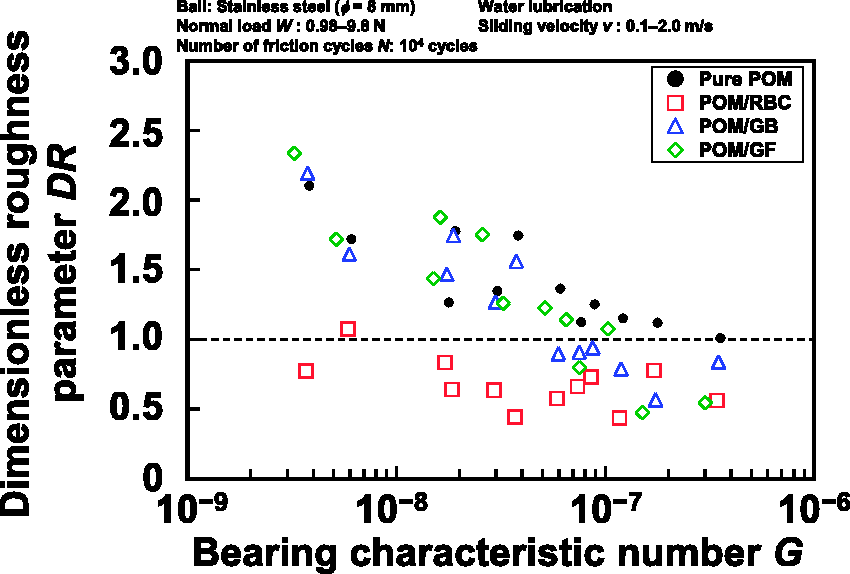
Figure 10 shows the relationship between the friction coefficient and the dimensionless roughness parameter. The friction coefficients decreased exponentially with decreasing roughness parameter. When the surface roughness became larger, i.e., the dimensionless parameter exceeded 1.0, the local pressure at the contact interface has become high. Therefore, the direct contact between the resin disk and the steel ball without a water film frequently increased in that case. By contrast, the roughness parameters of the POM/RBC composite were small. Schipper et al.
19
suggested that micro-EHL is possible with the boundary lubrication condition below a certain value of surface roughness. The occurrence of micro-EHL indicates the presence of a thin lubrication film between the interacting asperities. In the case of a small roughness parameter, such micro-EHL may occur on the top of the surface asperities.
Relationship between the mean friction coefficient and the dimensionless roughness parameter.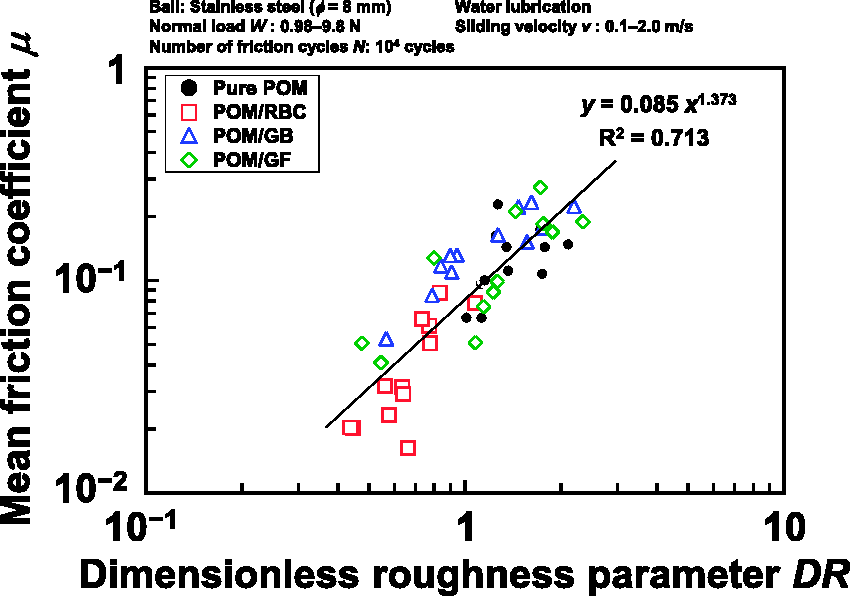
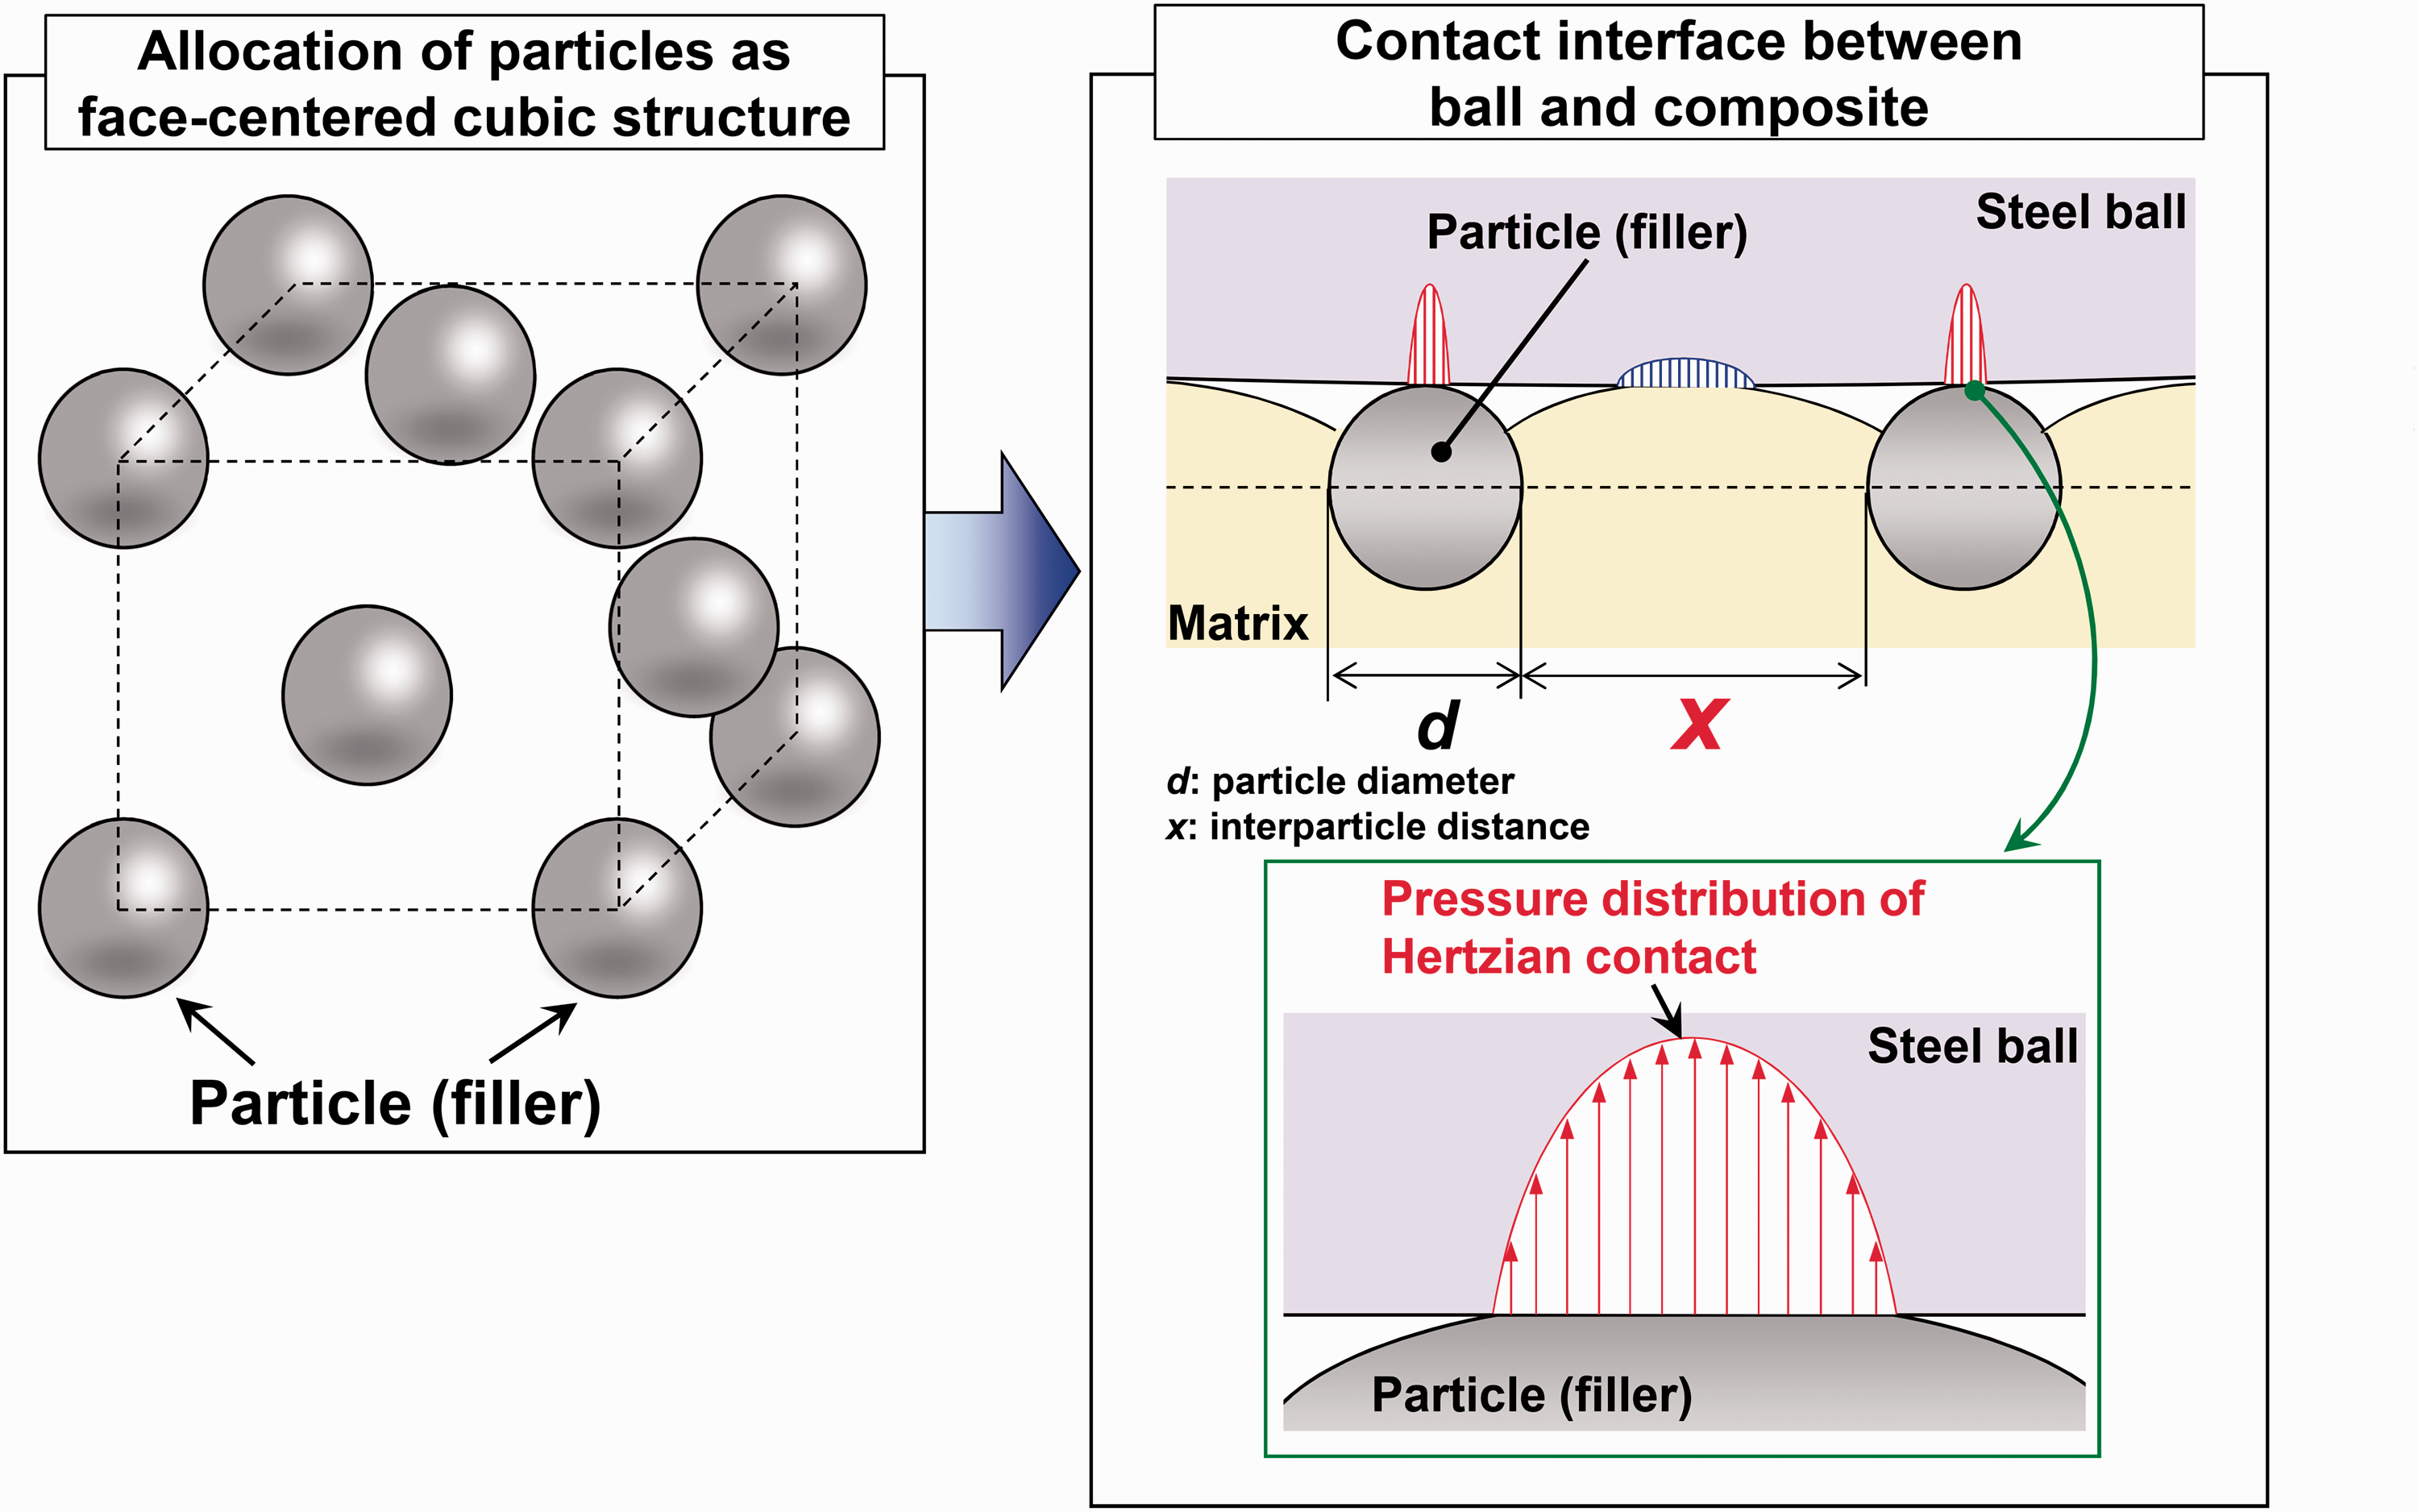
To consider the severity of the filler contact, the local contact pressure between a particle and the steel ball was calculated from the following equation
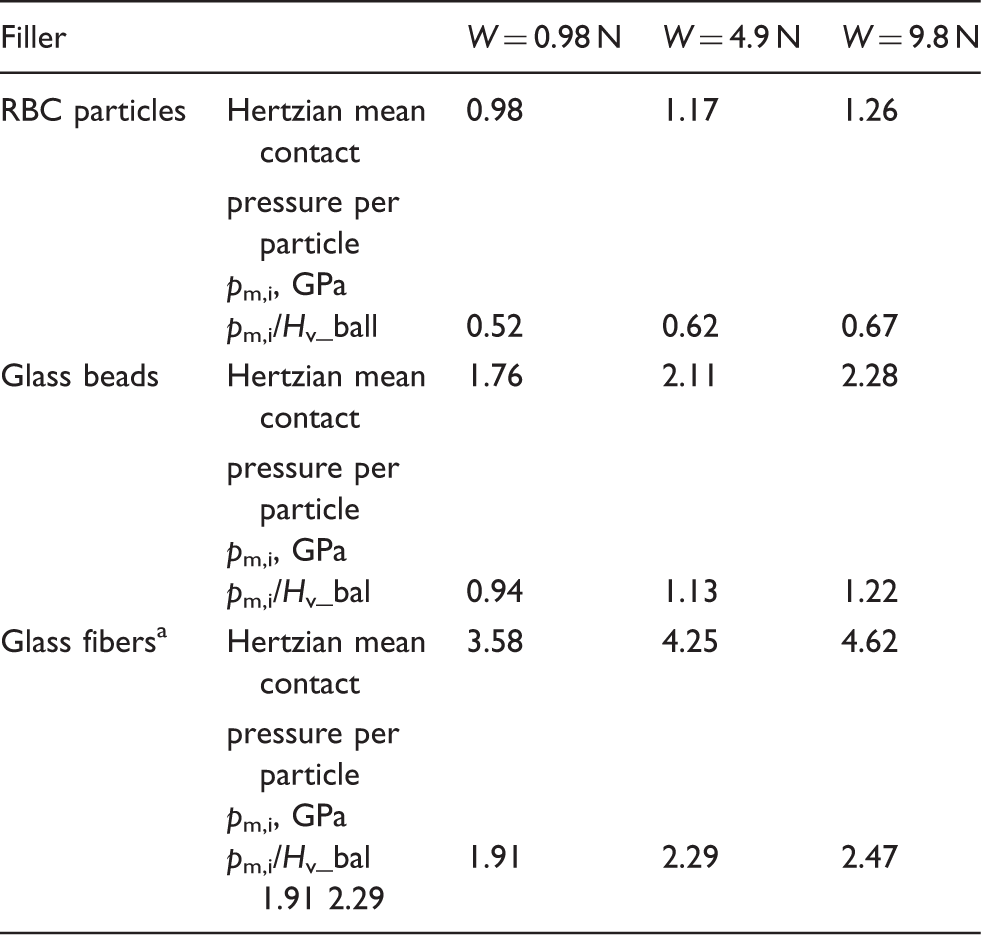
Schematic diagrams of the contact interfaces between the ball and the composites. Calculation results for the Hertzian mean contact pressure per particle. RBC: rice bran ceramics. Conversion value to spherical shape (diameter = 11.1 m).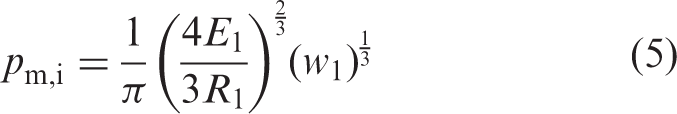
Conclusion
We investigated the tribological behavior of a polyacetal (POM) composite filled with RBC particles under water lubrication, compared to those of POM composites filled with GBs and GFs. The POM/RBC composite showed low wear (ws < 10−8 mm2/N) and low friction (μ < 0.10) under water lubrication, irrespective of the normal load and sliding velocity. Stribeck curve indicated that the lubrication condition of the POM/RBC composite was presumed to be near hydrodynamic lubrication, irrespective of the bearing characteristic number. Furthermore, the specific wear rates of the POM/RBC composite were the lowest of the composites, regardless of the bearing characteristic number. This indicates that the RBC particles played the role of an anti-wear filler without filler detachment. Dimensionless roughness parameters of the POM/RBC composite were smaller than 1.0, irrespective of the bearing characteristic number, i.e., the worn surface roughness decreased throughout the friction tests. Furthermore, the friction coefficients of the POM composites decreased exponentially with decreasing dimensionless roughness parameter; the low friction of the POM/RBC composite resulted from the small roughness parameters. The calculation of the local contact pressure between a particle and the steel ball possibly revealed that the RBC particles indicated a small contact pressure per particle that was nearly half the Vickers hardness of the steel ball. As a result, the RBC particles rarely damaged the steel ball with increasing surface roughness. Therefore, the low friction of the POM composite filled with RBC particles was attributable to the decrease in the roughness, e.g., polishing without the formation of a transfer film and the filler detachment.
Footnotes
Acknowledgment
The authors would like to thank Mr. Riku Kitamura for his help with the contact angle measurements.
Declaration of Conflicting Interests
The author(s) declared no potential conflicts of interest with respect to the research, authorship, and/or publication of this article.
Funding
The author(s) received no financial support for the research, authorship, and/or publication of this article.