
Abstract
A continuum damage model for simulating propagation of debonding in joints, introducing a linear softening damage process for the adhesive agent, is used to predict failure of scarf joints. The proposed modeling procedure was applied to scarf joints of marine type with glass fiber reinforced polymer adherends, commonly encountered in wind turbine rotor blade repair. Tests on aviation type scarf joints with carbon fiber reinforced polymer adherends were also simulated. Stress analysis was performed using plane strain elements of a commercial finite element code allowing implementation of user-defined material behavior. Numerical results for different scarf angles were in good agreement with the experimental data. The proposed model has been utilized to design a repair patch on wind turbine rotor blade and the design has been validated by testing a full-scale subcomponent of the repaired blade.
Introduction
Adhesive bonding is becoming an increasingly viable alternative for joining materials for more advanced structural applications, especially with the wide adoption of fiber reinforced polymers (FRPs) in recent years. Secondary bonding, with high-performance structural adhesives, is often used in the assembly of composite structures that continuously increase in share against metals. 1 The other main application of adhesive joining is structural composite repair where a very common technique is bonding scarf patches to the damaged structure.
The main advantages of the scarf repair, compared to other alternative patch types, is the enhanced bond length, the reduction of stress concentrations at the bondline edges and their ability to maintain a smooth aerodynamic surface on the repaired area. Due to these attributes, scarf patching is a favorite among the aerospace and wind energy industries where composites are widely utilized.
Analytical studies of scarf joints can be found since the early 1970s and the work of Hart-Smith. 2 Other authors such as Weber, 1 Adkins et al., 3 and Mortensen et al. 4 published analytical studies in later years but were not able to accurately predict the complex stress field throughout the adhesive layer. By increasing the complexity of boundary conditions and joint configurations, it becomes difficult if not impossible to solve analytically the overall system of governing equations for predicting joint performance. For that reason, finite element method (FEM) has become the most common technique for predicting adequately joint behavior, resulting in a wide number of parametric studies of scarf joints.5–10 Strength prediction models for scarf joints have been also developed using finite element analysis (FEA) and usually compared to experimental data in works of Kumar et al., 11 Gacoin et al., 12 Tzetzis and Hogg 13 among others. More recently many authors have published studies such as Campilho et al., 14 Liao et al., 15 and Goh et al. 16 that successfully predict the progressive damage evolution of scarf joints using the cohesive zone modeling (CZM) approach. CZM is based on a traction–separation law to simulate macroscopic damage along a predefined crack path and can capture the behavior of failure onset and non-self-similar growth of adhesive damage. CZM has found great success as a method for joint simulation and an extensive literature review on its development and application has been presented by da Silva and Campilho. 17 Damage initiation is related to the interfacial strength, and the area under the traction–separation relation is equal to the fracture toughness. However, there are still some limitations predominantly around the need to have a predefined crack path and the difficulty to define the CZM parameters, which require careful calibrations by experimental data.
The inverse method was one of the earliest techniques used to calibrate the CZM parameters and consists of the trial-and-error fitting analysis to experimental data on bonded joints, such as the curve, allowing tuning of the CZM law for specific joint configurations. 18 The most common approach is the property determination method, which requires several tests on the interface of the adhesive and the adherend, as well as the bulk adhesive itself. Therefore, variations to bond quality due to e.g. different surface treatment would result in the need of re-tuning the CZM law. The most common approach is to calculate and from the stress–strain curve of the bulk adhesive. 19 The values of for Mode I or for Mode II failure are estimated from the standardized DCB and ENF tests, respectively. The virtual crack closure technique (VCCT) is also widely used for computing energy release rates based on results from continuum (2D) and solid (3D) FEAs to supply the mode separation required when using the mixed-mode fracture criterion. 20
Continuum damage modeling constitutes a valuable alternative when crack path is not known a priori and can also simulate the volumetric characteristic of the fracture process zone. This approach has been used by de Moura et al. 21 to evaluate the effect of adhesive thickness on fracture characterization of adhesive joints.
In the present work, a modeling procedure for simulating adhesive joint behavior, already published by the authors, 22 is used to simulate progressive damage of scarf joints between composite adherends. The degradation model for the adhesive region is based on a softening procedure that accounts for energy dissipation during debonding and has been successfully applied in secondary bonded and co-bonded lap joints. The model homogenizes the damage process due to adhesive and cohesive failure debonding (joint failure). Validation of the FE modeling procedure is performed by comparing predictions with the experimental results of GFRP co-bonded scarf joints, as well as published test data for CFRP secondary bonded joints of various scarf angles.
Adhesive damage model
The adhesive paste progressive damage (microcracking) procedure, already presented in Masmanidis and Philippidis
22
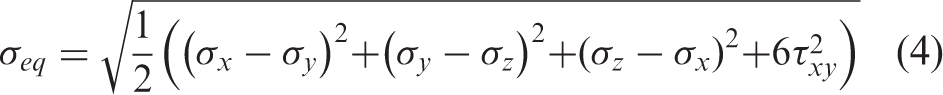
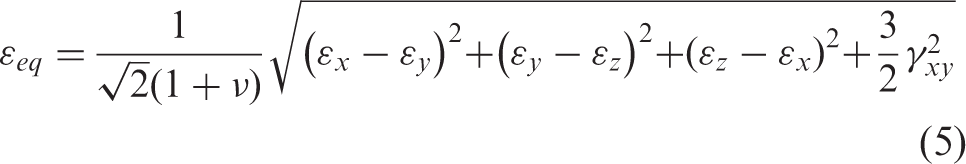
is as follows. For the isotropic adhesive material, the paraboloid failure surface criterion, adapted for generalized plane strain, is implemented as
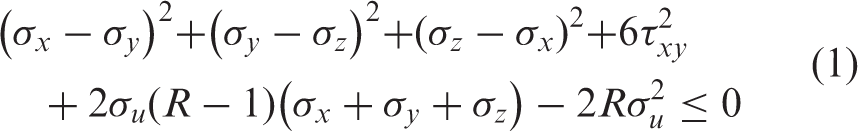
In the above relation,
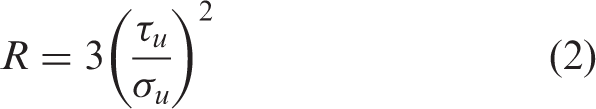
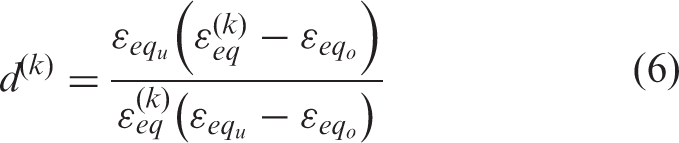
When failure is detected, a softening process is imposed on to the adhesive to account for damage evolution. For the kth step, after failure has been detected, the degraded moduli are calculated by
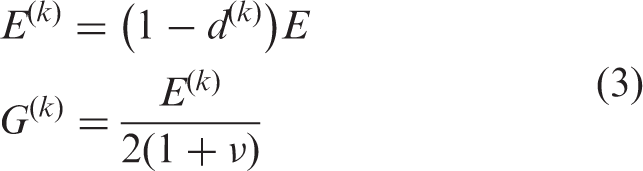
The damage index, d, is calculated by considering the linear softening process shown in Figure 1 for the equivalent stress and strain
Softening stress–strain curve after failure onset of the adhesive.
As it can be readily proved from the above equations,

The slope of line AB in Figure 1 defines the new stiffness of the degraded material for a load step during the softening process. The value
On the other hand, the value of the maximum equivalent strain,
In the proposed model, the parameter
The use of a softening law to simulate damage in joints is a concept widely accepted through the well-established CZM approach. The proposed model is a more simplistic approach since the softening law in not connected to the fracture properties of the adhesive or the adherend. The softening law is defined by testing a representative joint coupon and, therefore, is connected to several parameters that affect the strength, such as adhesive properties, stress concentrations from joint geometry, or in situ surface treatment. The simplicity of these calibration tests increases the value of the proposed mode for joint design.
Experiments
GFRP scarf joints
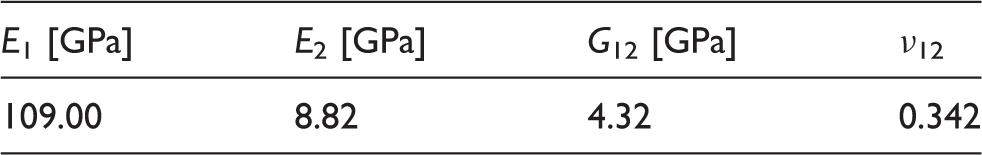
Engineering elastic constants of the UD glass/epoxy composite.
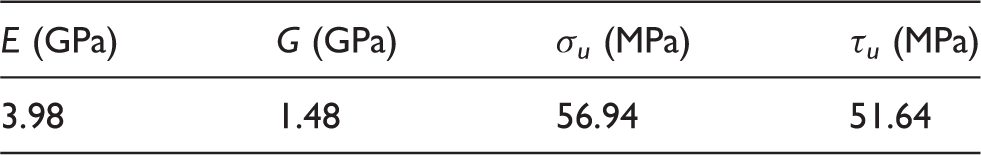
Engineering elastic constants and failure stresses for the polymer matrix.
Description of marine scarf repair coupons.
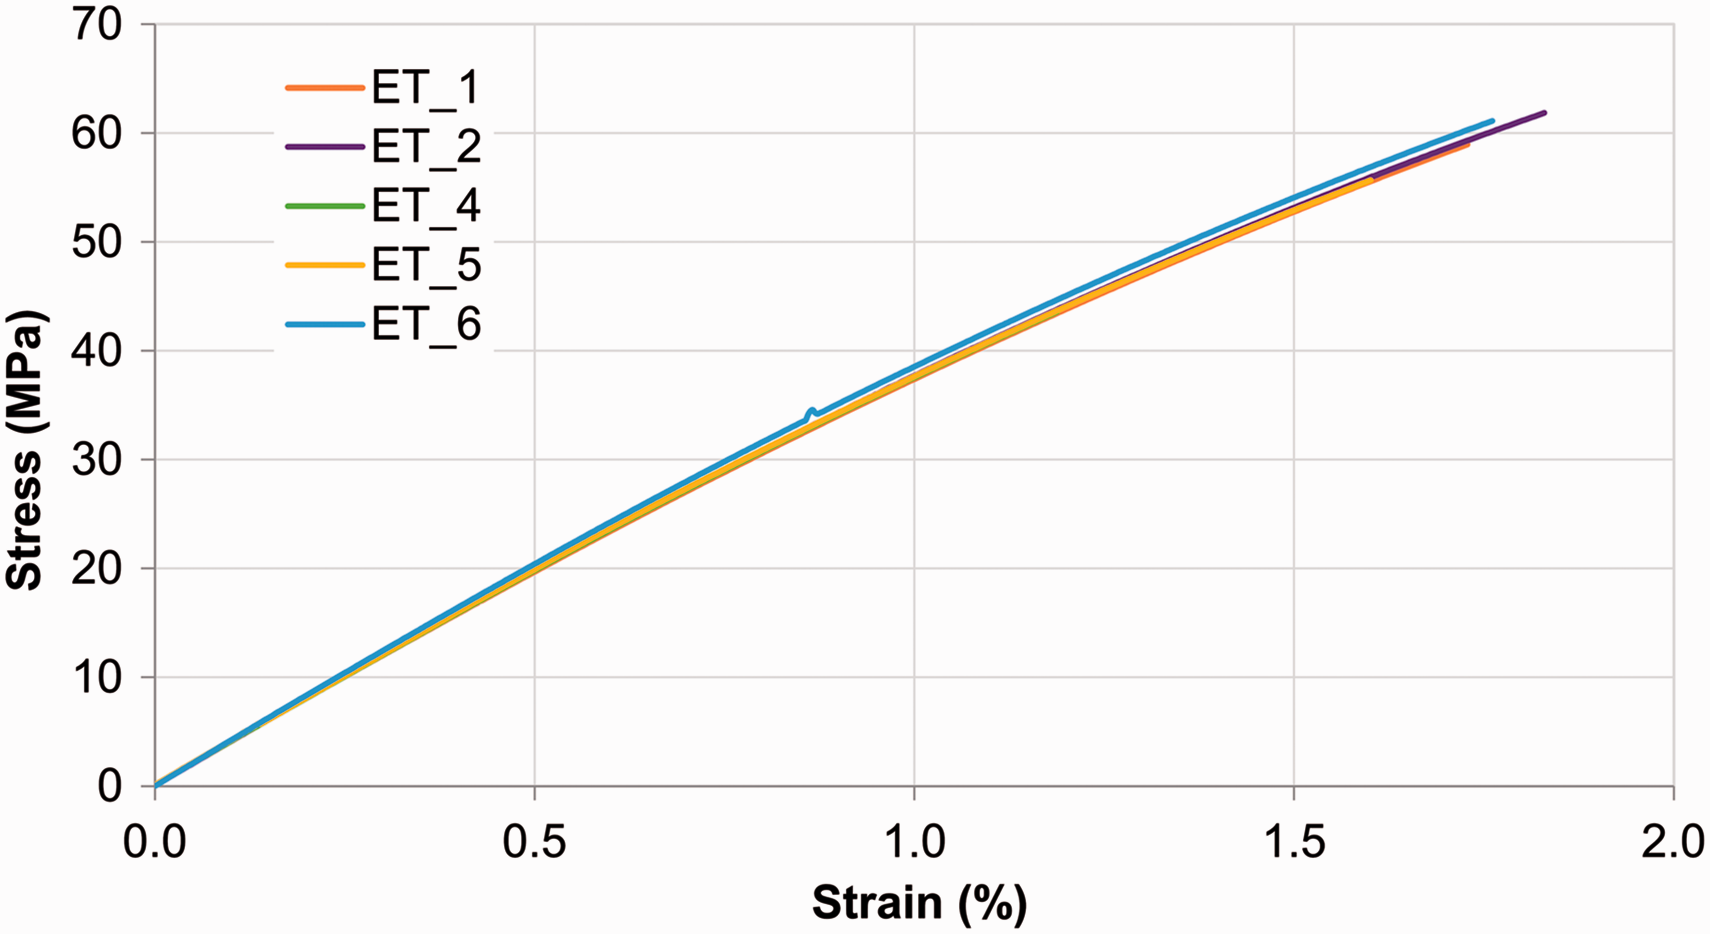
Tensile stress–strain curves for the polymer matrix.
Material characterization for the UD glass/epoxy composite has been performed according to EN ISO 527-5 for tension, EN ISO 14126 for compression, and EN ISO 14129 for shear. The polymer matrix was tested using ASTM D638-03 TYPE I specimens for tension and ASTM D5379 v-notched specimens for shear characterization. The stress–strain curves of the matrix material are given in Figures 3 and 4.
Shear stress–strain curves for the polymer matrix (some strain gages failed before maximum load).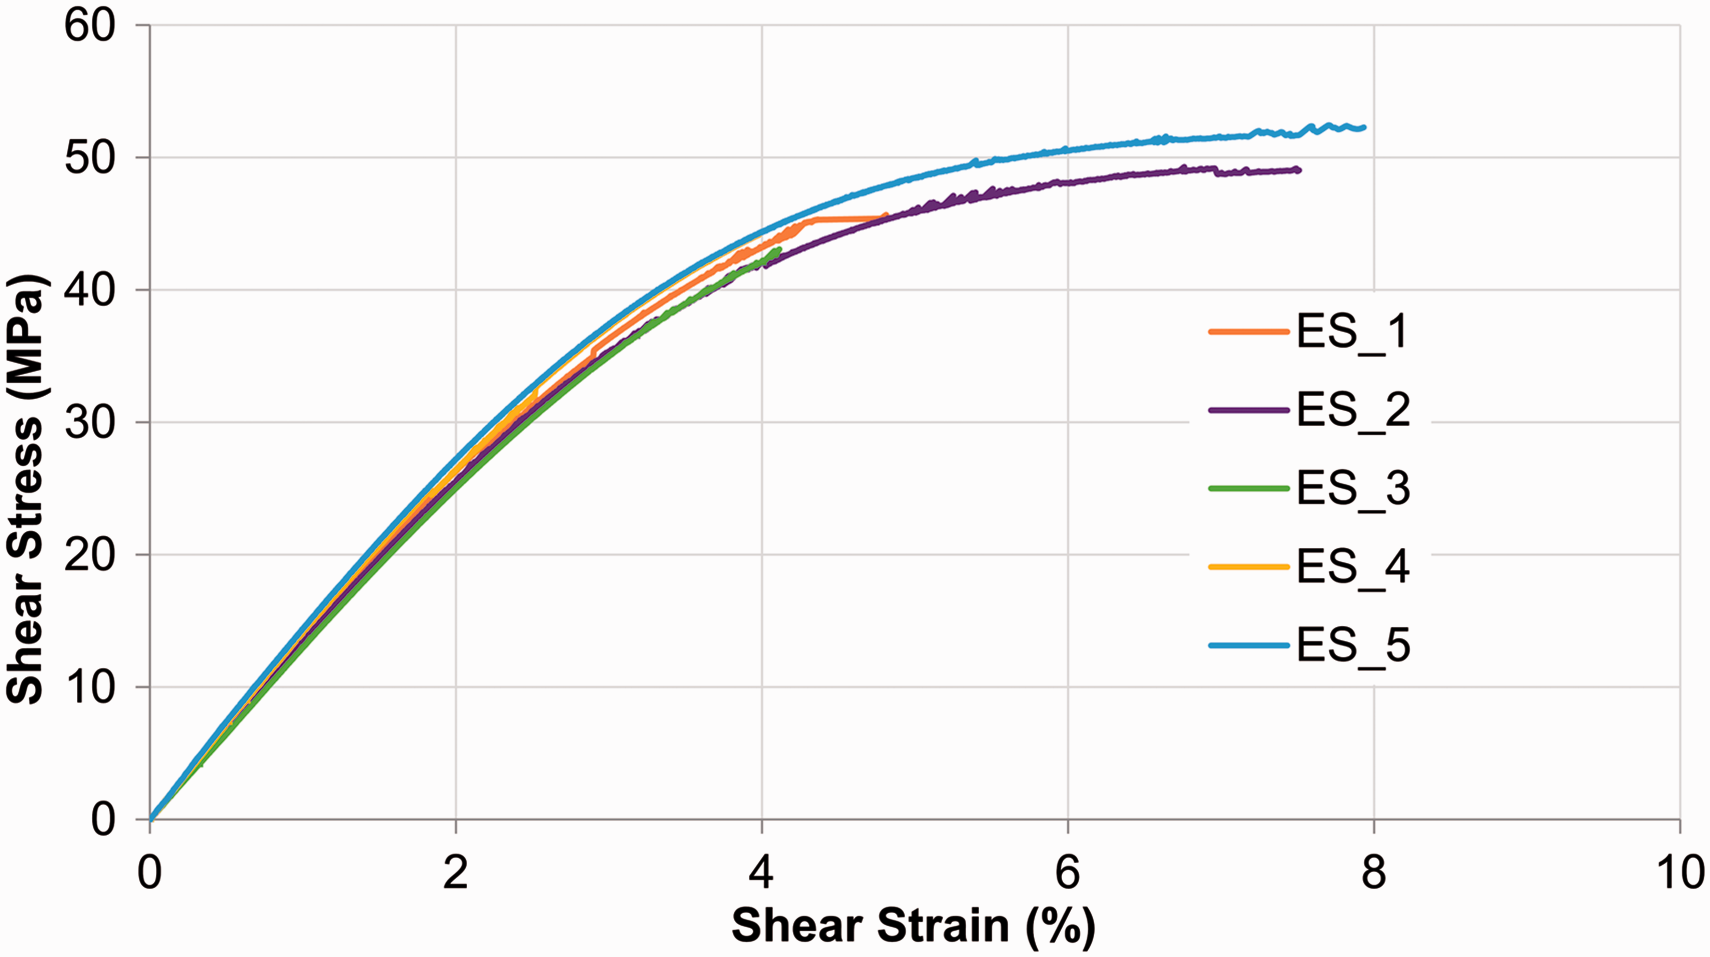
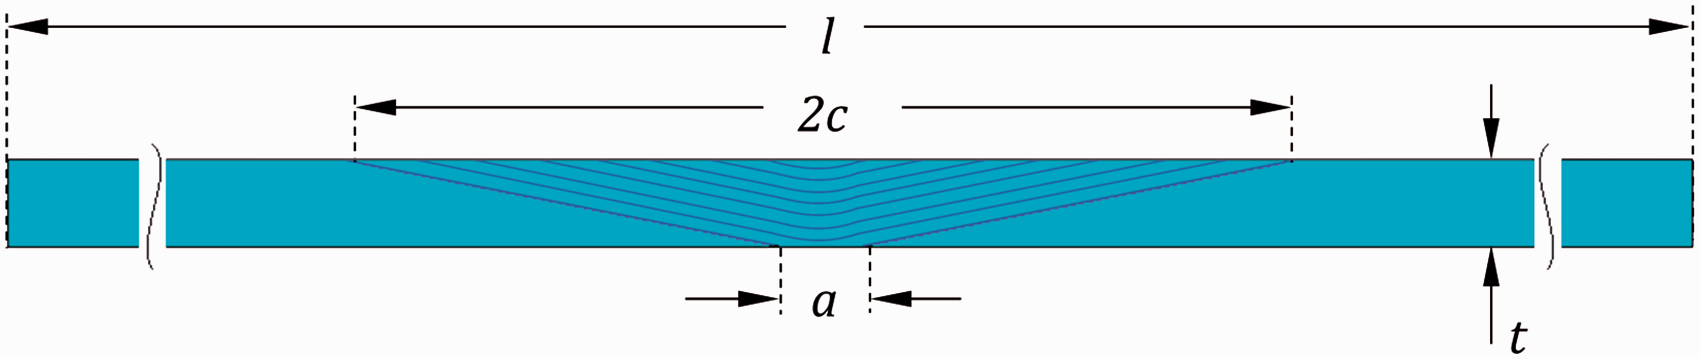
Two scarf angles were achieved by using adherends consisting of [(0/90)/(±45)/(UD)]3 layup with a total thickness of t=5.7 mm resulting in a scarf angle of 3.3° and of [(0/90)/(±45)/(UD)]5, t=9.5 mm and scarf angle of 5.4°. Patch was applied by resin infusion for both slope geometries. No special surface treatment has been used other than careful cleaning of the machined adherend surface. Total length and width of all three types of coupons equals to l = 500 mm and w = 25 mm. Upper patch length was equal to 2c = 200 mm for all cases while lower patch length was measured equal to a = 3 mm.
Test setup
Seven samples from each joint configuration were tested on a 100 kN MAYES DH 100 S test rig equipped with a 407 MTS controller with its crosshead speed set to 5.8 mm/min. All coupons were inserted in the grips for 50 mm at each side leaving a gauge length of 400 mm. Load and displacement were measured by acquiring the test machine load cell and LVDT signals respectively. The average stresses from seven coupons for each scarf ratio are tested along with seven continuous [(0/90)/(±45)/(UD)]2 coupons, for reference. A scarf coupon mounted on the test machine is shown in Figure 5.
Scarf patch repair coupon mounted on the test machine.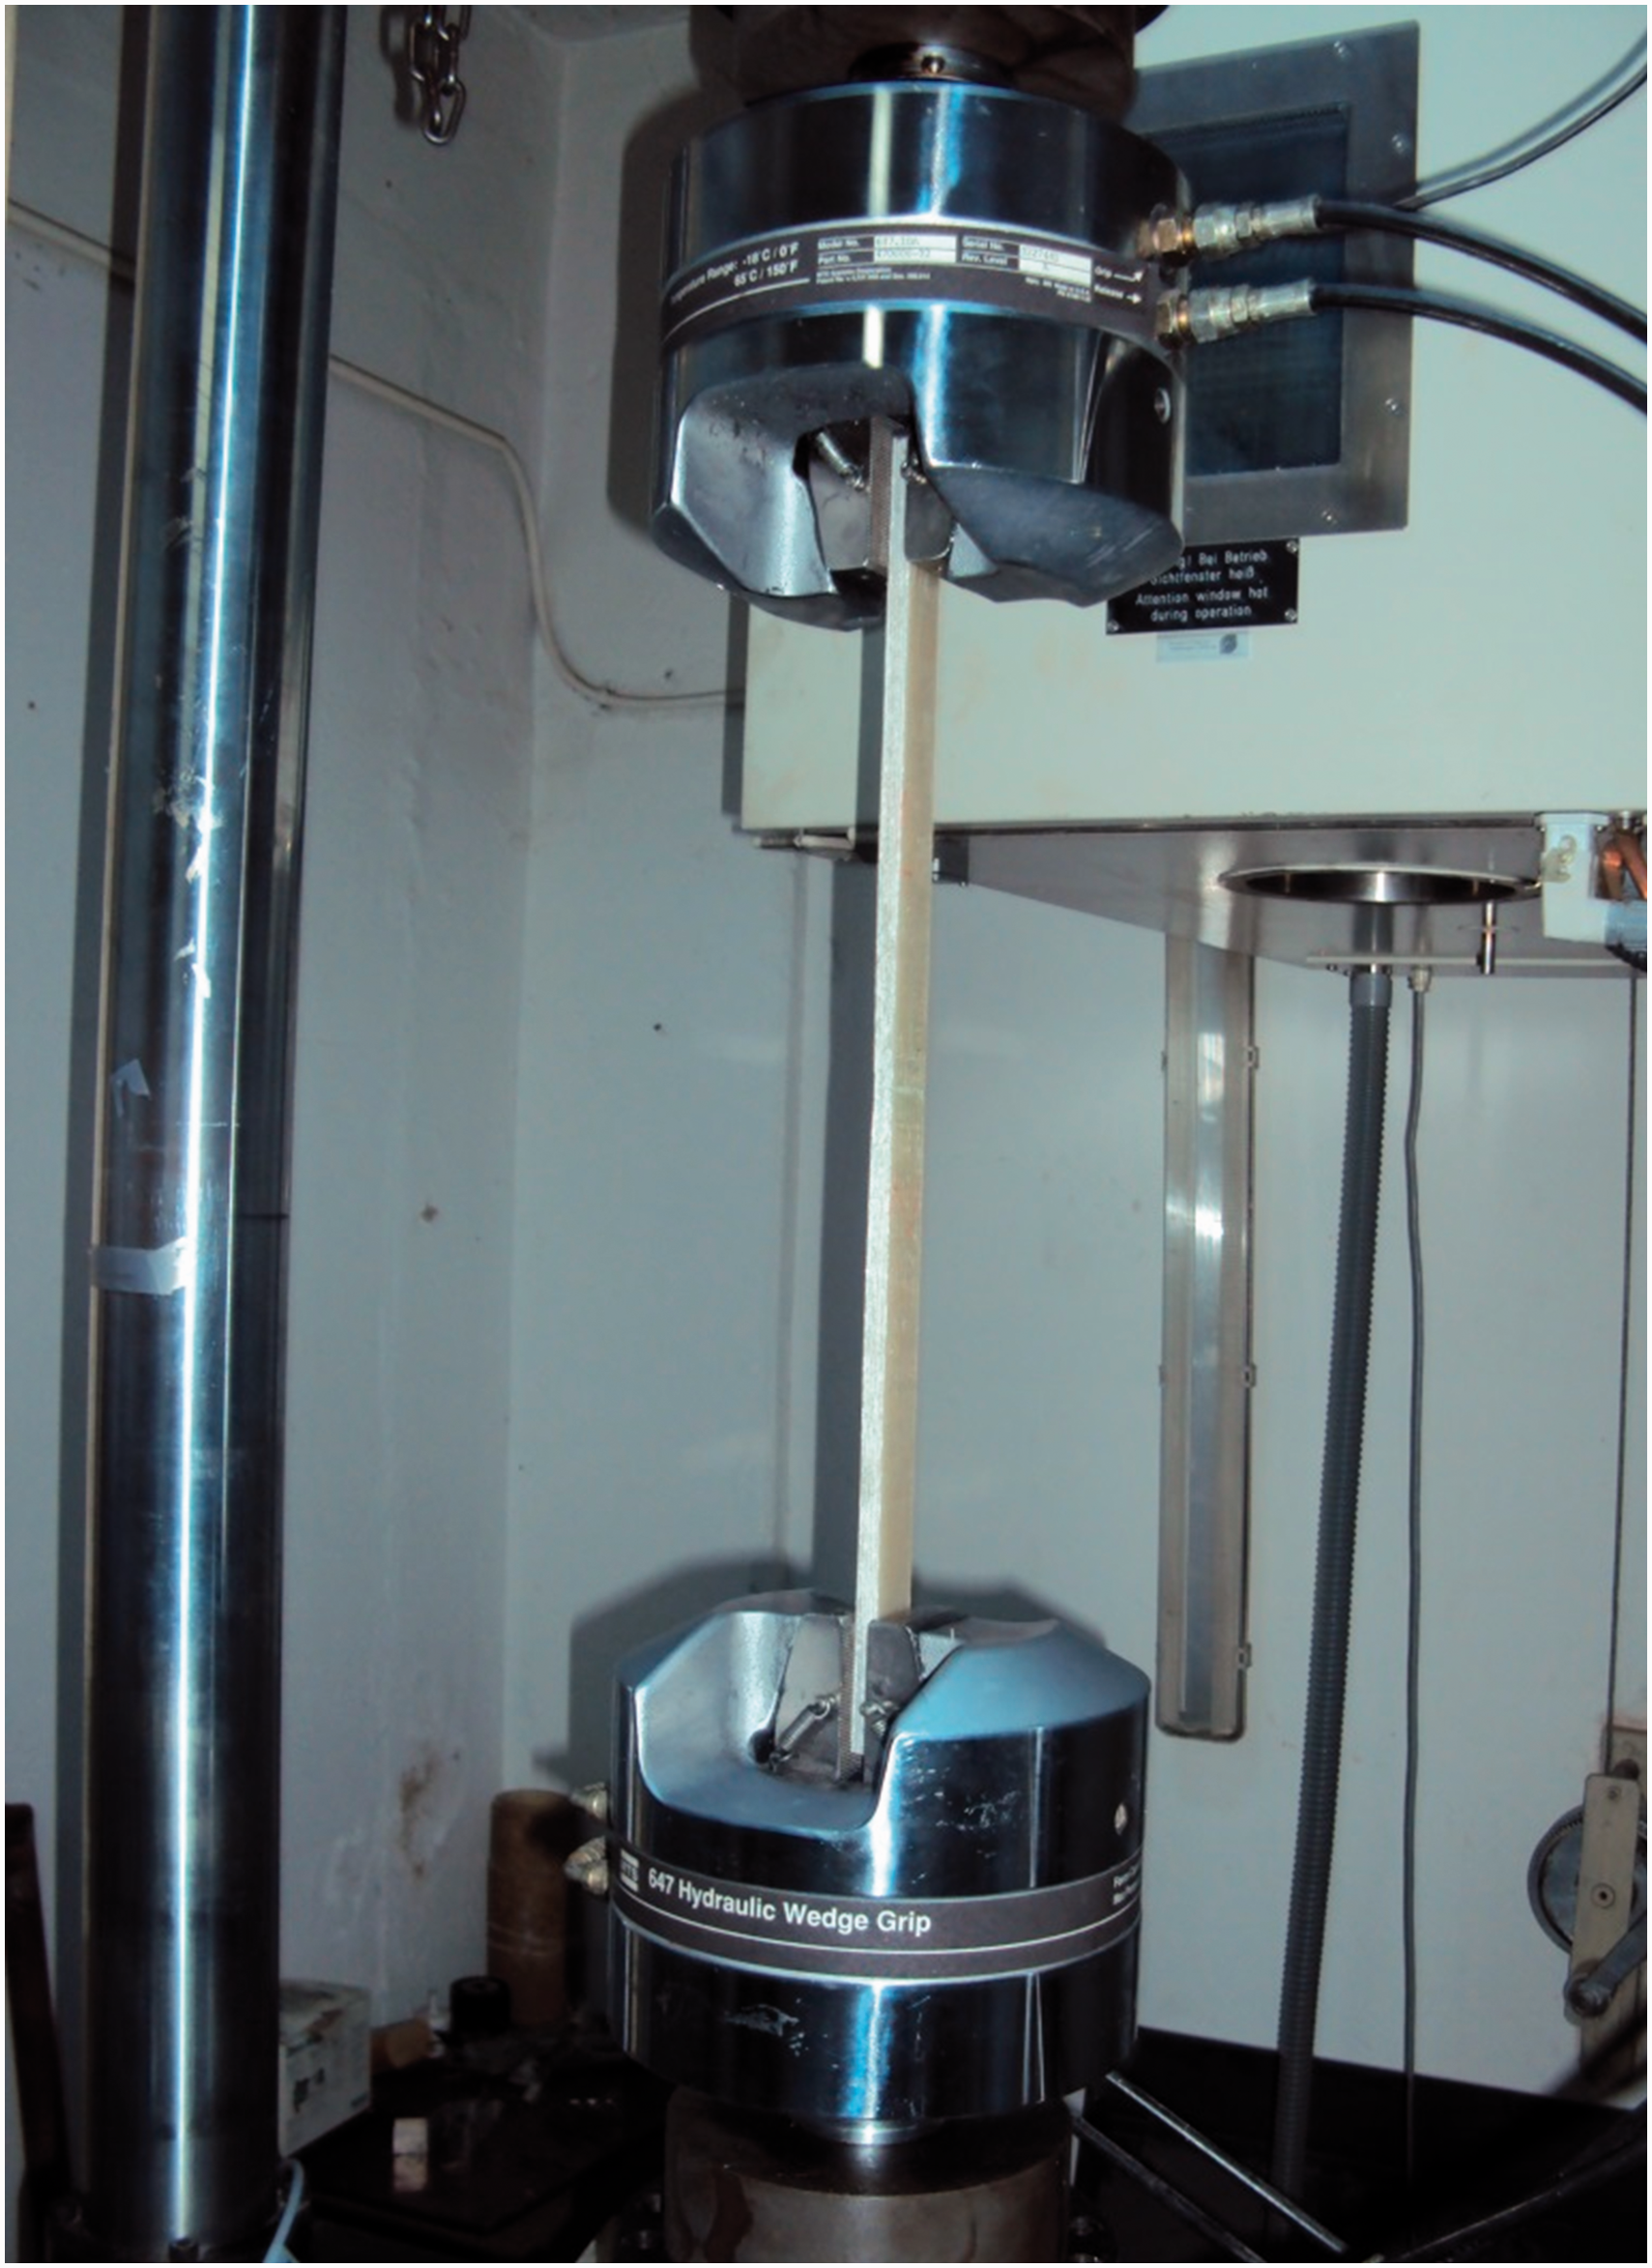
Numerical analysis
CFRP scarf joints
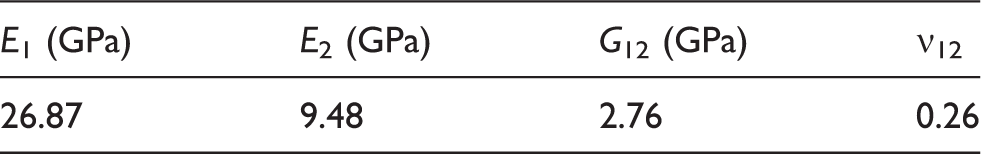
Engineering elastic constants of the carbon/epoxy composite lamina. 14
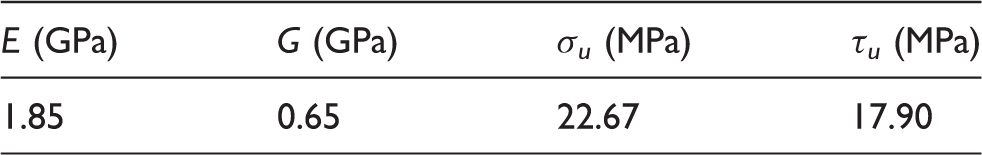
The dimensions of the coupons as shown in Figure 6 are l = 270 mm, t = 2.4 mm, ta = 0.2 mm, and a = 10 mm while the width is equal to 15 mm. The patch applied had the same lay-up with the adherend keeping the same orientation with the fibers as is common practice in aviation repair. In this case, the overlap length c varied in order to achieve scarf angles equal to 2°, 3°, 6°, 9°, 15°, 25°, and 45°. The adhesive used is Araldite 2015 from Huntsman and its properties are listed in Table 4.
Description of aviation scarf repair coupons.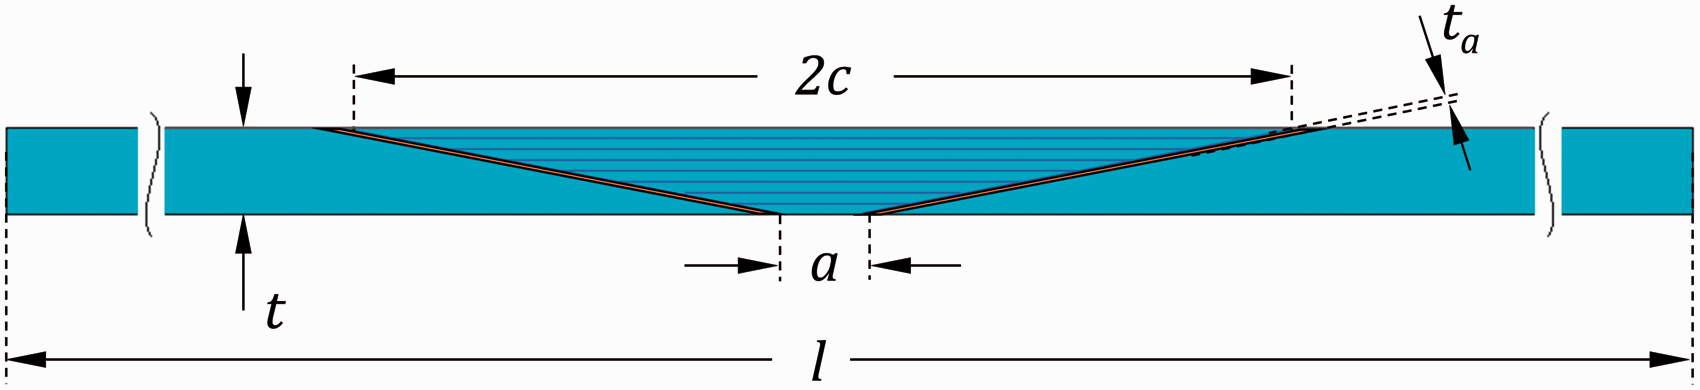
Numerical model description
Progressive damage models were implemented in ANSYS commercial FE code using the user programmable features of the PLANE182 element. In order to reduce computational effort, generalized plane strain analysis was chosen since relatively small strains are expected in the width direction of the model. Static analysis is used by implementing geometric nonlinearity by considering large strain effects.
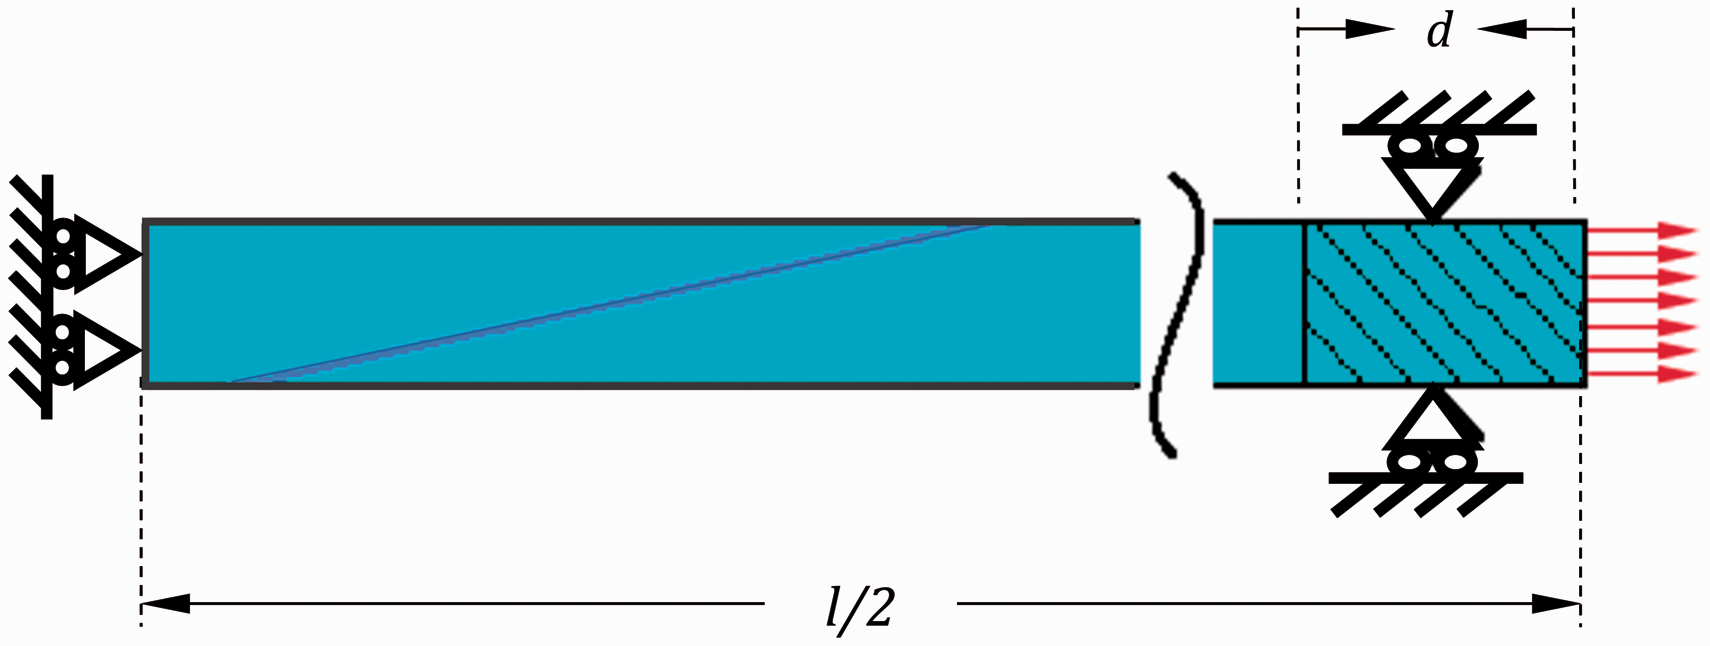
The FE model’s boundary conditions are selected to properly simulate the testing procedure, while just half the coupon was modeled using symmetry boundary conditions at the middle. For all coupon models, stepwise loading is introduced by applying axial displacement increments on the nodes at the right end of the coupons. A mesh convergence study was performed and a number of at least 260 elements were used along the bondline which are deemed adequate (see Figure 7).
FEA mesh convergence study.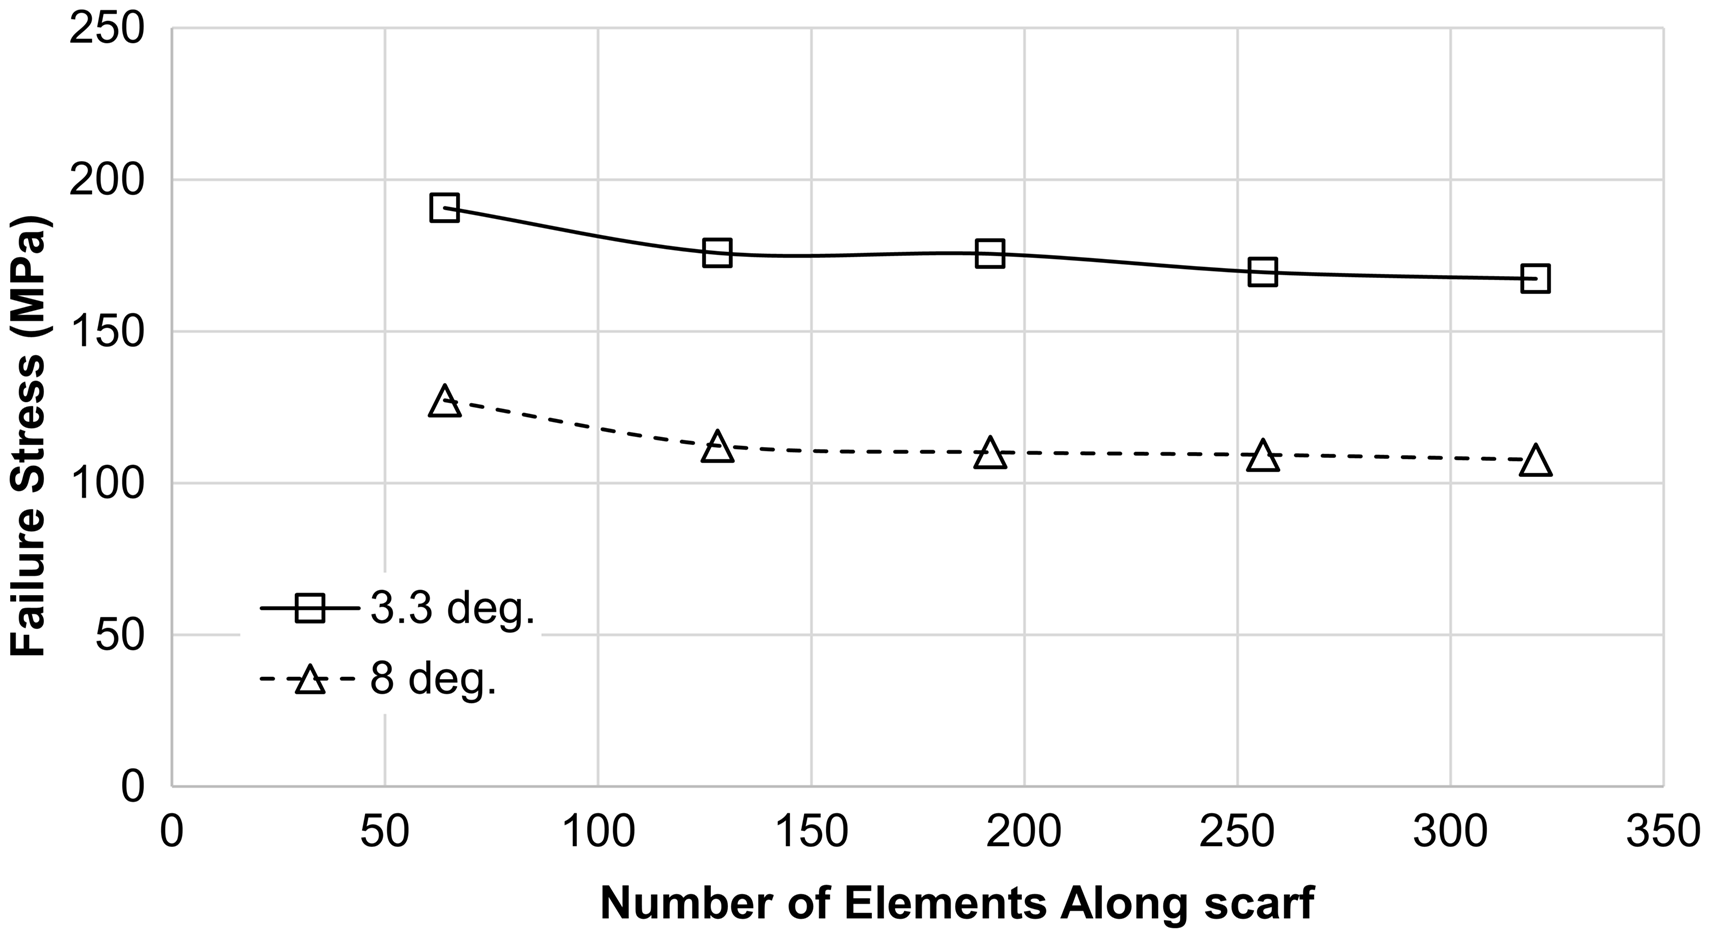
To avoid the dependence of load step convergence on mesh density, every time an element failure is detected the load is not increased for the following solution steps, until element failure stops propagating to adjacent elements and then the next increment is applied. After a thorough load step convergence study, it was found out that for a step equal to 4 µm, all models are fully converged as shown in Figure 8. All other nodal displacements were constrained for a distance of d = 50 mm at the end of the coupon model to account for the gripping of the test machine (Figure 9).
Load step convergence study. Boundary conditions of the FE model.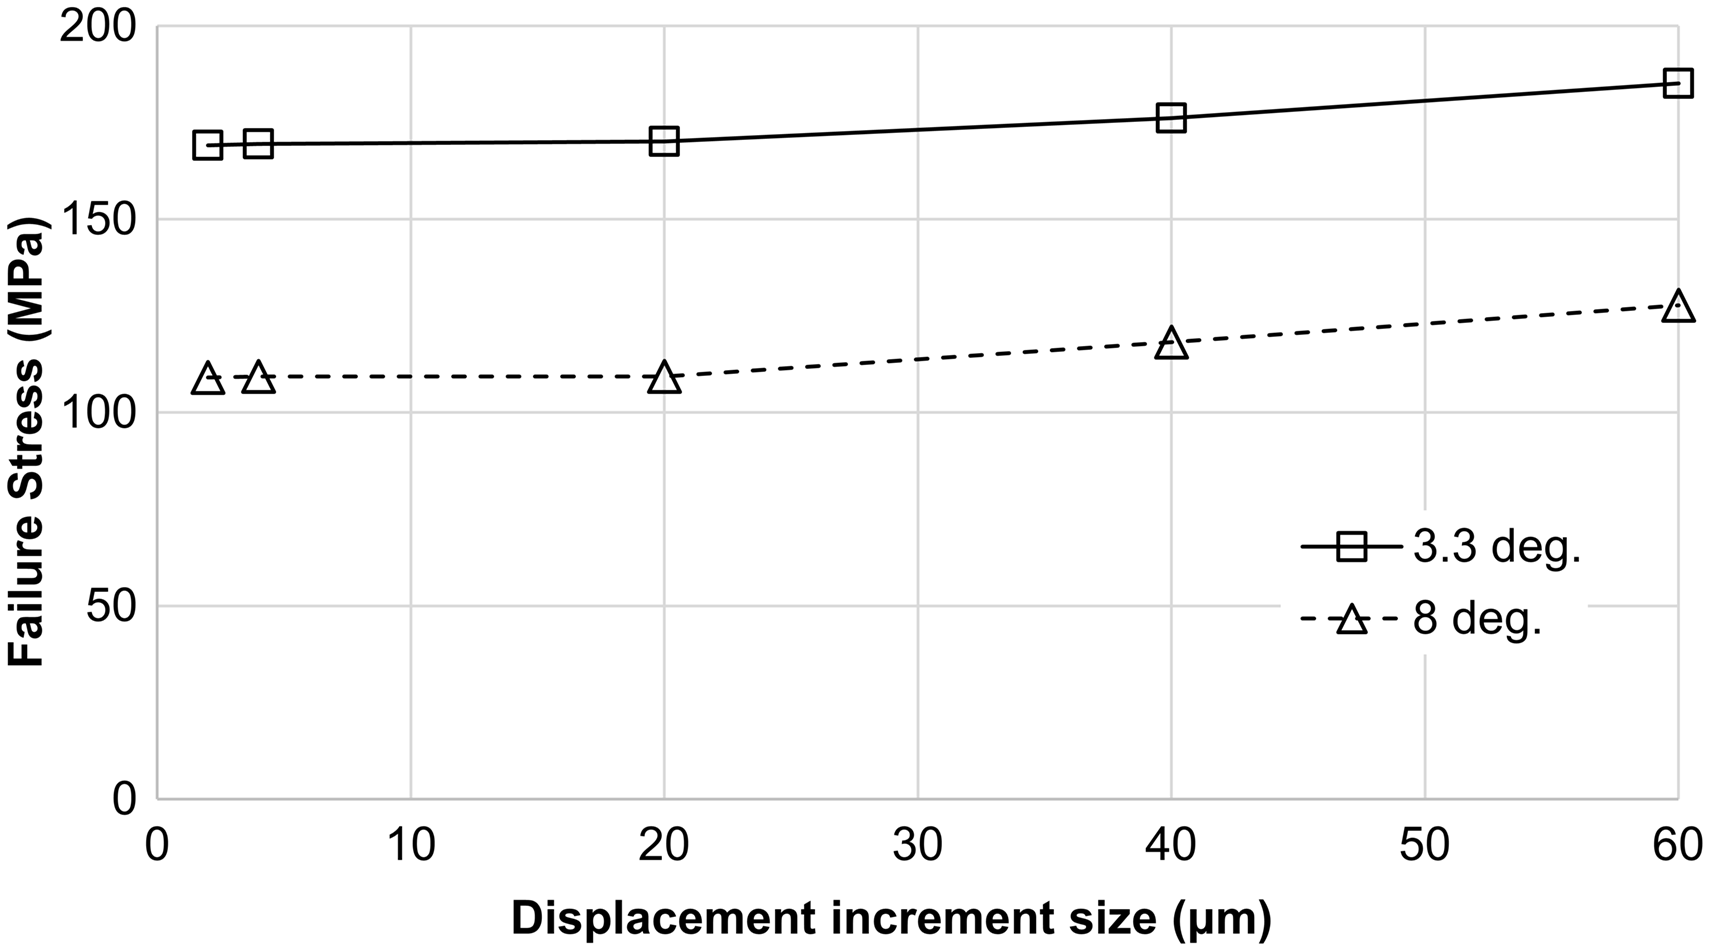
For the co-bonded GFRP scarf joints due to the lack of a distinct adhesive layer, the matrix of the first (0/90) layer of the patch is modeled as an adhesive agent. A model has been introduced in Masmanidis and Philippidis 22 that replaces the ply of the composite adherend by a two-layer effective material, consisting of a modified composite and a distinct polymer layer.
More specifically, the total thickness, tc, of the first (0/90) ply is assumed to be equal to the sum of the fiber thickness and that of the polymer resin tr, determined by
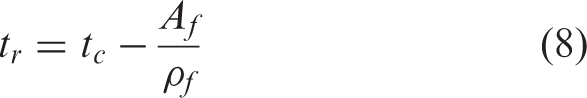
In the above relation, Af is the areal mass of the glass fabric, equal to 0.6 kg/m2 and ρf is the density of the E-glass fibers, 2560 kg/m3. The adhesive layer used in FE modeling is equal to tr /2 = 0.183 mm and has the properties of the polymer matrix in the UD composite ply, Araldite LY 3505, already described in Table 2. The thickness of the equivalent composite for the thin scarf joint adherend becomes tec = t– tr /2 = 5.517 mm. Since the change in the composite thickness is about 3% and the change of overall stiffness is negligible the measured material properties of Table 1 were used for the composite layers. A close up of the FE mesh for the marine and aviation scarf joint models is displayed in Figure 10.
Finite element mesh of the marine (top) and aviation (bottom) scarf joints.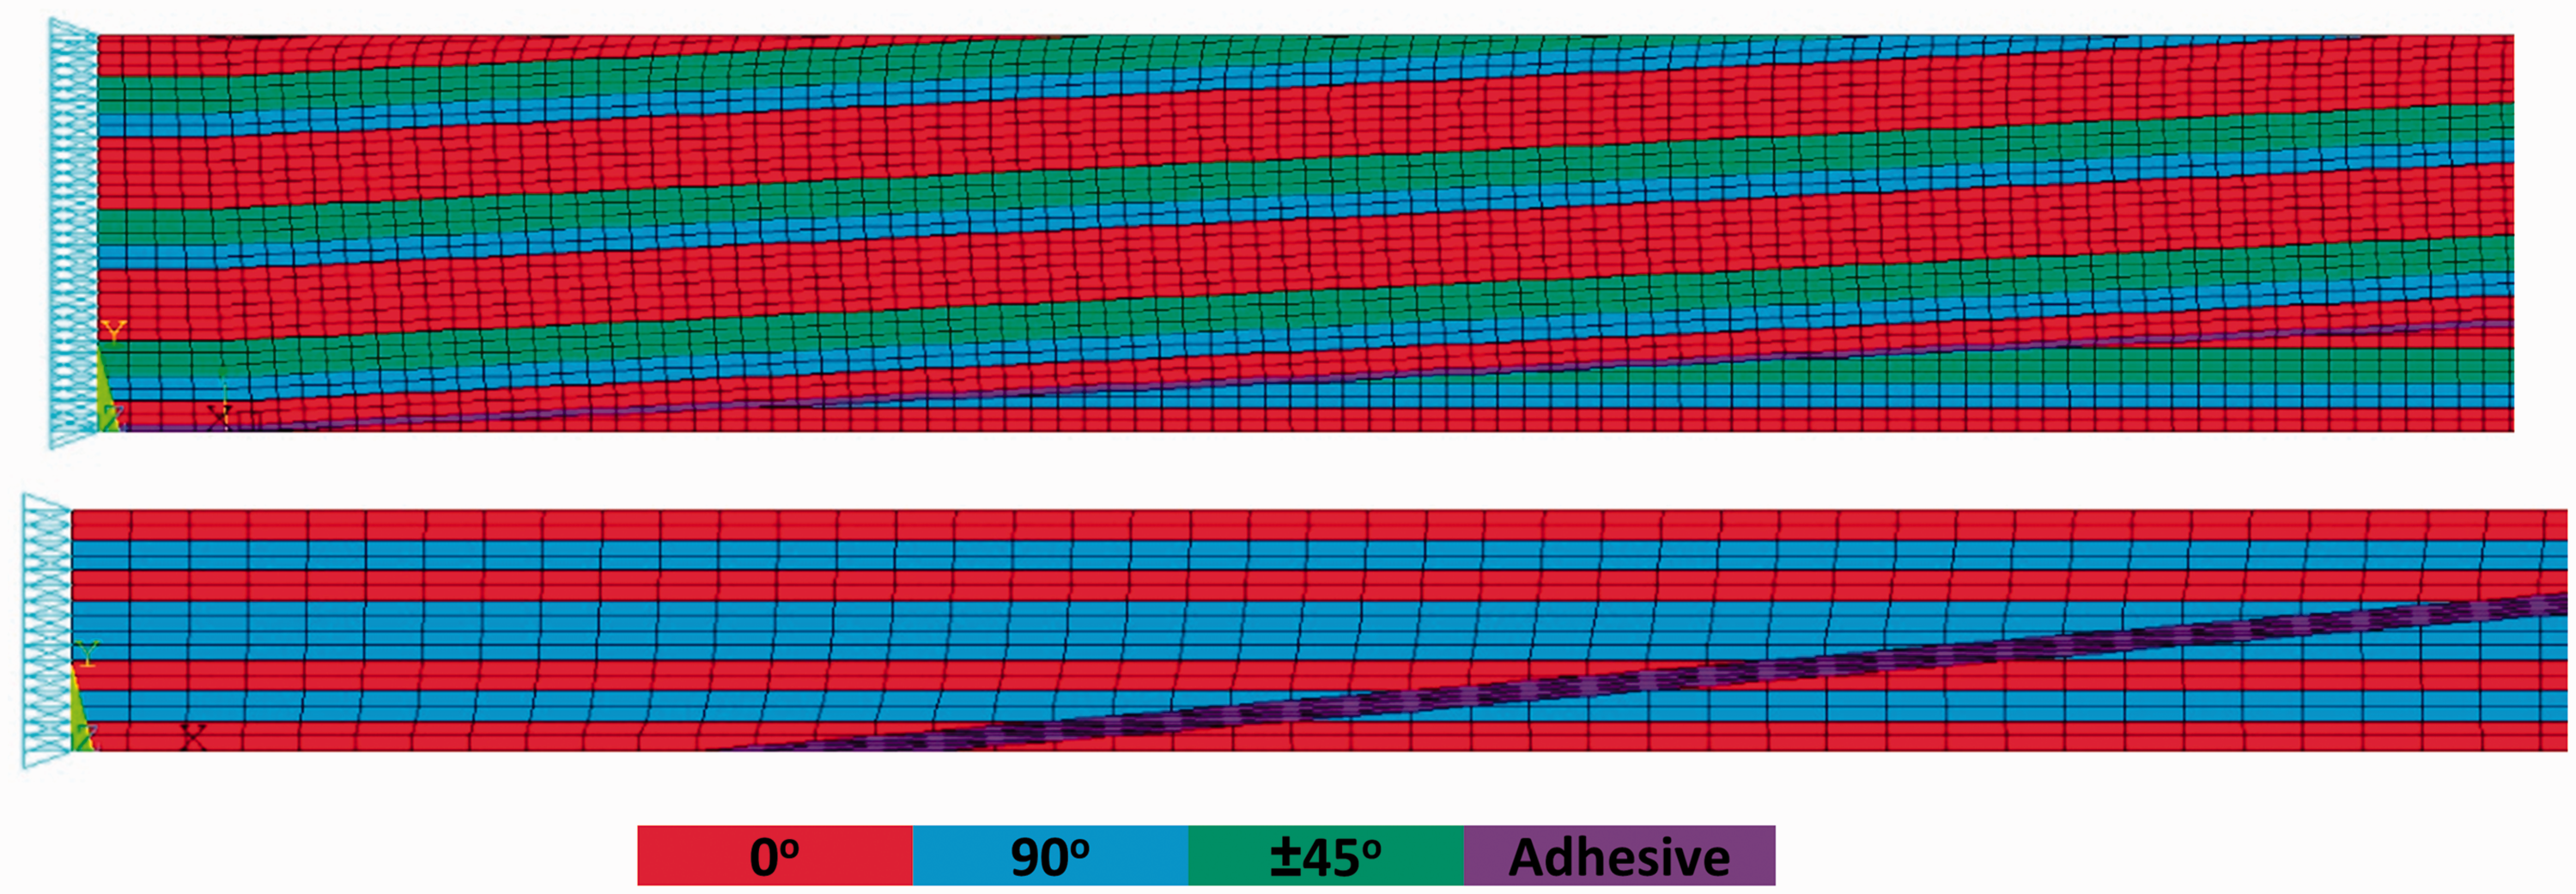
Results and discussion
GFRP marine coupons joined by co-bonding
GFRP scarf joint coupons average failure stresses.
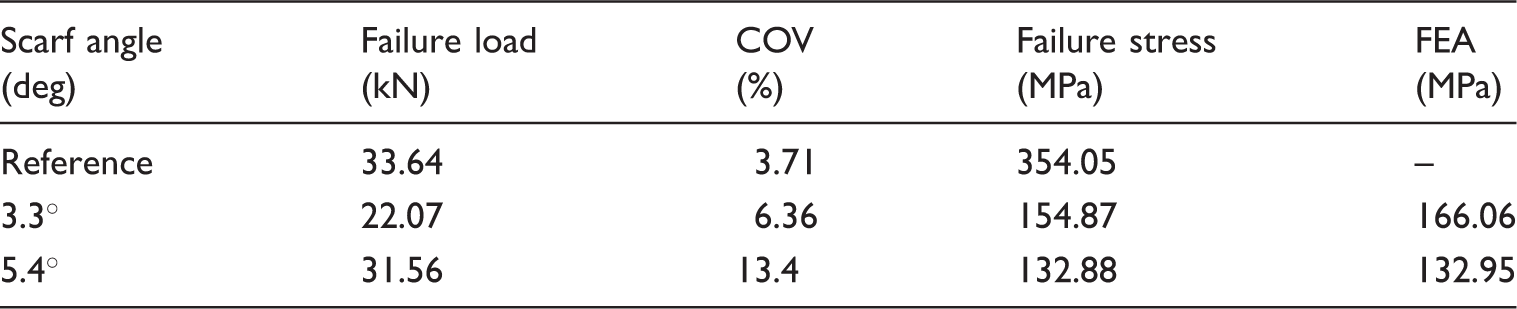
COV: coefficient of variation; FEA: finite element analysis.
The progressive damage model described earlier was used to predict ultimate loads at failure for all the series of coupons. The term failure at the numerical procedure denotes the complete separation of the adherends, which for all cases occurs after ultimate load is reached. The model parameter
Test results indicated a poor strength recovery for the joints not reaching 50% even for the 3.3° scarf angle. Fracture surfaces showed mainly adhesive failure and very limited fiber tear-out meaning that more advanced surface preparation techniques must be taken into account during repair. Picture of failed coupons can be found in Figure 11, displaying an adhesive failure mode since there is no distinctive adhesive layer and no significant adherend damage is observed.
Failed marine scarf repair coupons.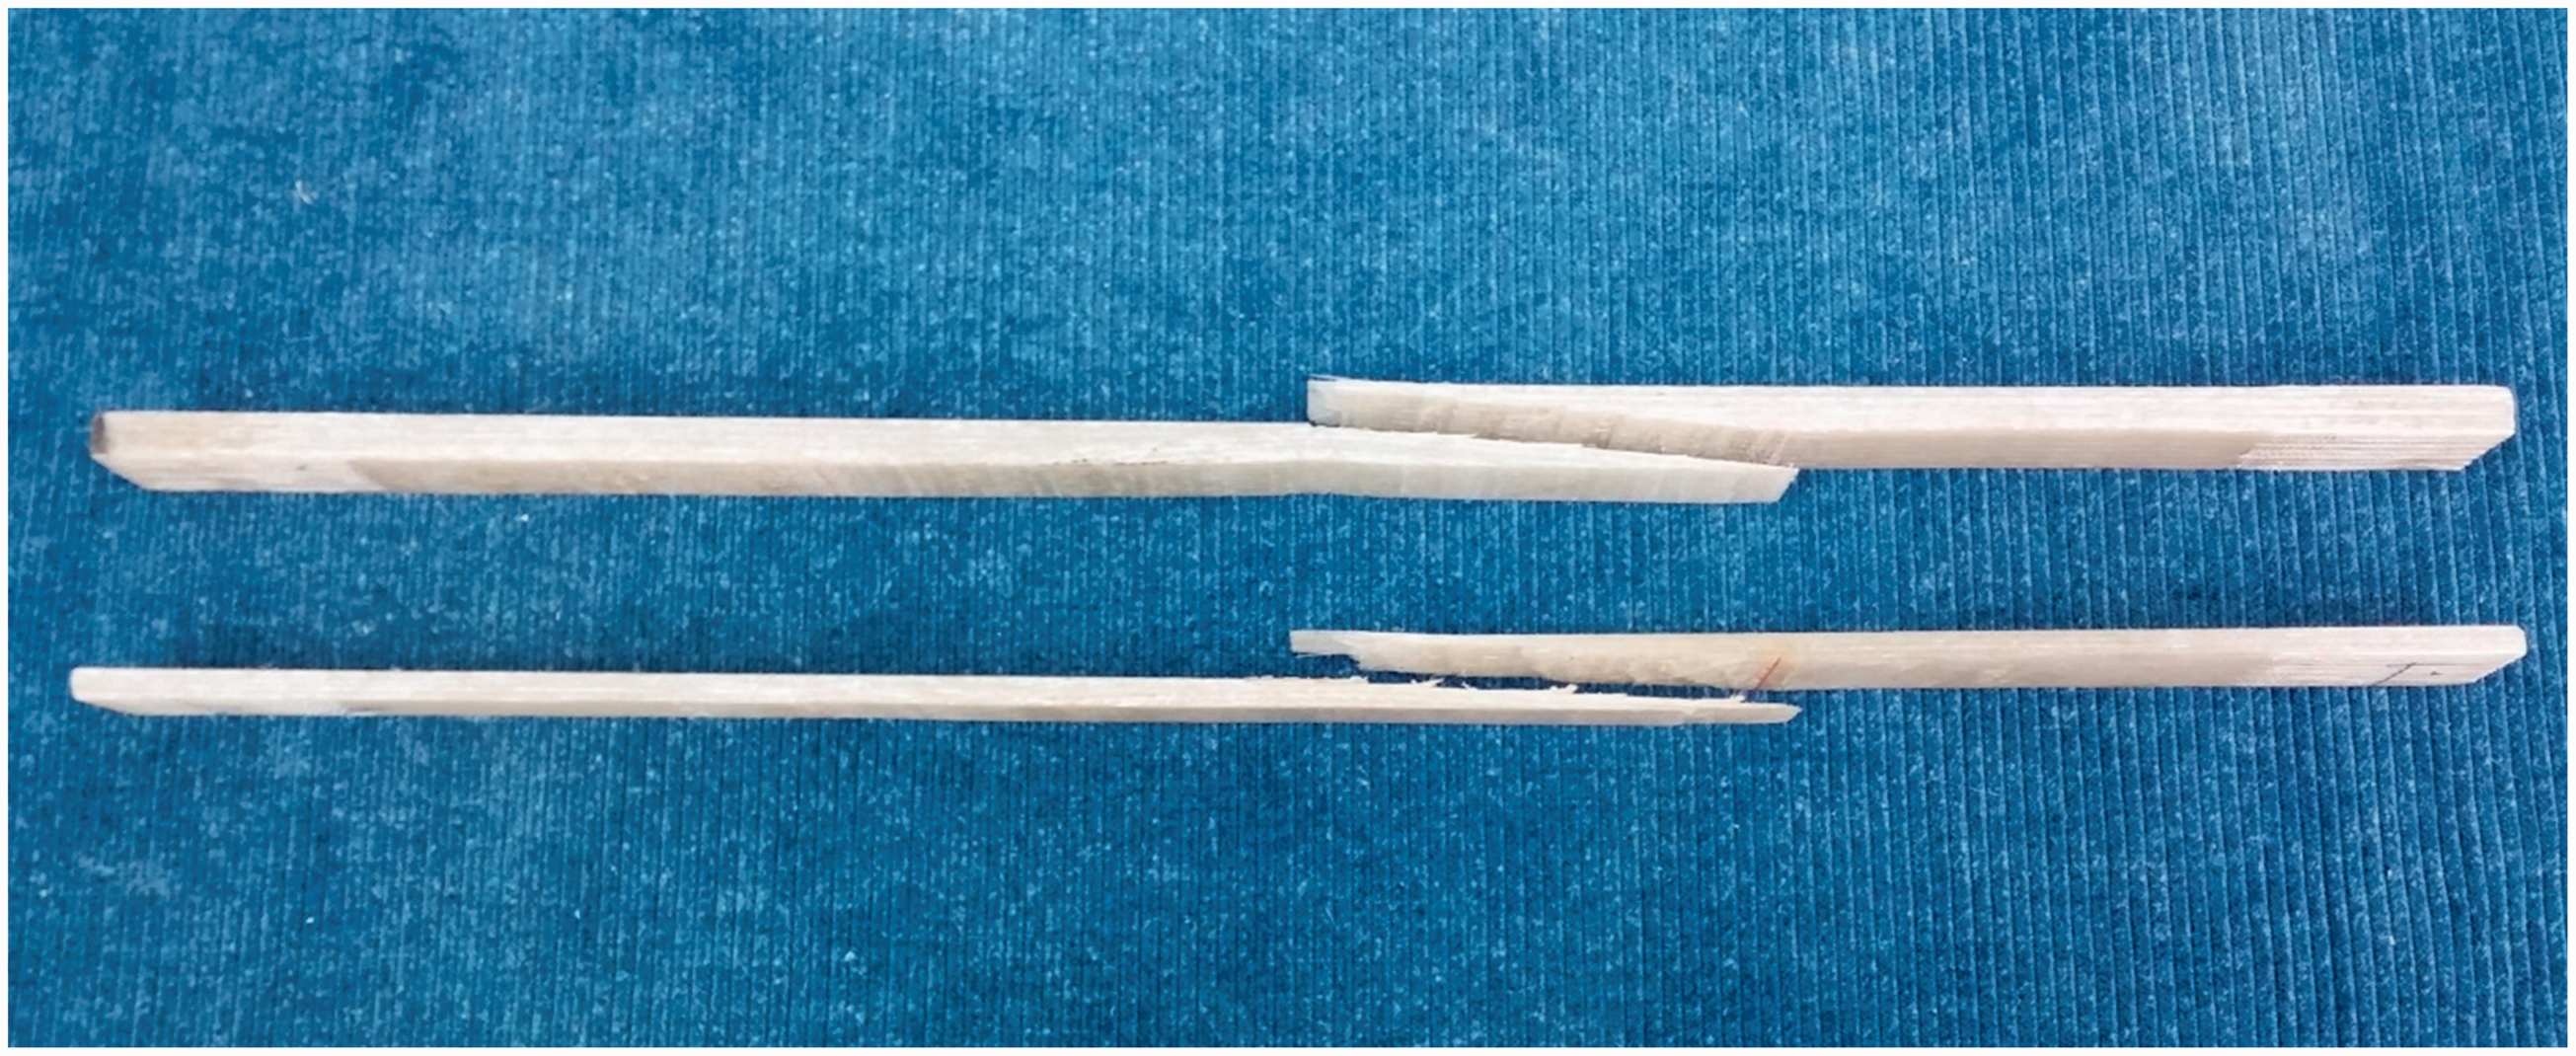
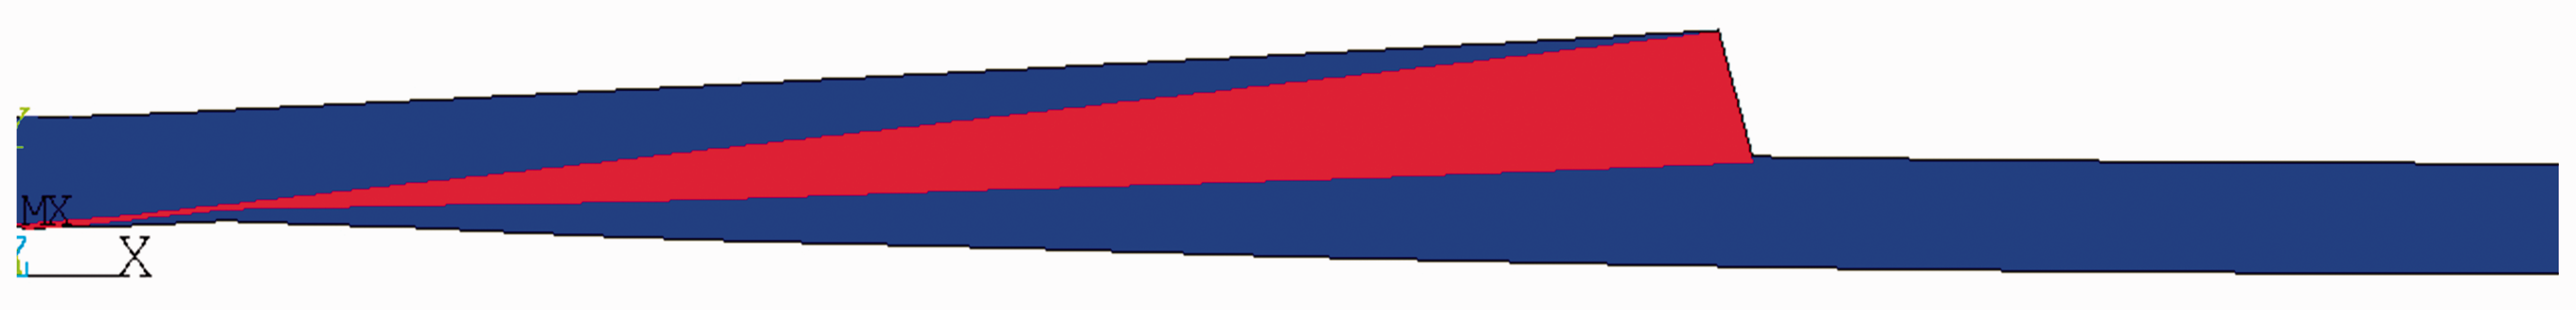
Strength predictions were produced for different scarf angles for each scarf coupon thickness (5.7 mm and 9.5 mm). As it can be seen in Figure 12, strength of the scarf joint is not significantly affected from the thickness of the adherends and is mostly dependent on the scarf angle. A plot of a failed FE model can be found in Figure 13, where the red colour denotes the completely failed elements of the adhesive according to the proposed degradation model.
Strength prediction of thin (5.7 mm) and thick (9.5 mm) marine scarf joints. FE model plot of a failed marine scarf joint coupon.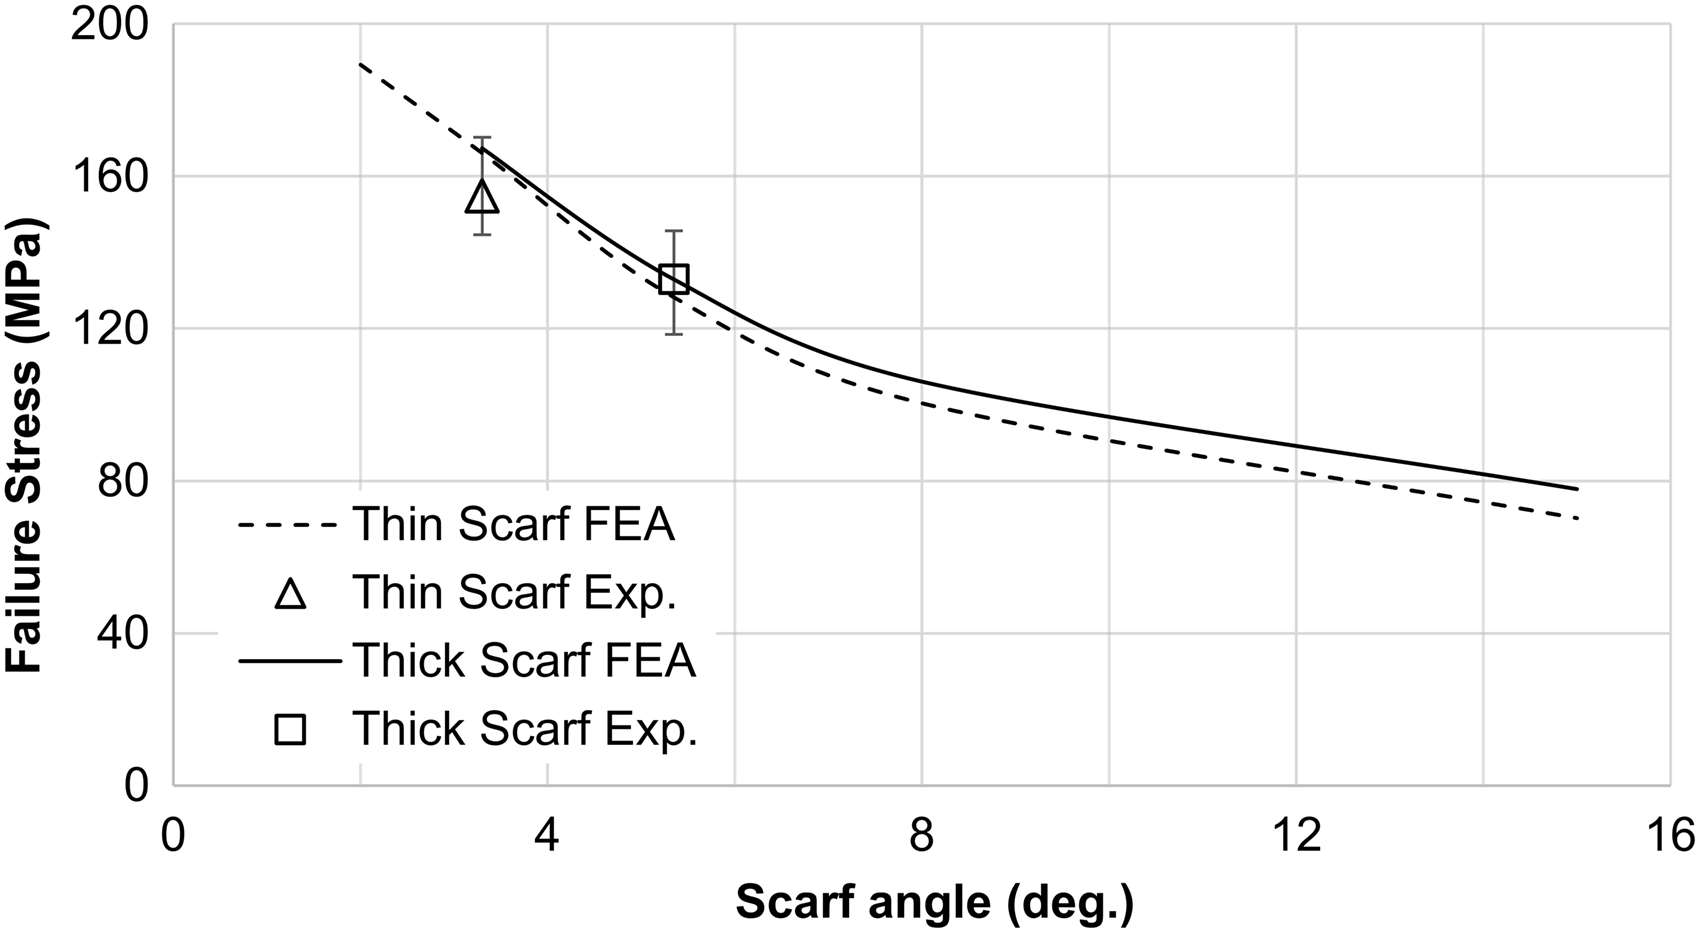
CFRP aviation coupons joined by secondary bonding
Detailed description on the tests performed on aviation scarf joints can be found in Campilho et al.
14
This time the scarf joints were of constant thickness but of varying overlap to achieve the different scarf angles. The value of the model parameter Strength predictions against experimental results for aviation scarf joints.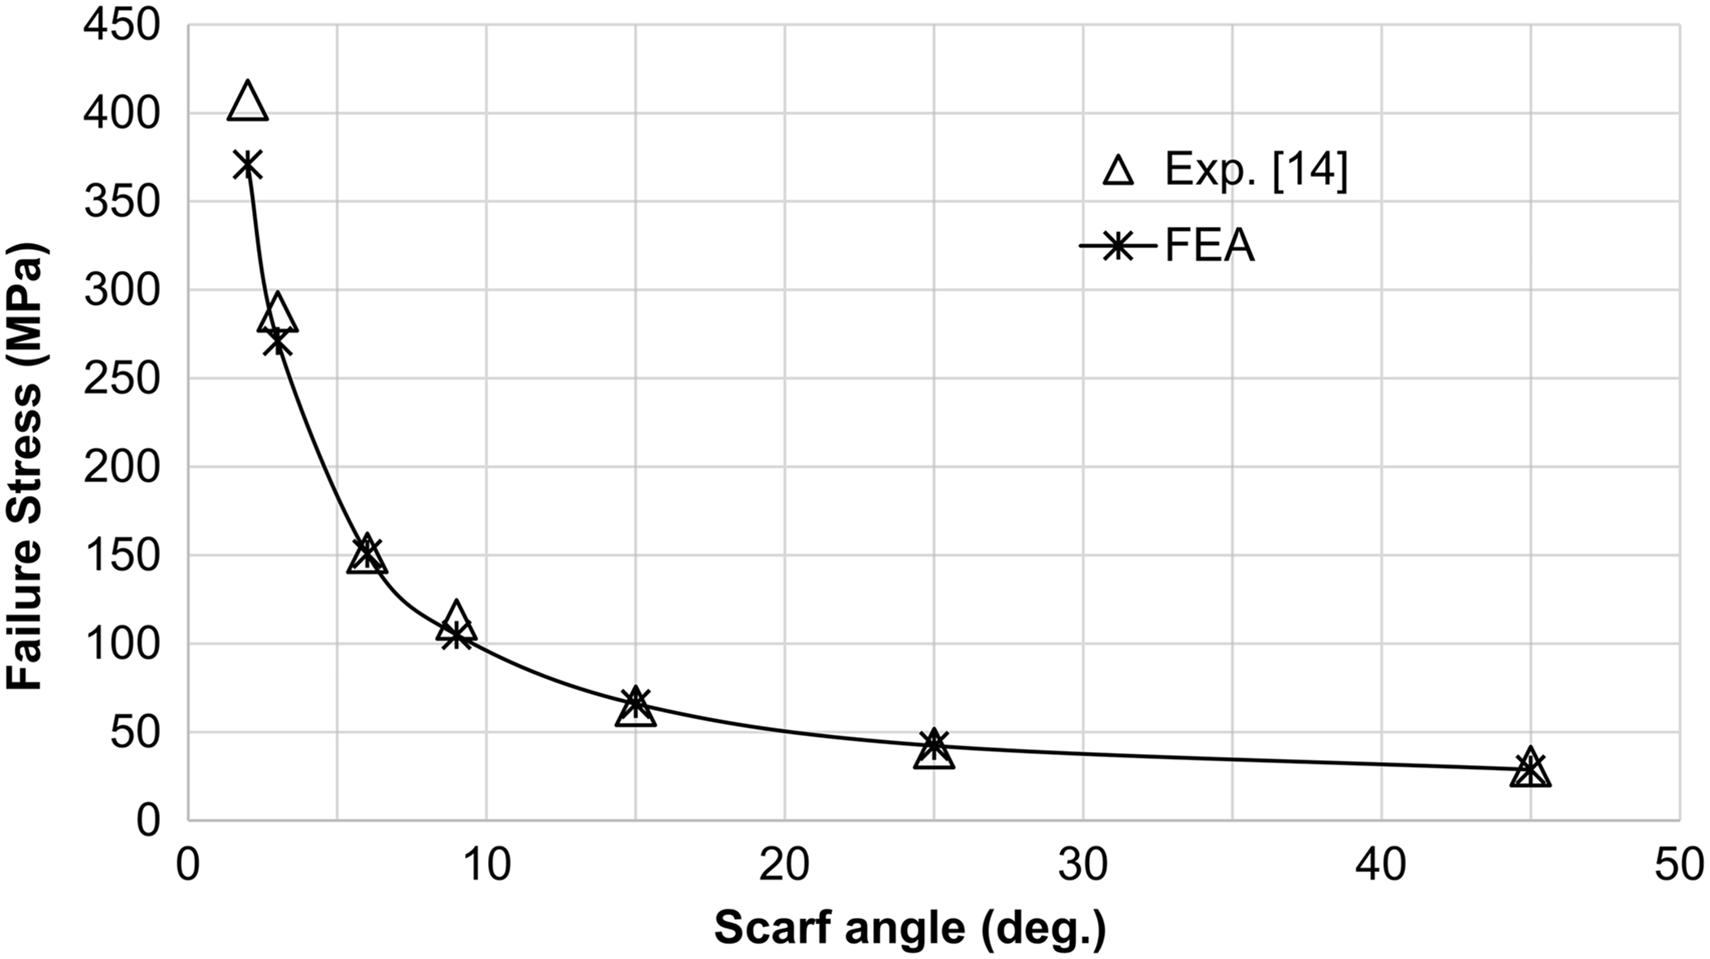
Validation on a full-scale repair patch
Design basis
The proposed model has been utilized to guide the design of a repair patch on a stall regulated 20 m wind turbine rotor blade in the frame of a cooperative with industry research project. 24 More specifically, extended damage has occurred in the flange of the blade spar beam due to lightning strike. After machining and removal of the scrap material an elliptic opening is left in the suction side spar cap; one of the main load bearing elements of the blade.
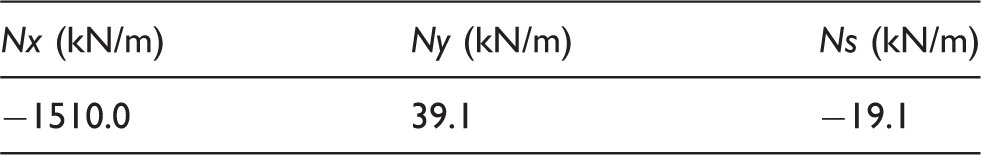
Repair region is located at 14 m from the root of the blade as seen in Figure 15. The laminate of the suction spar cap in this location has a thickness of trep = 0.0192 m and is almost exclusively composed of UD GFRP layers. The blade 3D shell FE model has been used to calculate the stress resultants in the repair region for the maximum design load of the blade, listed in Table 6.
Rotor blade geometry with highlighted repair region. Stress resultants at the repair region for ultimate design load.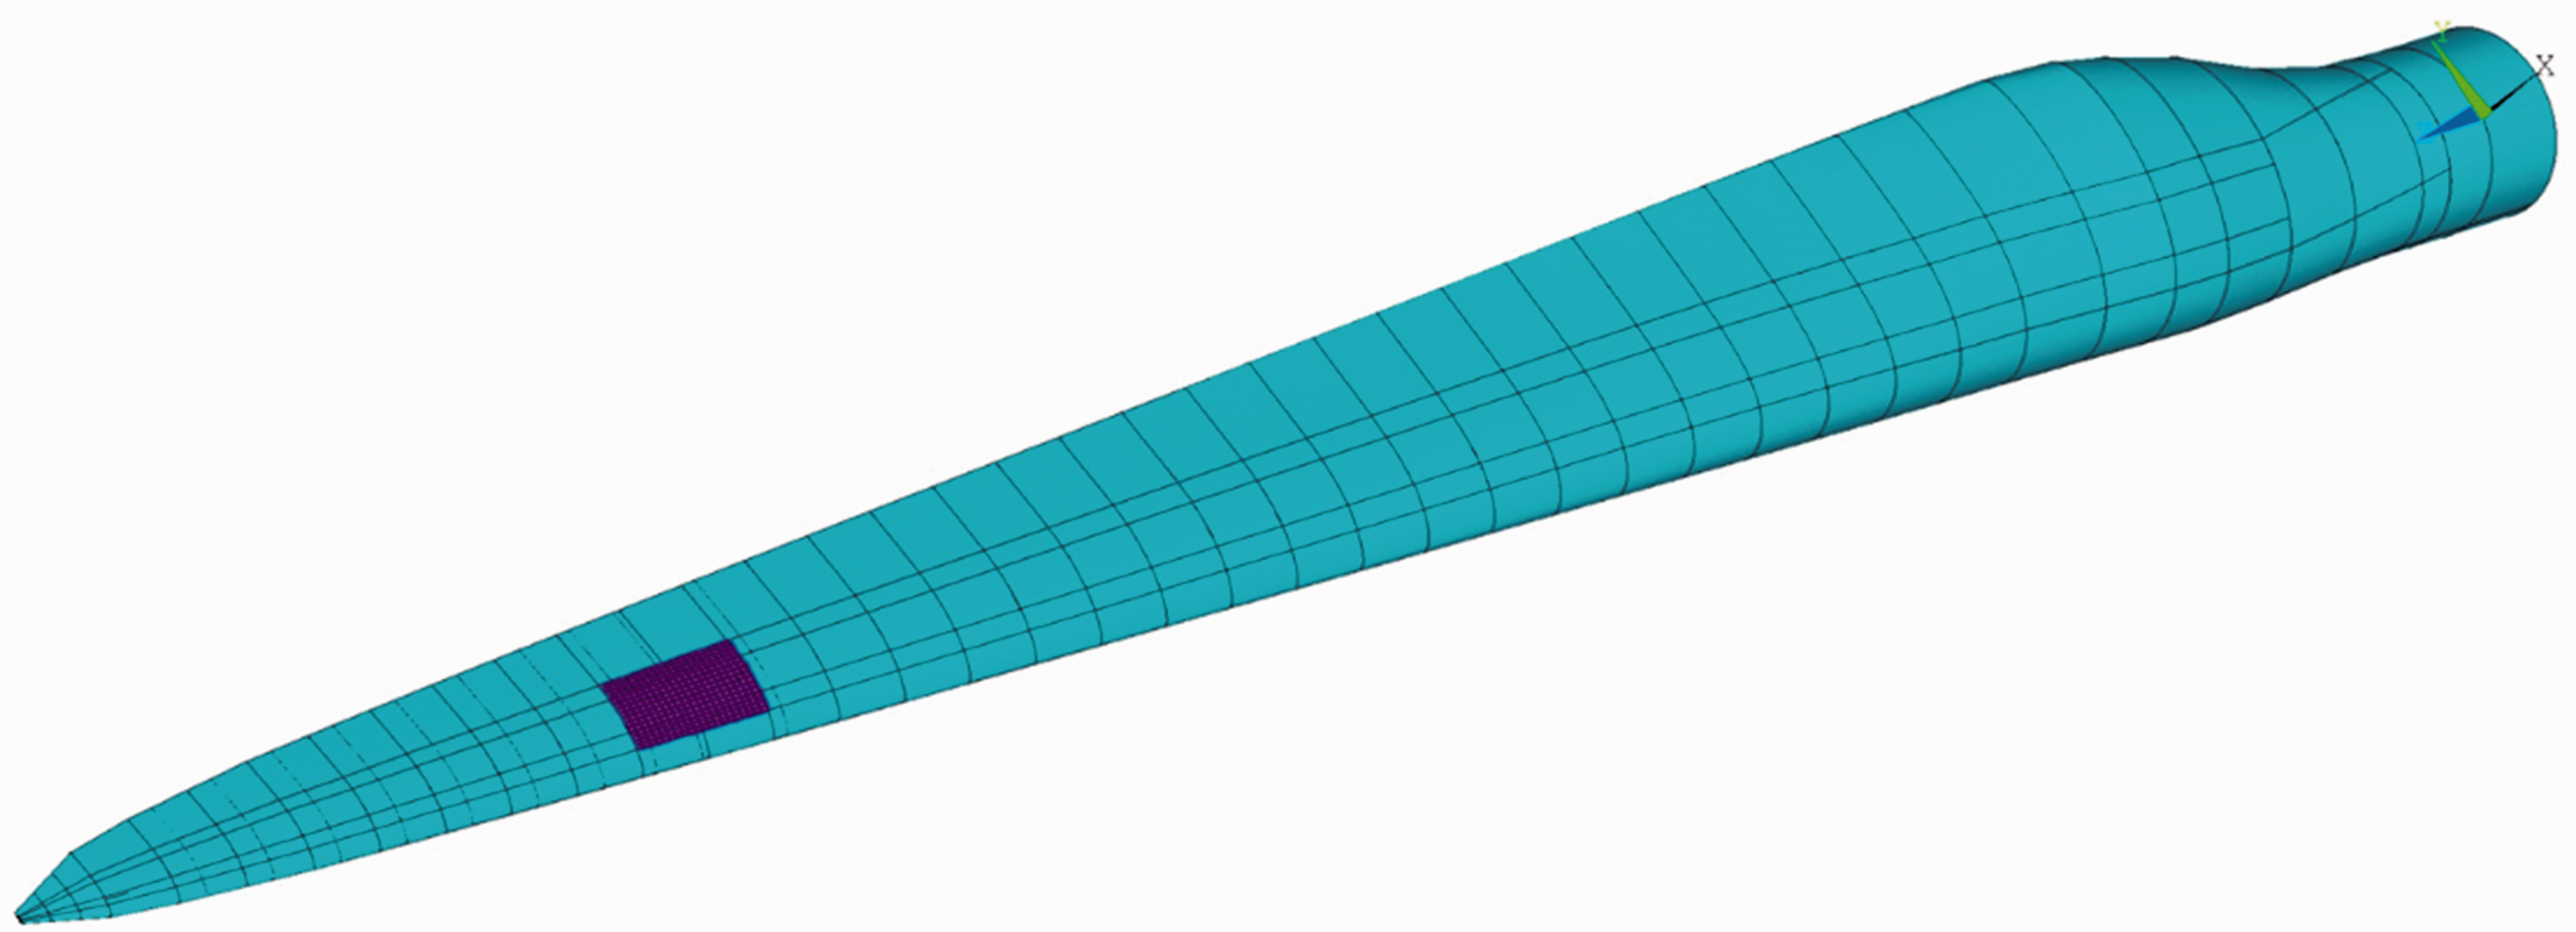
The opening overall dimensions are w = 0.09 m wide and h = 0.16 m long. After assessing different configurations, the ovalized geometry has been found to introduce the lowest stress concentrations on the repair region. Along fiber maximum stress failure criterion values, produced from a 3D submodel of the repair region, are shown in the contour plot of Figure 16.
Maximum stress failure criteria of the repair region.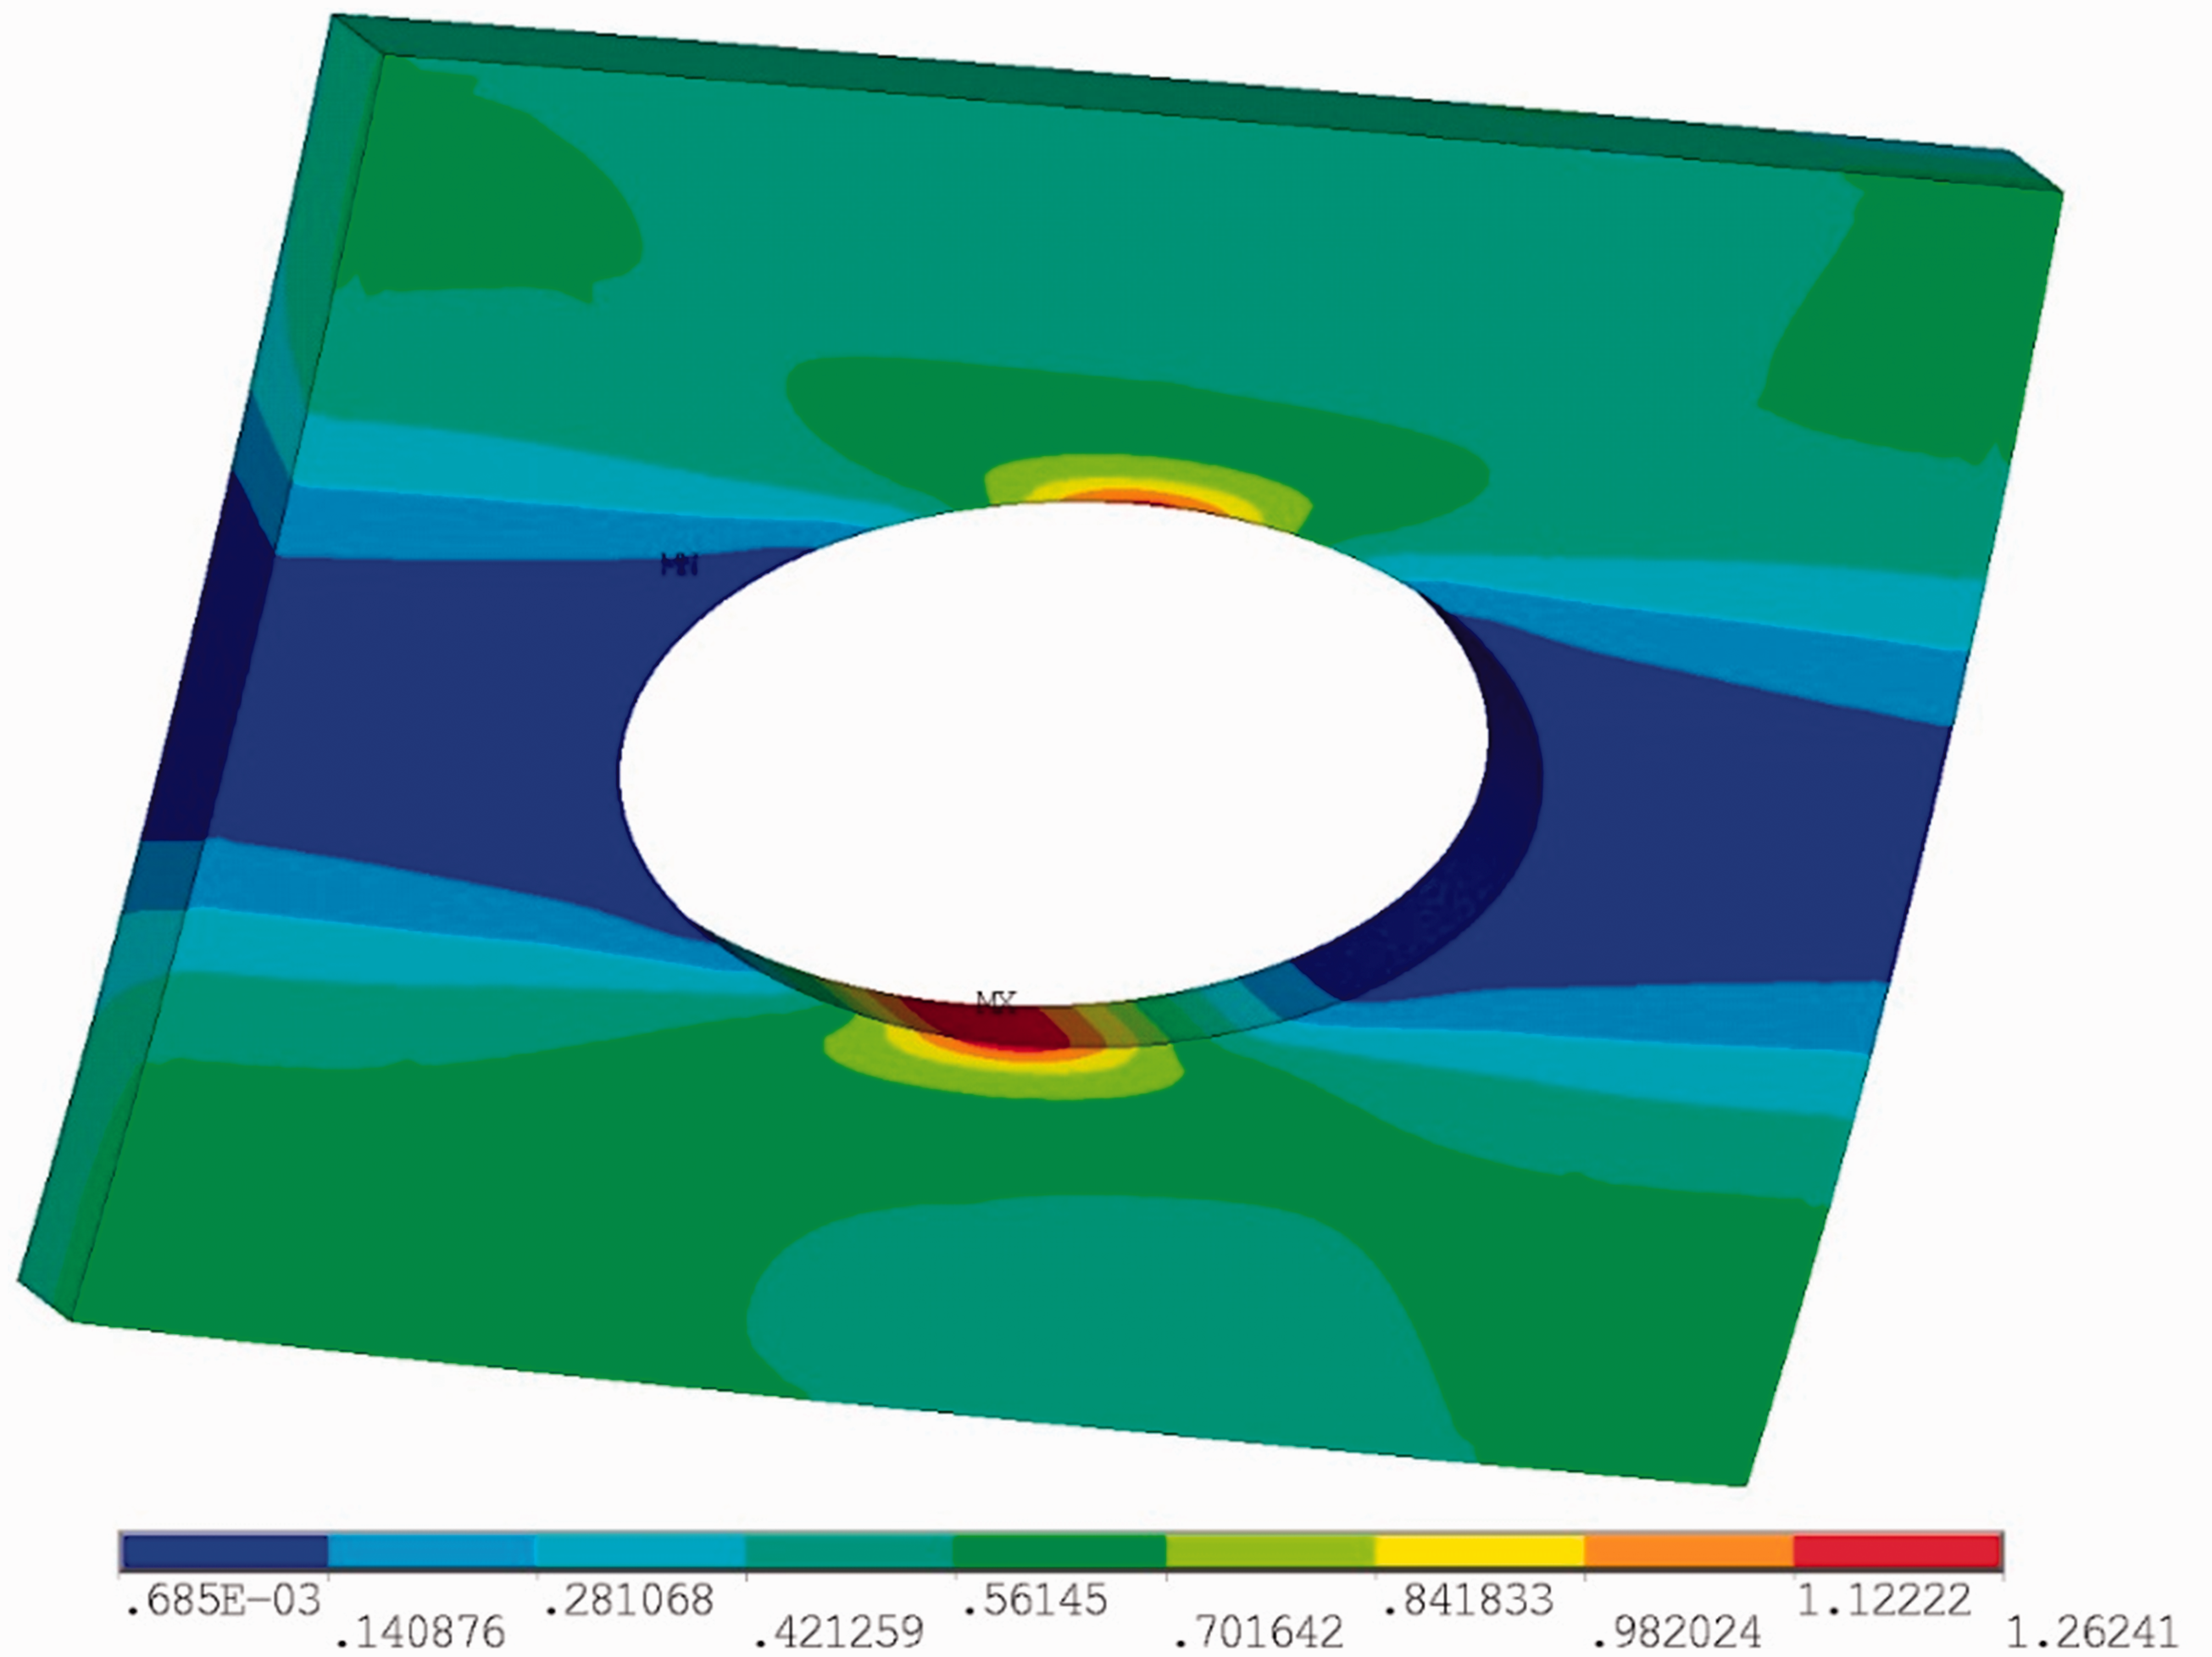
The selected repair technique is to apply a marine type scarf patch using UD layers. The previously described UD glass/epoxy material, the properties of which are listed in Tables 1 and 2, is used for the patch, as well as the repair region of the blade. The proposed progressive damage model is used to select the optimum scarf angle for the patch.
Design model description
The assessment was performed by reducing the problem into 2-plane strain FE models of the sections defined by the major and minor axis of the elliptical patch (Figure 17). The fibers are oriented along the loading axis and in the transverse direction for the major and minor axis plane strain model, respectively (Figure 18).
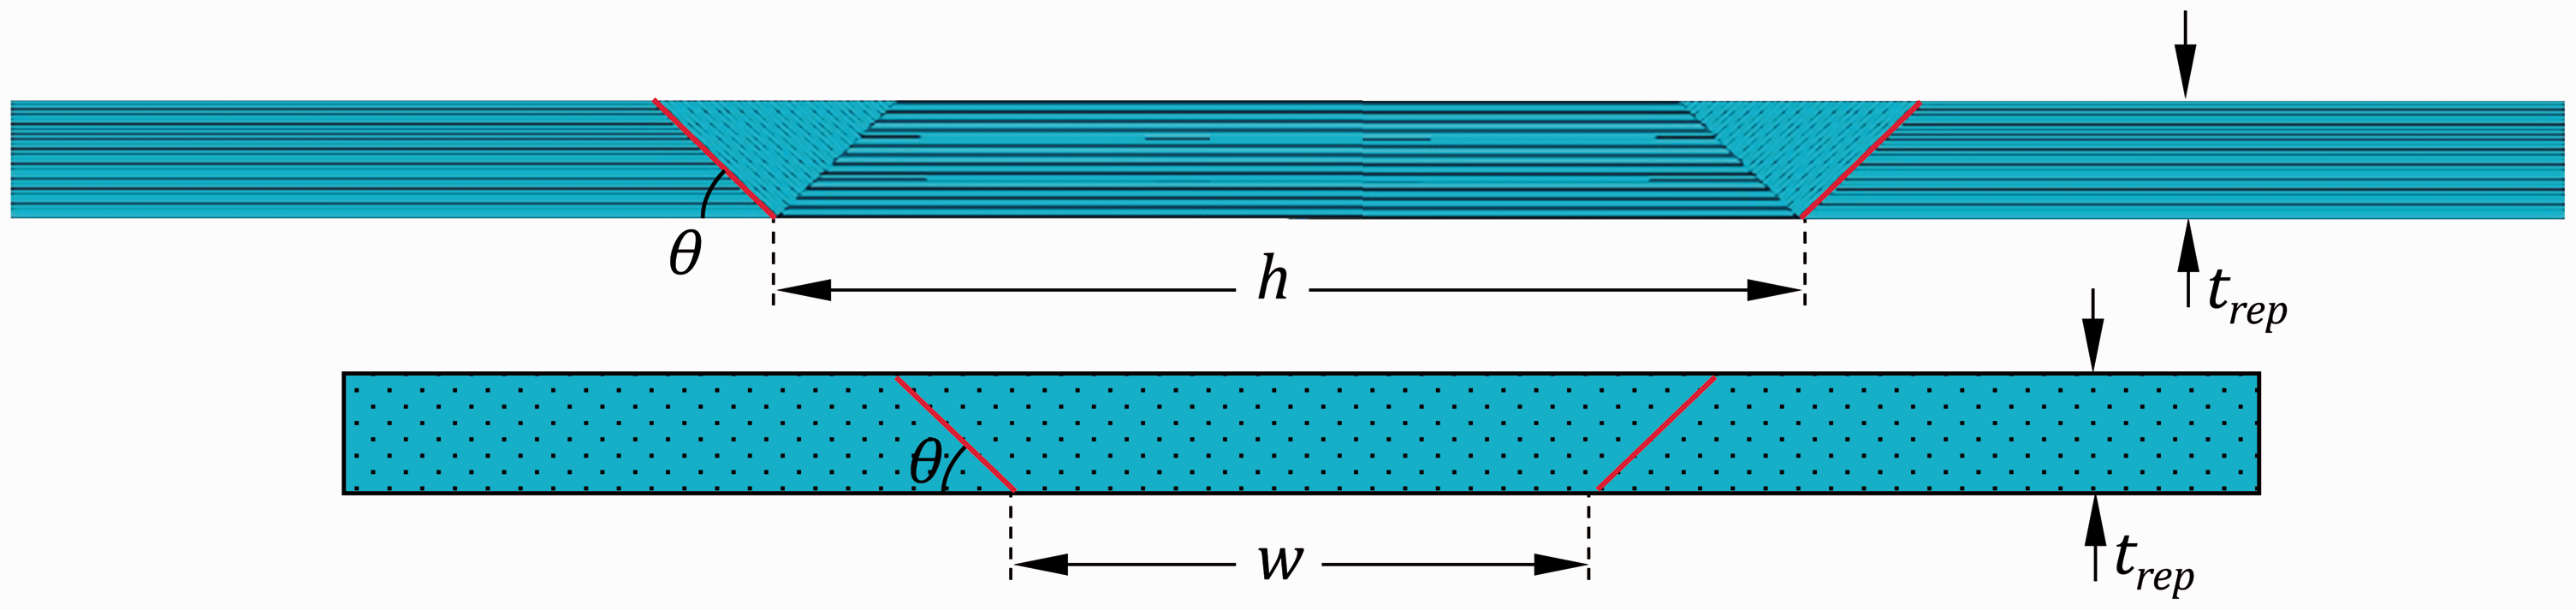
3D model of the repair region showing the section planes for the plane strain models. Plane strain models representing the marine scarf patch repair of the blade.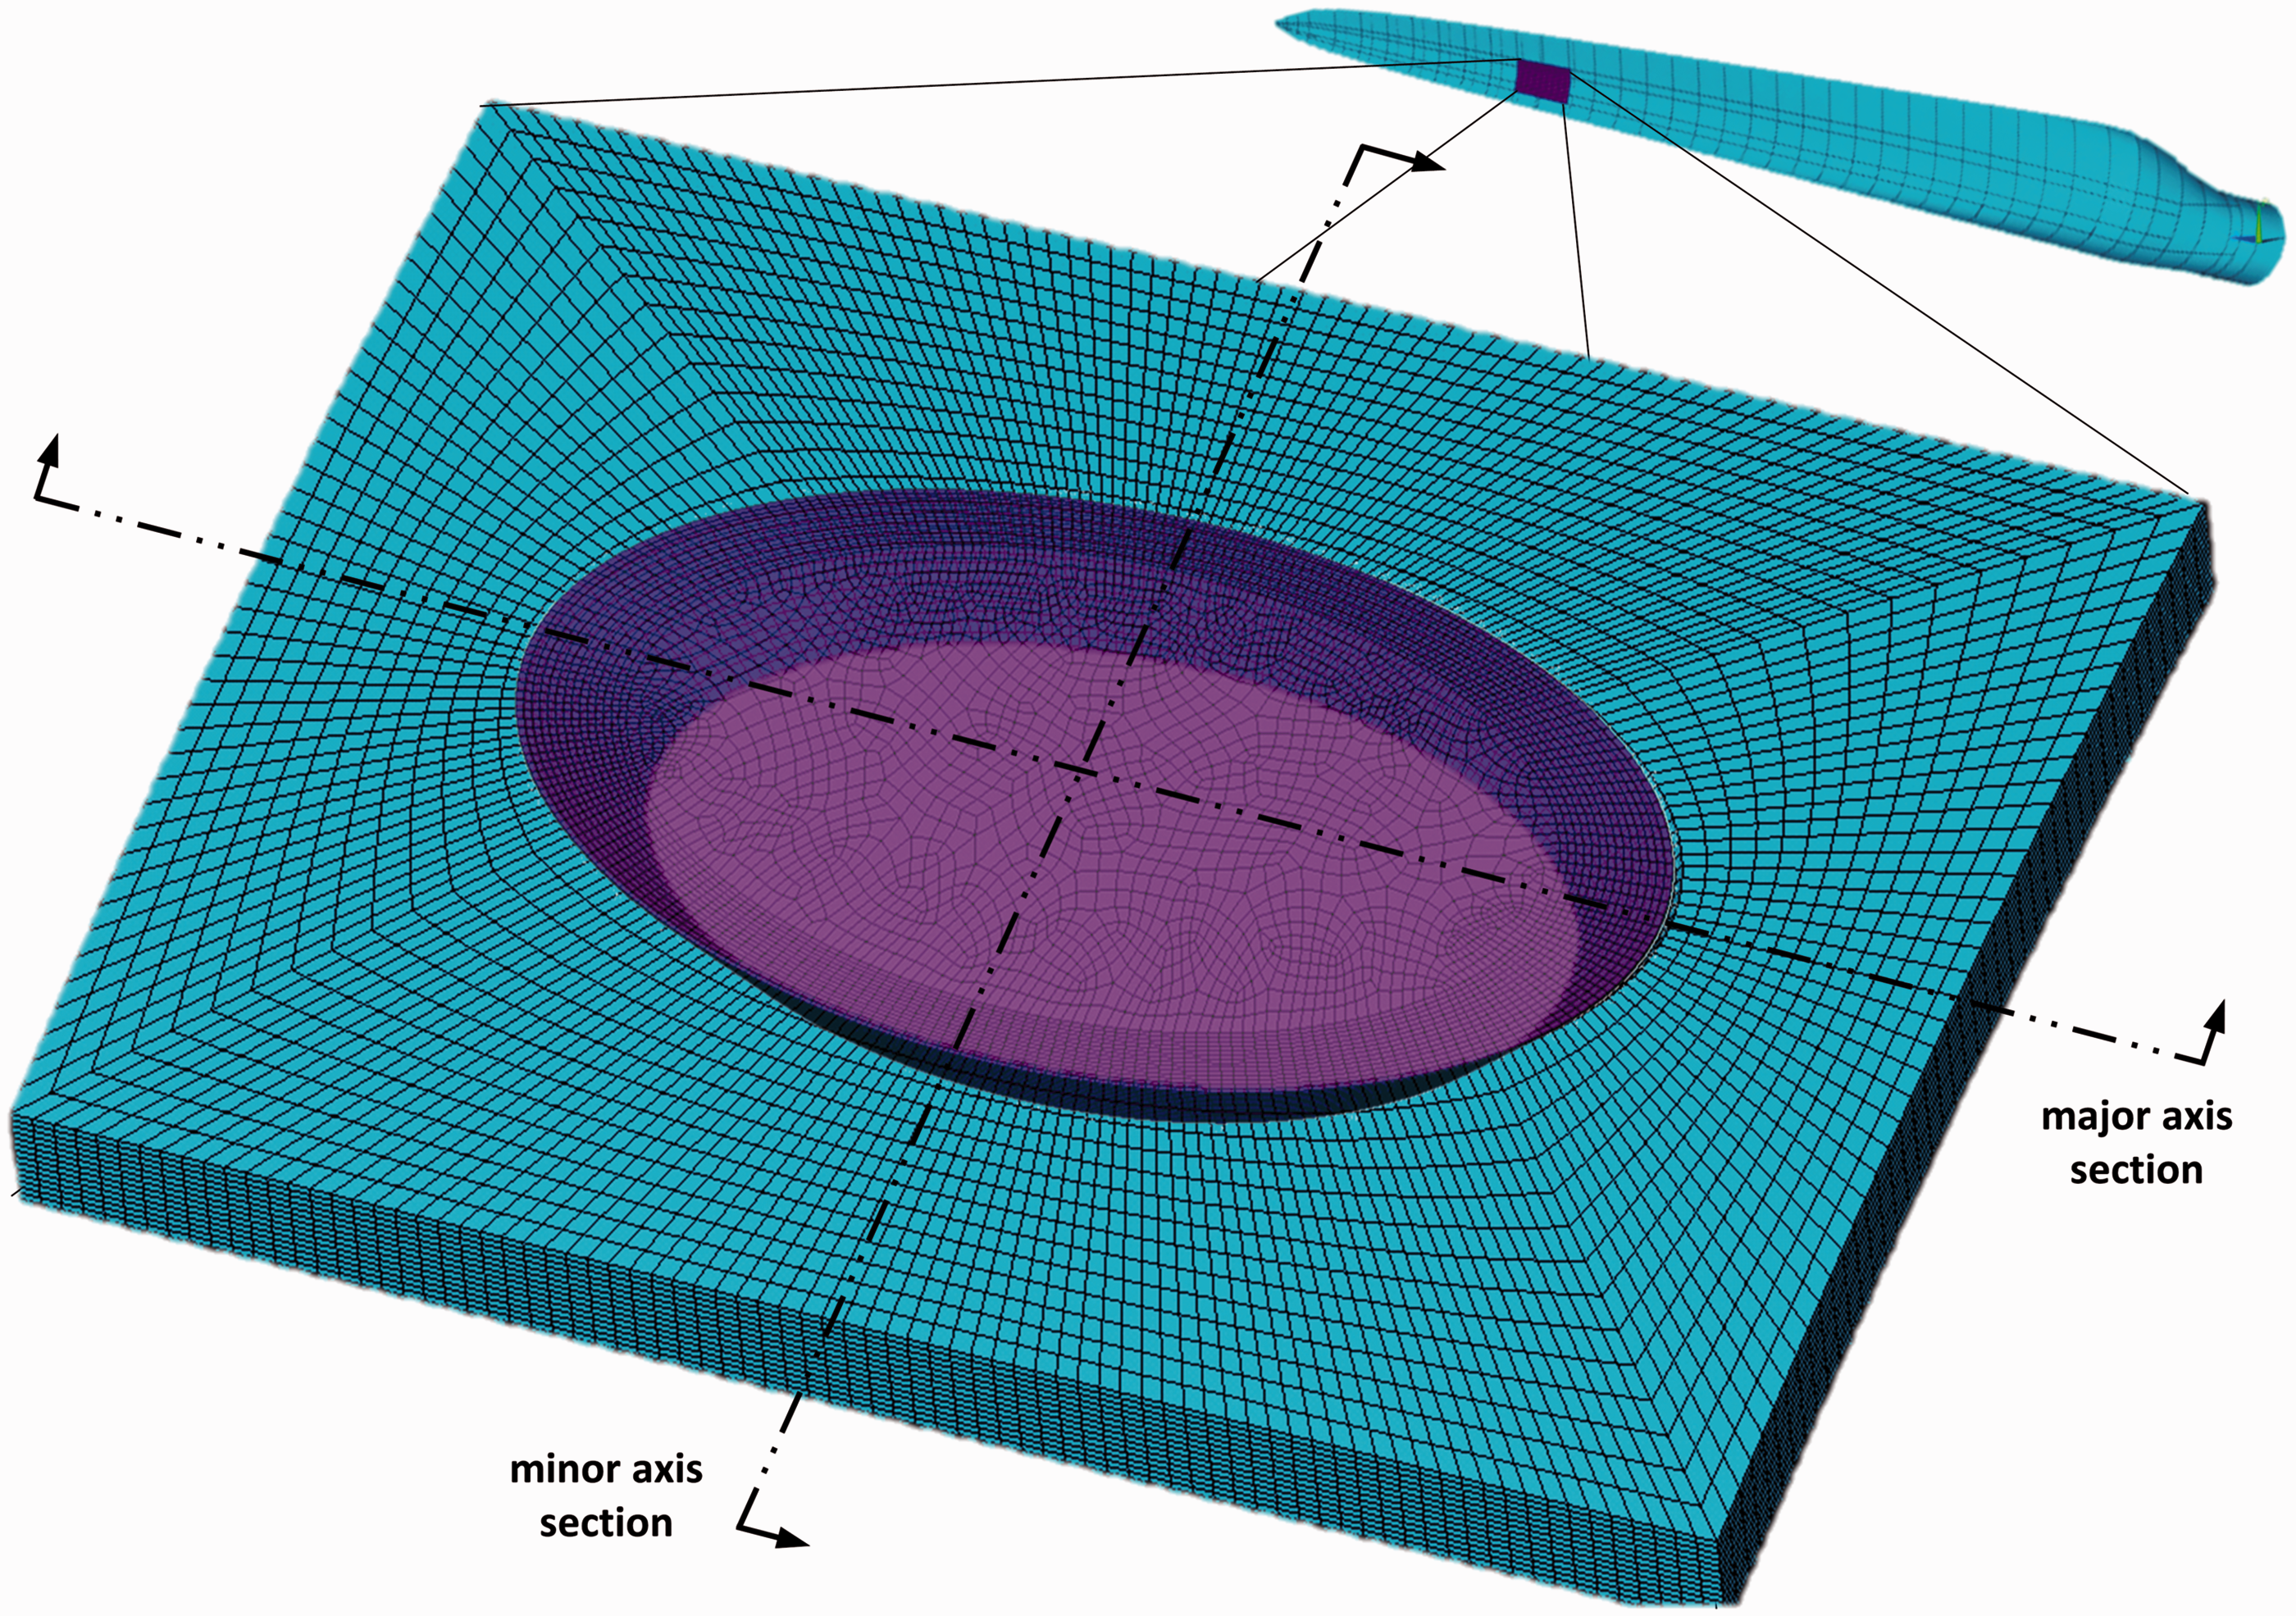
Following the methodology of the “Numerical model description” section, the representative adhesive thickness for both models is calculated to be tr/2 = 0.325 mm and has the properties of the polymer matrix in the UD composite ply. The same element types and mesh densities have been used with the ones described for the models in the “Numerical model description” section. The major axis model is loaded in compression, while the minor axis one in tension, by applying axial displacement increments on the nodes at the edge of the coupon model. In each case, half the model has been solved along the length, using symmetry boundary conditions at the middle. Furthermore, the value of
Due to the high loads observed in the major axis direction, progressive damage modeling, of the composite adherends, has been introduced for that case. The Puck criterion is used with the associated property degradation strategy and is described in detail in Masmanidis and Philippidis. 22
Design calculations
Due to the compressive nature of loads along the major axis of the patch, a repair with the desirable restoration can be achieved with a relatively large scarf angle. A range of angles between θ = 20° and θ = 45° is investigated. As can be seen in Figure 19, for θ = 45° the repair strength is higher than the expected stress resultants and this angle was chosen for the repair.
Stress resultant along the loading axis vs applied displacement for different angles.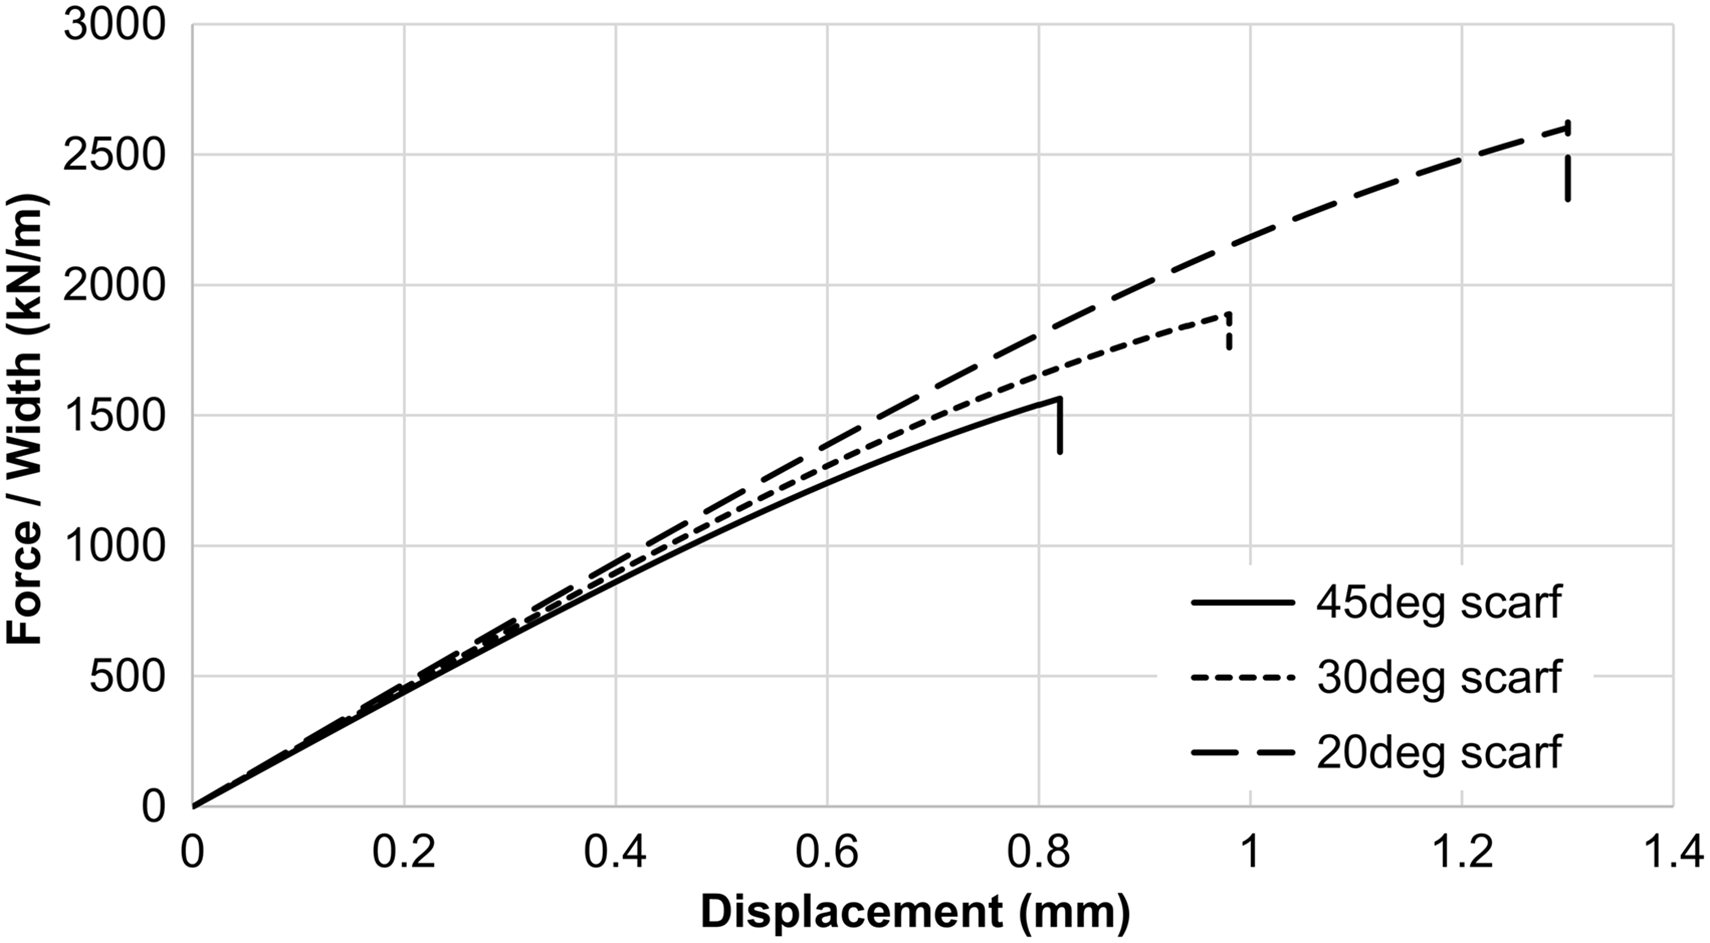
The contour plot of Figure 20 shows different failure modes as damage progresses for the major axis model with θ = 45°. Damage is initially detected at 95% of ultimate load and when the 100% is reached, damage keeps propagating to complete joint failure without increasing the applied load, i.e. the part of the computational routine that applies the same load-step until failure stops to progress, is activated. Therefore, from contour 2 failure progresses to the state of complete debonding (contour 3) without any load increase. It can be observed that as the debonding progresses, extensive damage occurs in the layers of the marine scarf patch that are not oriented along the loading axis. The red coloured elements correspond to failed adhesive material while other colours correspond to the various failure modes of the adherends according to Puck criteria; FFT and FFC denote tensile and compressive fiber failure respectively while IFFA, IFFB, and IFFC refer to the three-matrix failure modes that are described in more detail in Masmanidis and Philippidis.
22
Progressive failure of the major axis plane strain model.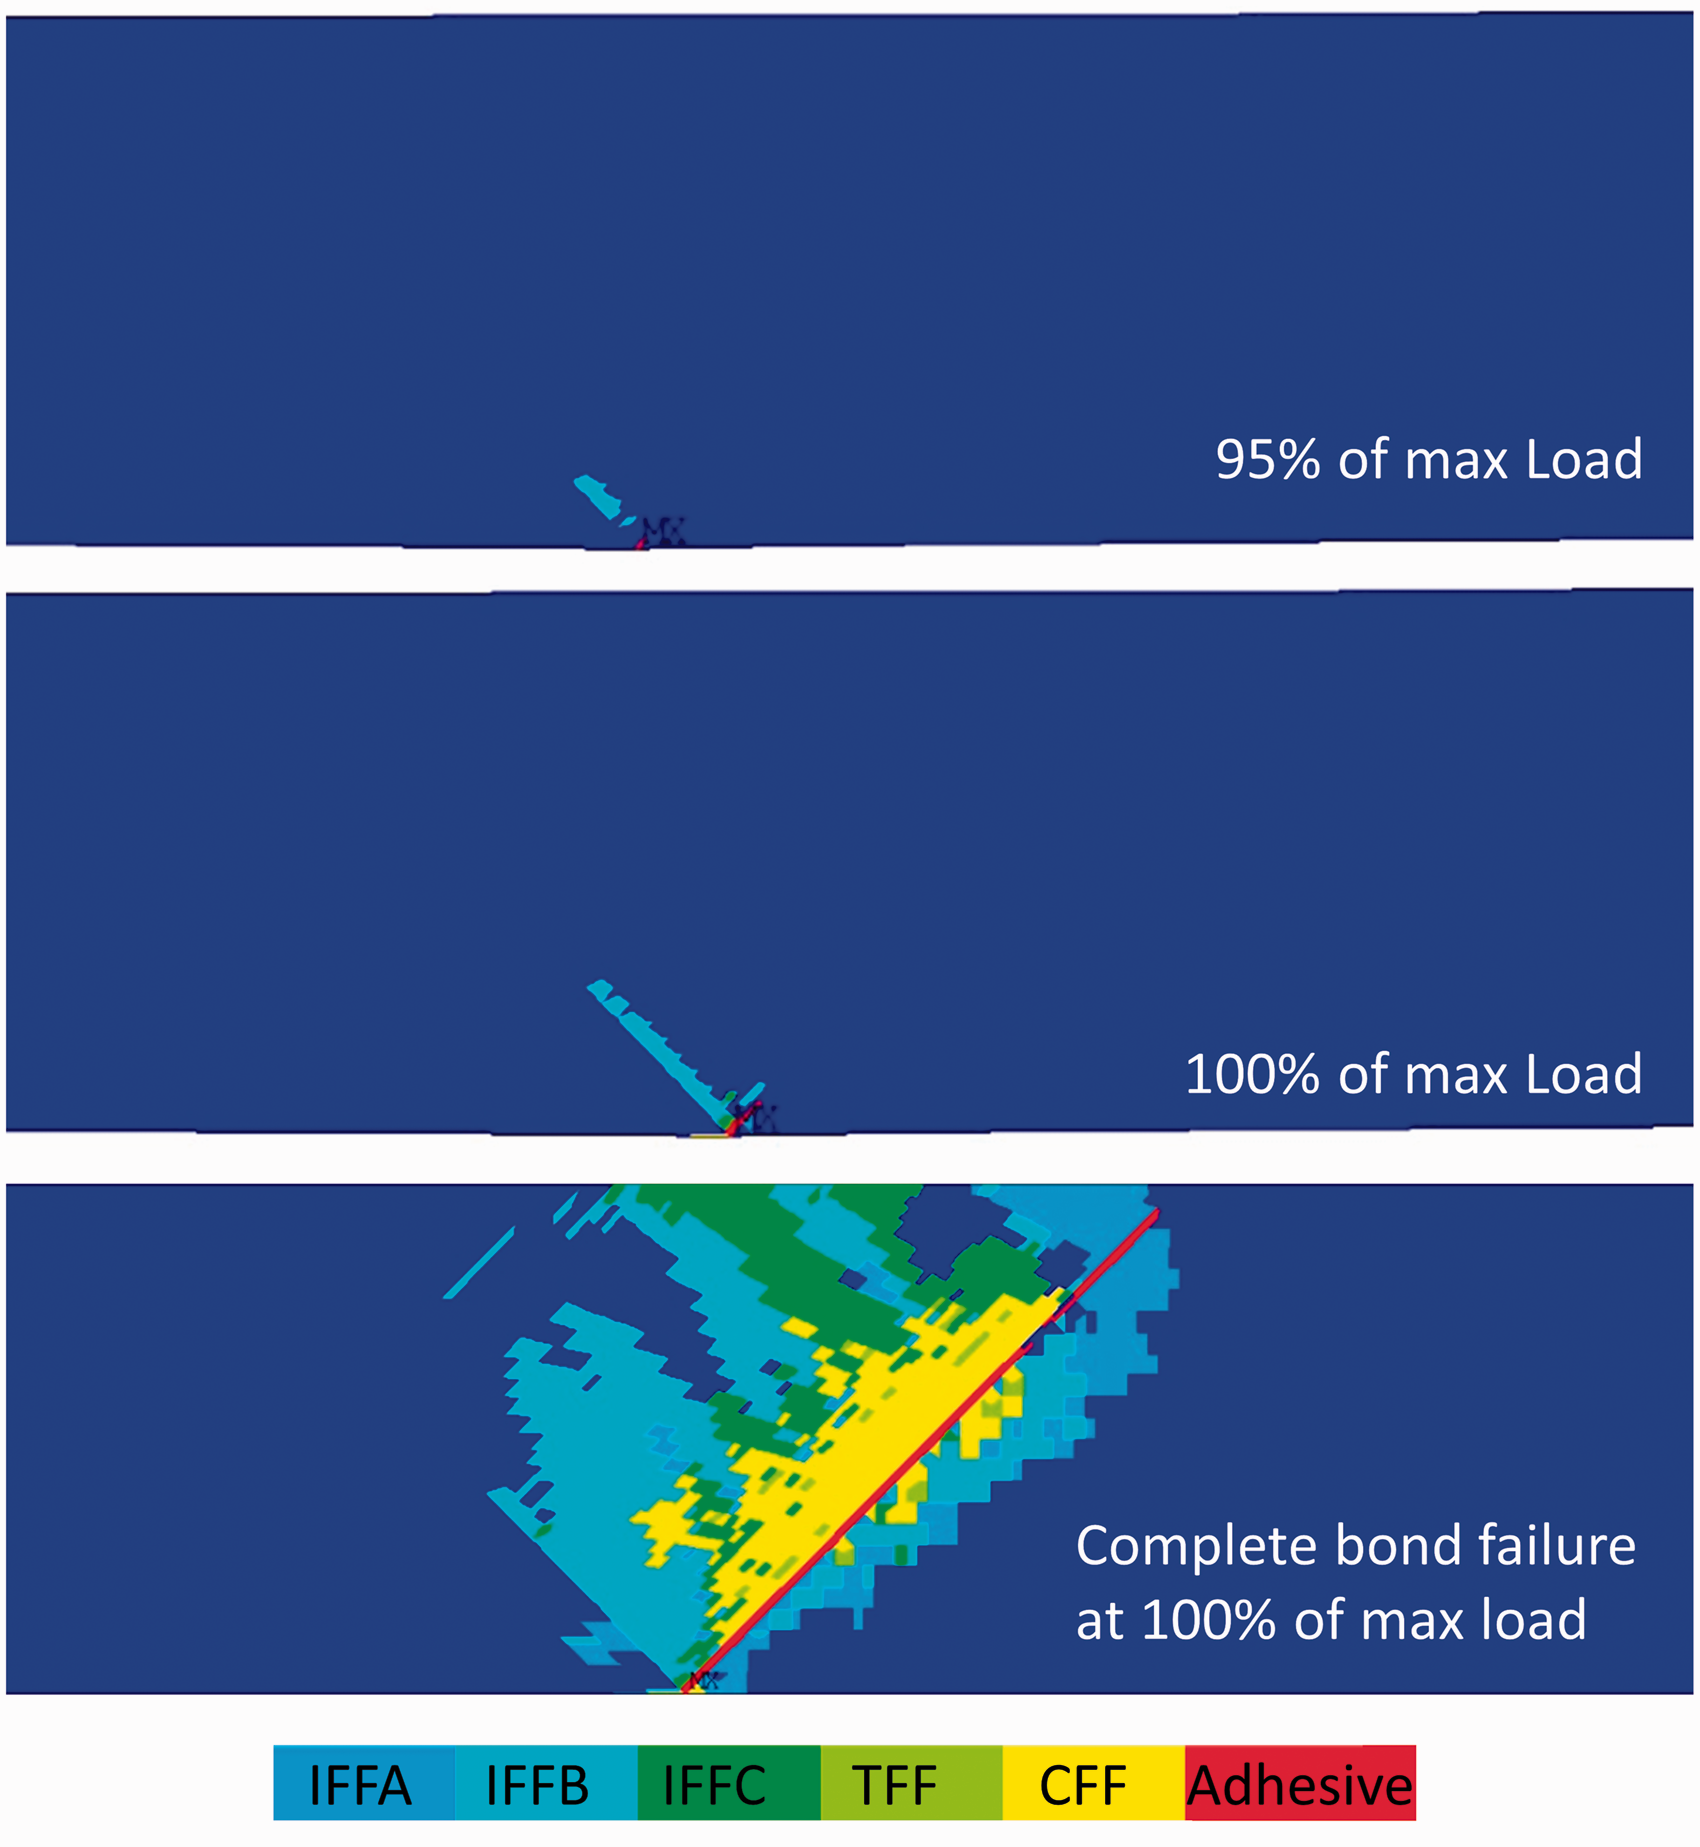
In the minor axis direction, the scarf patch is under tension but the loads are 40 times smaller. The optimum angle (θ) calculated using the major axis model is used and checked for the minor axis direction. Further optimization is possible by varying the scarf angle along the circumference of the elliptical patch. However, this will make the in situ repair of the blade practically very difficult.
For the selected scarf angle θ = 45°, the adhesive progressive damage model has been used to calculate a debonding stress resultant of 986 kN/m which is 25 times higher than the value of Table 6. Therefore, there is no danger of debonding in that direction. Furthermore, the axial stress of the plane strain model for the minor axis of the patch, reaches a magnitude of 52.2 MPa just before the beginning of debonding. Since both the adherend and the patch are loaded in the transverse to the fibres direction, for a 45° scarf angle, matrix cracking and debonding will occur almost simultaneously.
Patch design verification testing
To validate the repair design, a full-scale test of the repair region has been performed at the Blade Laboratory of the Center of Renewable Energy Sources (CRES) in Greece. A subcomponent of the blade has been designed by University of Patras and manufactured by Compblades Ltd., one of the industrial partners of the REWIND project.
24
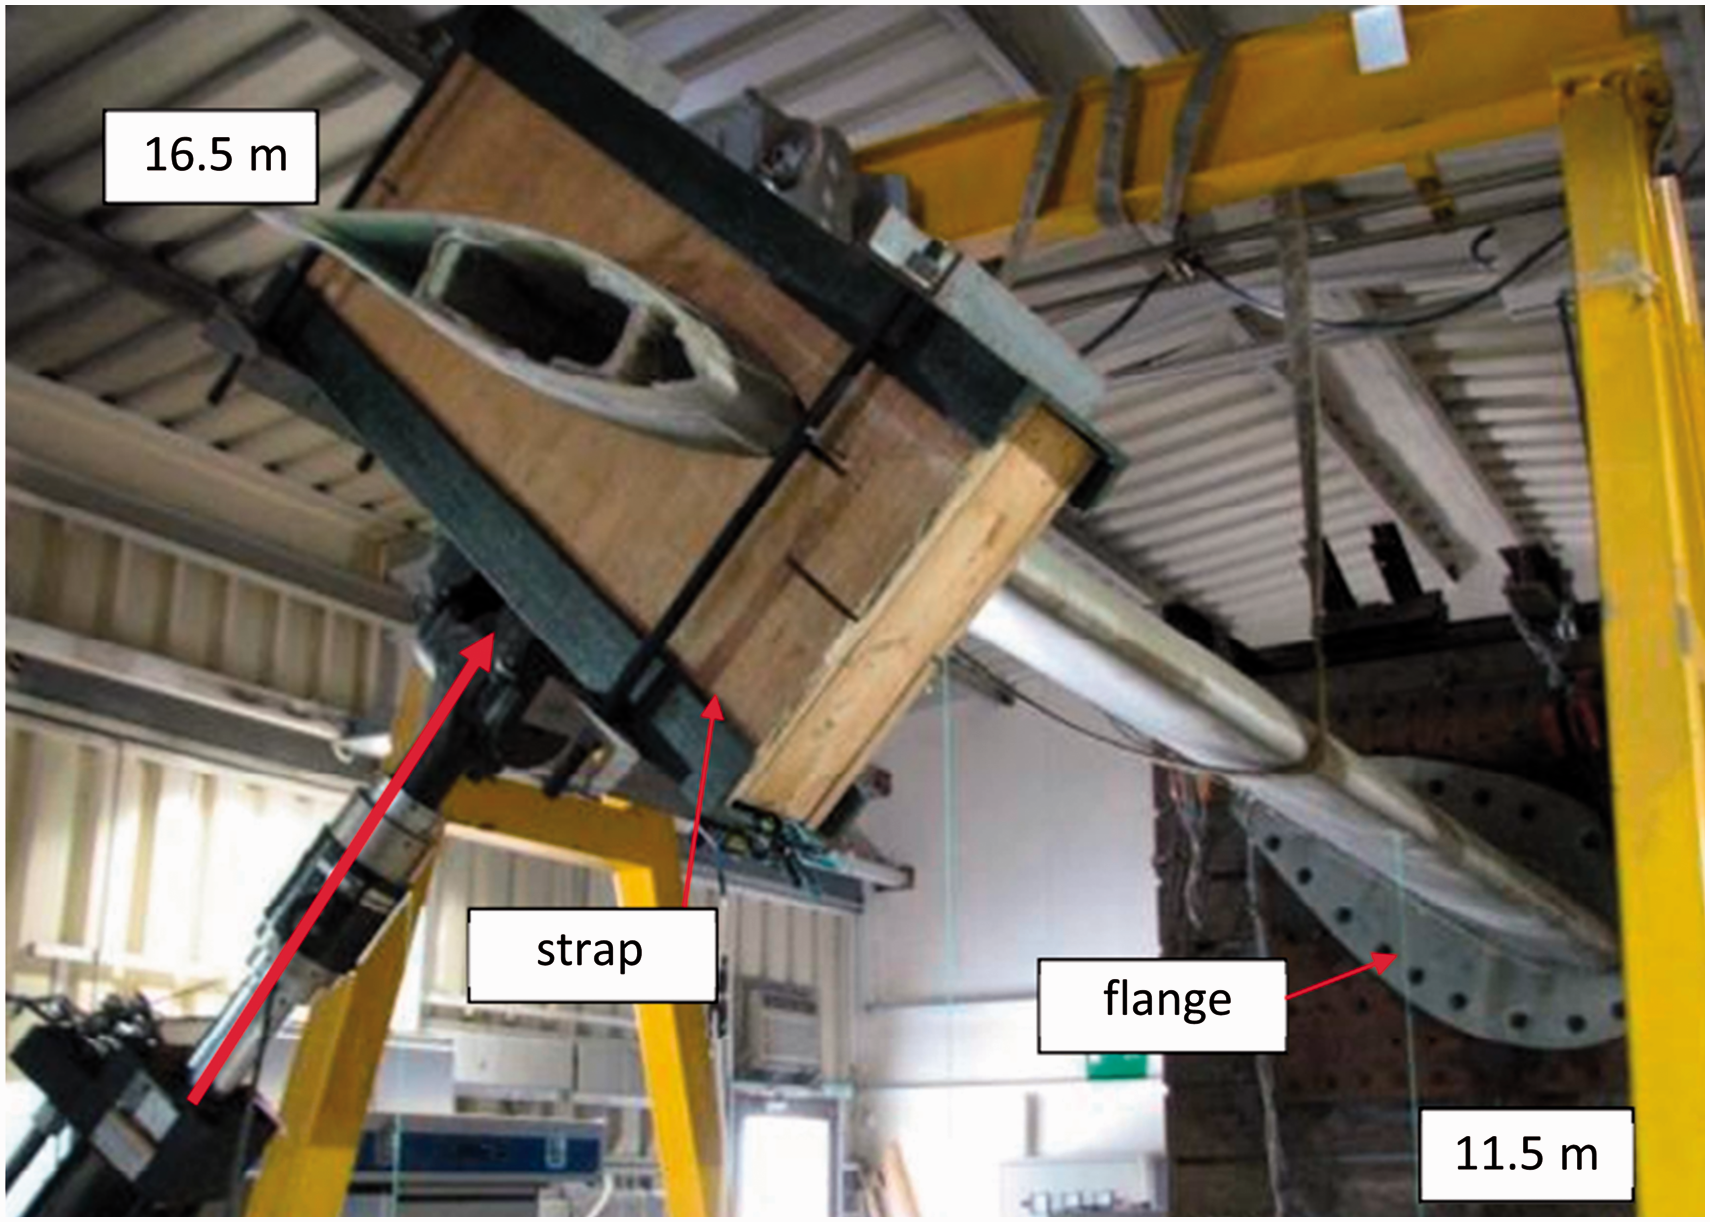
The subcomponent has the exact geometry and laminate plan of the original blade, but consists only of the structure located from 11.5 m to 16.5 m from the blade root. As can be seen in Figure 21, a flange was designed to support the subcomponent on the test rig and the load is applied through a hydraulic ram. The applied maximum ram force is 32.75 kN with an angle of 14.57°, in order to produce the exact stress state of Table 6 in the repair region.
Validation testing of repair patch using the blade subcomponent.
25
The displacement control loading has been applied using an MTS 247.22 hydraulic ram. During the test, strains were measured in nine locations of the subcomponent using HBM 6/350RY81 strain gauge rosettes. The deflection of the blade was measured with PATRIOT velometers having a range of 2000 mm. The displacement and load of the ram was also monitored. The data were recorded using CRESDAQ developed by CRES with 37 channels recording at 128 Hz. The mass and center of mass of the blade were measured to apply the appropriate load for relieving the subcomponent of any stresses from gravitational forces.
The test was performed successfully with the patch being under the design load for 10 min, without any signs of damage in the repair region. However, damage was observed in the laminate in the fillet region of the hub. Therefore, the specimen was not loaded beyond the design load to measure the ultimate restoration strength of the repair. Although it is of great value that the design approach has been proven to be conservative, premature failure of the full-scale specimen did not allow for safe conclusions on the accuracy of the proposed approach for modeling repair patches.
To further verify the validity of the plane strain modeling approach, strain measurements from the experiment
25
were compared with strains extracted from the models. Strains from both the subcomponent shell FE model and the plane strain FE model are shown in Figure 22. The axial strains are predicted with good accuracy and the plane strain model is proven suitable for the design of the patch.
Axial strains of the middle of the repair from shell and plane strain FE models vs. test.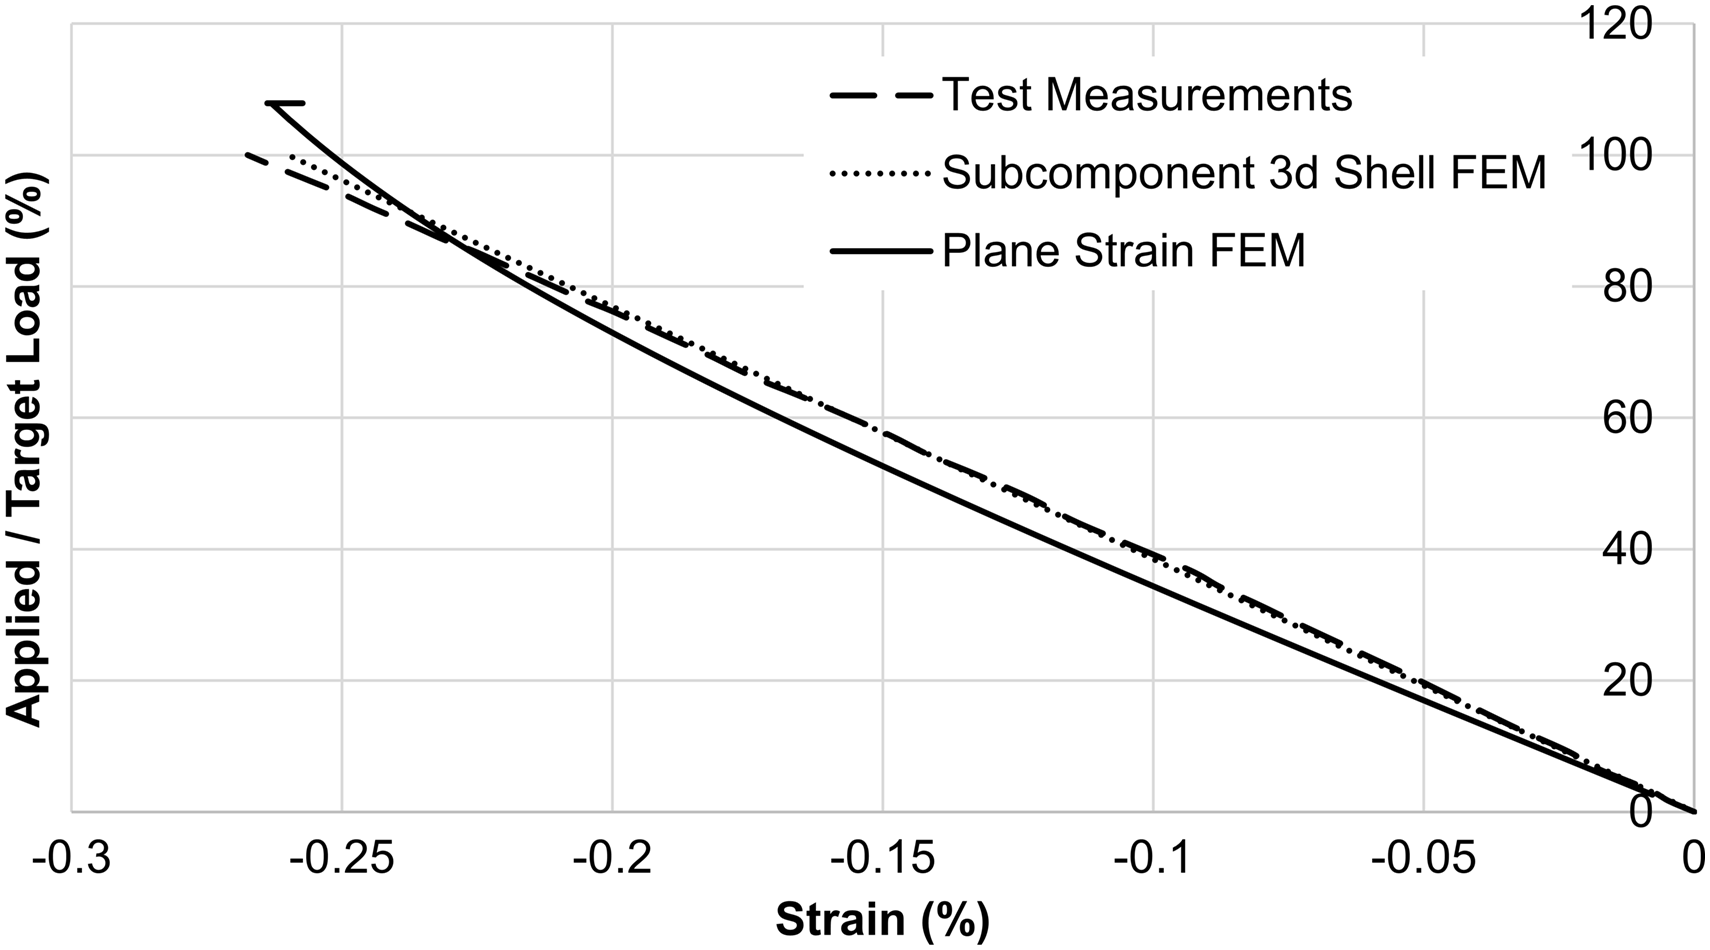
Conclusions
A bilinear softening model that has been already introduced by the authors to study progressive damage in lap joints is used to simulate failure of scarf joints with composite adherends. Both co-bonded and secondary bonded scarf joints were considered as well as different patch types referred here as marine and aviation.
Tests were performed in marine scarf coupons joined by means of co-bonding and the strength restoration found to be very low. This highlights the necessity for thorough surface preparation for proper adhesion.
Numerical simulation provided good results for ultimate loads. Analysis verified that joint strength is mostly depended on scarf angle and not the adherend thickness. Comparison of strength predictions with tests result of aviation scarf joints from the literature further verified the robustness of the proposed methodology to model joint behavior.
The proposed model has been used to guide the design of a repair patch on a wind turbine rotor blade. The model parameters calibrated with the marine scarf coupons have been used since the same joint type and materials is proposed for the repair. Reducing the problem to a plane strain model resulted in a very efficient design tool that has been validated through full-scale testing of the designed repair.
Footnotes
Declaration of Conflicting Interests
The author(s) declared no potential conflicts of interest with respect to the research, authorship, and/or publication of this article.
Funding
The author(s) disclosed receipt of the following financial support for the research, authorship, and/or publication of this article: This study was supported by Compblades Ltd (![]() ) through contract D357-2011 with the Research Committee of the University of Patras. The research work was also partially funded by EYDE-ETAK of the Greek Ministry of Development, in the frame of SYNERGASIA 2011 under contract ΣYN11_7_1000 (REWIND).
) through contract D357-2011 with the Research Committee of the University of Patras. The research work was also partially funded by EYDE-ETAK of the Greek Ministry of Development, in the frame of SYNERGASIA 2011 under contract ΣYN11_7_1000 (REWIND).