
Abstract
Thermal expansion, specific heat, diffusivity, and conductivity of carbon fiber-epoxy composites were studied using autoclave and out-of-autoclave prepregs with three different fabric weaves including unidirectional, eight-harness satin, and plain weave. For this purpose, light flash analysis was utilized where the implications of using anisotropic materials were studied. Results indicated that density, thermal expansion, conductivity, and diffusivity were strongly influenced by the fiber configuration of the sample. This phenomenon was attributed to the difference in fiber volume fraction induced by the different weaves of the fabric. Nevertheless, specific heat was similar for all the samples regardless of fabric type or resin formulation. Finally, thermal properties of tetrafluoroethylene release film were presented to analyze the tool-part heat transfer during manufacturing. This release film showed thermal conductivity three times lower than carbon fiber-epoxy samples indicating that the film could be an important contributor to thermal lag between tool and part.
Keywords
Introduction
Thermal properties of composite materials depend on the amount and configuration of constituent materials because fibers and matrices have different thermal properties. In the case of carbon fiber-epoxy composites, fibers have considerably higher thermal conductivity (24.0 W/(m·K) than resins (0.17–0.79 W/(m·K)),1,2 which implies that fabric weave configuration and fiber volume fraction (Vf) may affect the thermal properties of composite parts.
3
These thermal properties are crucial to design manufacturing routines of large scale aerospace structures.
4
Carbon fiber reinforced polymers (CFRP) are commonly heat-cured using ovens or autoclaves where the predominant heat transfer methods are autoclave/oven convection and tool-part conduction, as shown in Figure 1. Note that although tools are commonly heated by convection, the predominant tool-part heat transfer mechanism is conduction due to the higher thermal mass of the tool. Hence, the combination of these heat transfer mechanisms along with the internal heat generation caused by the exothermic curing reactions (typical of epoxy resins) may induce gradients in heat flow and irregular curing throughout the part. These curing gradients might also reduce the mechanical properties and create geometrical distortion.
5
Since these defects are not easily reversible, curing gradients can be predicted using numerical methods which require several submodels including thermal properties of the materials.
6
Heat transfer mechanisms during composite processing.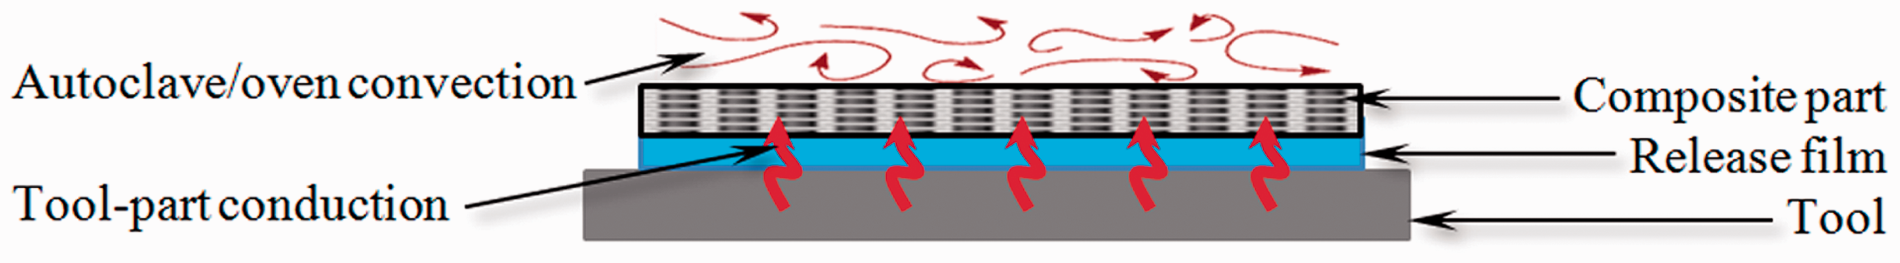
Previous research has comprised the measurement of thermal properties in CFRP composites at different temperatures by conduction methods. Sweeting and Liu 3 implemented a customized device to measure the thermal conductivity under vacuum conditions in which temperature sensors were placed along and through the thickness of the samples. Their results indicated conductivity values of 2–3 W/(m·K) in the fiber direction and 0.5–0.6 W/(m·K) in the through-the-thickness direction. Scott and Beck 7 proposed an alternative method to characterize simultaneously volumetric heat flux and thermal conductivity of composite materials during cure. Using modulated heat, the authors found an increase of thermal conductivity as a function of degree of cure. Friis et al. 8 implemented a technique to determine the thermal properties—Cp, diffusivity, and conductivity—of epoxy composites using the Ångström method. This approach consisted in measuring temperature response to heat fluctuations induced in one end of the sample. The authors found a relation between thermal properties and resin vitrification because their measurements showed an important variation in thermal properties when the degree of cure was higher than 0.7. Garnier and Sommier 9 proposed another method to calculate the thermal conductivity during cure. Using a signal analysis of the Ångström method, the thermal conductivity was calculated by deconvolution of the measured heat signal into two signals corresponding to thermal conductivity and the internal heat generation.
In this study, the thermal diffusivity and conductivity of carbon fiber-epoxy composites was characterized using a light radiation method. Samples made of prepregs with different fiber configurations, including unidirectional (UD), plain weave (PW), and eight-harness satin (8HS) were analyzed and the influence of fiber configuration on thermal properties was identified. The methodology utilized was the light flash method, which represents a fast alternative to characterize the thermal properties by heat radiation since each test takes around 2 min. Such tests were performed using fully cured samples at temperatures between 20 and 177℃, which corresponded to those of composites manufacturing. 10 In addition, the thermal conductivity at the tool part interface were analyzed by measuring the thermal properties of a tetrafluoroethylene (TFE) release film.
Materials and methods
Materials
Composite samples
Carbon fiber-epoxy materials utilized for characterization of thermal properties.
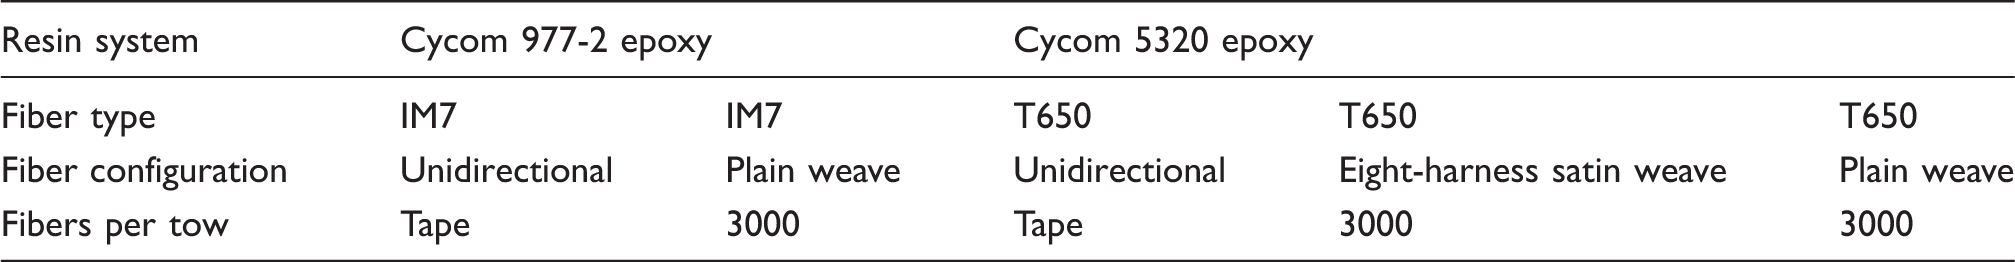
Fiber configuration of (a) unidirectional tape, (b) eight-harness satin weave, and (c) plain weaves.
Methodology
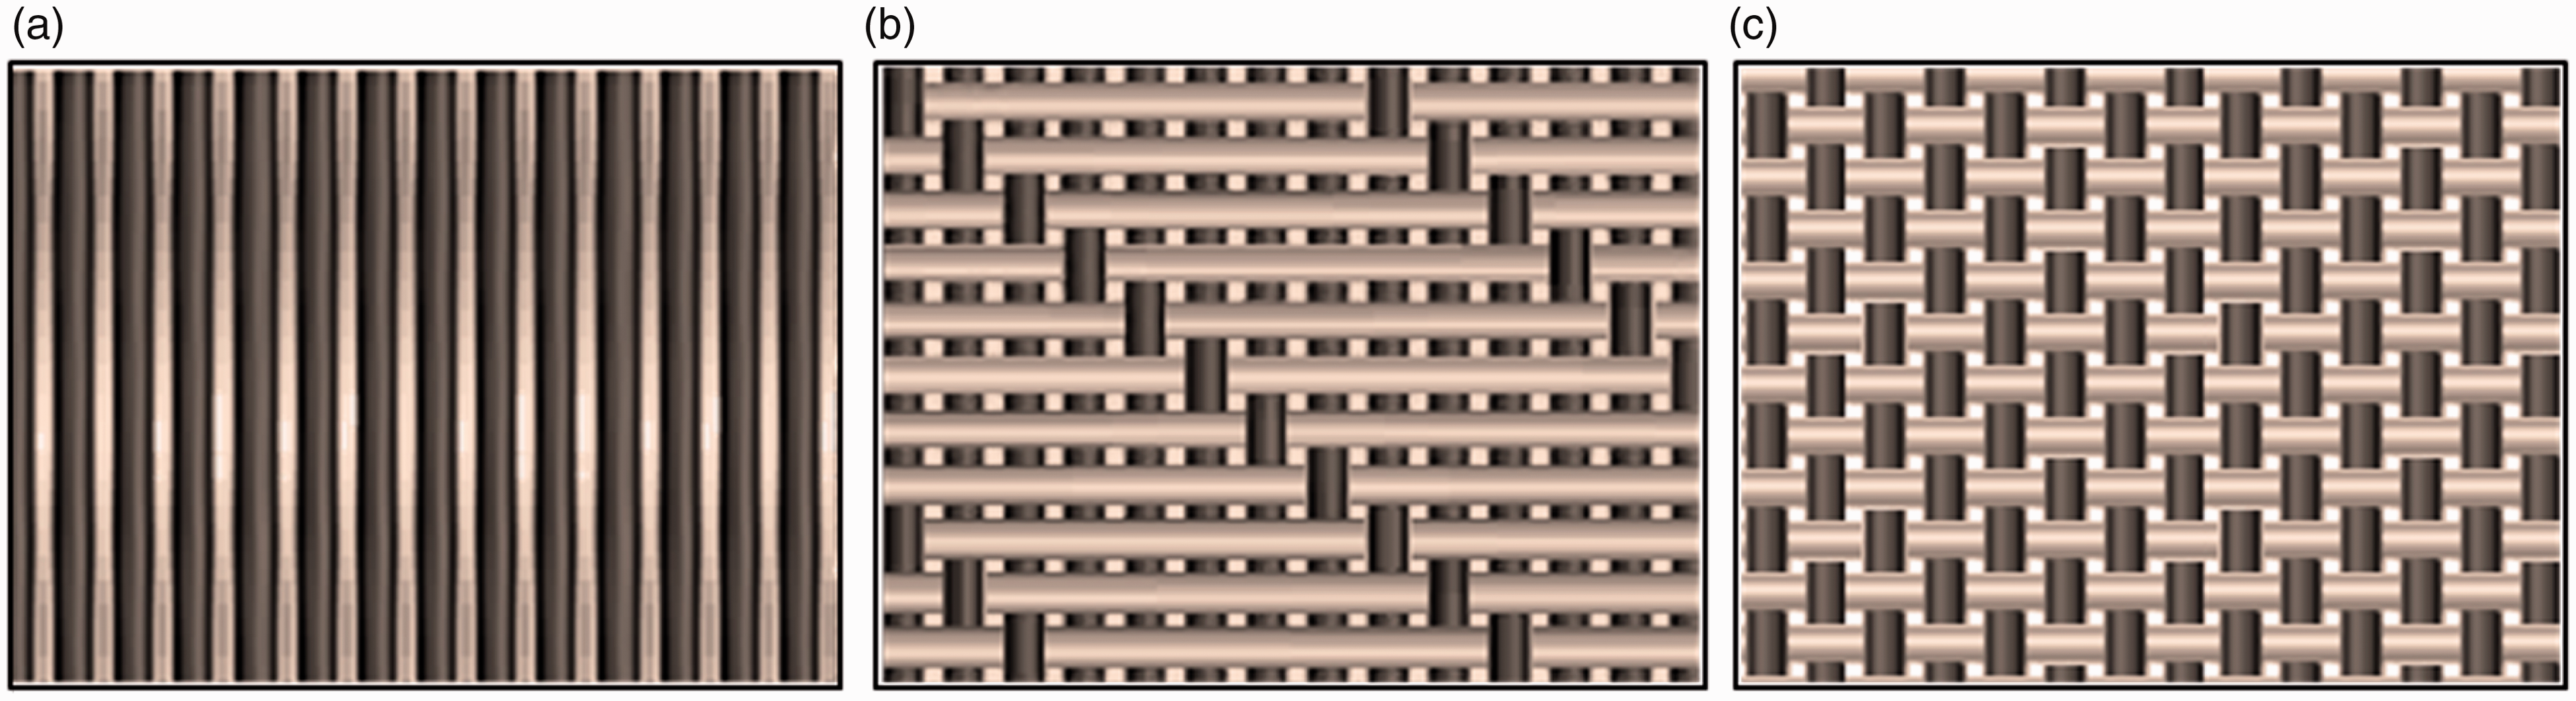
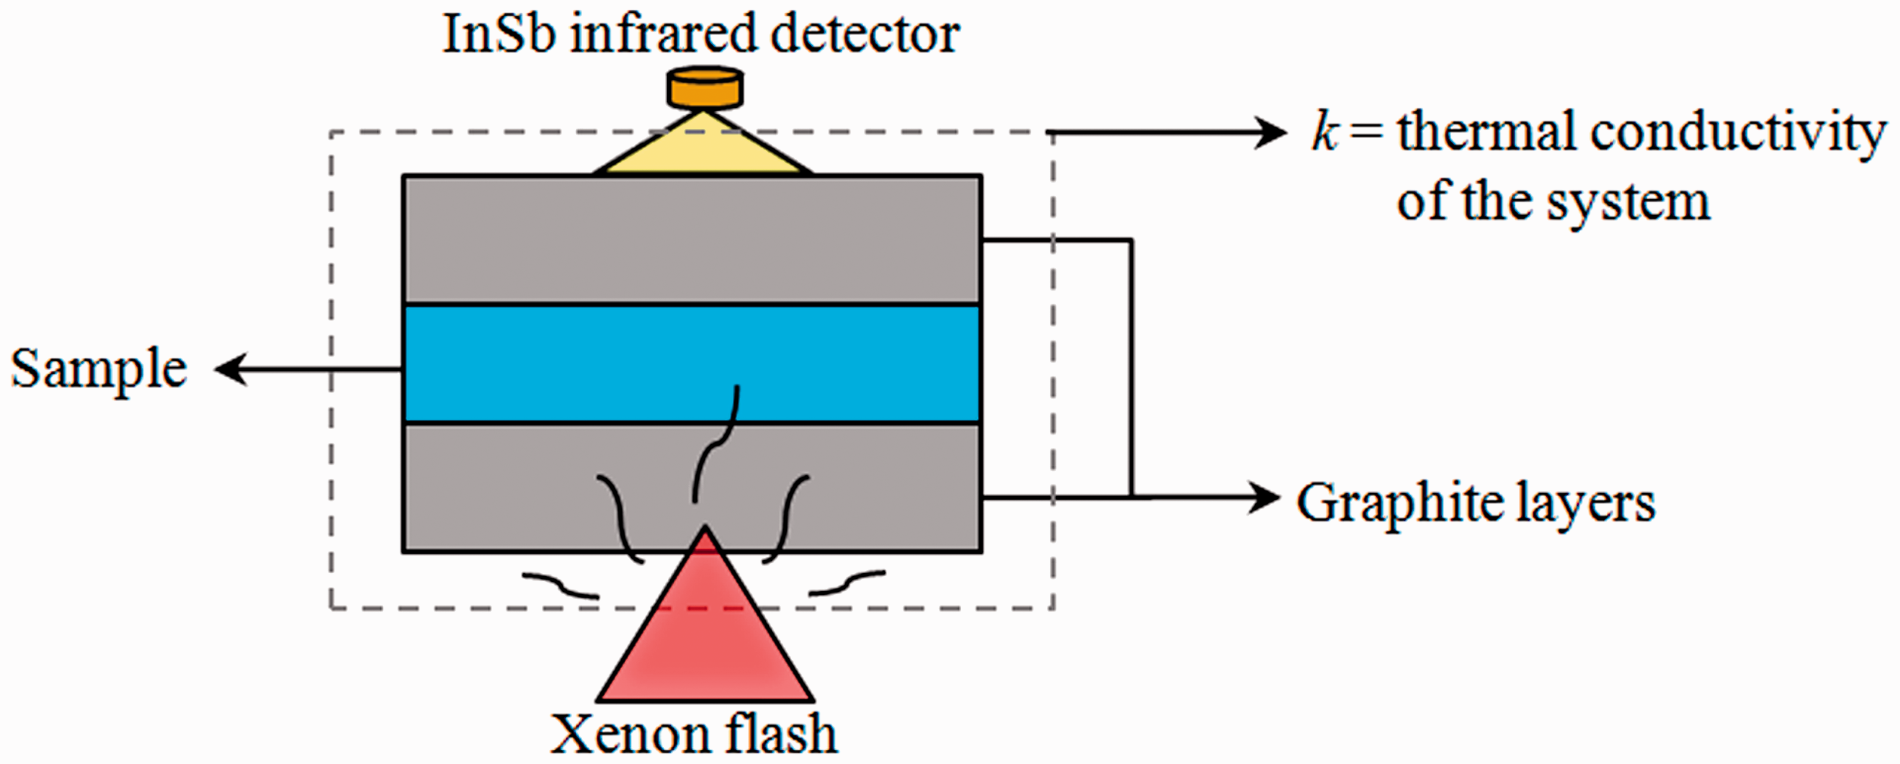
The thermal properties were measured utilizing a light flash analyzer (LFA, 447 NanoFlash by Netzsch) where the ASTM E1461 was used as a reference. This analyzer operated a xenon flash light that induced a pulse of energy on the bottom side of the sample (see Figure 3). Such pulse increased the sample temperature and an indium antimonide (InSb) infrared detector measured the response time to the pulse of energy on the top side of the sample. This response time was utilized to calculate thermal diffusivity. For instance, Parker/adiabatic method (ideal case) consists in calculating the thermal diffusivity as follows
11
Thermal conductivity setup for the release film.

Diffusivity measurement
Using the software LFA Analysis v. 4.8.5 (by Netzch), the post-processing of data acquired with the LFA consisted in calculating the thermal diffusivity by solving the Fourier equation for heat conduction in one dimension (z direction)
12

Density characterization
The variation in density with respect to temperature was calculated using the linear coefficient of thermal expansion (CTE) in the three principal directions. The density as a function of temperature 

Substituting equation (5) into equation (4)


The thermal strain 
As well, 
The following relations of 

Hence, the mathematical model utilized to calculate 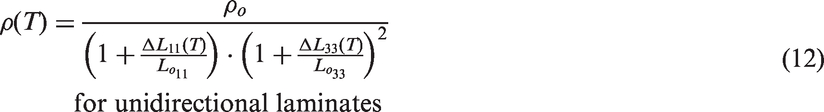
The thermal strain 
Cp calculation
Using the software LFA Analysis v. 4.8.5, specific heat (Cp) was calculated by measuring the temperature change of samples and a reference material when subjected to the same pulse of energy as follows


For Cps calculation, the correction factor was normalized with respect to the dimensional change in d11. This is due to tests were conducted using samples oriented in the fiber direction since lower experimental error was expected in the directions of higher thermal conductivity of the sample. In order to assess for the accuracy of Cp characterization by LFA, results were compared with those obtained using a differential scanning calorimeter (DSC, Q2000 by TA instruments) where samples of approximately 15 mg were utilized in Tzero aluminum encapsulated pans.
Thermal conductivity of TFE release film
Thermal conductivity of TFE was calculated using a gravimetric approach. Since samples were highly transparent, a layer of graphite was deposited on the release film as illustrated in Figure 3. However, graphite layer affected the characterization of thermal properties because it increased up to 20% the sample mass. For this reason, five samples were fabricated with different amounts of graphite (between 0.96 and 5.6 mg) and the thermal conductivity of TFE was estimated by extrapolation.
Results
Density and thermo mechanic characterization
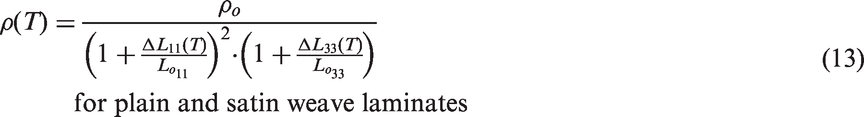
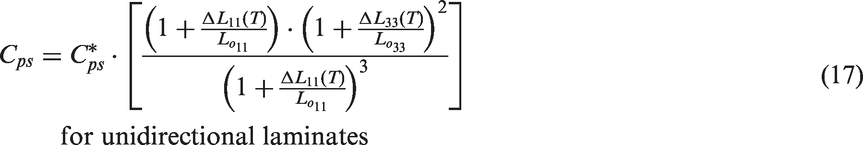
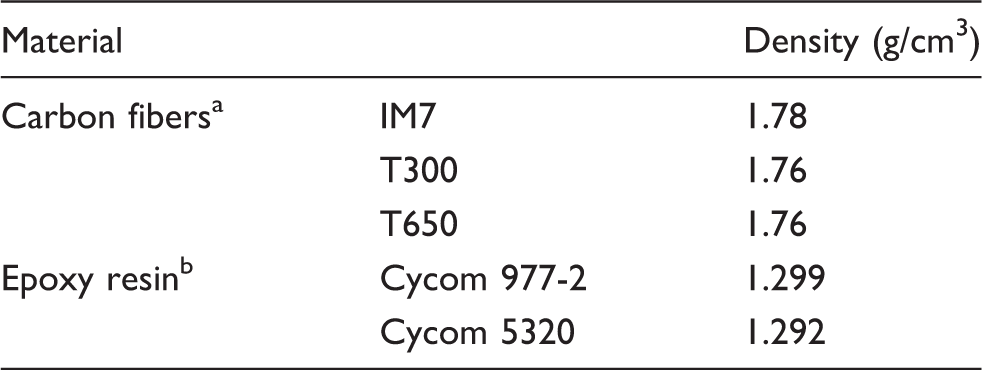
Density was measured at room temperature (see Figure 4) for the materials mentioned in Table 1 to obtain the term ρo of equations (12) and (13). These experiments indicated that different weave configurations affected the composite density because samples made of woven fabrics (PW and 8HS) showed lower values than those measured in UD samples. Since the density of epoxy resins was ∼27% lower than that of carbon fibers (see Table 2), these findings implied that samples with higher density would contain a larger amount of fibers—i.e. higher fiber Vf. Therefore, results indicated that fiber configuration influenced both density and Vf of the different materials tested. These findings agreed with the literature where it was found that Vf for UD composites
10
was higher (Vf = 50–70%) than that for woven fabrics (Vf = 35–55%).16,17
Density of composite materials at room temperature (23℃). Density of epoxy resin and carbon fibers. Obtained from the Technical Fibers Handbook: Reinforcement for Composites, by Hexcel Corp. Measured after disolving, filtering, drying, and curing a prepreg exposed to acetone solvent.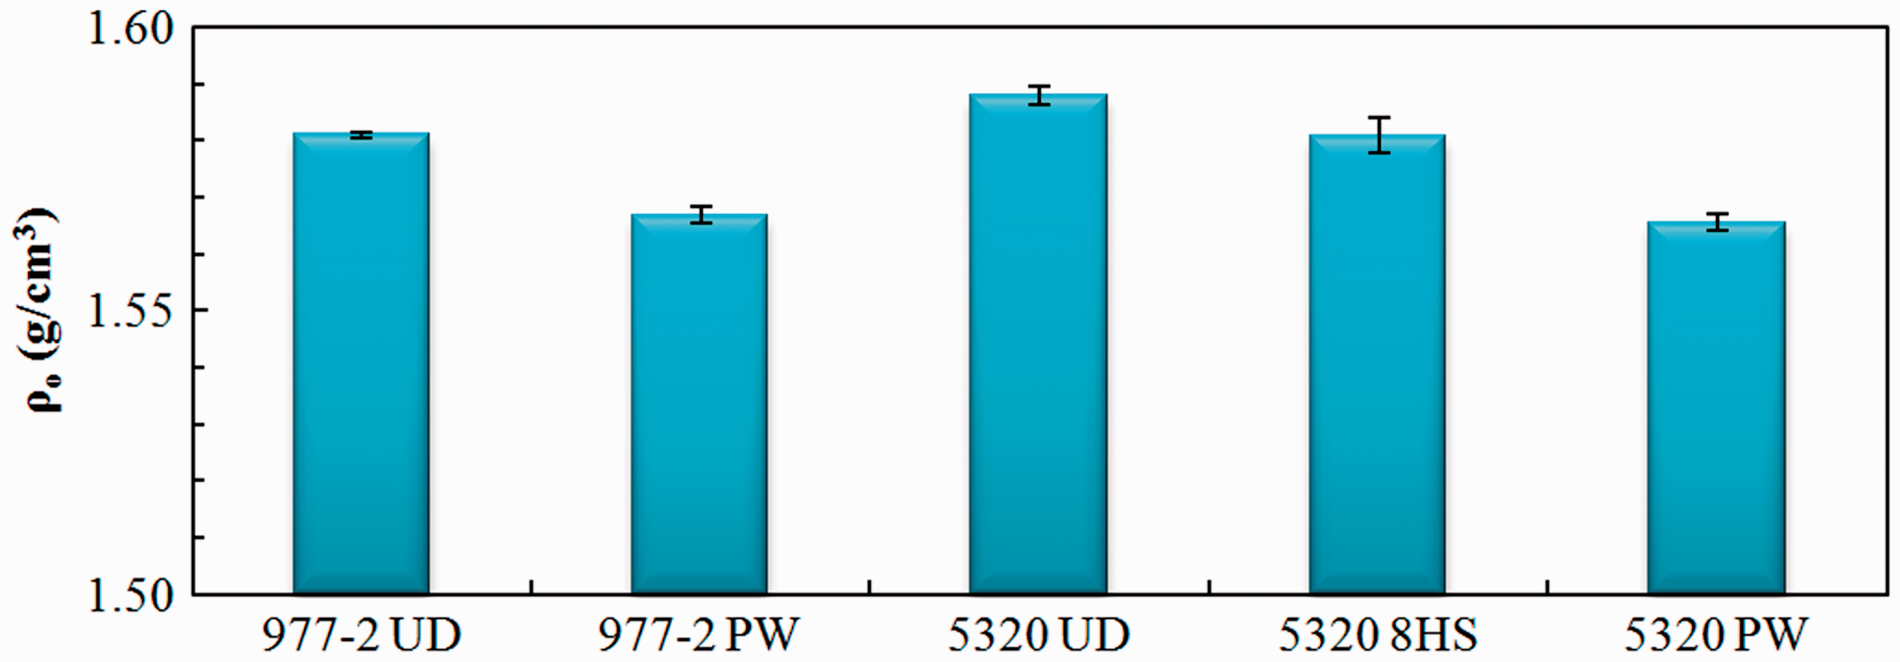
Once the density was characterized at room temperature, the next step was to measure the thermal expansion Thermal expansion ΔL(T)/Lo of composite materials measured by TMA. (a) Thermal expansion in fiber direction (d11) and through-the-thickness (d33). (b) Detail view of thermal expansion in the fiber direction (d11).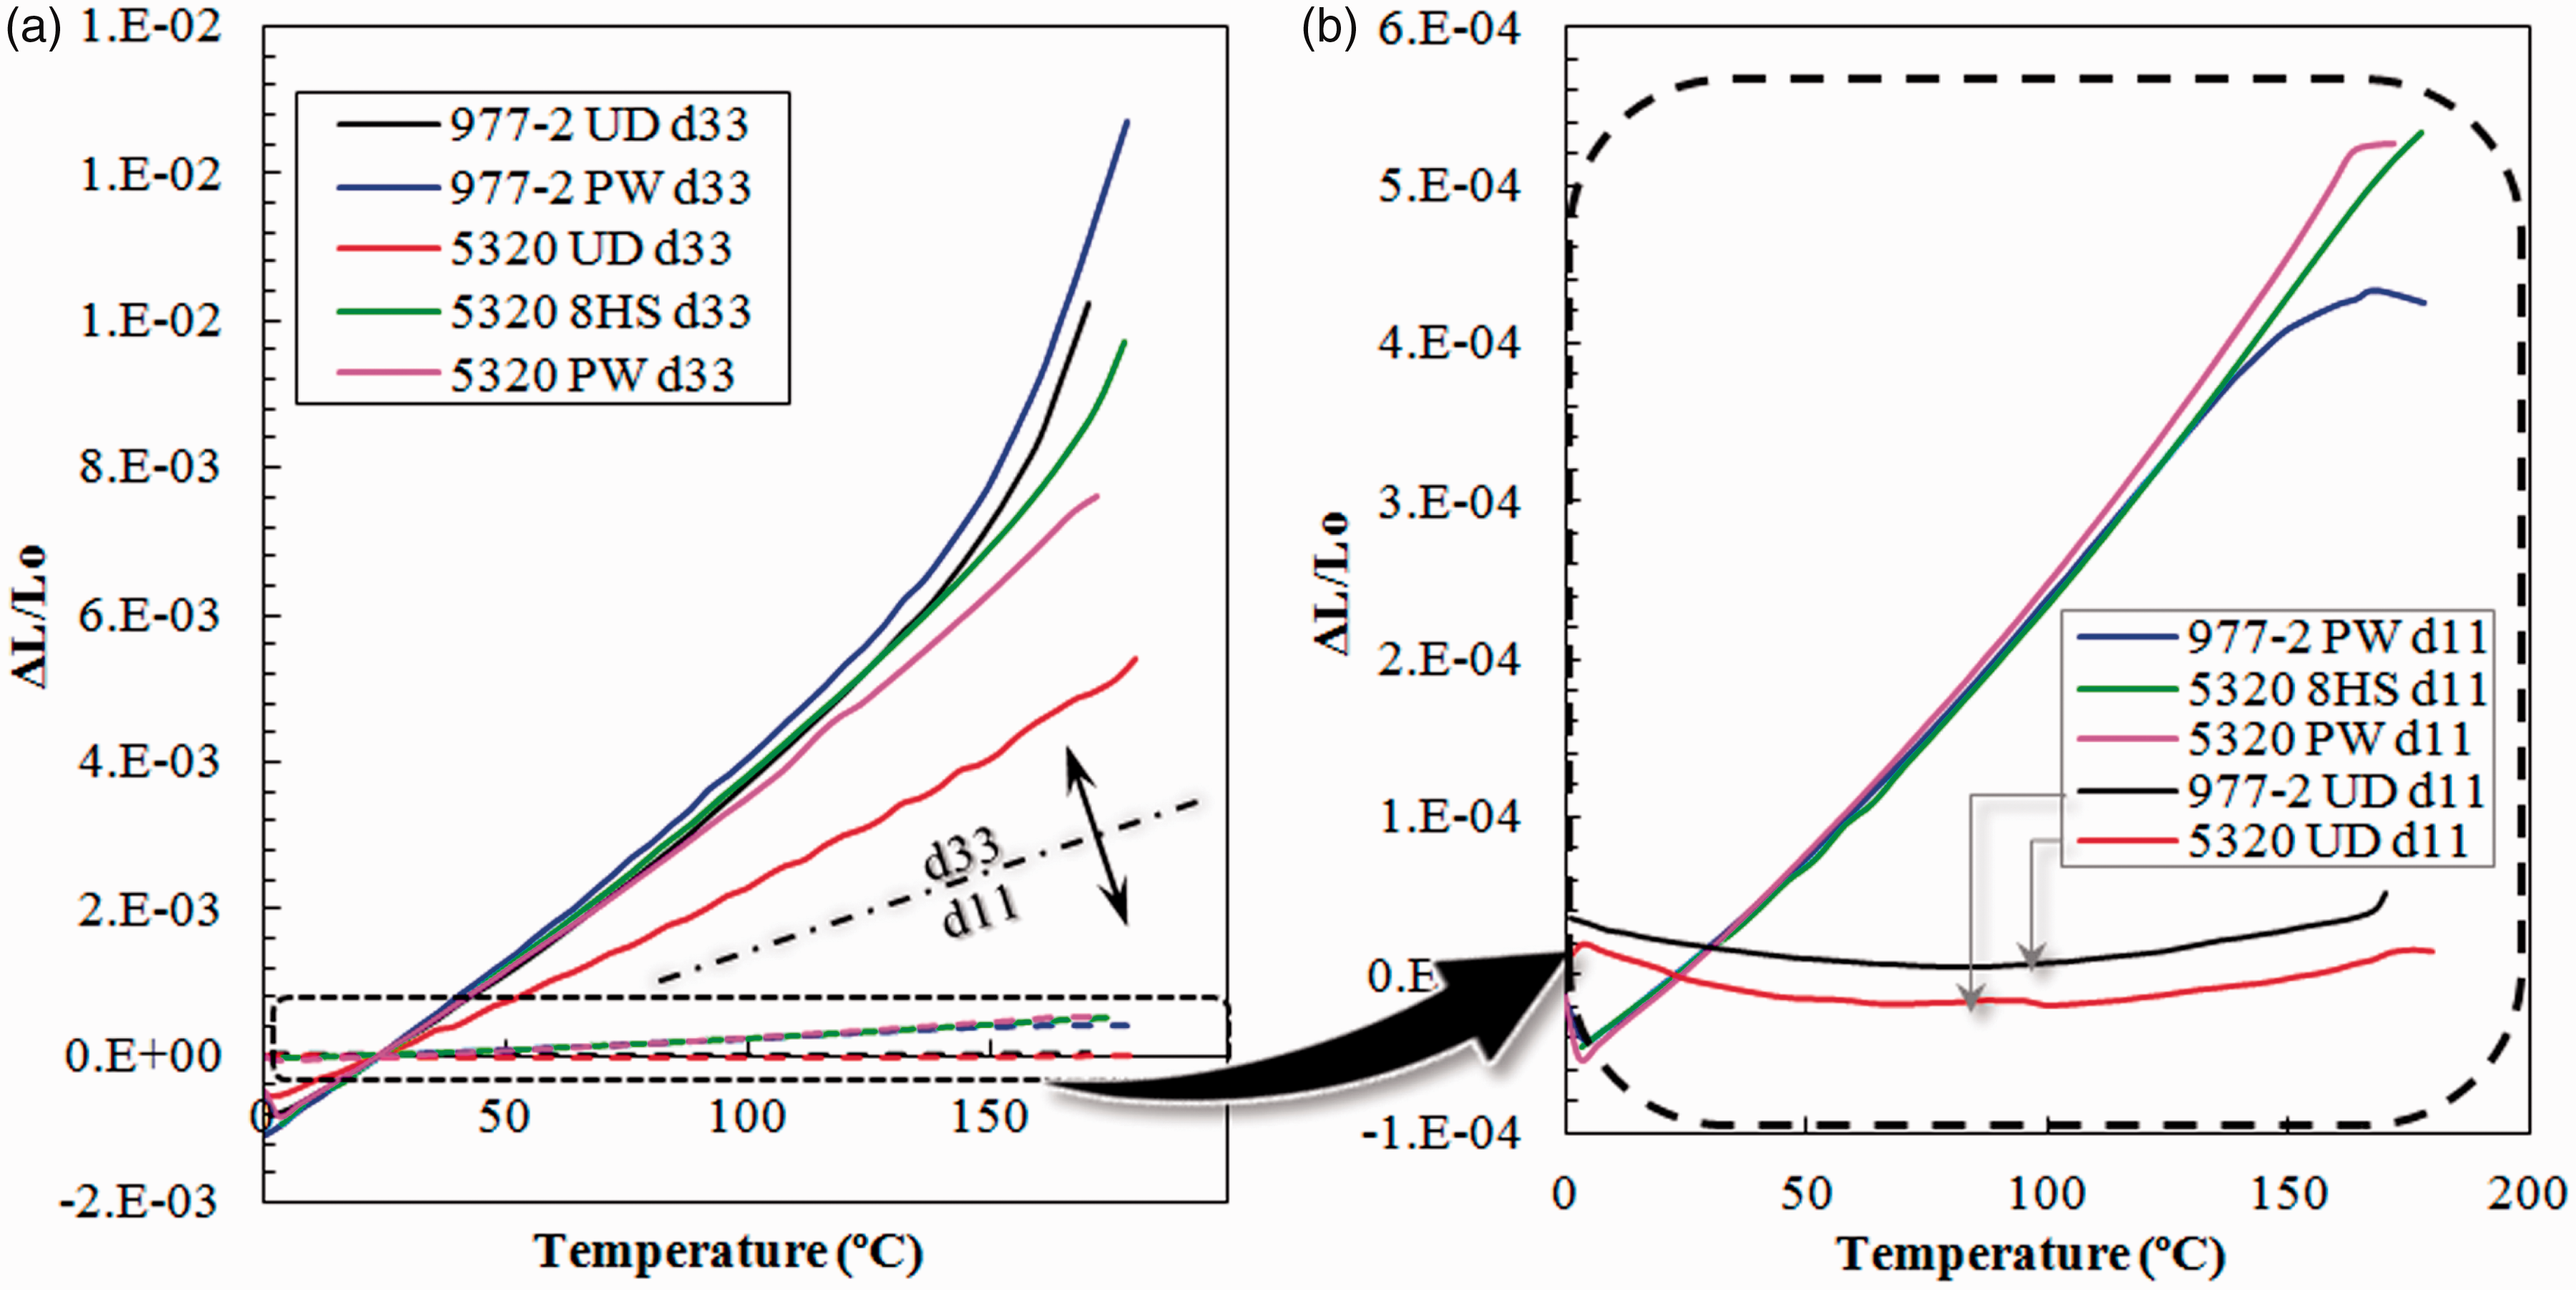
Figure 5(a) also indicates that thermal expansion in d11 was considerably lower than d33, which agreed with results reported in the literature. 18 Results of samples tested in d11 are portrayed in Figure 5(b), in which the curves are shown as grouped according to the sample fiber configuration. Woven fabrics depicted a positive thermal expansion whereas UD tapes indicated a slightly negative expansion. Note that curves of PW and 8HS samples were overlapped regardless of the resin formulation. Therefore, these findings indicated that in d11, the thermal expansion of carbon fibers prevailed over that of epoxy matrix.
Specific heat (Cp)
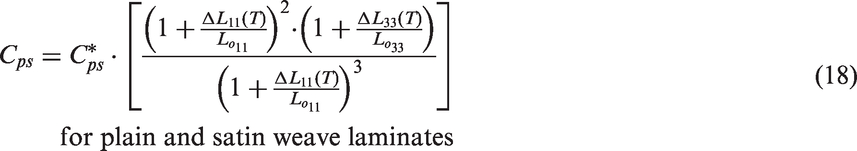
Results obtained from thermal expansion tests and ρo (see the previous subsection) were organized in a spreadsheet that was later used to calculate Cp using equations (17) and (18). Thus, Cp was determined using the LFA method and results are portrayed in Figure 6(a). Then, findings were compared with those obtained by DSC analysis (Figure 6(b)). Overall, tests indicated that Cp curves were similar for all the CFRP samples and changed proportionally to temperature. For instance, Cp values at room temperature (20℃) were around 900 J/(kg·K) while those at 180℃ were ∼1300 J/(kg·K) regardless of the resin/fiber system tested. Furthermore, Cp increased linearly proportional to temperature for all the samples where the linear regression results (depicted in Table 3) indicated R2 values of 0.90 ± 0.09. Similarly, the regression parameters m and b were 2.66 ± 0.82 and 844 ± 84 respectively, thus indicating that Cp did not vary considerably when different resins, carbon fibers, and fabric configurations were tested.
Cp obtained as a function of temperature utilizing LFA (a) and DSC (b) methods. Coefficients corresponding to the linear regression of CP vs. temperature for results shown in Figure 6(a) and (b) (linear regression: y = mx + b). DSC: differential scanning calorimeter; LFA: light flash analysis; UD: unidirectional; HS: harness satin; PW: plain weave.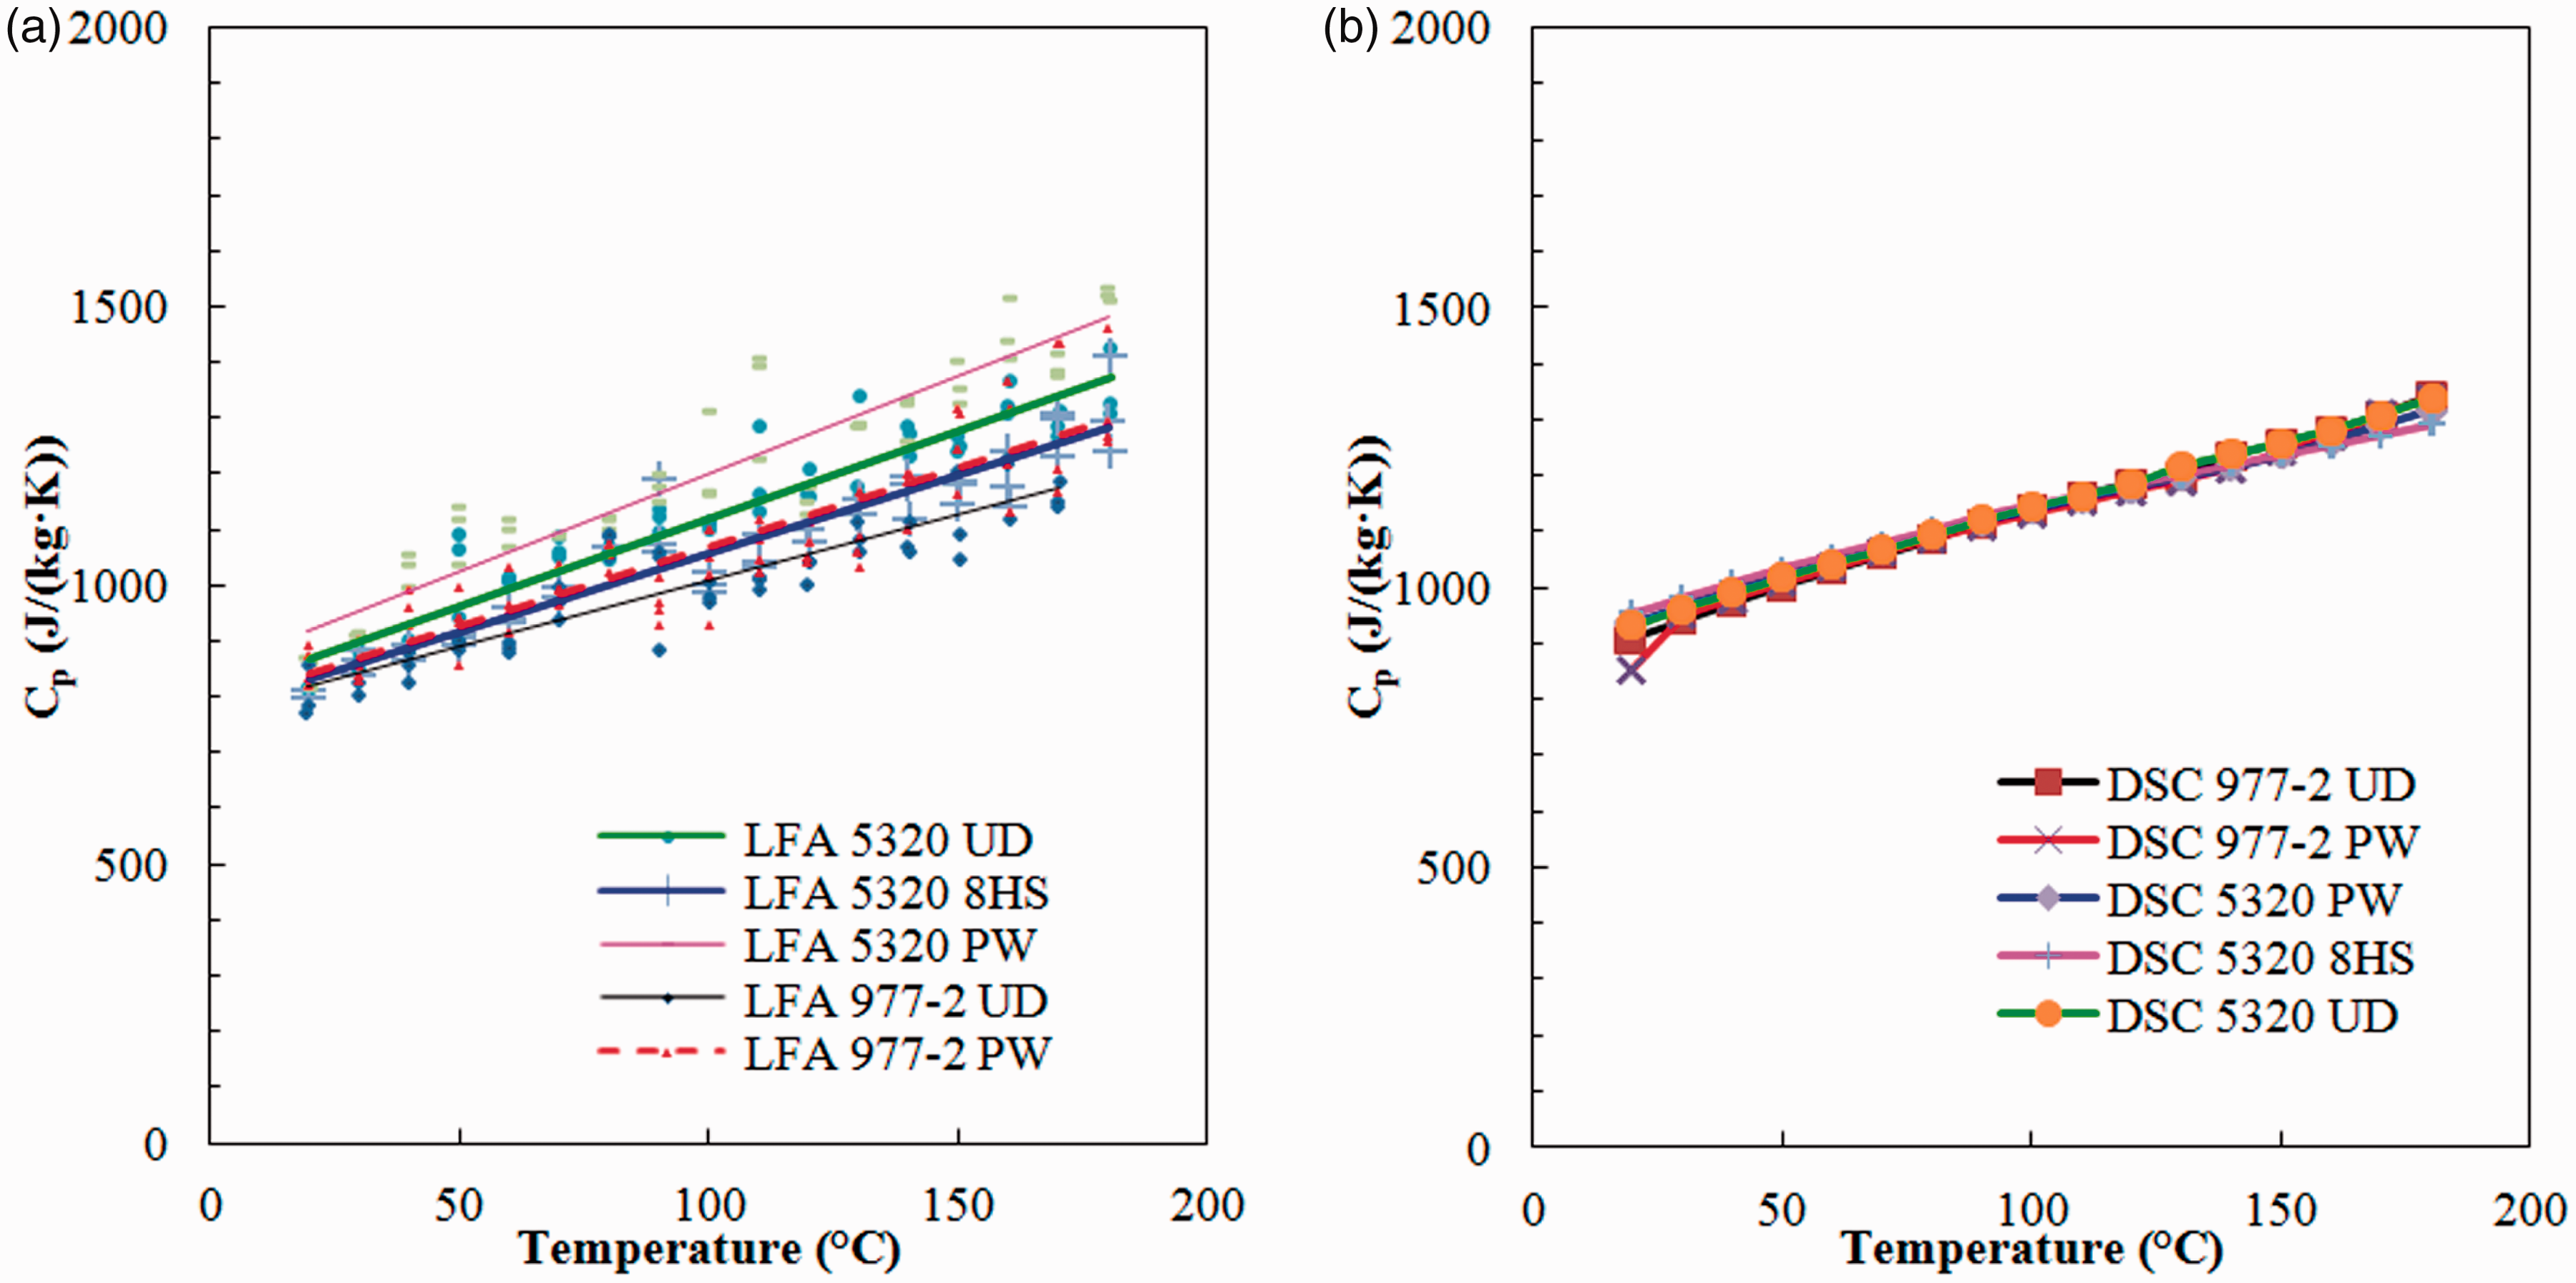
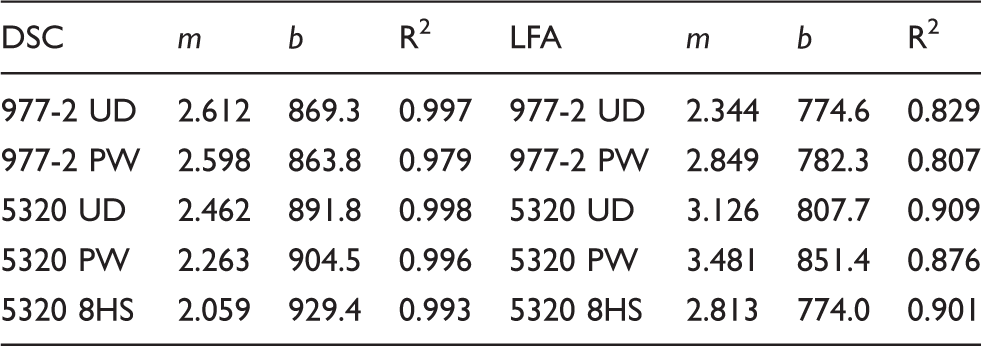
Figure 6 indicates that the results obtained by LFA had a higher dispersion than those measured with DSC. Moreover, the R2 values (Table 3) for DSC linear trends varied between 0.98 and 0.99, while those obtained for LFA between 0.81 and 0.90. Thus, these values implied lower experimental noise for DSC results. Nevertheless, the main advantage of using LFA method was the testing time because each Cp measurement performed by DSC took around 30 min, while the same test in LFA could take ∼2 min. Based on these results, it is recommended using DSC method when higher data accuracy is required, while LFA may be used when several samples are being tested or when testing time is an issue.
Thermal diffusivity model
Thermal diffusivity of CFRP samples was calculated using the computational models of the software Proteus LFA Analysis v. 4.8.5 (by Netzch), which included adiabatic/Parker (ideal case),
11
heat loss correction/Cowan,
13
and Cape-Lehman
15
model. The radiation-diathermic/Mehling et al. model
14
was also included in the software, but an analysis of the theory for this approach indicated that it should not be used for the materials utilized in this research. Mehling et al. model was developed for semi-transparent materials that showed a diathermic behavior such as the one depicted in Figure 7.
14
However, CFRP samples behaved as non-transparent materials (as shown in the figure) because a diathermic effect was not observed during testing. Hence, the Parker, Cowan, and Cape-Lehman models were subjected to a statistical analysis using Pareto diagrams in order to identify the model that showed the lowest standard deviation with respect to the time-temperature curve measured for the composite samples. Notice that the standard deviation was calculated with Proteus LFA software.
Time-temperature behavior for semi-transparent and non-transparent materials during LFA testing.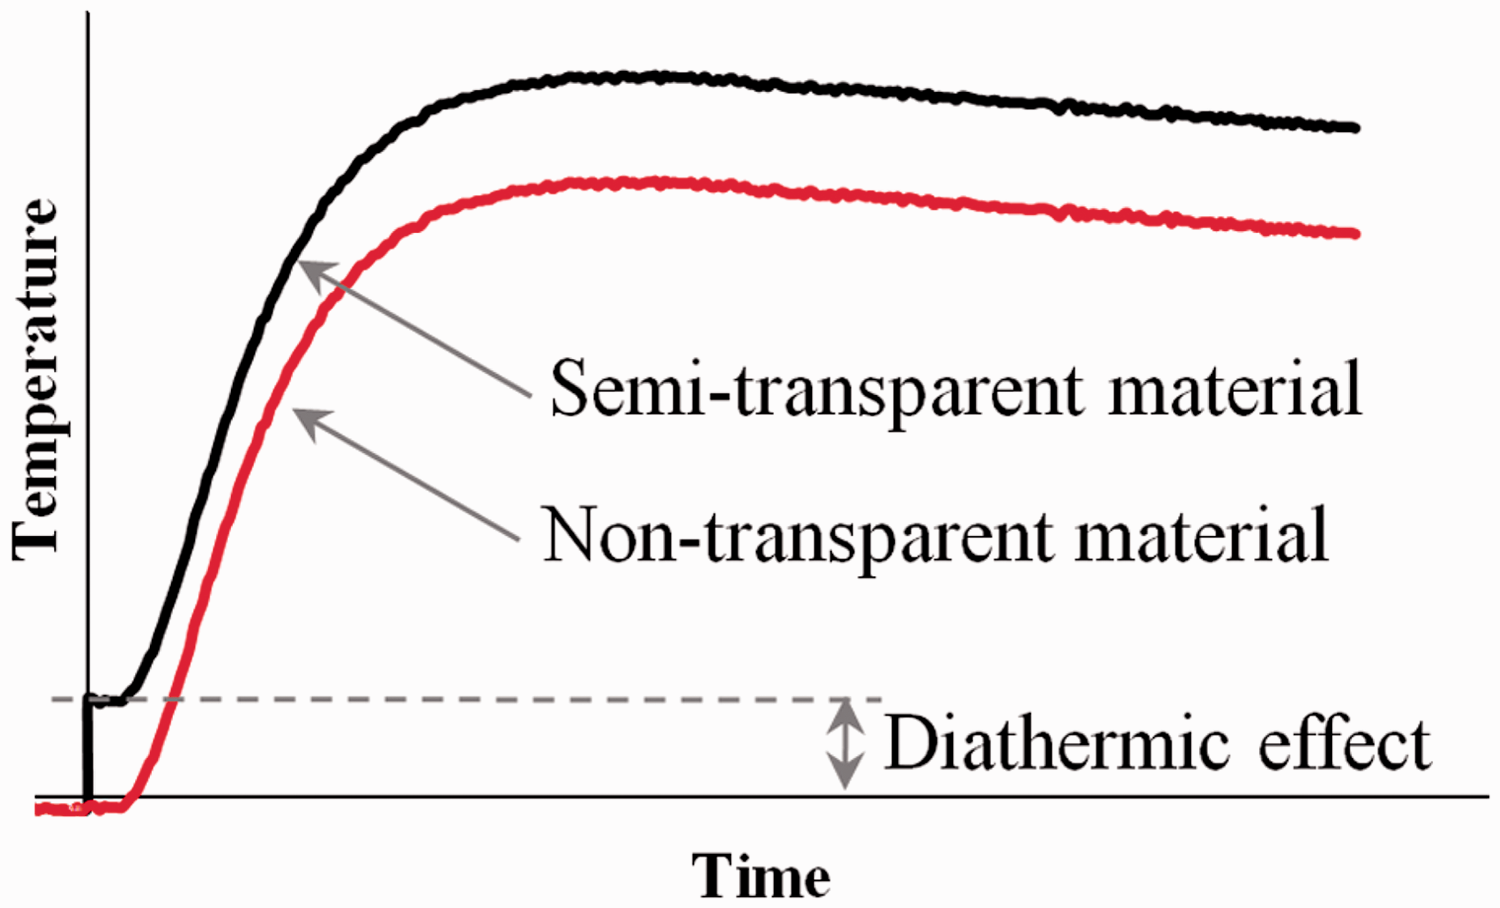
The relative frequency (number of occurrences divided by total number of samples) in which each model showed the lowest standard deviation was determined for each material using the Pareto diagrams shown in Figure 8. Results of Figure 8(a) indicate that Cape-Lehman model showed the lowest standard deviation of 95% for the 977-2 UD samples tested in d11 and 98% for the samples tested in d33. A similar trend was observed for all the materials as shown in Figure 8(b) to (d), except for samples made of 5320 PW in d11 (Figure 8(e)) where Cowan model was the best fitting model. Therefore, Cape-Lehman was the best fit for most of the cases evaluated. As such, all the measurements were recalculated using this model in order to determine thermal diffusivity.
Pareto analysis for the relative frequency where each model showed the lowest standard deviation for (a) 977-2 UD, (b) 977-2 PW, (c) 5320 UD, (d) 5320 8HS, and (e) 5320 PW.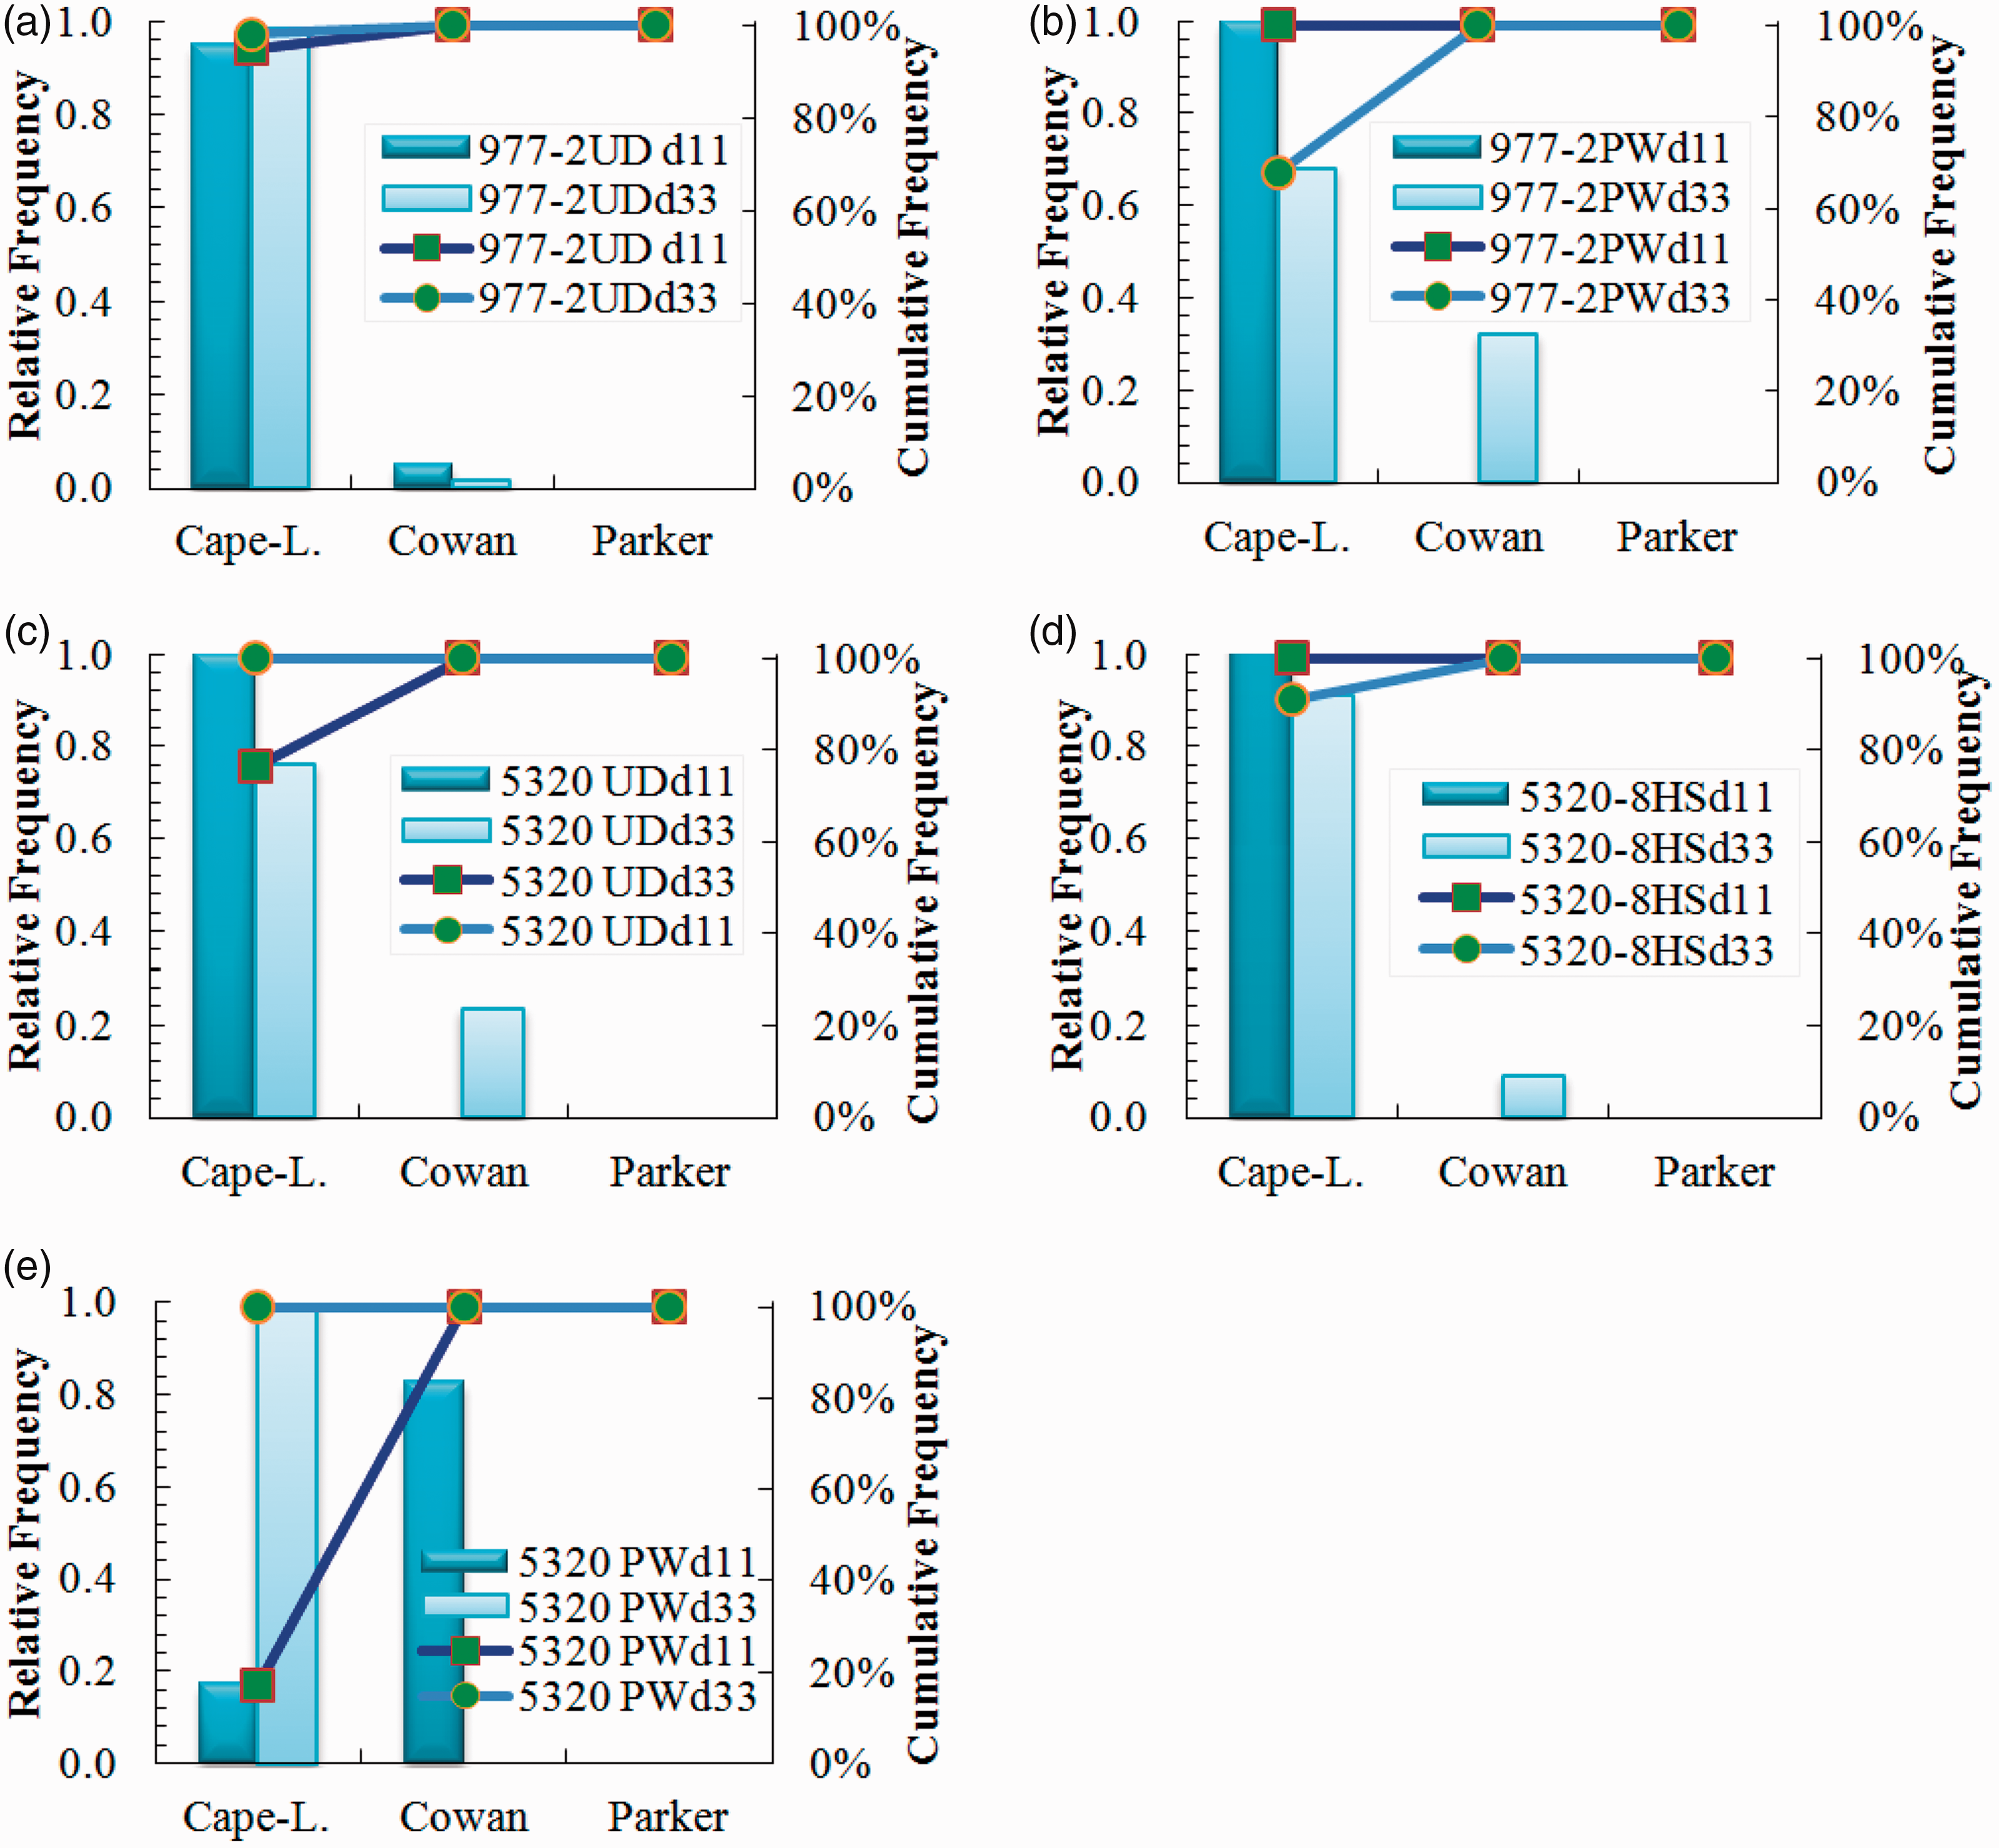
Note that the occurrence of Parker model was zero for all the materials where this model assumed a perfect scenario (adiabatic boundaries). This adiabatic scenario implies that the heat emitted by the flash lamp must be diffused throughout the sample and detected by the IR sensor as an increase in temperature with no loss through the edges. Nevertheless, Cape-Lehman and Cowan models included such heat loss terms to calculate thermal diffusivity.13,15 Hence, considerations included in Cape-Lehman and Cowan models could represent a closer approach to the real case scenario of the CFRP samples evaluated.
Thermal diffusivity and conductivity of CFRP
Thermal diffusivity of CFRP samples (Figure 9) was obtained using the Cape-Lehman model, and tests were performed between 20℃ and 180℃. Further, thermal conductivity (Figure 10) was calculated per equation (2) by multiplying density, Cp (by DSC method), and diffusivity. Results of Figures 9 and 10 indicated that both thermal diffusivity and conductivity were highly influenced by fiber configuration. Samples made of UD tapes depicted diffusivity and conductivity twice as high as those made of woven fabrics when tested in d11 (see Figures 9(a) and 10(a)). Moreover, 8HS samples showed higher diffusivity and conductivity than those made of PW fabrics when samples made of 5320 resin were tested. These findings implied that Vf of the samples might influence the thermal properties. This is due to samples made of UD fibers typically have lower resin content than those made of woven fabrics 8HS and PW, as previously mentioned in section “Density and thermo mechanic characterization”. Since the resin conductivity (0.17–0.79 W/(m·K))
2
was lower than that of carbon fibers (24.0 W/(m·K))
1
fabrics rich in resin might depict lower thermal conductivity. Note that the thermal conductivity values obtained in these tests agreed with literature since Sweeting and Liu
3
reported conductivity of 2–3 W/(m·K) in d11 for plain weaved CFRP and 0.5–0.6 W/(m·K) in d33, which matched those values obtained for 977-2 and 5320 PW.
Thermal diffusivity measured between 20℃ and 180℃ in (a) fiber direction (b) through-the-thickness direction. Thermal conductivity measured between 23℃ and 180℃ in (a) fiber direction (b) through-the-thickness direction.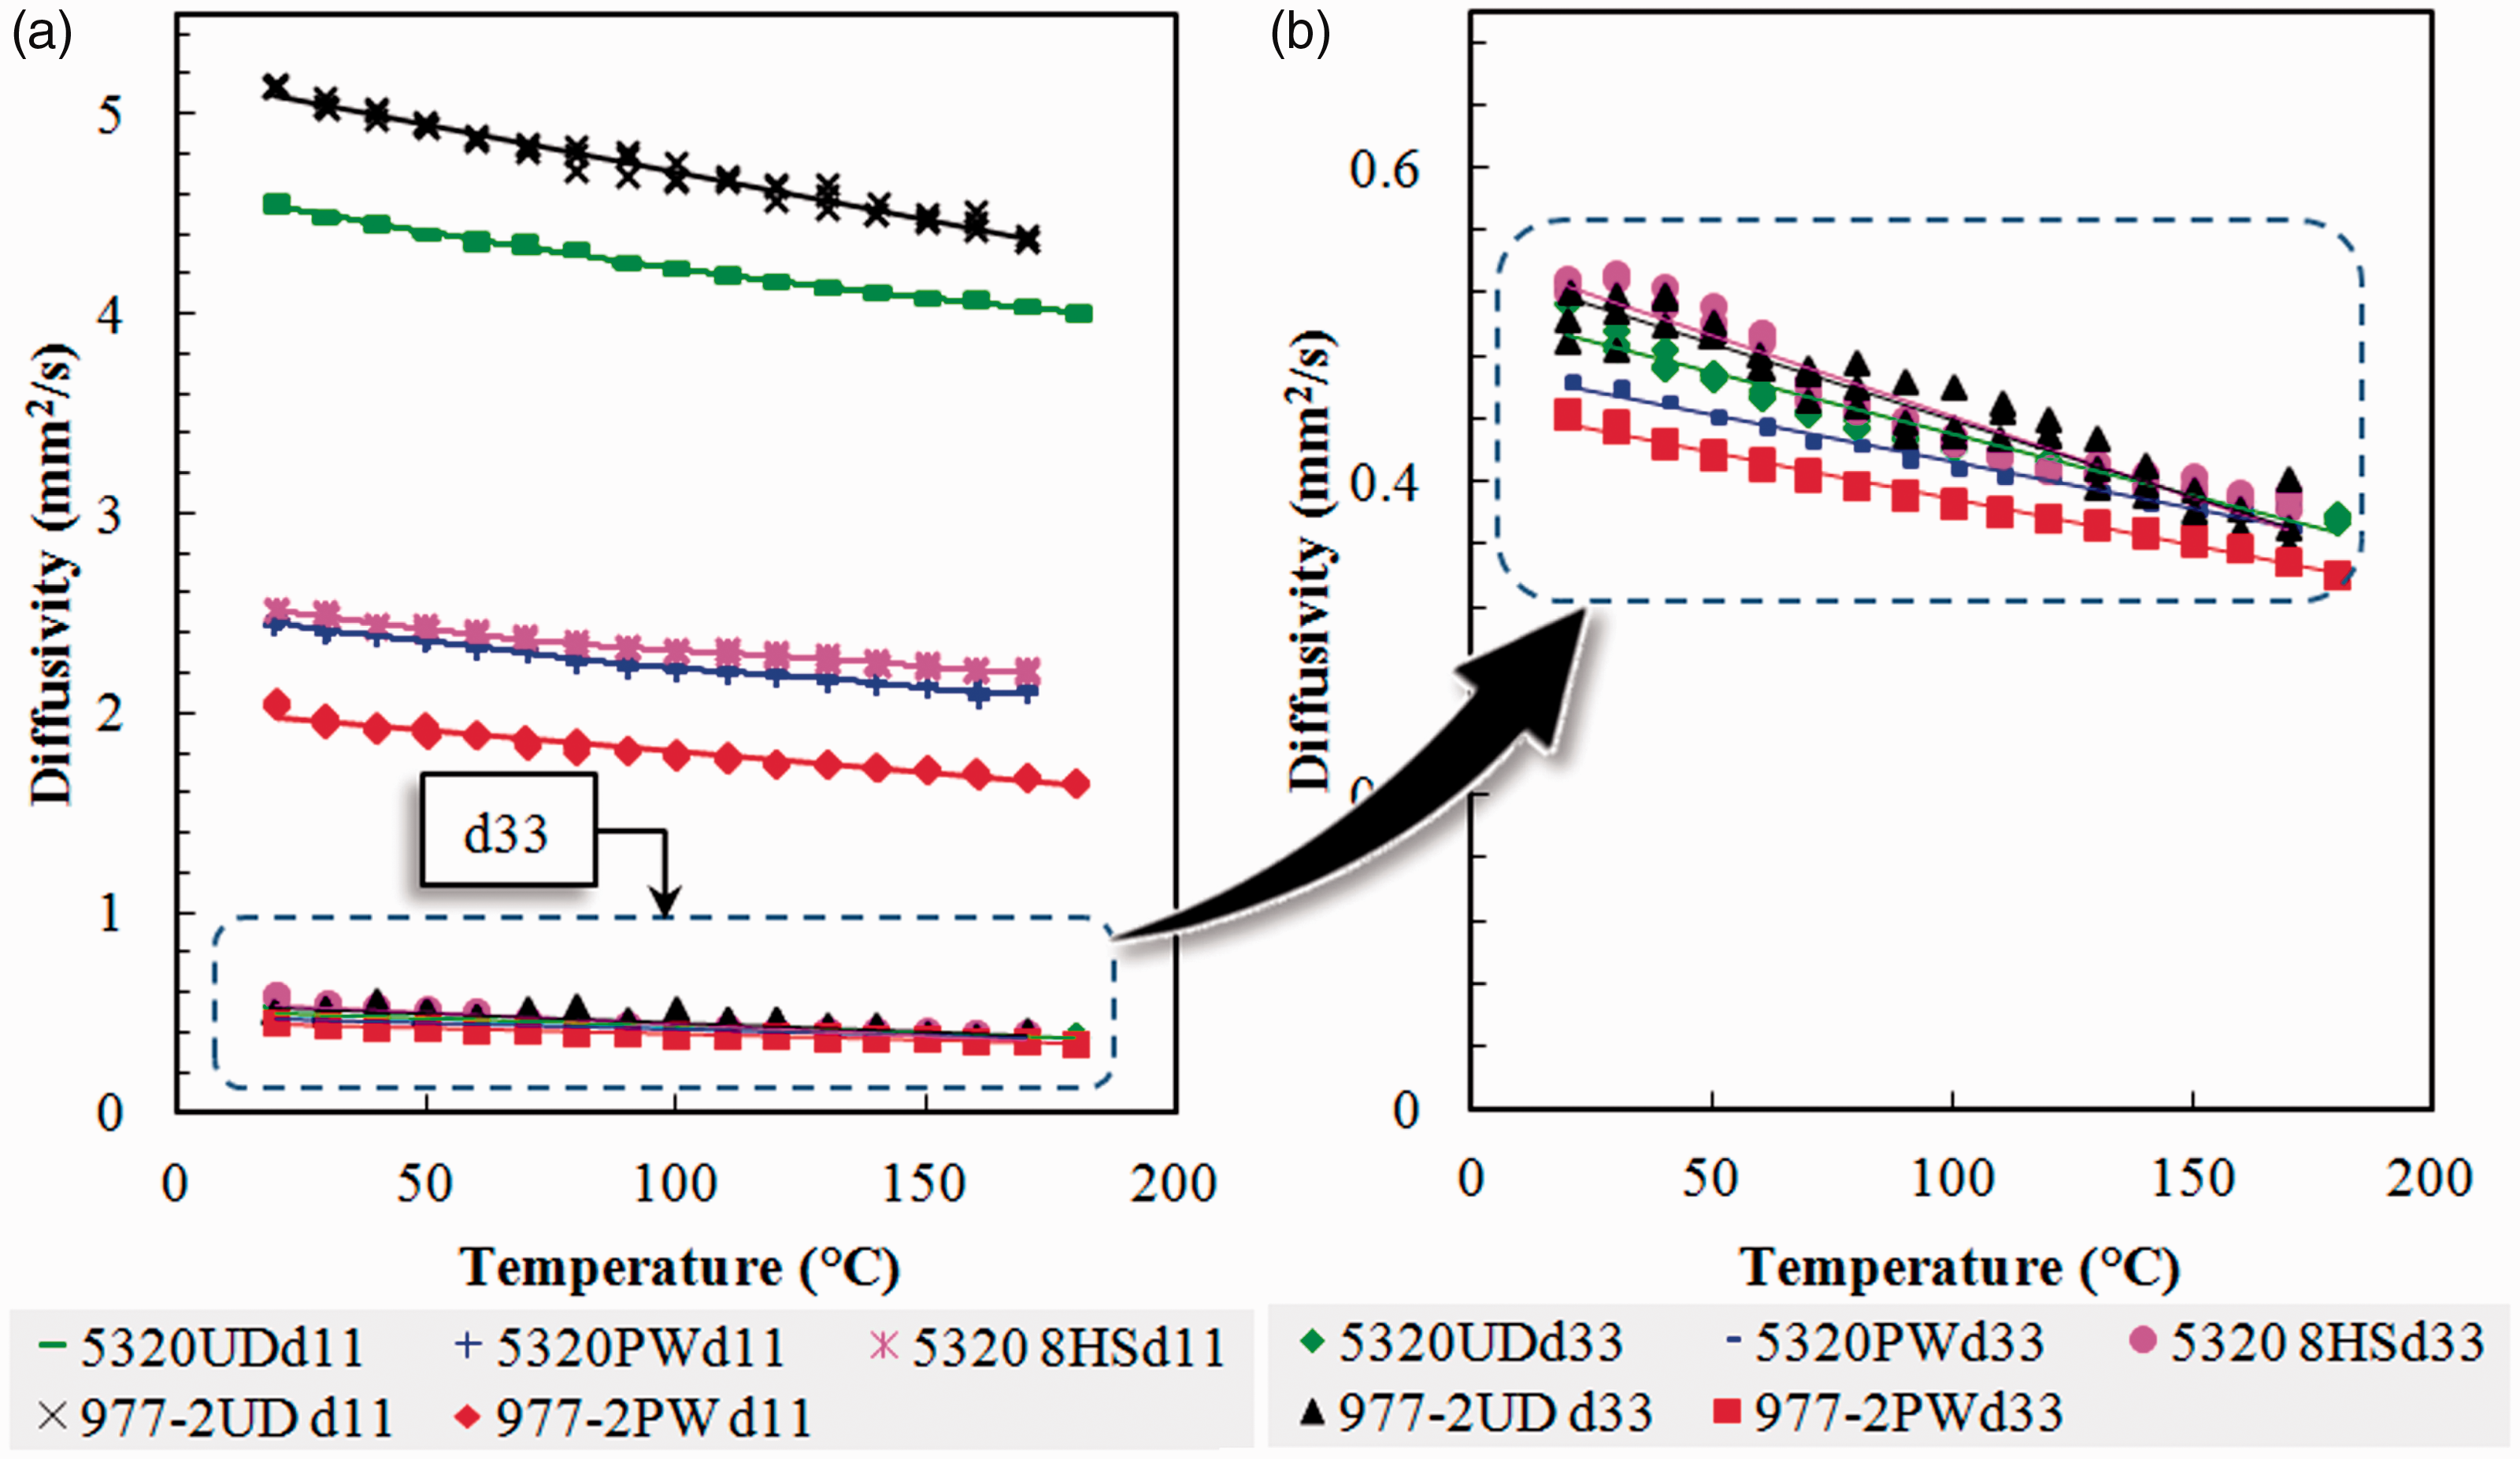
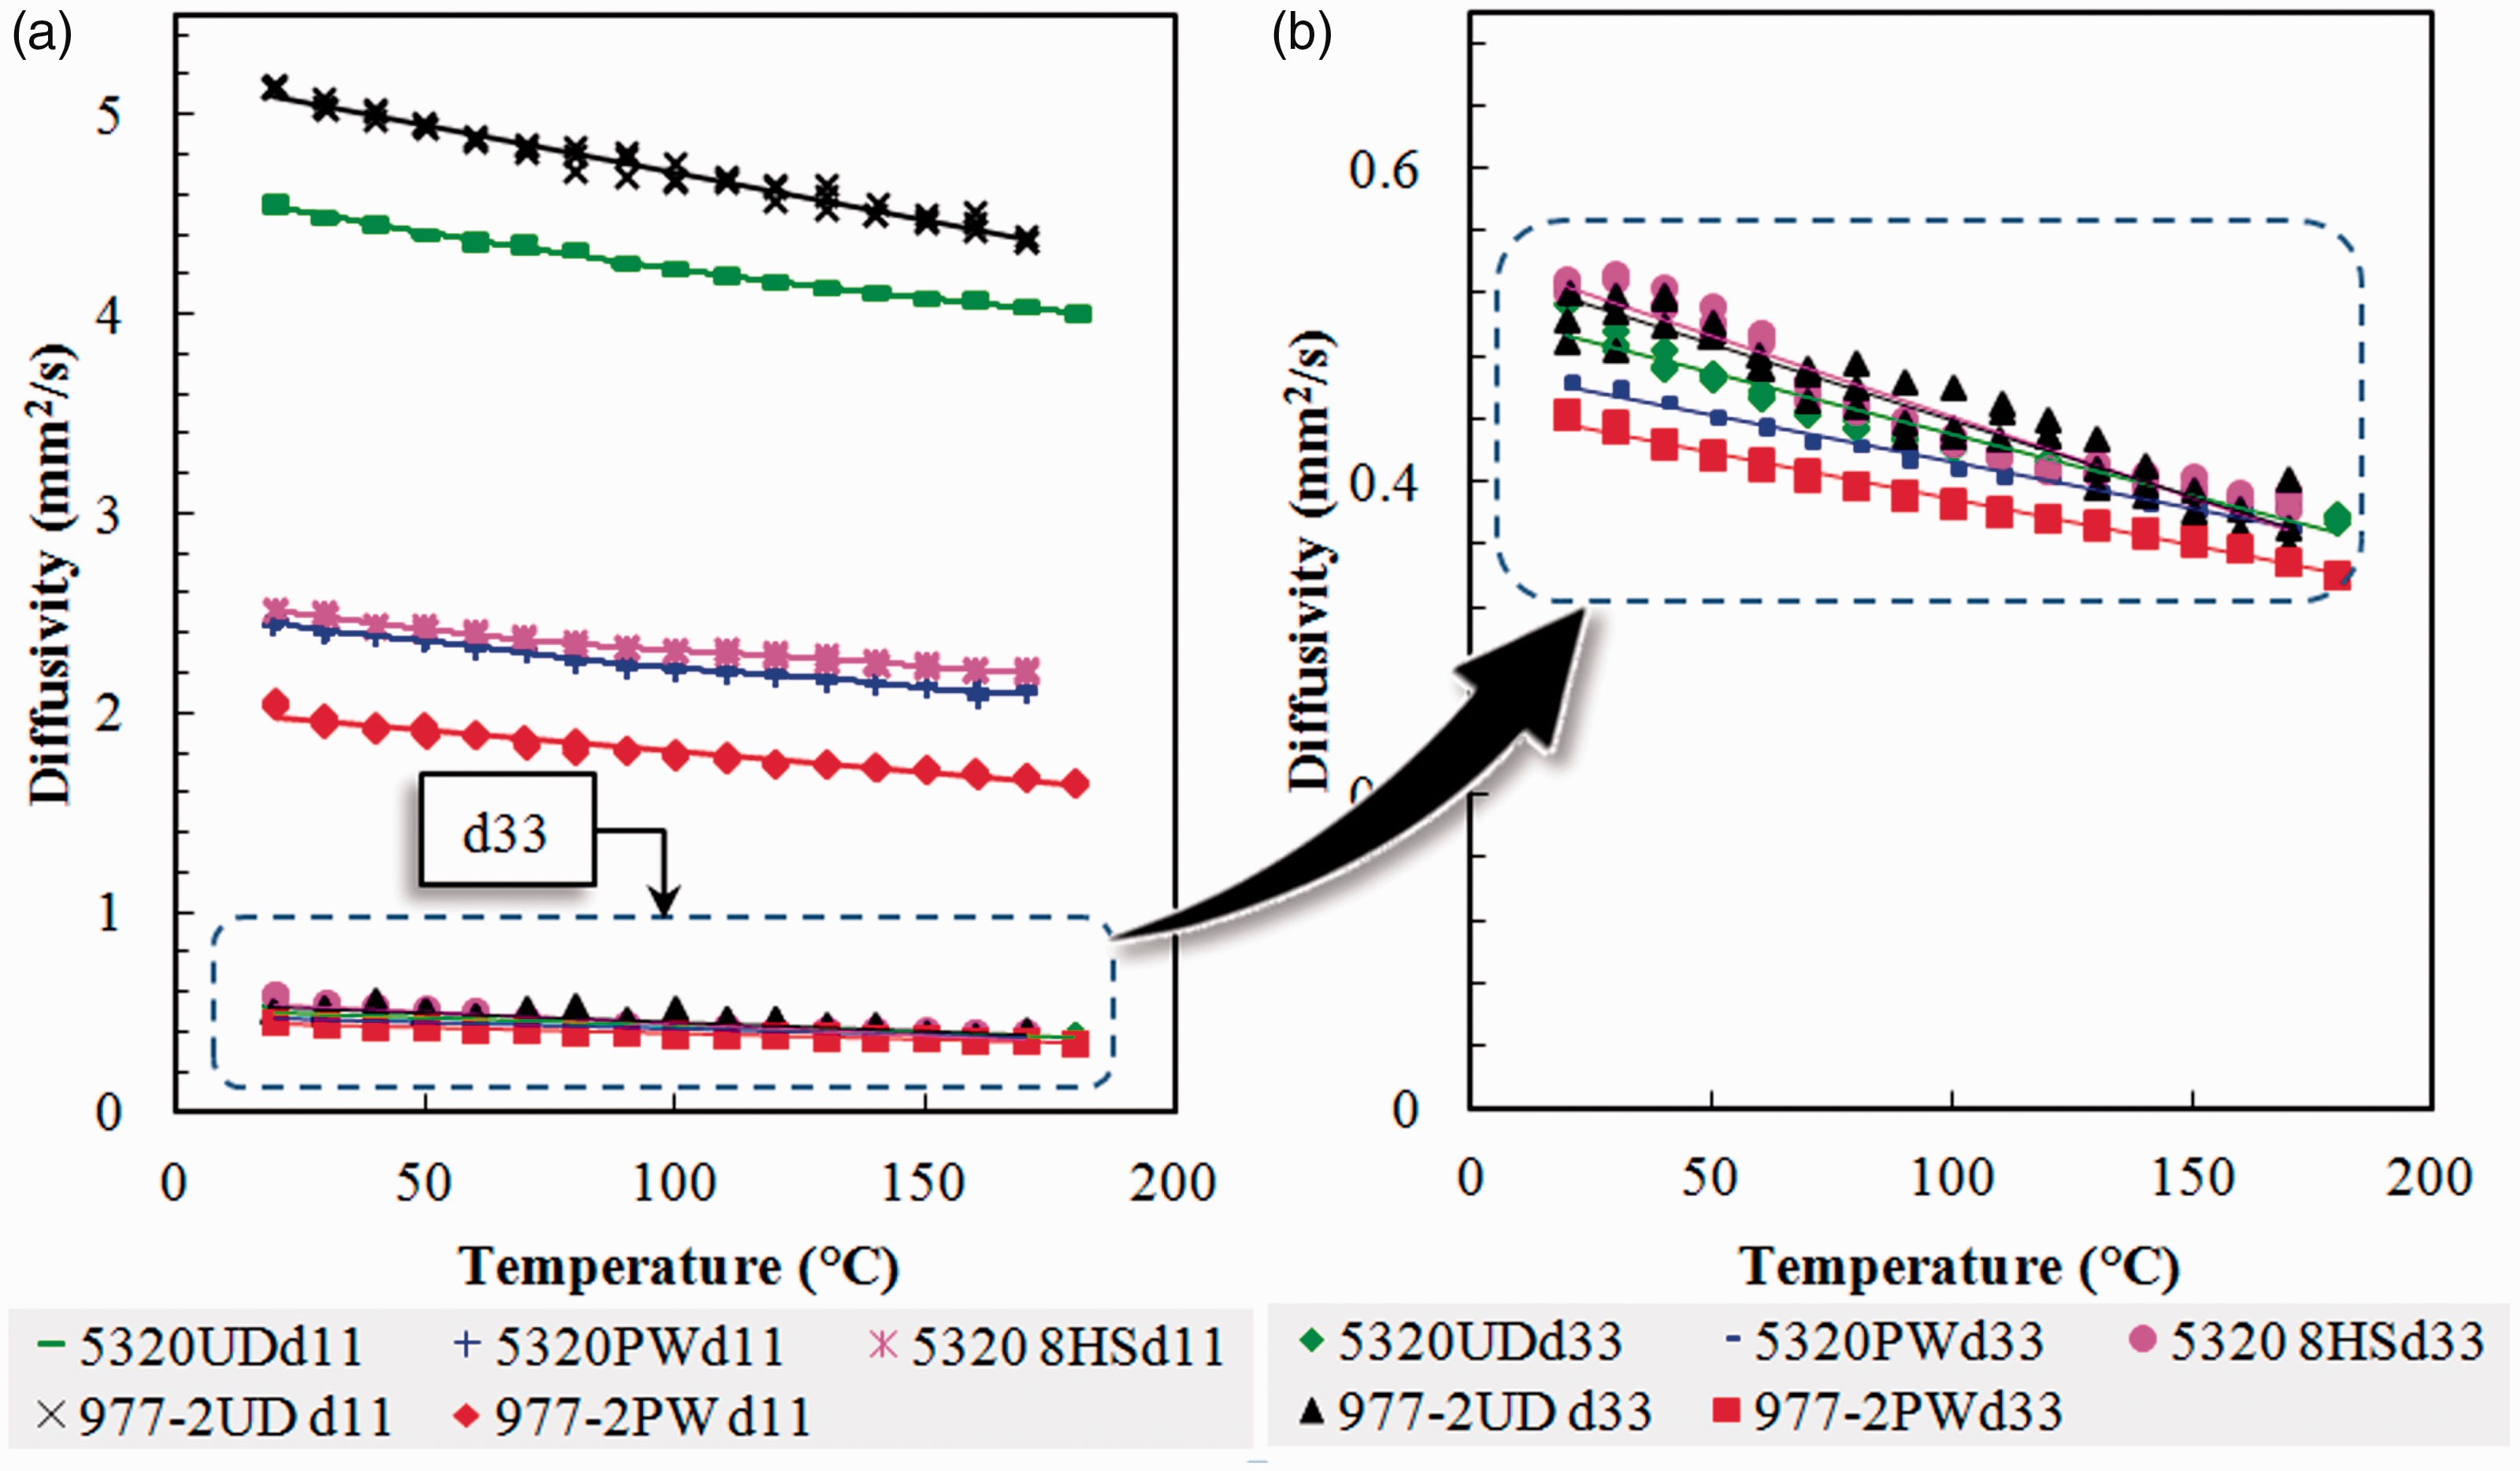
Additionally, Figures 9 and 10 show that the thermal diffusivity and conductivity in d33 were not strongly influenced by the fabric configuration. The results depicted typical values of thermal conductivity for epoxy resin, which implied that the thermal properties in through-the-thickness direction were governed mainly by the resin. Furthermore, samples did not show relevant differences regarding the thermal behavior of the two epoxy resin systems tested despite the fact that 977-2 was formulated for autoclave processing while 5320 was an out-of-autoclave resin.
Thermal conductivity of TFE release film
Thermal conductivity of a TFE release film was measured using a gravimetric method. A graphite coating was deposited on the top and bottom surfaces of the sample in order to reduce its transparency since the LFA testing requires that the sample absorb the energy emitted by the flash lamp to increase its temperature. However, this coating represented up to 20% of the sample total weight. Hence, samples with five different amounts of graphite were tested and the thermal conductivity was obtained by extrapolation.
Results, which are illustrated in Figure 11, showed a linear trend of thermal conductivity as a function of the graphite coating mass (R2 of 0.95). This trend line was extrapolated in order to determine what would be the thermal conductivity of the sample with no graphite. These findings indicated a conductivity value of 0.23–0.24 W/(m·K) of the TFE film which agreed with the theoretical values of fluoropolymers: 0.25 W/(m·K).
19
Additionally, these experiments were replicated at temperatures between 30 and 100℃ where results did not show a considerable variation in conductivity as a function of temperature. In addition, these values indicated that the release film had 50% lower thermal conductivity than the CFRP samples in d33. Therefore, TFE film could be an important factor of thermal lag at the tool-part interface during composites manufacturing.
Thermal conductivity of TFE film measured by gravimetric method.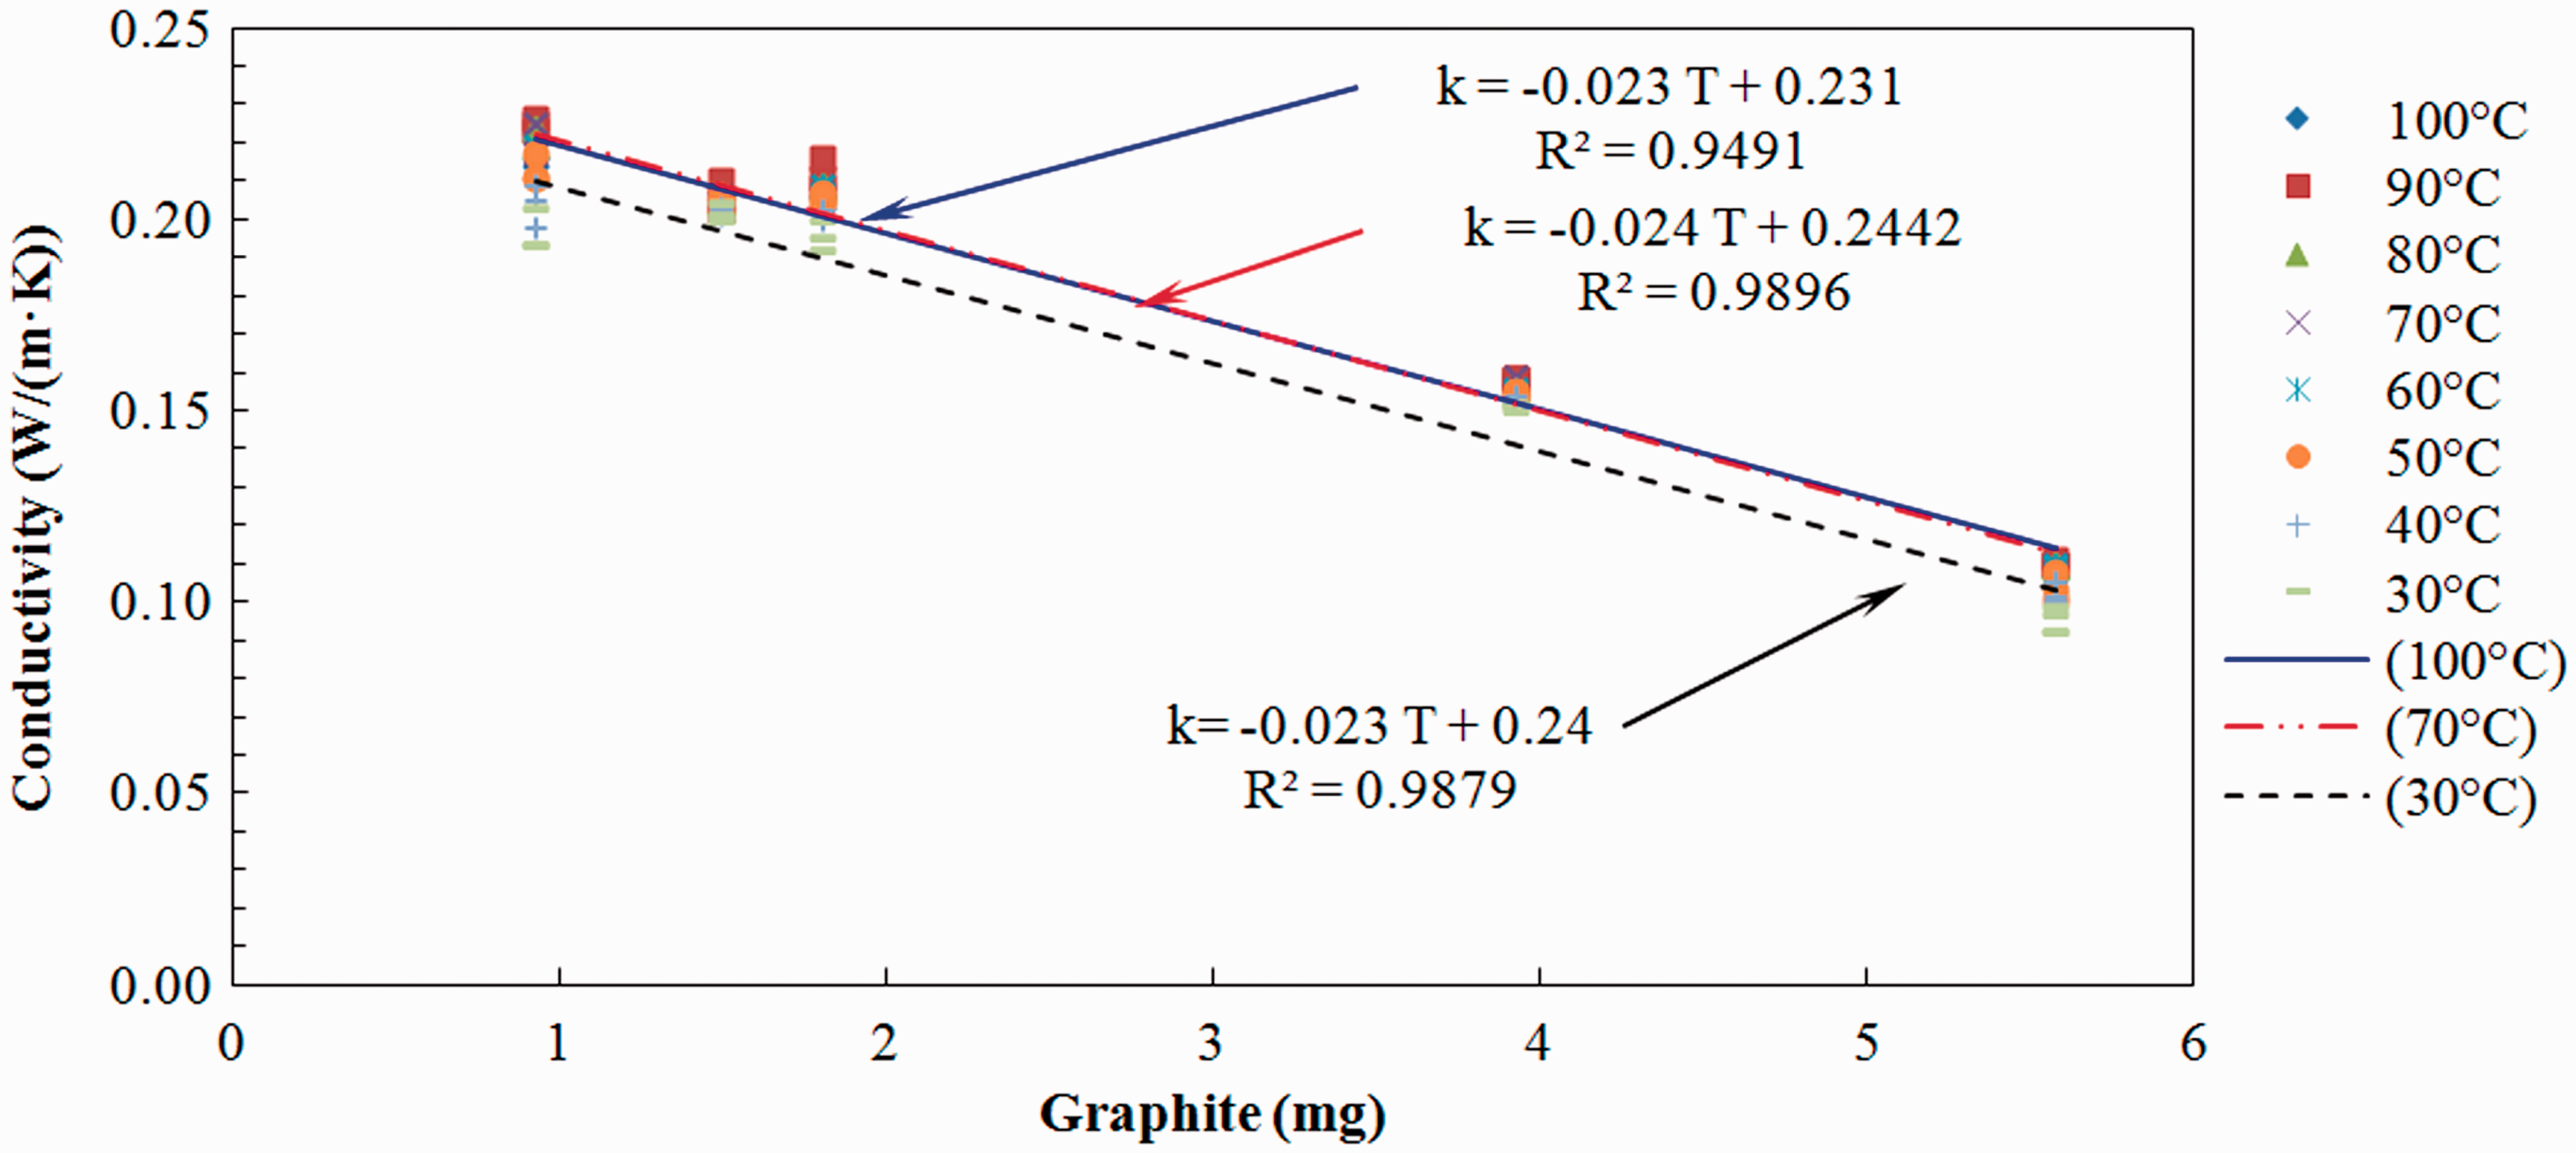
Notice that in the context of CFRP tests by LFA, the influence of graphite coatings did not represent a considerable error during the tests. This is due to graphite layers (∼2 mg) represented less than 1% of the total sample weight. Nevertheless, in the literature it was mentioned that samples with higher thermal conductivity (100–1000 W/m·K) and Vf lower than 0.2 would be affected by the deposition of such graphite coating. 20 On the basis of the results depicted in Figure 11, the use of gravimetric methods for characterization of highly conductive materials is proposed as future work.
Conclusions
Thermal properties of CFRP including density, CTE, Cp, thermal diffusivity, and thermal conductivity were characterized by using the LFA approach. Density of composite samples was measured at room temperature where findings indicated higher values on UD samples than those measured with 8HS and PW composites. Similarly, it was observed that thermal expansion rate of woven fabrics was higher than UD tapes. This change was attributed to differences in Vf since UD samples had higher Vf than woven fabrics. Subsequently, Cp was obtained using LFA and results were compared with those acquired by DSC as a function of temperature. In these tests, it was observed that this Cp did not change considerably when samples with different fabric configuration or resin formulation were tested. These results also showed that DSC tests had less dispersion in the data obtained, thus implying lower experimental noise. Nevertheless, results obtained by the LFA method were still acceptable, and LFA was 10 times faster than DSC tests. As such, LFA could be used when large amount of samples is required while DSC should be used for tests that require high accuracy. Then, a model to calculate thermal diffusivity for composite samples was identified. Three thermal diffusivity models that are used along with the LFA method were subjected to a statistical analysis where Cape-Lehman was the best fit for CFRP samples. Hence, all the measurements were recalculated using such model, and thermal diffusivity was obtained. Furthermore, thermal conductivity was determined by multiplying diffusivity, density, and Cp where results indicated that both diffusivity and conductivity were considerably affected by fabric configuration. UD fiber samples showed up to two times higher diffusivity and conductivity in d11, thus indicating that Vf could affect the heat propagation within composite parts. Nevertheless, it was not evidenced that the resin formulations influenced diffusivity or conductivity since measurements in d33 showed similar values for both 5320 and 977-2 resin systems. Lastly, tests were carried out using samples made of a typical release film utilized for CFRP manufacturing. These results showed that thermal conductivity of release materials was significantly lower than that of composites, which might generate a thermal lag between tools and parts. Future work in this area shall be focused towards the implementation of LFA method for characterization of thermal properties during curing.
Footnotes
Declaration of Conflicting Interests
The author(s) declared no potential conflicts of interest with respect to the research, authorship, and/or publication of this article.
Funding
The author(s) received no financial support for the research, authorship, and/or publication of this article.