
Abstract
In composite manufacturing, large composite parts usually exhibit high heating gradients during the autoclave process, which may intensify the process-induced residual stresses and deformations. As the thermal behavior of molds is of crucial importance to the curing performance of composites, a heat-balance method is presented to reduce the heating rate on overheated areas of molds, thus providing a more homogeneous curing process. The method is based on a local-isolation structure installed under the mold plate, which is used to change the local heat transfer coefficient of the mold. In the local-isolation structure application, an optimization process combining numerical simulations with a greedy genetic algorithm is developed to find the optimal layout and geometry of local-isolation structure in molds. The optimization results suggest that more uniform heating condition and more synchronous curing process can be achieved with the optimal design of local-isolation structure. In the case of a typical mold for C spar component, the maximum temperature difference in the composite part is reduce by 45.69%, while the maximum difference in degree of cure is decreased at a rate of 40.16%.
Introduction
The application areas of thermosetting composites have been spreading fast over the last years because of their higher specific strength and stiffness than conventional metal lightweight alloys. In the aerospace industry, composites are often used in parts with open-shell geometry, which can be fabricated in different processes such as autoclave-curing and resin transfer molding (RTM). During these processes, the final shape of the composite parts is not the same as the target geometry due to the process-induced residual stresses. 1 The poor geometric precision may cause further problems during and after the assembly of components as the rigid structures require matching of smaller sub-components. 2 To suppress the problem, much efforts have been made in promoting the curing performance of parts by finding the fittest curing environment for composites.
The curing process of composites involves the heat transfer between the laminates and the environment and the cross-linking reaction within the laminates. Regardless of the manufacturing method, the laminates are all cured in molds under prescribed cure cycles, which strongly affect the final curing performance. The optimum temperature and pressure profiles of cure cycles can be obtained by using efficient optimization techniques combined with reasonable experiments and simulations. In early studies, experimental approaches have been vastly utilized in finding the optimal parameters of cure cycles. In these studies, the physical state of laminates is monitored and tested during and after the curing process so that the cure profiles can be adjusted accordingly.3,4 Nevertheless, the experimental approach is expensive and time-consuming as the curing process of laminates has to be repeated for times until the desired properties of laminates are produced. Therefore, various simulation tools and techniques are adopted for a more effective optimization process of the cure cycles.5–9 Kim and Lee 5 simulated the curing process in an autoclave and determined a modified cure cycle with cooling and reheating steps to reduce the temperature overshoot of thick laminates. With both experimental and numerical approaches, Guo et al. 6 studied curing of thick thermosetting composite laminates and modified the manufacturer recommended cure cycle (MRCC) to reduce the temperature gradients through the thickness of laminates. To minimize the cure time of laminates under the constraint of the maximum allowed temperature, a design sensitivity analysis method was presented by Li et al. 7 Similar works aiming at shortening the cure duration and promoting curing efficiency can also be found in Rai and Pitchumani 8 and Carlone and Palazzo. 9 Although numerical simulations have been adopted in aforementioned studies, it is difficult and time-consuming to determine the best possible cure parameters by trial-and-error method deferred to their works. In order to optimize the process parameters with more efficient numerical simulations, the model reduction method known as proper generalized decomposition (PGD) was proposed by Chinesta et al. 10 In a PGD framework, a general solution that includes all the solutions for every possible value of the parameters can be obtained by solving the numerical model only once for life. 11 Recently, heuristic algorithms are also growingly used in the optimization of cure cycles with different objective functions.12–16 Carlone et al. 12 and Aleksendrić et al. 13 proposed an intelligent optimization model to optimize the thermal curing cycle of polymer matrix composites based on the coupling of a finite element thermo-chemical process model, dynamic artificial neural networks, and genetic algorithms. Jahromi et al. 14 applied trained recurrent artificial neural networks to minimize the temperature difference with the constraint of maximum allowable temperature. Meanwhile, commercial finite element method software facilitates the modeling of curing process. With the help of software ABAQUS, COMPRO, and MATLAB, Shah et al. 15 utilized a genetic algorithm (GA) and the Latin hypercube sampling method to optimize the cure cycle for the purpose of minimizing residual stresses as well as the curing duration. Struzziero et al. 16 conducted a multi-objective optimization of the cure stage of composites by combining a finite element solution of heat transfer problem with a GA.
Besides the cure profiles, the mold also plays a vital role in the curing process. In manufacturing practice, as the geometry of components is shaped by molds, some researchers started to optimize the geometry of mold so that the final distorted component can be close to the desired shape. For example, a sensitivity analysis is adopted by Zhu and Geubelle 17 to optimize the shape of molds for cross-ply laminates and L-shaped composite parts. A regression-based spring-in reduction method is developed by Dong 18 basing on a simplified curing model and designs of experiments. Moreover, relying on 3D curing simulations and high-fidelity draping on a surface model, a computational chain designed for compensating cure-induced distortions is developed by Wucher et al.19,20 While considerable research effort has been devoted to the geometry optimization of molds, little attention has been paid to the thermal behavior of molds. Particularly in autoclave process, with low thermal diffusivity and high thermal capacity, the mold itself is a major contributor to inhomogeneous heating and low heating rates. 21 Inhomogeneity in the course of the curing will cause an imbalance in the residual stresses, which may intensify the deformation of composites. Recognizing this, several researchers established objective functions with different methods to improve the thermal behavior of molds by optimizing their placement inside autoclaves.22,23 According to their study, both temperature gradients and cure durations are reduced when a batch of composite parts are cured in one autoclave.22,23 However, for single component with large dimensions, complicated geometry of molds may lead to more pronounced temperature and degree of cure (DoC) nonuniformity inside the component. To deal with the problem, with utilizing the so-called shift factor approach, Weber et al.21,24 provided a systematic study on important factors influencing the heat transfer in an autoclave and then redesigned the structure of a mold by eliminating the “thermos flask”. A reduction of processing time of about 10–38% as well as a reduction in temperature differences within the mold of more than 65% is achieved in Weber’s study, which illuminated the way of improving the curing process through changing the structure of mold. Moreover, design parameters of a mold are optimized by the authors in a former study using numerical simulations combining with the GA. The result shows that the synchronism of cure in composite part is improved about 17% with the optimization. 25
Although much efforts have been put to promote the heating efficiency and reduce the intra-shadowing effect of molds, the heating gradient along the axial direction of autoclave cannot be eliminated by merely promoting the heating efficiency of molds. To reduce the heating gradient within composites, a new heat-balance method is presented through changing the heat transfer condition between the heated air and the mold. As the heat-balance method is based on a local-isolation structure (LIS), the definition of the LIS is firstly introduced to suppress the heating rate on overheated areas of molds. Then, the effect of the LIS is verified by applying it to the underside of a mold, and the result shows that the local heat transfer coefficient (HTC) can be changed by the LIS. Furthermore, the application of LIS is expanded to a typical mold for manufacturing a thin-wall C-spar component with large dimensions. In order to obtain the optimal design, the design parameters of the LIS are optimized by combining numerical simulations with a greedy genetic algorithm.
The local-isolation structure
During the curing process, the HTC, which can be varied as much as two to three times within an autoclave,26–28 is considered to be the primary cause of the heating gradients within molds and laminates. In order to solve the problem of the high heating gradient, a heat-balance method is presented in this section. Different from former studies, the basic idea of this method is to suppress the heating rate on overheated areas of the mold, thus achieving more homogeneous heating condition of the whole component.
Definition of the LIS
The heat-balance method is based on the LIS, which is installed in the underside of mold plate (Figure 1). As an additional component, the LIS can be designed and manufactured either before or after the fabrication of molds. The application of LIS would not change the original mold structure while the geometry of LIS can be modified and optimized based on practical requirements. In the autoclave process, with the LIS, the narrow space below the mold plate is isolated from the environment and the heated air should first go through the convective holes of the LIS to reach the underside of mold plate. Both temperature and velocity of the air near the mold plate would be reduced in the heating process due to the application of LIS. In fabrication processes of the composite materials other than the autoclave process, the LIS would not pose much influence as it only appears under the mold plate.
The local-isolation structure.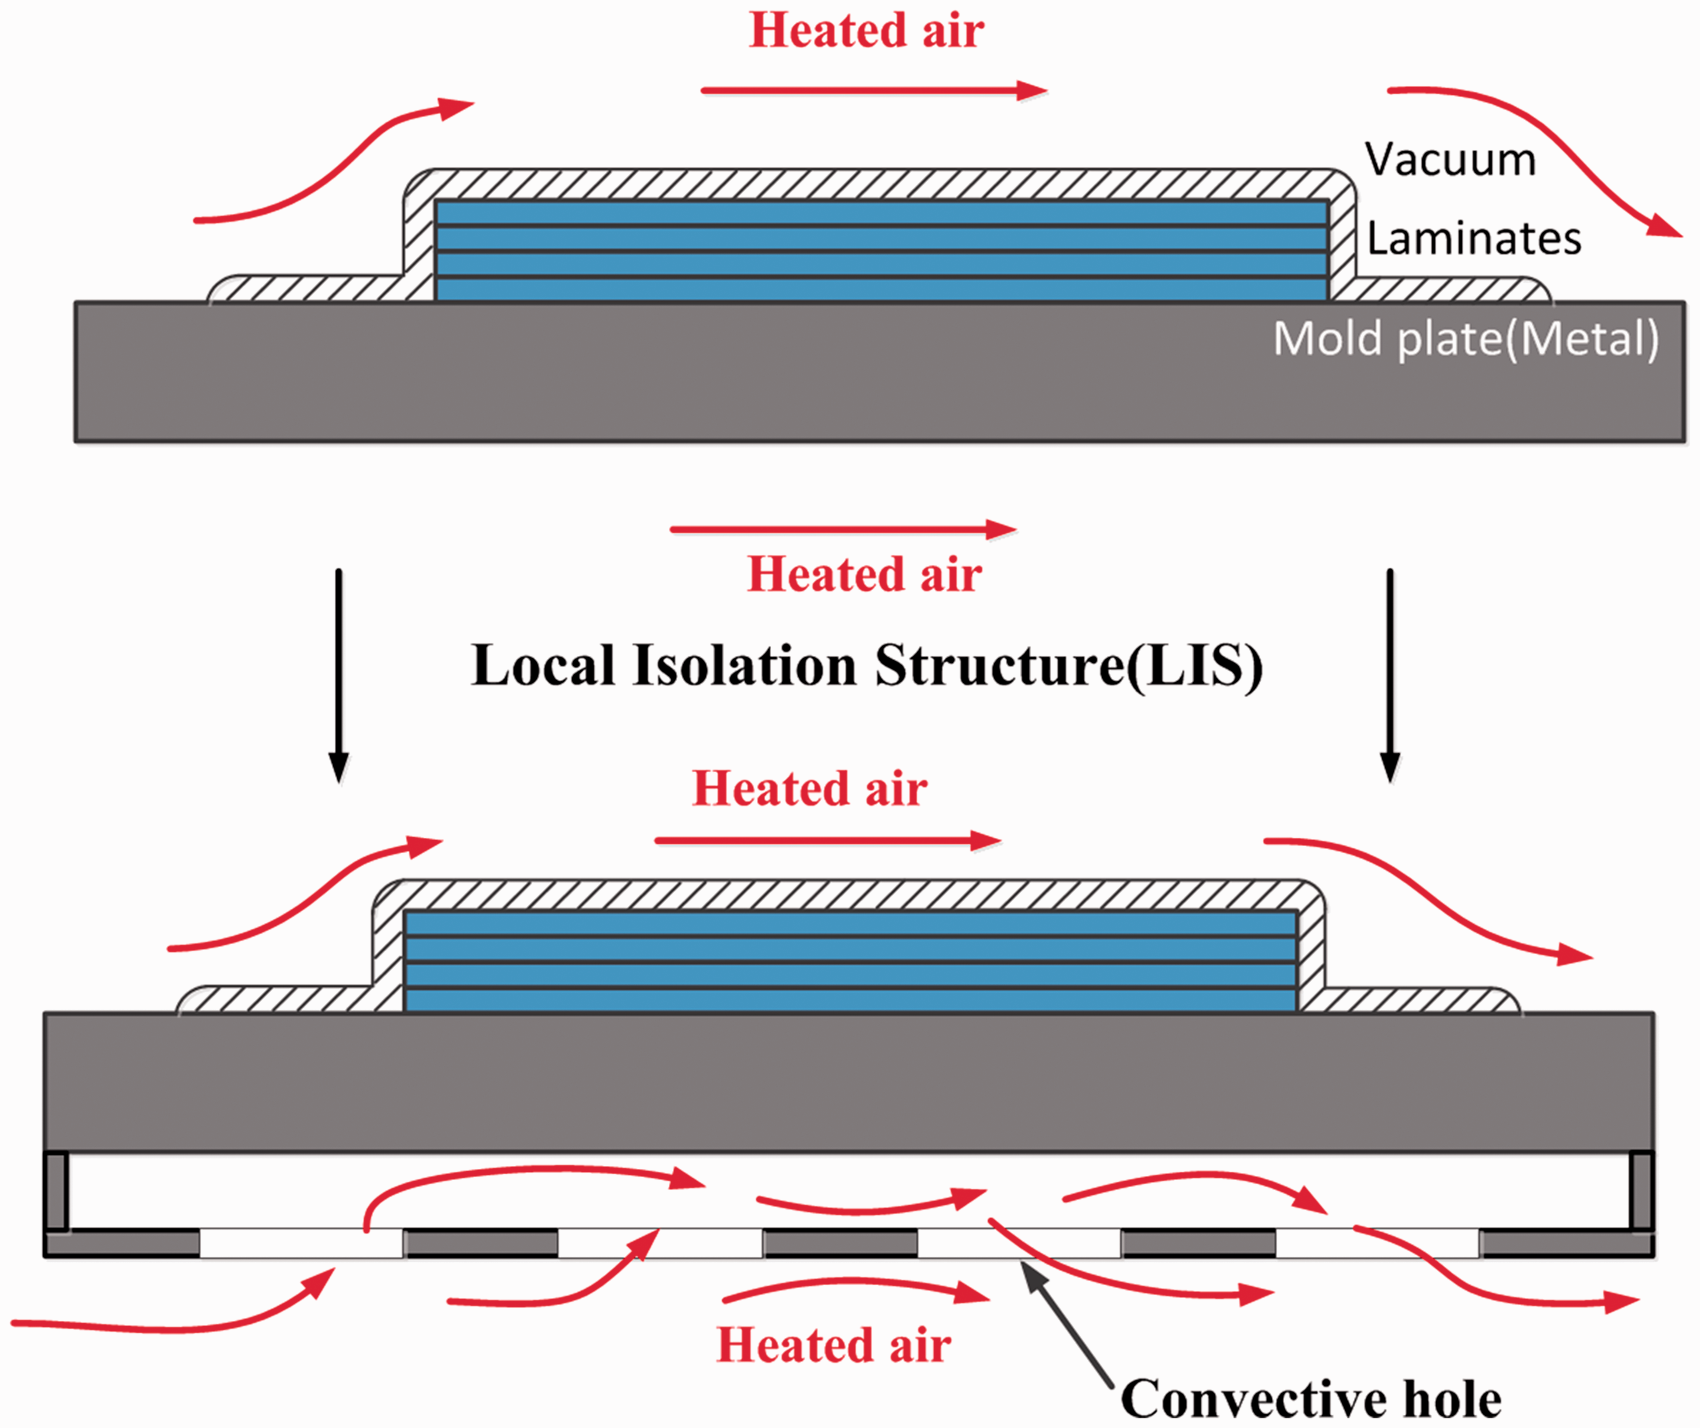
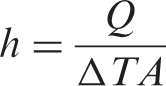
The heat transfer between the air and mold can be characterized by the HTC h
Effect of the LIS
In this section, the HTC on different faces of a mold is firstly simulated and compared with the known experimental data.
23
Then, the LIS is applied to the underside of the mold to verify its effect on the local HTC. The mold is 0.85 m in length, 0.8 m in width, and 0.15 m in height without the base plate. It is placed in an autoclave with length 3 m and diameter of 1.6 m, as is shown in Figure 2. A standard computational fluid dynamic (CFD) approach is adopted for the simulation of air flow within the autoclave, and three measurement points P1, P2, and P5 in different sides of the mold are selected for obtaining the HTC values.
Schematic drawing of the autoclave.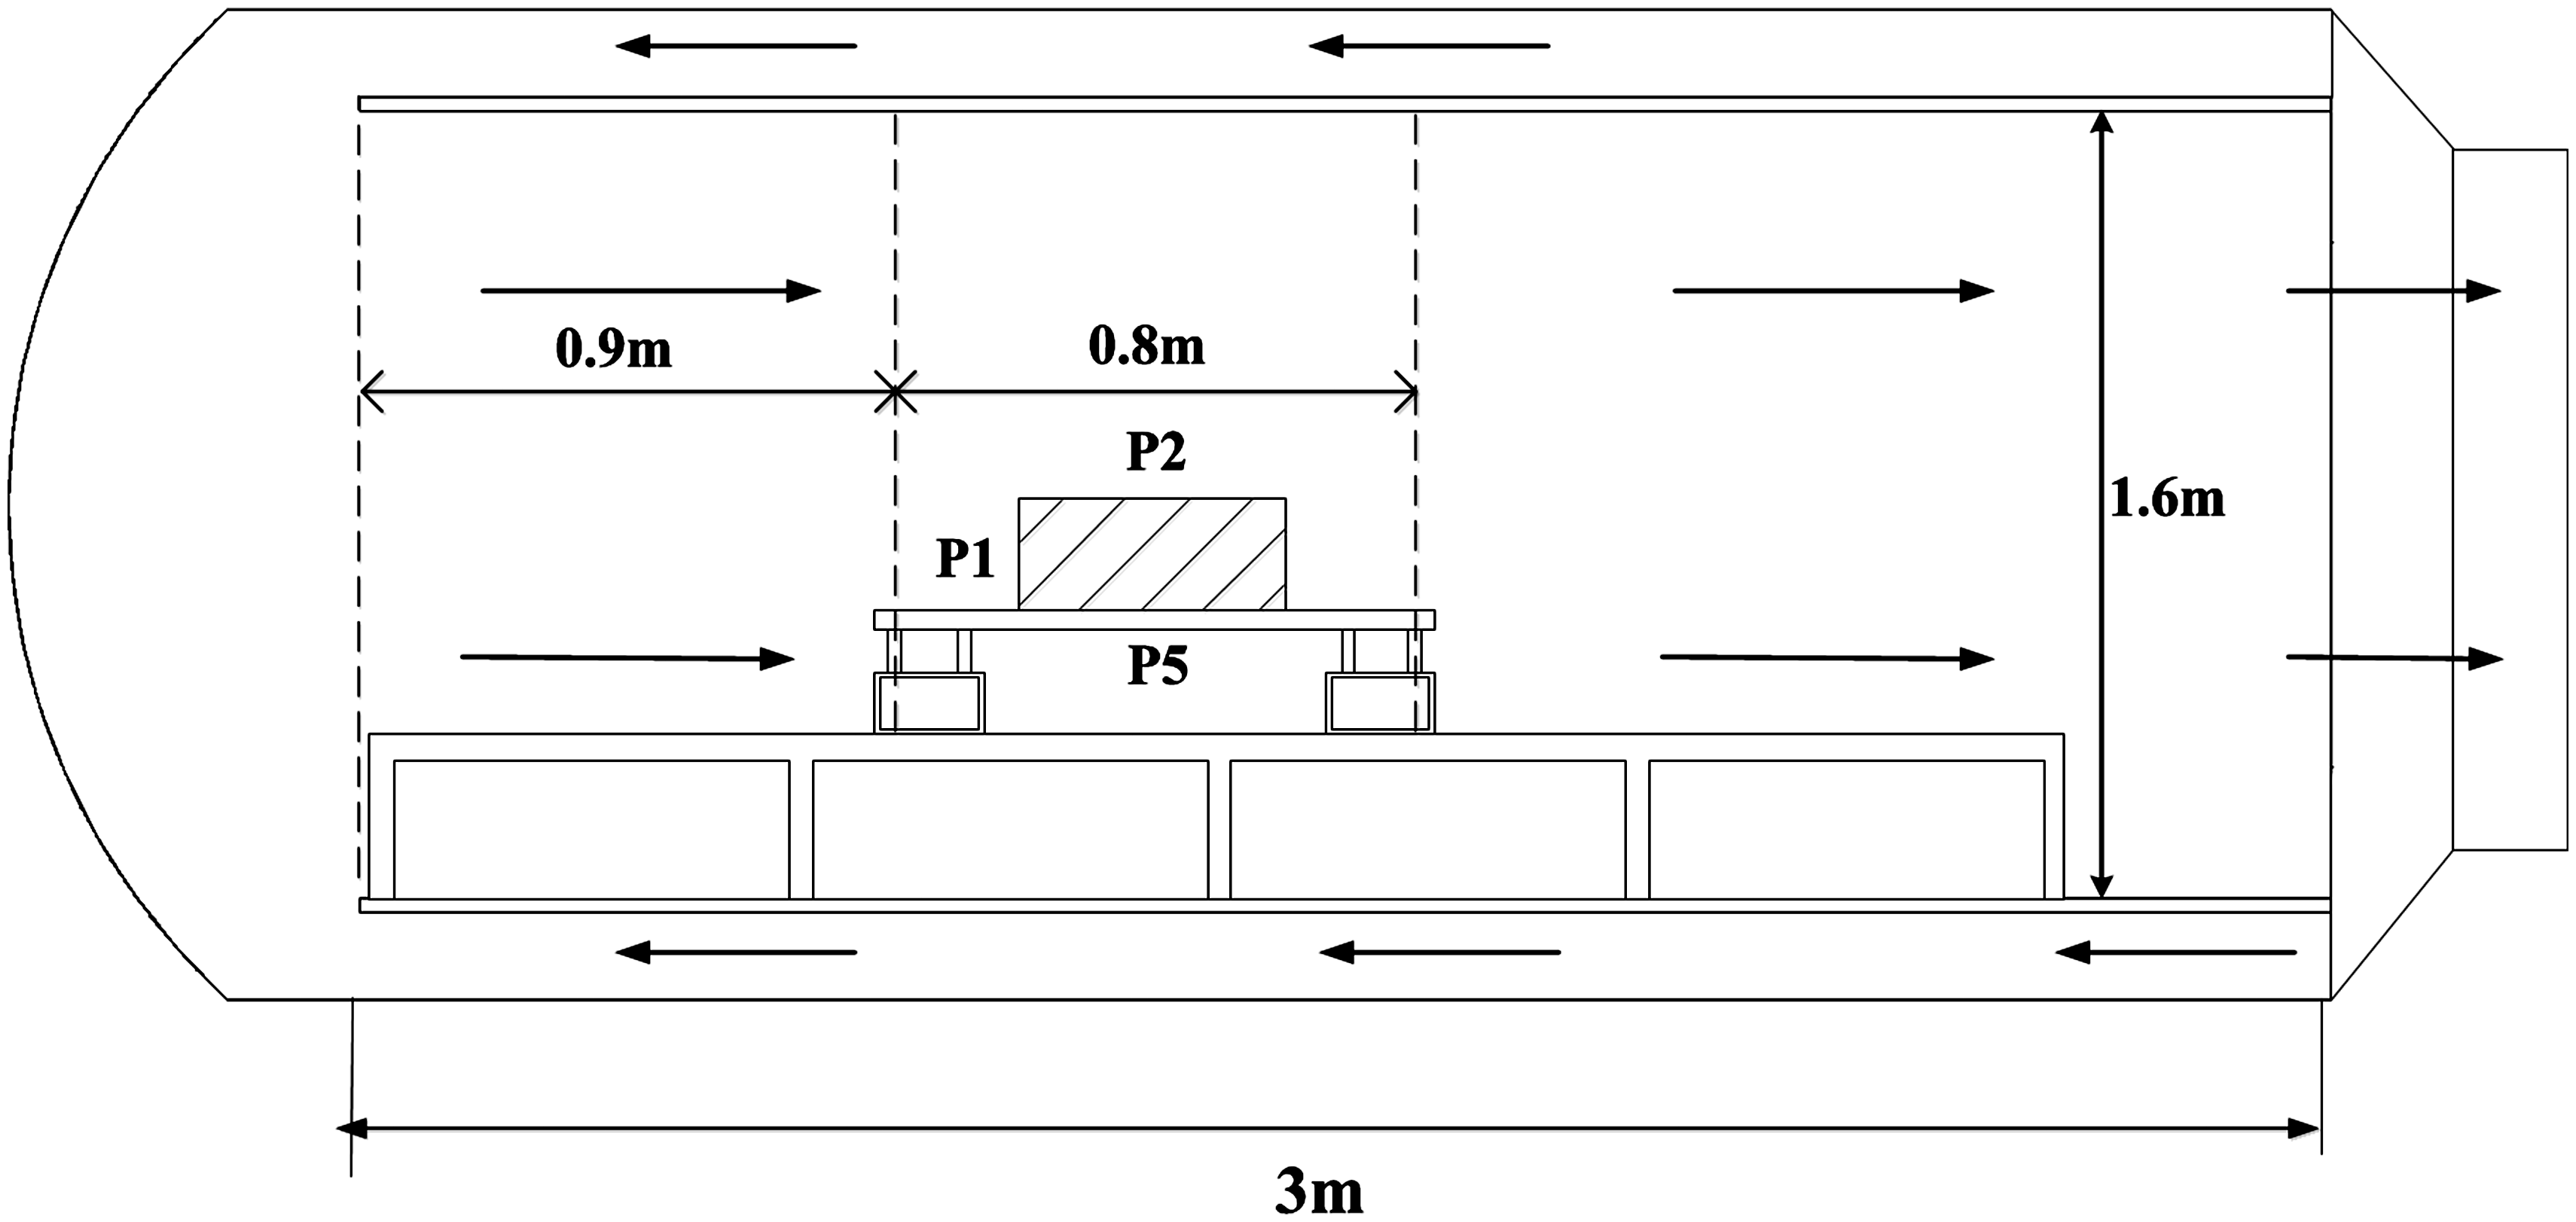
The first 90 min of an autoclave cycle is applied in the simulation.
19
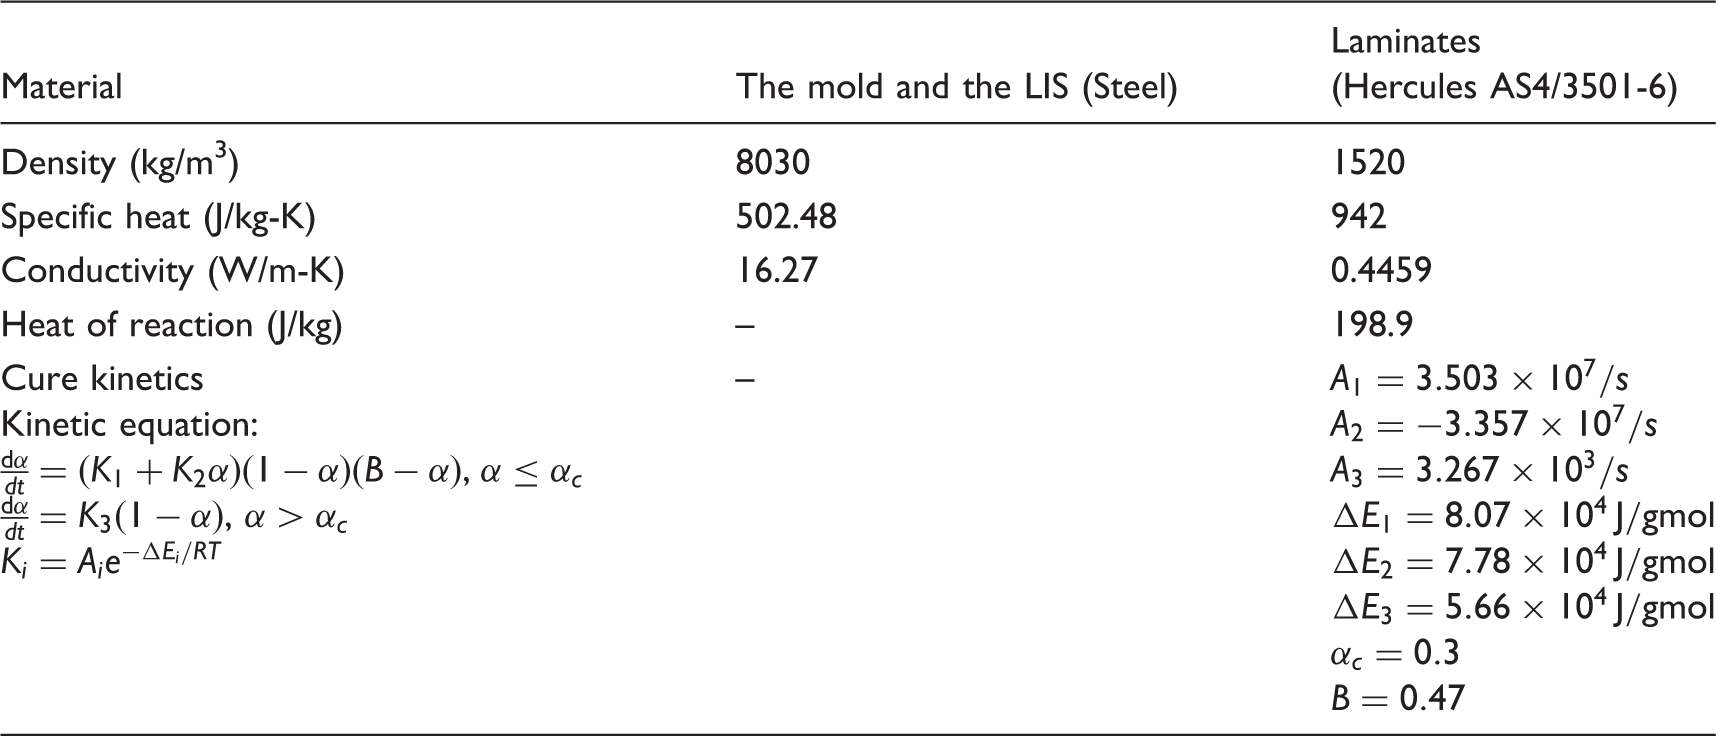
In the fluid region, the air is with a density of 1.225 kg/m3, a specific heat of 1006.43 J/kg-K, and a thermal conductivity of 0.0242 W/m-K. The average inlet velocity of air is set to 4 m/s and the viscosity of air is considered to be constant with the value of 1.7894e-05 kg/m-s. With the Reynolds number of air flow Re > 12000, the flow is turbulent and the standard k–ɛ turbulent model is utilized in the fluid domain. In the solid region, the mold is made of steel, which is with a density of 8030 kg/m3, a specific heat of 502.48 J/kg-K, and a thermal conductivity of 16.27 W/m-K. With the reference condition of a surface with parallel flow conditions at a pressure of 5 bar and a temperature of 453 K, the temperature curve of air and the relative values of HTC curves are presented in Figure 3.
HTC values in different measurement points of the mold.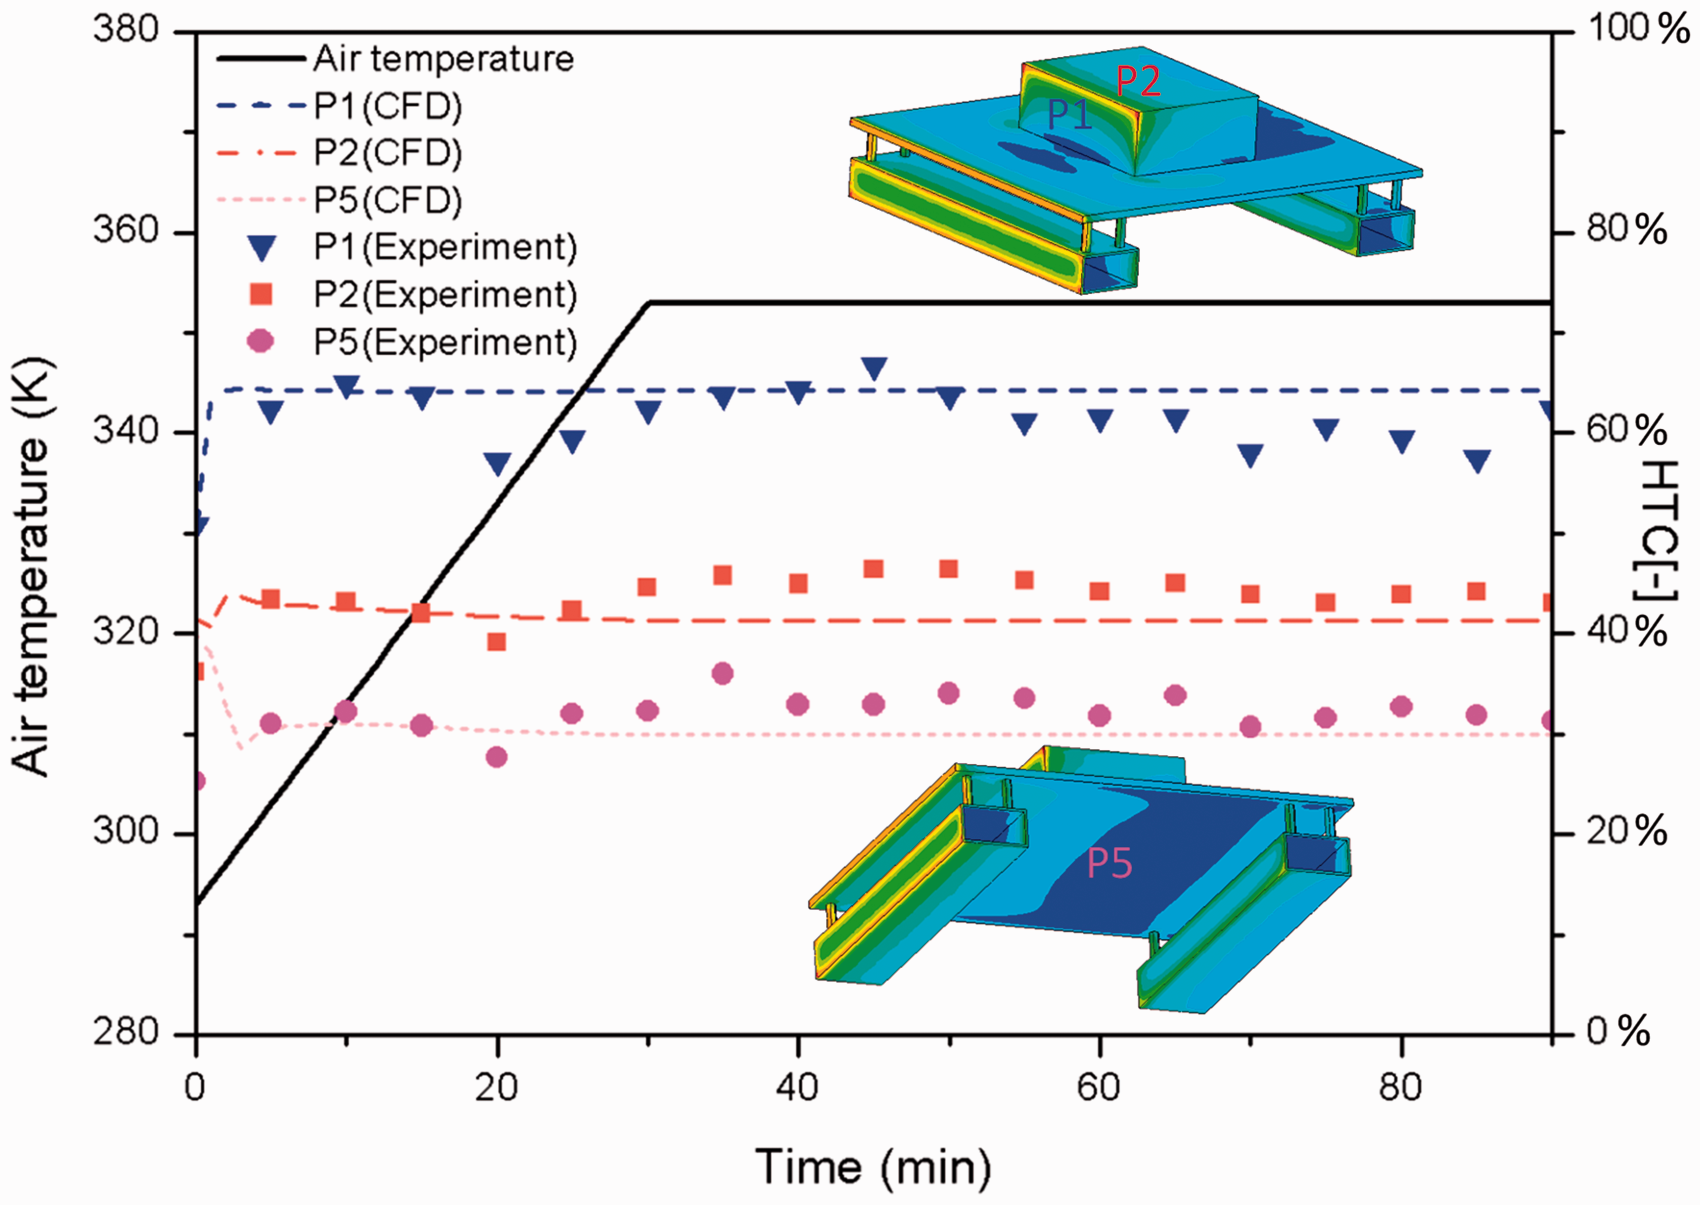
In Figure 3, both numerical and experimental results show that the highest value of HTC among the three measurement points is in position 1, which is on the leeward side of the mold. Meanwhile, parallel with the flow direction, lower value of HTC occurs in position 5 rather than position 2 because more obstacles exist around position 5. In fact, the LIS is also an obstacle for the convection of air. For example, when the LIS is installed in position 5 as shown in Figure 4, notable decline of the air velocity can be observed. The average velocity below the mold plate decreased from 0.2647 m/s to 0.0782 m/s after the LIS is applied.
Velocity of air around the mold.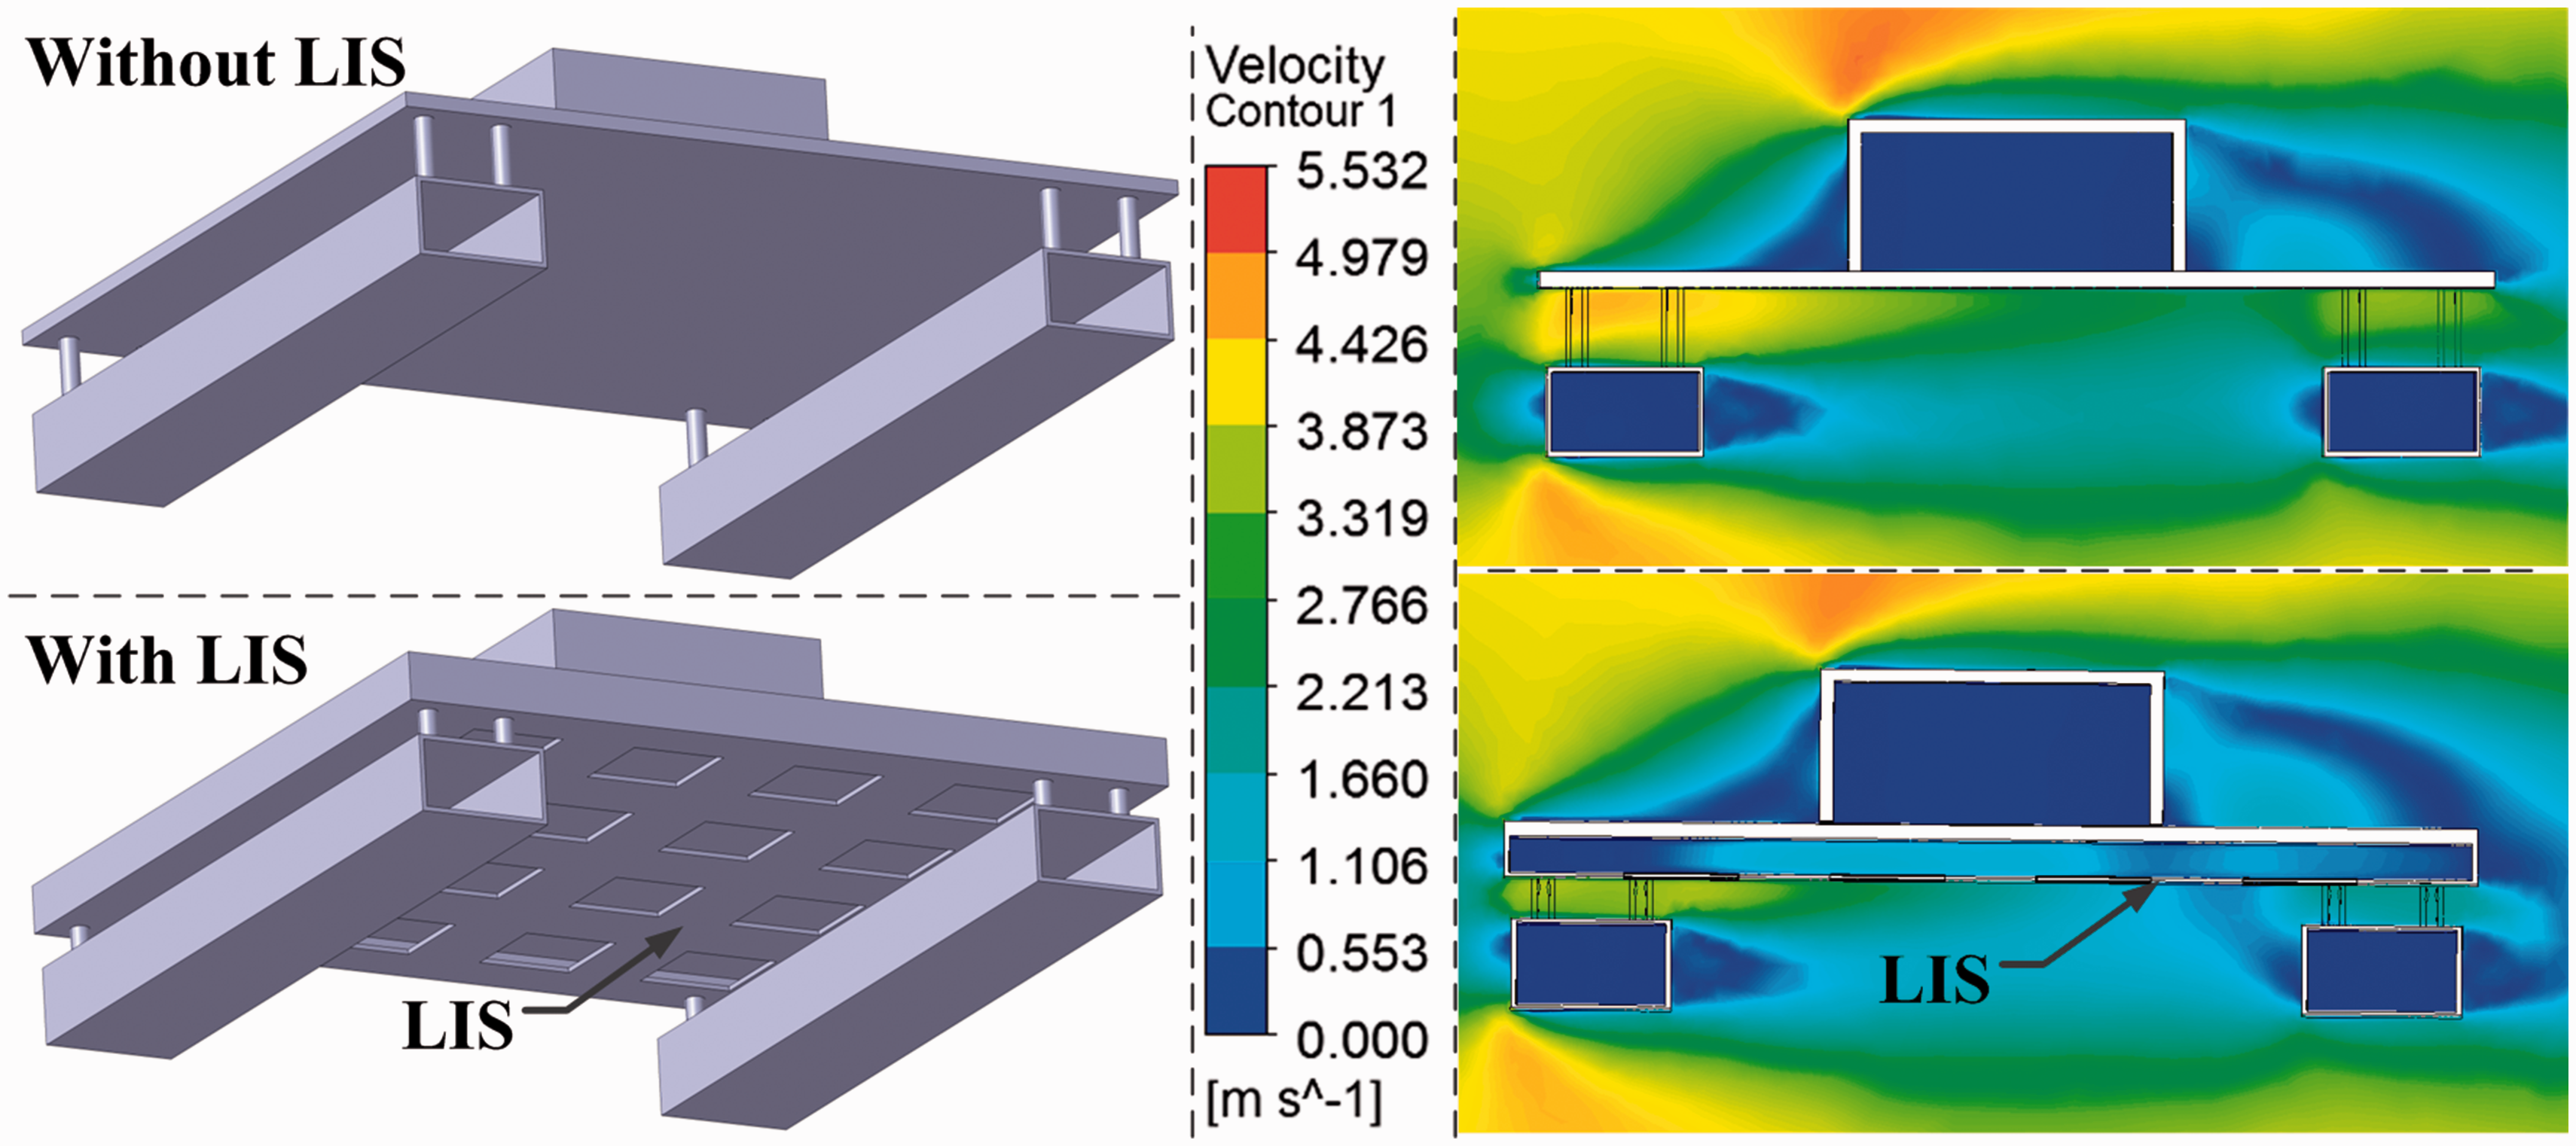
In Figure 5, the HTC on position 5 is reduced by 14.7% after the LIS is applied. The results suggest that the HTC between the air and mold can be suppressed by the LIS. Meanwhile, as the velocity of air depends on the holes of the LIS, it is conceivable that the HTC is decided by the size and geometry of the holes.
The effect of LIS on the HTC.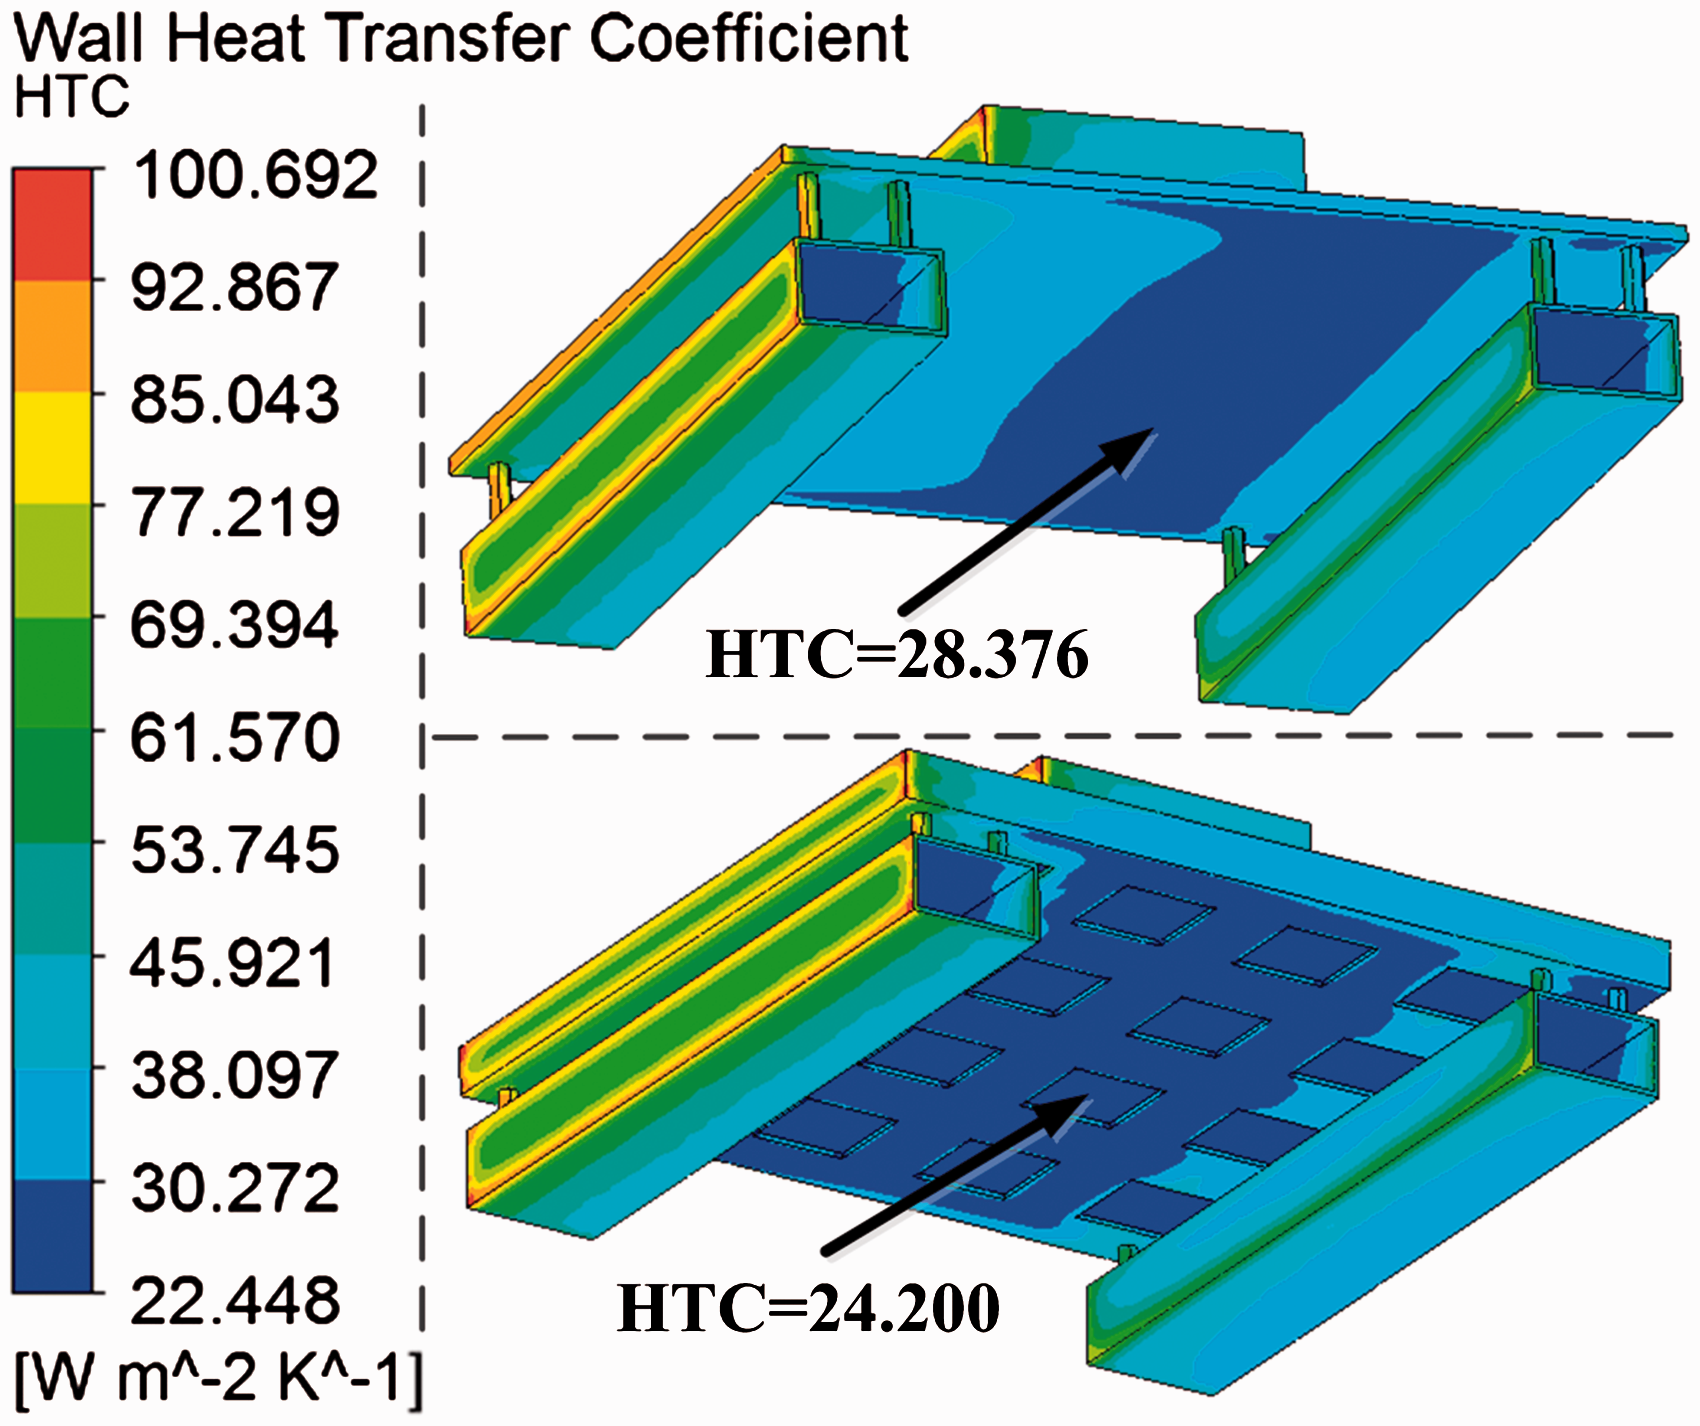
Application of the LIS in a typical mold
In the last section, the LIS structure has been applied in a mold with simple geometry and small size. For larger components and molds, which exhibit high temperature gradients in autoclaves, the application of LIS is much more difficult because different geometries of LIS may be required in different areas of the mold. Thus, design parameters of the LIS have to be optimized with efficient algorithms to find the areas and the geometry of LIS applied in the mold.
In this section, a typical mold with approximately 7 m in length, 0.45 m in width, and 0.38 m in height, is redesigned with the local-isolation method (Figure 6). The mold is covered with a 4 mm thick C-spar composite and it is placed in an autoclave which is 8 m in length and 3 m in diameter. This geometry of mold is selected because it is simple enough to demonstrate the thermal behavior along the axial direction of the autoclave, and complex enough to enforce the need for the optimization of LIS. The velocity of incoming air is set to 2 m/s and the cure cycle is shown in Figure 6. The properties of materials applied in the simulation are given in Table 1.
29
Typical mold and cure cycle for the C spar composite. Properties of the mold and the laminates.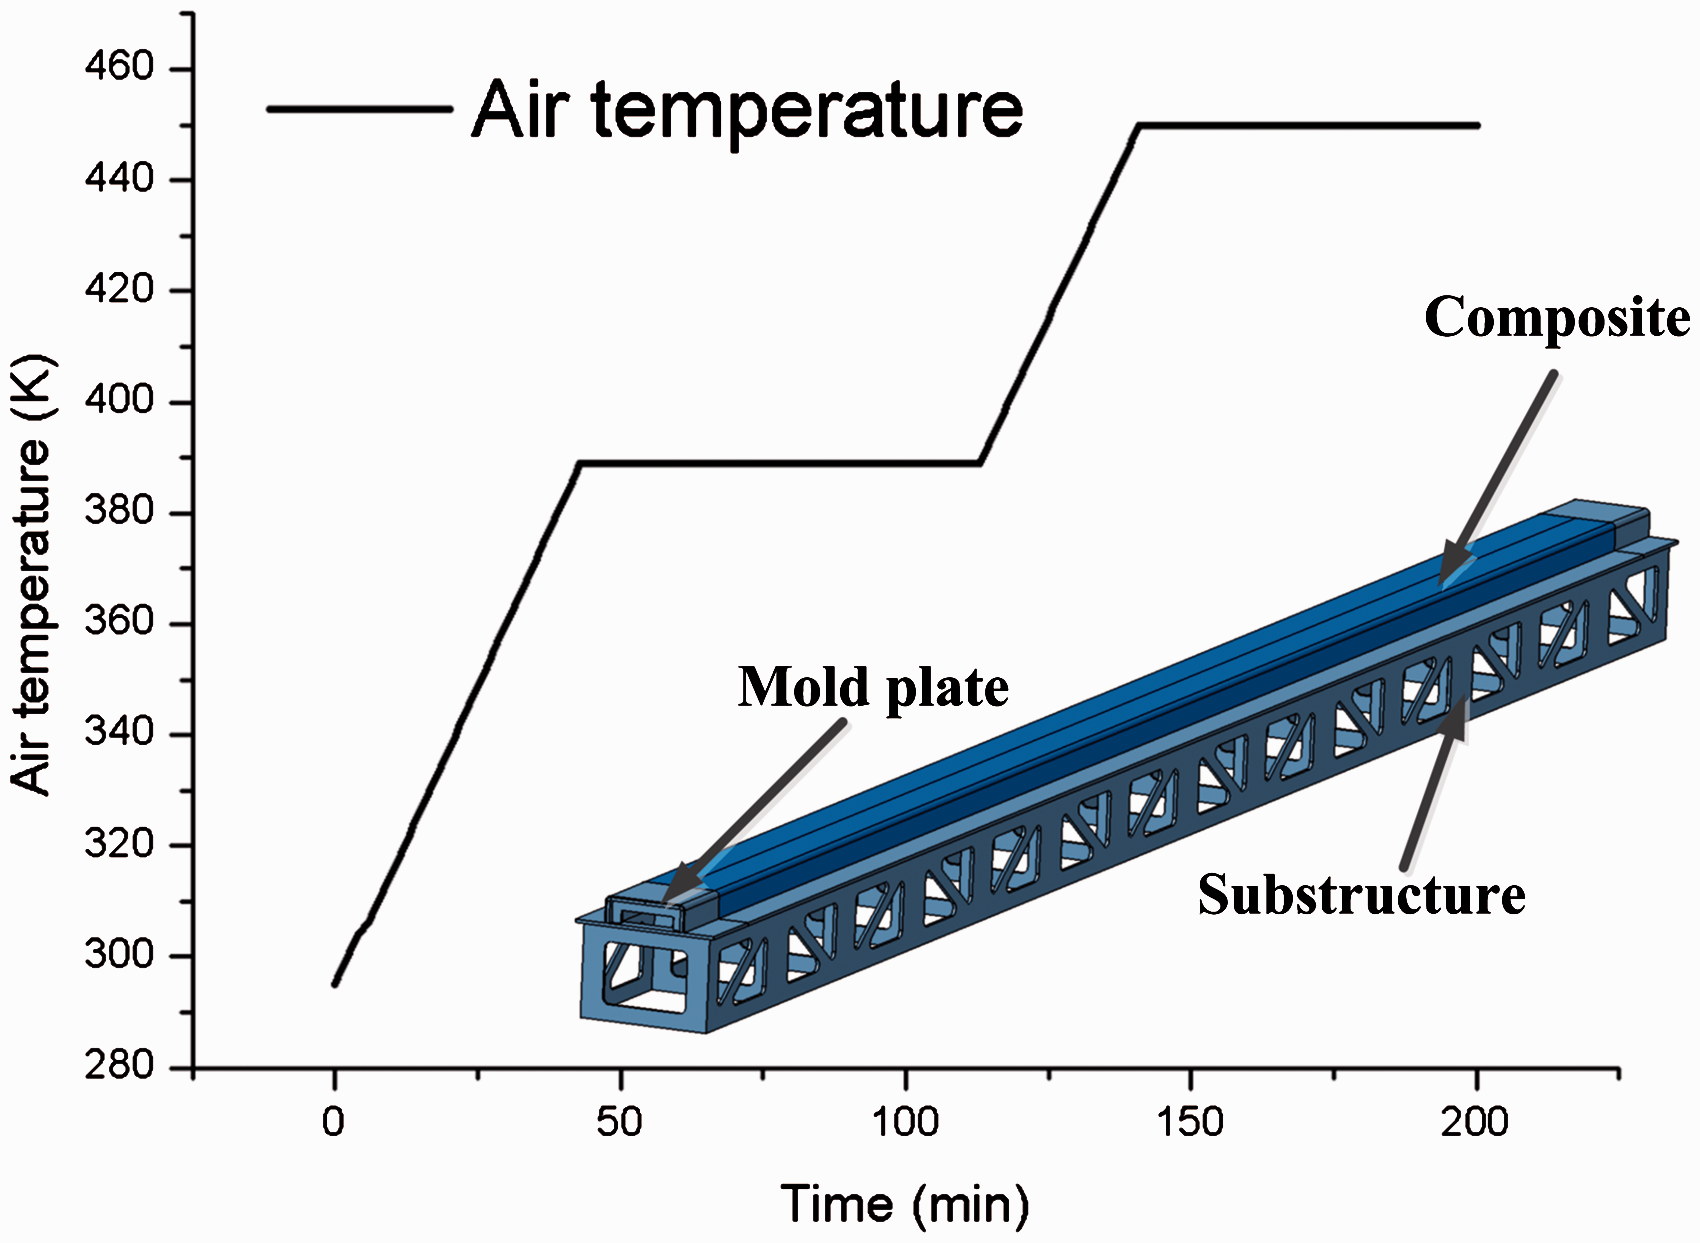
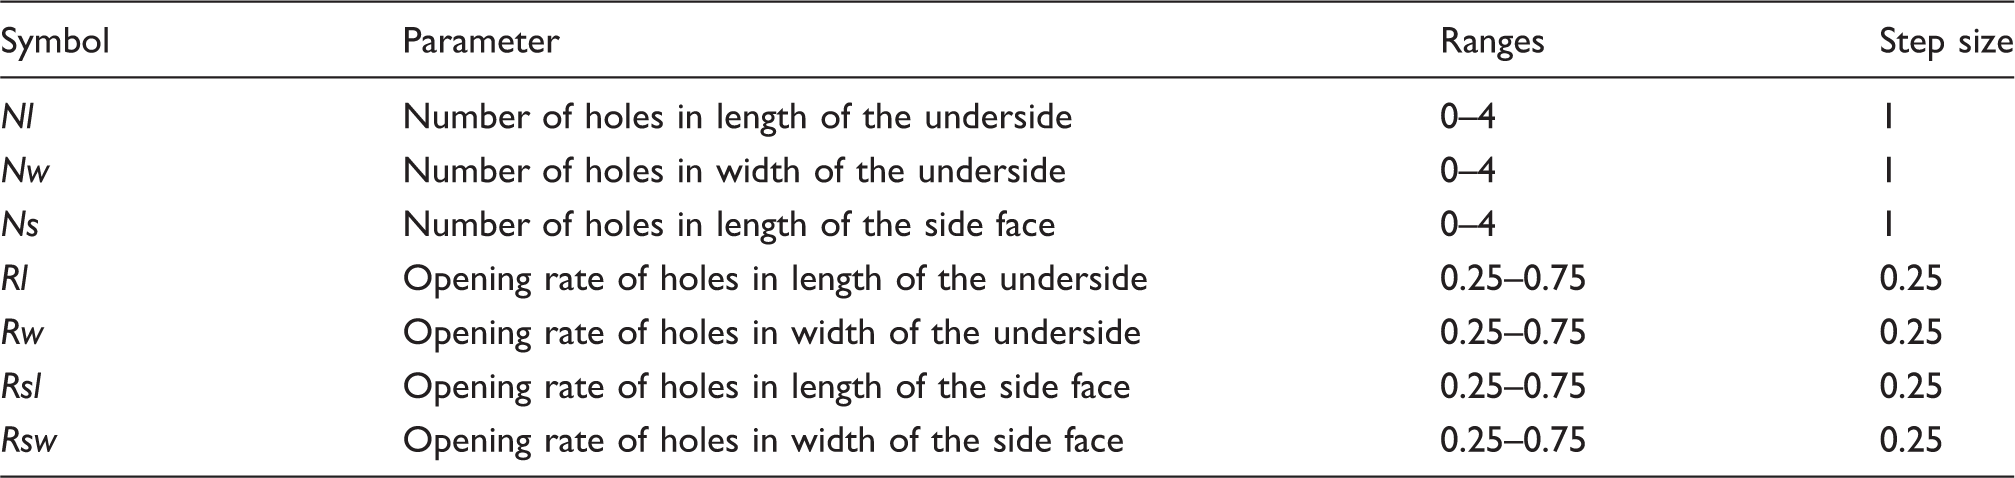
In order to distinguish the LIS in different areas of the mold, the mold is divided into 14 sections by the grid-boards of supporting structure. For each section, the back side of mold plate is installed with a LIS, which consists of three holed plates (one on the underside and two on the side face, Figure 7), to control the local HTC. Seven parameters are selected to characterize the geometry of the LIS: the number of holes in the length and width of the underside (Nl, Nw), the number of holes in the length of the side-face (Ns), and the opening rate of holes in the LIS (Rl, Rw, Rsl, Rsw), as is shown in Table 2.
Lay-out and geometry of LIS. Design parameter ranges.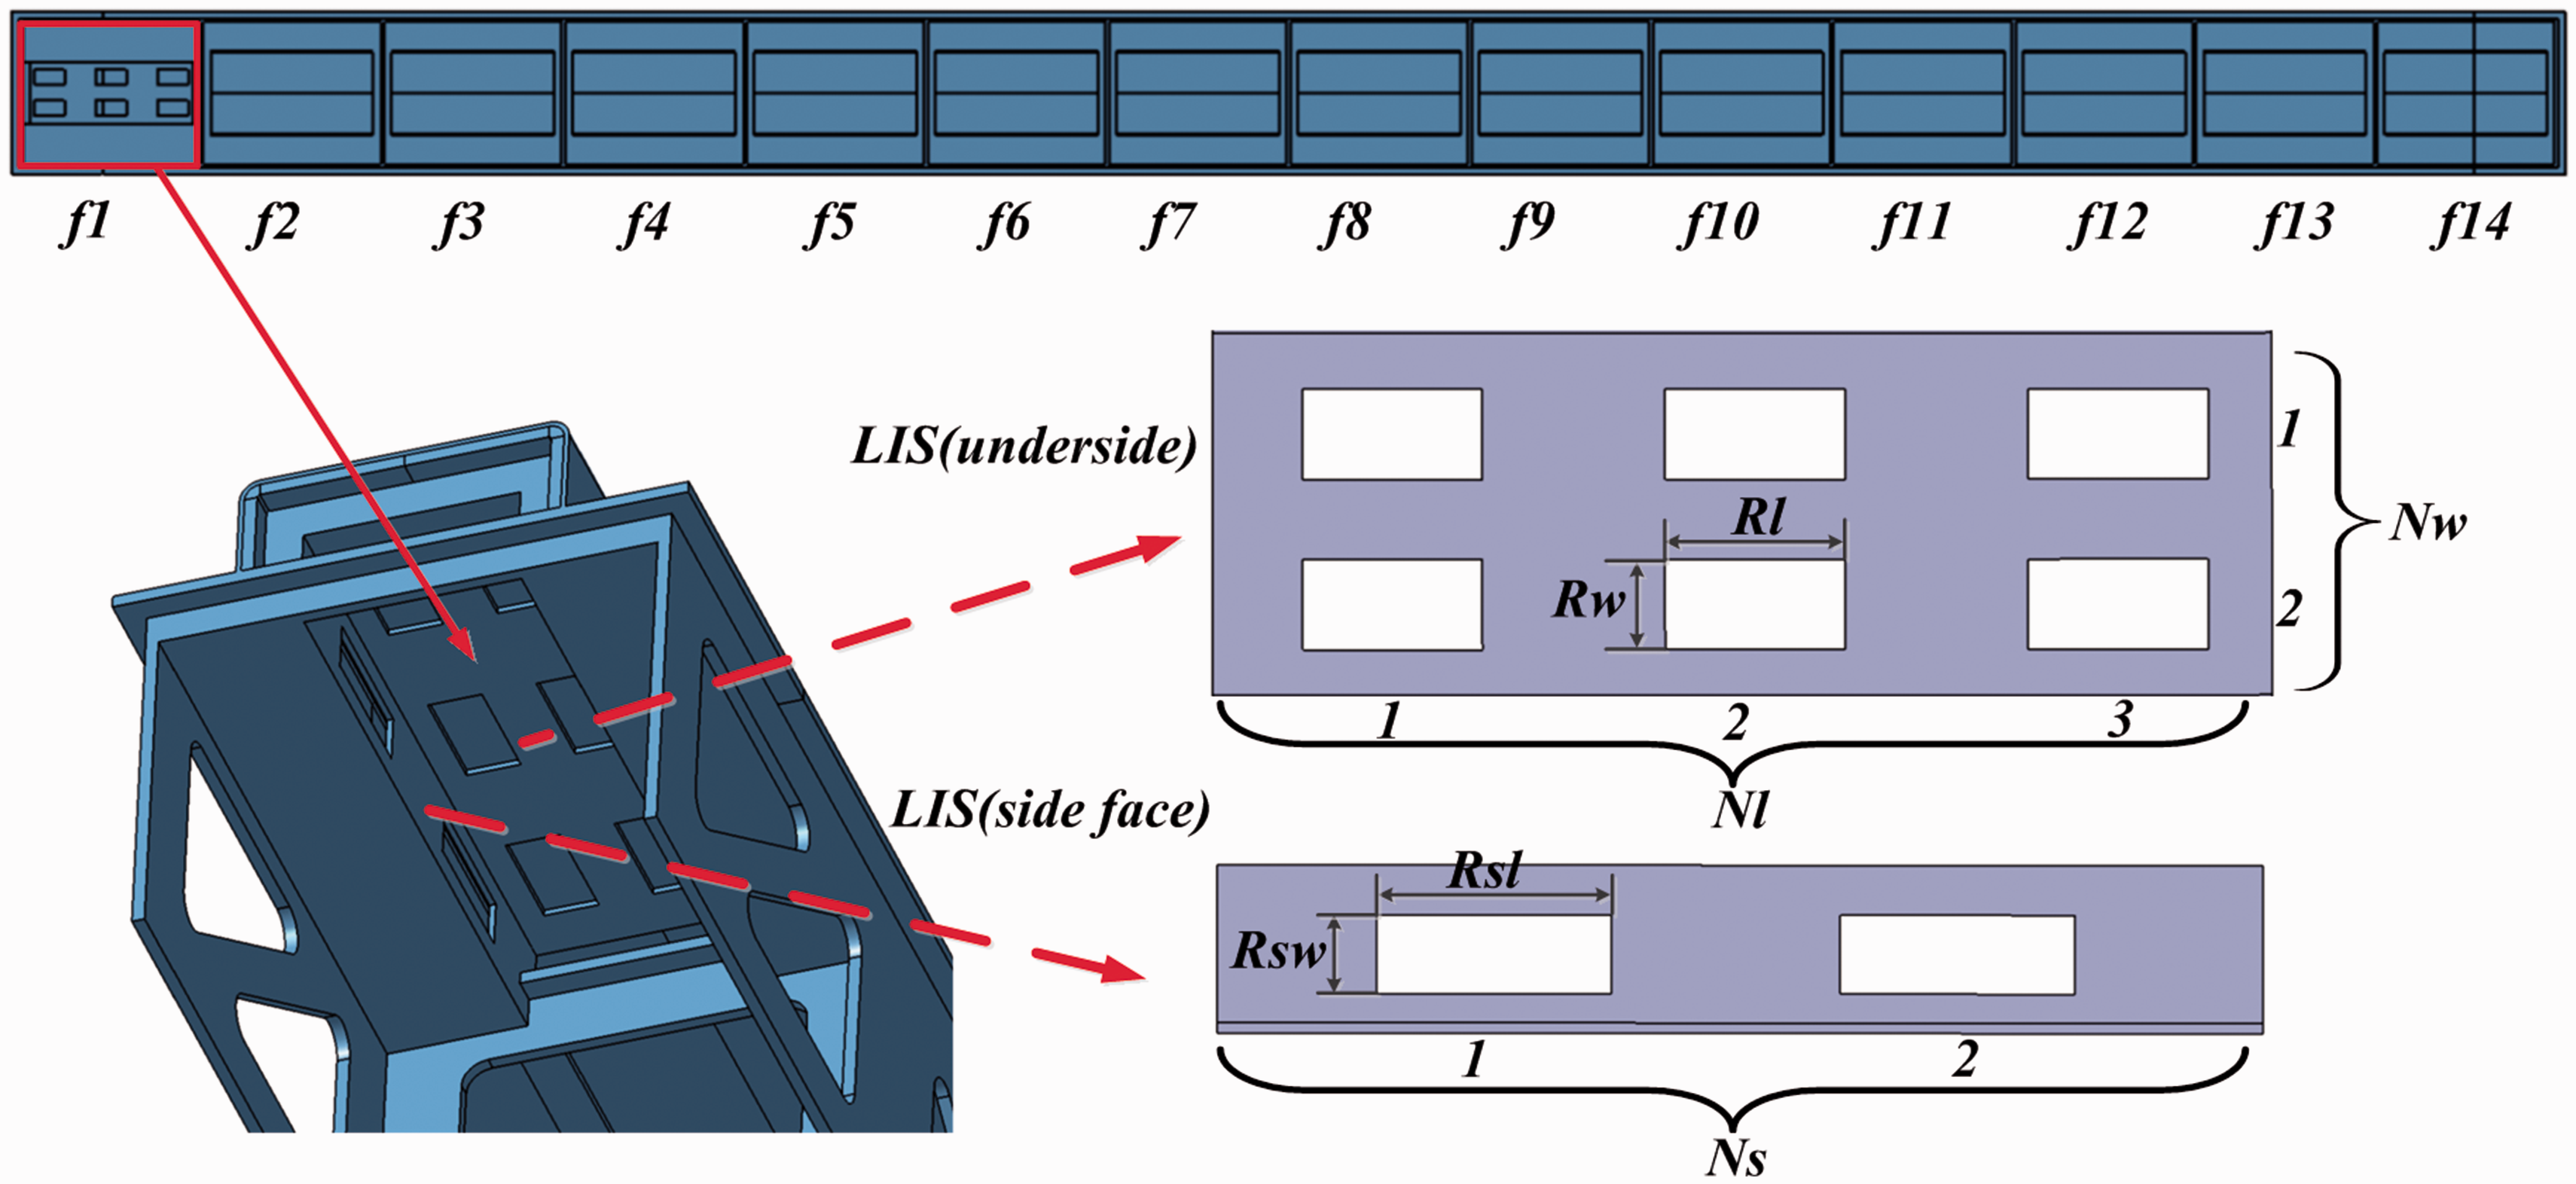
Layout and geometry optimization of the LIS
For large components, the application of LIS is faced with two major problems—what geometry of the LIS should be and in which section of the mold the LIS should be applied. Although the geometry of LIS can be characterized by parameters in Table 2, it is almost impossible to optimize the LIS in all sections of the mold with conventional algorithms. For example, for the mold presented in Figure 7, which is with 14 sections, totally 98 parameters have to be optimized simultaneously. To enable an efficient optimization process, a greedy genetic algorithm is presented to find the optimal parameters in different sections of the mold. The greedy algorithm is an algorithm that finds the best choice available at every step regardless of the possible future consequences
30
and it can be much faster than traditional approaches when an optimal solution to the problem contains optimal solutions to the sub-problems.
31
In this particular case, the optimization problem of LIS in 14 sections can be solved separately because the application of LIS in each section poses little influence on the others. The layout of LIS is encoded onto 14 0/1 dummy variables f1, f2 … … f14, to represent the sections, which have been redesigned with the LIS. For minimizing the temperature gradients within composites, the greedy genetic algorithm constitutes a nested loop of the optimization process, which is with following steps:
Set the dummy variables to be zero and simulate temperature profiles in different sections of the mold plate during the curing process; Select the most overheated section at moment T when the highest temperature difference occurs in the component; Set dummy variable fi of the selected section to 1. Then, apply LIS to the section and optimize the geometry of LIS with the GA; Sort the sections according to their highest temperature at T. If the dummy variable of the section with the highest temperature is 0, go to step 2. Otherwise, terminate the optimization process.
The schematic workflow of optimization process can be found in Figure 8.
Schematic workflow of the optimization process.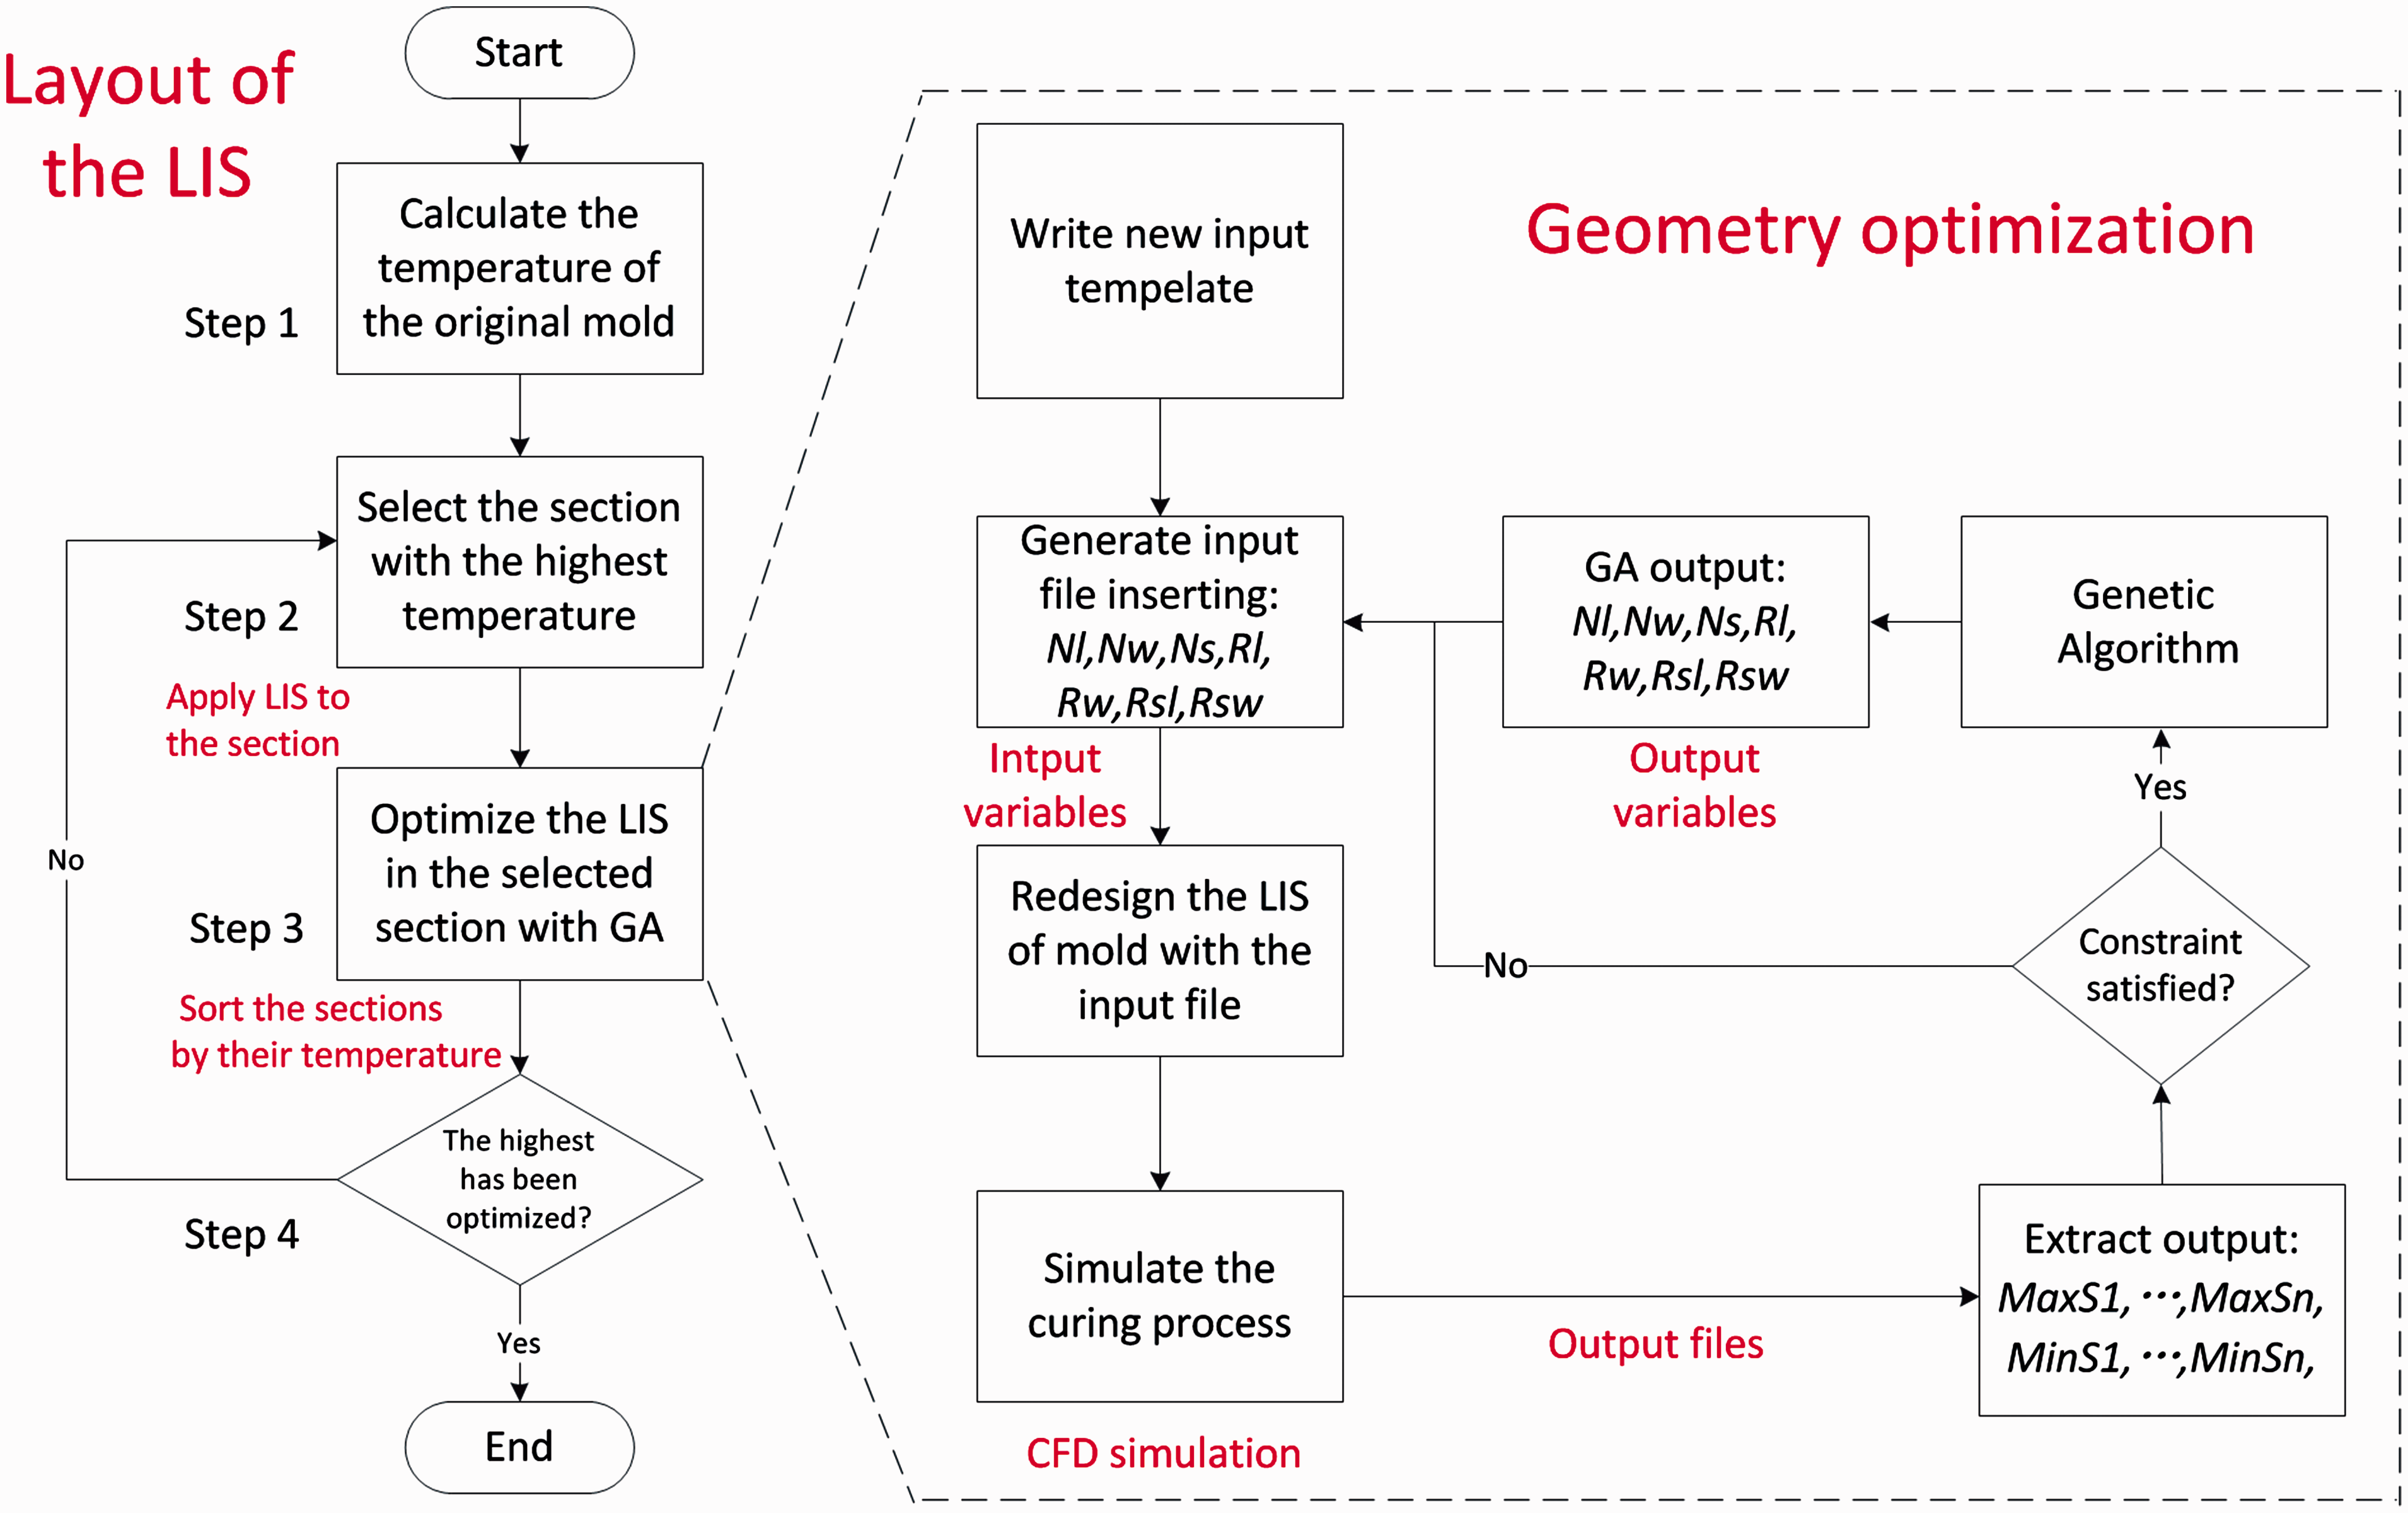
While the greedy algorithm deals with the layout problem of the LIS, the GA is utilized for optimizing their geometry, which is in step 3. The aim of the process is to provide a more uniform heating environment for laminates by reducing the local HTC between the air and the selected section of the mold plate. Therefore, a set of design parameters of the LIS, which lead to a lower heating rate of the selected section, should be found with the optimization process. To reduce the maximum temperature difference within the laminates, the temperature profiles of the mold plate are obtained at the moment when the highest temperature gradient occurred in laminates with the original mold, and the objective of the optimization can be written as
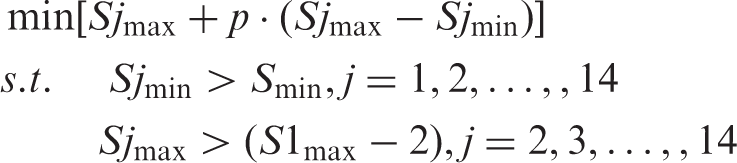
The objective of the optimization of each section contains two terms– the maximum temperature of the selected section Sj (Sjmax) and the maximum temperature difference within the section (Sjmax - Sjmax). A penalty factor p is used in the second term to represent the influence coefficient of the local temperature difference inside the selected section and it is set to be 0.2 in our optimization process. With the two terms, the heating rate of the section and the heating gradient within the section are simultaneously considered in the optimization process. Meanwhile, the minimum temperature of the selected section (Sjmin) is restricted to be higher than the minimum temperature of all sections (Smin) to avoid reducing the overall heating rate of the mold.
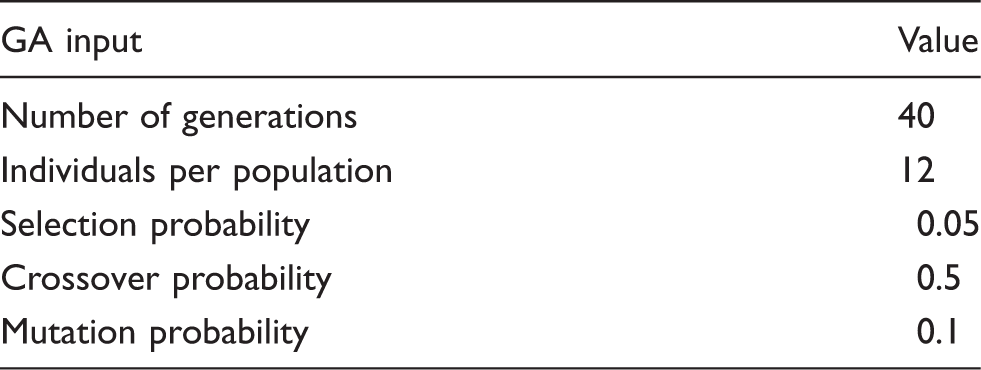
GA parameters used for the optimization.
Result and discussion
The optimization results and final geometry of LIS are illustrated in Figure 9. The result shows that three sections of the mold are redesigned with the optimized structure of LIS and the optimization result of each section can be observed in Table 4. After the LIS of the three sections are optimized, the maximum temperature difference (dTmax) in laminates during the curing process dropped to 23.071 K, 18.741 K, and 15.282 K, respectively. As is expected, notable decrease of air velocity can be found under the mold plate of the redesigned sections (Figure 10).
Optimization results and the final geometry of LIS. Design parameters of the optimal design. Velocity of air: (a) velocity around the original mold; and (b) velocity around the redesigned mold.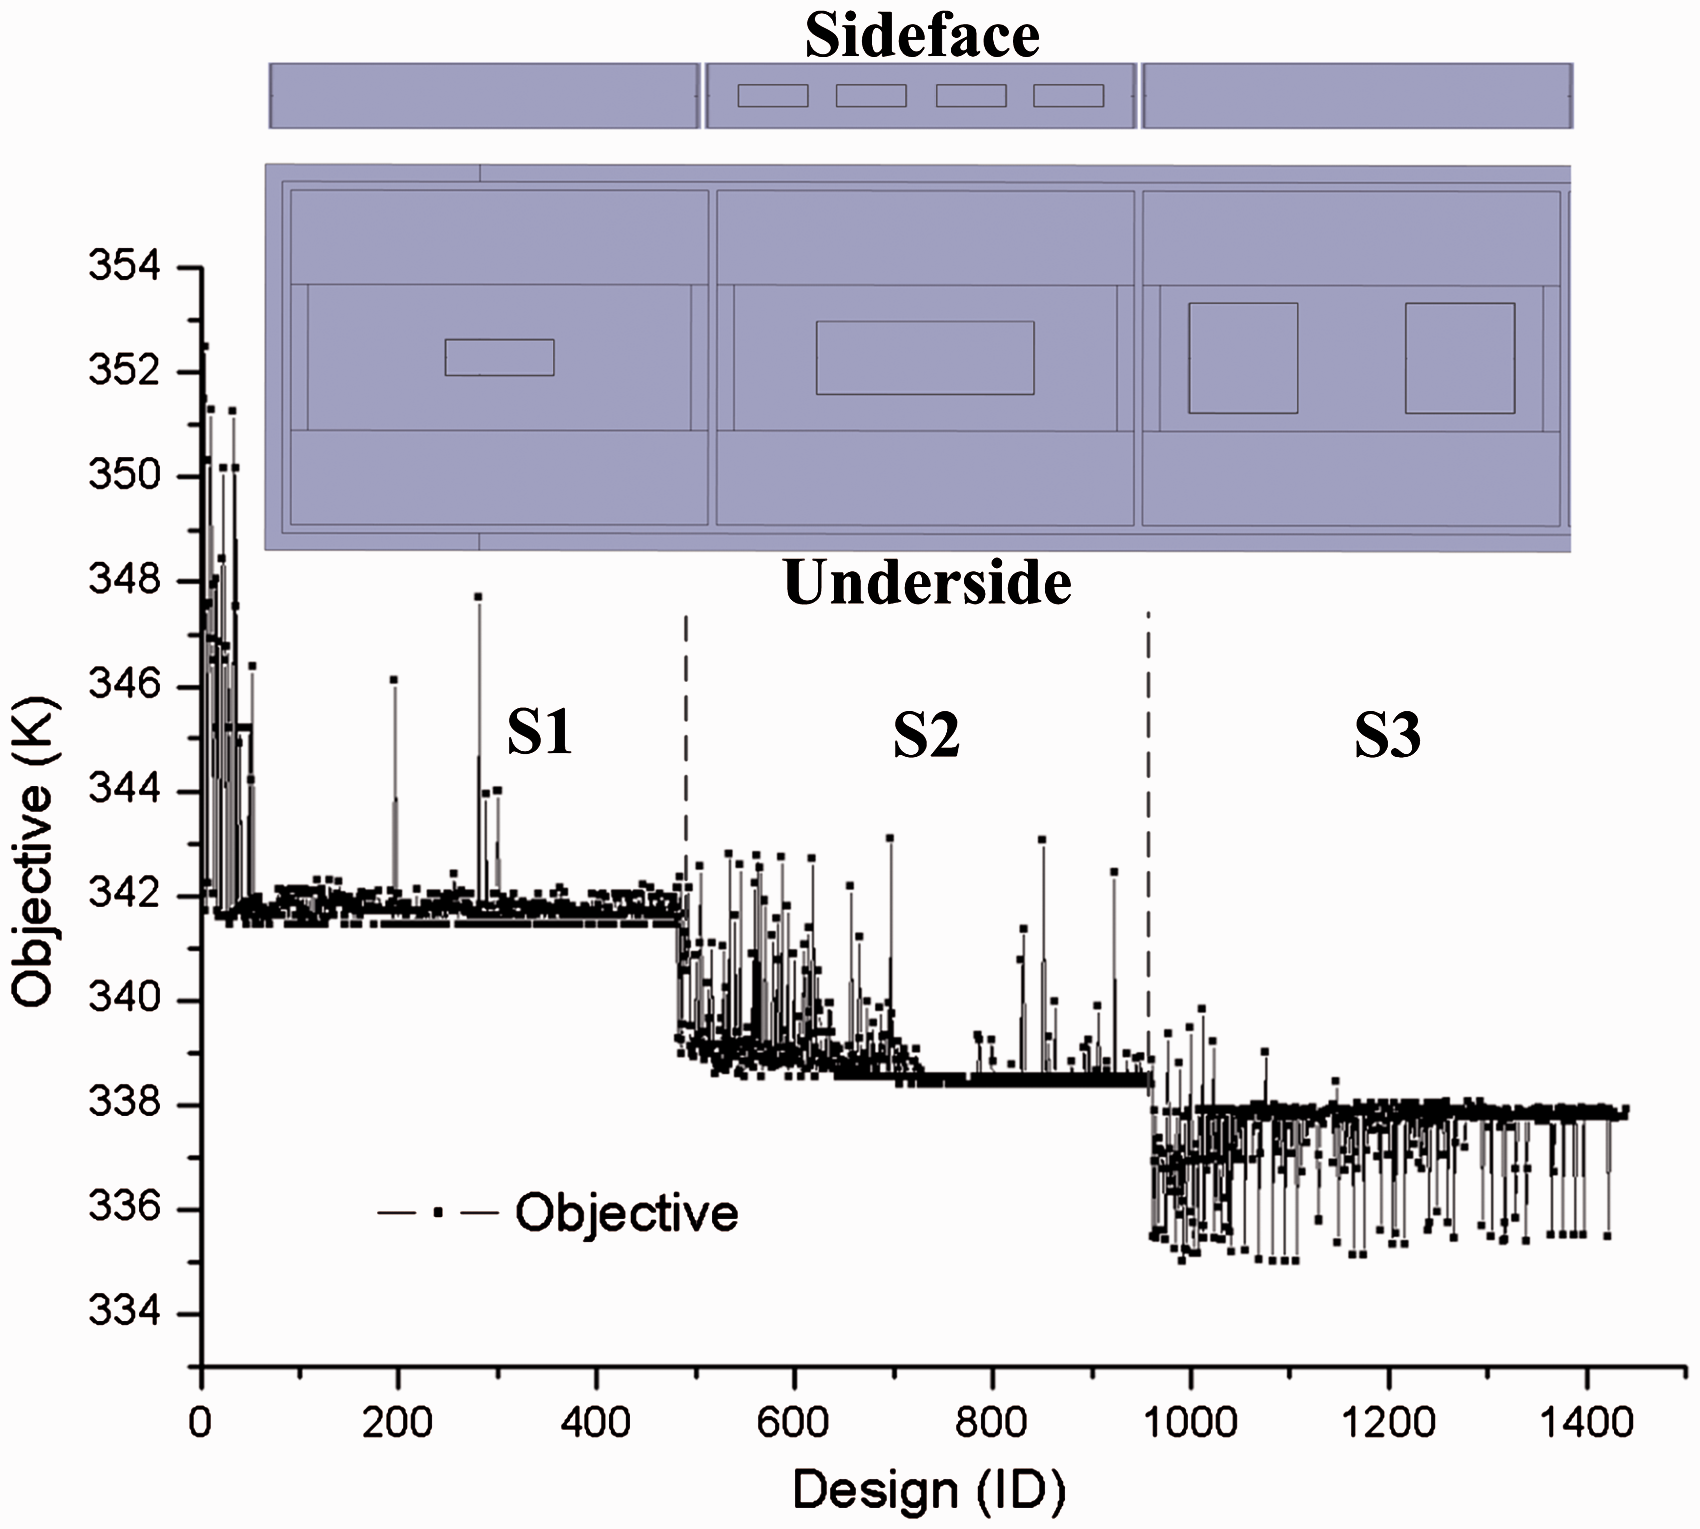
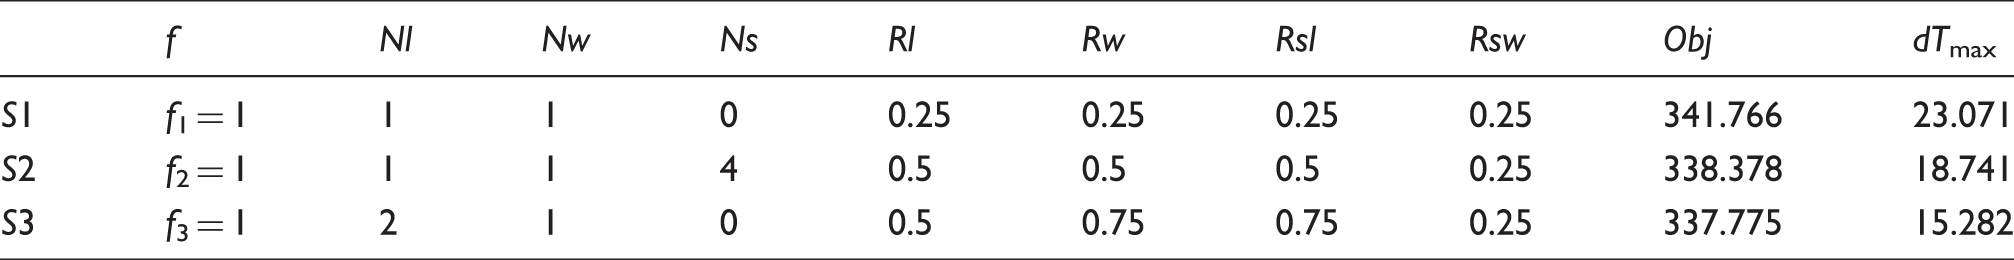
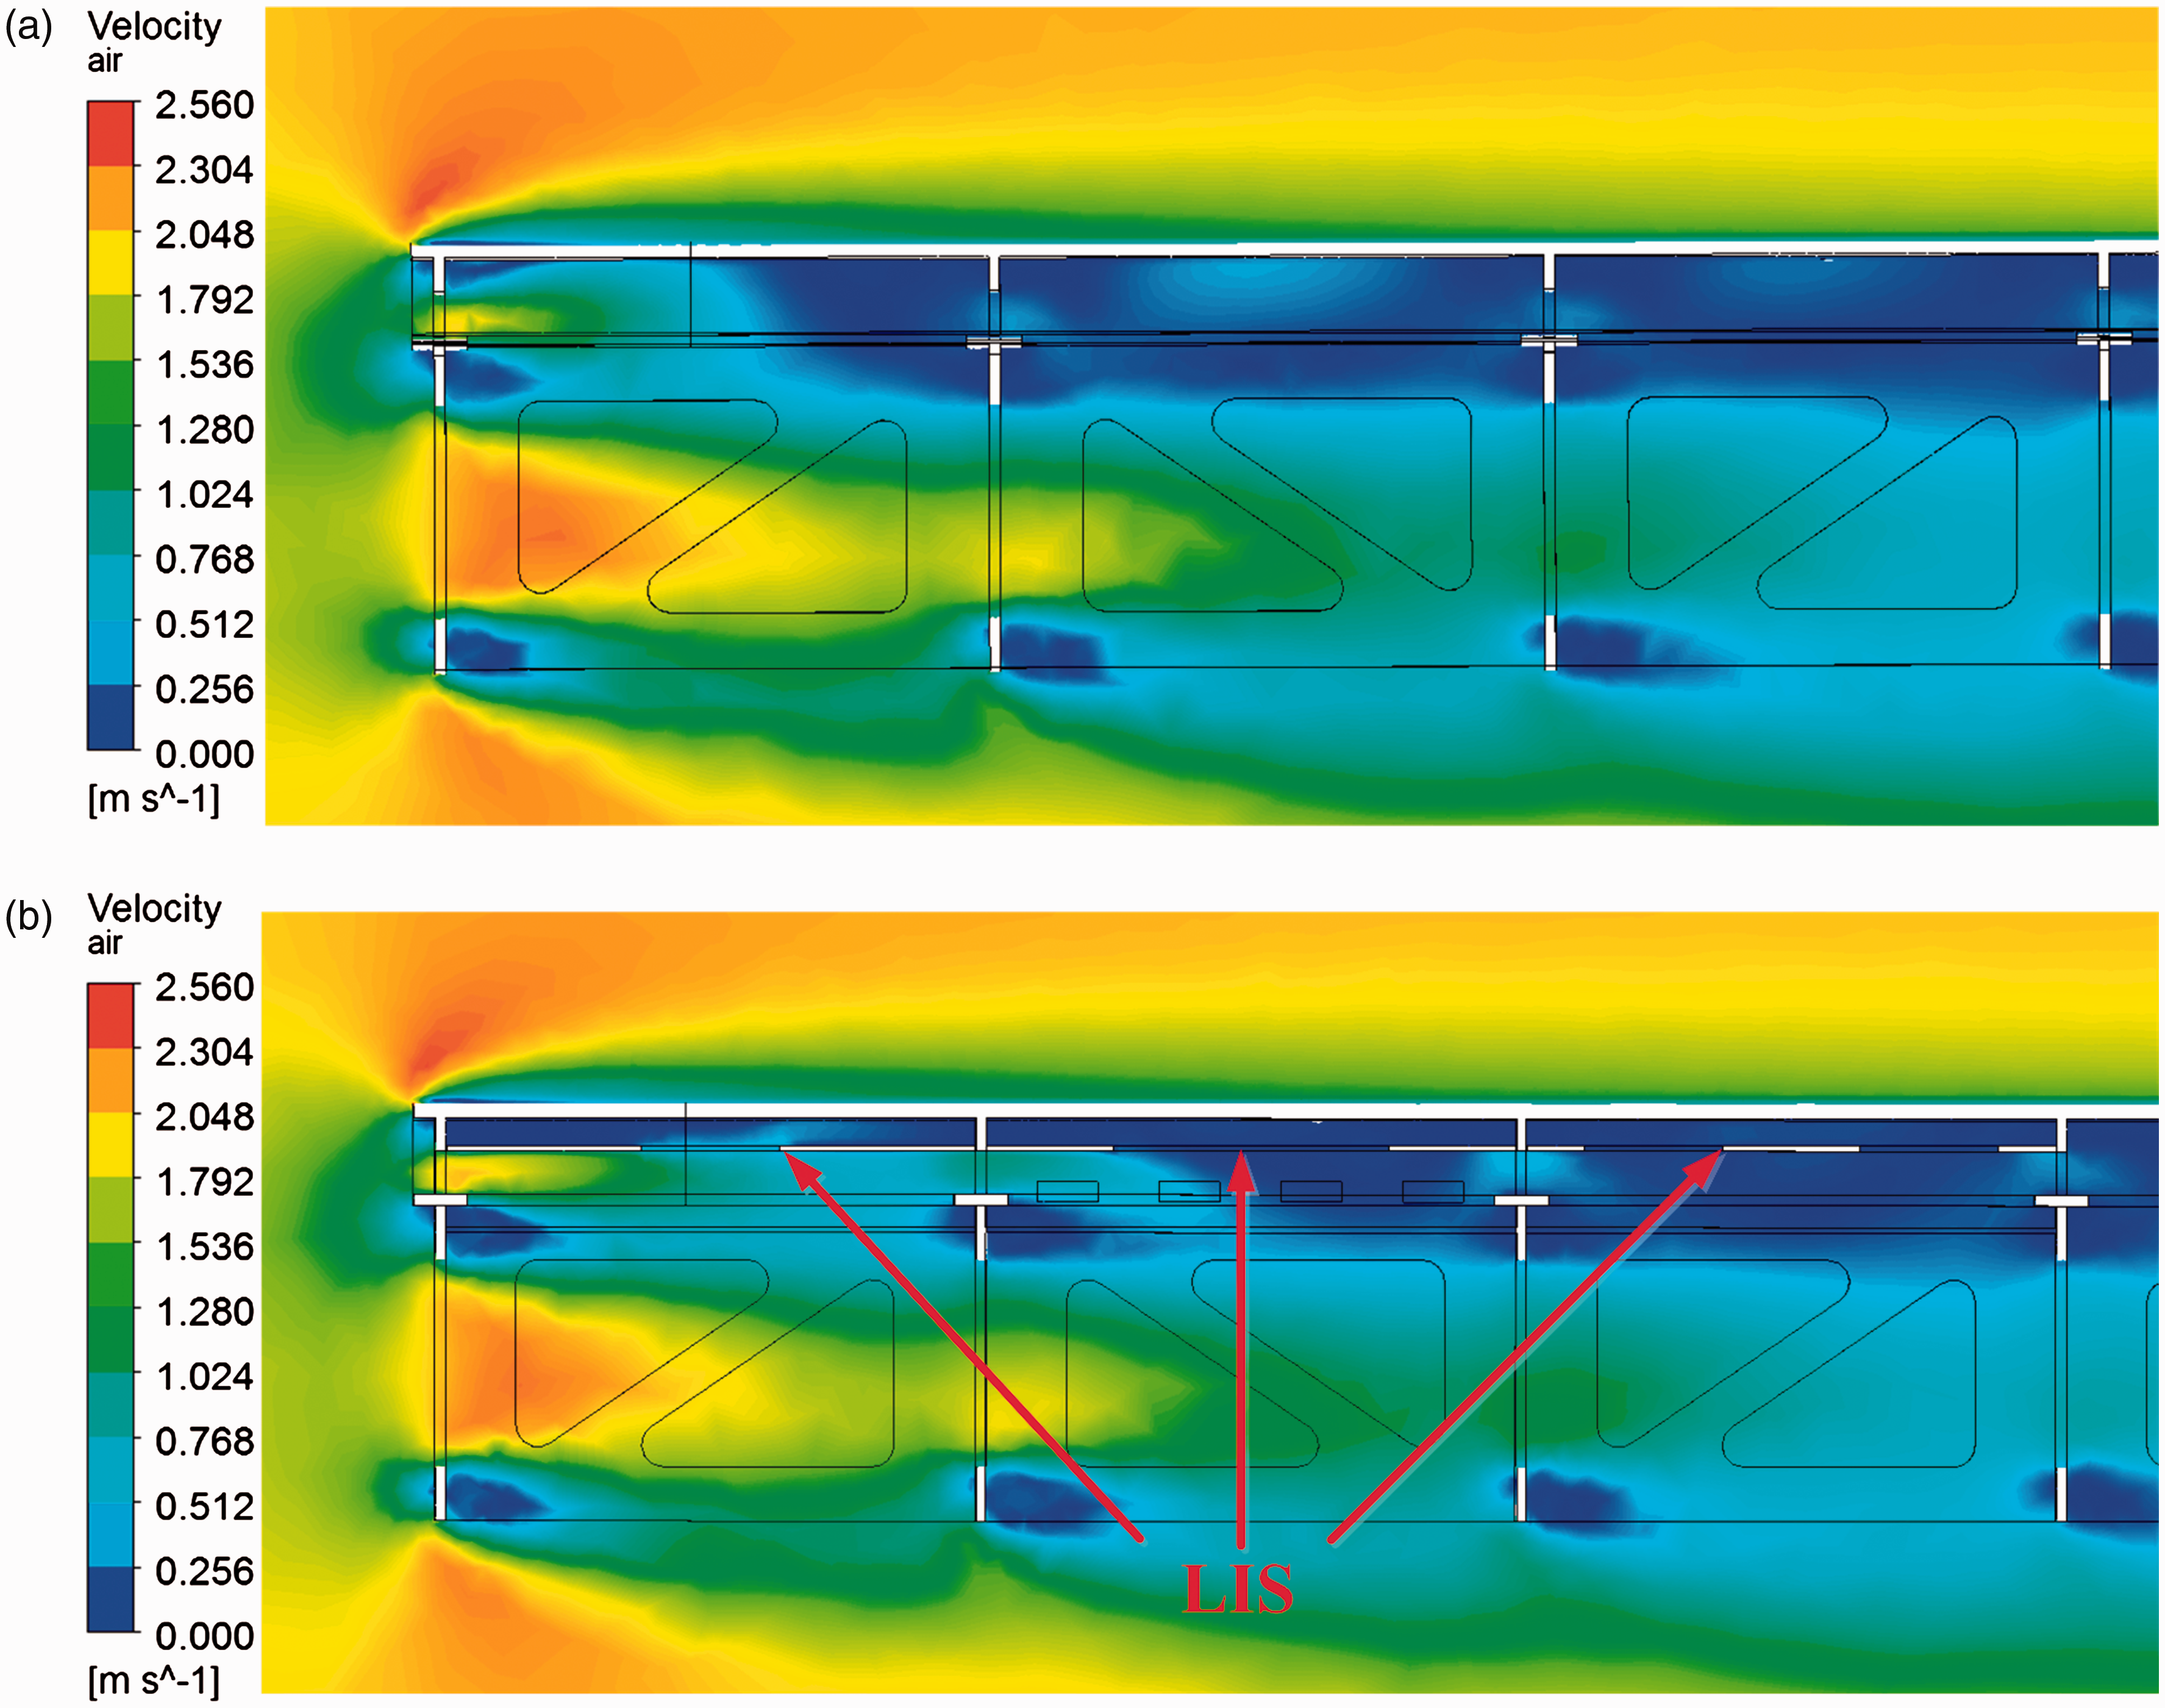
Figure 11 displays the difference in temperature and DoC within the component with different molds. In both designs of the mold, the temperature difference increased in heating phase of the cure cycle and decreased in preserving phase. In Figure 11(a), the maximum temperature difference reached 28.139 K with the original mold, while it is only 15.282 K with the redesigned mold. With the optimal design of LIS applied, the maximum temperature difference within the composite part is 45.69% lower than that with the original mold. In Figure 11(b), the maximum difference in DoC occurred in the second heating phase of the cure cycle. With the redesigned mold, the maximum difference in DoC dropped to 0.237 from 0.396, which is 40.15% lower than that with the original mold. Lower difference in temperature and DoC suggests that more uniform heating process and more synchronous curing process can be achieved with the redesigned mold.
Difference in temperature and DoC of the composite: (a) temperature difference; and (b) difference in DoC.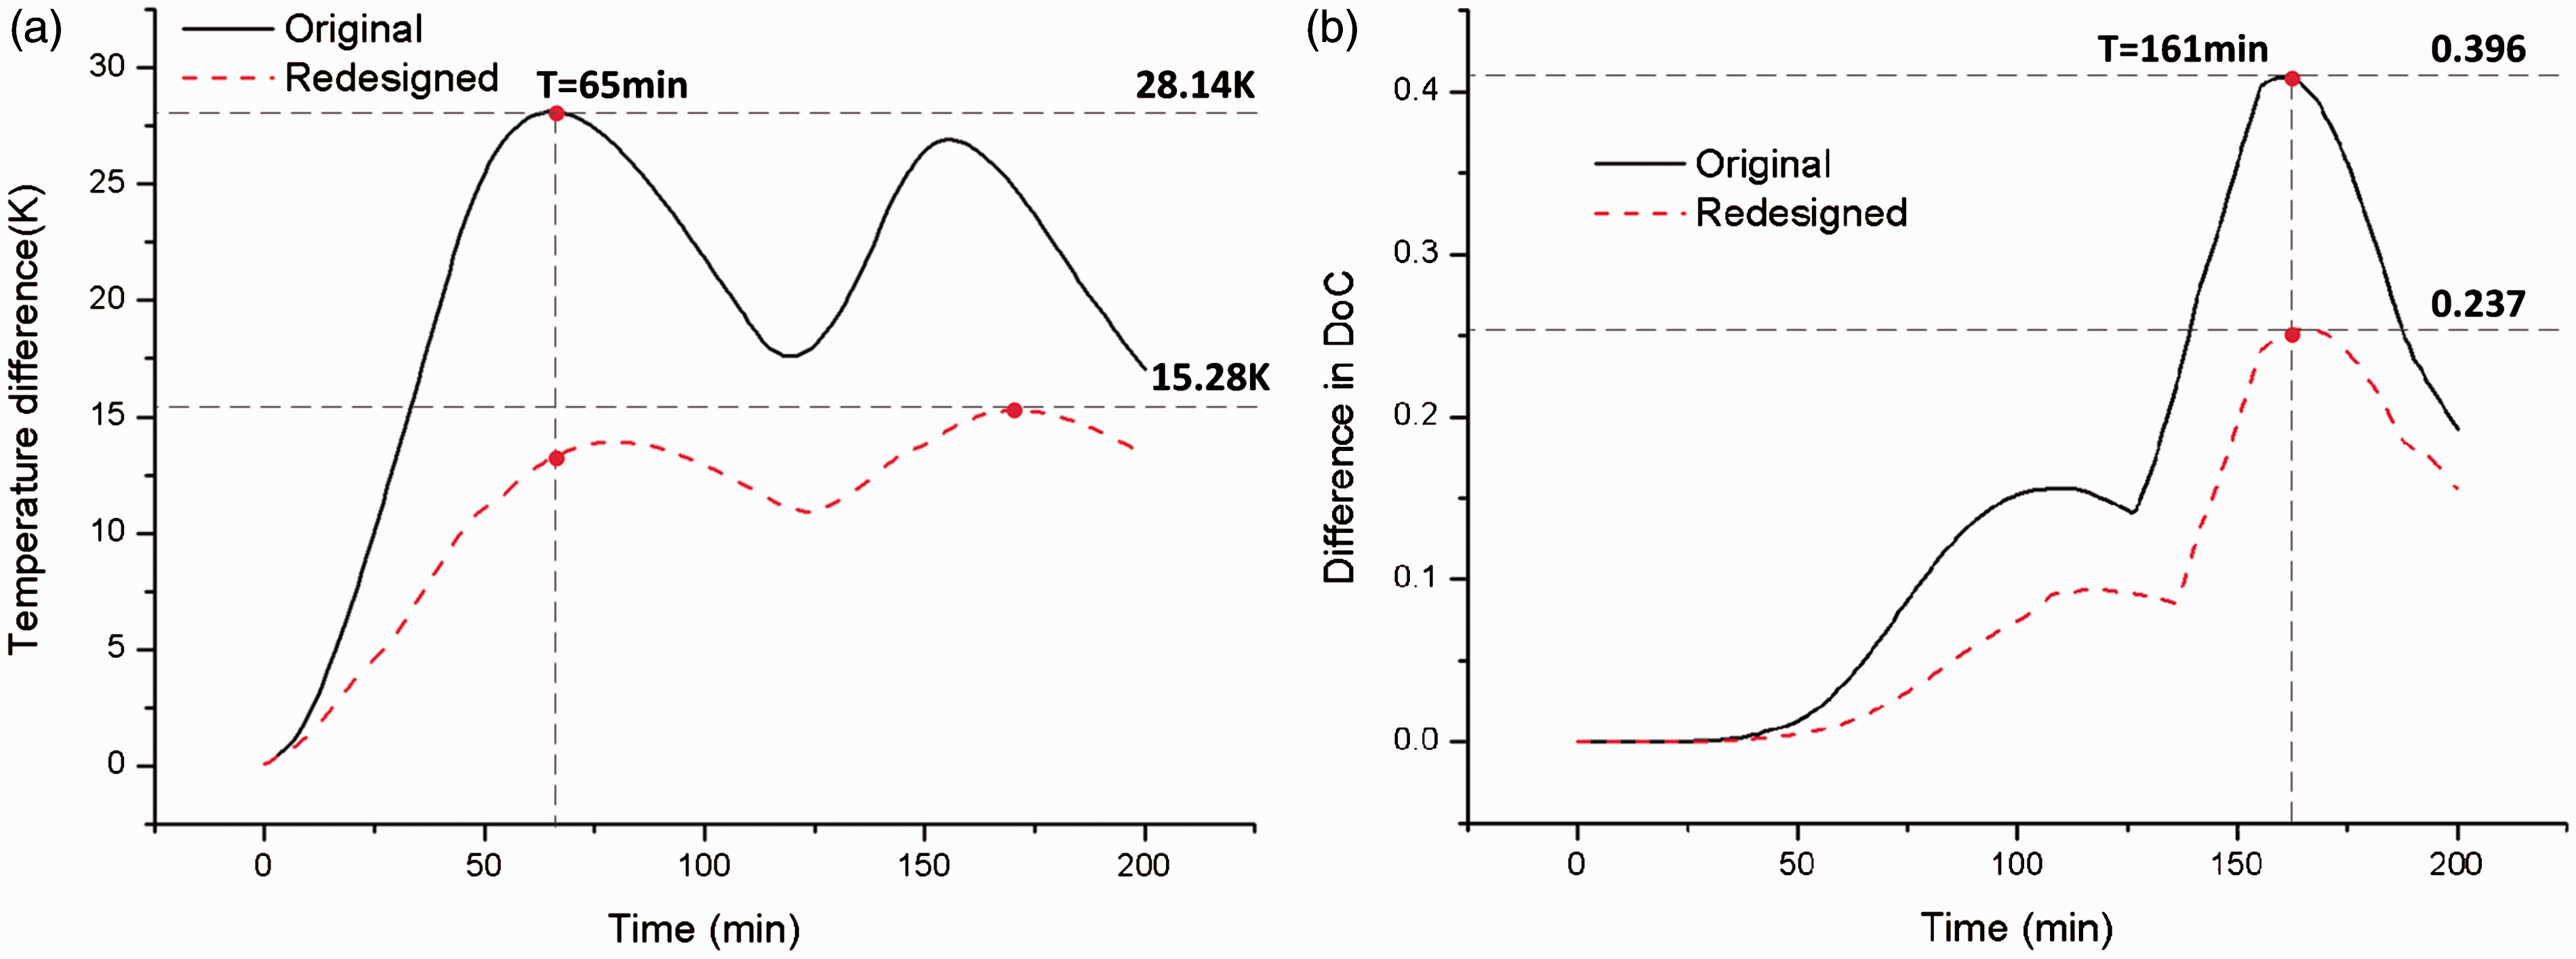
For a better understanding of the effect of the LIS, temperature and DoC of 14 measurement points along the length direction of the component, which is parallel to the flow direction, are obtained in simulations. Figure 12 shows the temperature of the measurement points at 65 min when the highest temperature gradient occurs in the composite part with the original mold. With the original mold, relative high temperature can be observed in measurement points which are close to the leeward end of the mold. After the LIS is applied to the mold, the temperature of measurement points in overheated areas is largely reduced with the redesigned mold. Meanwhile, in sections without the LIS, temperature of the component is almost the same with both molds, which indicates that the heating efficiency of the component is not compromised with the application of LIS.
Temperature of the composite along the length direction at 65 min.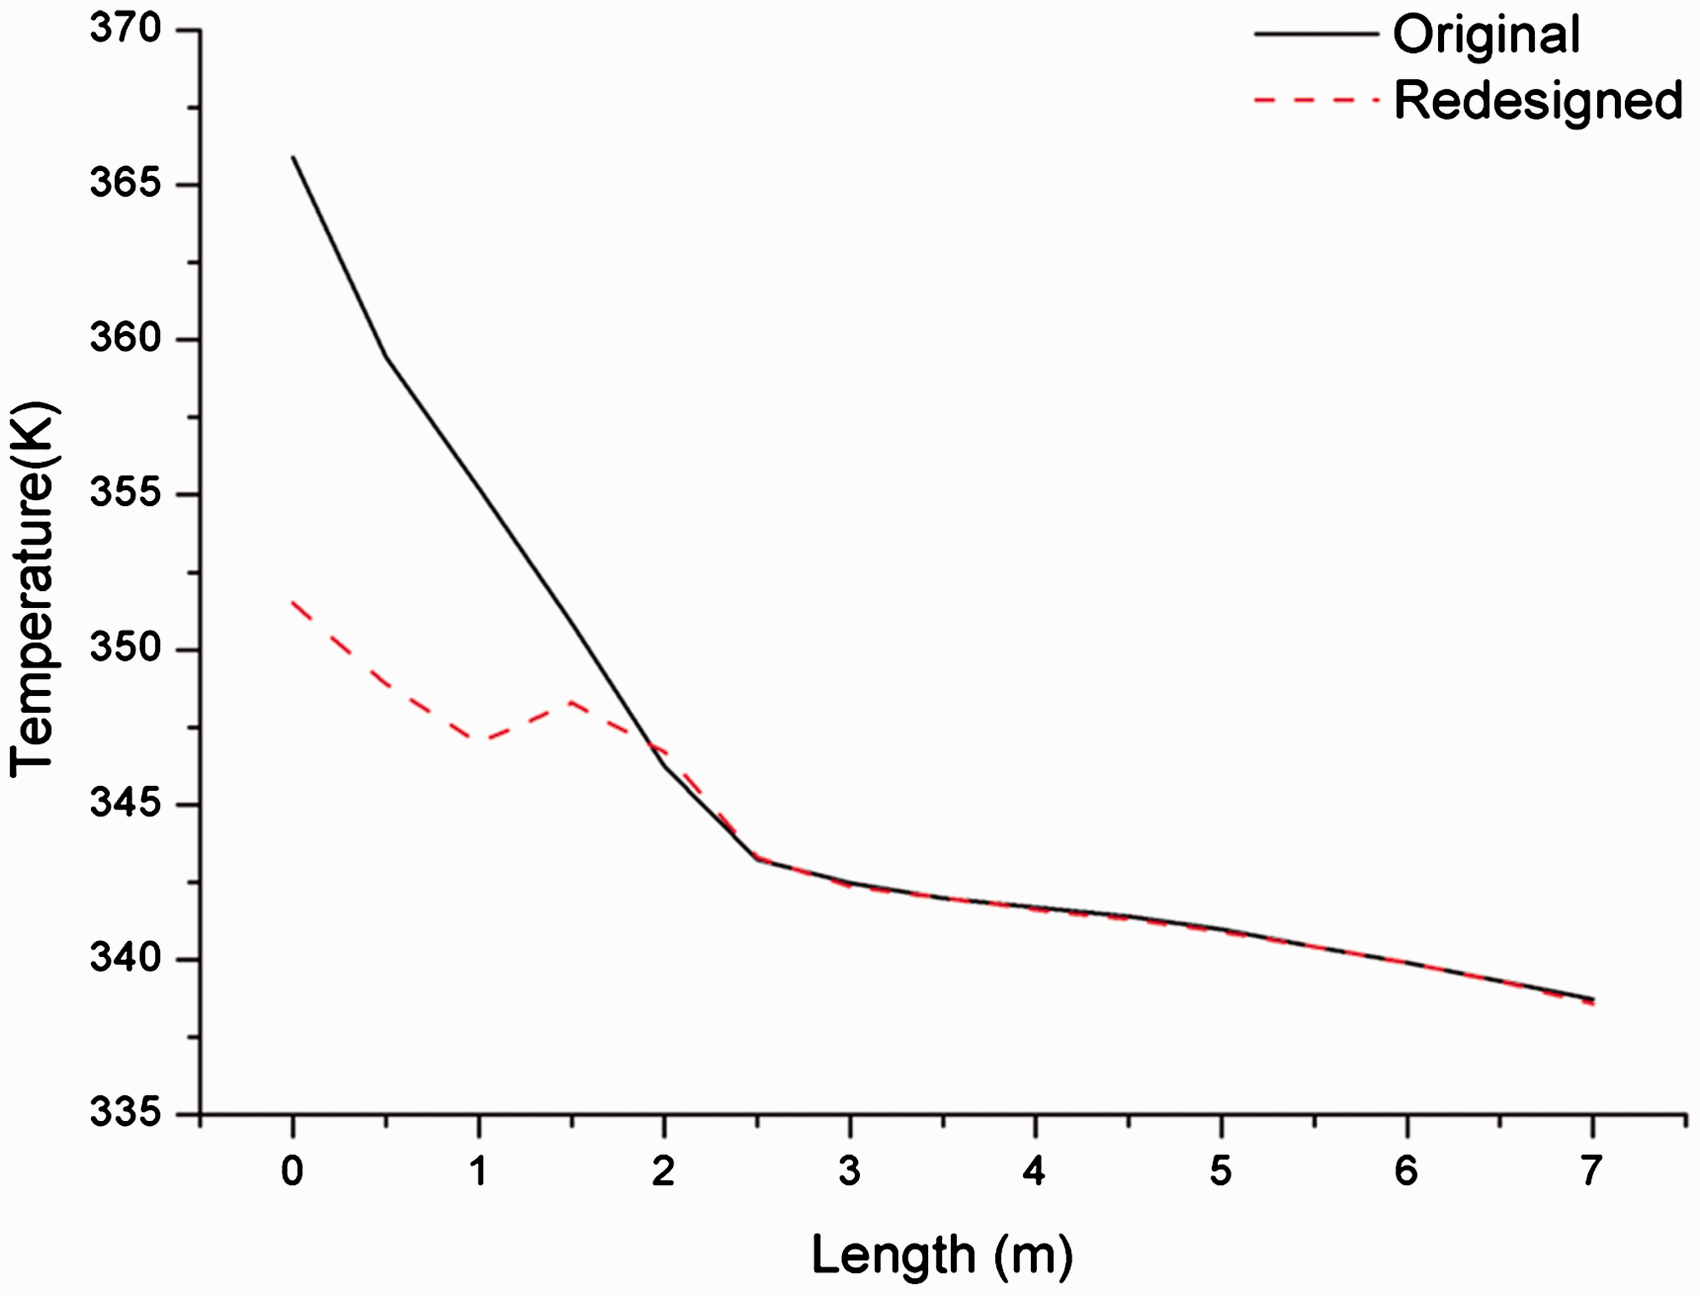
The temperature field of the mold and the composite part at 65 min are shown in Figure 13 with both the original and the redesigned mold. The temperature difference with the original mold is 28.139 K while the temperature difference with the redesigned mold is 13.048 K. At this moment, the temperature difference within the composite part with the optimal design of LIS is 53.63% lower than with the original mold.
Temperature field of the mold and composite at 65 min: (a) with the original mold; and (b) with the redesigned mold.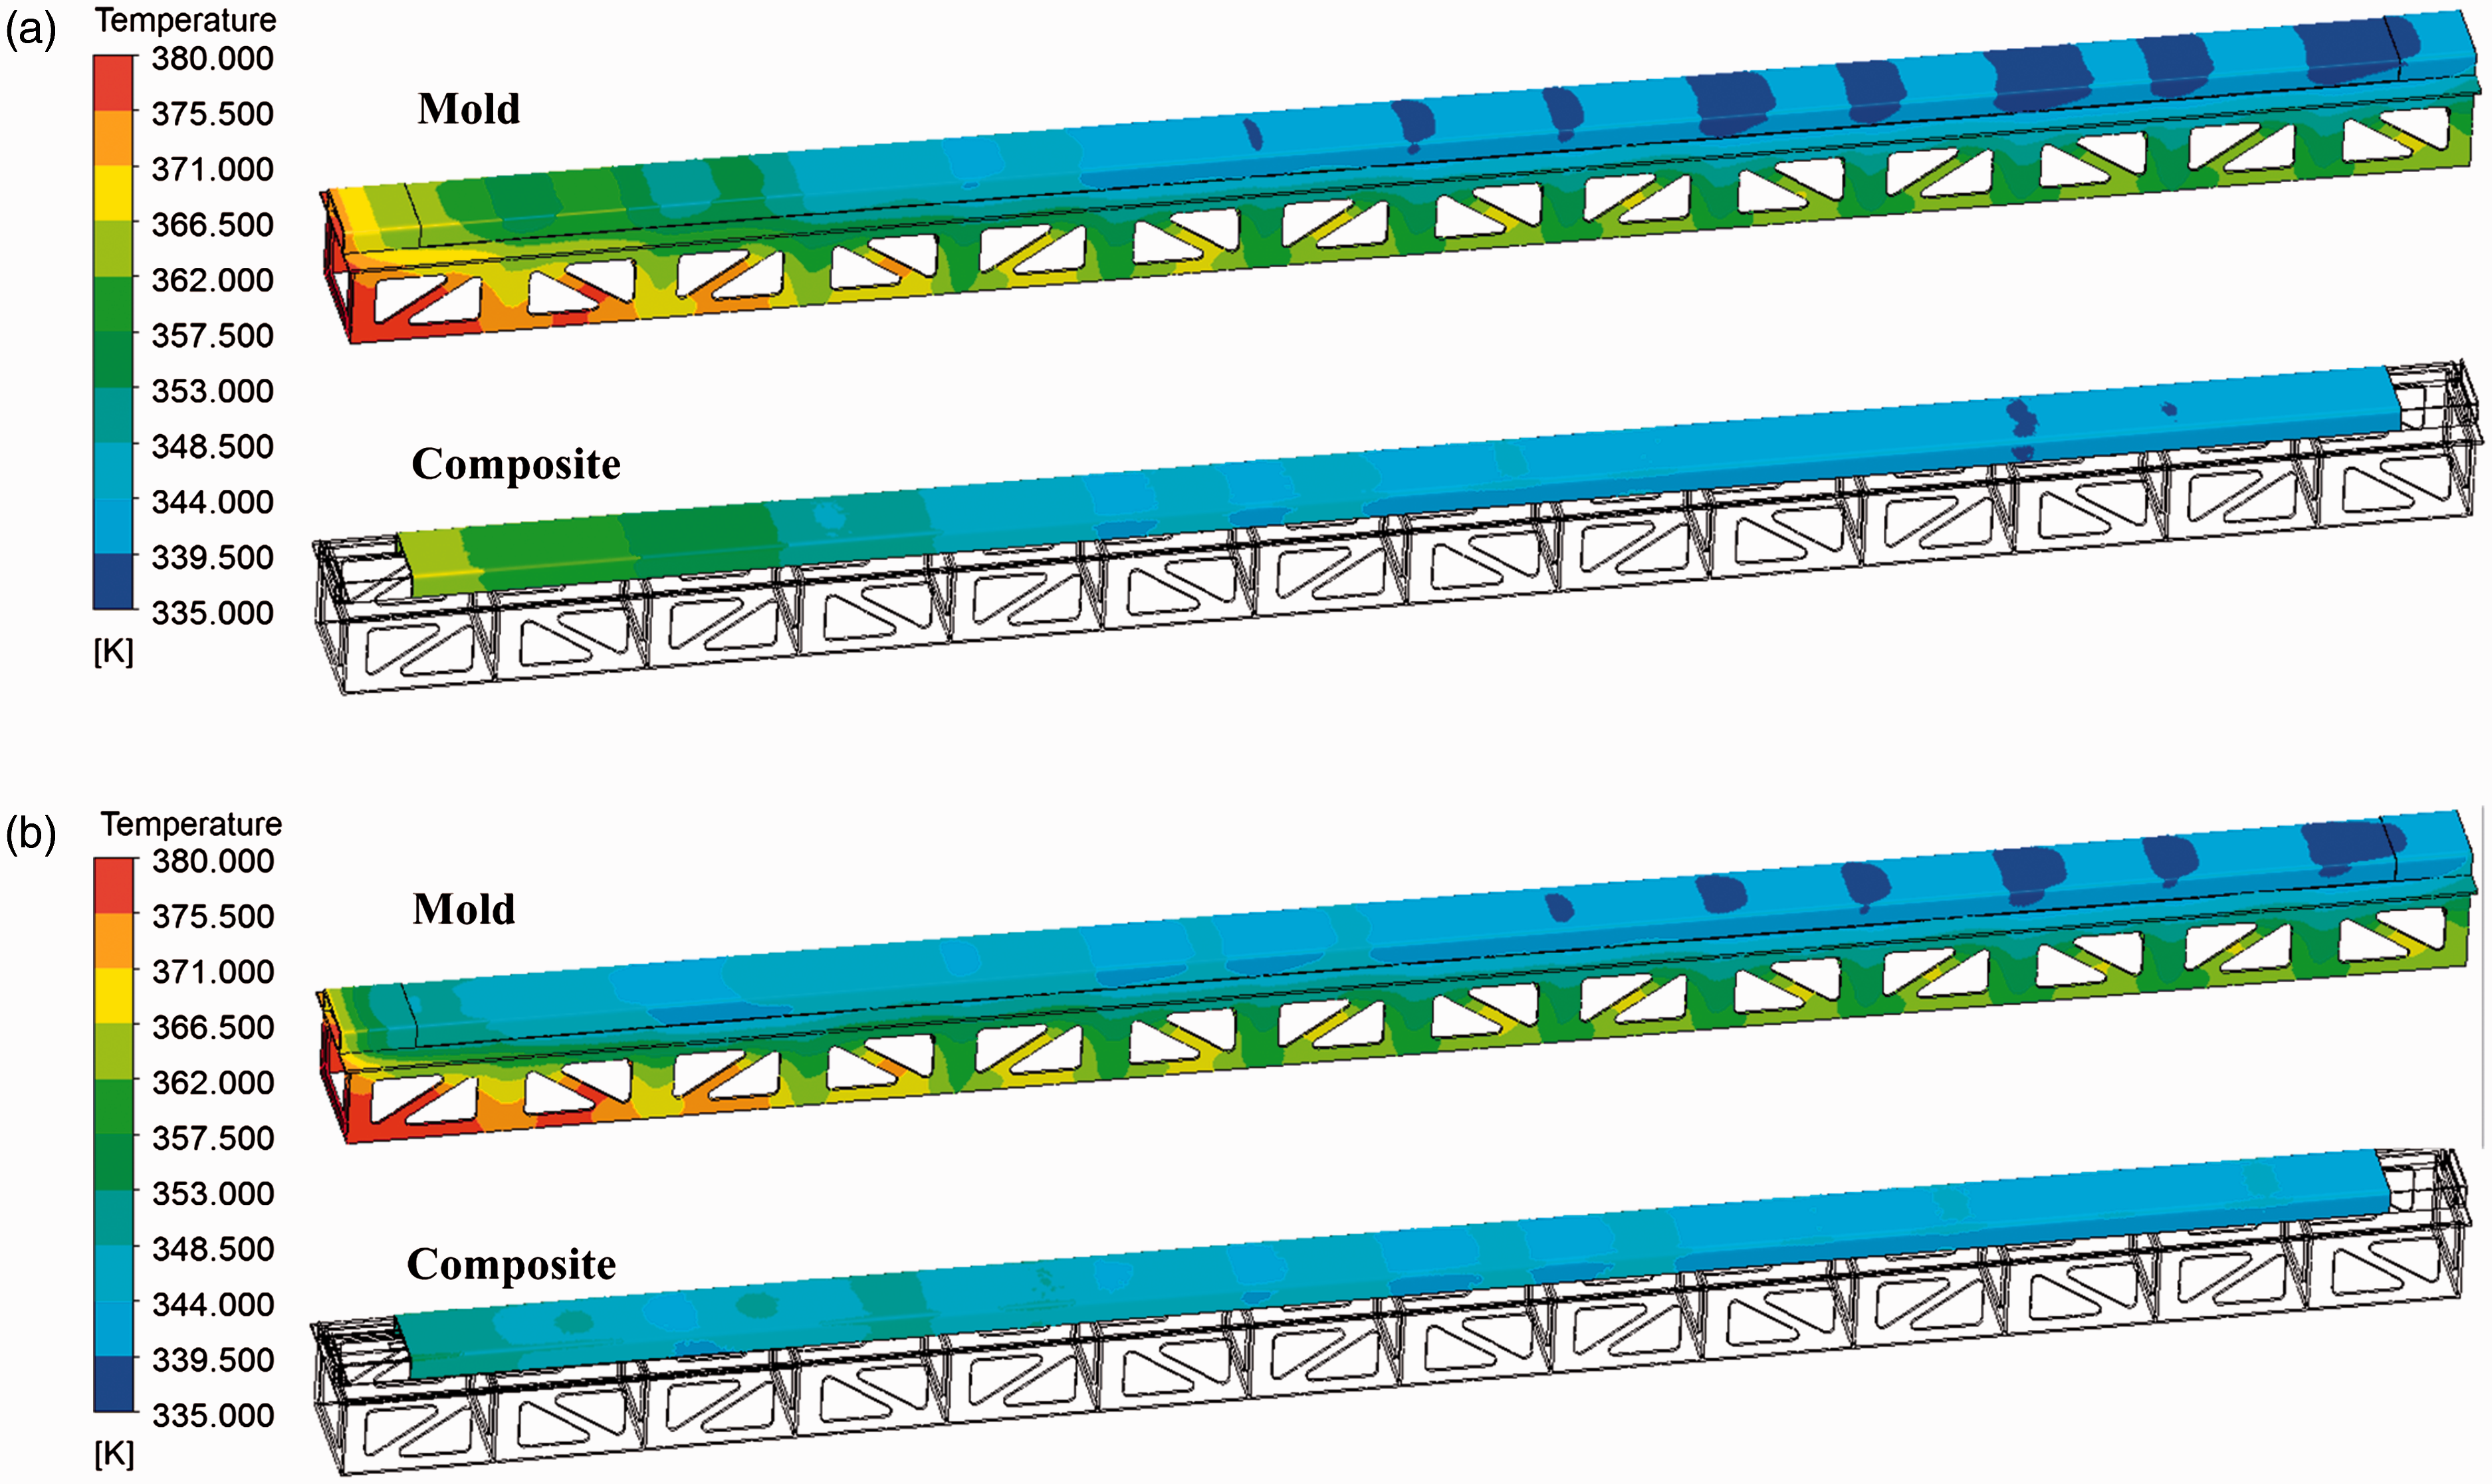
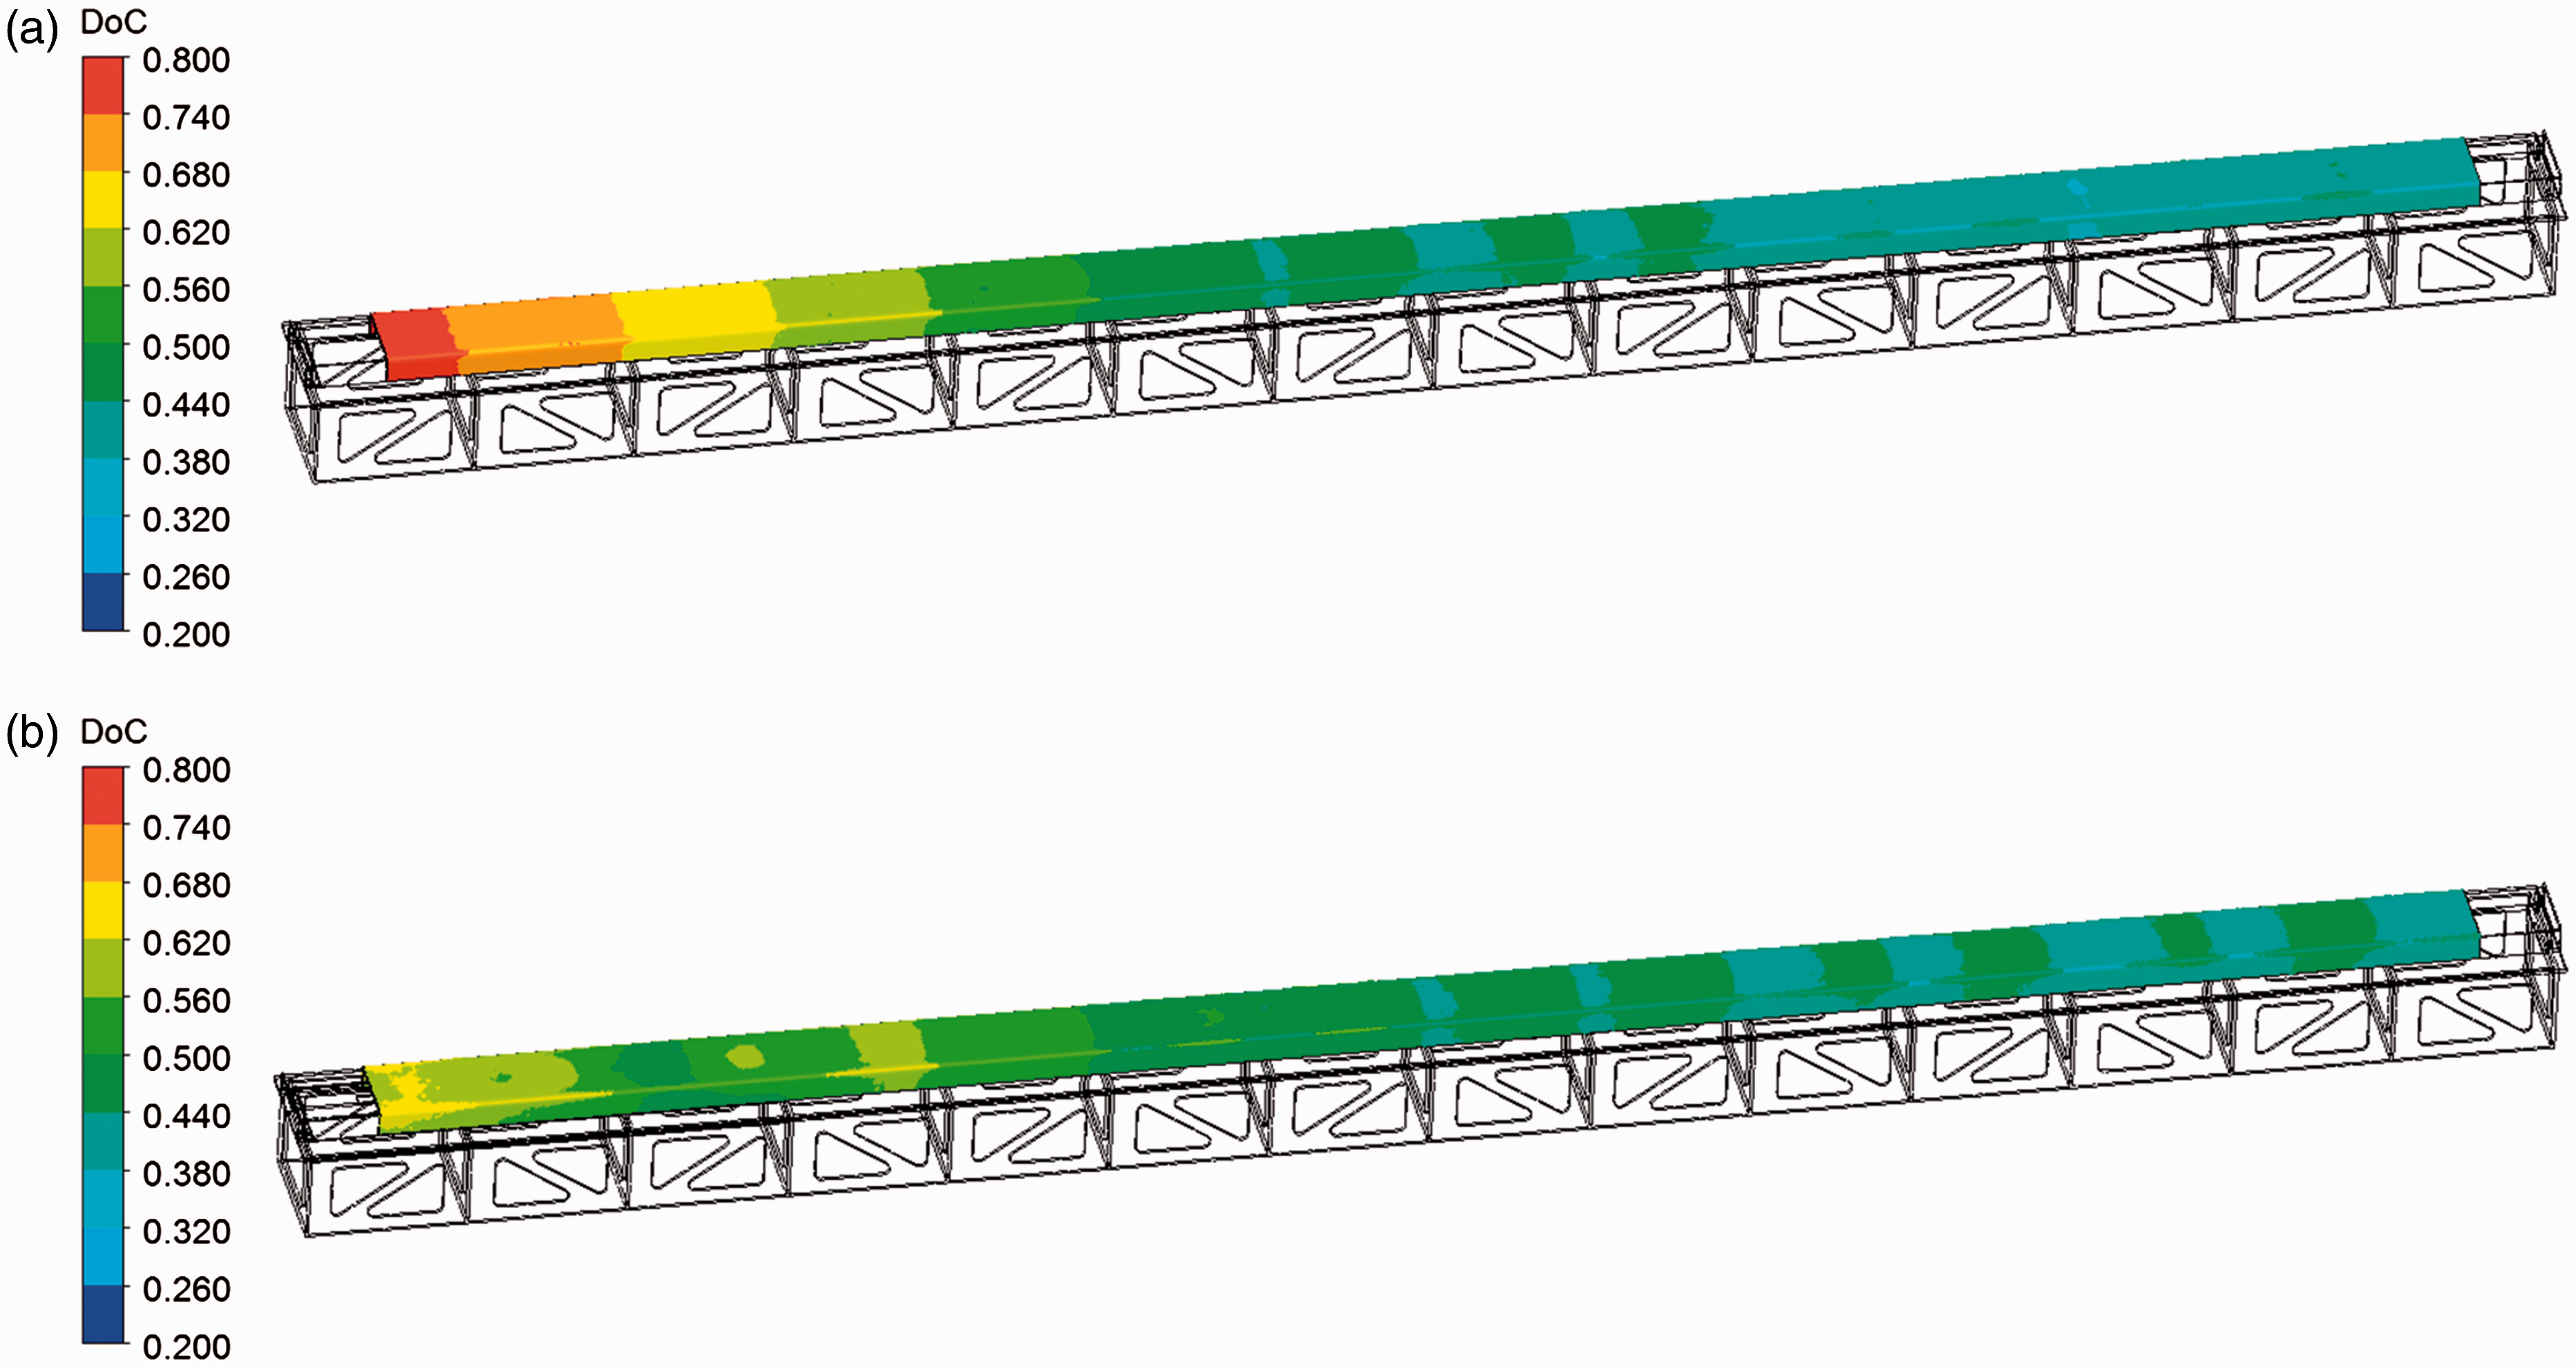
Figure 14 shows the DoC of the measurement points at 161 min when the highest DoC gradient occurs in the composite part with the original mold. With the LIS applied to the mold, the DoC of measurement points on the leeward side of the mold is reduced in a significant degree. Meanwhile, in sections without applying the LIS, the distribution of DoC is similar in both designs of the mold. From the contours of DoC in Figure 15, the maximum difference in DoC within the composite part is 0.396 with the original mold, while it is only 0.237 with the redesigned mold.
DoC of the composite along the length direction at 161 min. DoC of the composite at 161 min: (a) with the original mold; and (b) with the redesigned mold.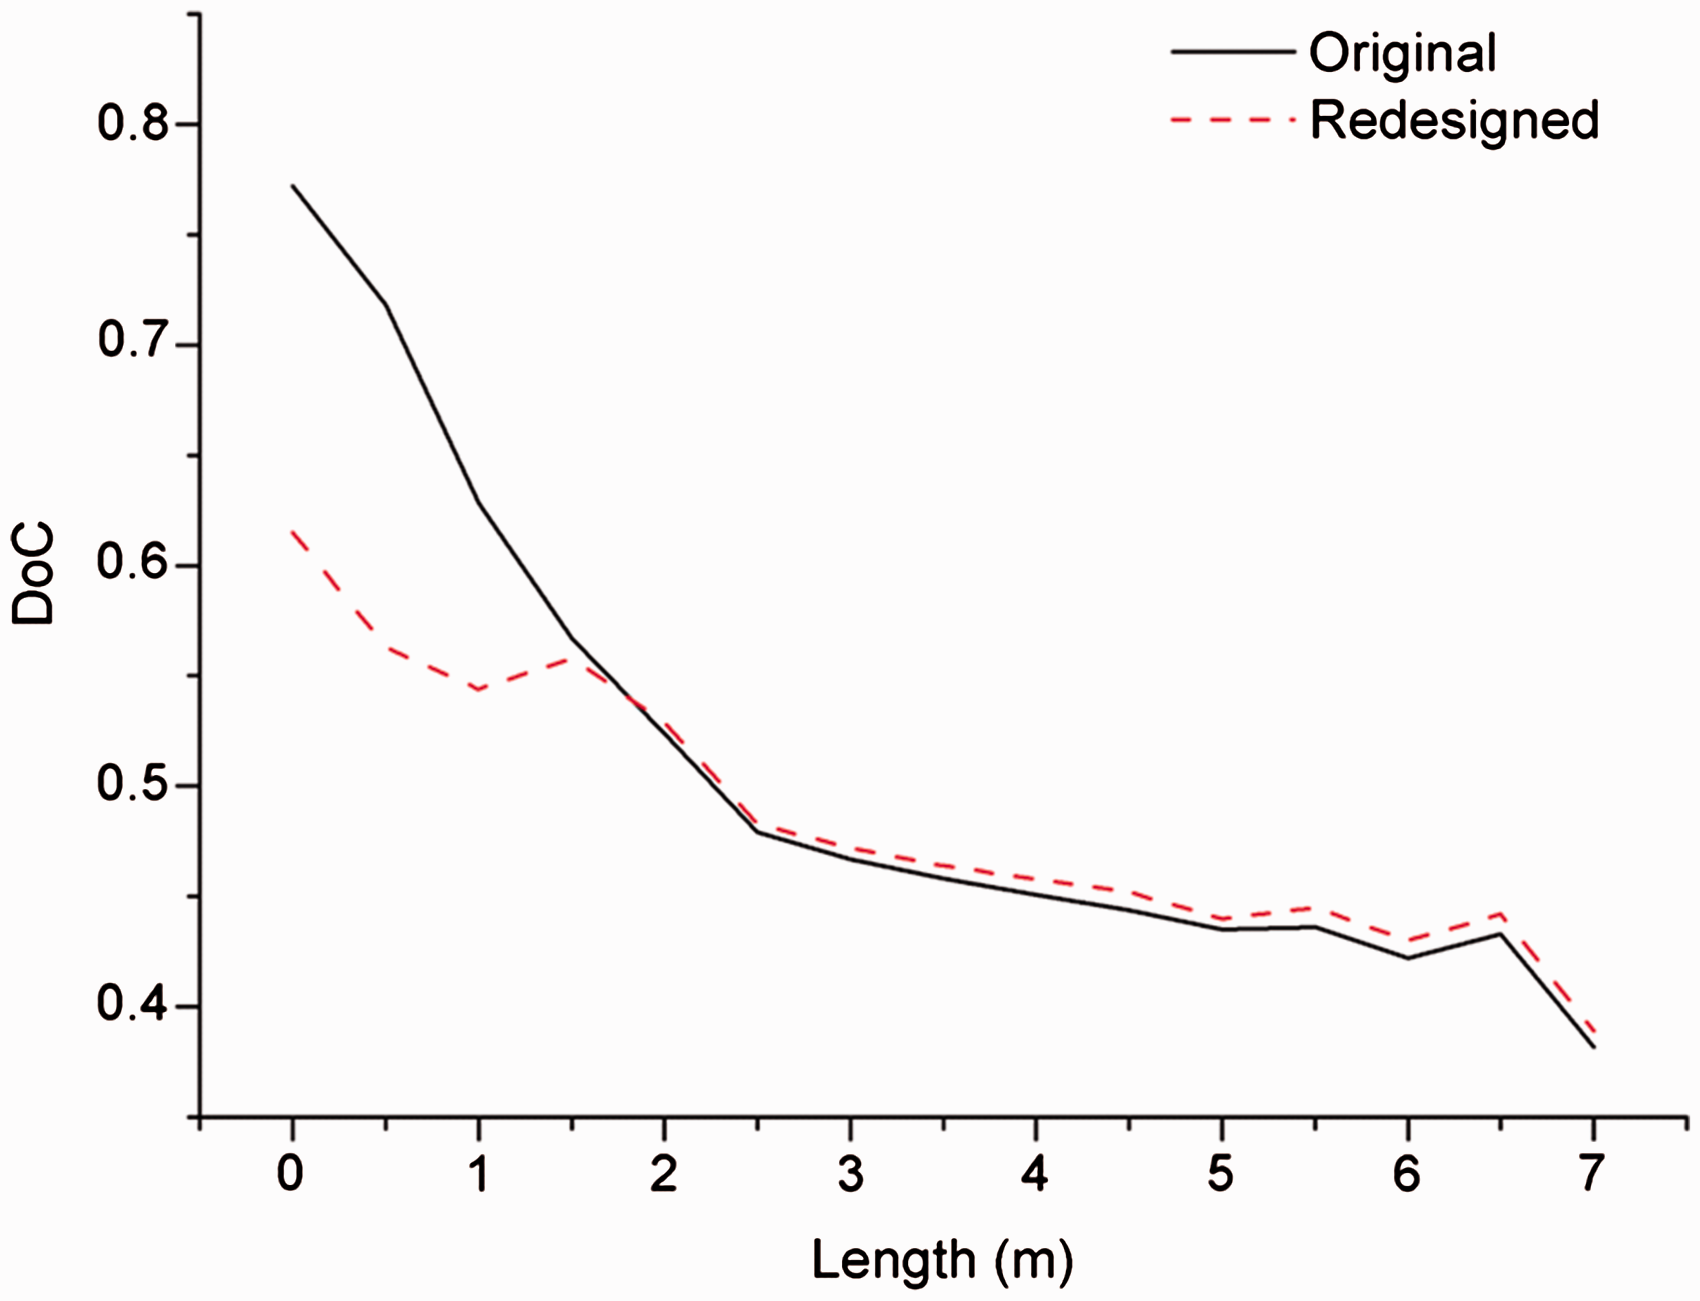
These contour plots show that more uniform temperature and DoC fields are found in laminates with the redesigned mold. The high reduction rates of temperature and DoC differences within laminates also suggests that it is capable of achieving a more homogenous heating environment for the composite part with adopting the presented method.
Conclusion and further work
In this study, a heat-balance method for molds is presented to balance the heating rate in different areas of molds. The method is based on the LIS, which disturbs the air flow under the mold plate to change the local HTC. Then, a mold with large dimensions is redesigned with the LIS and a greedy genetic algorithm is adopted to optimize the layout and geometry of the LIS. With the redesigned mold, the maximum temperature difference inside the composite part is reduced by 45.69% while the maximum difference in DoC is decreased at a rate of 40.16%. The results indicate a more uniform heating condition and a more synchronous curing process in the composite part.
This paper provided a novel heat-balance method and presented a way to optimize it. The curing performance of composite is largely improved with applying the LIS for the mold. Meanwhile, as the LIS can be designed and manufactured after the fabrication of mold, the application of the LIS is efficient and adaptive for different molds. In future works, more experiments are needed to verify the relationship between the LIS and the HTC. Moreover, the optimization target can be further discussed to meet the requirements of different processes. With the heat-balance method, more homogeneous curing process can be potentially achieved in various shapes of composite components.
Footnotes
Declaration of Conflicting Interests
The author(s) declared no potential conflicts of interest with respect to the research, authorship, and/or publication of this article.
Funding
The author(s) disclosed receipt of the following financial support for the research, authorship, and/or publication of this article: This study was supported by the National Natural Science Foundation of China (Grant nos. 51375442, 51521064, 51675479) Ministry of Industry and Information Technology (Grant no. MJZ-2015-G0-081) for special scientific research for civil aircraft, and the Fundamental Research Funds for the Central Universities (Grant No. 2017FZA4002).