






Abstract
In this study, the influence of type of carbon fiber, sizing amount on the fiber surface and the degree of compaction on the through-thickness electrical resistivity of dry unidirectional carbon fiber tows is investigated to validate the conduction pathways and mechanisms proposed by our previously reported micromechanics electrical resistivity model. An automated experimental setup has been developed and implemented, which measures the electrical resistivity and fiber volume fraction of carbon fiber tows under compression in real time. An extensive experimental study is conducted with five types of commercial PAN-based carbon fibers which vary in fiber diameter, number of fibers in a tow including two unsized fibers and three sized fibers with sizing amount of 0.25% and 1.0% by weight. The fiber volume fraction was increased by compacting the fiber tows using a mechanical testing system (Instron, Norwood, MA). The results show that the fiber sizing and fiber volume fraction impact the through-thickness electrical resistivity of carbon fiber tows. Sized fibers demonstrate 1–2 orders of magnitude higher electrical resistivity than the unsized fibers at lower fiber volume fractions (below 45%), while at higher fiber volume fraction (60%–70%), the electrical resistivity of the two fiber systems tends to be of similar magnitude. Fibers with more sizing (1 wt.%) demonstrated 10 times larger through-thickness resistivity than those with less sizing (0.25 wt.%), indicating the significant impact of fiber sizing on electrical resistivity. The results show good agreement with our micromechanics electrical resistivity model.
Introduction
The fundamental understanding of the electrical properties in carbon fiber-reinforced plastics (CFRP) is critical in applications where the structure is subjected to electric fields (e.g. lightning strike, electrical heating, etc.) or during health monitoring where resistivity changes are used to predict the change in their structural performance. Recently, smart structures that can detect1–3 and even repair4,5 defects using carbon fibers as embedded sensors have attracted attention. Other applications that utilize the electrical properties of carbon fibers include composite antennas, 6 composite structures with electromagnetic shielding ability 7 and integrated heating.8,9 The electrical behavior of CFRP under lightning strike conditions has been studied for aerospace applications 10 and provides insight into direct (structural) and indirect (equipment) damage modes as the lightning current propagates in the aircraft and/or into other conductive components (electrical circuits, wiring, etc.).
Electrical conductivity of CFRP is highly anisotropic with out-of-plane resistance several orders of magnitude higher compared to the in-plane values. Carbon fibers provide the continuous current flow pathways in fiber directions, while the high resistivity of the matrix lowers the effective conductivity of the CFRP in the transverse direction. The conduction path transverse to the fiber direction (out-of-plane and in-plane transverse) is due to the fiber waviness which creates fiber-to-fiber contact points between neighboring fibers. The current travels along the individual fibers before crossing to the next parallel fiber at the contact location. This route is repeated until the current reaches the opposite surface, thus extending the tortuous conduction pathway resulting in increased resistivity. 11 Electrical behavior of CFRP depends on the fabrication process12,13 and resulting fiber volume fraction. 3 The pressure cycle has two-fold influence on the transverse resistivity of carbon fiber tows: (1) pressure compresses the carbon fiber tows increasing the fiber volume fraction, resulting in increased number of contacts between fibers and (2) processing pressure determines the local fiber-to-fiber contact force and thus contact area, decreasing contact resistance between fibers.
There exists limited literature on the through-thickness resistivity of CFRP and dry carbon fiber tows. Athanasopoulos and Kostopoulos 14 investigated the in-plane electrical conductivity of UD carbon performs under constant and uniform pressure and proposed mathematical expression to describe the conduction behavior. Wang and Chung 11 and Curtin 15 have shown qualitatively the dependence of electrical resistivity of CFRP on fiber-fiber contacts due to fiber waviness.
In the present study to validate our micromechanics model, an apparatus that characterizes fiber waviness and measures in-situ electrical resistivity of carbon fiber tows under compression is designed and implemented. Under low current and electric field (much lower than dielectric strength of the resin system), resin in CFRP behaves as an insulator and does not contribute to electrical conduction. Dry carbon fiber tows are thus comparable to CFRP in terms of electrical conduction. The use of dry carbon fiber tows reduces the uncertainties introduced by the curing process and provides better control of material parameter such as fiber volume fraction. The present study is focused on investigating the impact of fiber volume fraction and existence of thin insulation layer on the through-thickness resistivity of carbon composites. Therefore, the dry fiber tows is better suited for our purpose. Although it is impossible to eliminate the impact of the structural change of fiber tows (spreading of fibers for example), the impact can be characterized and reflected by model parameters such as fiber waviness term.
The influence of a composite fabrication pressure cycle is represented by normal pressure applied by a mechanical testing system (Instron, Norwood, MA) to the fiber tow stack. A systematic study of the through-thickness resistivity of carbon fiber tows under compression has been conducted and provides further insight into the fundamental conduction mechanisms of dry carbon fibers which is an important component of the CFRP. A model describing the fundamental electrical transport mechanisms has been implemented by Yu et al. 16 and predicts the electrical resistivity as a function of fiber properties and fiber tow microstructure. The proposed model is tested in this study to validate the electrical behavior of carbon fiber tows in the through-thickness direction.
Experimental setup and methodology
Setup
A computer-controlled experimental setup was constructed to measure current, voltage, load, displacement and fiber volume fraction in real time. The system allows continuous measurements of the resistance and compaction state of the specimen. This electrical and mechanical characterization setup (see Figure 1) includes a mini-Instron machine with a load cell for applying and recording the force, a Teflon mold with two copper bars serving as electrodes, a CCD camera to monitor the fiber stack height, a digital multimeter for resistance measurement and a data acquisition system to integrate the results from all the components.
Experimental setup with its schematic for characterization of through-thickness resistivity of carbon fiber tows.
To eliminate the resistance introduced by the connecting wires, the resistance measurements were conducted by four-point method provided by the Keithley 2750 digital multimeter with a measuring resolution of up to 1 µΩ. Two sets of wires were used for current and voltage measurements on the copper electrodes, as demonstrated in Figure 1. The load cell has maximum loading capacity of 500 N with resolution of 1 mN, which transforms into maximum applied pressure of ∼10 bar over the 5 cm by 1.25 cm specimen area (the dimension of copper electrode surface). A custom-designed mold was used to conduct compression testing. The mold consists of a mold base and a mold cover, both machined from Teflon block for electrical insulation. The maximum opening (maximum thickness of fiber tows the mold can hold) of the mold is 1 cm and the surface dimensions are 5 cm by 1.25 cm, as depicted in the insert of Figure 1. Two copper bars of thickness 5 mm serving as electrodes are attached to the bottom of the mold base and mold cover, respectively. The mold has two open ends for real-time fiber volume fraction measurement using a CCD camera (Dino-Lite® Edge). Dry carbon fiber tows are placed in the mold cavity between the two electrodes, and pressure is applied by the Instron machine, ensuring a good contact between the specimen and the electrodes.
The mold was enclosed in an environmental chamber attached to the Instron machine providing a constant temperature environment of ∼25℃. Data were acquired at a rate of 1 Hz using a supervisory data acquisition computer and recorded on the PC for subsequent data reduction.
Specimen preparation and experimental procedure
Specimen parameters.
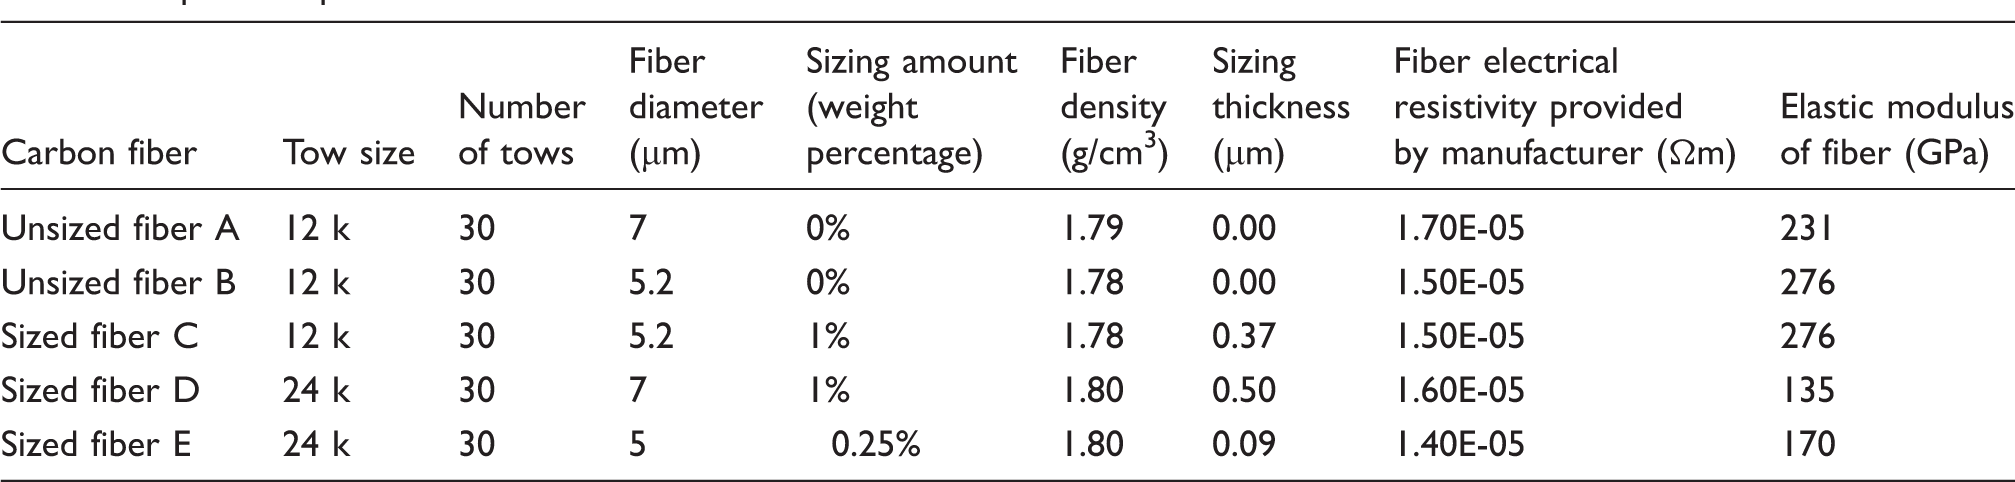
During each test, load applied to the fiber tow specimen is increased from 0 N to 450 N at an increasing rate of 1 N/s. At the final stage of compression, fiber volume fraction increased between 60% and 70% depending on the fiber type.
Previous researches17–19 have shown that resistance from sensing cable and contact between specimens and electrodes can introduce uncertainty in the electric resistance measurement, especially for cured carbon composite laminates.
Zhupanska and coworkers have conducted extensive research on electrical characterization of carbon composite materials.20,21 Various methods were tested to improve the contact quality between tested specimens and electrodes, including adding silver paste and copper tapes. 21 Ideally, a four-probe method is preferable to the two-probe method to eliminate electrode contact resistance from the measurement. While it is feasible to place four probes in the in-plane directions, as was done in literature,17–21 it is not feasible to insert four probes into the dry fiber tow specimens due to (1) limited thickness not fulfilling the requirements of distance between probes and (2) constant change of fiber tow configuration, leading to unstable probe configurations. In this study, Kelvin probes (four probes with current and voltage-sensing cable sharing connection points) are used to exclude resistance from the sensing cables. The electrode contact resistance changes with the compression and relaxation state of fibers and is considered in the model.
A baseline test with two copper bar electrodes touching each other is conducted before inserting the fiber tow specimen between them into the mold. An offset resistance of approximately 0.05 Ω without fibers was measured, which was repeatable throughout the experiments, independent of the applied load. This offset resistance was subtracted from the tow measurements. Before each test, the copper bar electrodes were cleaned and polished with 400 grit sandpaper to maintain a consistent surface roughness.
Specific through-thickness resistivity was obtained by multiplying the measured resistance by the surface area and dividing it by the thickness (the mold opening). The same loading cycle was repeated on each specimen to examine the effect of debulking on through-thickness resistivity.
Characterization of fiber volume fraction
The reading provided by the Instron machine cannot be used to measure the mold height due to the large compliance of the Teflon mold. A CCD camera with microscopic lens attachments recorded images of the mold (Figure 1), and the location of each mold surface was found using an edge detection algorithm. The difference between the two mold surface locations provided continuous reading of the mold cavity height. Accuracy was within one pixel and resulted in better than 10 µm precision (field of view (∼5 mm) divided by the camera resolution of 720 pixels).
Fiber volume fraction Fv can then be calculated using equation (1).

Here, hcavity and wcavity are the height and width of the mold, respectively. The equation assumes that each tow has n fibers based on manufacturer’s supplied data and that all fibers are continuous and have a constant diameter and occupy the entire length of the mold.
The advantage of using a camera to acquire fiber volume fraction is demonstrated in Figure 2, in which the fiber volume fractions calculated using the camera to find the cavity height is compared with the mold opening obtained from the extension data from the Instron machine. The two methods show similar fiber volume fraction Fv when Fv is less than 50%. Loading increases significantly with increasing fiber compaction and the mold compliance results in large error in cavity height measurements using the Instron method. Fiber volume fraction obtained by the camera reaches a limit at 70% under 10 bars of pressure.
Fiber volume fraction calculations using data from Instron and from image processing.
Characterization of fiber waviness
The fiber–fiber contacts form the continuous conduction paths for carbon fiber tows. The number of contact points per unit length on each fiber determines the number of parallel conduction paths and thus determines through-thickness resistivity of carbon fiber tows. Gutowski and Dillon
22
developed a mathematical expression correlating fiber volume fraction and compression state to applied normal pressure based on beam theory. The fiber network is modeled as an assembly of slightly arched beams where the contact points between neighboring fibers carry the applied force. The basic underlying assumptions are that the fibers make multiple contacts with their neighbors along their length, in such a way that the number of contacts increase as the bundle is compressed, and the contact-to-contact length L is proportional to the inter-fiber spacing a, which is arch height h subtracted by fiber diameter d, as shown in Figure 3. The fiber waviness term β is defined as the ratio between the contact-to-contact length L and inter-fiber spacing a.
Schematic representation of fiber waviness.
19


Gutowski relates the deformation of the curved fiber stack to axial and compressive loads. In the case of transverse compression, the functional relationship between compression stress and fiber deformation data is given by equation (2).
Here σz is the stress and E is the elastic modulus of the fiber. At or below a certain initial fiber volume fraction, V0, the fibers carry no load. As fiber volume fraction, Vf, is increased, the network can carry a rapidly increasing load. Eventually, the fiber volume fraction of the network approaches a theoretical maximum based on the fiber packing. The stress becomes infinite when, Vf approaches the maximum fiber volume fraction, Va. When the fiber network is perfectly aligned, Va falls between the limits for a square packing order, Va = 0.785, and hexagonal packing order, Va = 0.907. The fiber waviness term β can be obtained using a three-dimensional least-square optimization fitting equation (2) to the experimentally obtained relationship between compression stress σz and fiber volume fraction Vf. A set of β, V0 and Va values is chosen such that the difference between experimental compression results and Gutowski’s equation is minimal. Good fit to the experimental data for all five fiber types and equation for β, V0 and Va are summarized in Table 2 and shown in Figure 4.
Compaction data as a function of fiber volume fraction for all five fiber types. Fiber waviness and Gutowski fiber volume fraction terms for five fiber types.
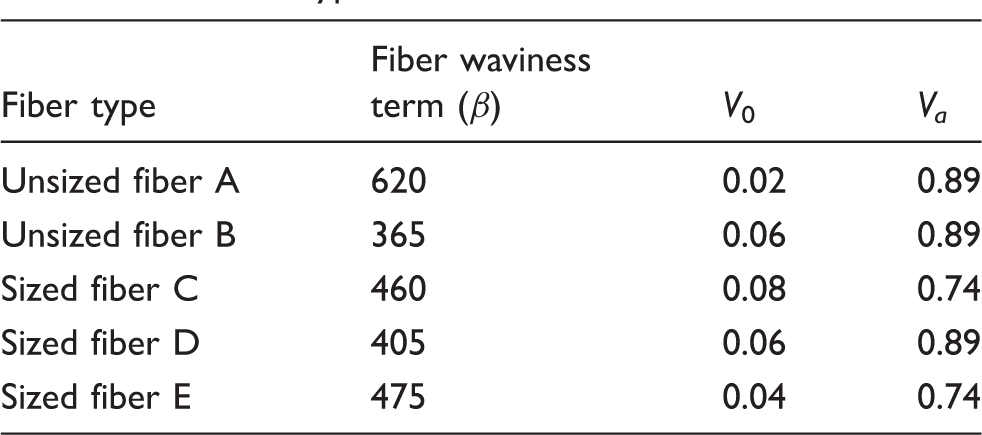
From Figure 4, one can note that the smaller diameter fibers (Fibers B,C,E) require significantly higher pressure to reach a particular fiber volume fraction level compared to the larger diameter fibers (Fibers A and D). Fiber volume fraction increases rapidly at low pressures (below 50 kPa) followed by stiffening of the fiber stack. The maximum fiber volume fraction at our applied experimental peak pressure of ∼800 kPa varies between 55% and 75% depending on the fiber type. There is a significant difference in the compression behavior of sized (Fiber C) and unsized fiber (Fiber B). The thin sizing layer may act as the lubricant, making the rearrangement of fiber packing easier, as indicated by Gutowski and Dillon. 22
3D resistor network model implementation
The carbon fiber tows have been modeled as a DC circuit with an array of electrical resistors representing the resistance from carbon fiber sections and fiber–fiber contact resistance. The model implementation is discussed in detail in Yu et al.
16
The resistor network represents the equivalent 3D microstructure of the fiber tow (Figure 5) which can be acquired either from a micrograph or from a modeled configuration. The 2D fiber arrangement of the out-of-plane cross-section is generated assuming random packing of fibers and the 2D structure is extended in fiber length direction using the fiber waviness term. The first contact point is randomly chosen to reflect the random nature of fiber-to-fiber contacts.
Schematic representation of the resistor network model: orange and blue resistors represent carbon fiber resistance Rf and contact resistance RC, respectively (2D presentation is shown for clarity).
16

The construction of the resistor network requires resistance values of the carbon fiber sections and fiber–fiber contact resistance. Carbon fiber resistance can be calculated from the intrinsic carbon fiber resistivity, diameter and contact-to-contact length, as in equation (3).

Contact-to-contact length L can be calculated by multiplying fiber-to-fiber spacing with fiber waviness term β, based on Gutowski’s curved beam model. For unsized fibers, contact resistance can be estimated based on Holm’s electric contact model and geometry of specimen
12

This study is focused on the region where fibers are relatively tightly packed. The model assumes the in-plane and through-thickness contact resistances to be equal. This assumption is based on the fact that the fibers are constrained by the model in both in-plane transverse and through-thickness direction. Contact pressure in in-plane transverse direction is thus comparable to through-thickness direction, resulting in similar contact resistances.
For sized fibers, contact resistance is calculated by fitting the experimental bulk resistivity results as the sizing properties are often proprietary. The resistivity of the equivalent unsized fiber assuming the same compaction behavior is calculated, and any difference is assumed to be due to the sizing.
Experimental results and model comparison
Through-thickness electrical resistivity results from our experiments and modeling are compared. During the experiment, the applied load (represented by normal pressure), through-thickness resistivity and fiber volume fraction are recorded in real time. Typical dataset is plotted in Figure 6; all other fiber types behave similarly. As load is increased, fiber volume fraction increases until it reaches the compression limit. Through-thickness resistivity keeps dropping during the compression process and reaches a stable stage when fiber volume fraction reaches the upper limit. It is interesting to note that at the end of the compression stage, the pressure needed to maintain the same fiber volume fraction drops, which suggests the reconfiguration of fiber arrangement within fiber tows.
Typical dataset recorded as a function of time during compression process for Fiber A.
The compression process can be roughly divided into two regions, as suggested from the plots of fiber volume fraction and load during compression. In the first region, fiber volume fraction increases quickly with even small load, while in the second region, significant load is required to increase fiber volume fraction. In the first region where fiber volume fraction is small (fiber tows are loosely packed), significant fiber spreading can be observed. Distance between fibers is uneven and clear boundaries between fiber tows can be observed. In the second region, boundaries between fiber tows disappear and the distance between fibers is almost even. In this study, we focus on the region where fiber volume fraction is larger than 0.3.
Effect of fiber volume fraction
Through-thickness resistivity of carbon fiber tows depends largely on fiber volume fraction. Fiber volume fraction determines the fiber-to-fiber spacing and thus the number of contact points per unit length. A 3D resistor network that considers contact resistance between carbon fibers 16 is used to model through-thickness resistivity of carbon fiber tows.
It was shown by experimental investigations5,23 that the through-thickness resistivity of CFRP depends nonlinearly on fiber volume fraction. Figure 7 shows the relation between through-thickness resistivity and fiber volume fraction during compression for the two types of unsized fiber tows (Fiber A and B) with random packing order investigated in this study. Simulation results from the proposed model are plotted against experimental data. Two orders of magnitude drop in resistivity is observed during the compression process. Abry et al.
3
reported similar change in transverse resistivity in CFRP. As fiber volume fraction increases, the through-thickness resistivity decreases because of the increasing contacts between carbon fibers and smaller contact resistance due to higher pressure. Good match of simulation results and experimental data is found for the low (Vf = 0.3) to medium fiber volume fraction (Vf = 0.55) range. At higher fiber volume fractions, the experimental results are lower compared to the model predictions. This may be due to measurement errors of the resistance at low magnitude or significant local variation of the assumed packing order and change in microstructure leading to changes in the β term and fiber-to-fiber contact distance compared to the model assumptions at higher fiber volume fractions. In all cases, prediction errors are within 5% of the initial resistivity value at Vf = 0.3. Material properties listed in Table 1 and model parameters listed in Table 2 are used in this simulation. Random fiber packing order is assumed for all the simulations in this study.
Through-thickness resistivity of unsized Fiber A and unsized Fiber B as a function of fiber volume fraction. Model describes experimental data well at volume fraction below 60%.
Resistivity of Fiber A bundle is approximately five times larger compared to Fiber B. This can be explained by higher contact resistance and higher fiber resistance of Fiber A. Modeled contact resistance RC and the resistance of fiber section between two contact points Rf are compared in Figure 8. For both Fiber A and Fiber B, fiber resistance is higher than the contact resistance at lower fiber volume fractions. Both contact resistance and fiber section resistance drop nonlinearly with fiber volume fraction. The fiber section resistance depends on intrinsic carbon fiber resistivity, cross-section area of the fiber and the length of fiber sections between contact points. The intrinsic resistivity of Fiber A is slightly larger than that of Fiber B. While the cross-section area of Fiber A is about two times of that of Fiber B, the distance between contact points of Fiber A is about 1.7 times that of Fiber B. These two factors cancel out and make the fiber section resistance of Fiber A and Fiber B of the same order. From Figure 8, we can see that both the fiber and contact resistances for Fiber A are larger than Fiber B, and the resistivity of Fiber A is greater than Fiber B as seen in Figure 8.
Comparison of contact resistance and fiber resistance for unsized Fiber A and Fiber B. Both fiber resistance and contact resistance of Fiber B are larger than Fiber A.
Effect of fiber sizing
Fiber sizing is a thin coating layer on carbon fibers that is intended to enhance interfacial properties between fiber surface and composite matrix. Sized fibers have different electrical properties from unsized fibers due to the existence of an insulating sizing layer. With the insulating thin sizing layer, sized fiber is comparable to CFRP in terms of electrical conduction. The through-thickness resistivities of sized carbon fibers measured in this study fall in the same range as the CFRP resistivity reported by Abry et al.
24
and Hirano et al..
25
Figure 9 compares the experimentally obtained resistivity of the sized fibers (C, D and E) with modeled resistivity of the sized fibers. Parameters used in the model are listed in Tables 1 and 2. Random fiber packing order is employed in the model. Since the properties of sizing are proprietary, contact resistance is back calculated by fitting the experimental bulk resistivity.
Experimental resistivity and model results of sized fibers (Fibers C, D and E). Fibers C and D have same amount of sizing (1 wt.%) and exhibit similar resistivity, while Fiber E with less sizing (0.25 wt.%) registers smaller resistivity.
Experimental data from unsized fiber B are plotted in Figure 8. The resistivity of Fiber C (sized version of Fiber B with 1% sizing) is increased by a factor of ∼40 times at Vf = 40% compared to the unsized fiber stack. The ratio increases with increasing fiber volume fraction to ∼200 times at Vf = 60%. The resistivity of Fiber D (with 1% sizing) is ∼10 times larger than that of Fiber E (with 0.25% sizing) tows due to thicker sizing layer on Fiber D. Fiber C and Fiber D have similar sizing amounts and demonstrate similar resistivity.
For sized fibers, the contact resistance is significantly larger than the carbon fiber resistance and dominates the bulk resistivity. Figure 10 compares the predicted contact and fiber resistance as a function of Vf for the sized fibers. Both resistance values drop with increasing compaction, but the contact resistance is an order of magnitude larger and thus effectively determines the bulk resistivity.
Comparison of contact resistance (Rc) and fiber resistance (Rf) for sized fibers. Significant drop in contact resistance Rc in Fiber E is observed, which may due to the breakage of the thin sizing layer on Fiber E at higher pressures.
While contact resistance for Fiber C and Fiber D changes little during compaction, huge drop in contact resistance is observed for Fiber E, which has the least amount of sizing. This may be due to the penetration of the contacting neighboring fiber into the thin sizing layer on Fiber E under high compaction pressures. Fiber C and Fiber D have 1% sizing on the fiber surface, while Fiber E has 0.25% sizing by weight. The thicker sizing layer on Fiber C and Fiber D introduces larger contact resistances compared to Fiber E. This is validated by the resistor network model, which shows similar contact resistances for Fiber C and Fiber D over a wide range of fiber volume fractions, while the Fiber E shows a much lower contact resistance, especially at higher volume fraction.
Effect of debulking
Figure 11(a) shows the compaction results of multiple cycles of the same specimen for Fiber A. All other fiber types tested in this study demonstrated similar behavior during debulking process. Similar hysteresis behavior is seen for all fiber types and has been reported.
22
However, this is the first time the impact of debulking process on the electrical conduction of carbon fiber is experimentally exhibited. The data show that the compaction behavior changes as multiple debulking cycles are applied. In context of electrical resistivity, the compaction changes the state of fiber arrangement and modifies the fiber waviness and thus fiber-to-fiber contact length. Figure 11(b) summarizes the β-terms for three debulking cycles and for all five fiber types. For each fiber type, five specimens were fabricated and tested and the statistical results are presented in Figure 11(b).
(a) Fiber A compaction data for multiple debulking cycles and (b) β for first three compaction cycles for all five fiber types. For each fiber type, five specimens were fabricated and tested and the averaged beta terms and their variations are plotted.
Resistivity data for all five fiber types are plotted in Figure 12 for three debulking cycles. Resistivity change is most significant between the first and second debulking step for all fiber types tested in this study. Similar pattern that the first cycle sees the largest change was reported by Leong et al.
18
when investigating the effect of through-thickness compression on the microstructure of CFRP. Debulking process contributes to change in through-thickness resistivity of dry carbon fiber tows in two ways. First, compaction changes the state of fiber arrangement and modifies the fiber waviness and thus the fiber-to-fiber contact length. It is interesting to note that β is increasing with increasing debulking cycles as seen in Figure 11(b), which means the average distance between contact points becomes larger. The resulting longer conduction path increases the through-thickness resistivity at a given fiber volume fraction. Secondly, the increase of electrical resistivity after debulking can be attributed to decreased pressure required to compress carbon fiber tow stacks into the same volume fraction at the second and third debulking cycles, as shown in Figure 11(a).
Through-thickness resistivity as a function of fiber volume fraction during the first three debulking cycles for five fiber types.
The sized fiber shows at least an order of magnitude resistivity increase after the first debulking cycle. Since the sizing layer is highly insulating, through-thickness conductive pathways are formed through the penetration of sizing layer creating direct fiber–fiber contact. During the first debulking cycle, applied pressure is high enough for the fiber sizing to break, resulting in smaller electrical resistivity. During second and third debulking cycle, penetration of sizing layer only happens at limited locations due to small pressure applied, resulting in high through-thickness resistivity. Resistivity of the sized fibers seems to converge back to first cycle values, as the compaction pressure and fiber volume fraction increases. This may be due to the penetration of sizing layer at high pressures.
Conclusions
An apparatus was designed and implemented for in-situ measurements of through-thickness electrical resistivity of dry carbon fiber tows as a function of compaction. The system measures fiber volume fraction accurately using a high-resolution CCD camera and image processing techniques. Fiber waviness was characterized and quantified from fiber tow compression tests. The data were reduced using Gutowski’s fiber compaction model describing fiber deformation behavior under transverse loading. Experimentally obtained resistivity of unsized fibers (fibers type A and B) compared well with a 3D resistor network model implementation. Sized fibers (fiber types C, D and E) showed more than an order of magnitude increased resistivity due to increased contact resistance between fibers. Repetitive debulking process simulated by applying normal pressure with an Instron machine rearranged the fiber contacts and reduced both the contact pressure and the fiber waviness, resulting in larger through-thickness resistivity at higher loading cycles. Debulked sized fiber systems showed an order of magnitude higher resistivity at lower fiber volume fraction and tend to converges to unsized fiber resistivity at higher fiber volume fractions. The experimental results compared well with our 3D resistor network model, indicating that the principle conduction mechanisms are captured and modeled accurately.
Footnotes
Declaration of Conflicting Interests
The author(s) declared no potential conflicts of interest with respect to the research, authorship, and/or publication of this article.
Funding
The author(s) received no financial support for the research, authorship, and/or publication of this article.