
Abstract
The interface of graphene/epoxy was studied using molecular dynamics simulations by calculating the work of separation and traction-separation responses in the normal mode. The influence of functionalization of the graphene layers on the traction-separation behaviour was also examined by grafting hydroxyl, carboxyl, and carbonyl groups. It is shown that the magnitude of the maximum traction is clearly larger for functionalized graphene/epoxy systems as compared to pristine graphene. The work of adhesion also shows a clear difference in the interface behaviour of functionalized graphene/epoxy and pristine/epoxy systems with the presence of functional groups generating higher values of work of separation.
Introduction
When studying the fracture behaviour of composite material structures through finite element analysis, a frequently used method for modelling the crack development is the cohesive zone models.1–5 Through the cohesive zone models, the progress of a crack can be analyzed from relations between tractions on the interface between two phases and the opening displacement (separation) of a crack in the interface. These traction-separation relations, hence, define the behaviour of the interface including the degradation of the interface. Typically, the shape of the traction-separation relations has been assumed either as polynomial, piecewise linear or exponential and has been parameterized through macroscopic experimental data such as the fracture toughness or the tensile stress–strain response of the material.6–8 However, the assumption regarding the shape of the relations and limited knowledge about the macroscopic experimental data limits the applicability of cohesive zone models for modelling new materials, such as polymer-based nanocomposites.
In recent years, graphene has become an interesting candidate as reinforcing phase in high performance composite materials due to the exceptional mechanical properties and the large aspect ratio of this two-dimensional material. However, the adhesion properties of pure graphene with respect to the polymer matrix are not competitive with traditional reinforcing materials, such as carbon fibres and hence have to be improved before graphene-based nanocomposites can be a commercial success. 9 The adhesion and consequently the load transfer between graphene and matrix rely on different types of interaction; namely mechanical interlocking, chemical bonding, and non-bonded interactions between the graphene and the polymer matrix.10,11 By covalently bonding chemical groups to the graphene surface, the interaction with the polymer matrix can be increased; thus, the efficiency of load transfer and adhesion is improved. 12 However, grafting negatively influences the mechanical properties of the graphene due to a change in the bonding structure of graphene.13–17 Therefore, a compromise between an increase in load transfer capability and a decrease of the mechanical properties of the graphene due to functionalization needs to be made.
The analysis of the interfacial bonding and subsequent prediction of the mechanical behaviour of nanocomposites is a multiscale problem given the small dimension of the fillers. In the present study, molecular dynamics (MD) was used to determine the traction-separation relations between graphene and epoxy resin, which can then be implemented as input into a cohesive zone model. The use of MD simulations is advantageous as it considers the local nanoscale properties of the crack at the interface, providing quantitative predictions of the failure properties of a material. 18
Several methodologies have been presented in recent years relating to the extraction of traction-separation curves through MD simulations in different materials interface like aluminium,18,19 but also in nanocomposites with polymer matrices including, e.g. graphite,20–22 carbon nanotubes23–27 and graphene.28–30 In the present study, the behaviour of a mode 1 crack is modelled through the opening mode of separation of an epoxy-graphene composite material by step-wise separating the epoxy and the graphene as indicated in Figure 1. The tractions between the epoxy and graphene are monitored and the influence of different functional groups on the interaction between the graphene and the polymer matrix, compared to pristine graphene, was examined through traction-separation curves.
Mode 1 opening mode of fracture (left) with inset (middle) of the epoxy/graphene interface modelled through MD and a 2D model (right) of the opening mode of the interface.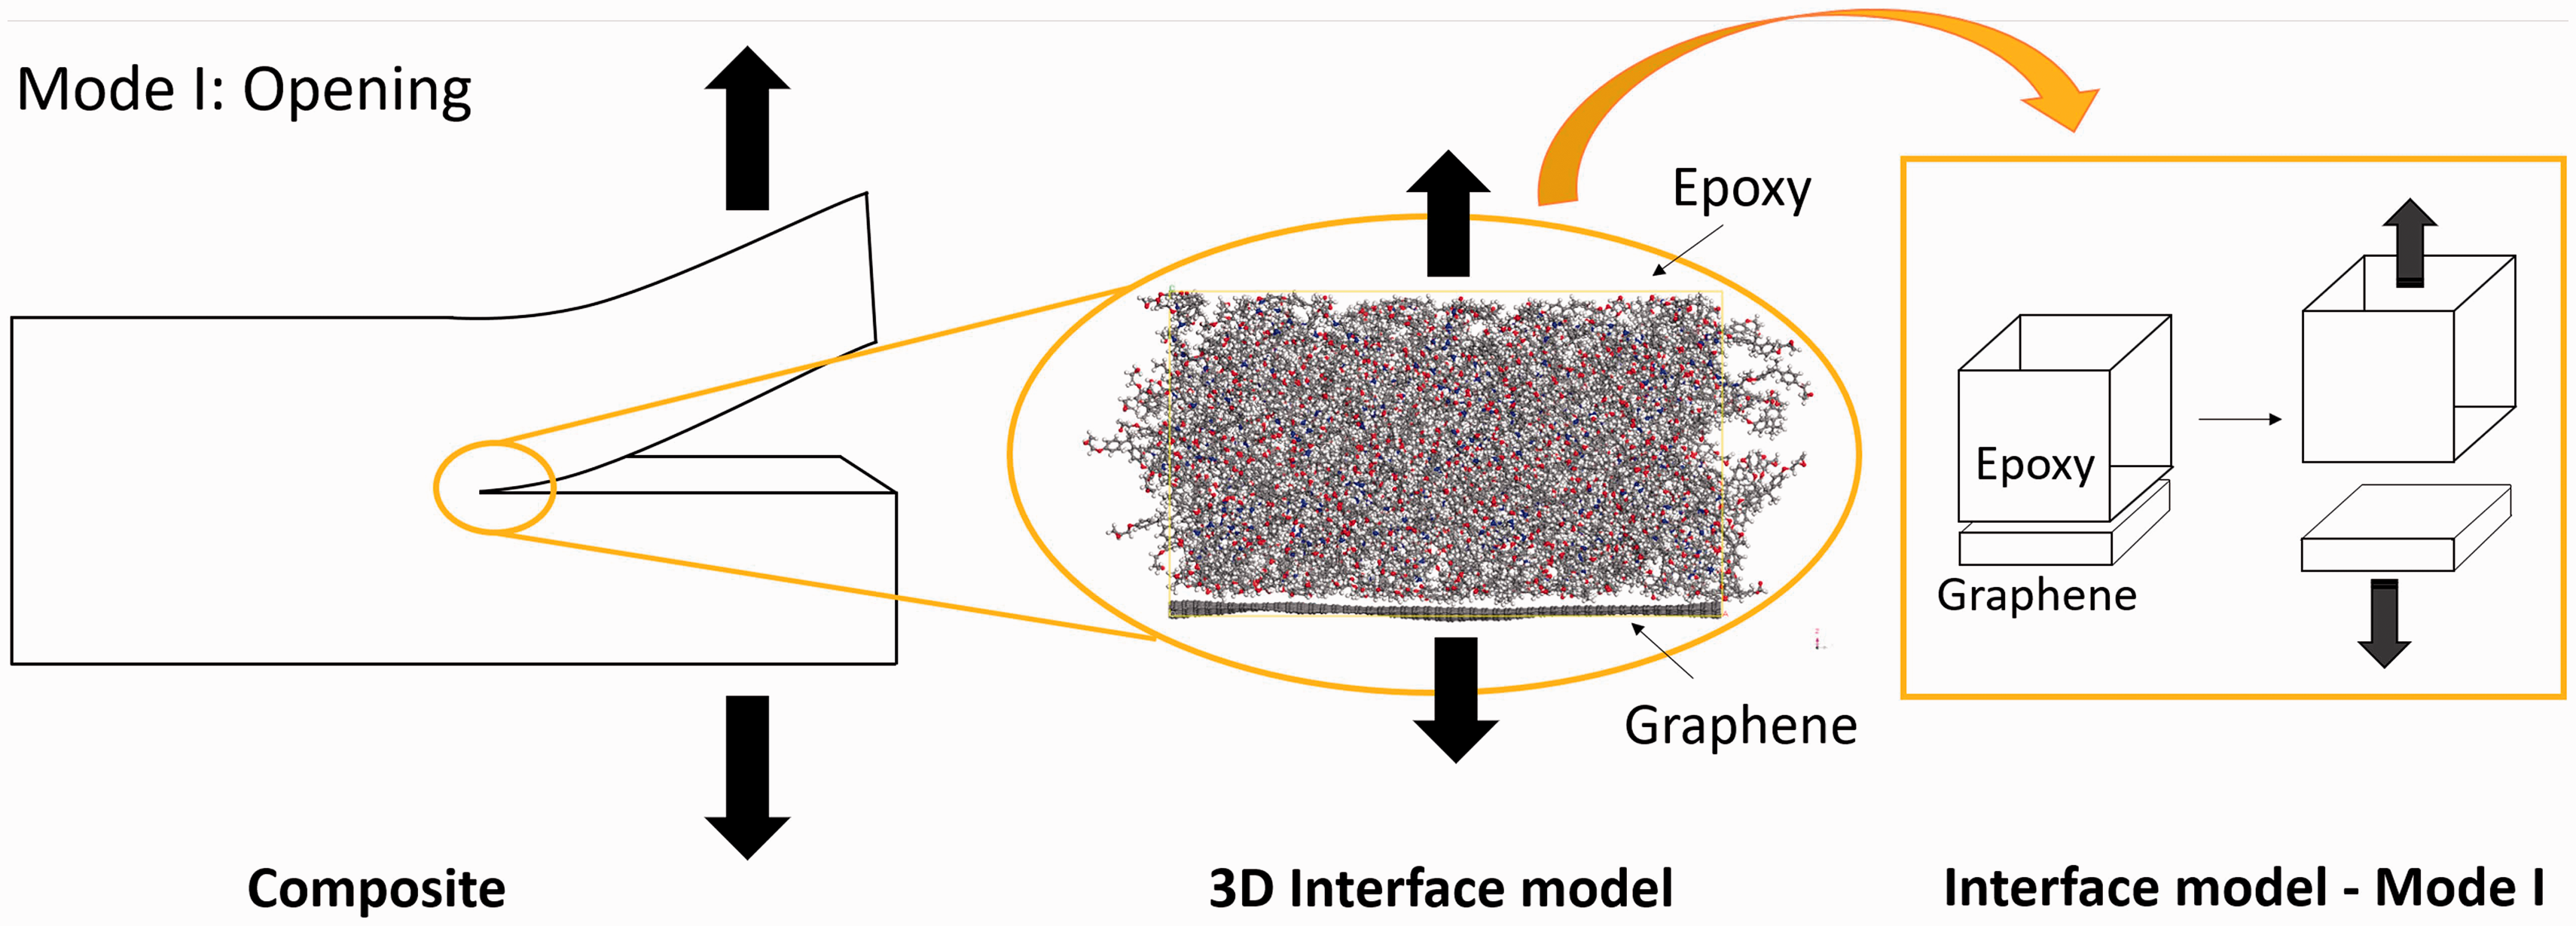
Simulation approach
Molecular models
The molecular models were built using the software Materials Studio 6.0.
31
Bisphenol A diglycidyl ether (DGEBA) was used as the model of the epoxy cured with triethylenetetramine (TETA) consisting of 744 atoms. The molecule was replicated using the packing task of Amorphous Cell module resulting in a periodic cell with 70 packed molecules corresponding to 49,000 atoms. Cell dimensions are 10.4 × 10.0 × 4.7 nm3 and cell angles α = β = γ = 90°. The density was set to 1.15 g.cm-3, an average value for epoxy resin density as reported in literature (Figure 2).
32
Molecular structures of bisphenol A diglycidyl ether (DGEBA) and triethylenetetramine (TETA).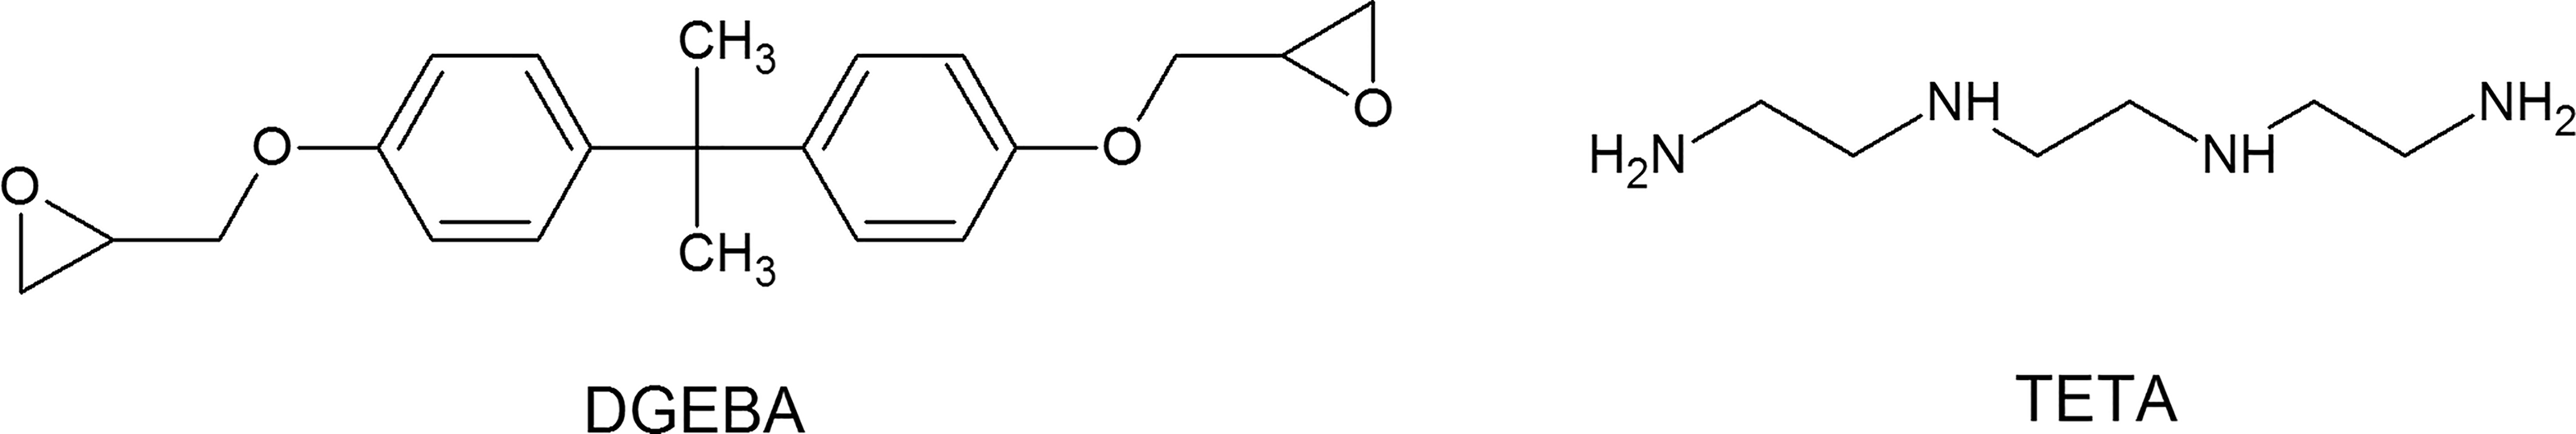
A graphene layer consisting of 3840 atoms was created within a periodic cell with the dimensions 10.2 × 9.8 × 0.34 nm3 and angles α = β = γ = 90°. Functional groups such as hydroxyl (–OH), carboxyl (–COOH), and carbonyl (–C=O) were individually and randomly grafted onto the graphene layer resulting in 10% functionalization of the carbon atoms in the graphene structure. This percentage was chosen after previous studies on graphene in which it was verified that 10% functionalization did not affect the mechanical properties of graphene considerably. 17
The epoxy and graphene systems were initially equilibrated individually and then combined into one system for further equilibration, as described in the simulation procedure.
Simulation procedure
The interactions between atoms were modelled using the condensed-phase optimized molecular potential for atomistic simulation studies (COMPASS) force field which has been parameterized and validated in modelling the interaction of, e.g. carbon, oxygen and hydrogen atoms, including the hybridization states relevant for the graphene systems and functional groups presently studied.
33
COMPASS force field has been used in simulations of graphene and together with other carbon-based materials.34–38 The atom-based summation method with a cut-off radius of 9 Å was used to calculate the non-bonded interactions. The equilibration procedure is described in Figure 3.
Equilibration process.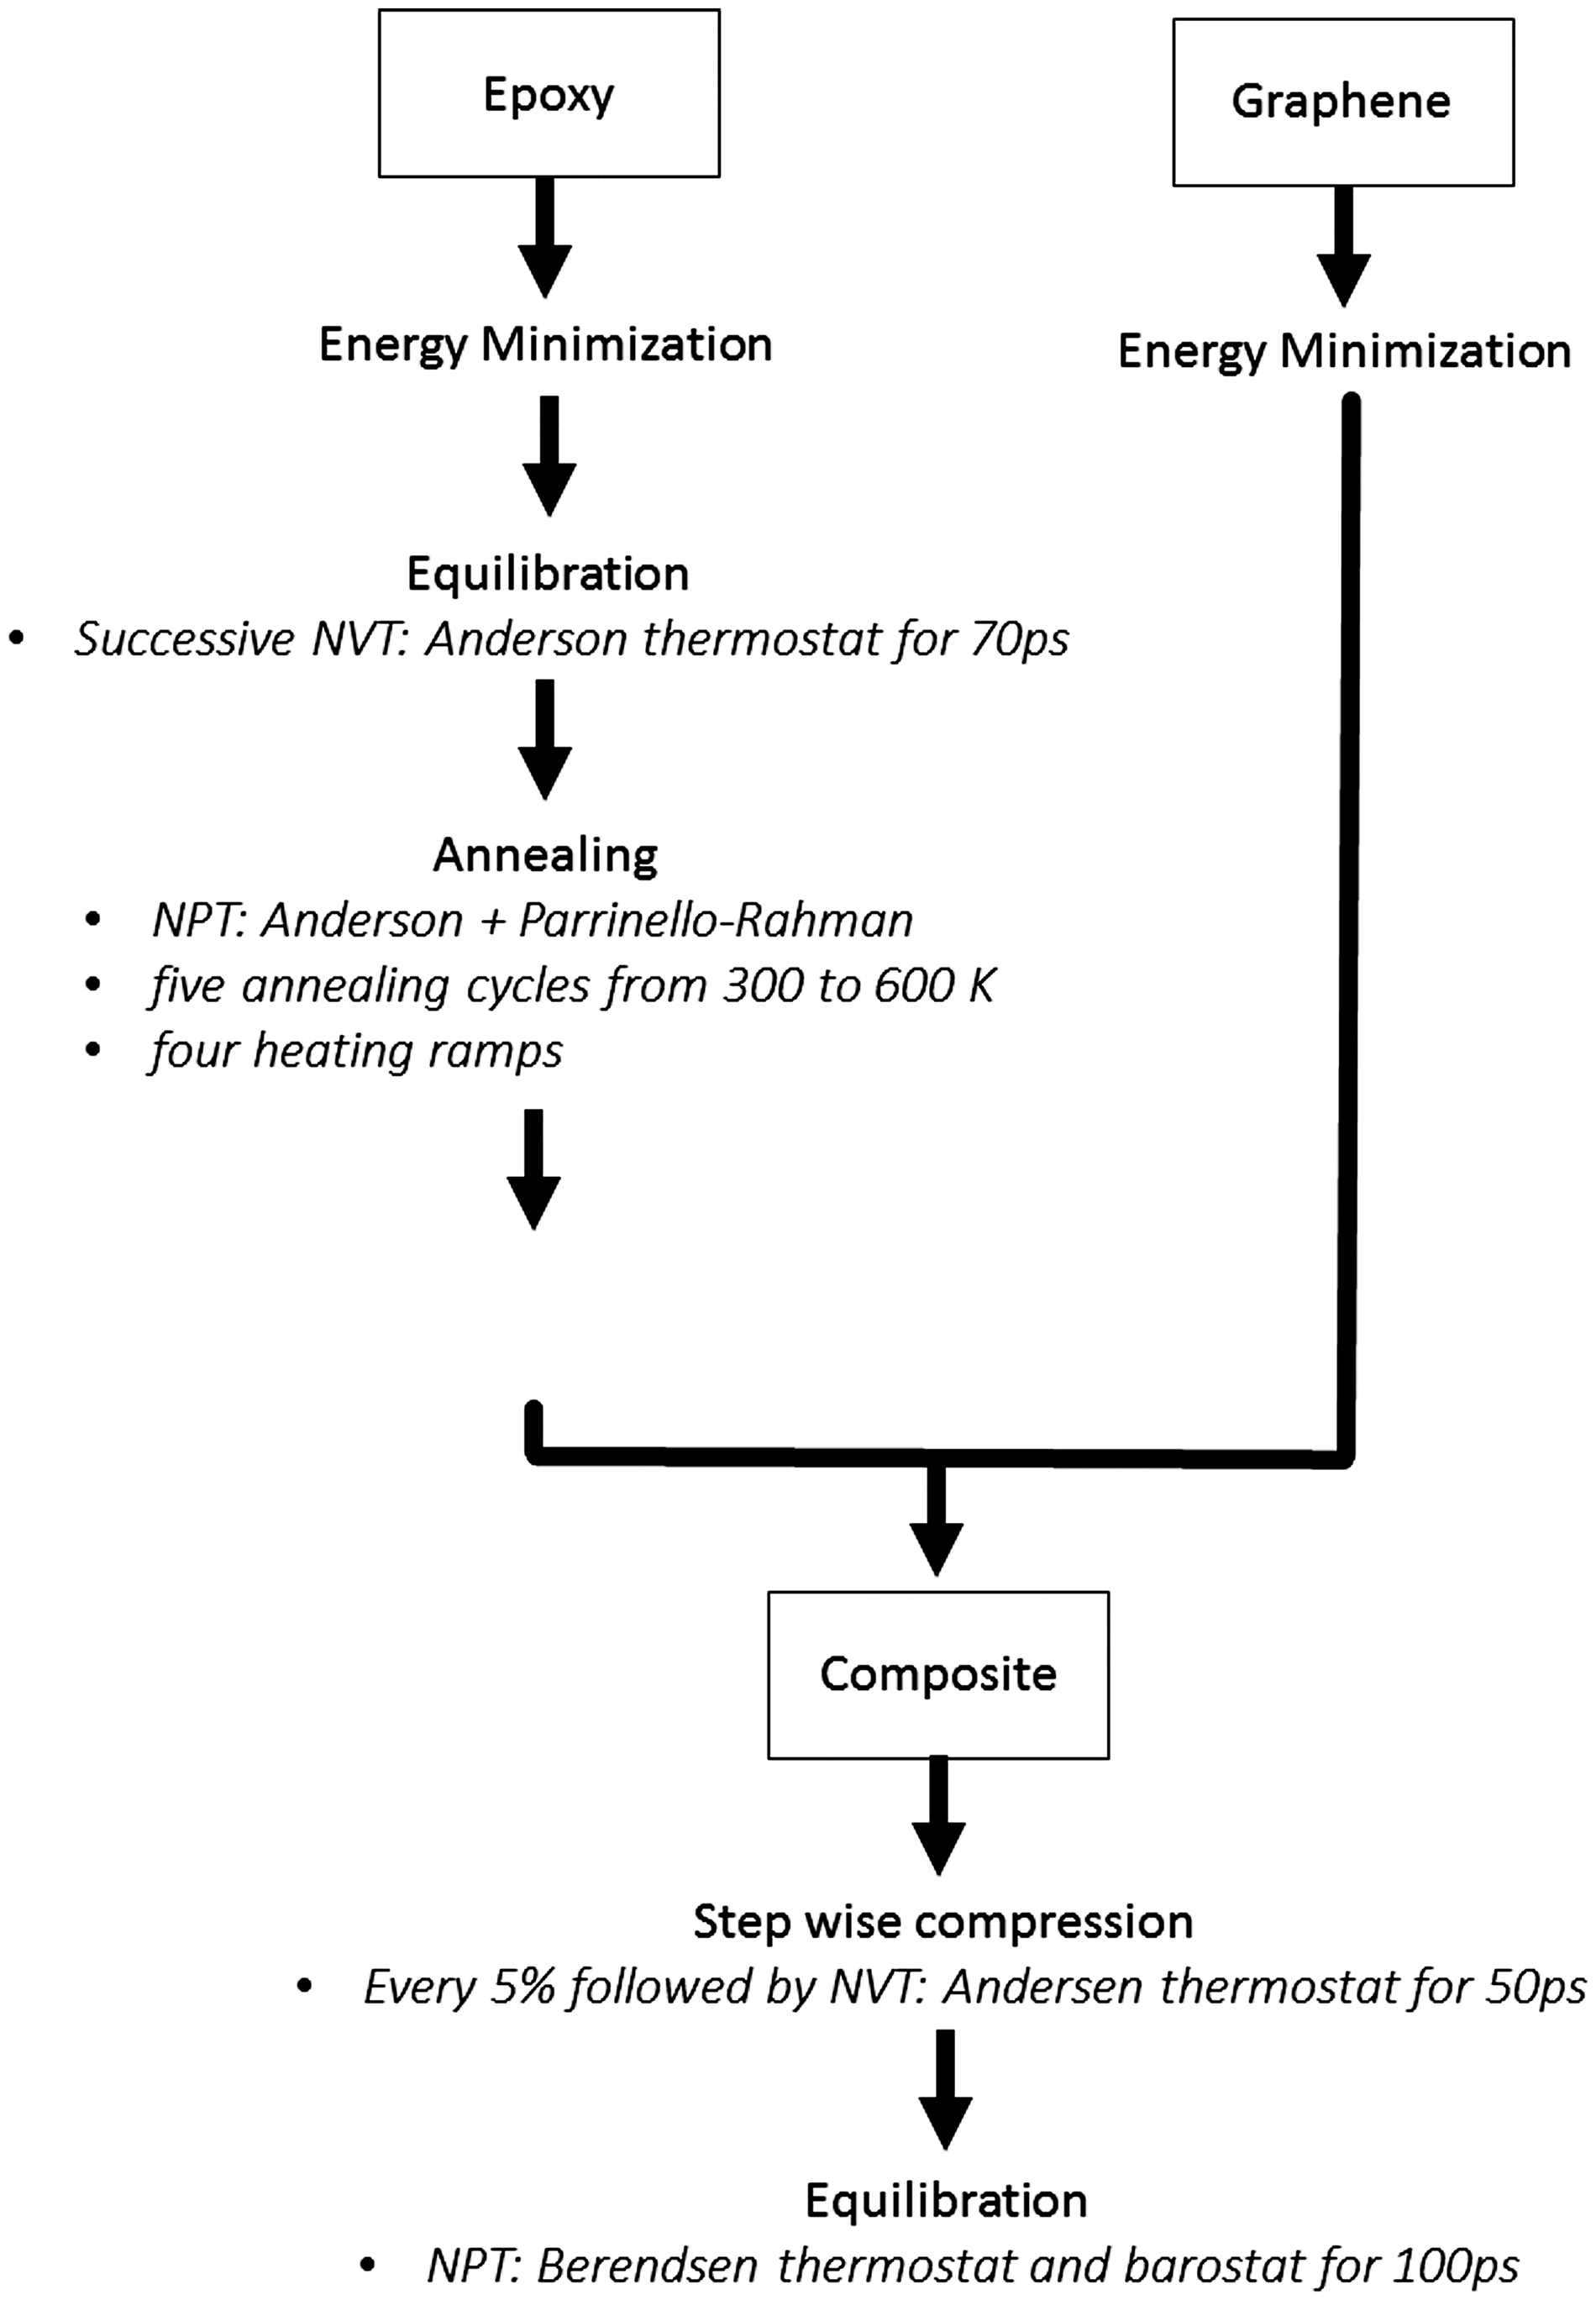
Successive MD simulations were performed to equilibrate the epoxy system. Initial dynamic simulations with the canonical ensemble (NVT) and Andersen thermostat
39
were performed for 70 ps and a timestep of 1 fs, followed by simulated annealing to gradually minimise the energy of the structure and, at the same time, prevent it from being trapped in a conformation that represents a local energy minimum. The polymer was subjected to five annealing cycles from 300 to 600 K and four heating ramps. The annealing was performed in an isothermal-isobaric ensemble (NPT) with Andersen thermostat and Parrinello–Rahman barostat, respectively.40–42 This allowed the shape and volume of the cell to change during annealing. A final equilibration dynamic simulation was performed at 298 K and atmospheric pressure for 110 ps, using the NPT ensemble with Andersen thermostat and Parrinello-Rahman barostat. Constant energy and pressure, together with a linear increasing mean square displacement, were observed (not shown) indicating that the epoxy system had reached equilibrium. The epoxy system and energy-minimized graphene system were then combined into one system. Because this procedure created a gap in the final combined system, the latter was gradually compressed in the z- direction (see Figure 4) until it reached a density close to 1.0 g.cm−3.
32
Each compression cycle was followed by a NVT dynamics for 50 ps to avoid large energy increases to the system.
43
Finally, NPT dynamics was performed with Berendsen thermostat and barostat
44
for 100 ps to equilibrate the final structure to a stress-free system. The Berendsen barostat was chosen for the final equilibration since this barostat only varies the side lengths of the cell, while the angles remain at 90 °. Finally, the periodic boundary conditions were removed, and hydrogen atoms were added to the graphene edges to avoid high energy states.
Compression process of graphene-epoxy (left: before and right: after compression).
The traction-separation relations were determined by step-wise moving the graphene layer, as displayed in Figure 1 followed by energy minimization. The carbon atoms belonging to the graphene sheet were constrained during the minimization to prevent the graphene from moving in the y-axis direction during the geometry optimization. The epoxy and graphene were separated at a step wise of 0.05 nm until a separation of 0.2 nm was reached. Then the step size was increased to 0.1 nm until complete separation was obtained. This separation distance varied according to the functional groups attached to the graphene.
For each step, the interaction energy

The work of separation was calculated from the interaction energy difference per area between a system with fully embedded graphene layer (see Figure 5), Einter(0), and a completely separated system, Einter(∞), as presented below
45

The interaction force, F, between the epoxy matrix and the graphene sheet was determined through numerical differentiation. The interfacial tractions were determined by dividing the interaction forces by the area of the graphene sheet (10.2 × 9.8 nm2), as presented in equation (3), where x is the displacement of the graphene sheet.

Results and discussion
For a matter of simplicity, the graphene/epoxy, graphene-OH/epoxy, graphene-COOH/epoxy, and graphene-C=O/epoxy systems are hereafter reported as ‘Graphene’, ‘OH’, ‘COOH’, and ‘C=O’, respectively. The calculations were performed for each functionalized graphene/epoxy system three-fold. Each system had different configurations, that is to say, the functional groups were distributed differently within the graphene for each system. The average values are reported below.
In Figure 6, the interaction energies of the four different molecular systems are shown.
Pull-out simulations for the OH system in the z- axis direction (z = 0 Å, 8 Å and 16 Å). Representative interaction energies of systems in the opening separation mode.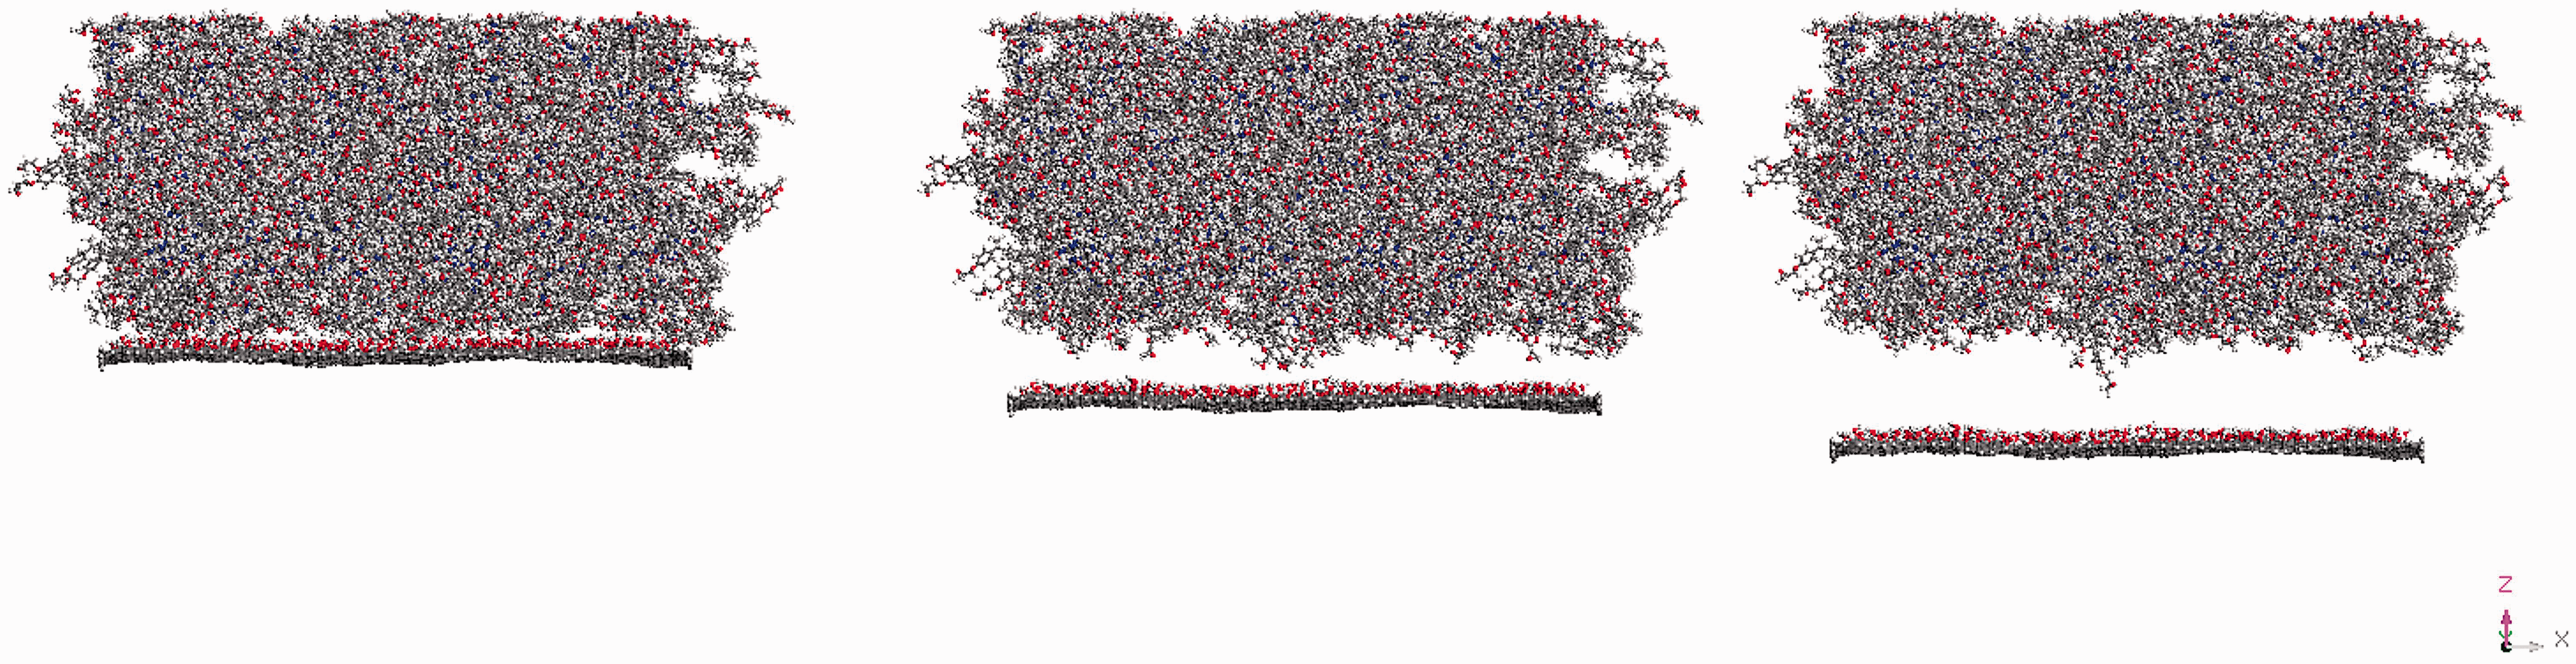
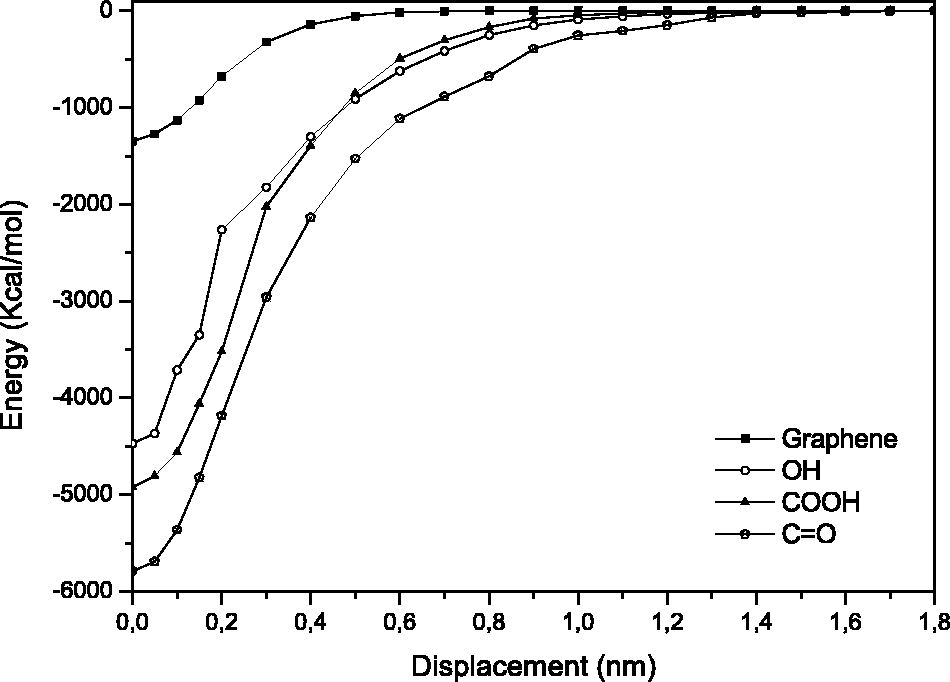
A significant difference in the interaction energies is visible when comparing the neat graphene with the functionalized systems. The latter suggest higher interface attraction given the more negative energies, compared to the neat graphene system, and, as expected, this attraction diminishes as the separation increases.
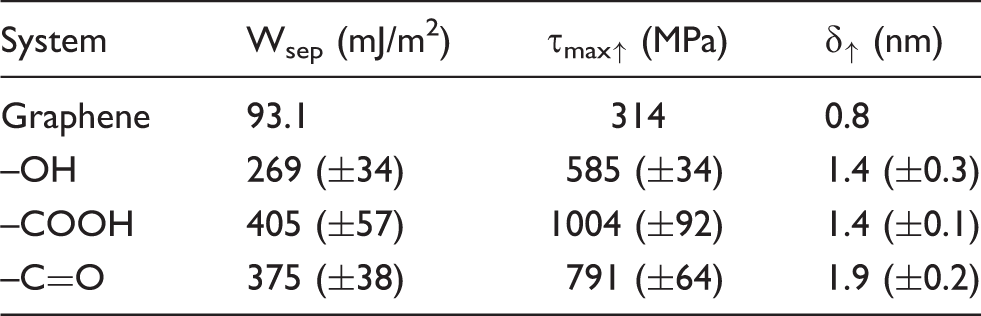
The work of separation was calculated following equation (2), and for the pristine graphene system, a work of separation of 93.1 mJ/m2 was obtained which is considerably lower than that for graphene/graphene interface, 505.3 mJ/m2, 29 present in, e.g., graphite. The decrease in work of separation for graphene–polymer interfaces when comparing with graphene–graphene interfaces has previously been observed in studies of graphene–polyethylene interfaces.29,46 On the other hand, the OH, COOH and C=O systems have a work of separation of 269, 405 and 375 mJ/m2, respectively, indicating that the functionalization increases the interaction more than three-fold, with the carboxyl system presenting the strongest interaction. A similar four-fold increase for functionalized systems has also been reported for PE systems with functionalized graphene layers. 29 An explanation for the higher work of separation values for the functionalized systems could be due to the fact that the graphene only interacts with the epoxy matrix through van der Waals interaction, while the functionalized graphene layers interact with the matrix through both van der Waals and electrostatic interaction. 12 Furthermore, the number of atoms per area is larger for the functionalized graphene compared to the neat graphene, which further increases the interaction energy. Another reason could be due to the smooth surface of graphene, opposite to the roughness created by the functional groups, with the first mimicking the lotus leaf effect. 47
The tractions for the opening separation mode as a function of separation distance are shown in Figure 7. In this study, the separation distance is defined as the distance at which the interaction energy becomes lower than 0.1% of the maximum energy.
Representative opening mode traction vs. separation distance. Work of separation (Wsep), maximum cohesive strength values (τmax↑), and separation distances (δ↑) for all four systems.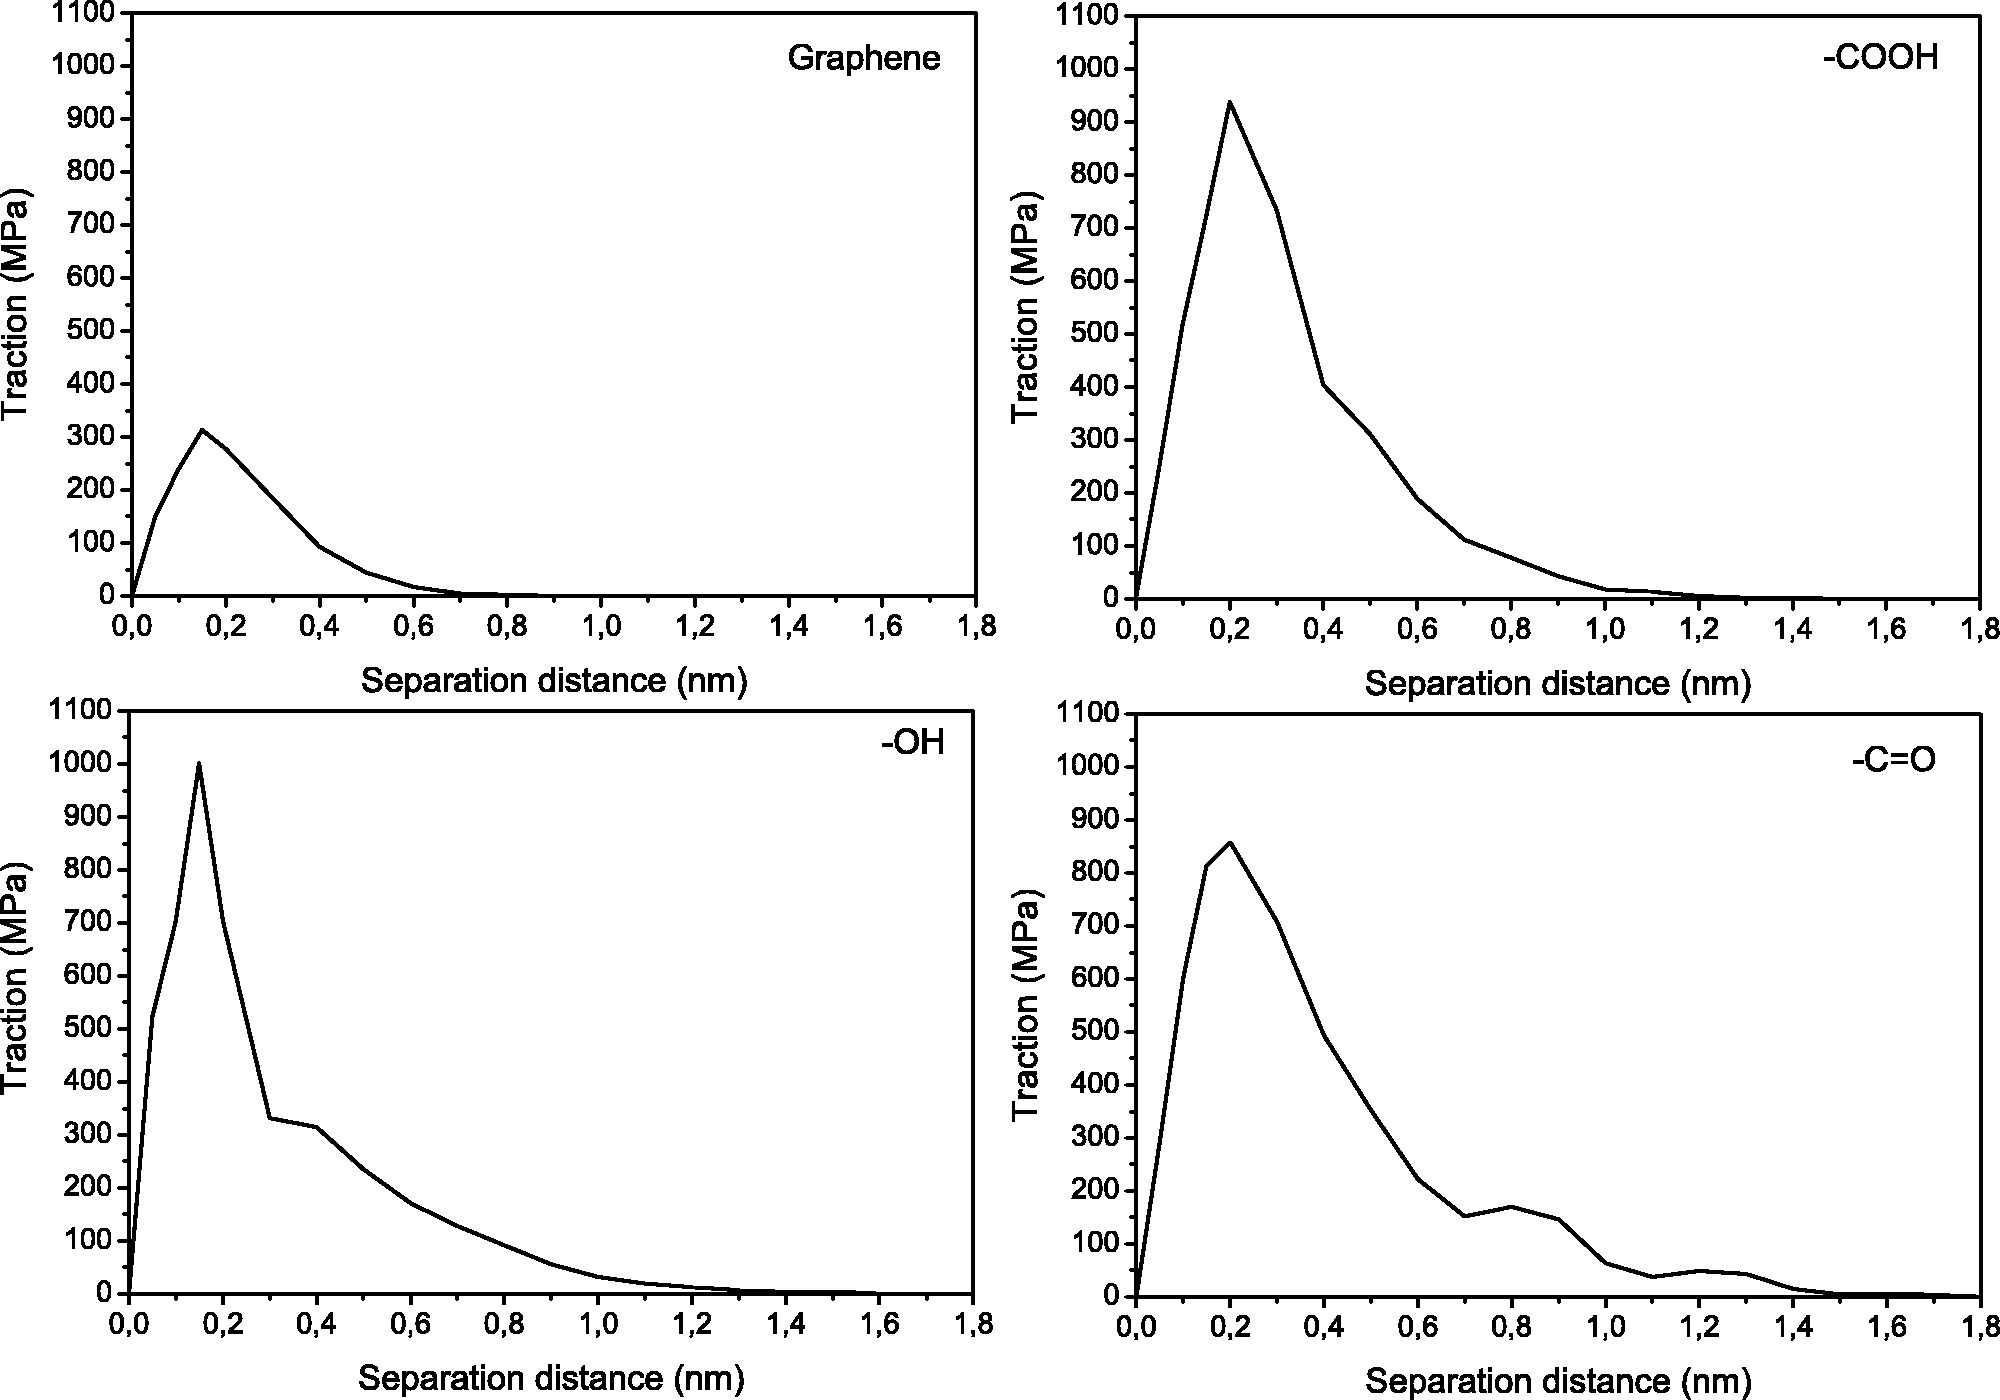
The shape of the traction-separation curves generated through the molecular dynamic simulations resembles the general shape of other traction-separation curves.48,49 The initial part of the curve (up to a separation distance of approximately 0.2 nm) increases with increasing separation distance until the maximum cohesive strength, τmax, is reached. The tractions then decrease and approach zero as the separation distance is further increased.
As the pristine graphene is being moved away from the epoxy, the traction increases, reaching a cohesive strength of 314 MPa, which then decreases continuously reaching zero at a separation of 0.8 nm. Previous studies have reported a maximum traction of 250 MPa in the normal mode for polyvinylidene fluoride (PVDF) and graphite interfaces. 45 Considering the similarities in filler and slight differences in polymer choice, these results agree well with the results obtained in this study. The cohesive strengths are however three-fold higher in average for the functionalized systems compared to pristine graphene. The OH system reaches a cohesive strength of 585 MPa. Similar to the graphene system, the traction-separation response shows a continuous decrease towards zero after the maximum peak is reached, but in this case the complete separation occurs at 1.4 nm. The COOH obtained a cohesive strength of 1004 MPa, the highest, reaching a total separation at 1.4 nm. The C=O reached a cohesive strength of 791 MPa and the decrease from the maximum peak is linear only until 0.7 nm showing an irregular decrease from that point until separation is achieved at 1.9 nm. The interaction between reinforcement and matrix at the molecular level is ruled by electrostatic attractions, hydrogen bonding and van der Waals forces of both phases. The presence of functional groups covalently bonded to the surface of graphene provides higher electrostatic forces, which result in higher affinity between graphene and epoxy, and thus higher cohesive strength. 50 The fact that the carbonyl group is more electronegative, makes its interaction with epoxy stronger than, e.g., hydroxyl groups. The strongest interaction from the carboxylic system can be attributed to the double number atoms of the functional groups.
Conclusion
MD simulations were performed to evaluate the traction-separation responses at the interface of pristine and functionalized graphene with epoxy resin. The results suggest that the mechanical strength at the interface is stronger for functionalized graphene systems than for pristine graphene and epoxy, with the work of separation and the maximum tractions presenting results three times superior for functionalized systems compared to the neat graphene system.
Footnotes
Declaration of Conflicting Interests
The author(s) declared no potential conflicts of interest with respect to the research, authorship, and/or publication of this article.
Funding
The author(s) disclosed receipt of the following financial support for the research, authorship, and/or publication of this article: The authors would like to acknowledge the support provided by the Innovation Fund Denmark through the Danish Centre for Composites Structures and Materials for Wind Turbines grant no. 060300301B.