
Abstract
Carbon nanotubes-based nanocomposites have gained a great amount of attraction and play a key role in the realization of strain sensors owing to their remarkable physical properties. In this study, the piezoresistivity of multi-walled carbon nanotubes (MWCNTs)/epoxy-based nanocomposite-based strain sensor under static tensile load is examined using electrochemical impedance spectroscopy. Morphological examinations show that MWCNTs are randomly and homogeneously distributed in the epoxy polymer matrix. A simplified resistance constant phase element model is proposed and validated by impedance spectrum to fit the impedance spectra and the equivalent circuit parameters are extracted under uniaxial static load. Impedance results suggest that depending on the frequency regions, the sensor exhibits different responses under loading. Moreover, the proposed sensor gives high sensitivity, linearity and low hysteresis under cyclic quasi-static loading and unloading that makes the sensor a promising candidate for practical strain sensor applications.
Keywords
Introduction
Commercial strain gauges are commonly employed in many engineering applications to measure the mechanical deformation and applied force on an object that is typically fabricated by patterning metal wires on an insulating thin layer. 1 However, commercial strain sensors exhibit some critical limitations, such as limited flexibility, low measurement range, low sensitivity and fatigue life and high cost. These limitations result in the increase in demands through the use of conductive nanofillers. Incorporation of conductive nanofillers, i.e. carbon black,2,3 graphene,4,5 nanowires6,7 and carbon nanotubes (CNTs)8–11 into a certain polymer matrix can enhance mechanical, electrical properties as well as sensing performance of the strain sensor significantly.12–20 Among these nanomaterials, CNTs are widely used owing to their high aspect ratio, which enables the formation of the conductive paths within the nanocomposite network at very low CNTs concentrations.21,22 However, realization of the CNTs-based nanocomposite is quite challenging due to high surface area and strong van der Walls attraction between CNTs that causes the formation of agglomerations or bundles into polymer matrices. Hence, an effective nanocomposite synthesis is required since agglomerations in CNTs/polymer matrices deteriorate mechanical and electrical and sensor properties of nanocomposite significantly. 23 On the other hand, the type of polymer as host material plays also an important role in the fabrication and performance of the strain sensors. Many critical factors of polymers including Poisson's ratio, height of potential barrier, tunneling effect as well as adhesion rate to the substrates can be directly associated with the effect of the polymer.24,25 For instance, the viscosity of the polymer defines the characteristics of the mixing process and the dispersion state of the nanocomposite. On the other hand, a good dispersed CNTs network in the polymer results in lower resistance and higher conductivity. The thickness and type of the polymer strongly affect the tunneling resistance, which is dominant in the conduction mechanism of CNTs/polymer-based nanocomposites.26–28 In this work, epoxy resin polymer was chosen since it has good mechanical properties and adhesiveness to the substrates that ensure high stress transfer from the substrate to the sensor layer, which is important for the design of the strain sensor. 29 To understand the conduction mechanism and contribution of nanofiller, polymer and their complex networks, electrochemical impedance spectroscopy (EIS) was used. EIS is a real-time, non-destructive frequency method that provides useful information about the conduction mechanism of the sensor under load. 30 While many reported studies investigate the CNTs/polymer nanocomposites-based strain sensor in DC electrical field31–35 only some preliminary studies considered the effect of applied frequency.15,36–44 For example, Mei et al. 41 studied the optimum operating frequency of the pressure sensor carbon black/silicon rubber nanocomposites using EIS, where a high sensor sensitivity is obtained at 1 kHz frequency. Mohanraj et al. 42 have shown that the CB/styrene–butadiene rubber composites show frequency-dependent conductivity which was attributed to the easy of the polymer chain mobility at low concentrations that influences the conductive network and significant chance in AC conductivity under applied pressure. Additionally, Wang et al. 43 have investigated the AC resistivity of pressure sensor based on carbon black/polymer nanocomposites. For the nanocomposites that has the CNTs concentrations above the percolation threshold, it was indicated that with the increase of the frequency, the sensitivity of the pressure sensor increases due to the decrease of the polarization and electron hopping. Tong et al. 44 investigated the piezoresistivity of the CNTs/epoxy-based nanocomposites for different CNTs concentrations in AC field. In that work, the sensitivity and linearity of the sensors were calculated from the relative change of the dielectric loss tangent. However, the effects of different operating frequency ranges on the sensor piezoresistivity, i.e. sensitivity, linearity and hysteresis remain to be fully studied.
The main goal of this study is to investigate the effect of AC frequency on the piezoresistivity of the MWCNTs/epoxy-based strain sensor under static tensile loading. Here, it is also aimed at understanding the contribution of CNTs network and polymer matrix as well as the conduction mechanism of the nanocomposite under different operating frequencies using EIS. As shown in the reported numerical results, the proposed sensor shows especially high sensitivity, linearity, repeatability and hysteresis in particular at the frequency-independent region.
Experimental methods
Nanocomposite preparation and design of strain sensitive nanocomposite
The MWCNTs with 95% purity, 6–9 nm outer diameter and <1 µm length were obtained from Southwest Nano Technology and they were used without any further chemical treatment. A detailed methodology of MWCNTs/epoxy nanocomposite preparation is explained in previous works of the authors.15,16 To perform quasi-static tensile loading measurements, a glass-reinforced epoxy laminate substrate (FR4) is used as a cantilever beam owing to its good adhesion with the CNTs/epoxy nanocomposites, good heat resistance and mechanical properties.
45
Before the deposition of the nanocomposites, FR4 substrate is immersed in isopropanol solution and then sonicated for 15 min. Then, the substrate is cleaned with distilled (DI) water for 15 min and dried with nitrogen gas (N2). For the realization of the strain sensitive nanocomposite layer, the FR4 cantilever beam is covered with a mask and it was cut in the size of 1.5 mm × 5 mm (see Figure 1(d)). After that, a certain amount of nanocomposite for the 1 wt.% of MWCNTs concentration is deposited on the substrate by a stencil printer at an optimized speed of v = 80 mm/s. After the deposition of the nanocomposite and removal of the mask, the sample is dried in a climate chamber for 3 h at 160℃.
Schematic illustration of the design, deposition, and encapsulation of MWCNTs/epoxy nanocomposites-based strain sensitive samples. (a) Applying a mask for electrodes deposition, (b) applying silver paste for the formation of the electrodes, (c) removing the mask, (d) application of the second mask for the sensor layer deposition, (e) deposition of the nanocomposite by stencil printer, (f) removing the second mask and drying the sensor layer, (g) applying the copper cables for the electrical measurements and (h) encapsulation of the sensor layer with a tiny latex polymer.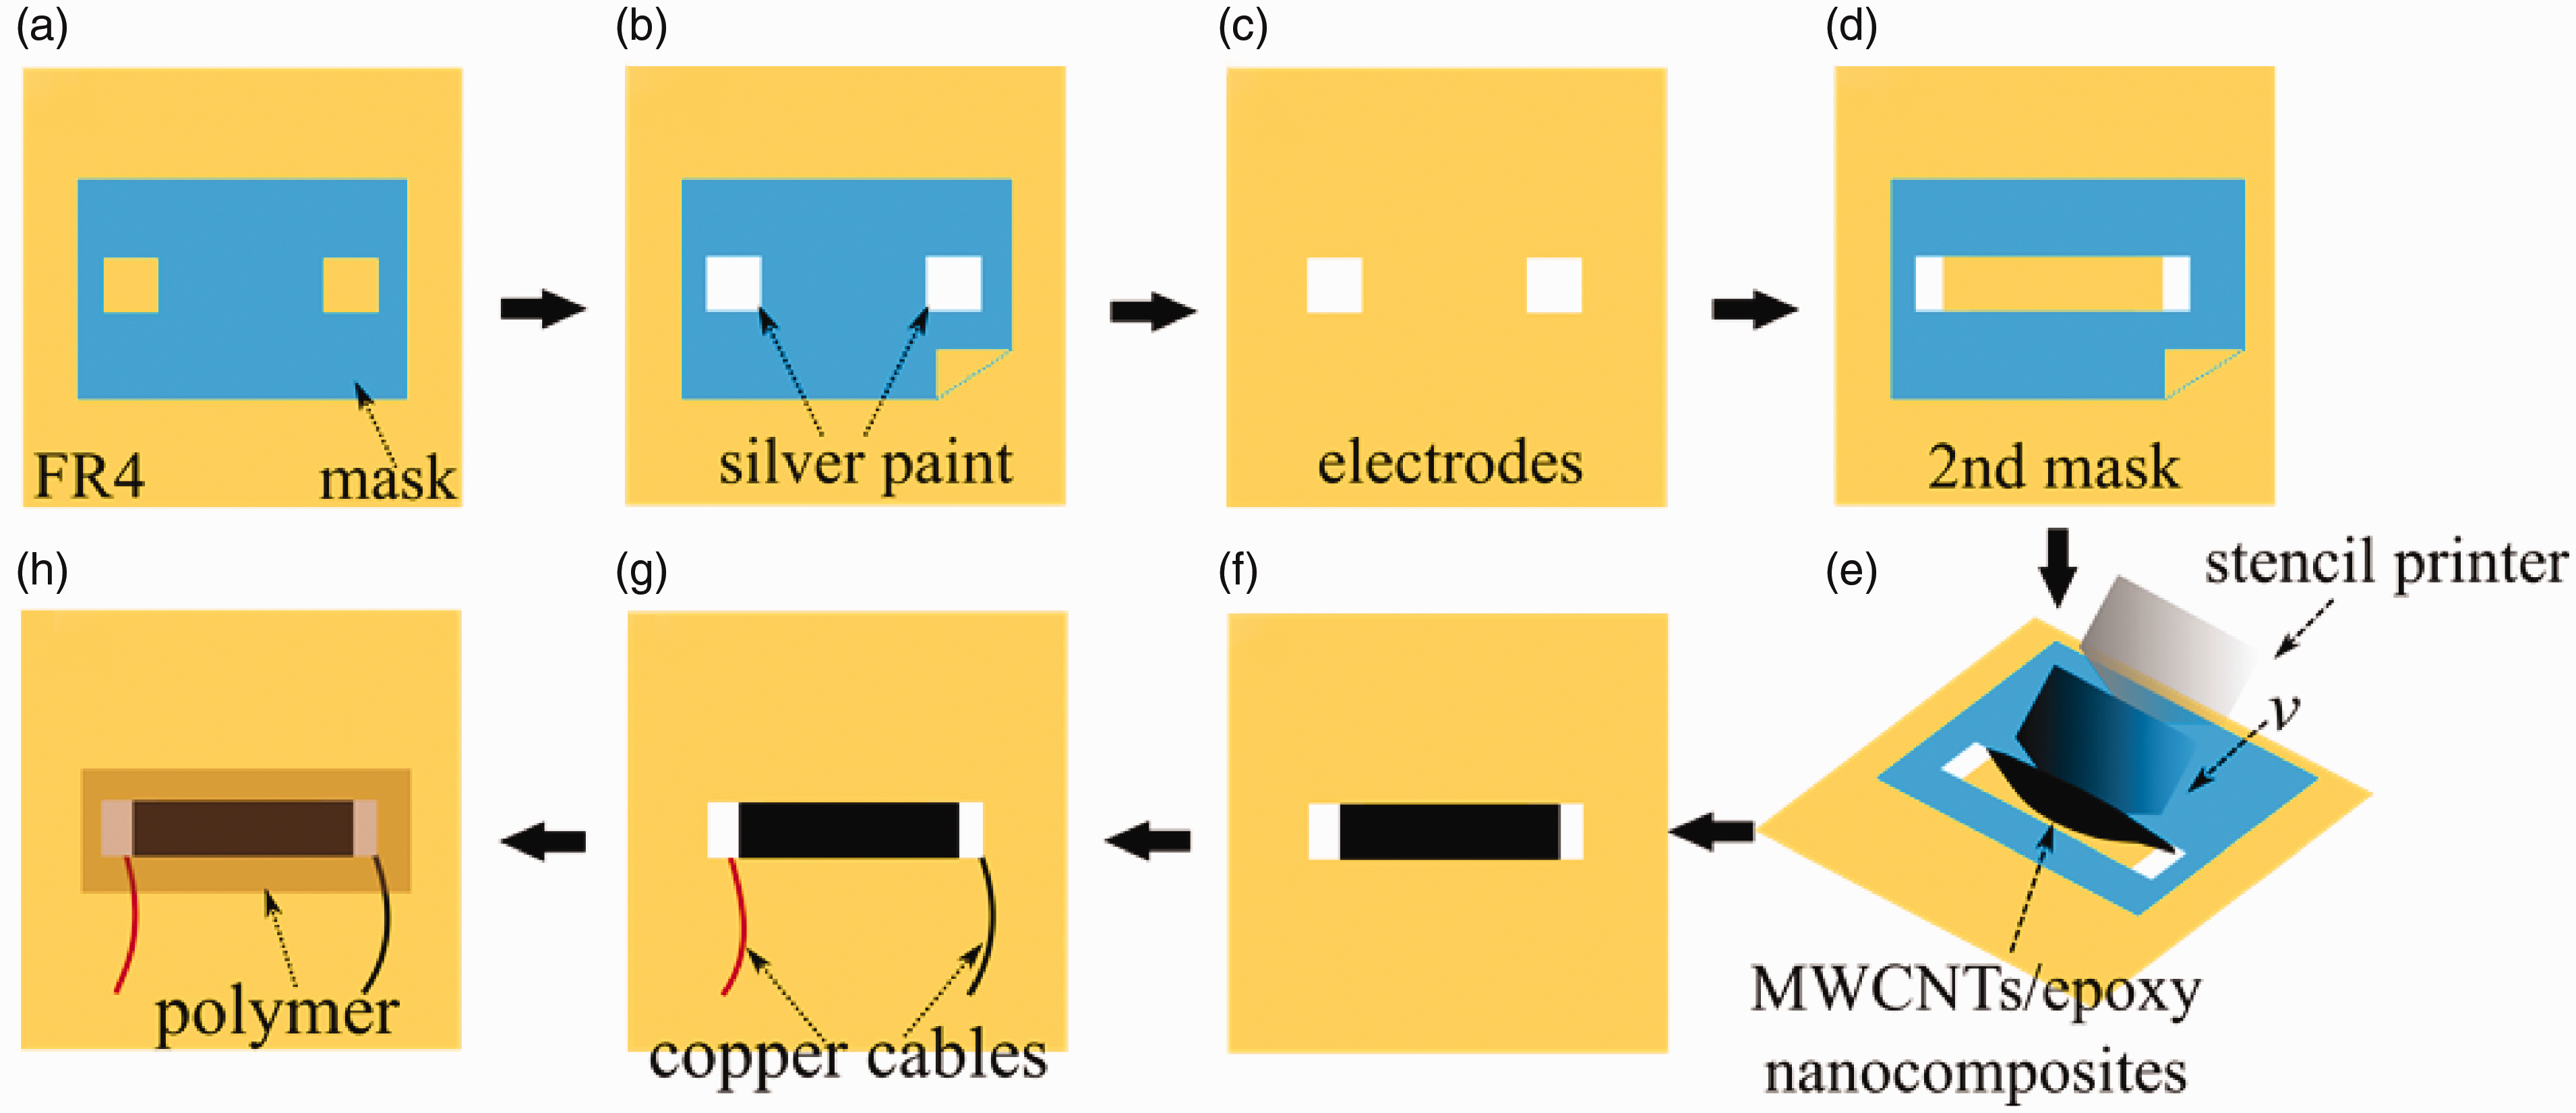
Subsequently, to perform the electromechanical measurements, Agilent 4194A precision impedance analyzer is used for impedance measurements. To do this, a certain amount of the conductive silver paste is applied at both side of the sample and it was dried overnight in a clean chamber. Later, in order to minimize the humidity effect, sensor is encapsulated by a thin layer of the latex polymer. The deposition and encapsulation process is schematically illustrated in Figure 1.
Experimental setup for quasi-static tensile loading and impedance measurements
To conduct the quasi-static strain measurements, one side of the FR4 cantilever beam is rigidly clamped between two iron blocks shown in Figure 2. Then the cantilever beam is loaded from 50 g to 350 g with the step of 50 g and the corresponding impedance readings are recorded by a LabVIEW program. Subsequently, EIS Spectrum Analyzer fitting tool
46
is used to extract the model obtained from the impedance spectroscopy.
(a) Top view and (b) Side view of the experimental setup for impedance analysis of MWCNTs/epoxy nanocomposite-based sensor under quasi-static uniaxial tensile loading. The nanocomposite-based sensor is connected to the EIS system and 1 Vpp excitation voltage is applied to the sensor for the frequency range of 100 Hz to 10 MHz.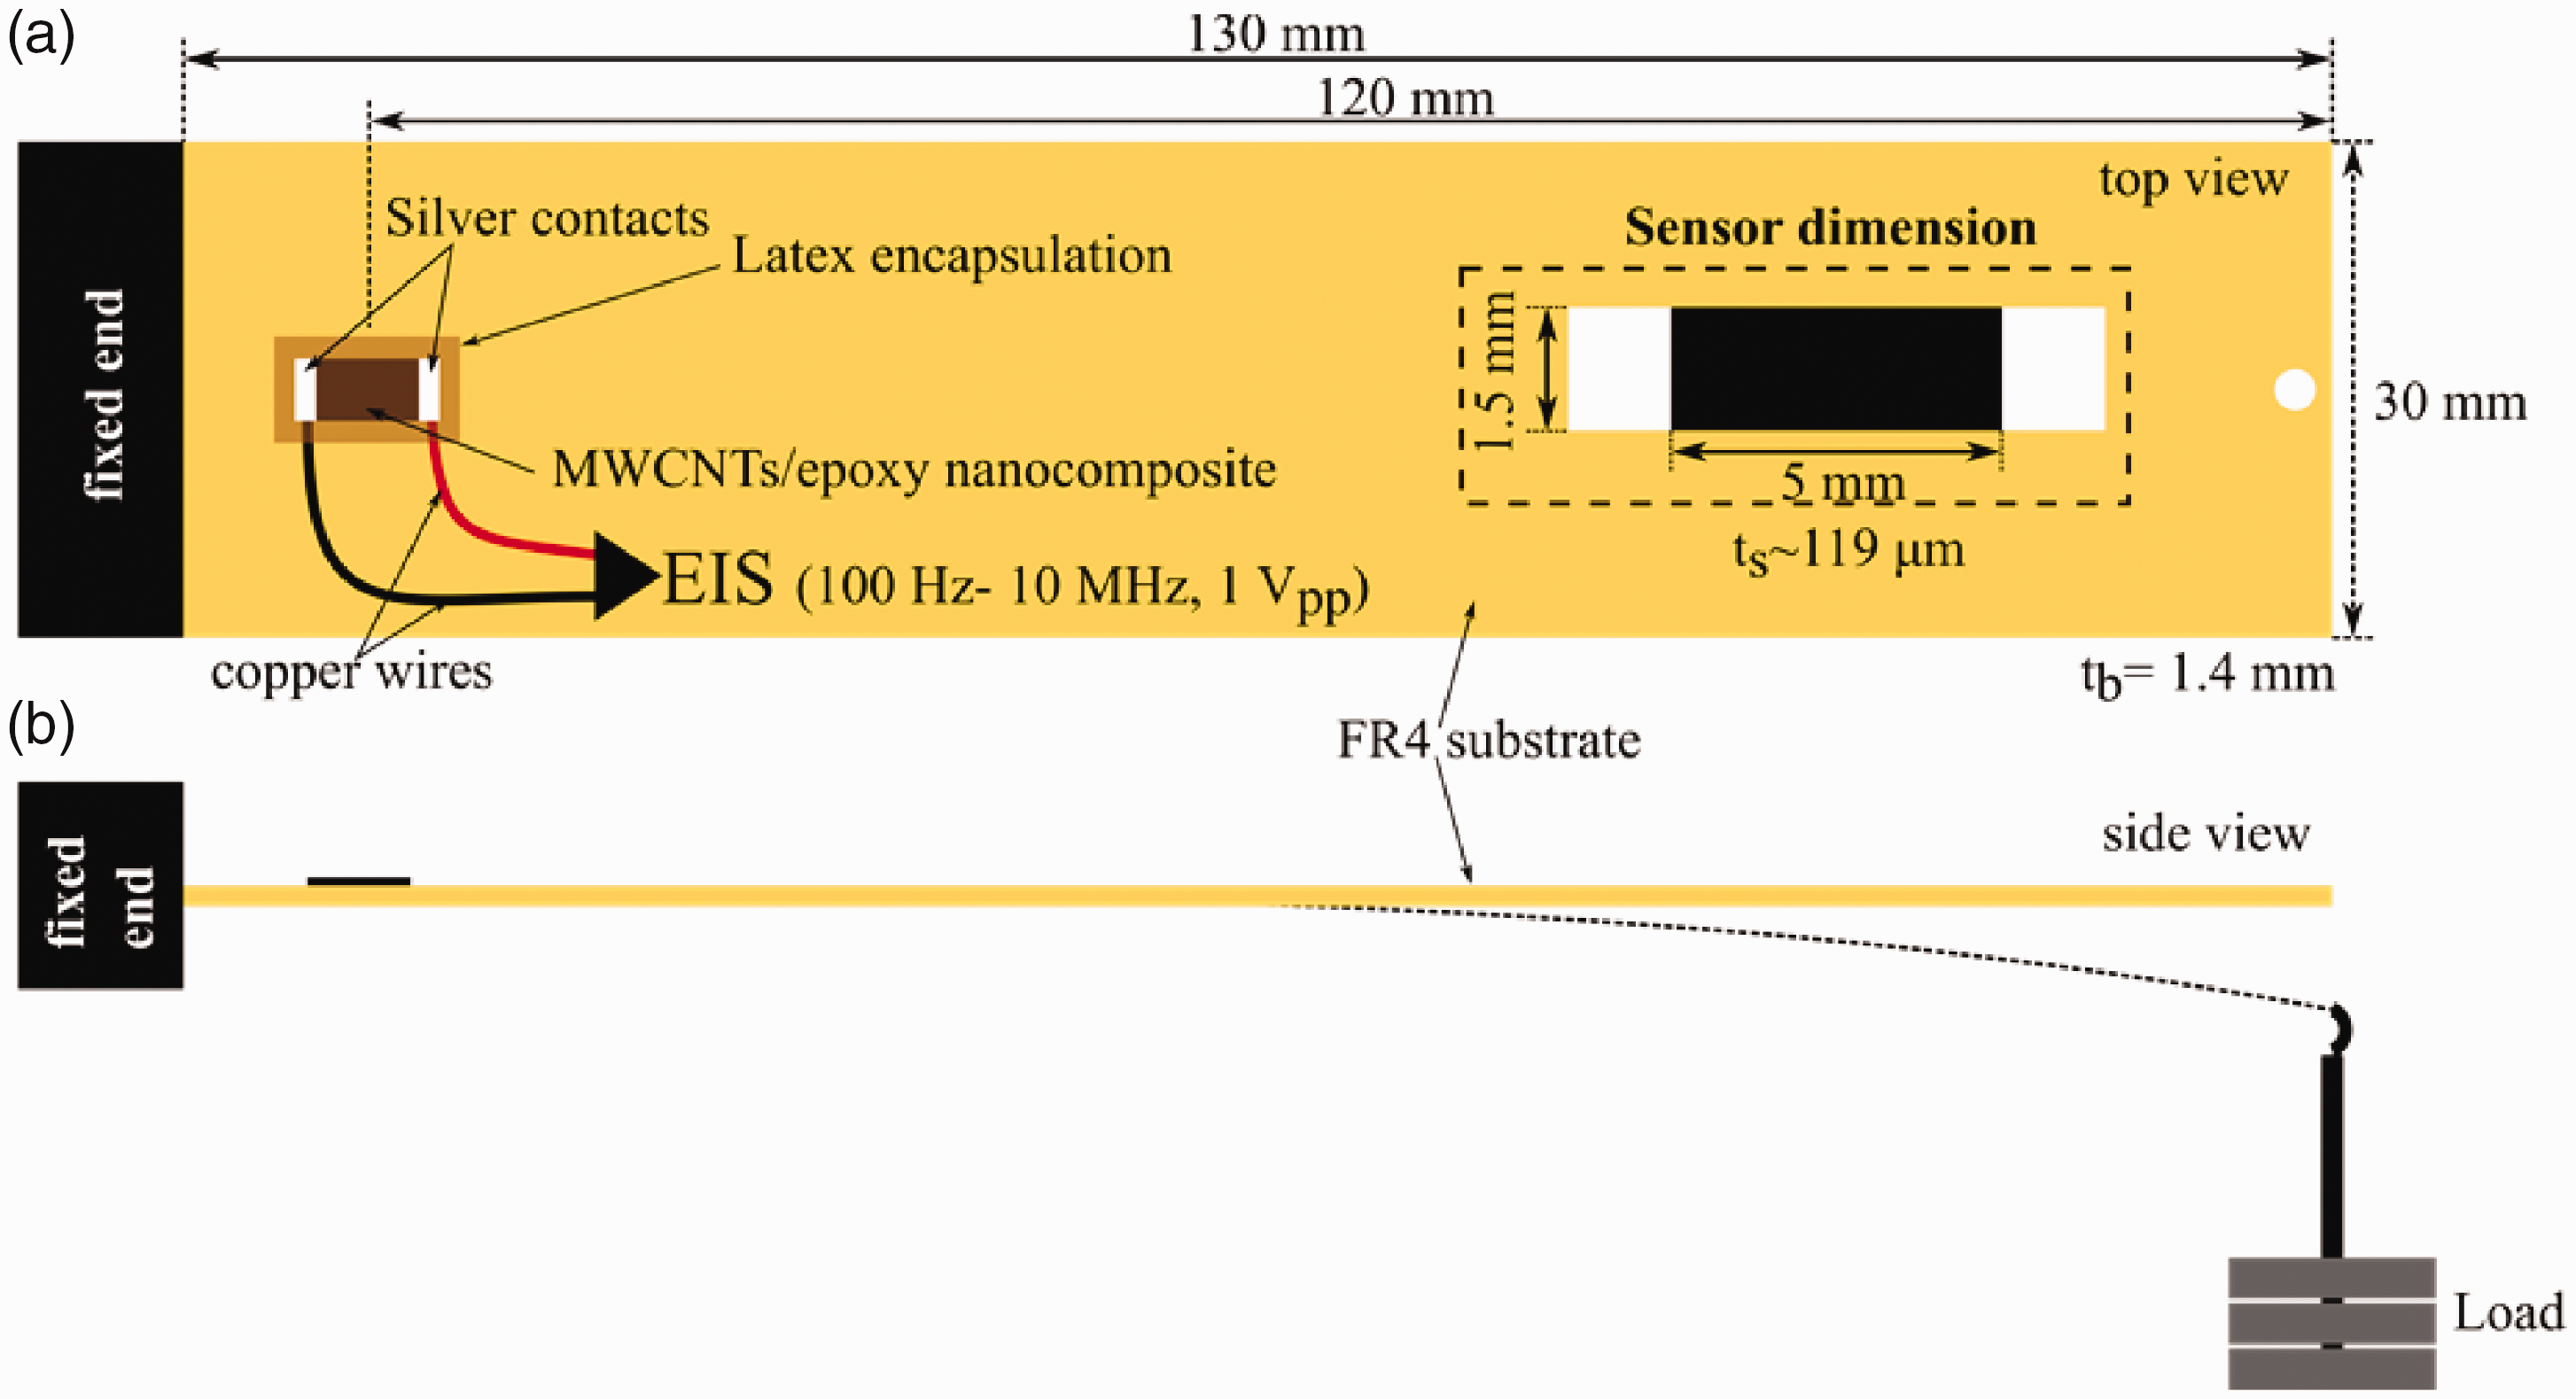
To calculate the amount of the applied strain on the sensor, cantilever beam theory-based formula is used
47

Results and discussion
Dispersion characterization
In order to understand the conduction mechanism of the CNTs/network, dispersion state of the CNTs within the polymer matrix should be well investigated prior to the tensile strain measurement. Agglomerated or bundled CNTs result in a non-uniform dispersion, which causes poor bonding between CNTs and polymer. Therefore, it is required to get an efficient and powerful synthesis for homogeneous CNTs distribution in the polymer since the agglomerated CNTs network has a negative effect on the physical properties of nanocomposites.
In this study, scanning electron microscopy (SEM) is used to check the homogeneity and dispersion state of the MWCNTs/epoxy nanocomposite. For SEM measurements, a small amount of MWCNTs/epoxy nanocomposite is applied on a silicon wafer that is then mounted on an SEM stub. The sample is then partially coated with a thin layer of silver paste to avoid charging during SEM analysis. From the obtained SEM images in different scales shown in Figure 3, it can be seen that MWCNTs are randomly distributed within the epoxy matrix and MWCNTs are homogeneously dispersed within the epoxy polymer besides some partial agglomerations.
Illustration of partial agglomeration of MWCNTs in MWCNTs/epoxy nanocomposites with 1 wt.% of MWCNTs. Images are taken at different scales 10 µm and 5 µm, respectively. Dashed lines at both images show the partial agglomeration of MWCNTs in epoxy polymer matrix.
Working mechanism and piezoresistivity of MWCNTs/epoxy nanocomposite under uniaxial static tensile loading
Based on various conducted studies, the piezoresistivity mechanism of the MWCNTs/polymer nanocomposites is attributed to three main mechanisms, which are the change in tunneling resistance, loss of the contacts between the CNTs and piezoresistivity of individual CNTs.48–50 For the strain values below 1%, both piezoresistivity of individual CNTs and destruction of nanotube–nanotube contacts can be omitted.35,50
In most of CNTs-based nanocomposites, CNTs are not physically in contact due to inevitable polymer medium where the tunneling effect occurs and it dominates the conduction mechanism of the nanocomposite.26,51 The tunneling resistance is defined as Rtunnel ∝ (d) exp(cd), where c is the constant and d is the distance between CNTs.52,53 As schematically shown in Figure 4, MWCNTs/epoxy nanocomposite has a certain impedance value of Z0 under load. Under tensile loading (F = F1), the distance between CNTs increases so that the corresponding impedance value increases.
Schematic illustration of the piezoresistivity mechanism of MWCNTs/epoxy nanocomposites under static tensile load.
Impedance response of MWCNTs/epoxy nanocomposite under static tensile loading
Figure 5 shows the impedance response of the MWCNTs/epoxy nanocomposite-based strain sensor under static tensile loading from 50 g to 350 g. It is seen that depending on the frequency range, the nanocomposite sensor exhibits two different behaviors, which are frequency-independent (DC, until the critical frequency, f
c
) and frequency-dependent response (AC). Namely, at DC region, CNTs resistive networks arising from tunneling dominate the conduction mechanism and therefore impedance response stays constant until the critical frequency. For instance, while the f
c
at no load is 2.19 kHz, it shifts to 4.95 kHz at 350 g load. After the critical frequency, charge carriers start to flow over capacitive networks that prove the dominance of the capacitive paths in the conduction mechanism. Further, from the piezoresistivity analysis of the nanocomposite, it can be observed that the impedance values increase with the increase of the applied load.
(a) Bode and (b) Nyquist plot of MWCNTs/epoxy-based piezoresistive nanocomposite under tensile loading up to 350 g. Inset figure in (a) shows that the impedance of the nanocomposite increases with the increase of static load. Inset figure in (b) shows the simplified R-CPE equivalent circuit and change in the Re(Z) as a function of the static tensile load.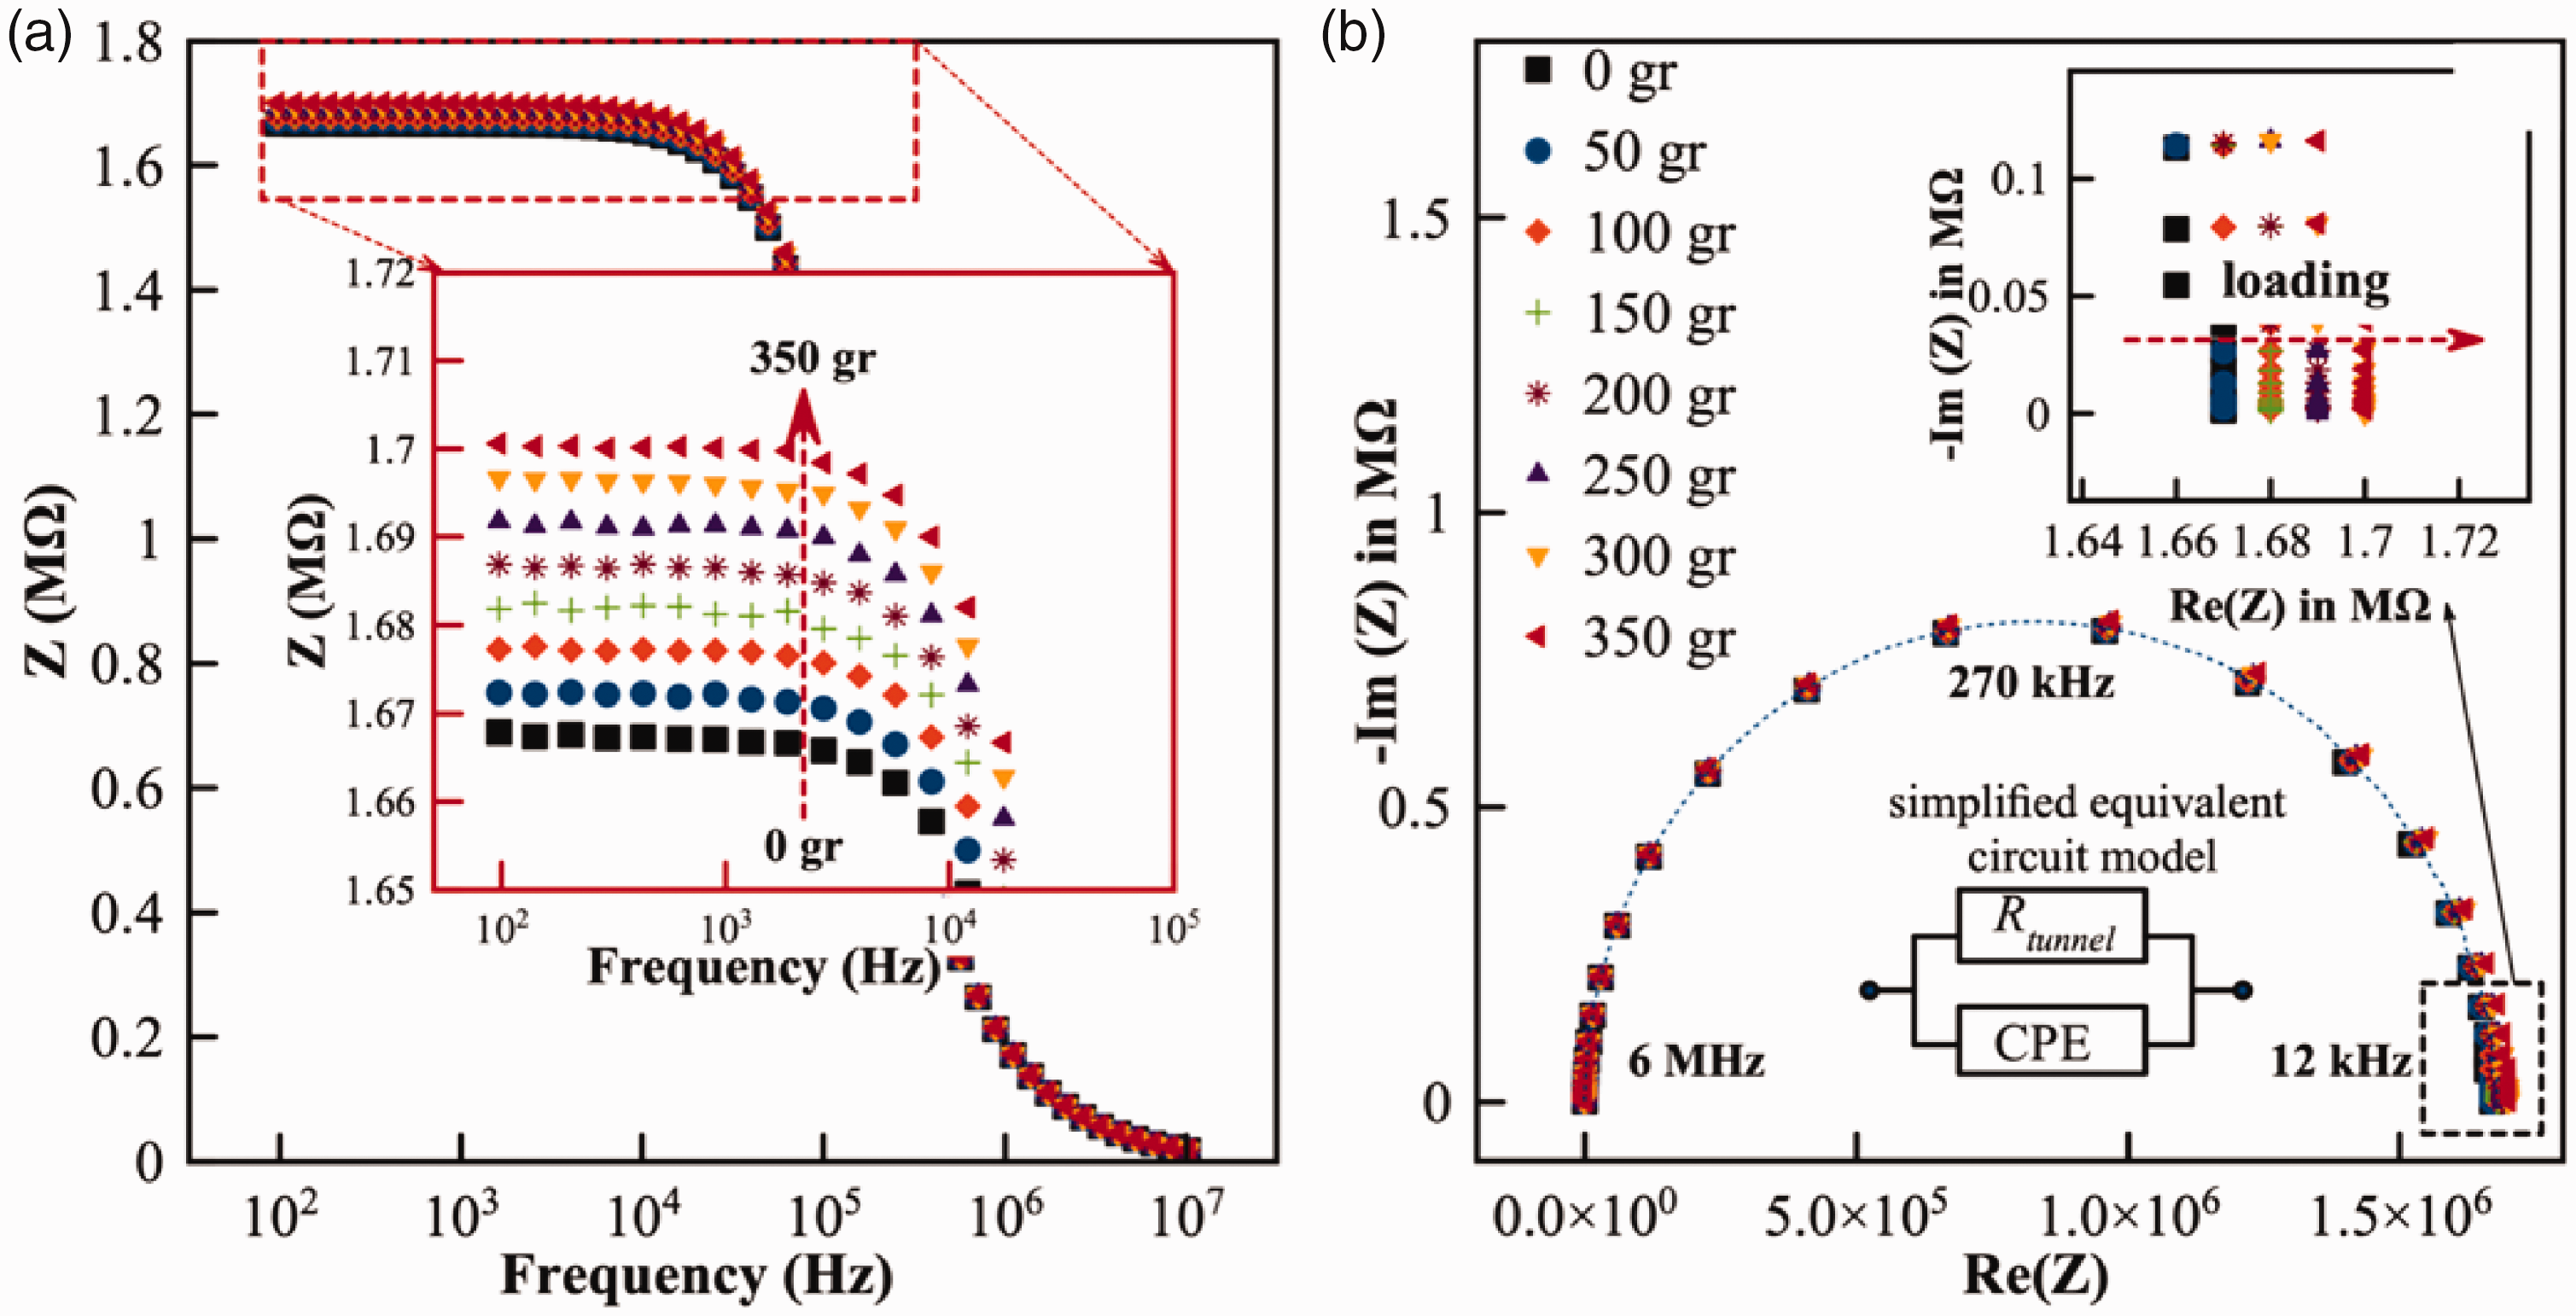
As shown in Figure 5(a), at the first region (frequency-independent, DC) of the impedance response, impedance value of the sensor increases from 1.67 MΩ to 1.7 MΩ under the static tensile load (350 g, 1526 µɛ) that corresponds 1.79% of relative impedance change. From the critical frequency, the sensor starts to show capacitive behavior where impedance value rapidly decreases. Additionally, from the Nyquist plot (see Figure 5(b)), it is seen that the sensor gives a quasi-semi-circle response. Under the applied tensile load, it is observed that the real part of the impedance of the sensor increases with the increase of the load.
Figure 6 shows the change of −Im(Z) as a function of applied frequency. Here, it can be again seen that the –Im(Z) shows two different characteristics depending on the operating frequency and –Im(Z) increases with the increase of the tensile loading. Additionally, from the extracted R and CPE (see Figure 6 inset figure b) values as a function of applied tensile loading using EIS Spectrum Analyzer fitting tool, it is also observed that the relative change of R and CPE values gives the opposite response since under the applied strain the distance between CNTs fillers increases that leads to increase of the R and decrease of the CPE values. It is also measured that change in CPE is slightly higher than the change in R under the static tensile load (2.38% and 2.6% for R and CPE, respectively).
Change in Im(Z) as a function of frequency under static tensile loading. Inset figure in (a) shows the closer look of change in Im (Z). (b) Inser figüre shows the simplified extracted relative resistance and CPE changes of the sensor and corresponding linear regressions as a function of the static tensile load.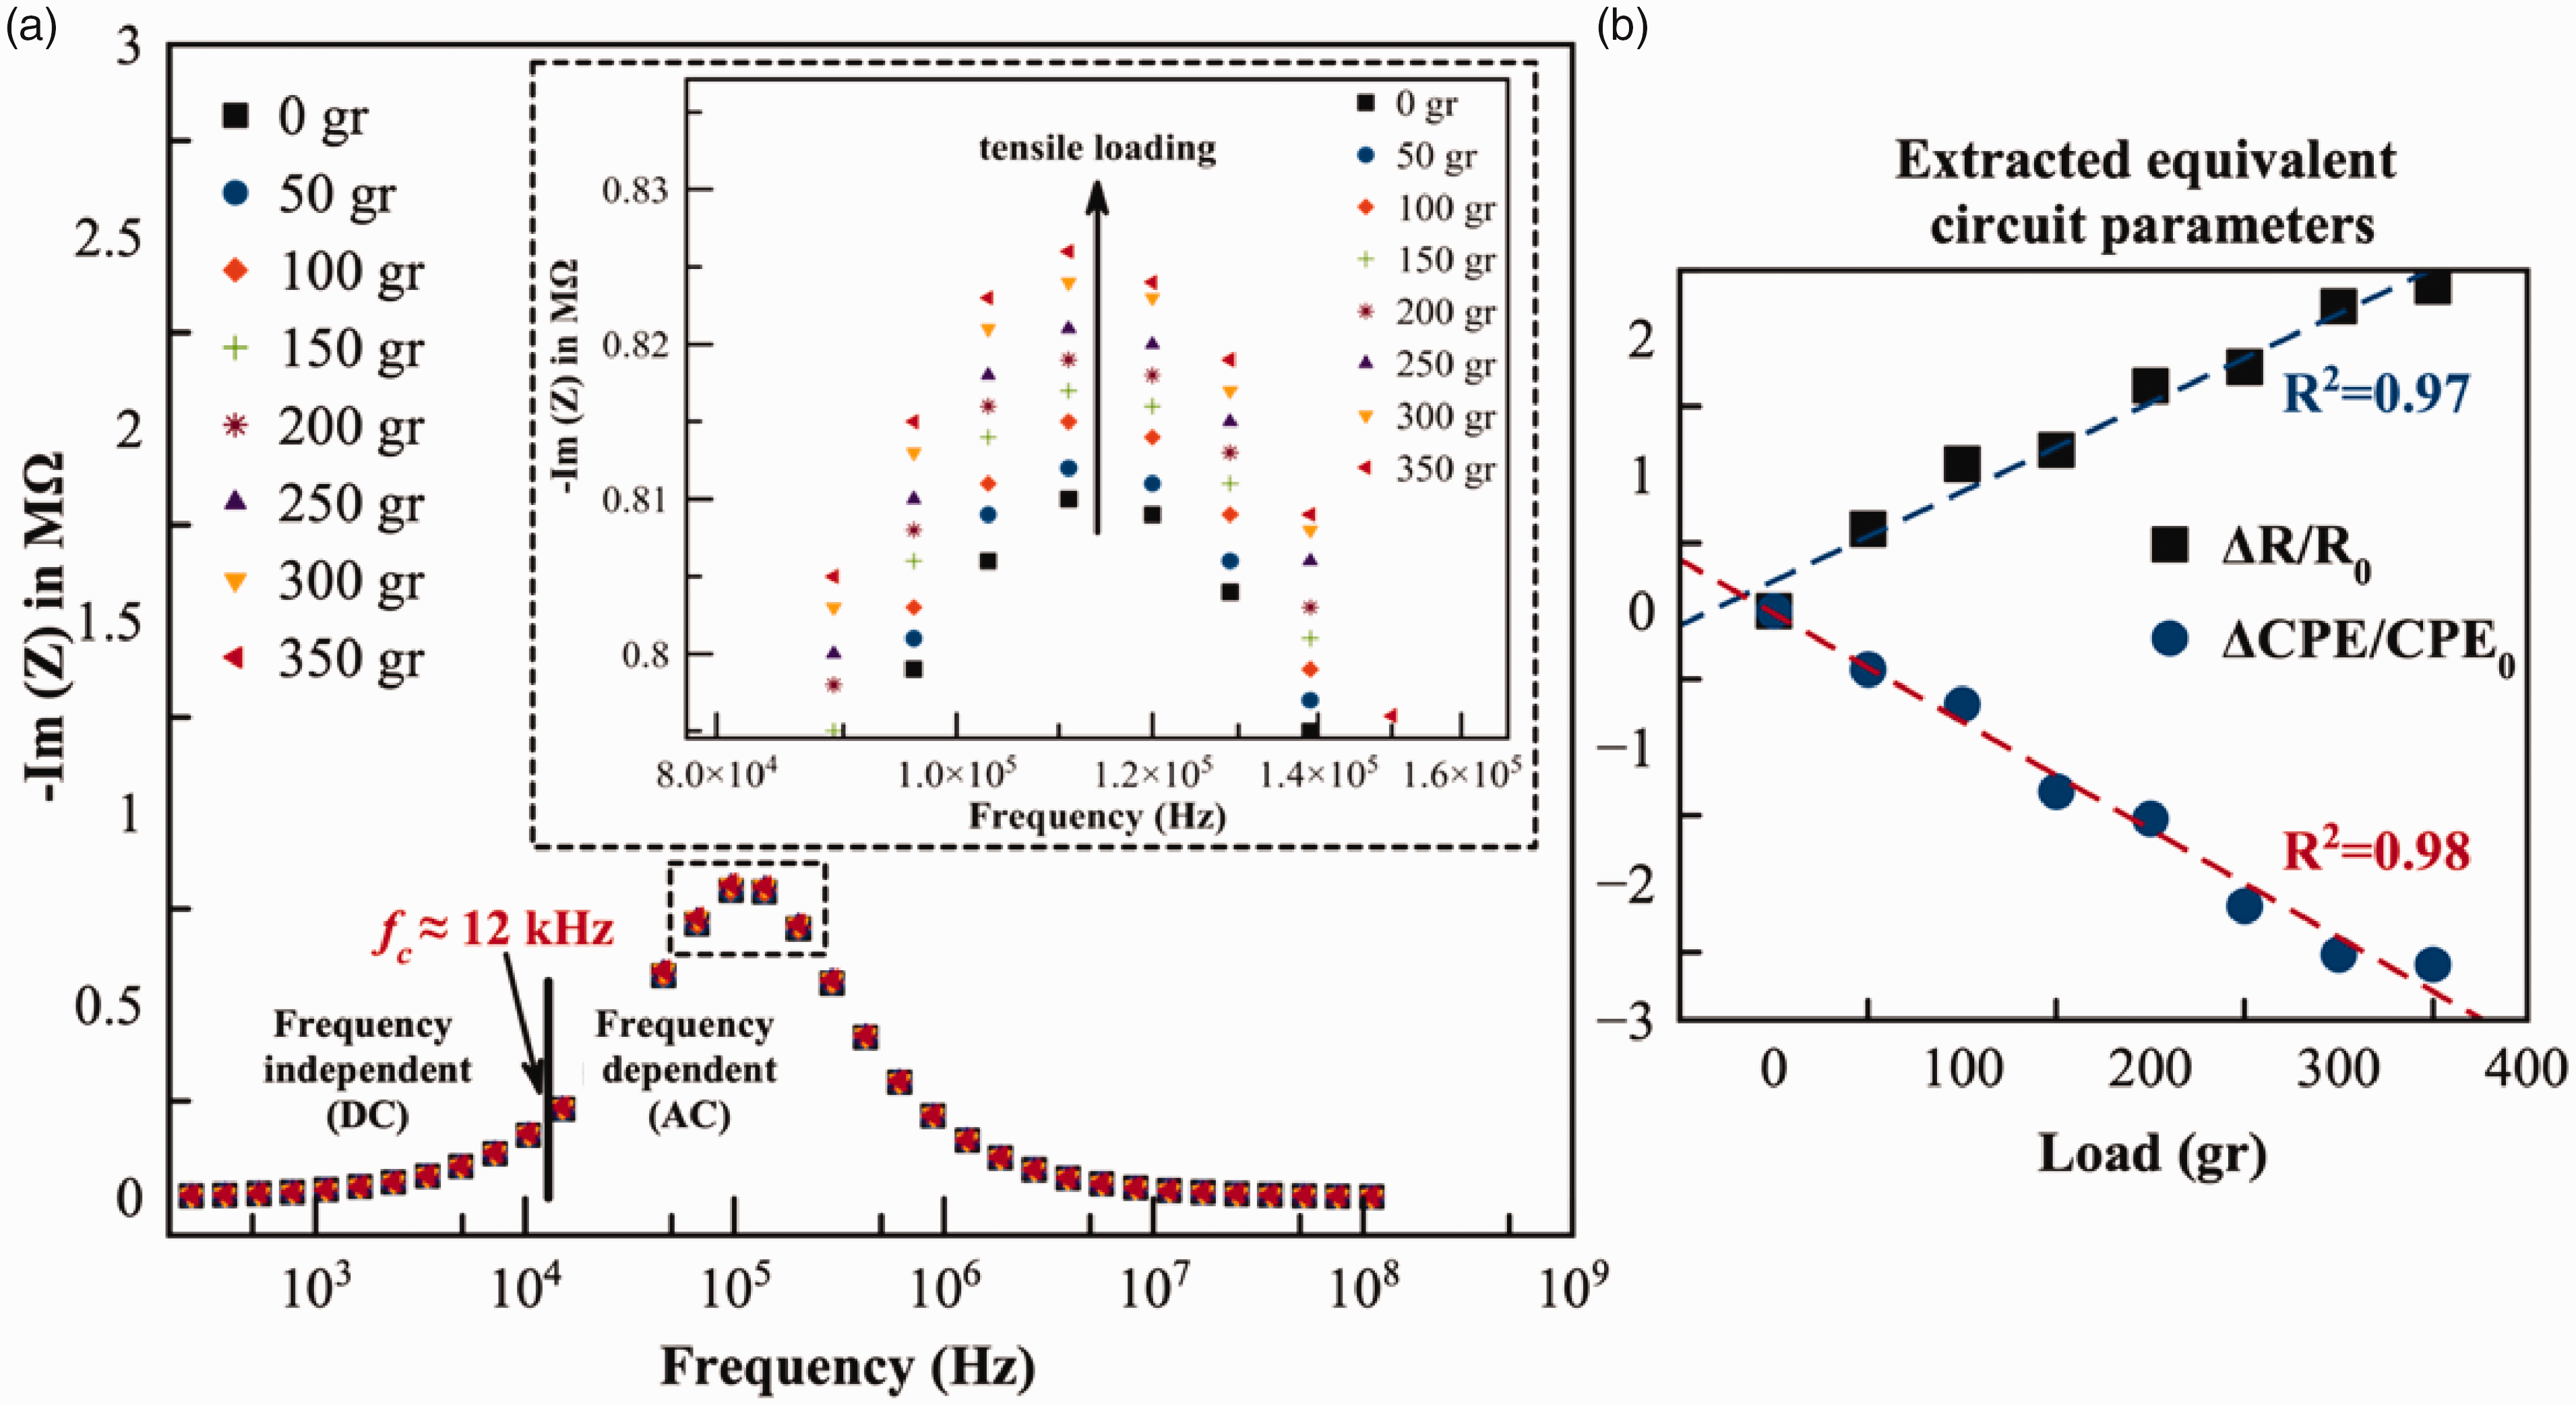
Sensitivity and cyclic quasi-static loading–unloading performance of MWCNTs/epoxy nanocomposite
From the impedance response, the sensitivity of the sensor as a function of the frequency, which relates the relative impedance change of the sensor as a function of the applied static load is defined as K factor (K = (ΔZ/Z0)/ɛ) and it is calculated as shown in Figure 7. Here, it is worth to note that the proposed sensor gives a highly sensitive response compared to commercial metallic strain gauges. It is seen that at the frequency-independent range, the sensitivity of the sensor is stable with the value of around 13, whereas above the critical frequency (approximately 12 kHz) in the frequency-dependent range, the sensitivity starts to decrease sharply up to 8.5 due to the dominance of the capacitive networks. Through this investigation, sensitivity of the sensor can be easily tailored in a wide range of frequency. It is important to note that the obtained resistive and capacitive sensitivity of the sensor are higher than the commercial metallic strain gauges whose sensitivity is around 2.
Relative impedance change and corresponding sensitivities of the MWCNTs/epoxy nanocomposite as a function of the frequency.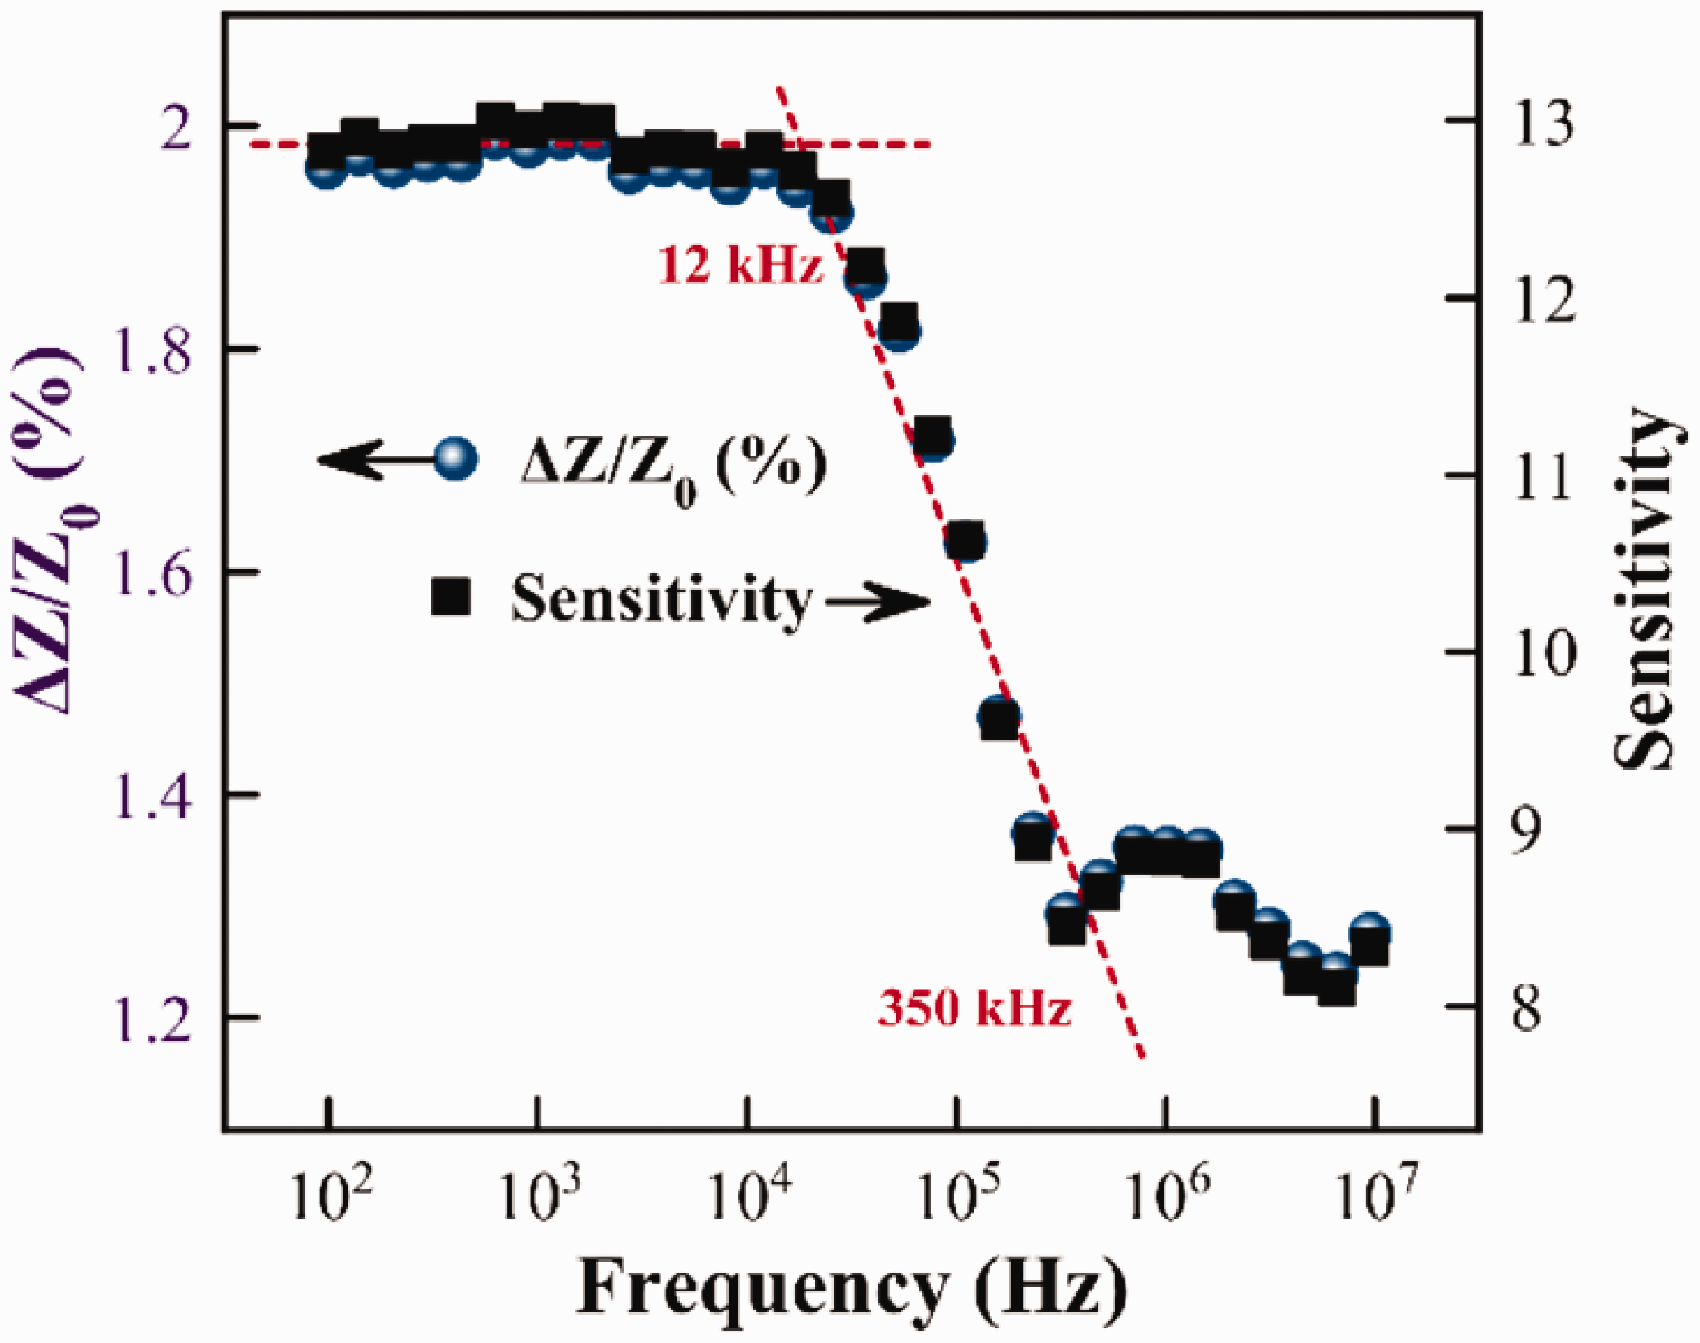
For some practical strain sensor applications, high sensitivity is desired to obtain an adequate resolution. Hence, the proposed sensor sensitivity is examined as a function of relative frequency shift under applied tensile load as shown in Figure 8. It can be seen that under static tensile load (350 g), the critical frequency of the sensor response increases with the increase of the load with the linearity factor of 0.99. Here, critical frequency change shifts linearly from 2.19 kHz to 4.95 kHz under loading that corresponds to a quite high relative critical frequency change of 126%. In addition, it is also observed that the under tensile load, the frequency independence of the sensor gradually increases.
The relative impedance change of the nanocomposite under load with the linear shift of the critical frequency. Inset figure shows the relative change in the critical frequency as a function of tensile load.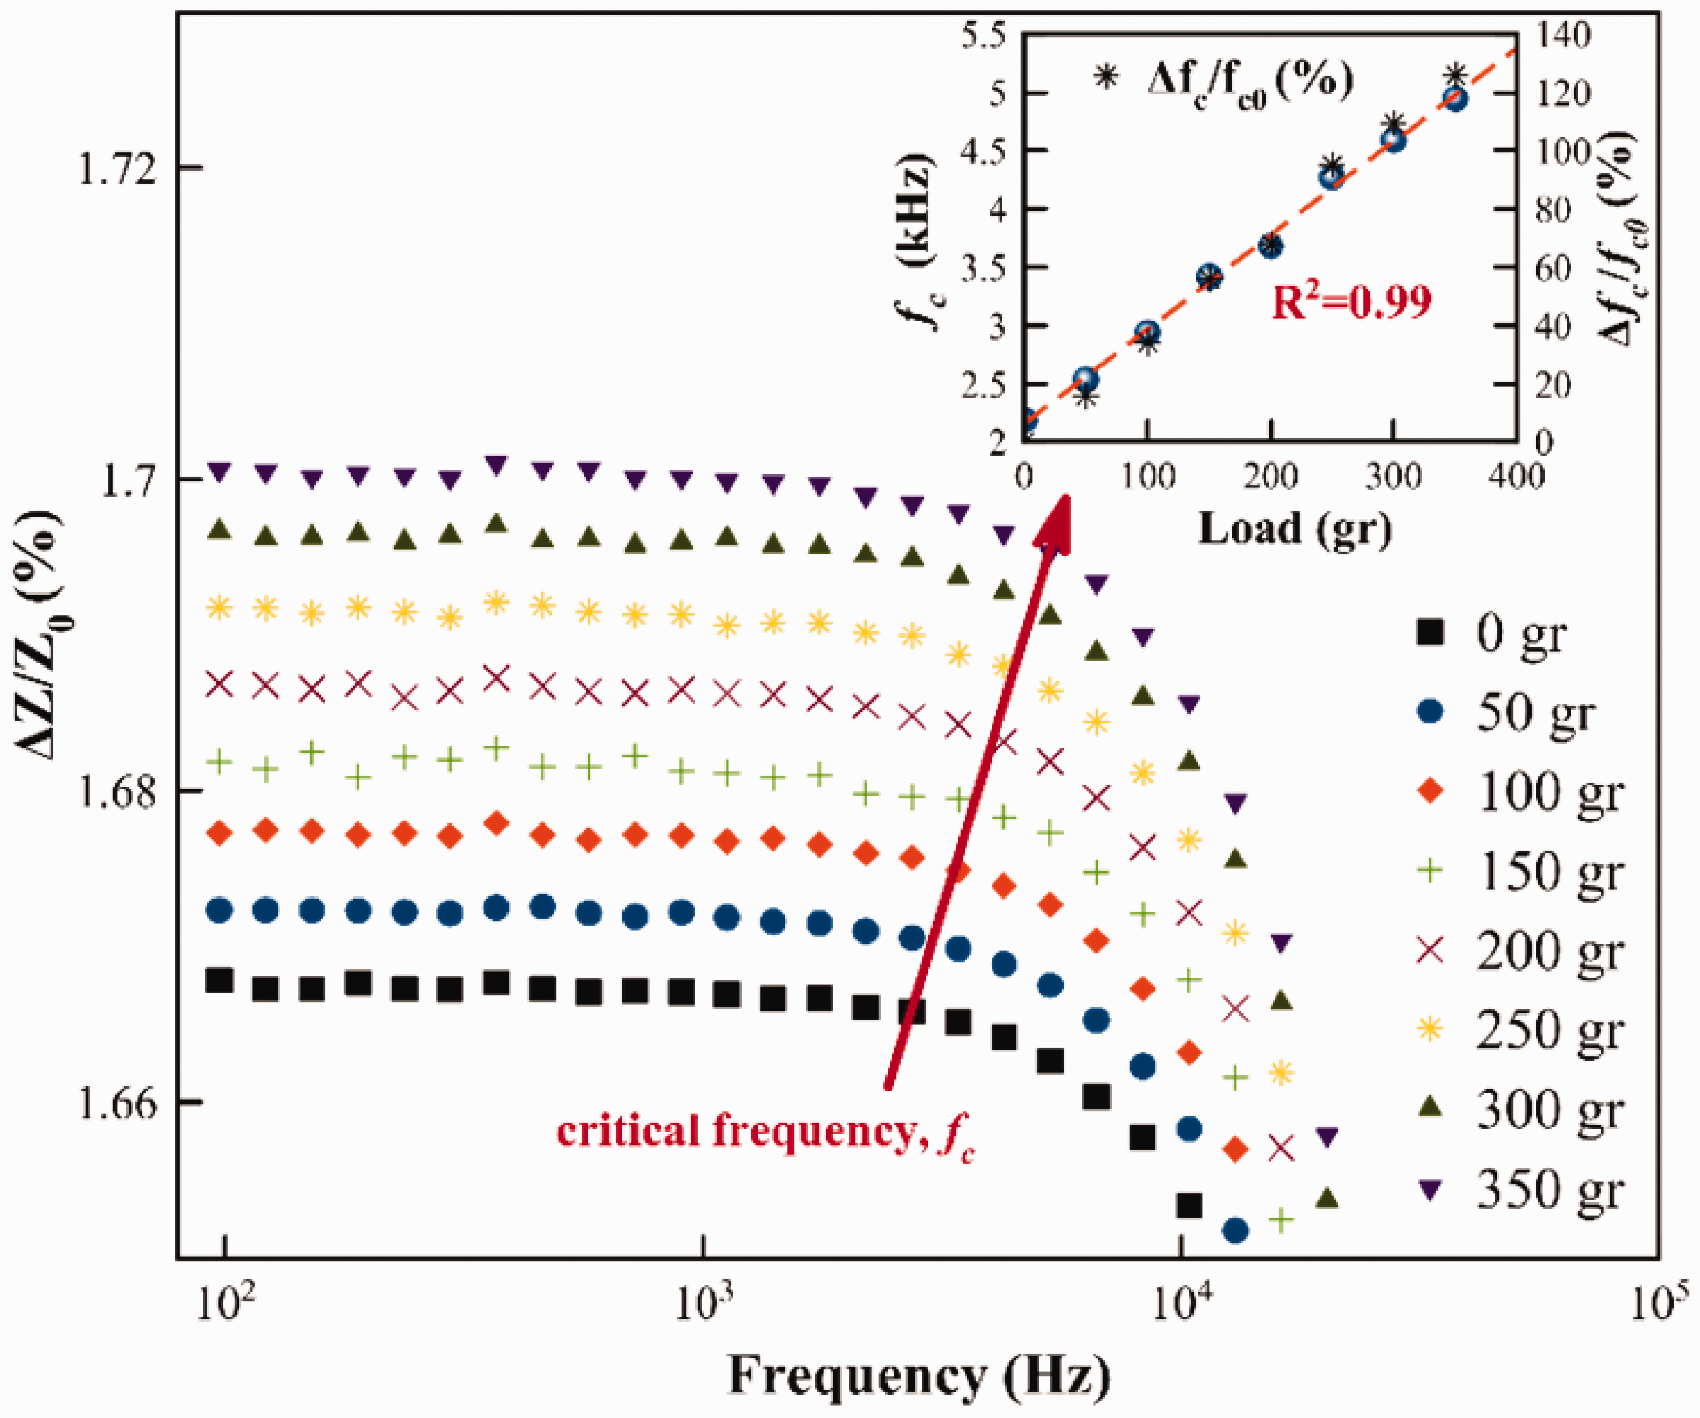
Furthermore, the sensor is subjected to the cyclic quasi-static loading and unloading tests for different frequency ranges to evaluate the cyclic response and repeatability of the sensor as shown in Figure 9. Here, the sensor is loaded from 50 g to 350 g with the step of 50 g and for each loading step, corresponding impedance responses are recorded. It is observed that for all frequency ranges, the sensor shows a high degree of the correspondence between the applied static tensile load and the relative change in resistance as well as reversibility. No decay in sensor impedance response is noted that indicates a good piezoresistivity of the sensor. These results show that the proposed sensor also possess a high potential for dynamic loading. However, it is important to note that in particular above the critical frequency, the relative resistance change of the sensor decreases with the increase of the frequency due to loss of the impact of the resistive paths and dominance of capacitive paths. Even though the sensitivity of the strain sensor in DC measurement is higher than the AC, using AC measurement is more reasonable, especially for practical sensor applications. Because, at low-frequency regions (frequency-independent, DC) the change in polarity of the electric field is quite slow so that the molecules get enough time to be polarized.
54
Hence, the polarization is high and it affects the sensor performance. Therefore, i.e., under the load, the measured resistance value of the sensor at the time (t = 0) is not the actual resistance value. Contrarily, polarization effects can be eliminated or minimized by increasing the operation frequency. At high frequencies, the degree of polarization is quite less since the polarity of the applied electric field changes much faster than the orientation of dipoles.
55
So that, not only there is no need to wait until the sensor is charged, but also the changes in the electrical resistance in the MWCNTs/epoxy nanocomposite can be directly linked to the applied strain.
Cyclic quasi-static loading and unloading piezoresistive response of the MWCNTs/epoxy nanocomposite from 50 g to 350 g for different frequency regions at stable room temperature. Inset figure shows the close look of the cyclic piezoresistive response of the nanocomposite for 100 Hz.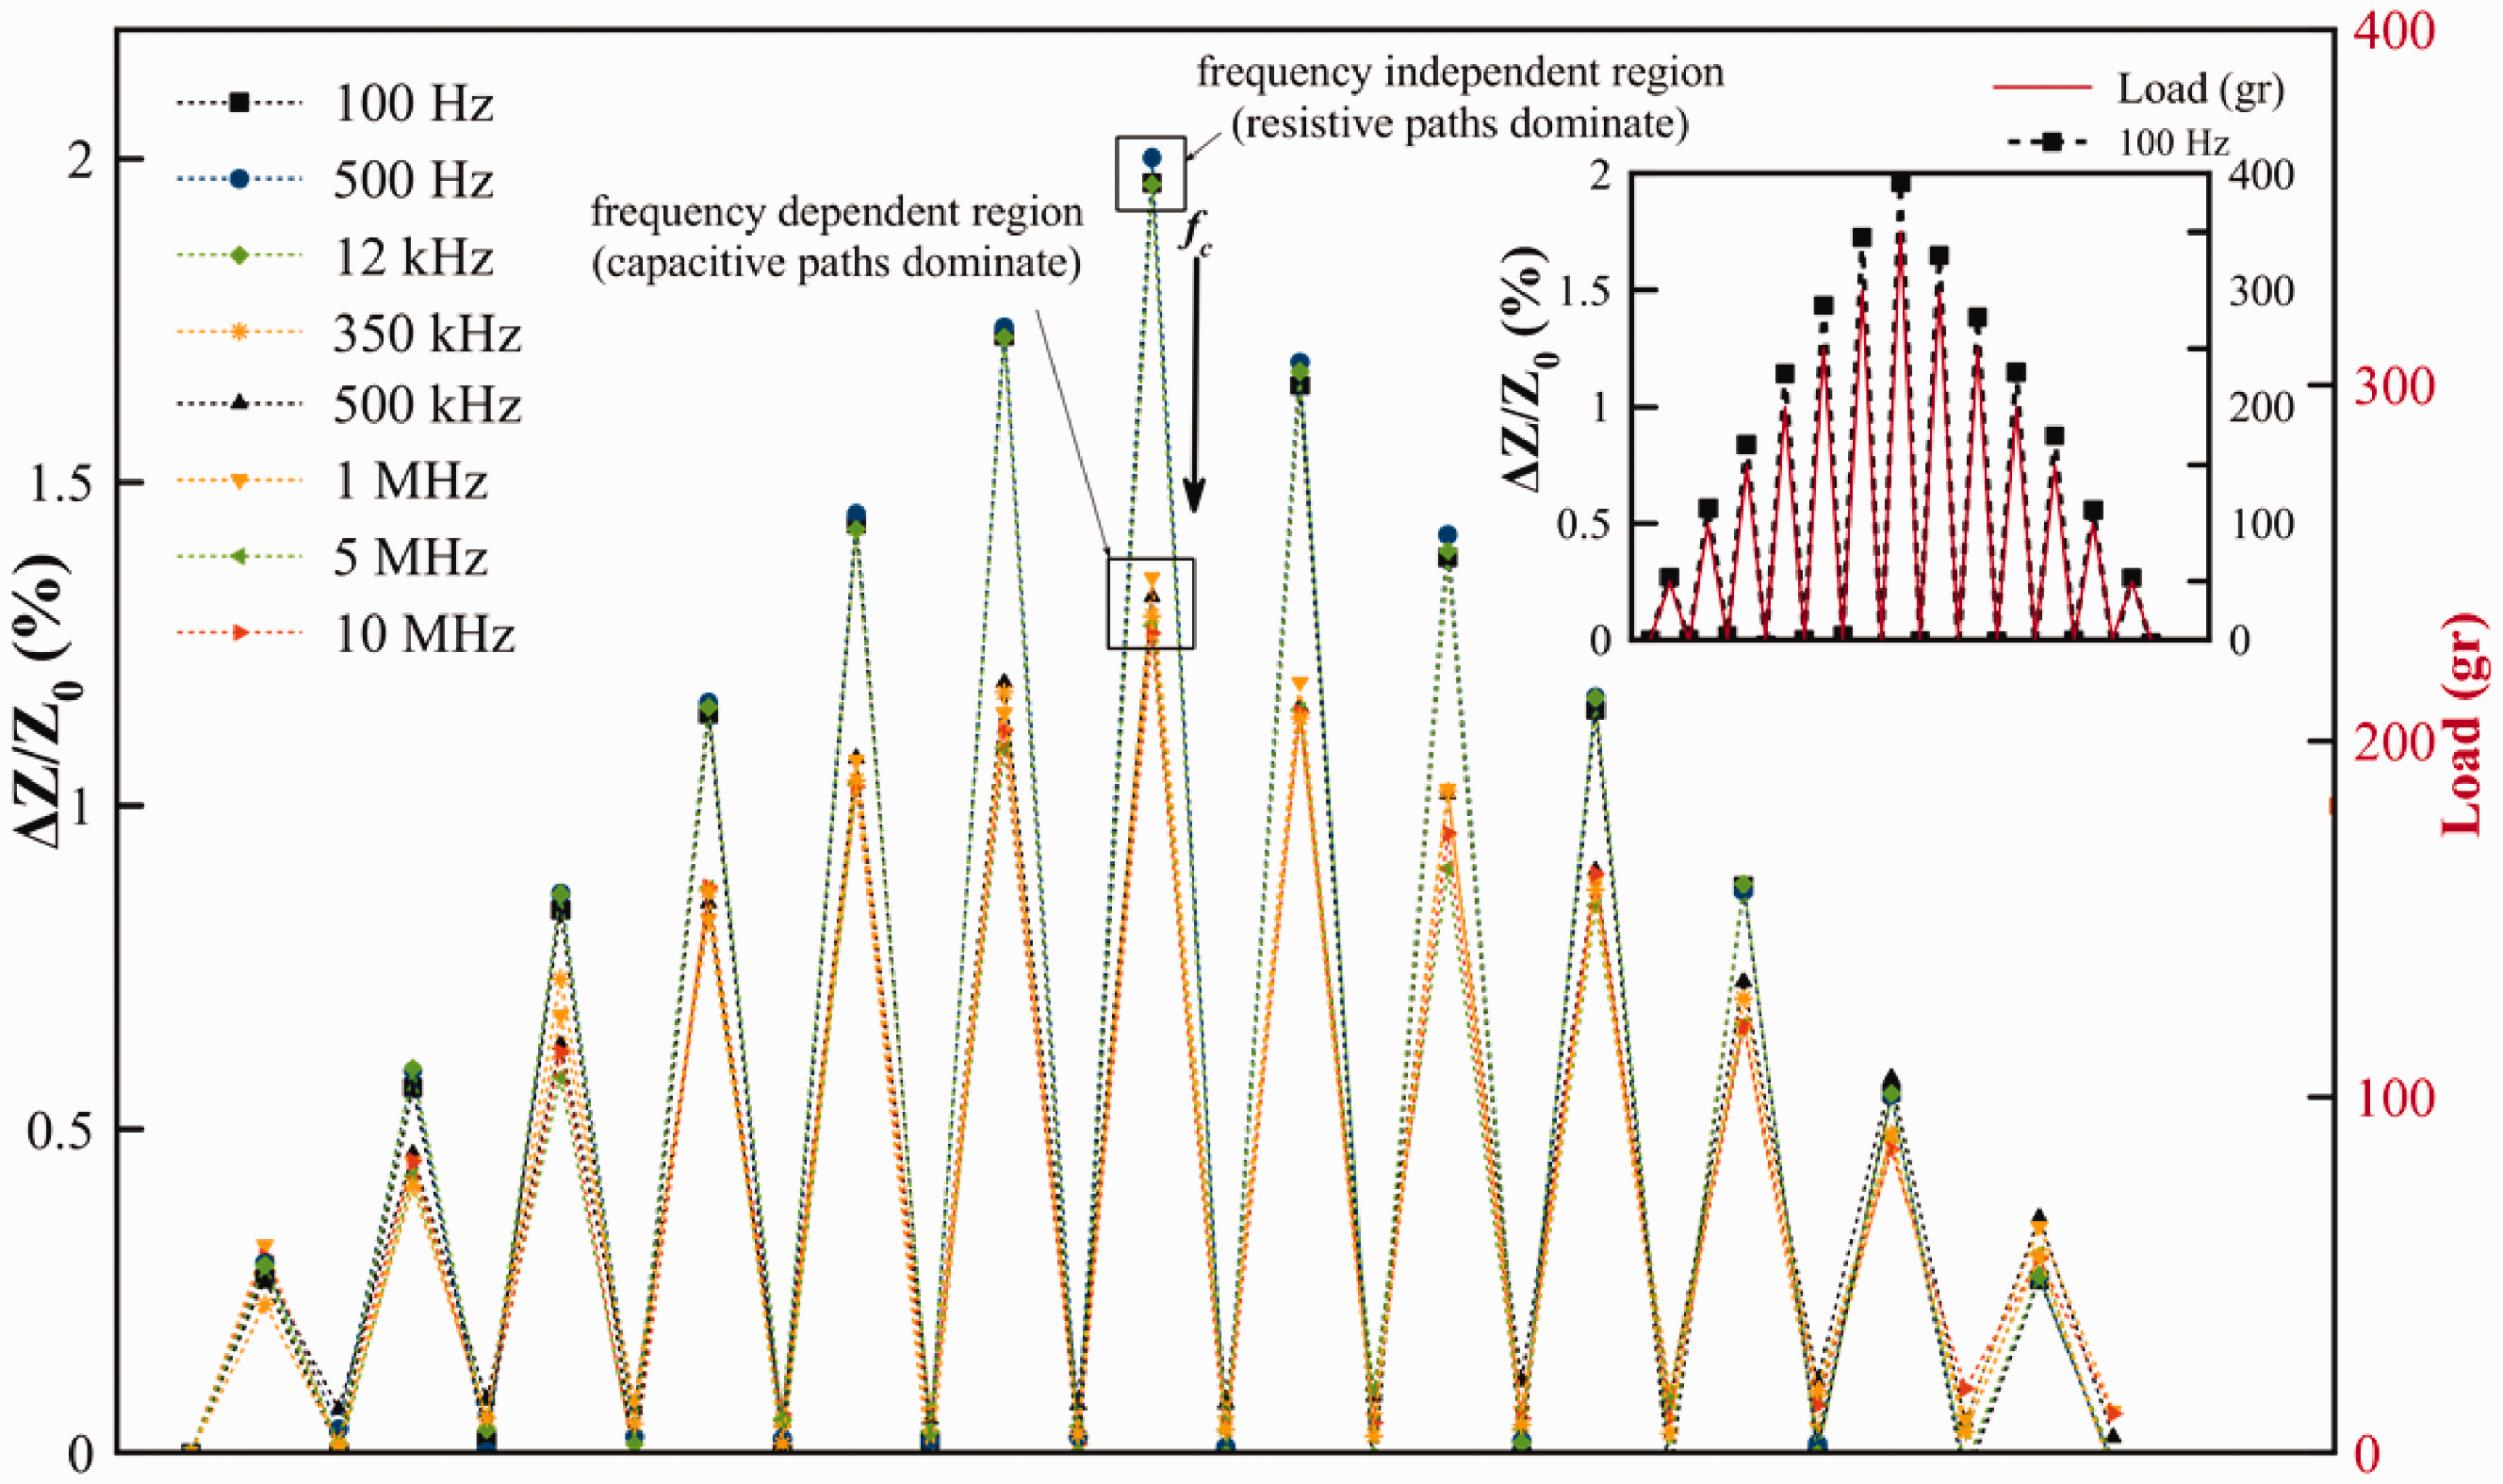
Sensor linearity and hysteresis behavior under different frequency ranges
Beside high sensitivity and repeatability under quasi-static loading and unloading, sensor linearity and hysteresis are also important parameters to investigate. Non-linearity can be a drawback for practical sensor applications that require complex linearization and calibration processes. As shown in Figure 10, the proposed sensor shows a highly linear response and this linearity slightly decreases with the increase of the frequency due to the role and dominant contribution of the capacitive paths. While at frequency-independent range, sensor gives a quite high linearity with the linearity factor of 0.99, and in the frequency-dependent range, linearity slightly decreases to 0.98.
Linearity of the MWCNTs/epoxy nanocomposite for different frequency regions. Inset figure shows the linearity of the nanocomposite for the operation frequency of 100 Hz.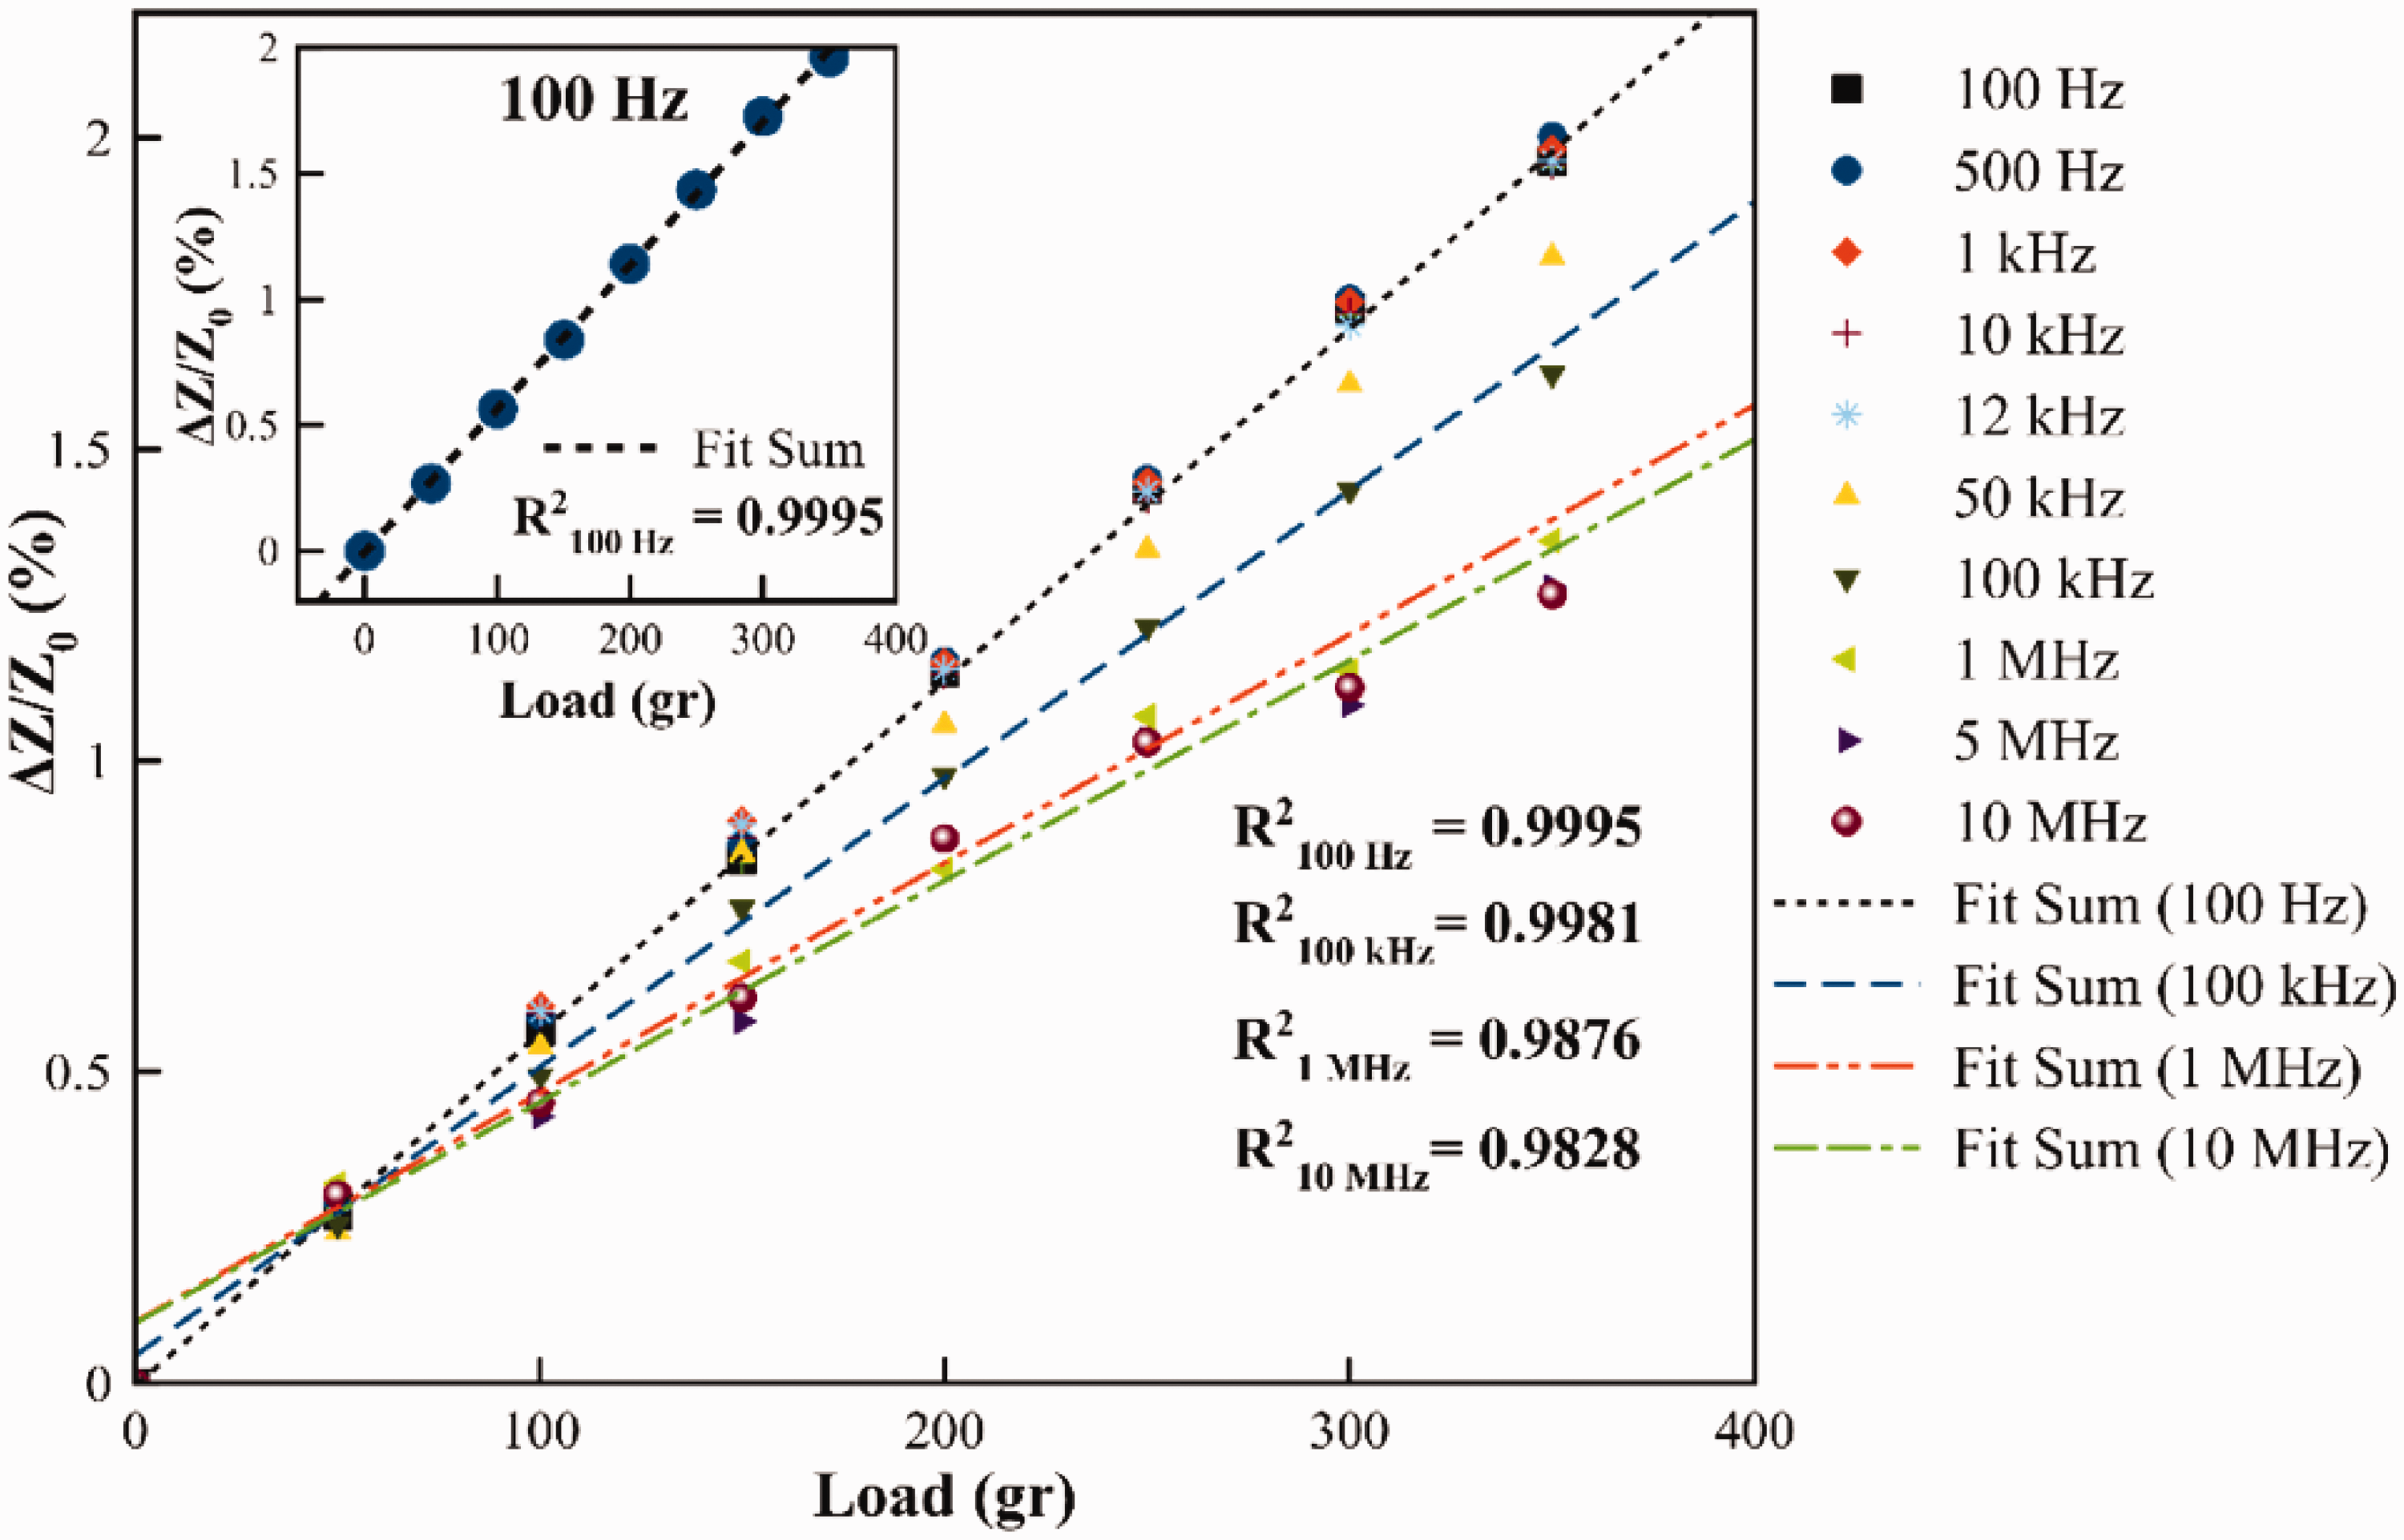
Moreover, hysteresis is another important parameter to examine especially when the sensor is under dynamic load. Hysteresis in the strain sensors based on nanocomposites is mainly attributed to the viscoelastic nature of the polymer matrix and the interaction between the nanofiller and polymers.54–56 Depending on the strength between nanomaterial and polymers, sensor gives different sensing namely hysteresis behaviours. While a weak interfacial binding between fillers and polymer gives high hysteresis due to slippage and irreversible rearrangement of nanofiller, strong interfacial binding would give low hysteresis response.57,58 Figure 11 shows the hysteresis response of the MWCNTs/epoxy nanocomposites under static tensile load for different frequencies. It is seen that for almost all frequency ranges, MWCNTs/epoxy nanocomposite-based strain sensor exhibit low negligible hysteresis owing to the formation of strong interfacial binding between CNTs and epoxy polymer.
Hysteresis profile of the MWCNTs/epoxy nanocomposite under static tensile step load for different frequencies. Inset figure shows the hysteresis of the nanocomposite for the operation frequencies of 100 Hz and 10 MHz.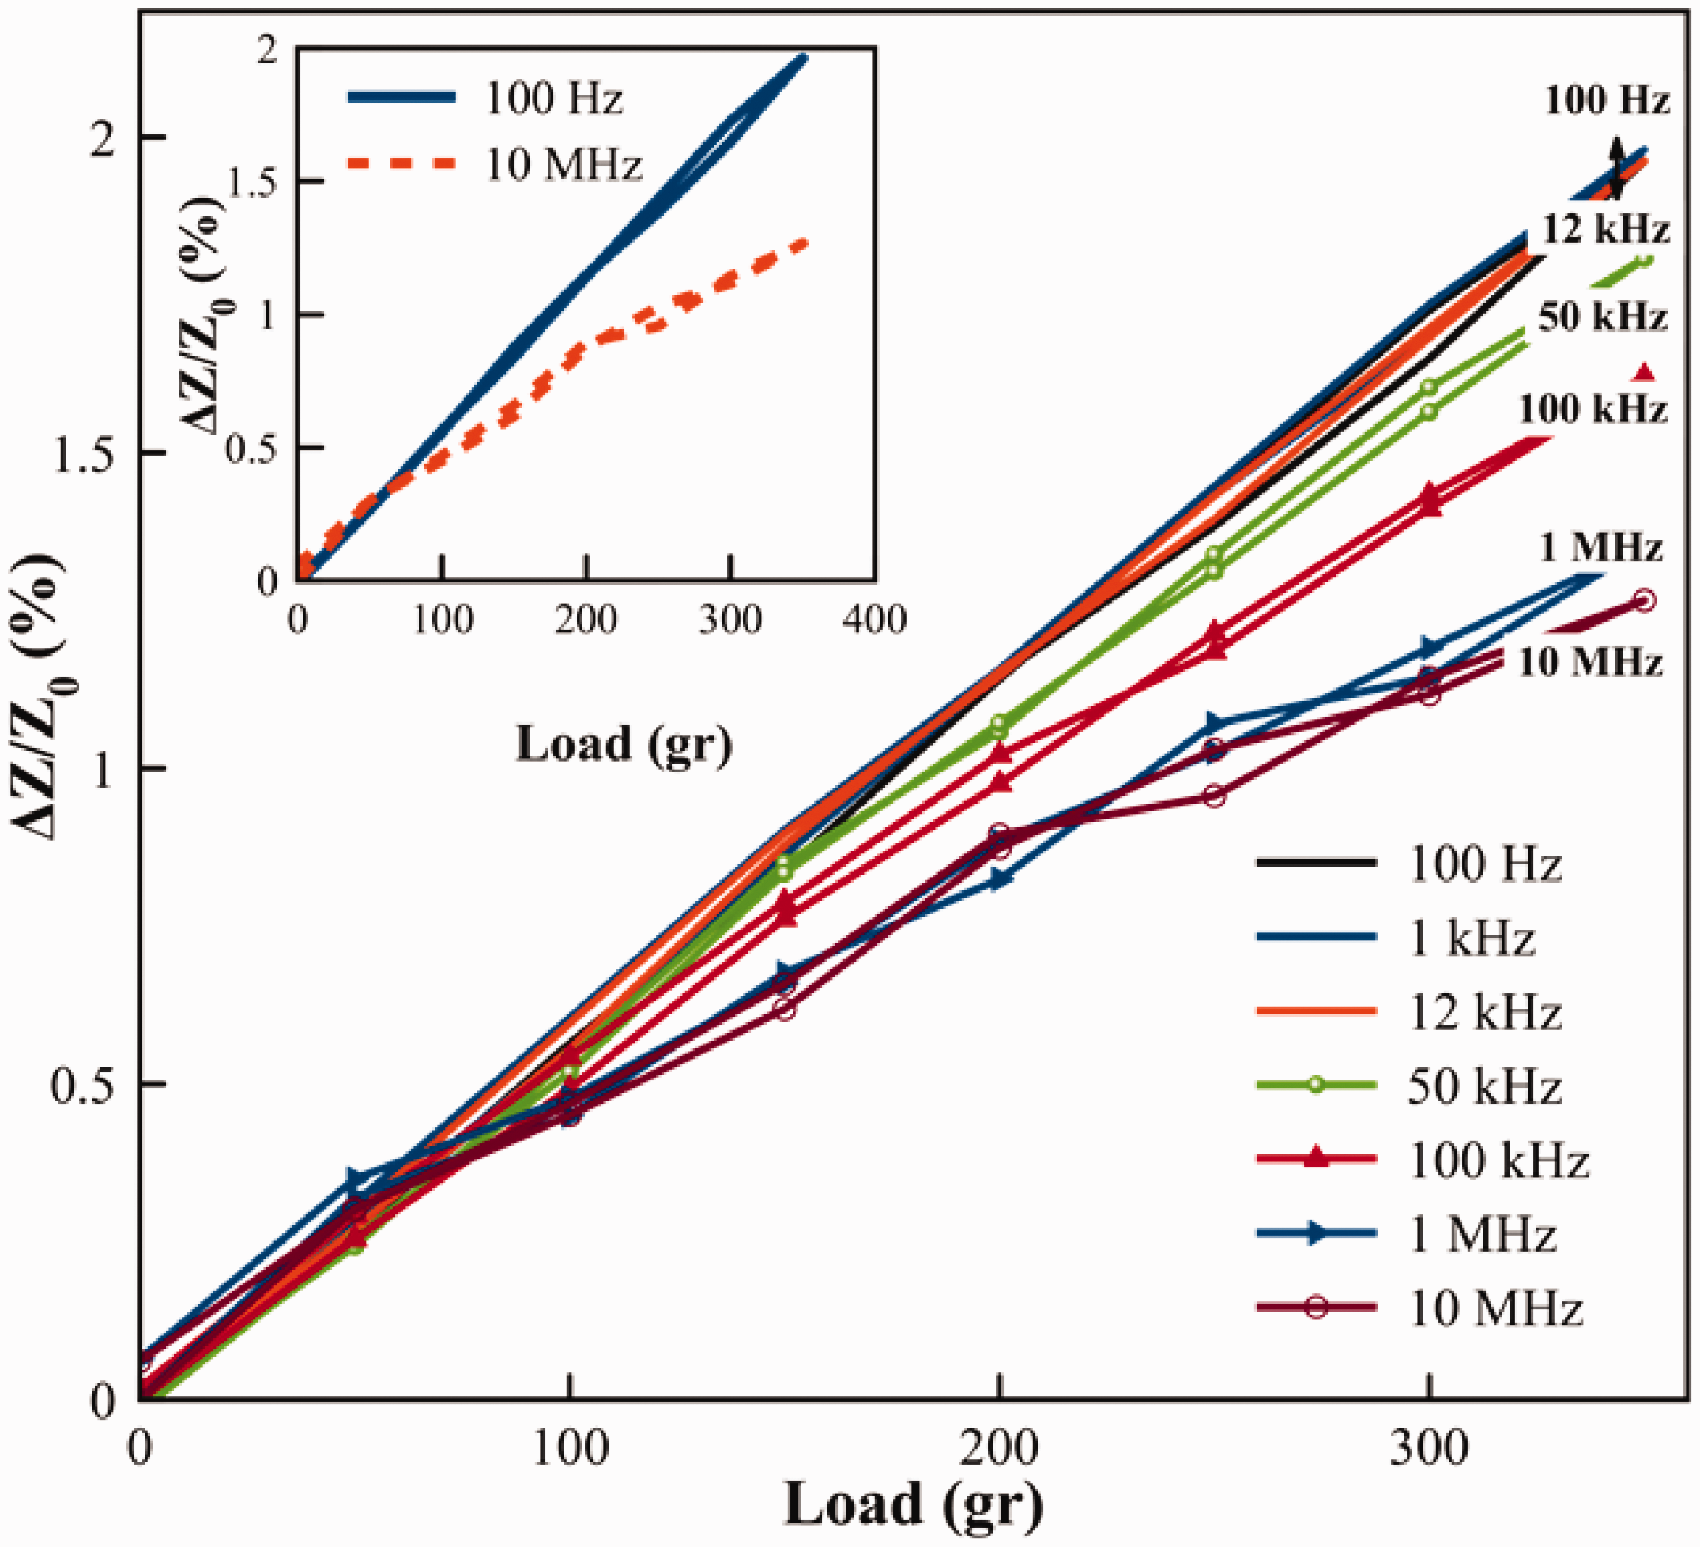
Conclusions
A strain sensitive MWCNTs/epoxy-based nanocomposite is synthesized and applied on an FR4 cantilever beam for static uniaxial load and the electromechanical characterization of the sensor is conducted using EIS for the frequency ranges from 100 Hz to 10 MHz. SEM microscopic images show that CNTs are dispersed in epoxy resin polymer homogenously. From impedance measurements, it is seen that the proposed sensor shows frequency-independent and frequency-dependent characteristics under applied frequency. Additionally, the sensor gives a quasi-semi-circle response that modelled as simplified R-CPE. Depending on the frequency range, either resistive or capacitive paths dominate the piezoresistivity of the MWCNTs/epoxy network. Moreover, sensor gives good sensitivity up to 13 at frequency-independent region. By taking the shift in the critical frequencies under applied static load, sensor sensitivity increases drastically. Consequently, in both regions, sensor shows quite good linearity and low hysteresis, which makes the proposed strain sensor a good candidate for structural health monitoring applications.
Footnotes
Acknowledgements
The author gratefully acknowledges Torsten Jagemann from the Chair of Solid Surfaces Analysis, Technische Universität Chemnitz for helping and guiding during SEM investigations.
Declaration of Conflicting Interests
The author(s) declared no potential conflicts of interest with respect to the research, authorship, and/or publication of this article.
Funding
The author(s) disclosed receipt of the following financial support for the research, authorship, and/or publication of this article: This work was partially supported by the Ministry of National Education of Turkey, which provides the author with the scholarship.