
Abstract
The mechanical properties of phenol formaldehyde (phenolic novolac) and short carbon fiber T300 polymer-based nano-composites-reinforced with nano-silica and nano-clay particles have been studied experimentally. By increasing the weight percentage of the short carbon fiber in the phenol formaldehyde, the strength of the composite increases, but its plastic deformation is severely limited. Also, in the case of composite reinforced with nano-silica particles, the tensile and flexural strength of the composite with the increase in the weight percentage of the nano-silica increase by 1% to 3%, whereas with the nano-clay particles, the tensile and flexural strength of the composite decrease by 1% to 3%. It is composite with 1% weight percentage of the nano-clay particle which has the highest strength in comparison to the other samples. Regardless of the type of corrosive solution, the composite strength decreases significantly over 25 days. However, with an increase in the duration from 25 days to 45 days, a slight change has been observed. The outcomes indicate that the corrosion of PF/CF40% composites and the composite reinforced with silica nanoparticles are higher corrosion rate in acid than in salt solution. In contrast, the nano-clay composite has more corrosion in salt solution. Furthermore, the analysis of the fracture surface of samples done by SEM microscopy shows reduction of the porosity in the case of using nanoparticles.
Keywords
Introduction
During recent years, many studies have been done on nano-scale-reinforced composites. Researchers found that nano-scale-reinforced composites, especially polymer-based nano-composite have considerable properties compared to polymer matrices with a low-volume fraction. The main advantages of this type of materials are strength-to-weight ratio, reduced permeability to gas, and composition resistance to solvent and thermal stability. 1 Certain properties of composites, especially high thermal stability and flame retardant, have led to the extensive development of nano-composites. For many years, researchers have implemented phenol formaldehyde (PF) in the production of polymer-based nano-composites. Due to its high thermal stability, stability against chemical agents, high characterization, structural strength, and solvent resistance in the air and space industry, PF is frequently used as thermal and coating insulation. 2 Brostow and Hagg Lobland 3 investigated intermolecular forces and phase diagrams of non-crystal composites and also tested mechanical properties of ceramics, polymers, and biological materials. Grialdo et al. 4 studied tribology features of polyamide polymer with carbon tubes in different percentages. They found that the penetration depth drops due to the rise of concentration of nano-carbon tubes, and adding 1% nano-carbon tubes leads to 27% growth in Young's modules. Brostow et al. 5 established experiments to investigate the properties of polyurethane, polyvinyl, and calcium carbonate particles. They proved that brittleness decreases with adding fillers. Orozco et al. 6 studied nano-carbon tubes and Sepiolite in order to improve their compatibility with polypropylene. Joseph et al. 7 studied the mechanical properties of PF matrix, the composite reinforced with banana and glass fiber. The fiber length and relative load are two main parameters in the study of tensile and flexural strength and the influence of the impact. The results reveal that both types of fiber reinforcements have a great influence on the increasing of fiber loading properties in the formation of a regular process. But, the shear strength arisen from the tensile tests shows that the strength between the banana fibers and the matrix is much higher than that of the glass fiber. Periadurai et al. 8 used the polymerization method to determine the effect of adding nano-silica particles on the thermal stability of the reinforced phenolic resin. The results of this study showed that the formation of the chemical bond between inorganic and organic materials increases the thermal stability of the nano-composite by 70 ℃ compared to pure phenol. They also demonstrated that due to the carbon content and limited amount of oxygen, the resistance of the nano-composite to the flame is higher than pure phenolic. The mechanical properties of phenolic nano-silica composite with a volume fraction of 1, 2, and 3% were investigated by Taheri-Behrooz et al. 9 They found that the Young's modulus of composite material with 2% volume fraction increases, but it decreases significantly in the composite material with 3% volume fraction. On the other hand, the obtained results showed that in 2% volume fraction, the composite hardness goes up about 2.27% (as compared to pure phenolic).
Over the past decades, the combined properties of nano-silica and nano-clay reinforcements including mechanical and thermal properties, thermal stability, dimensional stability, and flame retardant have been considered.10–13 Considering the size of nano-silica particles, 5 to 50 nm, and their high surface, the properties of nano-composite materials reinforced by this material differ significantly from other materials. Due to its excellent reinforcing properties in the manufacturing of a wide range of polymer-based composites, nano-silica is used as the main reinforcement.14–20
The main purpose of this investigation is to construct PF and carbon fiber (CF) composites reinforced with weight percentage of nano-silica and clay and to investigate their strength. In addition, composites have been placed in corrosion solutions of acid and salt water in different periods of time to study their corrosion effects on the properties of the nano-composite. Therefore, the research objectives can be summarized as follows:
Construction of PF/CF nano-composites reinforced with nano-silica particles and clay particles using polymerization method. The study of the effect of weight percentage of short CF, nano-silica and nano-clay particles on the strength, formation, and morphology of the composites. The investigation of the effect of samples exposure time in various types of corrosion solutions on the strength of the composites. The effect of corrosion solution type on composites strength.
Materials and methodology
Materials
The matrix chosen in this study are novolac phenolic resin (IP-502; a hexamine mixture of 1% to 9%), which is uniformly controlled and graded. The phenolic resin can not be molded alone because its strength is very low and brittle.
For this purpose pure phenolic resin has been used with short CF T300 (1 cm length) to improve the mechanical properties and shape in the modeling. Nano-silica and clay particles were used as reinforcing materials. The reinforcing materials are silica nanoparticles (spherical, with a diameter of 50 nm) and unclassified clay (layer, 1 nm thick and average length of 100 nm). Two corrosive solutions of salt solution and sulfuric acid have been also utilized to determine the corrosion resistance of nano-composite.
Composition and sampling
Firstly, the phenolic resin has been blended with a short CF with a weight percentage of 35 and 40. Using a mechanical mixer with a speed of 600 r/min, the PF/CF mixture has been mixed with 1% and 3% nano-silica and nano-clay particles for 20 min. The ultrasonic homogenization device (Hielscher UP400S) has been used to obtain a uniform dispersion of nano-amplifiers. To avoid the temperature rise during homogenization, the solution has been cooled using an ice bath. Then, this mixture has been cooked for drying and removing acetone from the mixture in an oven for 60 min at 90 ℃. Afterwards, for the strengthening of the composites, the frames filled with composite materials have been put under 50 bars and 160 ℃. After the molding, the composites have been cut to 120 × 3 × 13 mm, and the flexural strength and tensile strength tests have been carried out the tests and repeated for three times. Of course, the results of samples that exhibit much lower than predictive strength have not been taken into account tests The reason for this low strength has been the low quality sample cutting or defect in the manufacturing of the sample.
Morphological analysis
The TESCAN MV2300 microscope has been implemented to analyze the morphology of nano-silica and nano-clay particles in a polymeric phenolic matrix. In addition, a X-ray diffraction spectrum analyzer has been used to determine the degree of dispersion of nanoparticles in a matrix. The experiments have been carried out by using XRD apparatus with diffraction angle (2θ) of 5 to 65 degrees based on standard measurements of BSEN13925. The samples have been produced in the forms of sheets with 2 × 2 × 0.2 cm.
Mechanical testing
The universal test machine (SANTAM 30T) has been used to determine the tensile and flexural strength of the composite. Samples are prepared according to ASTM D3039 and ASTMD790. In this study, the linear speed was 2 mm/min.
Research methodology
Experiments have been conducted to investigate the effect of short CFs (35% and 40%), nano-clay (1% and 3%), and nano-silica (1% and 3%) on tensile and flexural strength. Also, the composites were placed in the corrosive environment of sulfuric acid and salt solution for 25 and 45 days. Then, the tensile and flexural strength of the composite before and after exposure to the corrosive solution and the effect of CF, nano-silica content, nano-clay content, corrosion environment, and corrosion time have been surveyed.
Results and discussion
Phase properties
In order to determine the composition structure and qualitative identification, EDX analysis with scanning electron microscopy has been implemented. Figure 1 illustrates the presence of the elements Si, O, and C in the composite PF/CF reinforced by silica nanoparticles. Moreover, qualitative identification and distribution of nanoparticles in phenolic resin is presented in Figure 2 The results reveal that mass percentage of produced Si with 1% nano-clay in polymer sheets is higher than that of 3% nano-clay.
EDX pattern of PF/CF composite with (a) 3% of nano-silica and (b) 1% of nano-clay. Identification of particles distribution in PF/CF composite with (a) 3% of nano-silica and (b) 1% of nano-clay.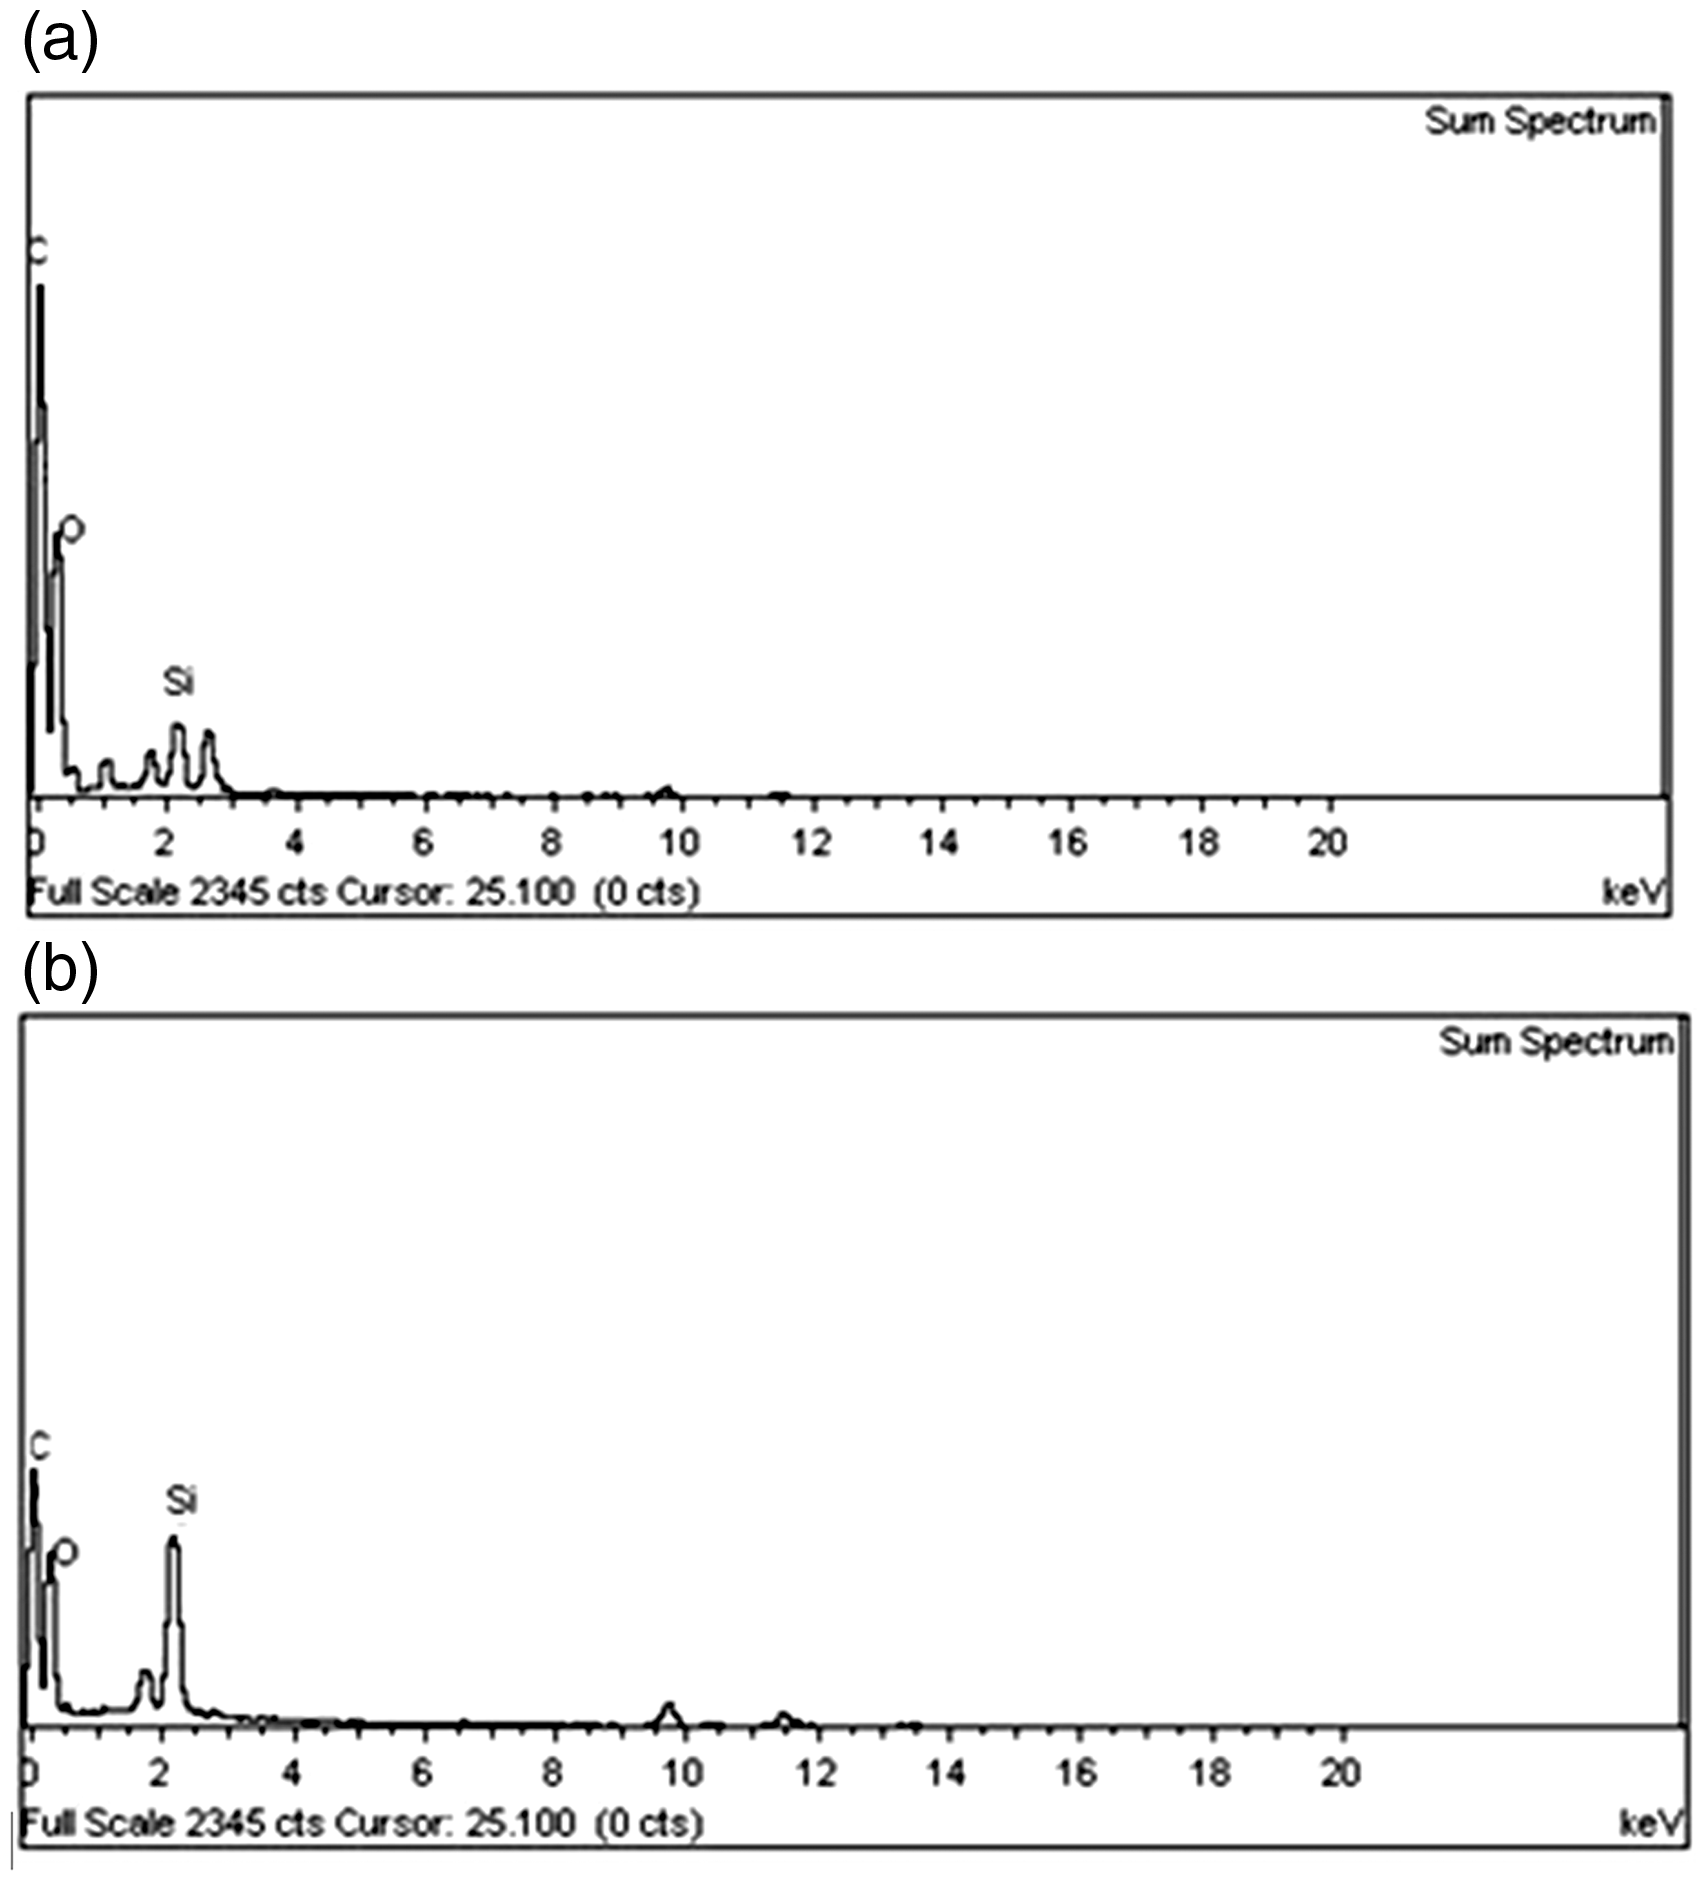
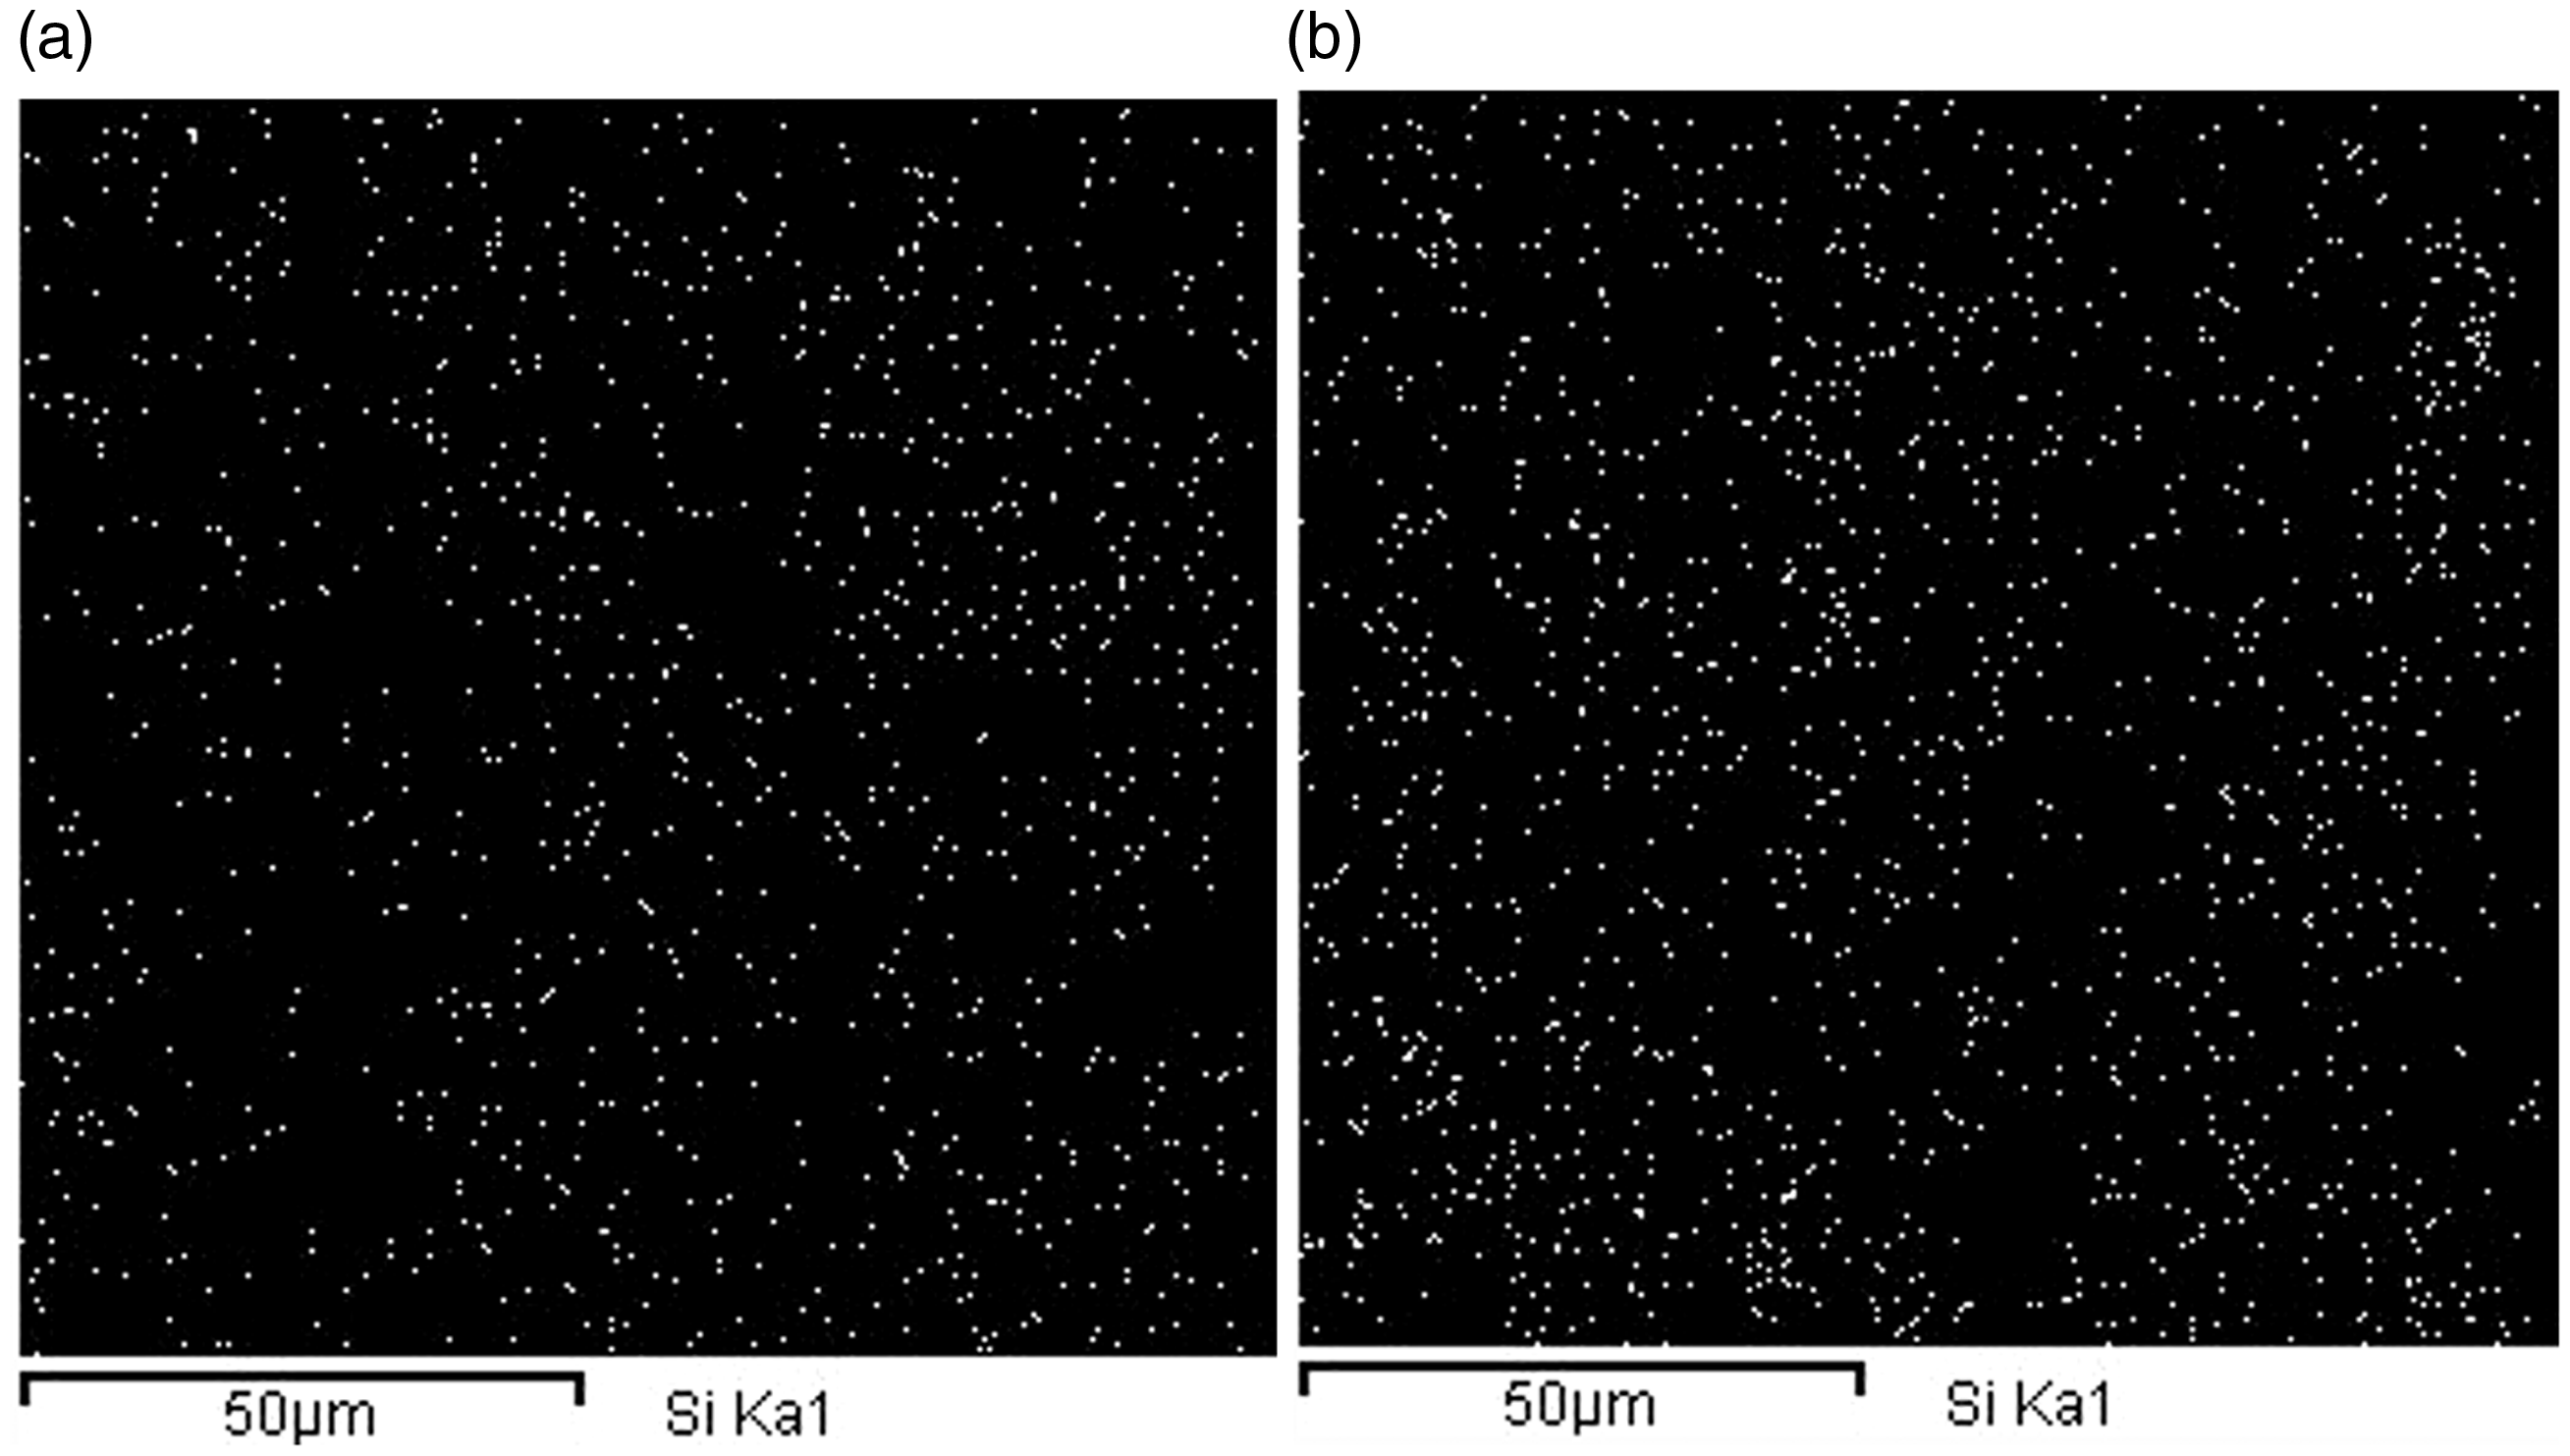
In other words, the increase in strength due to the addition of nano-clay is due to the high weight percentage of clay in the polymer. One the other hand, the distribution of nano-clay particles in the constructed composite is more uniform and denser than that of nano-silica particles in the composite. As apparent from Figure 2, the more dispersion of nano-clay particles is due to flat shape with spherical silica content. Nevertheless, the probability of nano-clay deposition in the matrix is high. By comparison of EDX patterns of the composite reinforced with nano-silica and nano-clay particles, it was observed that the dispersion of nano-clay particles is more than the dispersion of nano-silica particles in the composite. Some researchers argued that this difference is due to the shape of the silica nanoparticles (spherical) and clay (flat).21,22
The findings of X-ray spectrums on produced nano-composite show that it has crystal structure and specific peaks. Figure 3 illustrates the peak of scattering of X-ray for 1% and 3% nano-silica in 2θ = 25.48 and 25.26, respectively. It is clear that the corresponding distance between silicate layers is d = 3.49 angstrom and 3.52 angstrom, respectively, so with 3% nano-silica the distance increases. Moreover, it is obvious form Figure 4 that the peaks of X-ray scattering for 1% and 3% nano-clay are in 2θ = 24.92 and 25.50, respectively. The corresponding distance between clay layers is d = 3.57 angstrom and 3.49 angstrom, respectively, so with 3% nano-silica the distance diminishes. The distance between the molecules of novolac resin and silica particles is the result of thermodynamic dependence of matrix and silicate layer.23,24,3
X-ray spectrum of Nano-silica composite with 1% and 3% weight percentage. X-ray spectrum of Nano-clay composite with 1% and 3% weight percentage.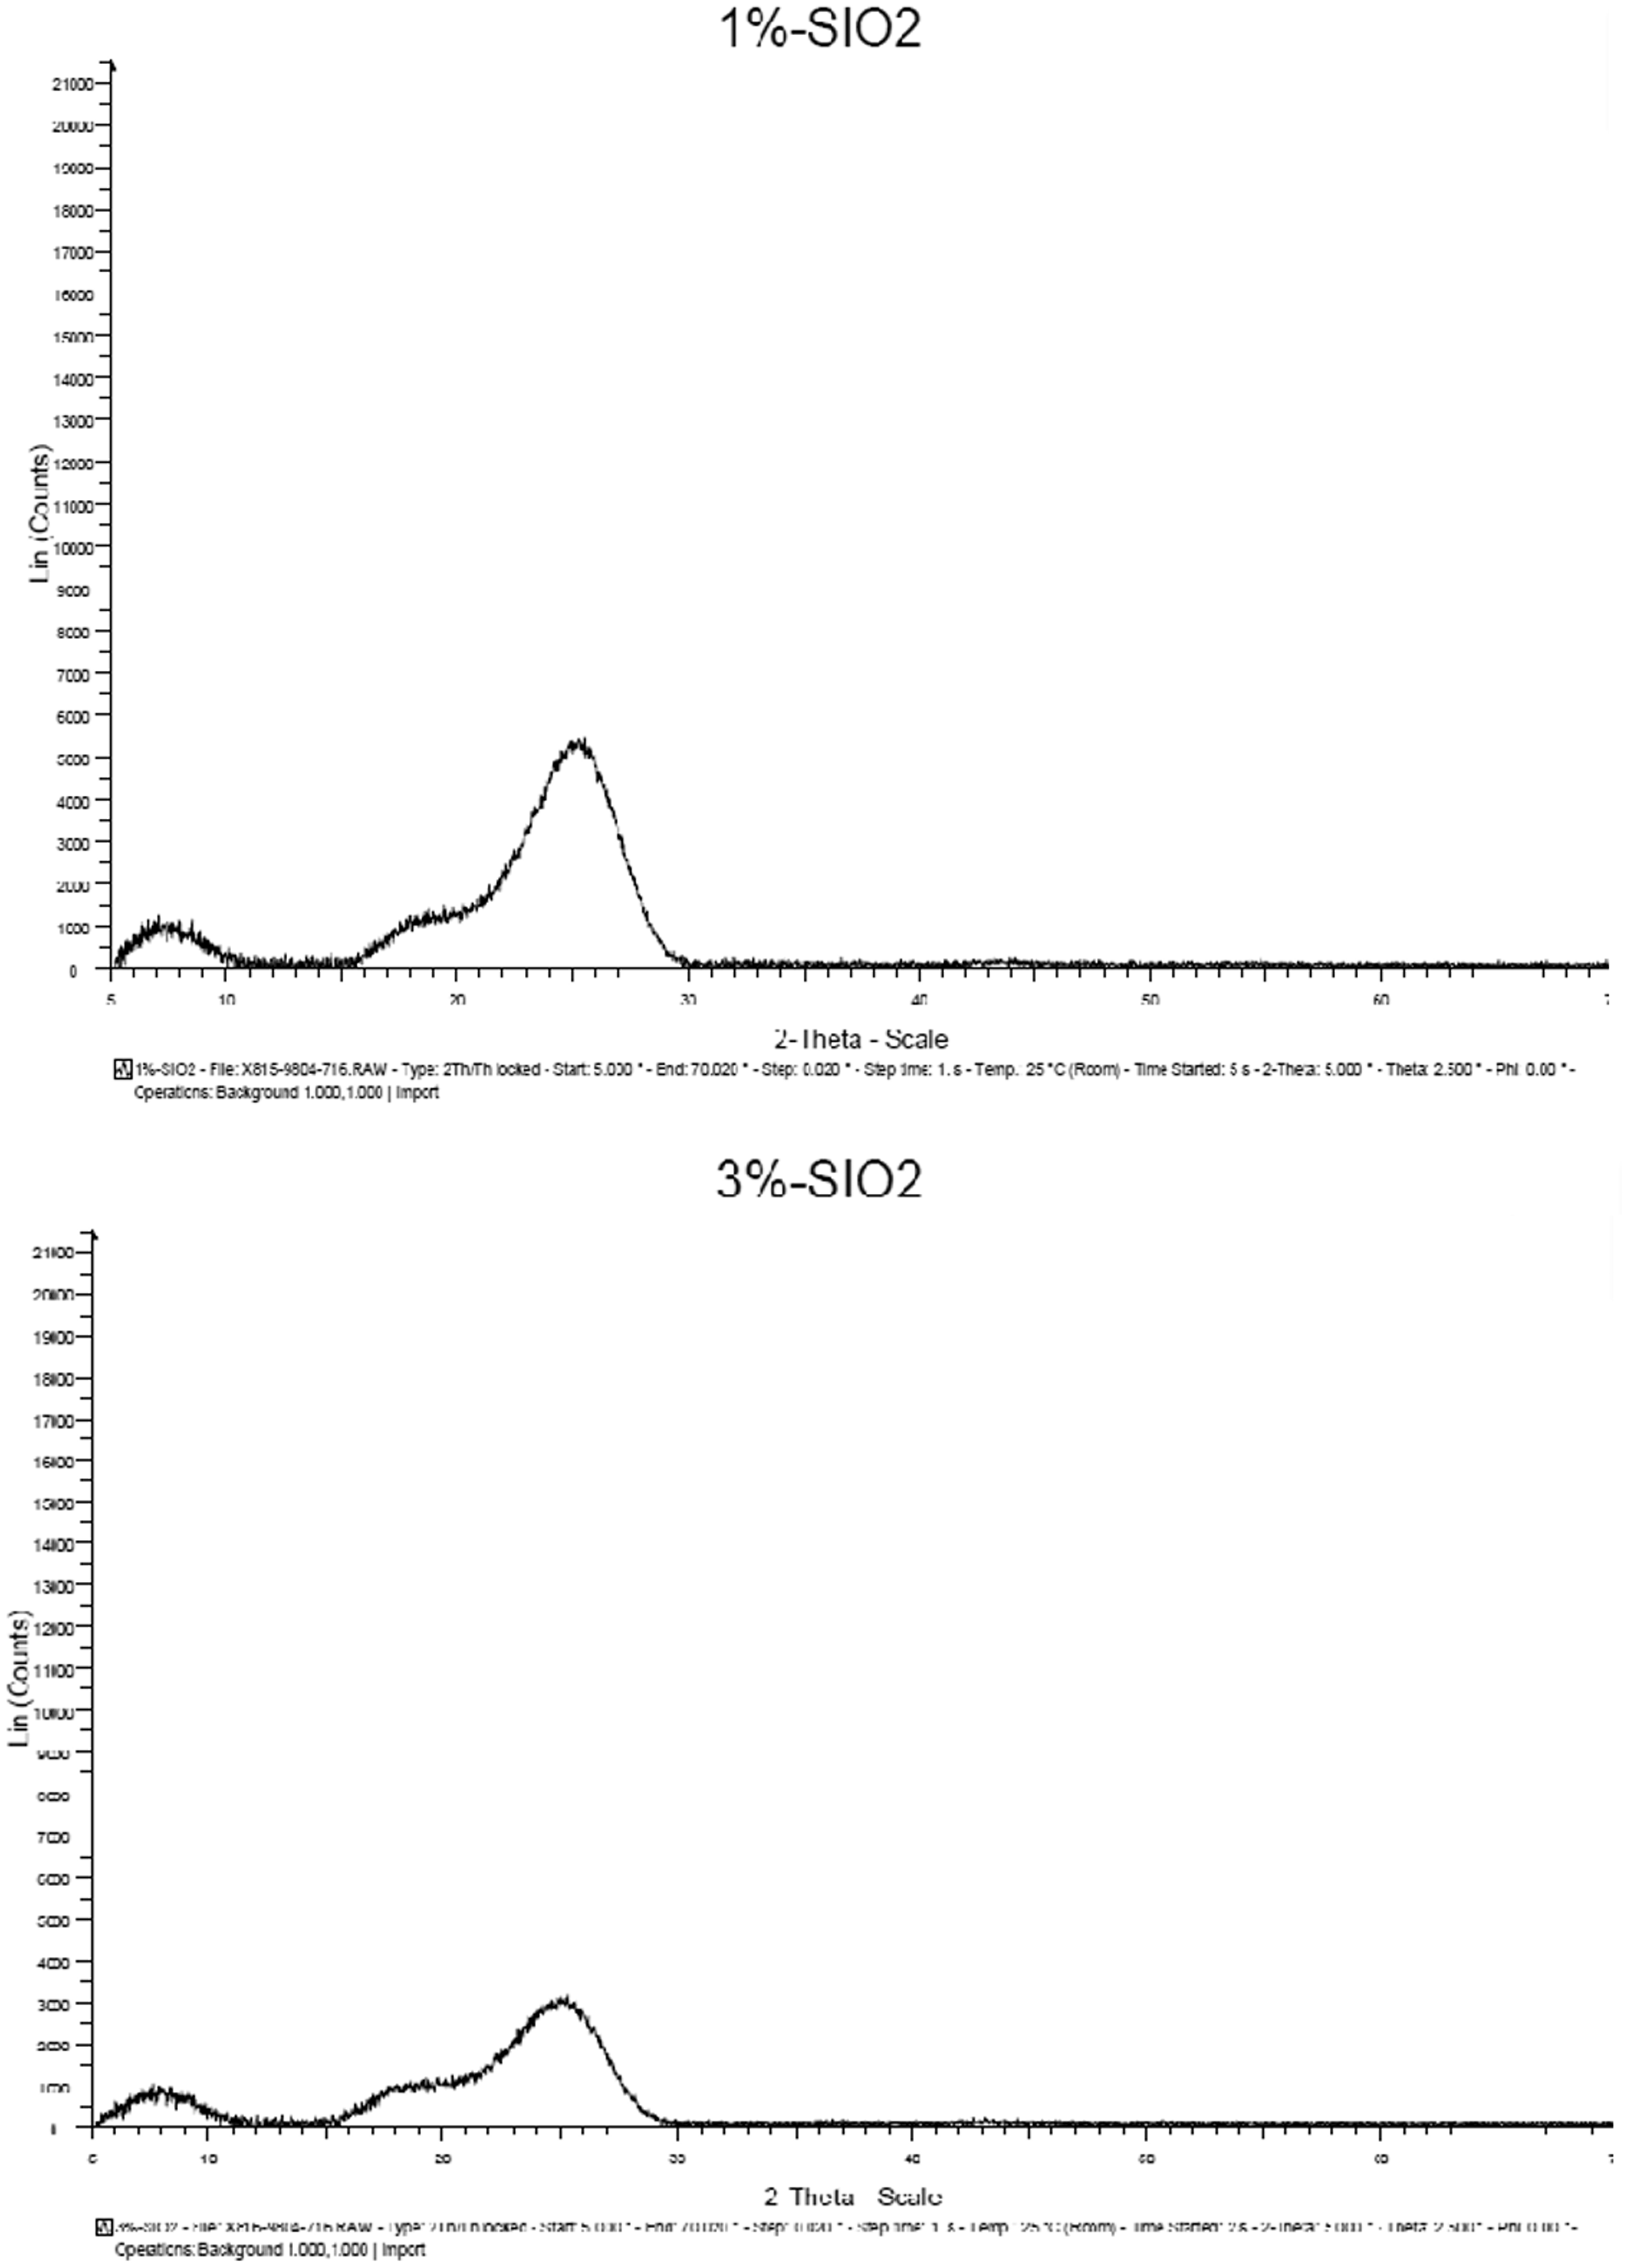
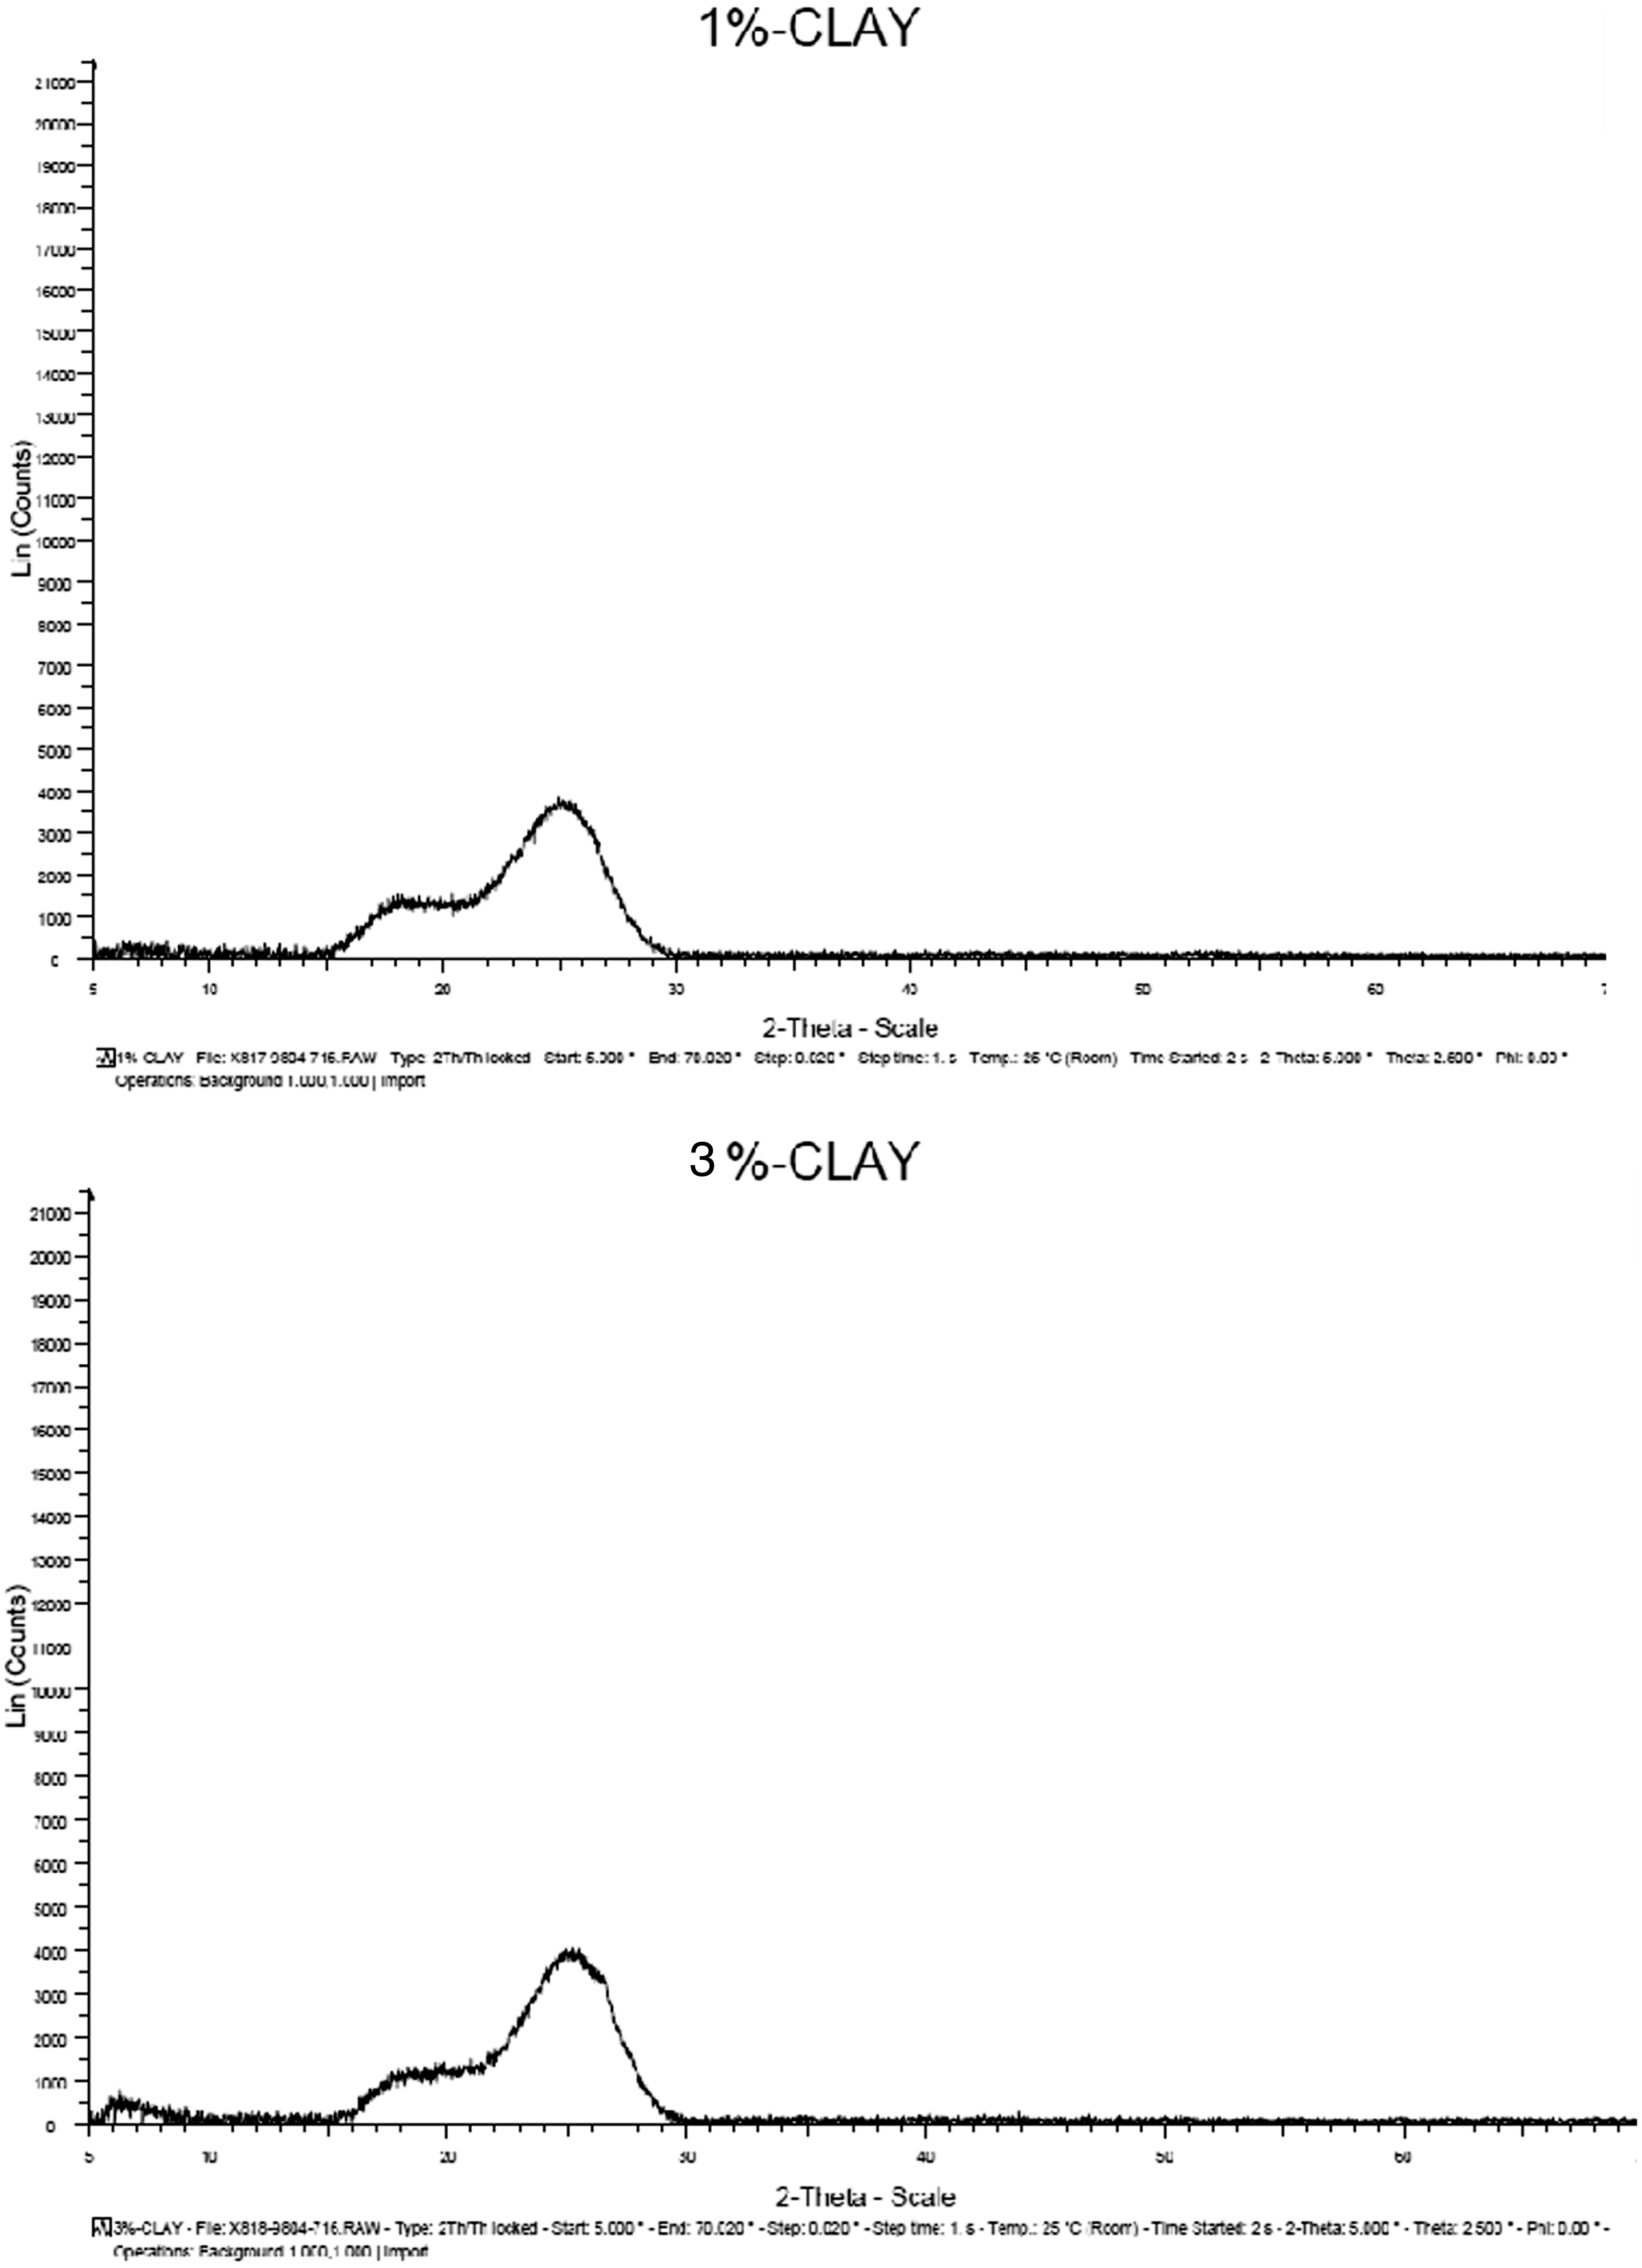
Moreover, the average sizes of nano-clay and nano-silica particles have been estimated to be 2.17 nm and 2.22 nm, respectively, by implementing the Scherrer equation of D = 0.9 × γ/βcosθ. It can be concluded that whatever the particle is smaller, its FWHM is higher, i.e. the peak is wider crest and lower value.
Morphological analysis
In order to analyze the morphology of the composites, for the proper distribution of the polymeric plates and the porosity in the samples, the sections were cut from the cross-sectional level and were subjected to SEM. Figure 5(a) depicts void volumes and porosity of phenolic resin. Figure 5(b) shows the SEM image of the cross sections of the specimens under different conditions. In pure phenolic, the distance between the polymer layers is high. However, by adding short CF the porosity reduces, and void volumes are filled in the phenolic resin. Figure 5(c) and (d) shows a composite morphology made of nano-clay and nano-silica particles. It is seen that the composite morphology in this state is quite uniform, and the degree of porosity is low.
SEM images illustrating morphology for (a) pure phenolic, (b) adding carbon fiber in Phenolic resin, (c) adding Nano-silica, and (d) adding nano-clay.
Strength properties
Stress–strain diagrams driven by the tensile and flexure strength tests of the composites have been presented in Figure 6.
Stress–strain diagrams of the composite made of different reinforcement materials.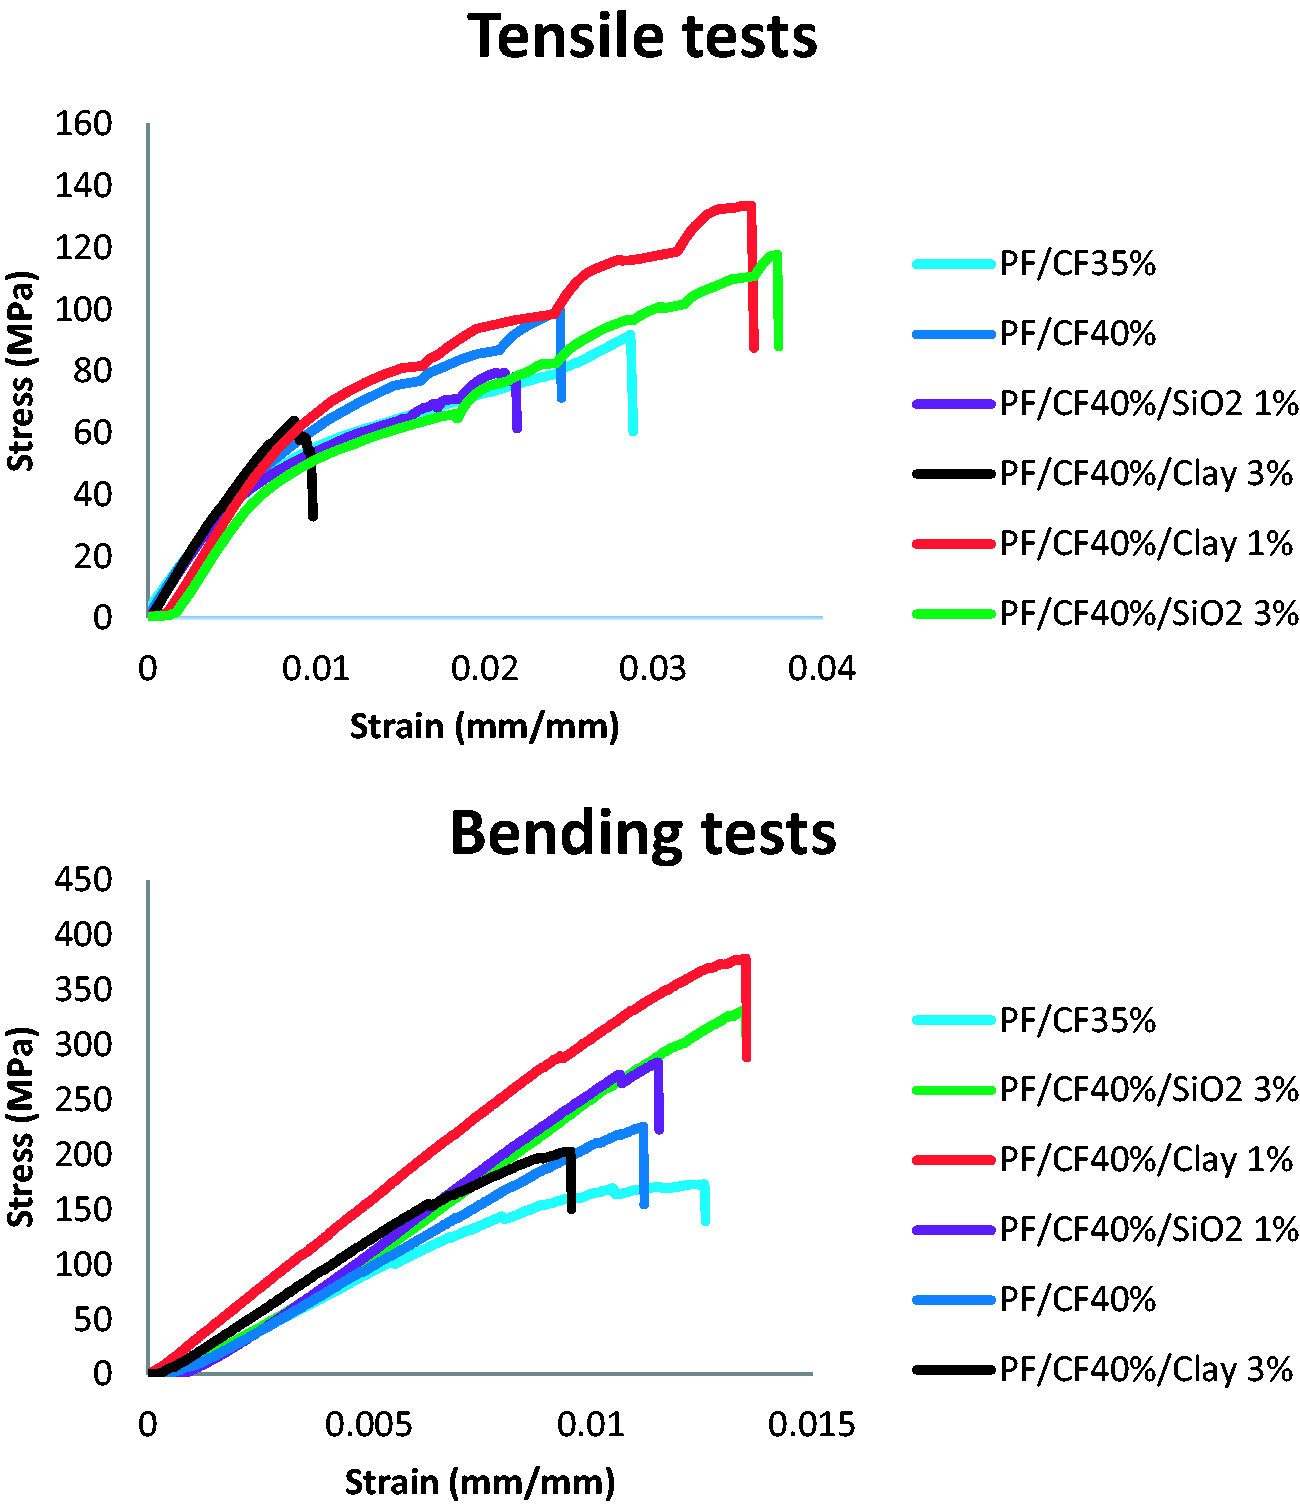
Figure 7 displays the bar graph of the ultimate tensile and flexural strength of the various samples. By increasing the weight percentage of the CF T300 from 35 to 40%, the strength of the composite has increased substantially, but its plastic deformation decreased significantly (Figure 6). In fact, Carbon is a very fragile material, which is combined with most materials such as metals and even polymers, causes a fragile structure. For the aforementioned reason, when CF is added to the resin, the made composite is a fragile structure and its strength increases, whereas the plastic deformation in the composite is reduced.25,26
Strength of the produced samples.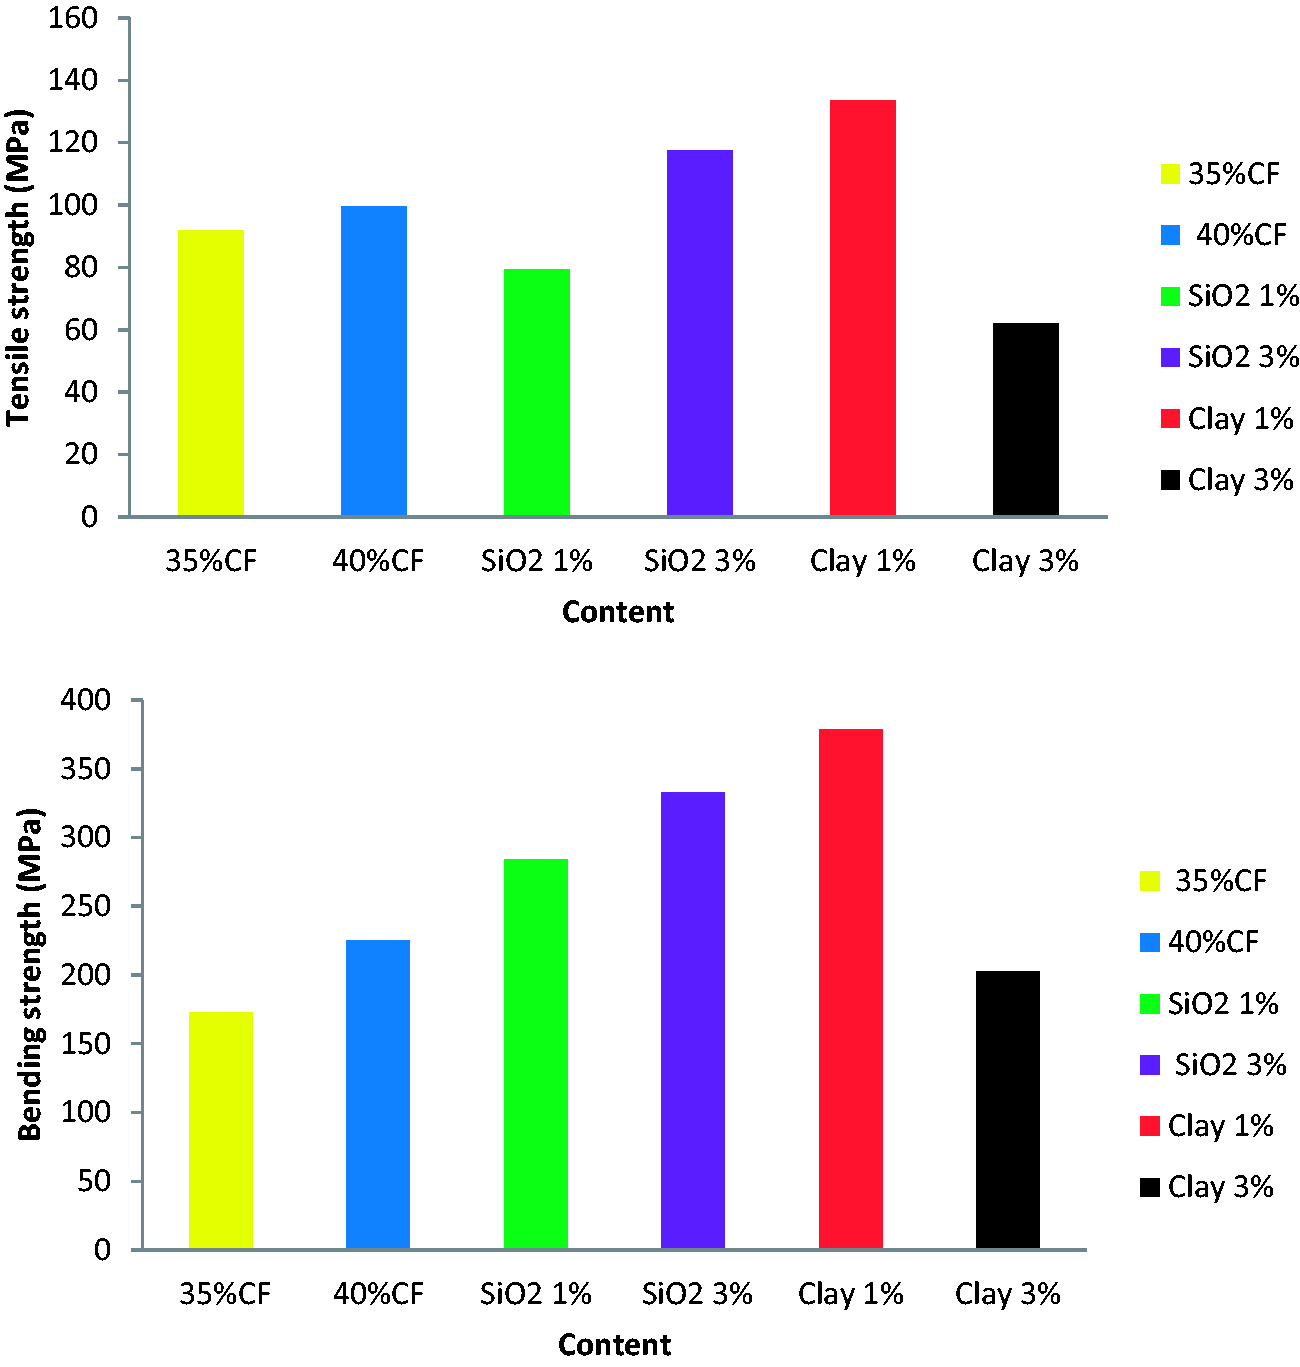
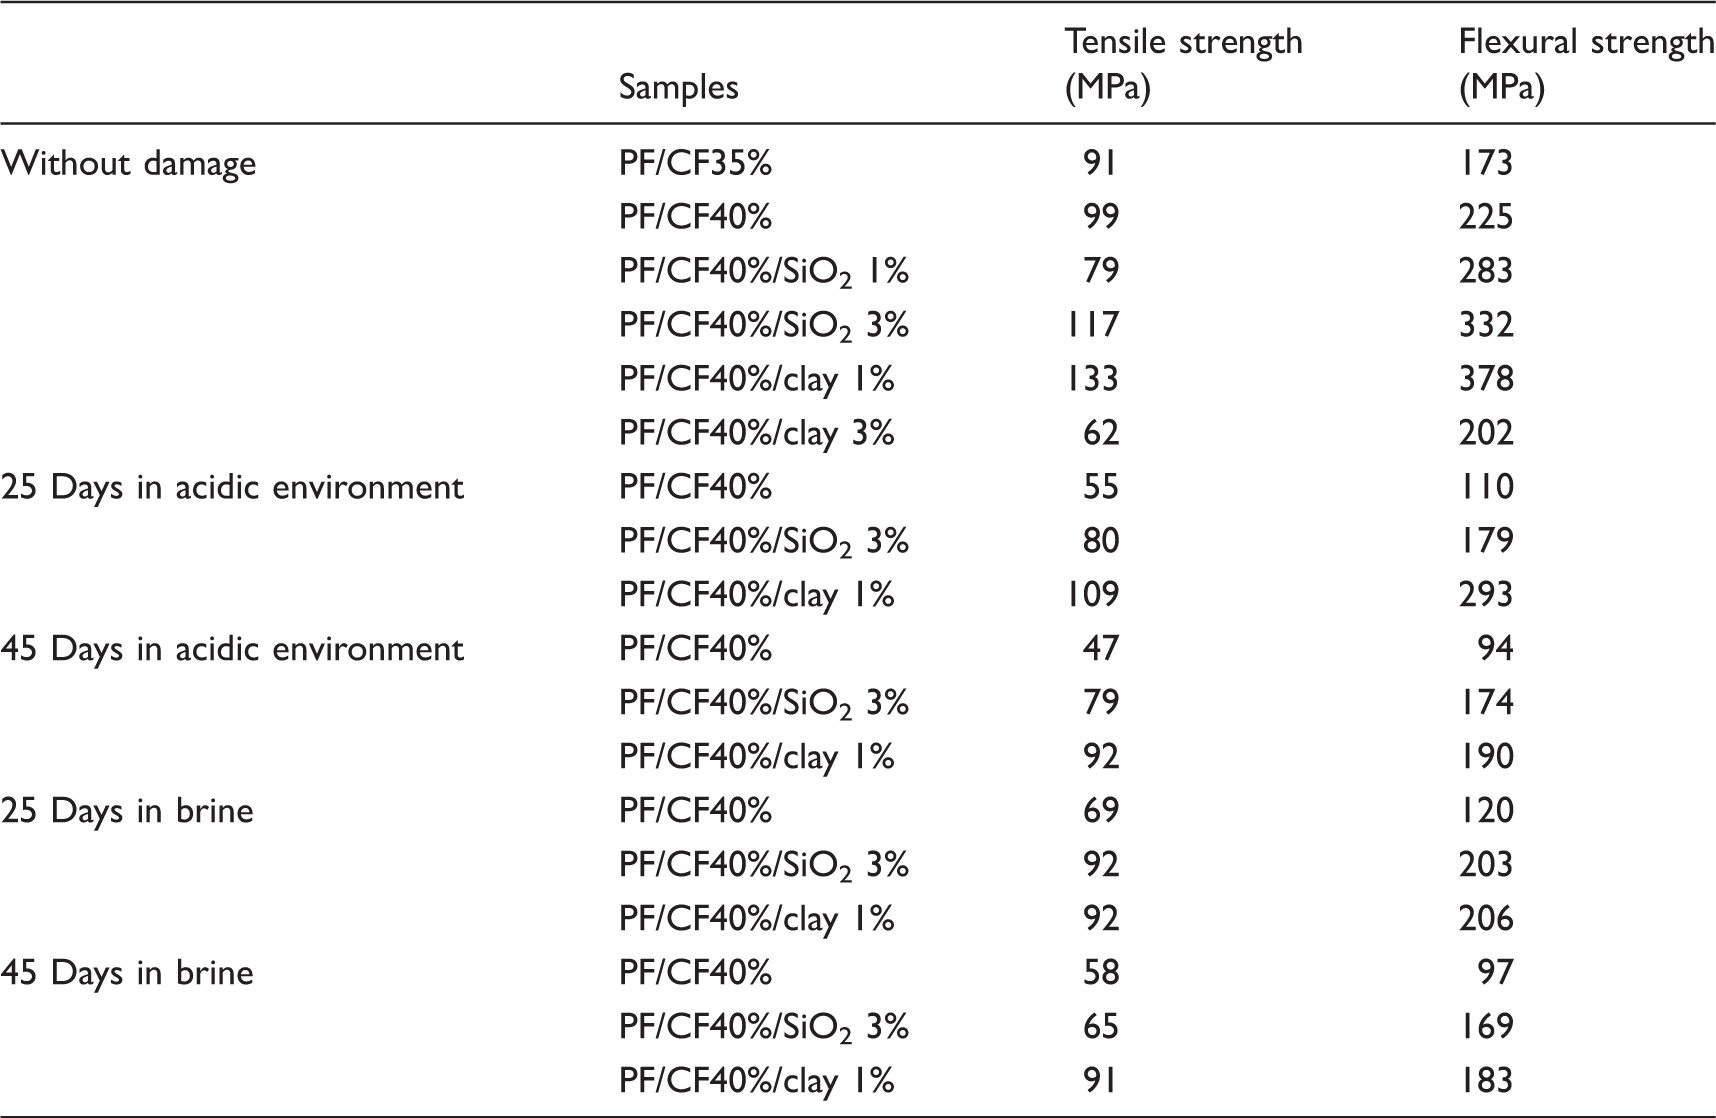
Furthermore, from Figure 5 one can conclude that adding 1% nano-silica particles does not affect the composite strength. 27 In contrast, adding 1% nano-clay particles significantly enhance the composite strength because the size of nano-clay particles is smaller than nano-silica particles 28 By blending 3% nano-silica particles, the strength of the composite structure increases dramatically. However, with the addition of 3% nano-clay to the composite, as compared to 1%, PF/CF40% pure is saturated with clay, and in this condition, the clay is deposited in the composite structure and the stress increases. In this case, the composite strength decreases. Ding and colleagues also achieved such results in their research in this area. 29 They found that the filling of void volumes and the strength of composite reinforced with nano-clay particles are two main reasons for strengthening the polymer matrix with nano-clay particles. Figures 6 and 7 indicate that in PF/CF40% composites, PF/CF40%/clay1% composite, and PF/CF40%/SiO2 3% have a maximum tensile and flexural strength compared to other manufactured samples. In this case, after examining these images, we conclude that the reinforced composite with nano-clay particles has the highest strength compared to other samples made with other particles. Table 1 provides the maximum tensile and flexural strength of the samples.
SEM images from the topography of the composite surface with the highest strengths are presented in Figure 8. According to this figure, the size of nano-clay particles (D1 = 39.59 nm, D2 = 61.27 nm, and D3 = 47.02 nm) is smaller than the size of nano-silica particles (D1 = 50.81 nm, D2 = 62.00 nm). On the other hand, the distance of the nanoparticles at the fiber surface and the size of vacant spaces in a composite reinforced with 1% nano-clay are lower than the composite reinforced with 3% nano-silica. Under these conditions, the degree of porosity in the PF/CF40% composite reinforced with nano-clay particles is 1% less than the porosity in the PF/CF40% composite reinforced by 3% nano-silica particles. Hence, we conclude that the composite reinforced with 1% nano-clay particles has the highest strength.
30
Void distances for (a) PF/CF40%/Clay 1% and (b) PF/CF40%/SiO2 3%.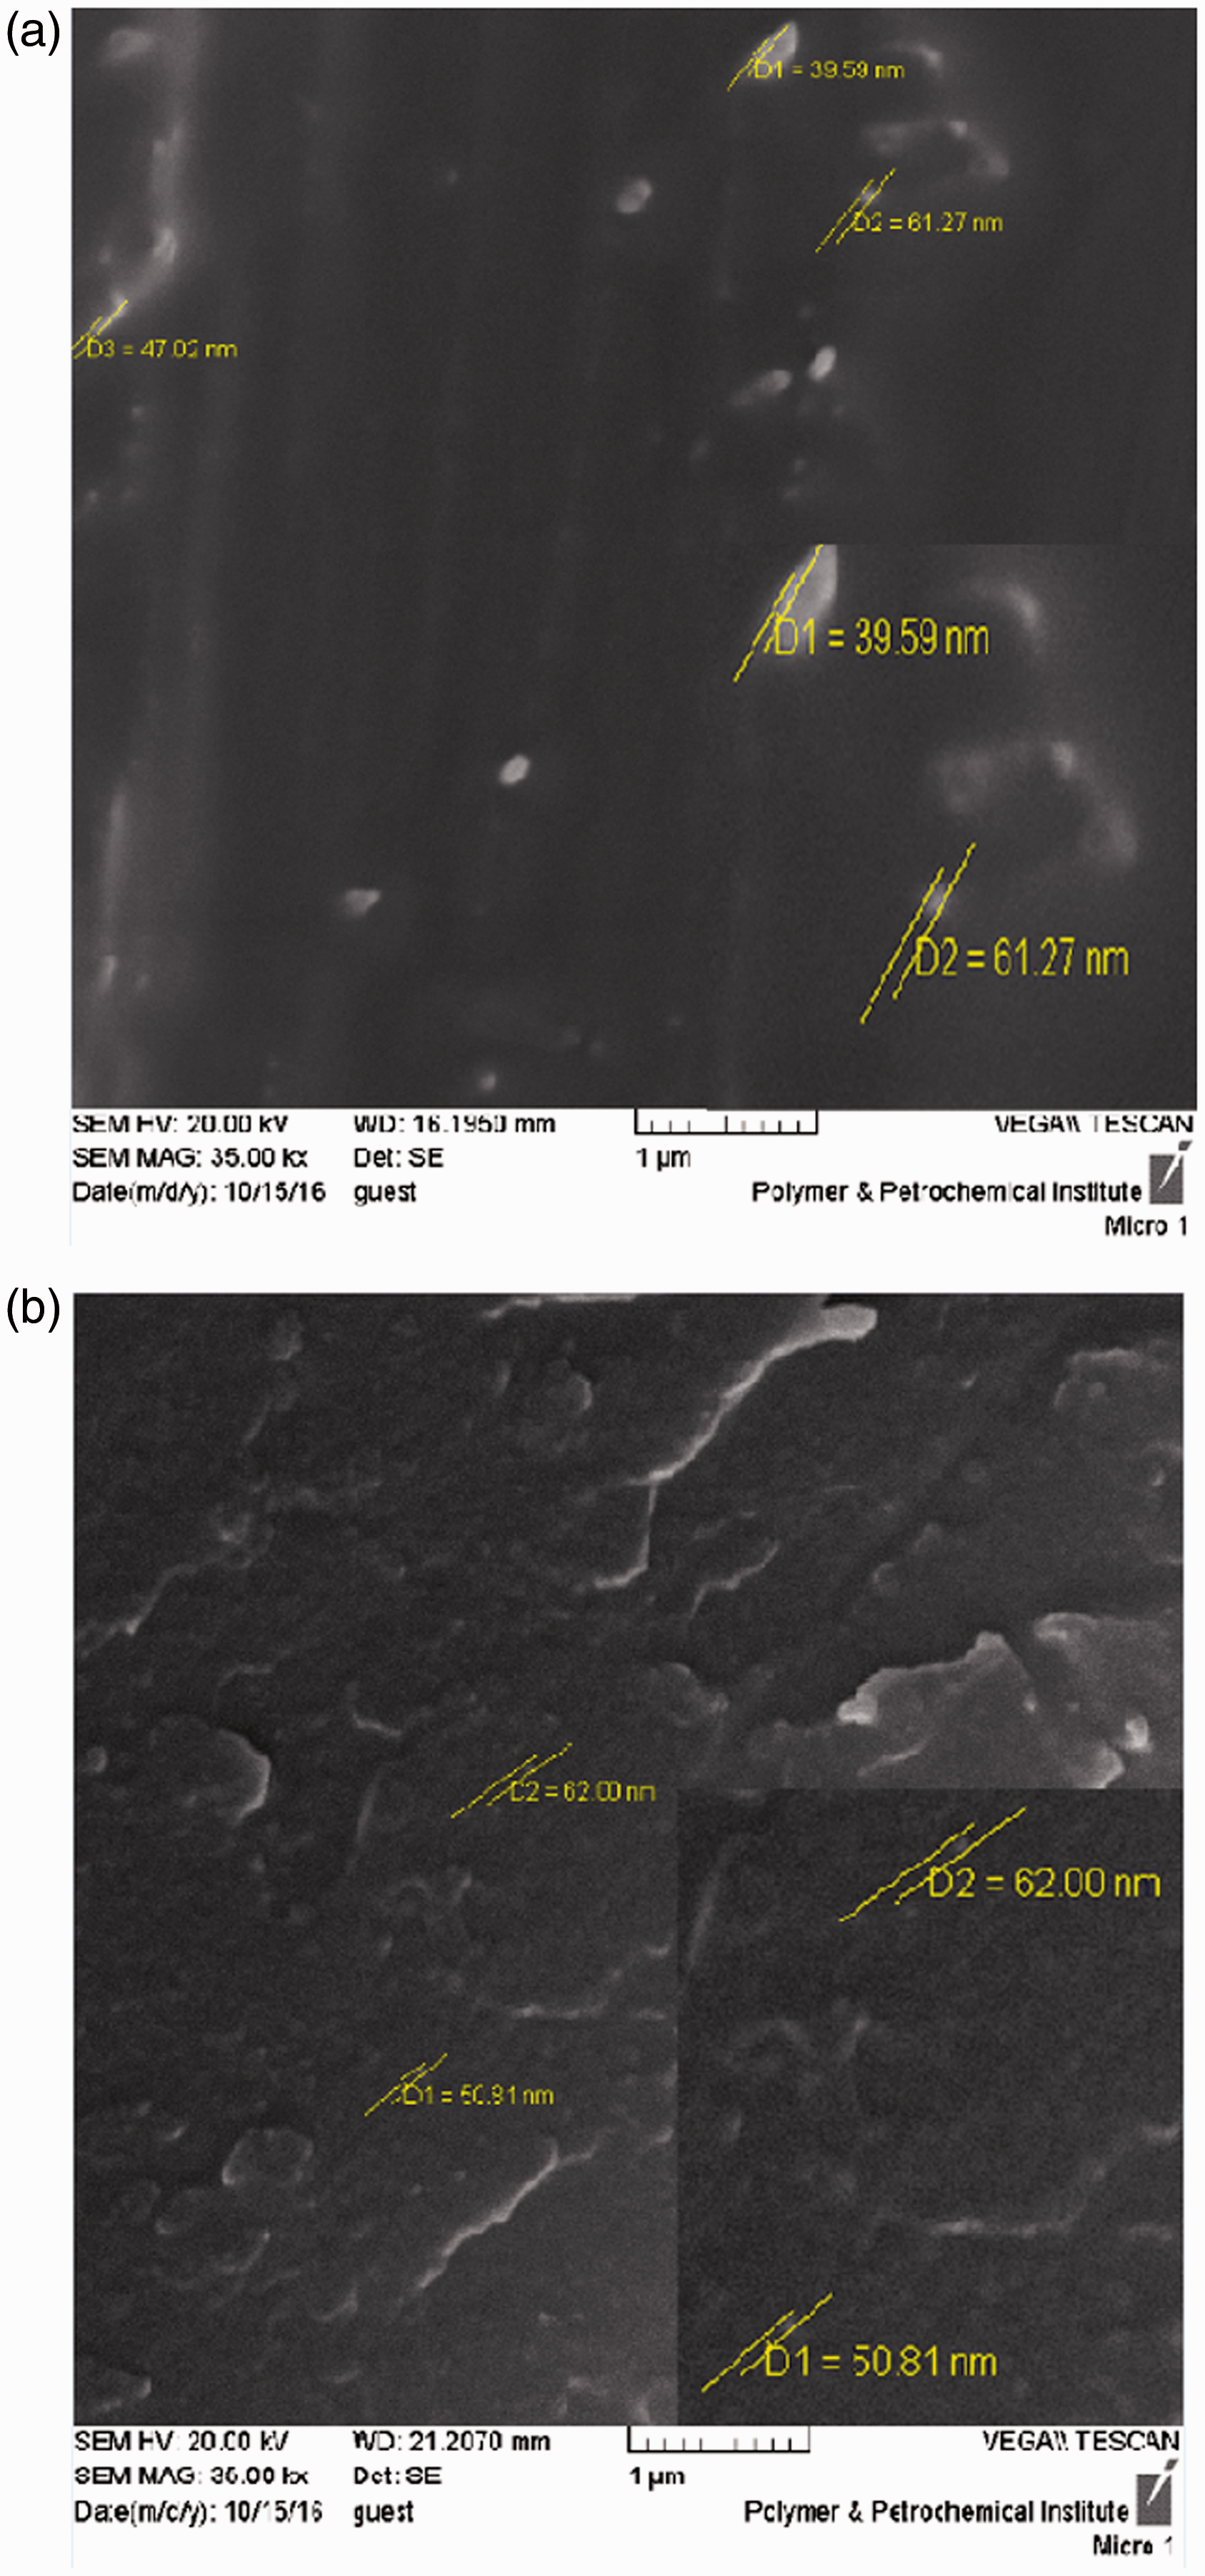
Figure 9 shows the SEM images of the composite surface. Figure 9(a) shows the PF/CF40% composite, which shows a lower resin penetration. Figure 9(b) and (c) illustrates a PF/CF40% composite reinforced with 1% nano-clay particles and PF/CF40% composite reinforced with 3% nano-silica particles. The figures reveal that the resin has penetrated into the fiber and the interface adhesion increases. At the end, the composites reinforced with nanoparticles have the highest degree of strength than pure samples.
24
Penetration and adhesion of resin to fibers for (a) PF/CF40%, (b) PF/CF40%/SiO2 3%, and (c) PF/CF40%/clay 1%.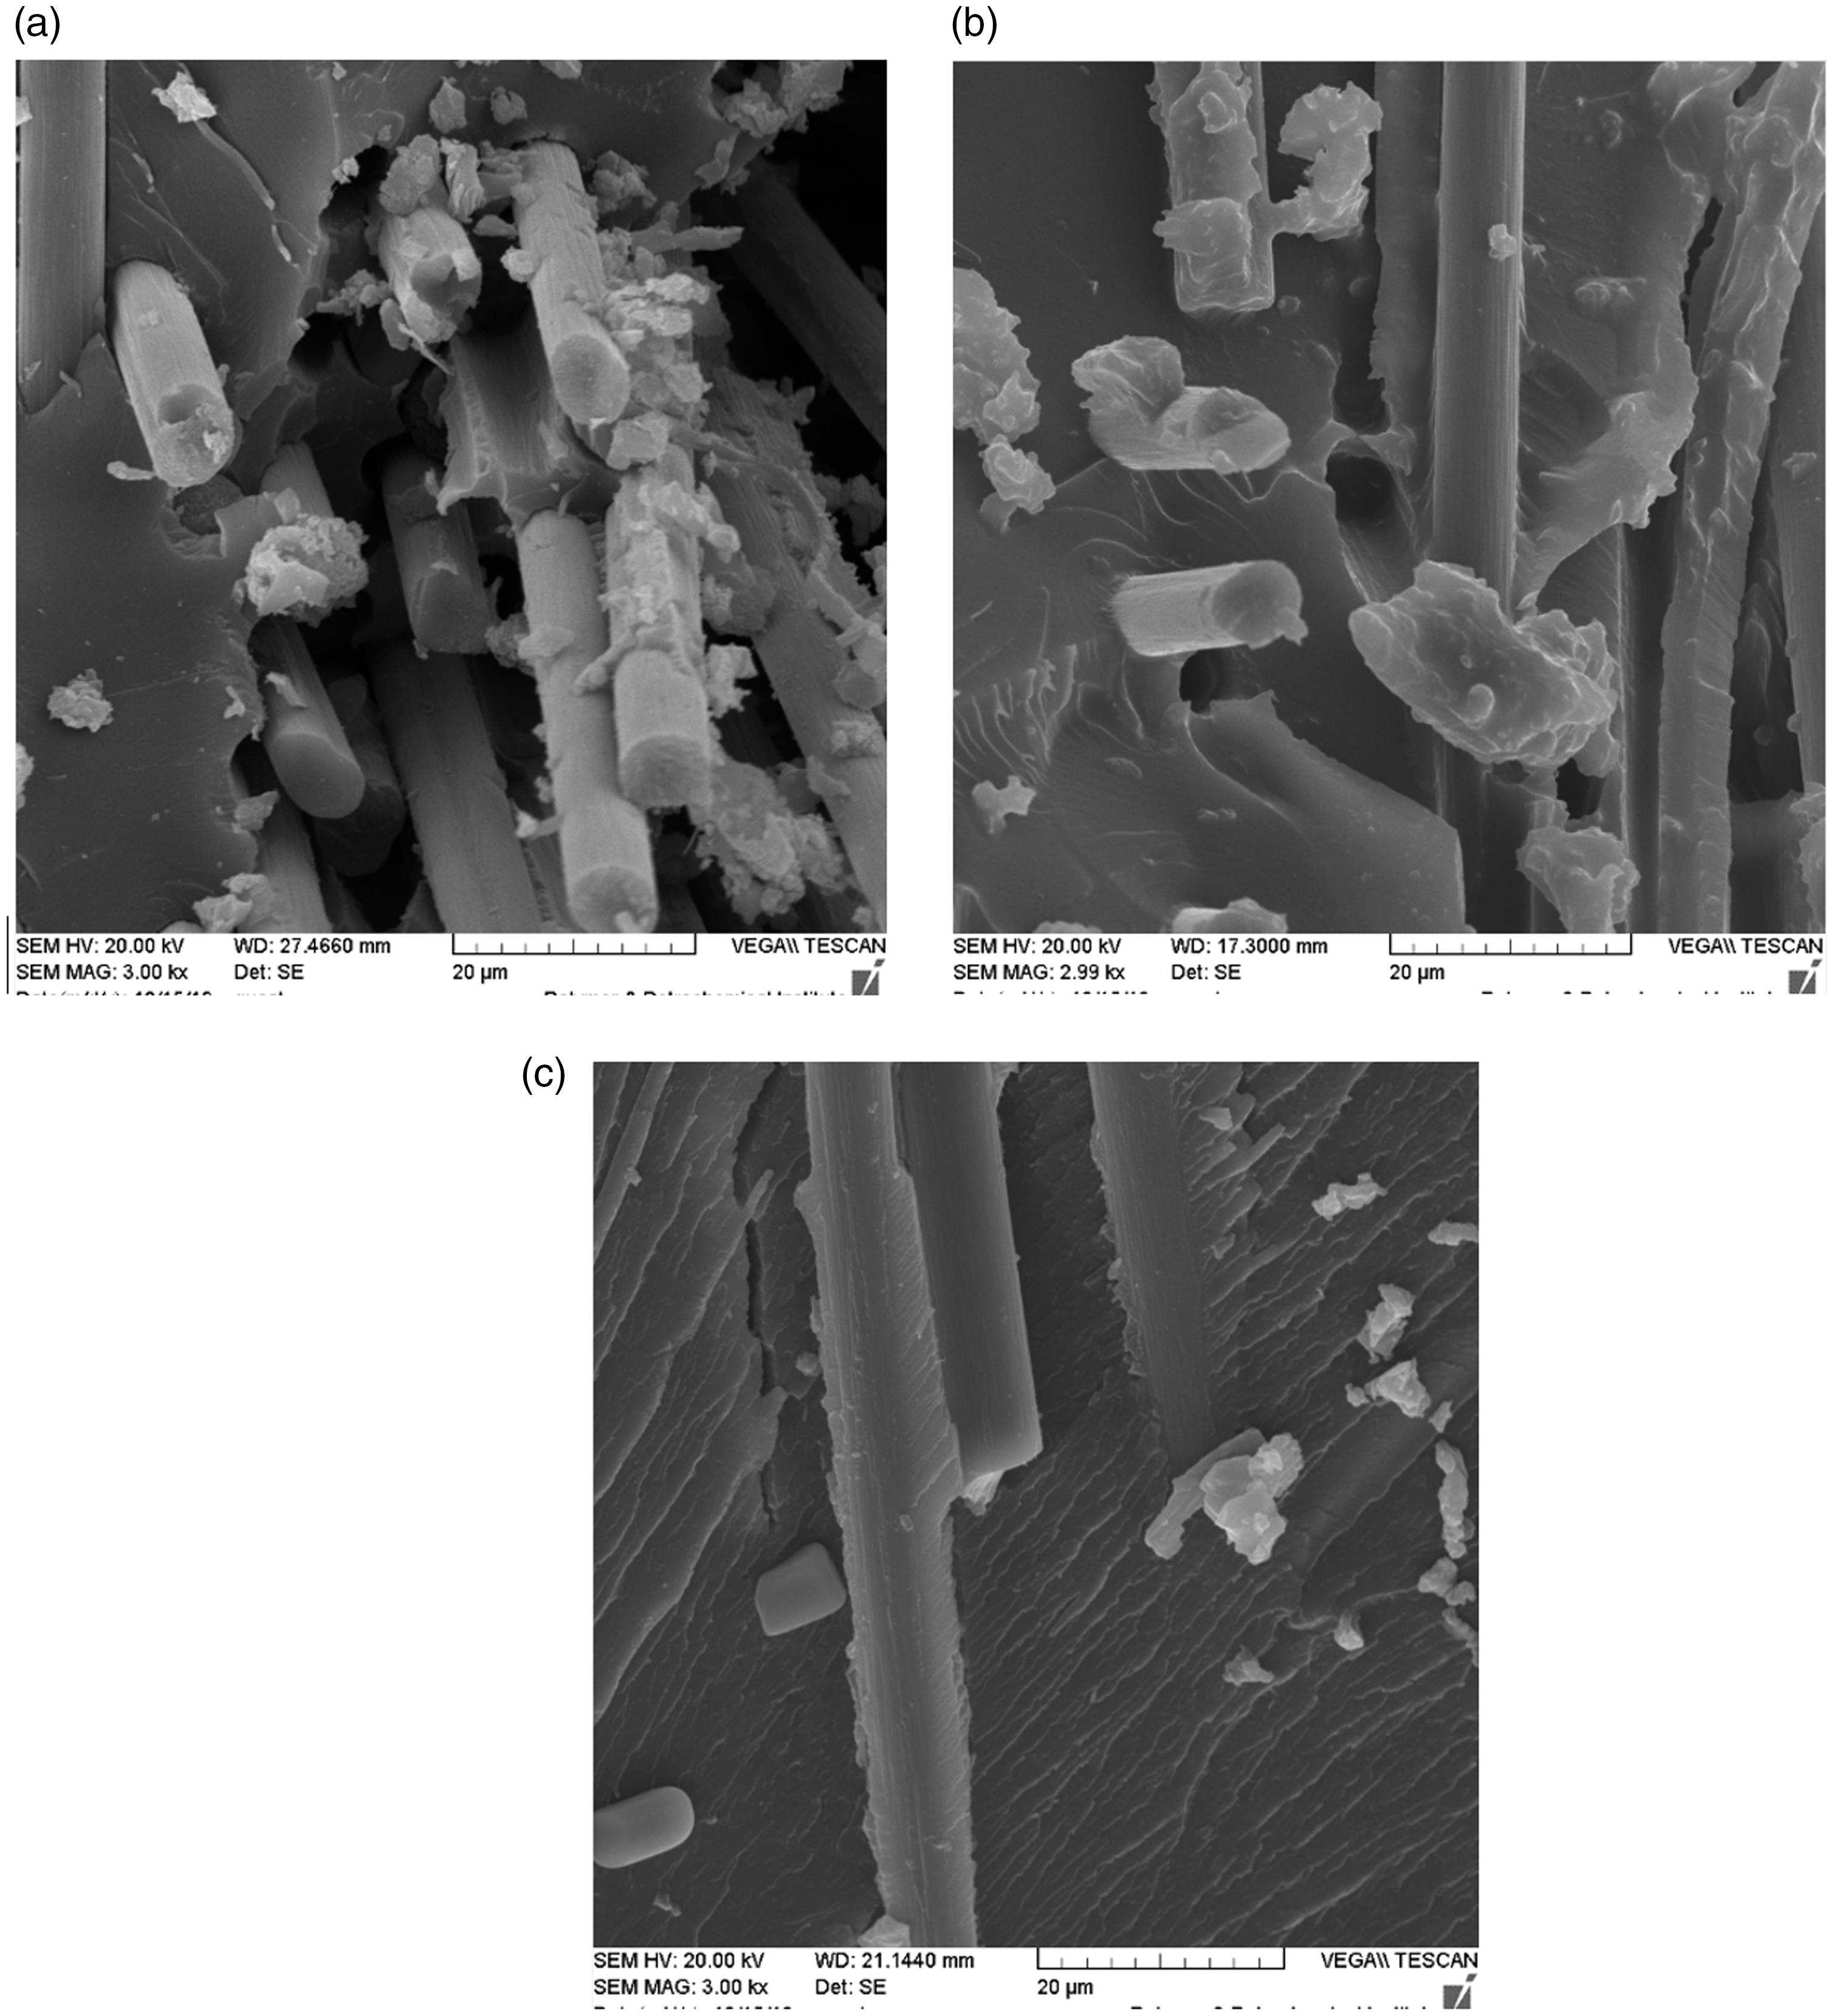
Composite strength in corrosive environment
In order to investigate the behavior of composite samples in corrosive environment, PF/CF 40% pure composite, composite reinforced with 1% nano-clay particles, and composite reinforced with 3% nano-silica particles have been placed in salt solution and sulfuric acid for 25 and 45 days. Figure 10 presents the strain–stress graph of the tensile and flexural strength tests of the composite samples. Figure 11 shows the final tensile and flexural strength of composites in corrosive environments for a different time period.
Stress–strain diagrams of the composite made of different reinforcement materials: (a) tensile test and (b) bending test. Tension and flexural strength of composites in (a) acid and (b) salt solution.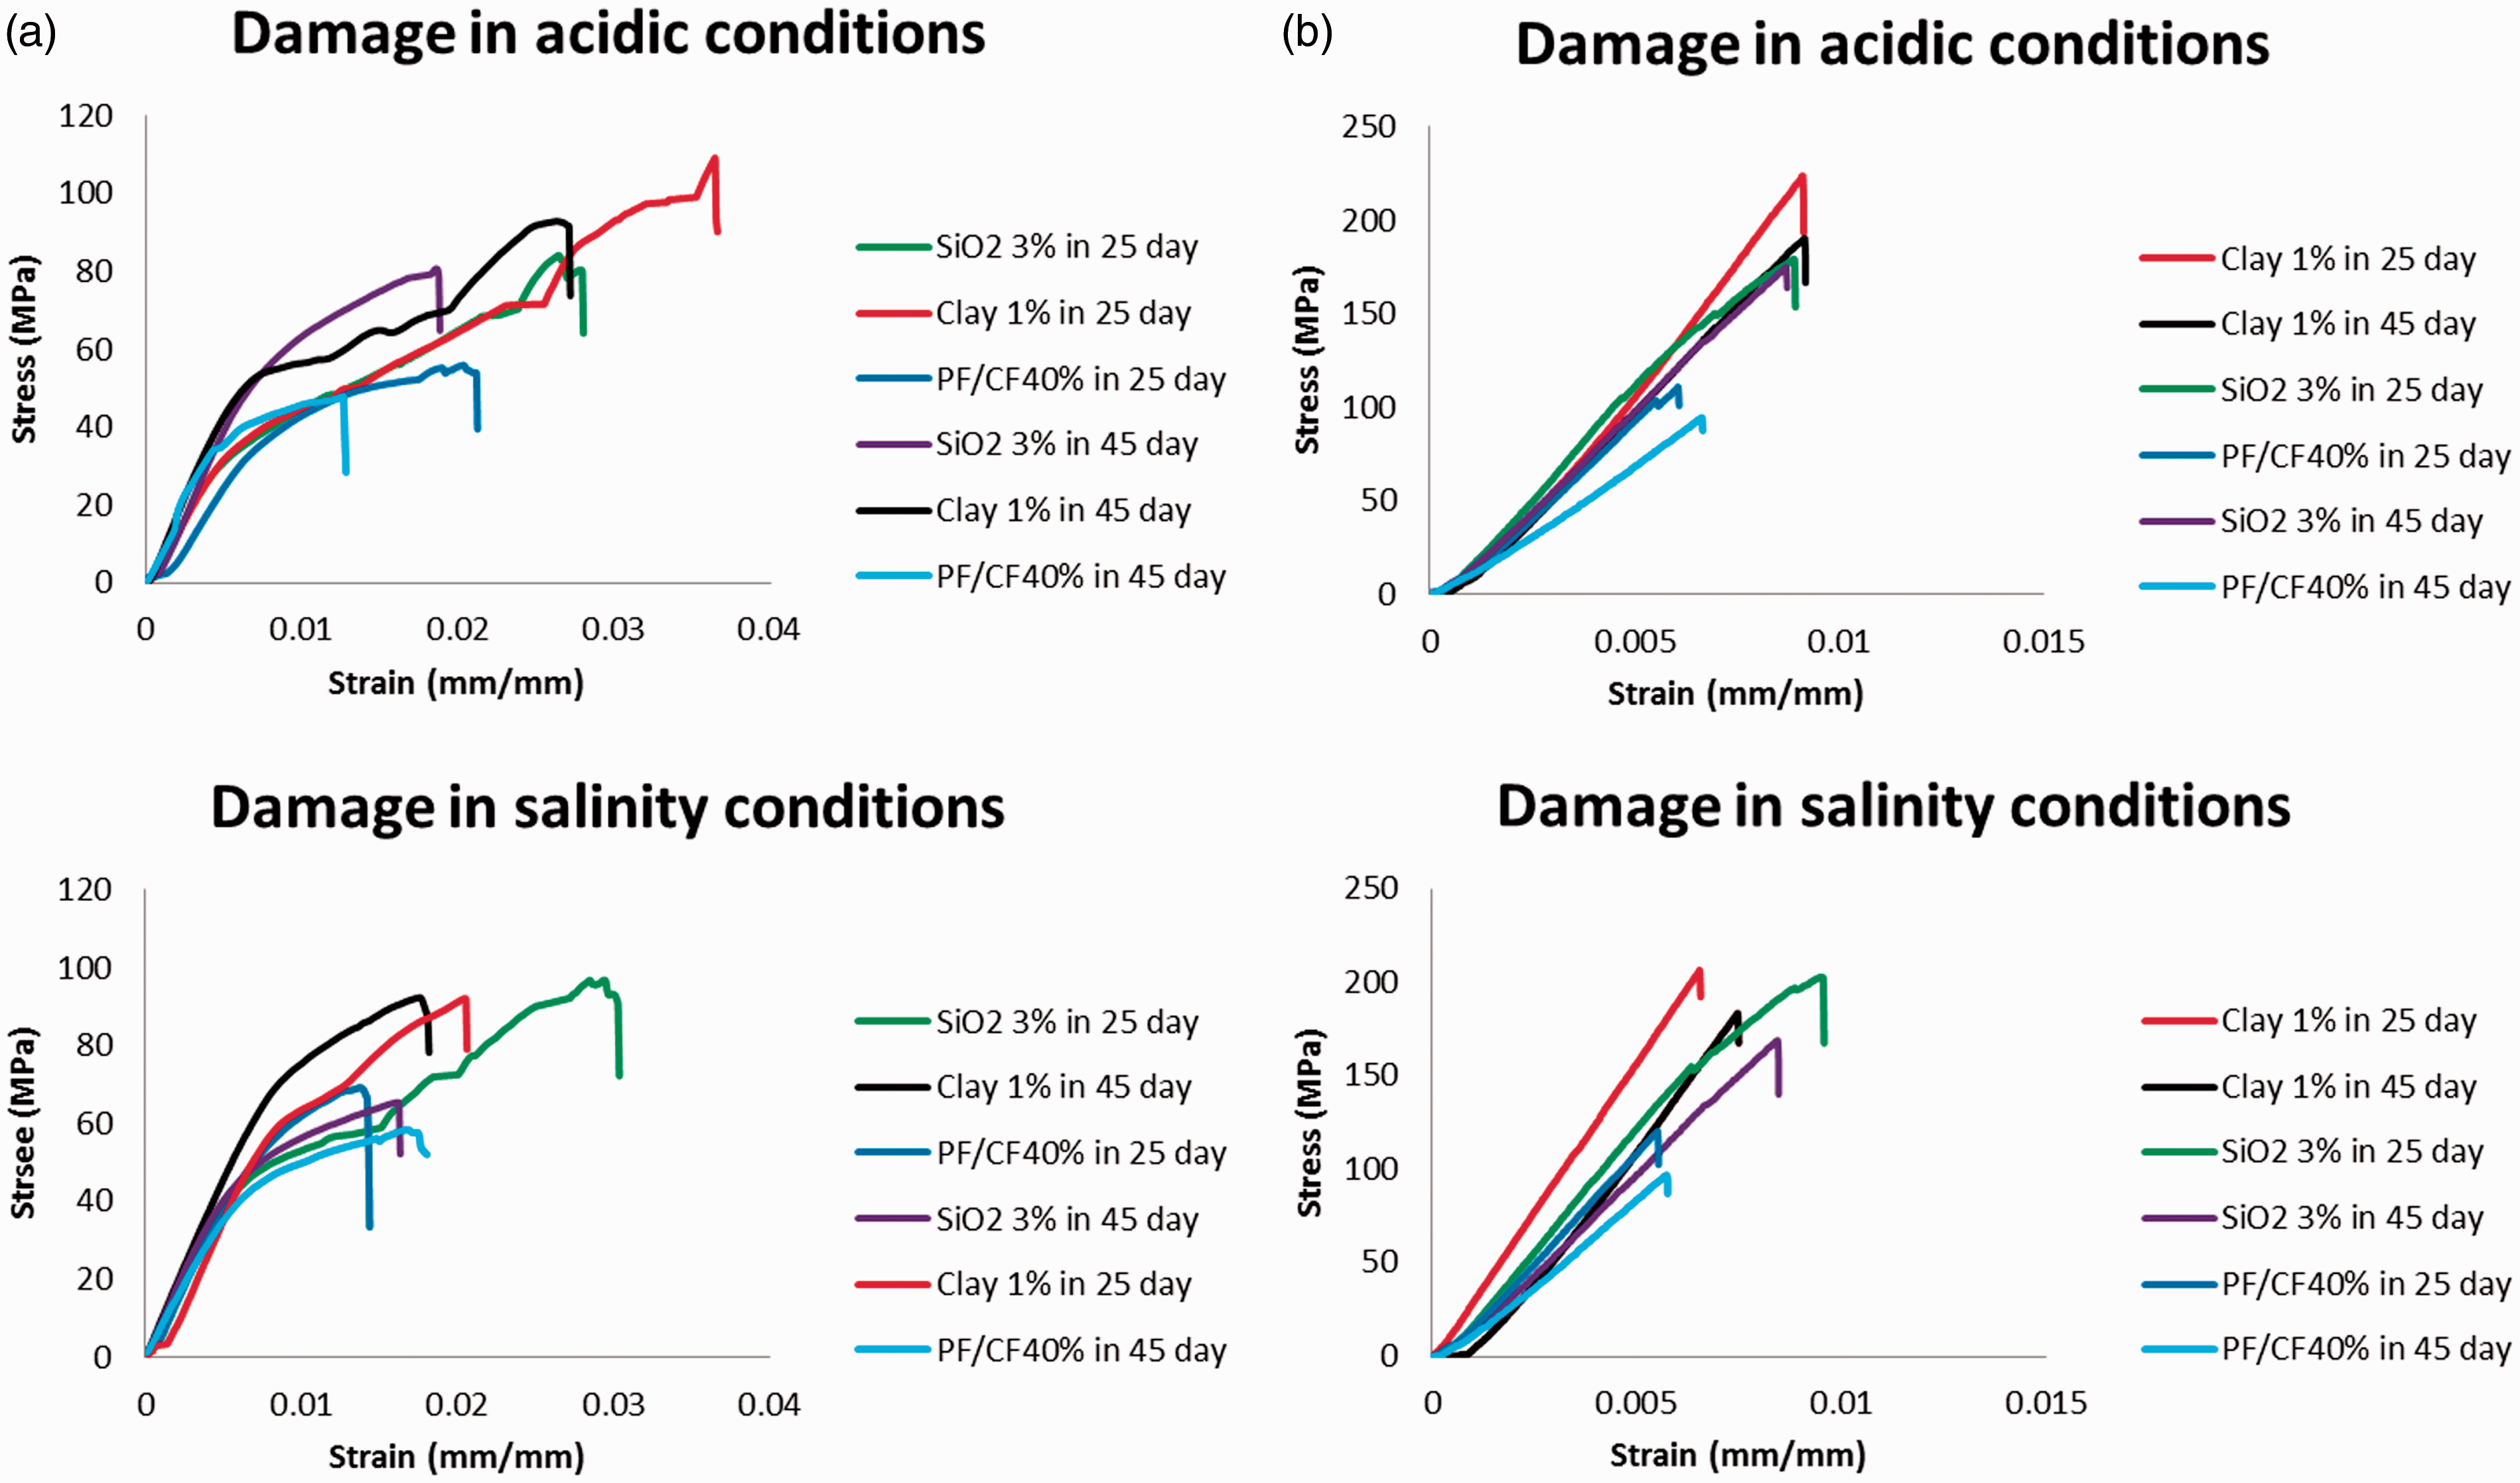
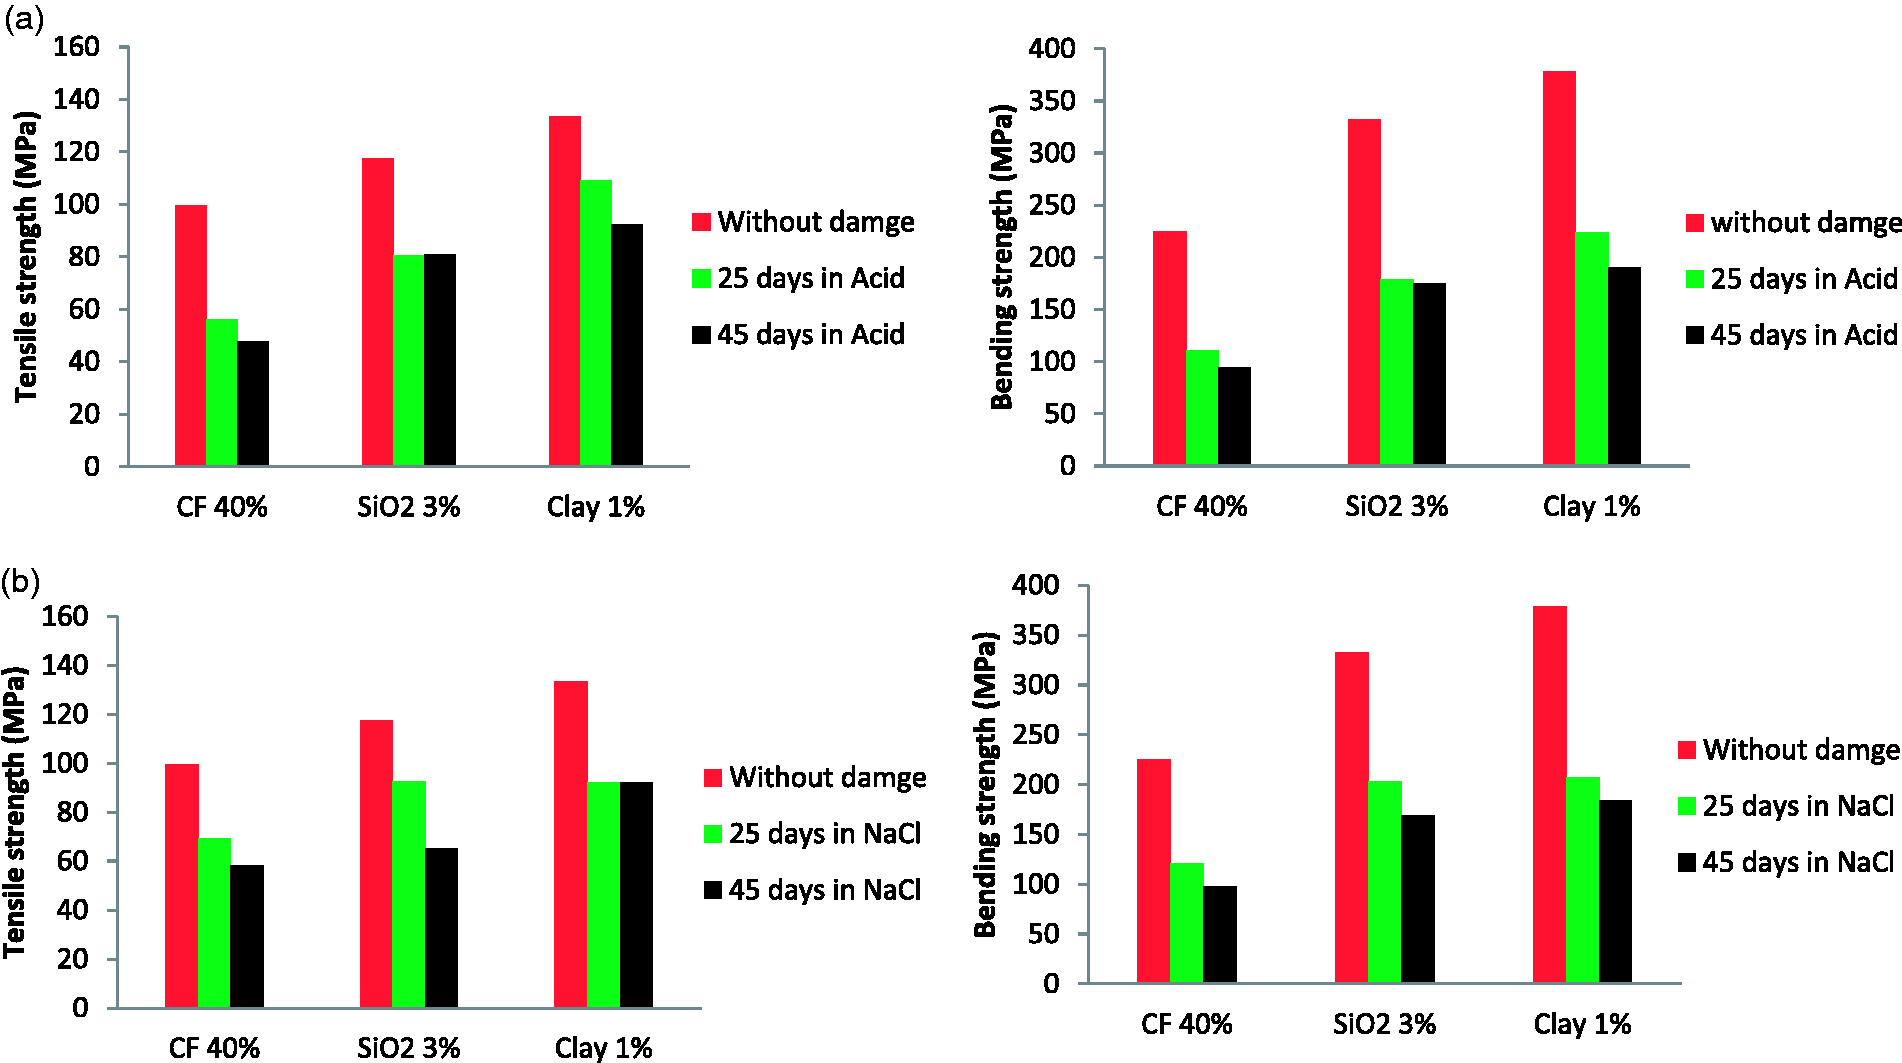
It can be seen that regardless of the type of composition used in the storage of corrosive solutions, the strength of the produced composite is reduced significantly. The percentile reduction of the tensile and flexural strength of PF/CF40% after 25 days of exposure to the acidic medium is about 44% and 59%, respectively, while the percentage of the reduction of the strength in salt water is about 31% and 50%, respectively. Also, for composite reinforced with 3% of nano-silica particles, reducing the tensile and flexural strength in the acidic medium is about 35% and 50% and in salt solution is approximately 16% and 30%, respectively. In addition, for composite reinforced with 1% nanoparticles, the tensile and flexural strength in the acidic medium is 16% and 40%, respectively, while the tensile and flexural strength of the composite sample in salt solution is reduced by nearly 35% and 55%, respectively. As a result, in the acidic environment, the composite compound strength is significantly reduced compared to the brine. Also, due to the increased corrosion in longer storage time, the strength changes is more; the other remarkable issue in these figures is the little difference between the time of 25 days and 45 days in reducing strength. In other words, it can be deduced that the amount of corrosion in the early days is high, and when the phenolic resin is corroded and approaches to the composite layers the reinforcements, these reinforcements resist and decrease the corrosion rate. The nano-particles fill the empty spaces in the composite and prevent the penetration of the corrosive solution (salt and acid) and reduce the corrosion rate.23,24 Due to high surface area per unit volume, nanoparticles also have a uniform distribution on the material, and the maximum coating efficiency can be achieved using the minimum amount of material used. In a nano-composite product, polymers and nanoparticles are synthesized by dissolving in quiescent polymerization and by melting interaction. The nano-structural layers are formed by spraying and then by compressing, and the electrostatic auto formation reaches maximum density and cohesion. They can be used as a solid layer to protect the material from the base material.19–22,27–31
In order to determine the effect of the type of corrosion solution on the composite strength, a comparison of the solutions has been made, and the results are depicted in Figure 12.
The influence of exerting force on bending strength for (a) 25 days and (b) 45 days.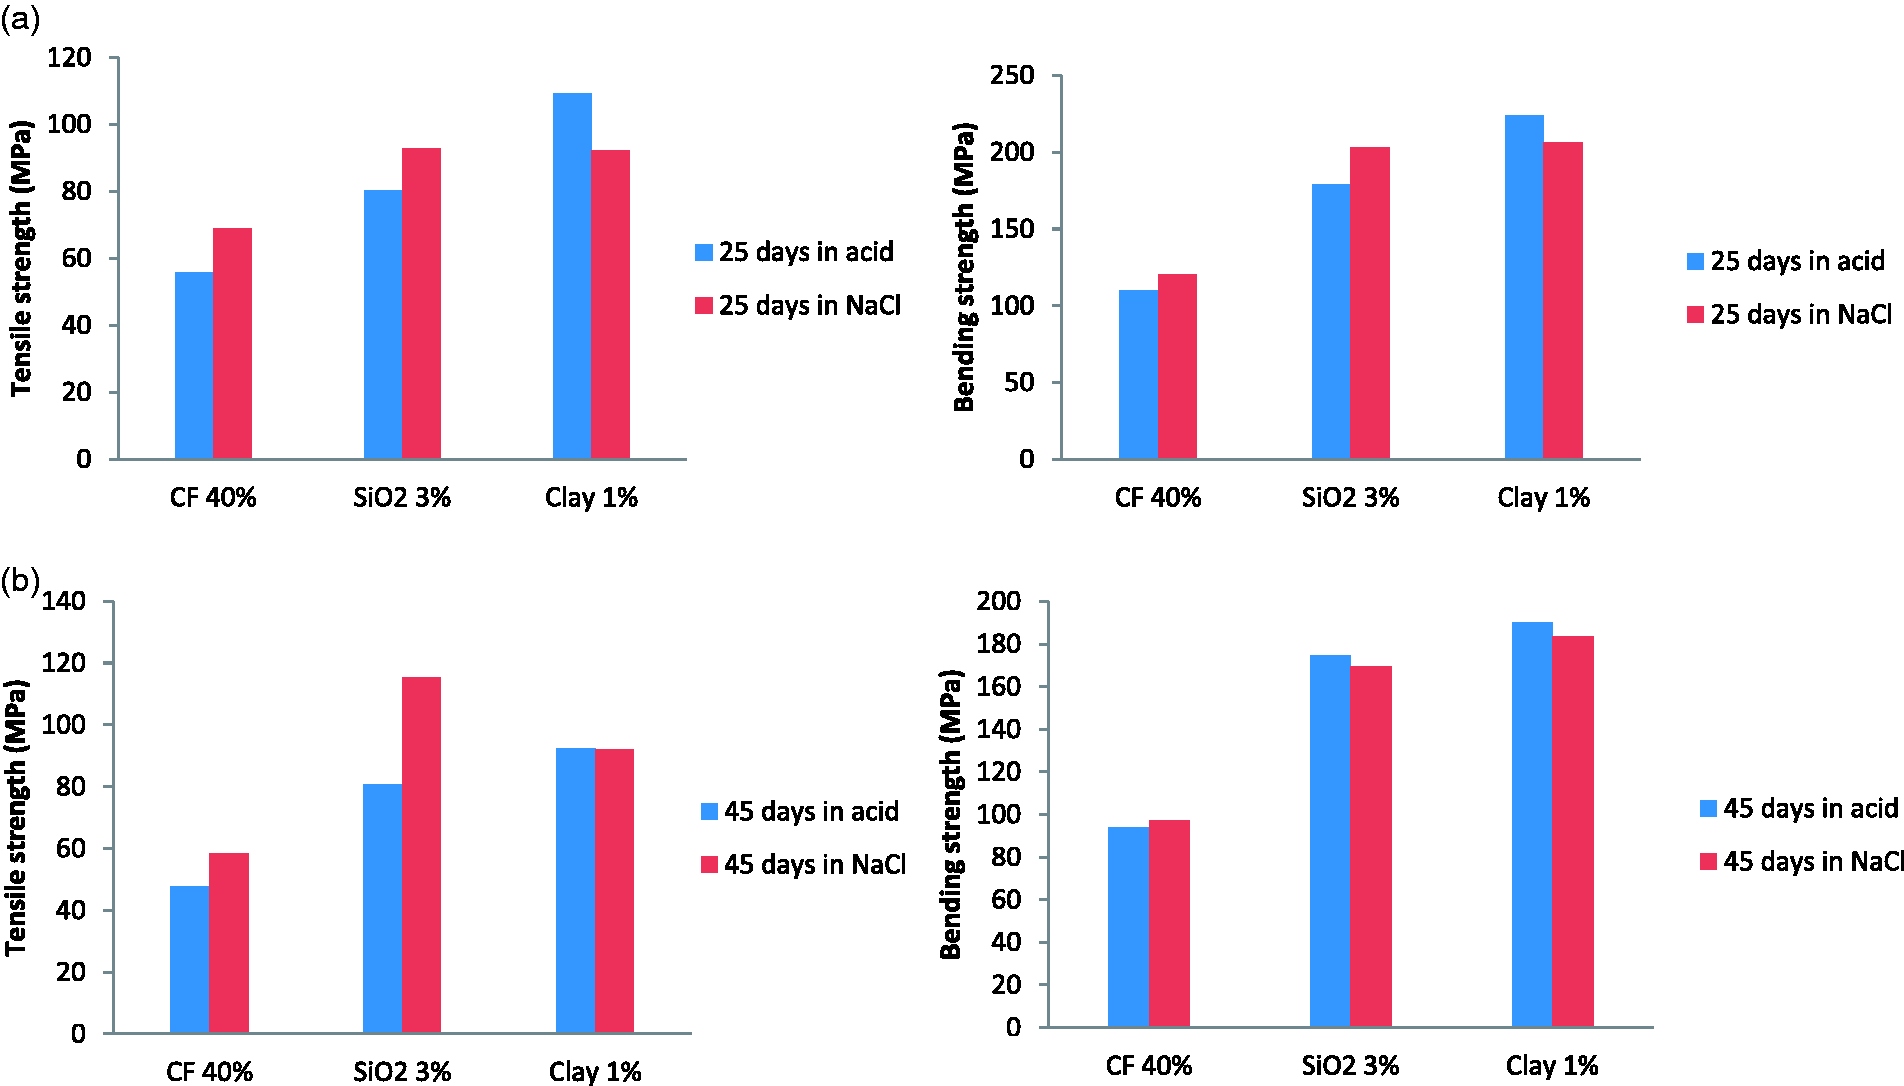
For the composite PF/CF 40% and the composite reinforced with nano-silica, the corrosion rate in acid is more than salt solution. Due to the presence of vacant spaces in the composite PF/CF40%, the corrosive solution is further penetrated. Also in the silica-reinforced composite, due to the presence of oxygen in the SiO2 phase, the corrosion rate of the acid is drastically raised. Therefore, the strength decreases further. However, the composition of the composite reinforced with nano-clay particles is more susceptible to salt solution, and corrosion is only due to acid attack. By contrast, in salt solution, due to the presence of distilled water, the conditions for oxidation and adequate moisture for corrosion are provided.10–22,27–32 Therefore, the corrosion rate of a composite reinforced with nano-clay in a salt solution is higher than that of acid solution. Also, in Figure 13, the SEM images of a sample of a damaged nano-silica-reinforced composite (in acidic conditions) and a nano-clay-reinforced composite (in salt solution) prove that the phenolic resin is corroded in the surface layers. This process is observed regardless of the corrosion time in each solution. In total, the composite strength reinforced with nano-clay particles is more than CF/PF40% pure and nano-silica reinforced composite in corrosive environment since the nano-clay composite reinforcement particles are ceramic which are wear resistant. On the other hand, CF is highly resistive to chemical and corrosive media. It increases the strength of the composite in corrosive environments.
33
Table 1 provides the maximum tensile and flexural strength of the samples.
SEM images of damaged composite sample: (a) PF/CF40%/SiO2 3% in acidic environment and (b) PF/CF40%/clay 1% in salt water environment.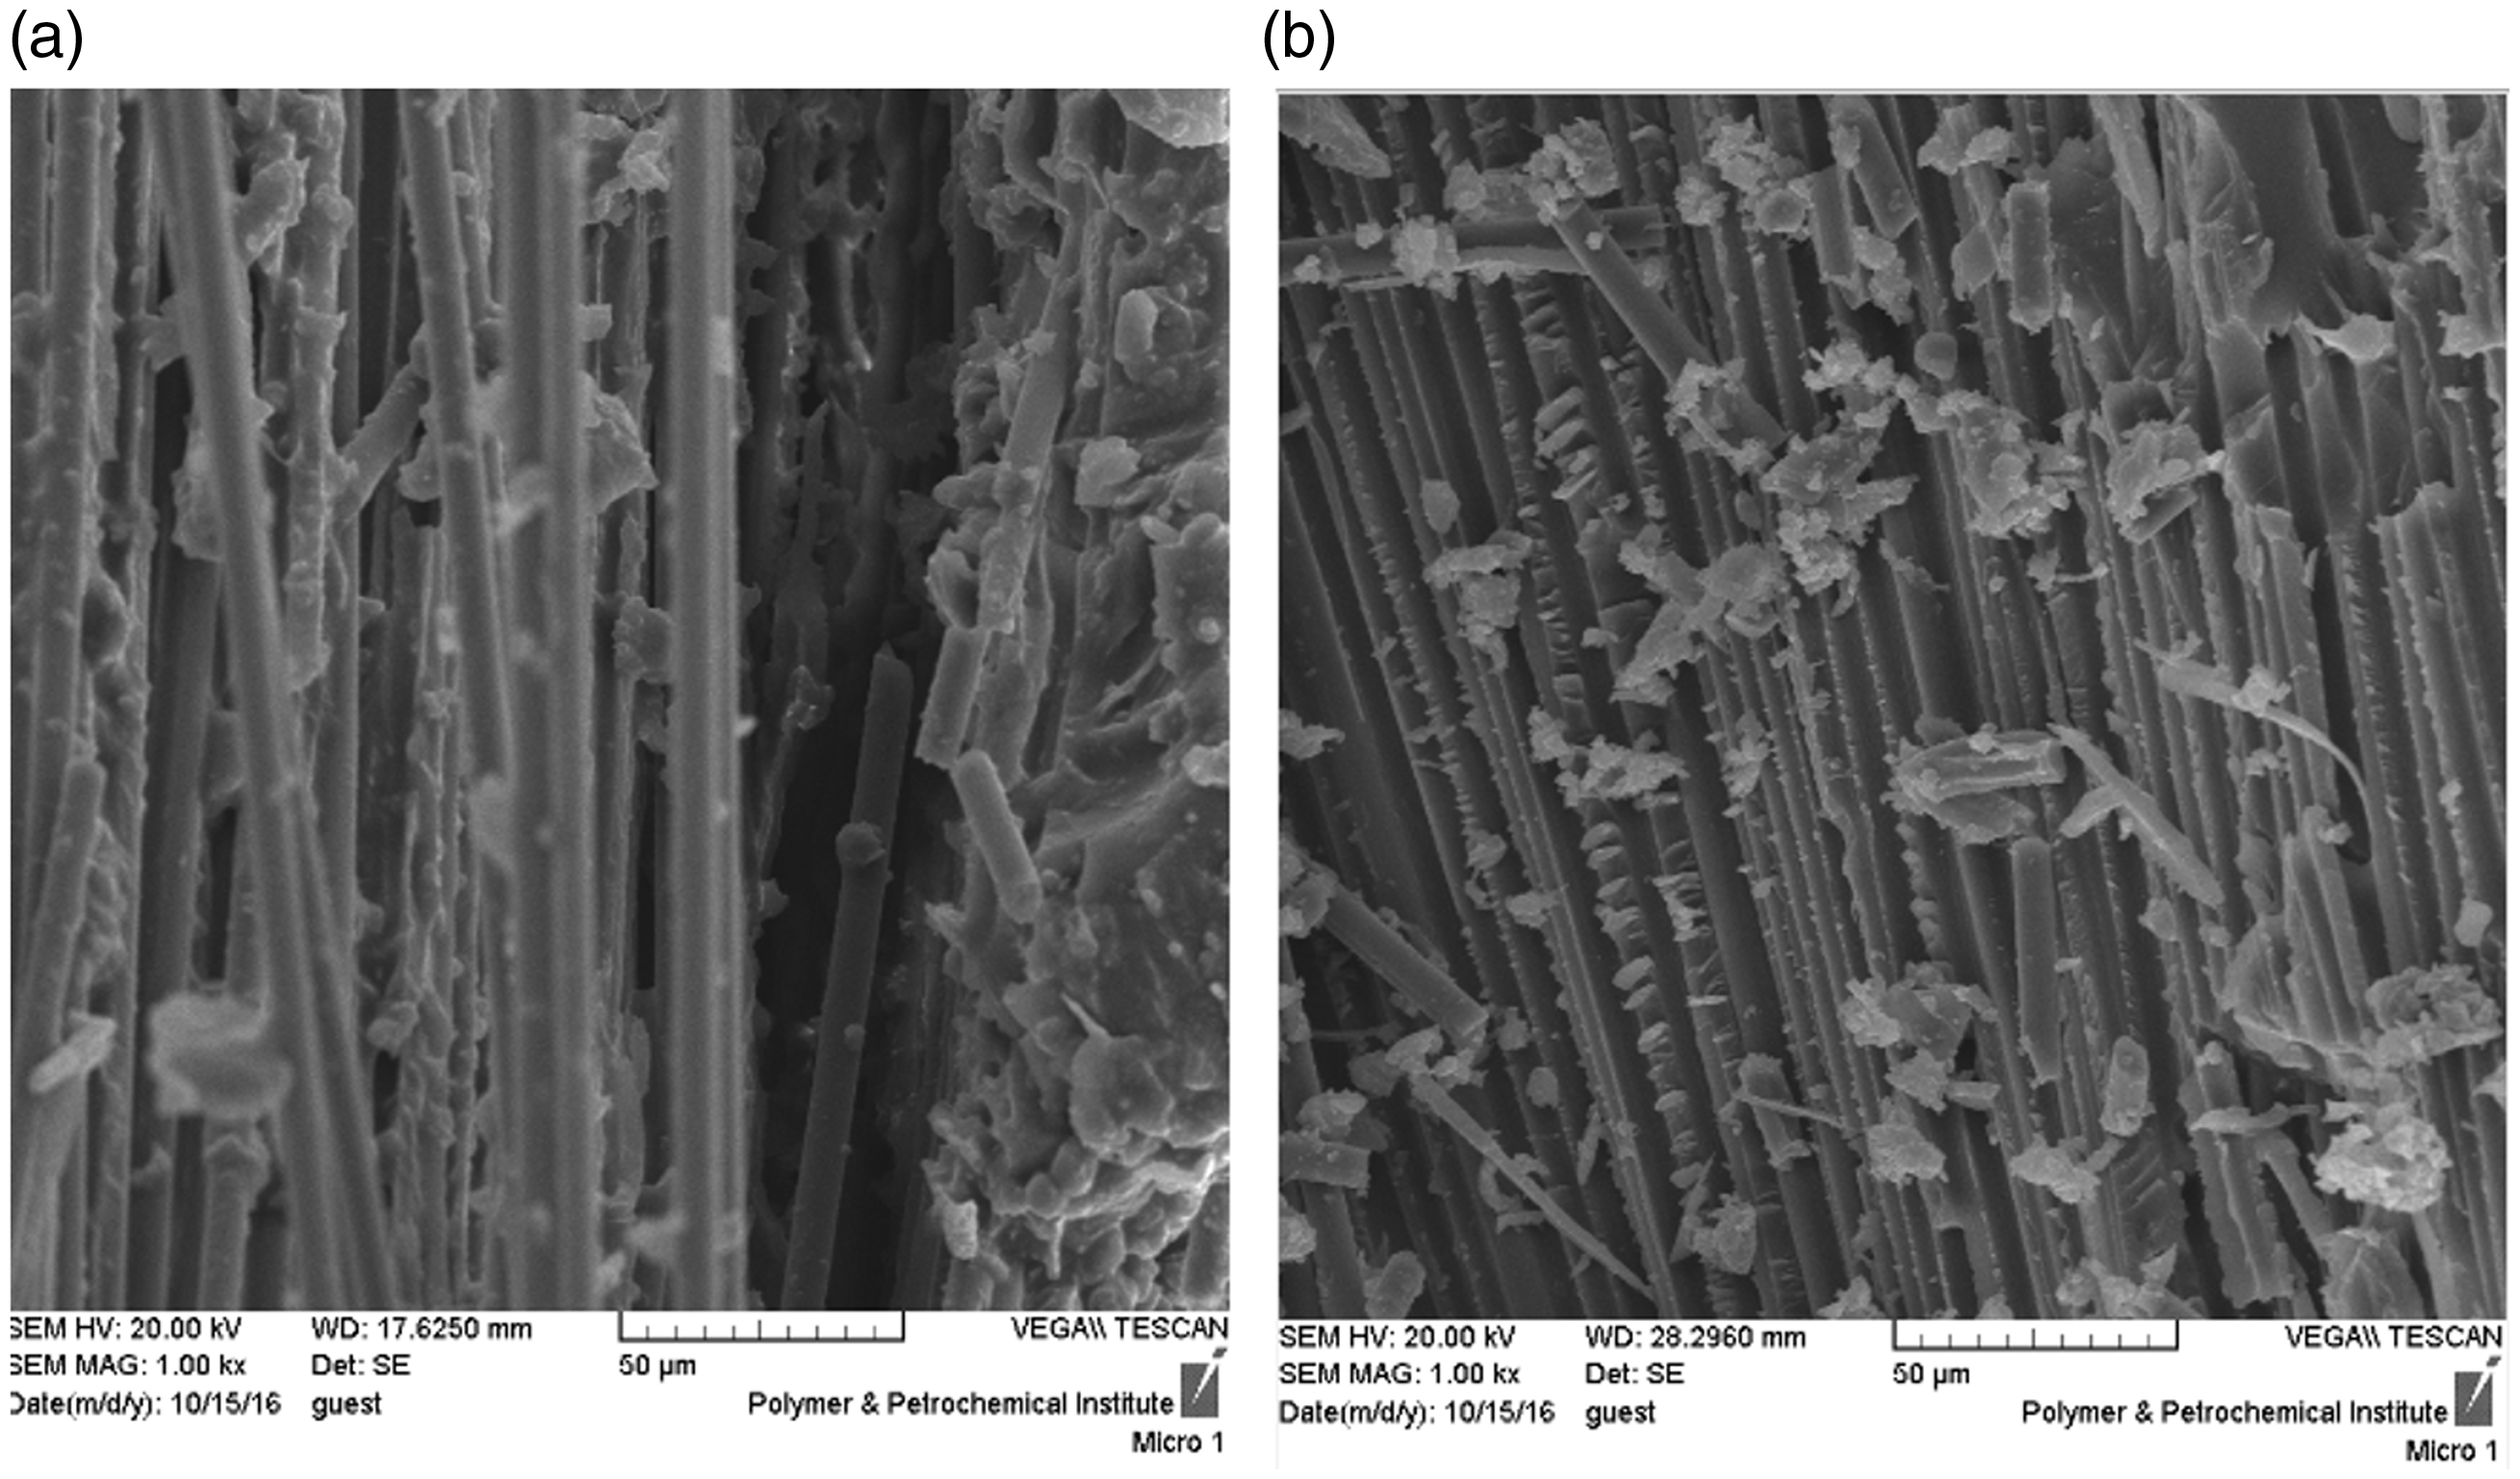
Conclusion
This experimental study has been carried out using nano-polymeric base PF and CF composites reinforced with nano-silica and nano-clay particles. The influence of parameters such as the amount of CF, nano-silica, and nano-clay particles on the tensile and flexural strength of the composites has been investigated. Also, the composite samples have been exposed to acidic and salt water corrosive solutions to determine the behavior of the composite after the exposure to these solutions. The results obtained by this research are categorized as follows:
The composite XRD spectra made show that the distance between silicate layers increases with the rise from 1% to 3% in weight percentage of nano-silica. In addition, the distance between clay layers falls with the rise from 1% to 3% in weight percentage of nano-clay. Composite morphology presents the fact that adding short CFs and nanoparticles reduces the porosity of the composite. On the other hand, the penetration of the nanoparticles into the composite and the adhesion of the resin to the fibers increase. The results reveal that the strength of the sample composites is in turn PF/CF40%/clay 1%, PF/CF40%/SiO2 3%, and pure PF/CF40%. Due to the decline in the size of nano-clay particles compared to the nano-silica, the strength of the composite reinforced with nano-clay is higher and its porosity is lower than those of nano-silica. It has also been proved that the PF/CF40% composite reinforced with nano-silica particles is more sensitive to the acidic environment, while the composite reinforced with nano-clay particles is more sensitive to salt solution. In this case, the strength of the composite reinforced with nano-silica particles in the acidic environment and the strength of the composite reinforced with nano-clay particles in the salt solution environment is lower. Mechanical properties of phenolic nanocomposites.
Footnotes
Declaration of Conflicting Interests
The author(s) declared no potential conflicts of interest with respect to the research, authorship, and/or publication of this article.
Funding
The author(s) received no financial support for the research, authorship, and/or publication of this article.