
Abstract
In design under uncertainty, random distributions are often determined by expensive sampling tests. A key question is whether to invest in more samples or live with a reduced performance by fewer samples due to large uncertainty. The question is particularly difficult to answer when the type of distribution is unknown. This paper investigates the tradeoff between performance and conservativeness in estimating B-basis allowables, using experiments on composite plates with holes. Two approaches that do not require a distribution type are examined: (1) bootstrap confidence intervals and (2) Hanson-Koopmans non-parametric method. Based on the study, it is found that the Hanson-Koopmans method was more conservative than the bootstrap method because the latter penalized allowables for small-size samples. For a small number of samples (less than 29), conservative estimations are preferred over accuracy to account for the large uncertainty. Based on this observation, the bootstrap-assisted Hanson-Koopmans method is proposed to enhance the conservativeness. For the tested cases, the performance penalty using the bootstrap-assisted Hanson-Koopmans method for a small number of samples is found to be substantial.
Keywords
Introduction
In design under uncertainty, the distributions of random variables are often determined by expensive samples. The uncertainty related to the material properties of a composite laminate is significant and has to be modeled properly for reliable designs. 1 The manufacturing and testing process could be expensive and time-consuming which makes the design process more challenging. One remedy for limited tests is to introduce analytical models/simulations.2,3 Vallmajó et al. 3 proposed an uncertainty quantification and management (UQ&M) framework based on analytical models to compute the B-basis design allowables of notched configurations. However, the analytical models are not always available, and this paper focuses on experimental tests only. With limited tests, a key question is whether to invest in more samples or live with the reduced performance by fewer samples due to large uncertainty. Identification of the distribution/uncertainty forms for statistical analysis would be also challenging with few samples. 4 Conservative designs are preferred when uncertainty exists especially for safety-critical applications such as helicopter rotor blades. 5 However, the reduction in performance can be substantial because sampling uncertainty is epistemic uncertainty, which is usually treated more conservatively than aleatory uncertainty. Consequently, there has been substantial recent interest in the tradeoff between reducing sampling uncertainty and improving performance. Picheny et al. 6 studied the influence of sample sizes and target probability of failure on the conservative estimate. Bae et al.7,8 showed a tradeoff between making design conservative and using more samples to reduce sampling uncertainty. However, they assumed that the samples are normally distributed.
Establishing the tradeoff between the increased sample size and reduced performance is more challenging when the type of distribution is unknown. This paper presents a lesson learned from the regulations governing the design of composite materials used for aircraft structures. Composite materials are widely used for the design of various mechanical systems due to the outstanding capability to be tailored to specific load paths and conditions, resulting in weight efficient designs. For example, more than 50% of the Boeing 787 airframe and the Airbus A350XWB are made of carbon fiber composites. 9
To determine the conservative strength of composite plates, multiple coupons at the same configuration (design) are tested. Design allowables (e.g. A- or B-basis allowables10,11), which are also termed as tolerance intervals/limits (TI), are usually obtained from the confidence interval of a low percentile of measured strengths. Various methods for computing the TI of composite material are well documented in the literature.12,13 The calculation of TI depends on the type of distributions (e.g. normal, lognormal, and Weibull). Young 11 summarized the statistical approaches for calculation of TI for discrete and continuous distributions. When there is no clear indication of a specific type of distribution, MIL-HDBK-17-1F 14 recommends the non-parametric method such as the Hanson-Koopmans (HK) method. 15 The non-parametric method compensates for the lack of knowledge of the distribution by increasing conservativeness.
Conservative allowables imply more weight, but Bhachu 16 found that the non-parametric approach is efficient in achieving conservativeness without excessive increase in weight, compared to methods based on assumed distribution. Still, the HK method can fail when the sample size (number of the replicates) is smaller than a critical value, which varies with distributions. 15 Besides the HK method, bootstrap confidence bounds have been used to infer design allowables without specifying a statistical distribution. Cross et al. 17 estimated the confidence intervals of the crack growth model using bootstrap confidence bound. Bigerelle et al.18,19 quantified the uncertainty in Paris law material constant using the bootstrap. Bhachu et al.16,20 compared several common approaches for fatigue crack growth problems. Romero et al.21,22 tested the performance of the TI method, kernel density method, Johnson method, and non-parametric method.
The TI approaches are based on rigorous mathematic assumptions and work well with high variability. However, with too small number of samples, it is difficul to identify the distribution type to apply TI. The non-parametric B-basis approach is invalid when the sample size is smaller than a critical value. Besides the effort to develop statistical tools for characterizing TI, extensive experimental studies have been reported to understand the variation of material properties. The world-wide failure exercises23,24 provided experimental data and benchmarks for failure criteria of composites. The Laminate Variability Method 25 was proposed to incorporate the material properties at a lamina level to mitigate the adverse effects of limited numbers of test coupons while computing B-basis values. Carlsson et al. 26 and the Composite Materials Handbook-17 (CMH-17)10 provided an in-depth guideline for systematic experimental analysis.
The B-basis allowables are often estimated from experimental test results on limited samples (e.g. less than 29 samples). This paper investigates the estimation of B-basis allowables, a typical TI, from limited samples using test results obtained from the composite laminates with a hole. 27 The tests were performed at eight configurations with 18 samples per configuration. The eight configurations are selected by changing two design variables: the size of the hole and the fraction of 45-degree plies in the laminates. Experimental data were collected on open-hole-tension (OHT) strength tests28,29 following ASTM standard 27 for this study.
Two issues are investigated in this paper: (1) Are the B-basis allowables estimated from small-size samples as reliable as those from large-size samples? (2) What is the weight penalty when using the design allowables from a limited number of samples? In order to address these two issues, two approaches are evaluated in this paper: (1) bootstrap confidence intervals and (2) HK method. The former does not assume an underlying probability distribution, while the latter assumes log-concave CDF class, which is good for the distribution of composite failure strength.
One challenge for predicting B-basis allowables is balancing conservativeness (for a safe design) versus performance (weight penalty). Conservative prediction is a necessary requirement for certification by regulatory bodies, like the Federal Aviation Administration. B-basis allowables are sensitive to distribution form and sample size, which complicates the calculation. This paper utilizes a partial set of samples (out of 18 samples per configuration) to estimate B-basis allowables, from which the conservativeness and weight penalty are calculated. This paper also explores the usefulness of combining the non-parametric estimation with bootstrapping to account for the unidentified uncertainty and ensure better conservativeness.
The paper is structured as follows: The following section discusses the experiments of the benchmark OHT tests and statistics of the experimental results. Then, the estimation of B-basis at a given configuration with samples is detailed. ‘Estimating B-basis allowables of the OHT tests’ section evaluates the B-basis estimations using the experimental results. In the penultimate section, the bootstrap-assisted HK is proposed to enhance the conservativeness from limited samples. In conclusion, we summarize the major outcomes and future work on the estimation of design allowables.
OHT tests
Experiments
OHT test30,31 is a benchmark test to investigate the effect of an unfilled hole on the tensile failure strength. In this paper, it is used to investigate the approaches to estimate B-basis allowables. The test specimen geometry is shown in Figure 1. The composite laminates are made from MTM45-1 PWC2 3K PW G30-500 fabric prepregs, and the tests were performed according to ASTM D5766.
27
The width of the specimen and the diameter of the hole were denoted by w and D, respectively.
Open-hole tension test specimen configuration and observed failure mode.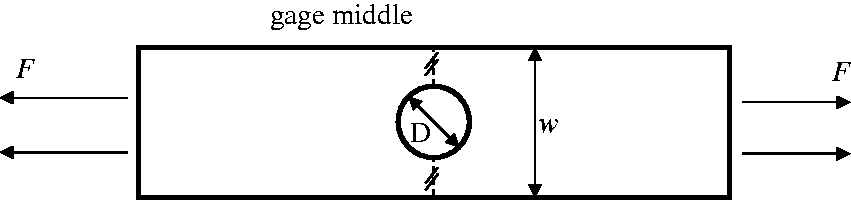
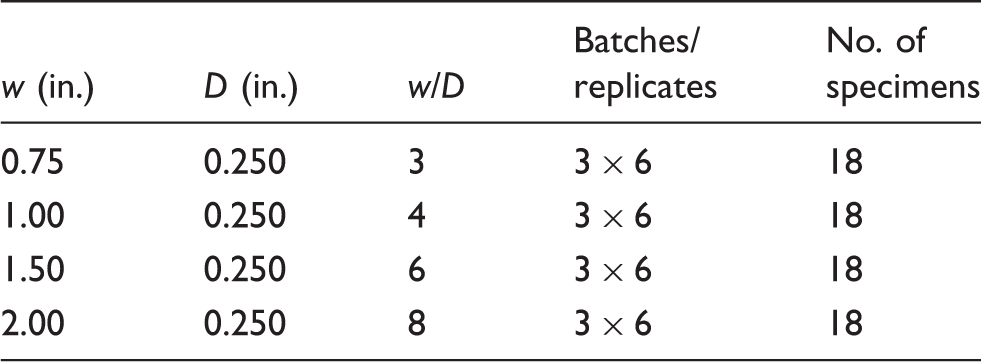
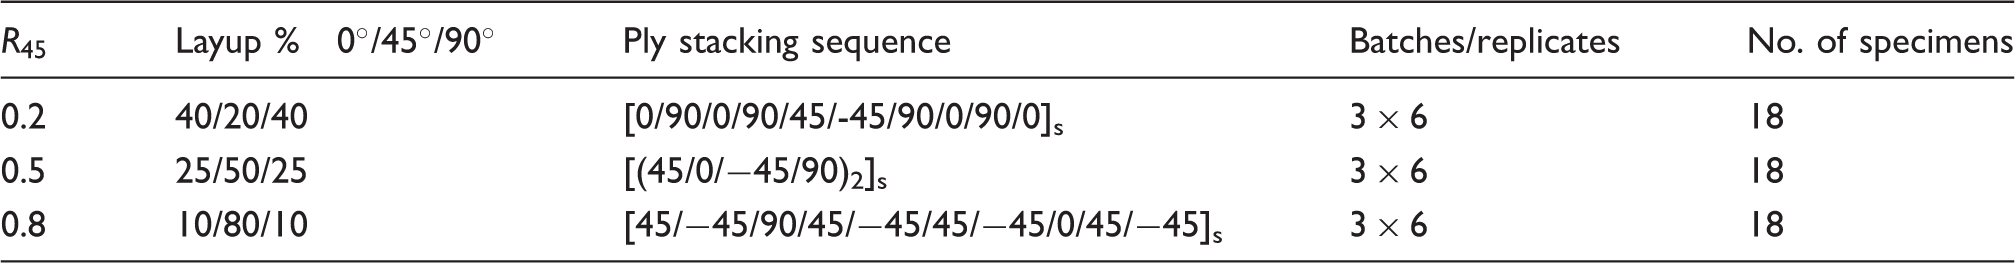
The test configurations in two design variables.
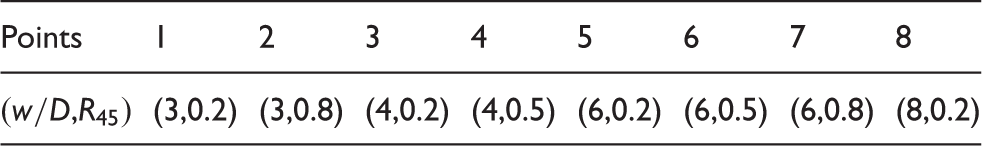
w/D test matrix at a given R45.
Layup test matrix at a given w/D.
Statistics of the experimental strengths
The test results are first examined using boxplot (see Figure 2) and statistics (see Table 4). The means of strengths vary between 37 and 100 ksi in different configurations. For a fixed Boxplots of tensile strength using 18 samples at eight different configurations. Statistics of tensile strength using 18 samples at eight different configurations.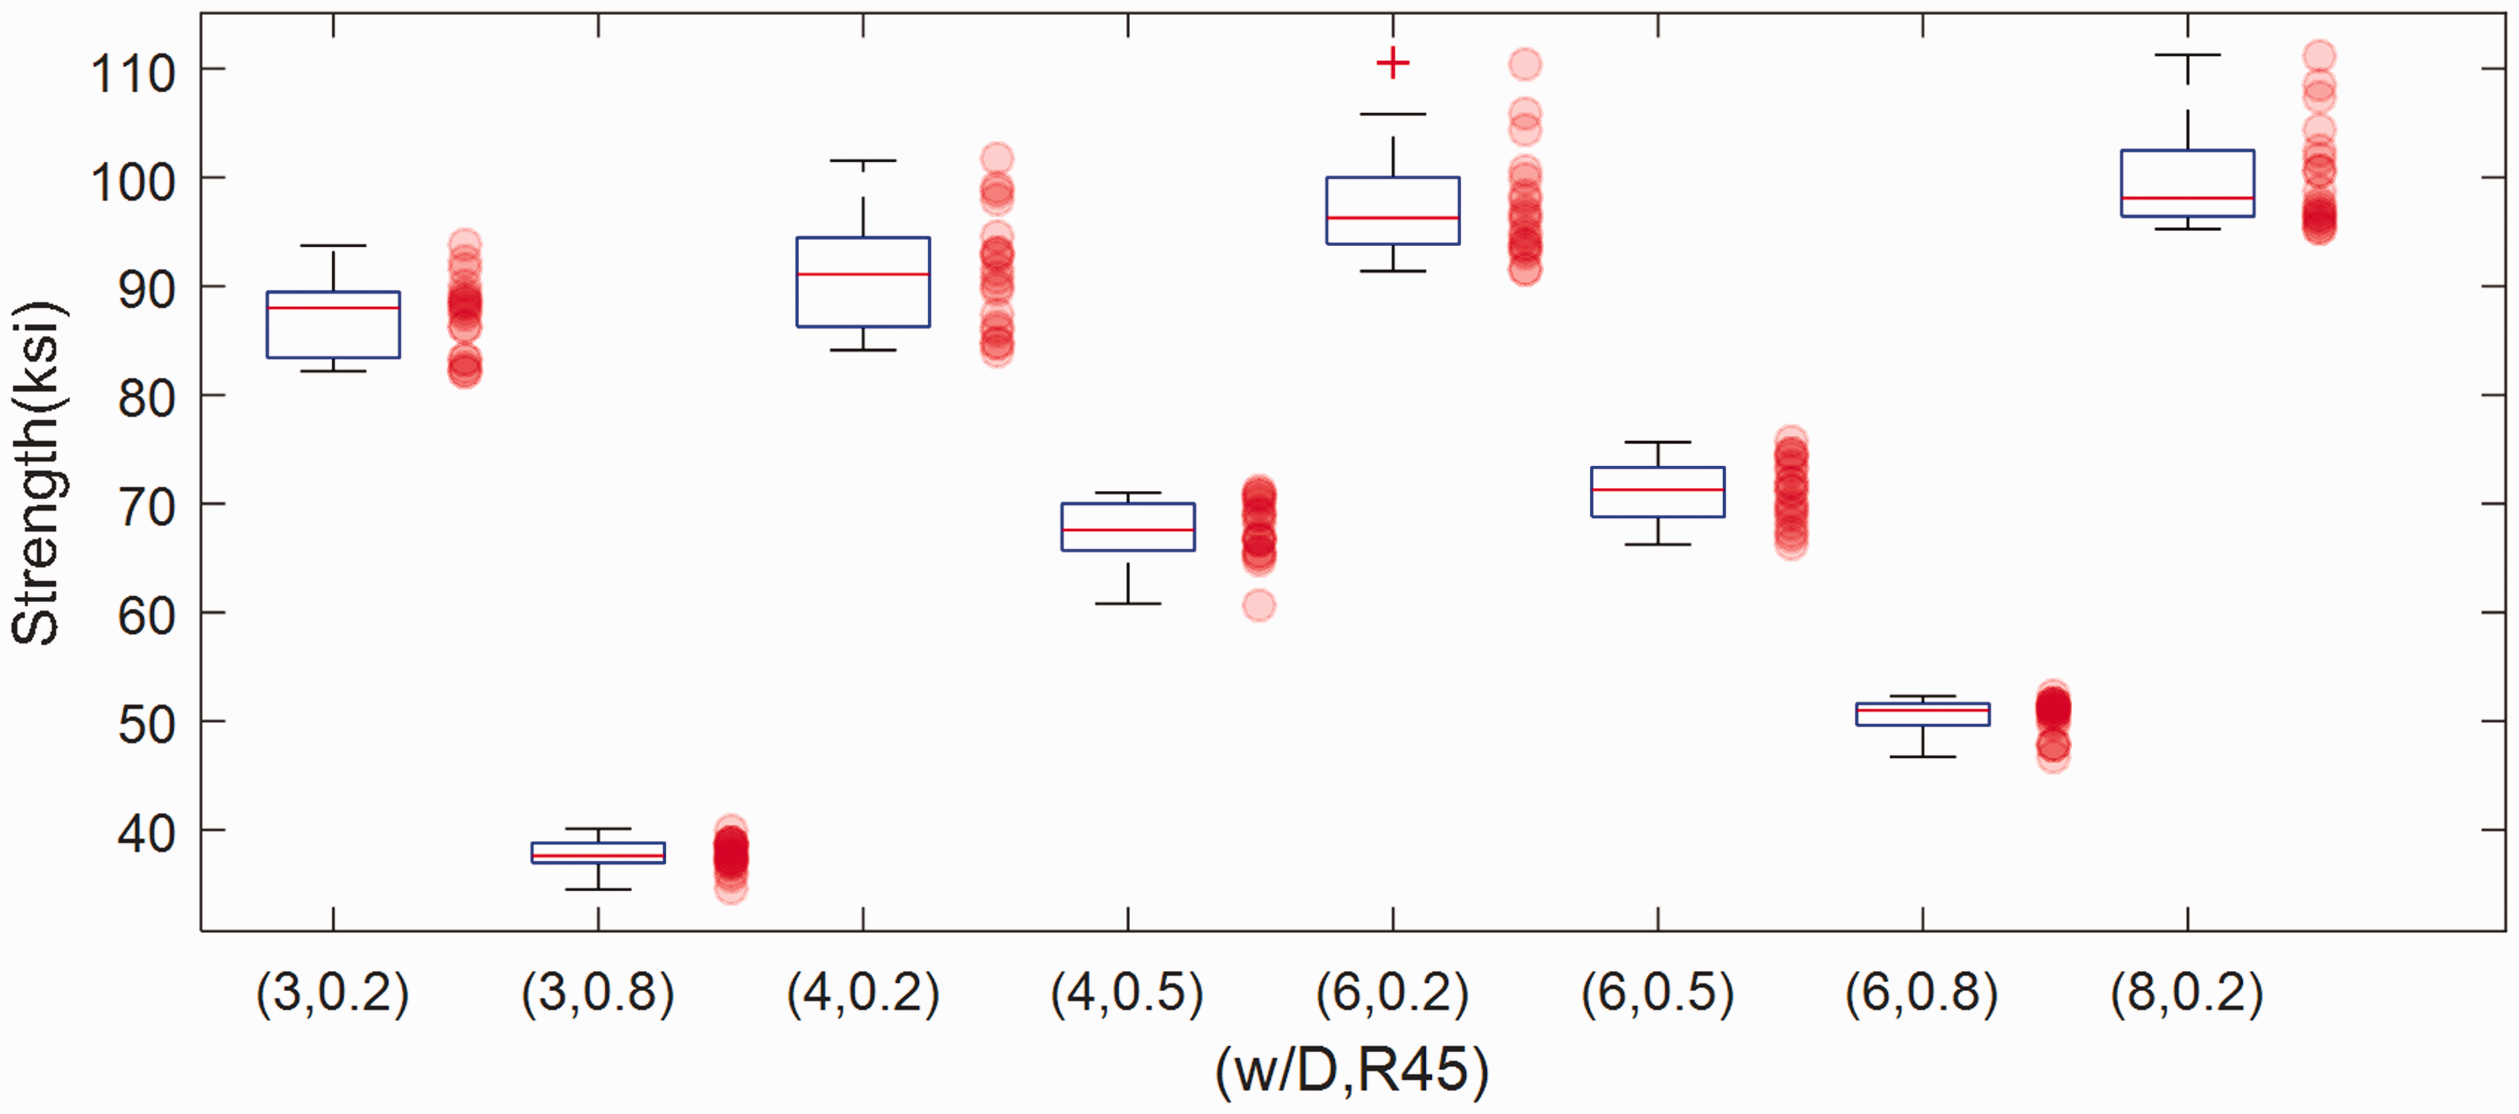
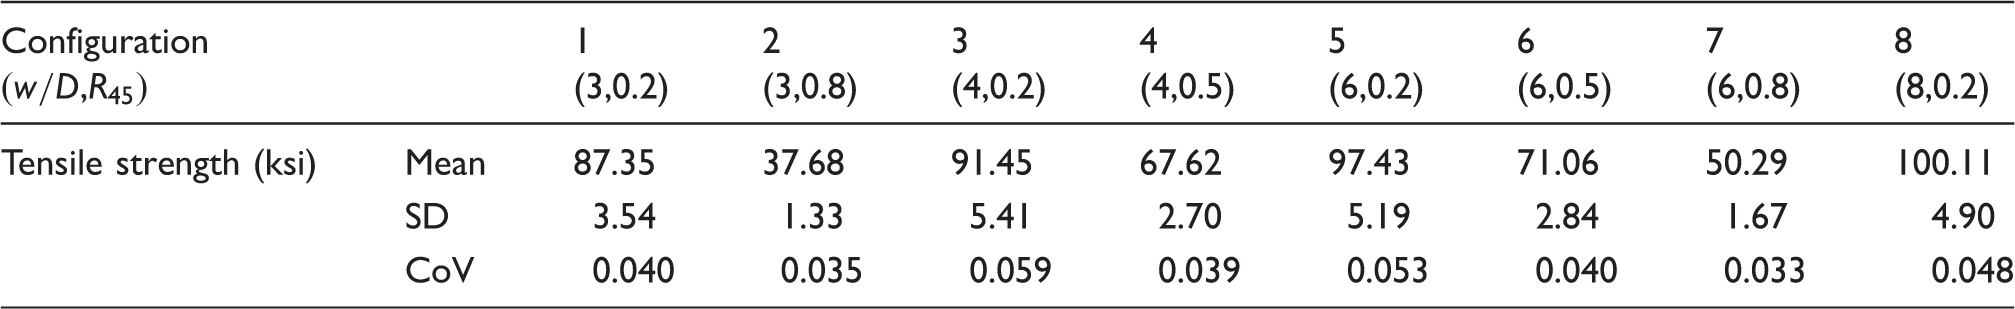
Estimation of B-basis heavily depends on the type of distributions. Figure 3 shows the histograms of the samples at different configurations. Configuration 2 showed a pattern of Weibull distribution with a heavy tail, configurations 1 and 7 follows a bimodal, and configuration 6 is close to a uniform distribution. The Kolmogorov–Smirnov (KS) test
12
was used to quantify which continuous distribution is the best fit. The KS test is a non-parametric test to quantify the goodness-of-fit between a given probability distribution and the empirical distribution of samples. The OHT samples are tested for a normal, uniform, and Weibull distributions, but there is no single distribution that fits all samples the best. Details of the KS tests are provided in Appendix A.2. The normal distribution fits best for four configurations, uniform distribution fits best at a configuration, and Weibull distribution fits best at three configurations. Based on the histograms and KS tests, the non-parametric approach was selected for calculating B-basis allowables.
Histograms of samples at different configurations.(a) Configuration 1, (b) Configuration 2, (c) Configuration 3, (d) Configuration 4, (e) Configuration 5, (f) Configuration 6, (g) Configuration 7 and (h) Configuration 8.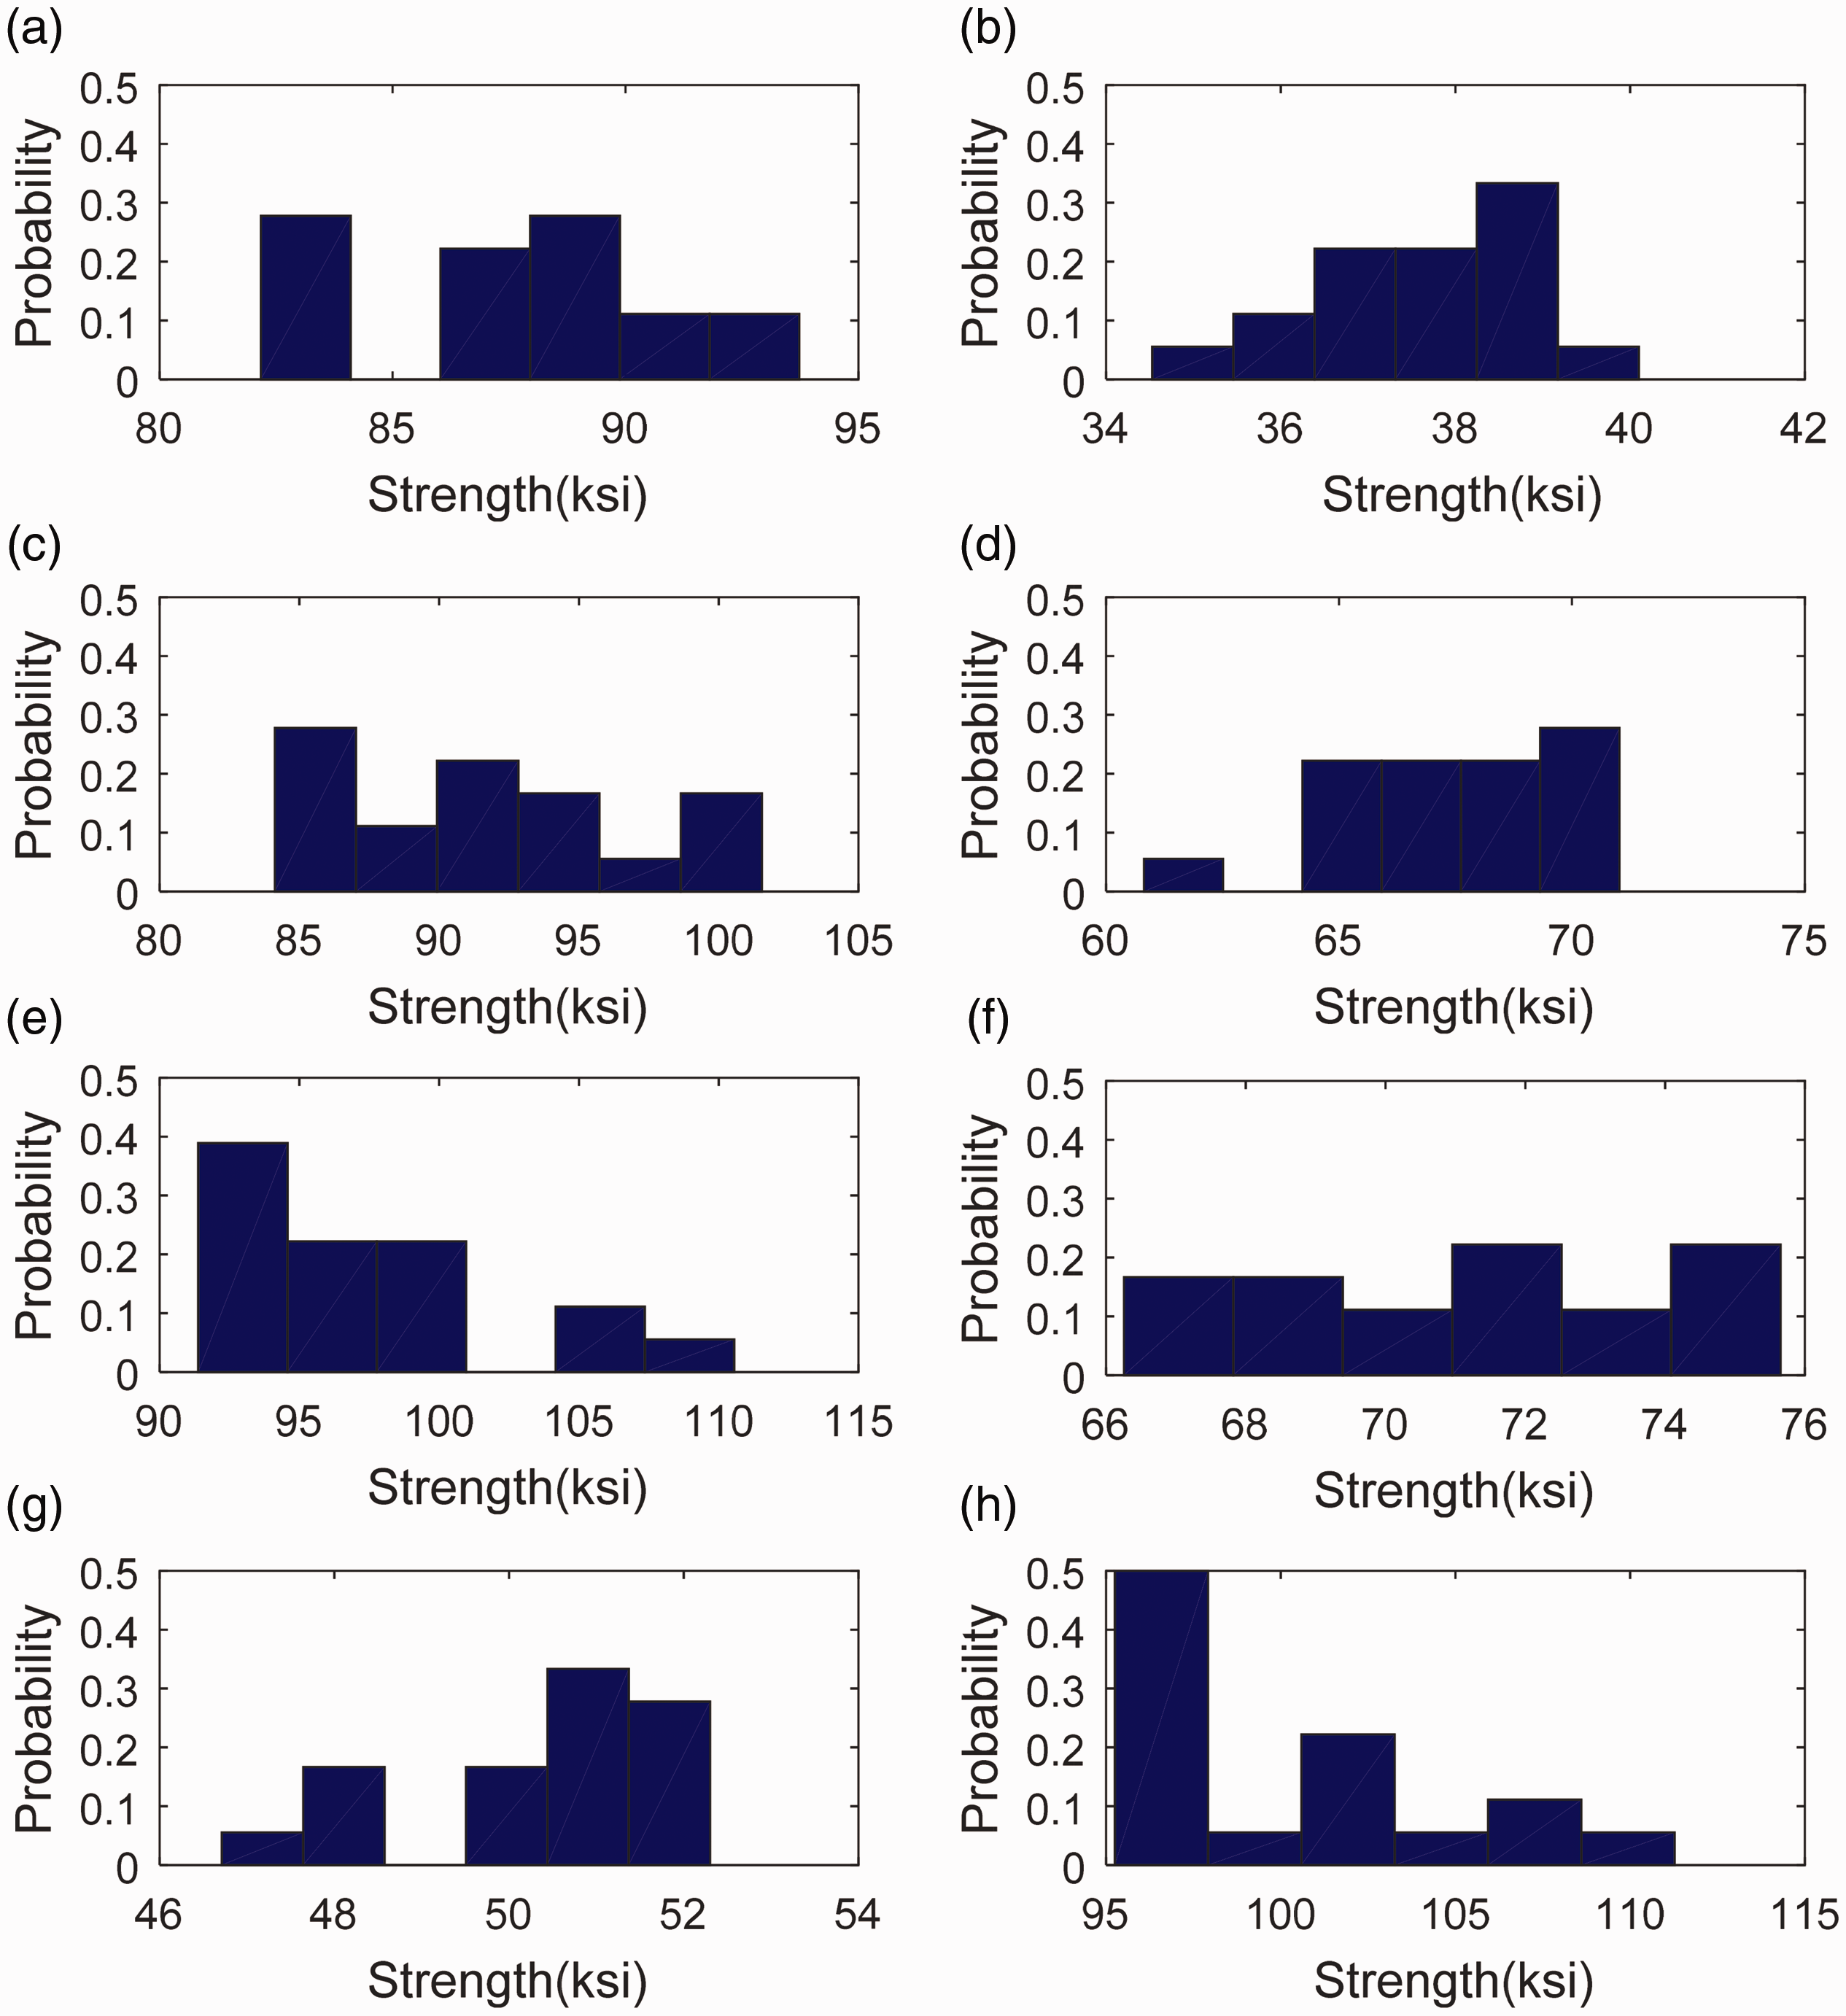
Estimating B-basis allowables for unknown distributions
A design allowable is determined such that it is less than a large portion of the population with a high level of confidence. The B-basis allowable is a bound that is less than 90% of the population with 95% confidence, as shown in Figure 4. Two mainstream methods are examined for calculating B-basis allowables from unknown distributions.
Illustration of B-basis allowables based on samples.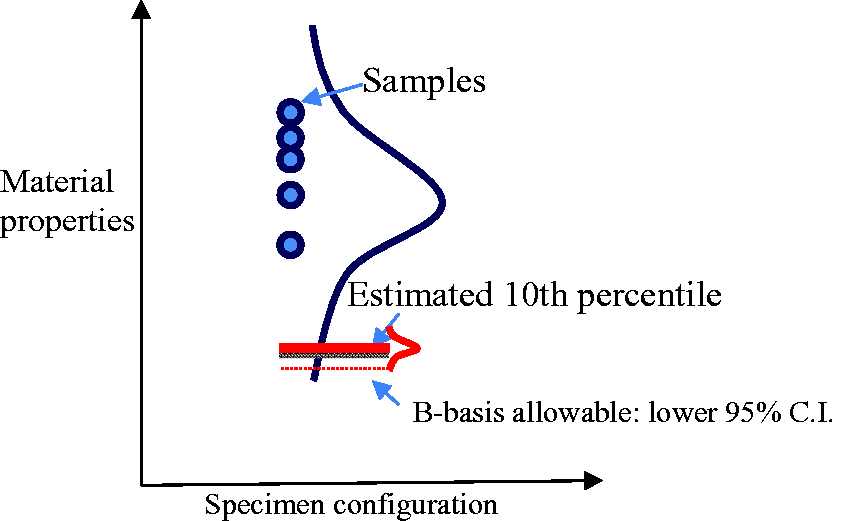
A non-parametric approach using order statistics
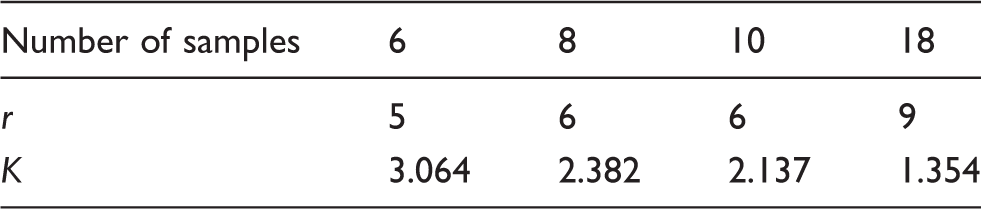
CMH-1710 recommended a non-parametric approach for calculating B-basis allowables when samples do not demonstrate a clear distribution pattern (e.g. due to a limited number of samples). The non-parametric approach is based on the order statistics and varies with sample size. When more than 28 samples are available, the B-basis value is the rth lowest sample, where r varies with sample size. For example, r equals to one when 30 samples are available. The HK method is suggested for non-parametric estimation of B-basis allowables with less than 29 samples. We adopt the HK method for the non-parametric estimation

Parameters for the non-parametric B-basis allowables with different number of samples.
B-basis allowables using bootstrap confidence intervals
Bootstrapping34,35 is a data-driven approach for statistical inference and commonly used for estimating bias and variance of a critical statistic. Various methods have been established for finding confidence bounds from bootstrap sampling distributions. The percentile method determines the confidence interval for the statistic of interest (e.g. 10th percentile) from bootstrapped distributions. The bias correction approach modifies the estimated statistic of interest by a bias to account for the small-size samples. The bias-corrected accelerated method corrects for both bias and skewness in the distribution of bootstrap estimates. Picheny et al. 6 incorporated bootstrapping for reliability analysis of a system response. Edwards et al. 36 proposed an approach to estimate the lower percentiles of material properties using bootstrapping. Lee et al.37,38 evaluated and improved the accurate coverage of the bootstrap confidence interval.
A typical bootstrapping procedure resamples (with replacement) from the available sample set without assuming any probability model. The distribution is approximated by the population of existing samples. Samples with the same size are drawn (with replacement) from the population multiple times. The existing samples are resampled with an equal chance of being selected. Then, a sample statistic (e.g. mean or variance) is calculated from each bootstrapped sample. An empirical distribution of the statistic is obtained to define the uncertainty. The percentile for small-size samples is computed according to Langford. 39
We adopted the bias-corrected accelerated method which corrects the B-basis estimation for both bias and skewness 
Estimating B-basis allowables of the OHT tests
Test plan to evaluate the estimations of B-basis allowables
We resort to the experimental results to estimate B-basis allowables with different sample sizes. The resampling scheme31,41 is adopted to make the most use of experiments and investigate the B-basis estimation with varying sample size. The lower 10th percentile of
Two metrics are used to evaluate the margin (weight penalty) and conservativeness. The weight penalty is based on the assumption that the weight of the laminate is inversely proportional to the load it carries. Therefore, it is defined as the relative difference between the baseline and estimated B-basis. Since there are 
The estimated B-basis allowables 
Estimation of B-basis allowables from experimental replicates
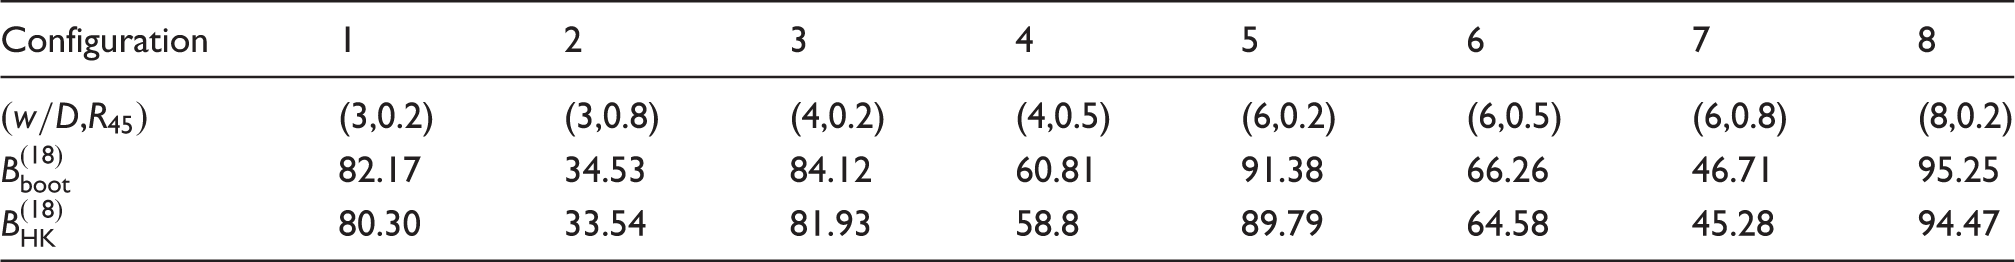
Estimated baseline B-basis allowables (unit: ksi).
The B-basis allowables estimated from Estimated B-basis allowables from the 1000 sets of resamples. B-basis allowables are estimated from 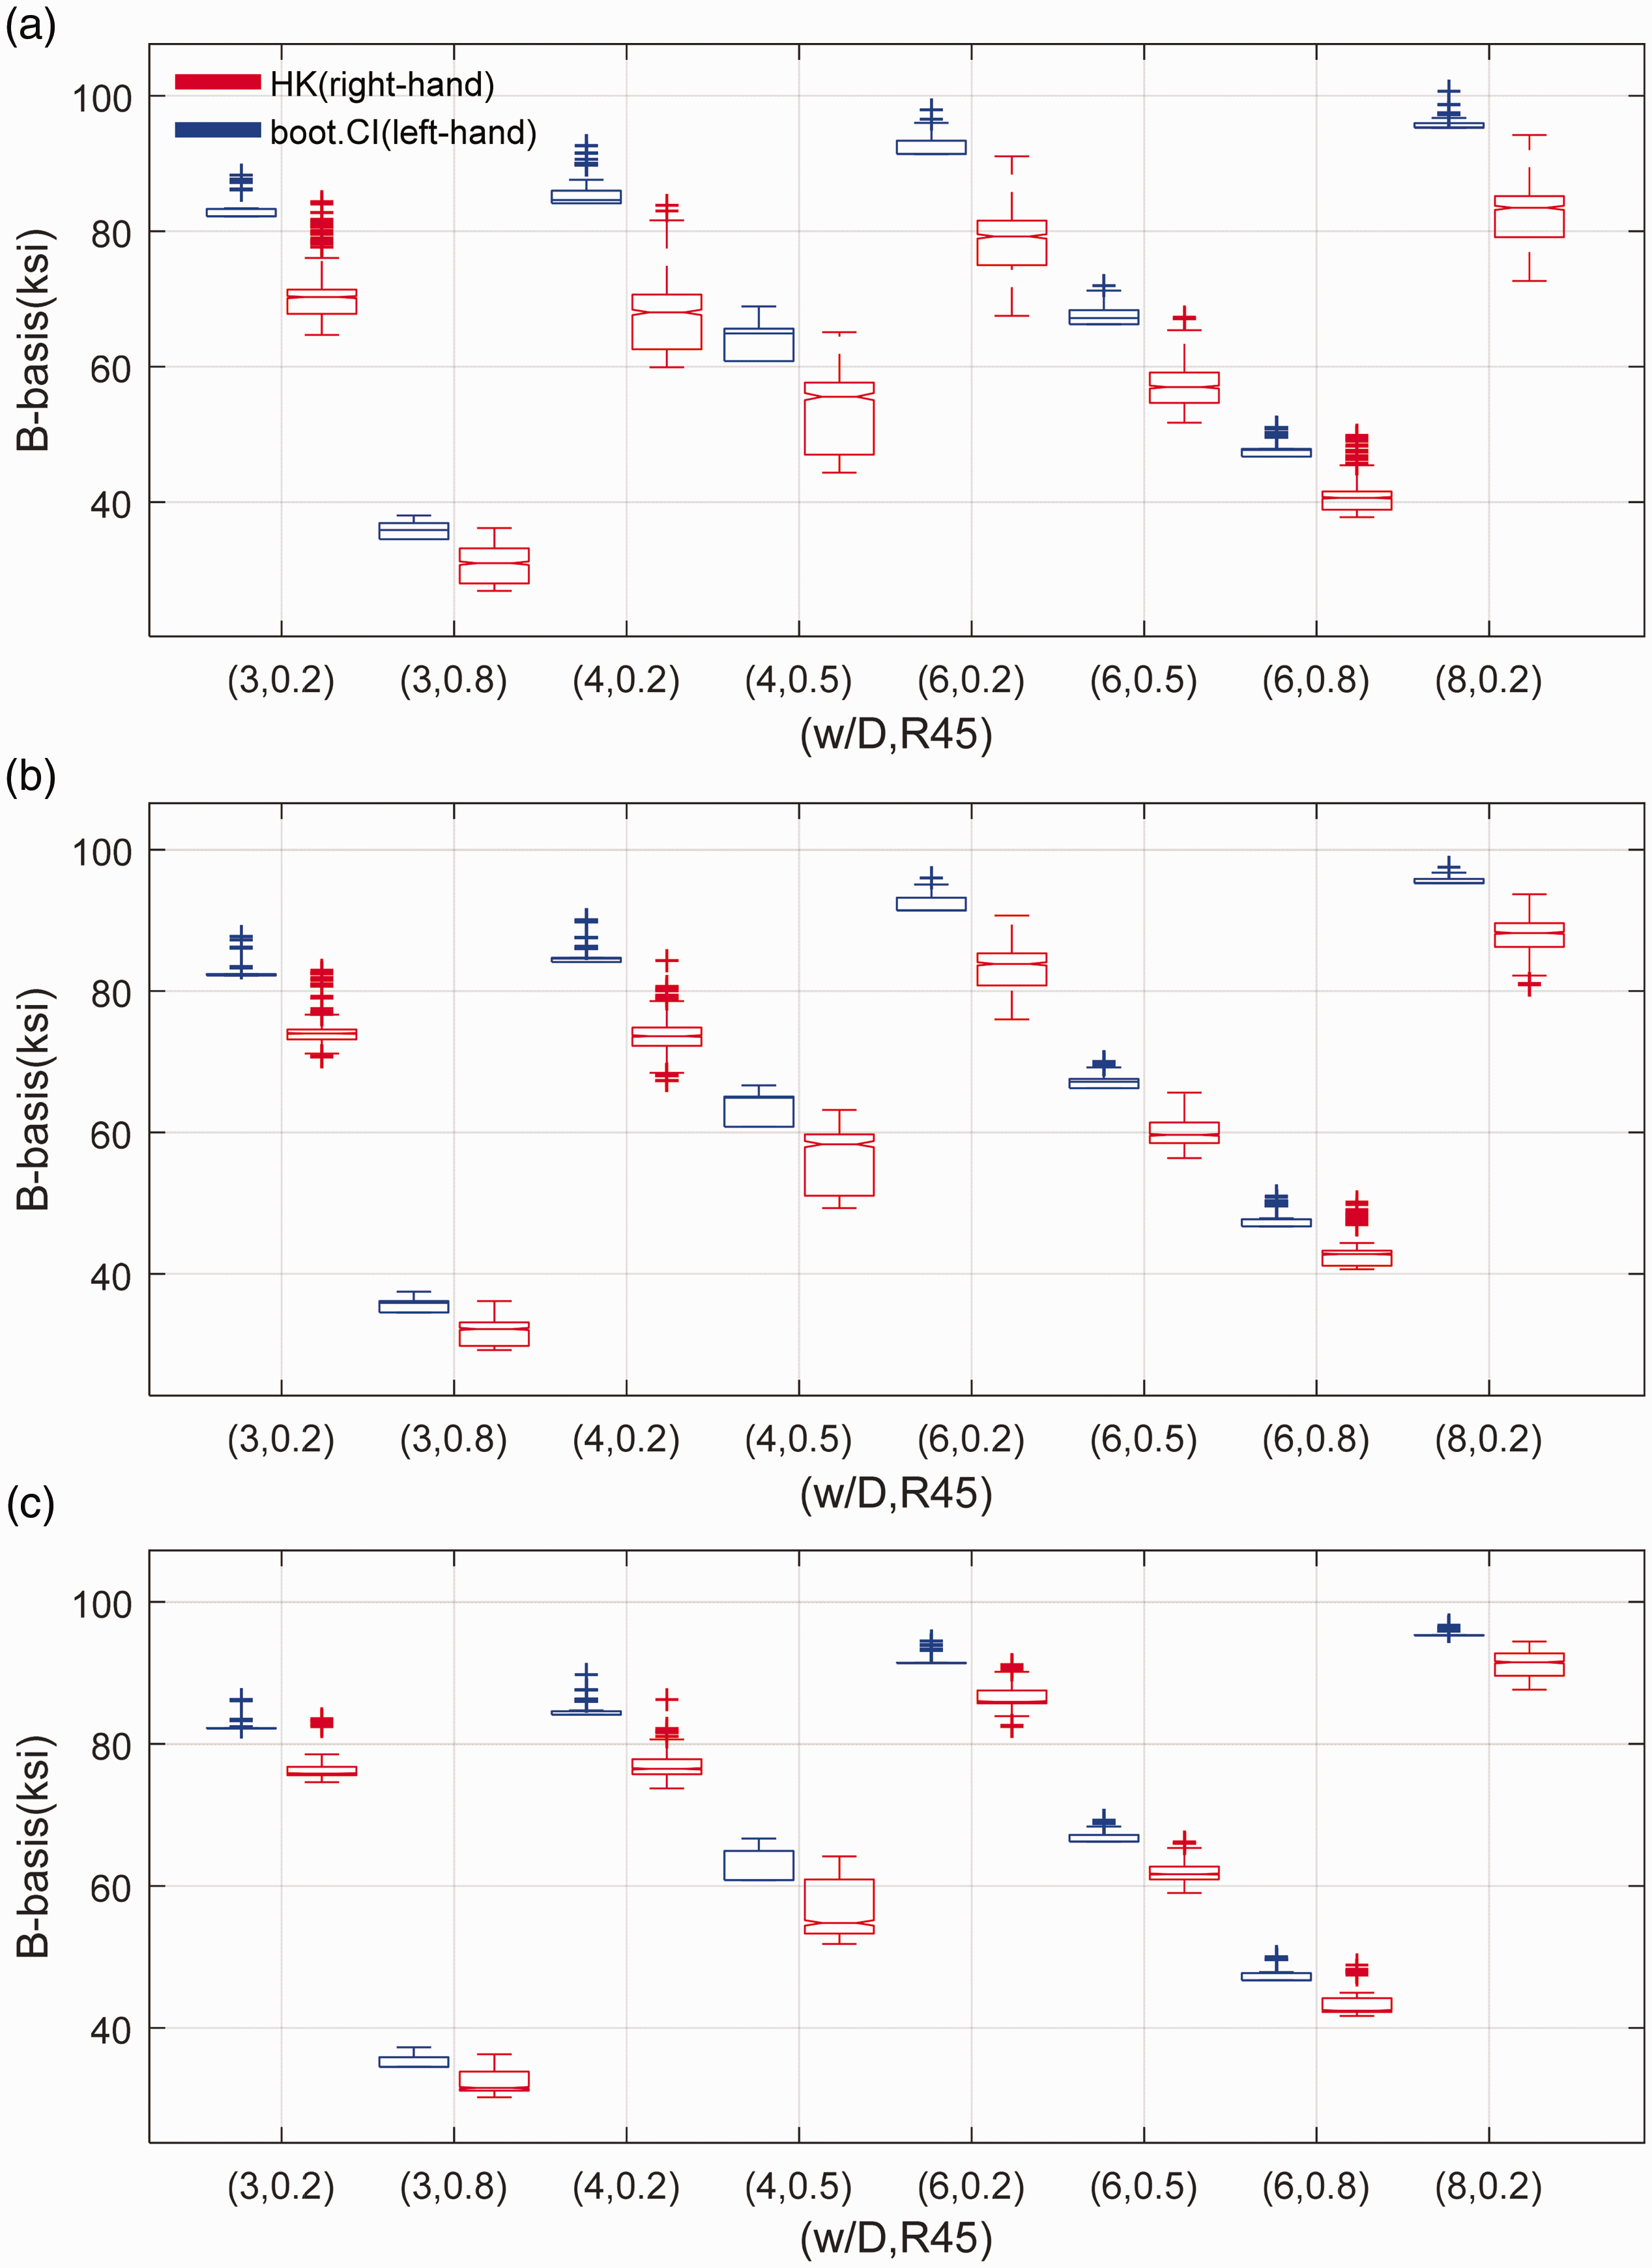

Normalized mean values of the B-basis estimations from 1000 sets of the resampled dataset.
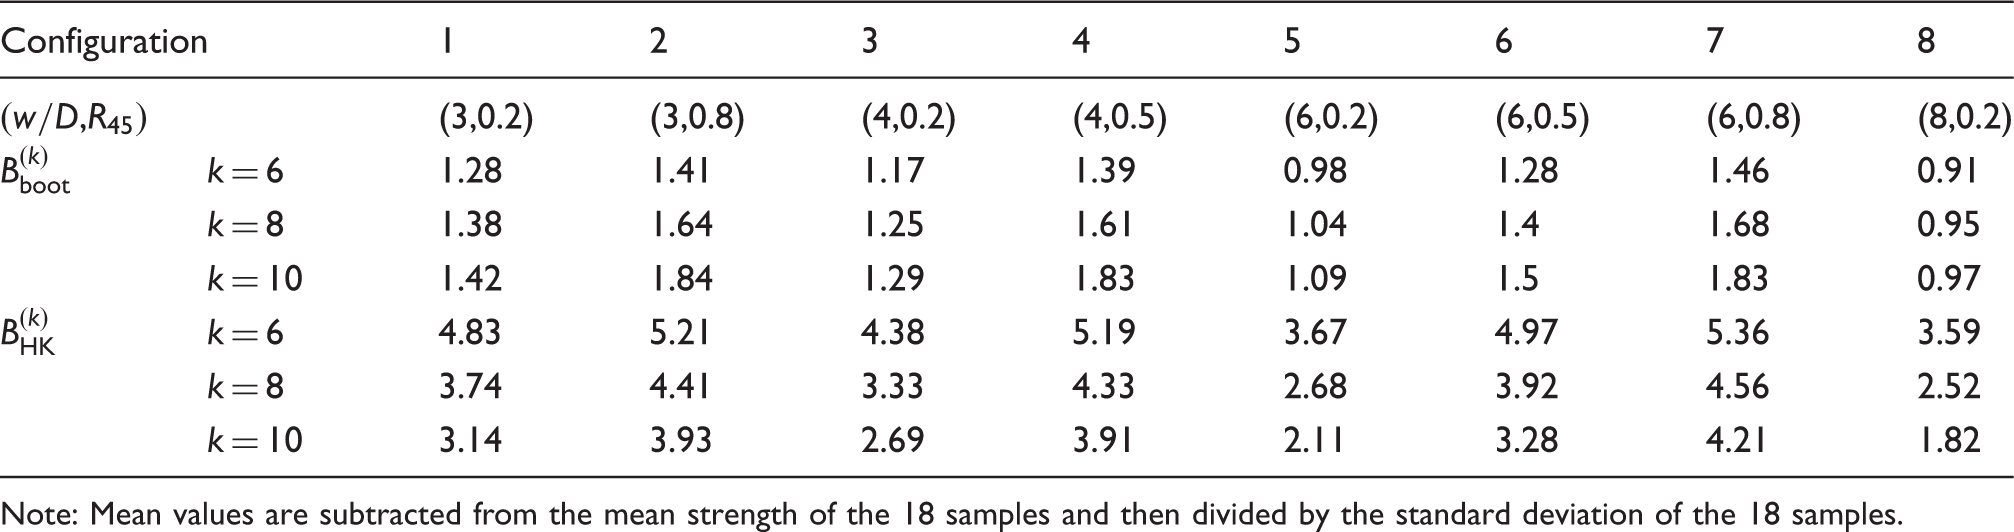
Note: Mean values are subtracted from the mean strength of the 18 samples and then divided by the standard deviation of the 18 samples.
The tradeoff between WPF and CF for the estimated B-basis allowables was examined next. The means of WPF and CF from the 1000 sets of resamples are visualized in Figure 6. It is noticeable that for Weigh penalty factor versus conservativeness fraction from the 1000 sets of resamples. Each set of selected data has 6,8, or 10 samples. 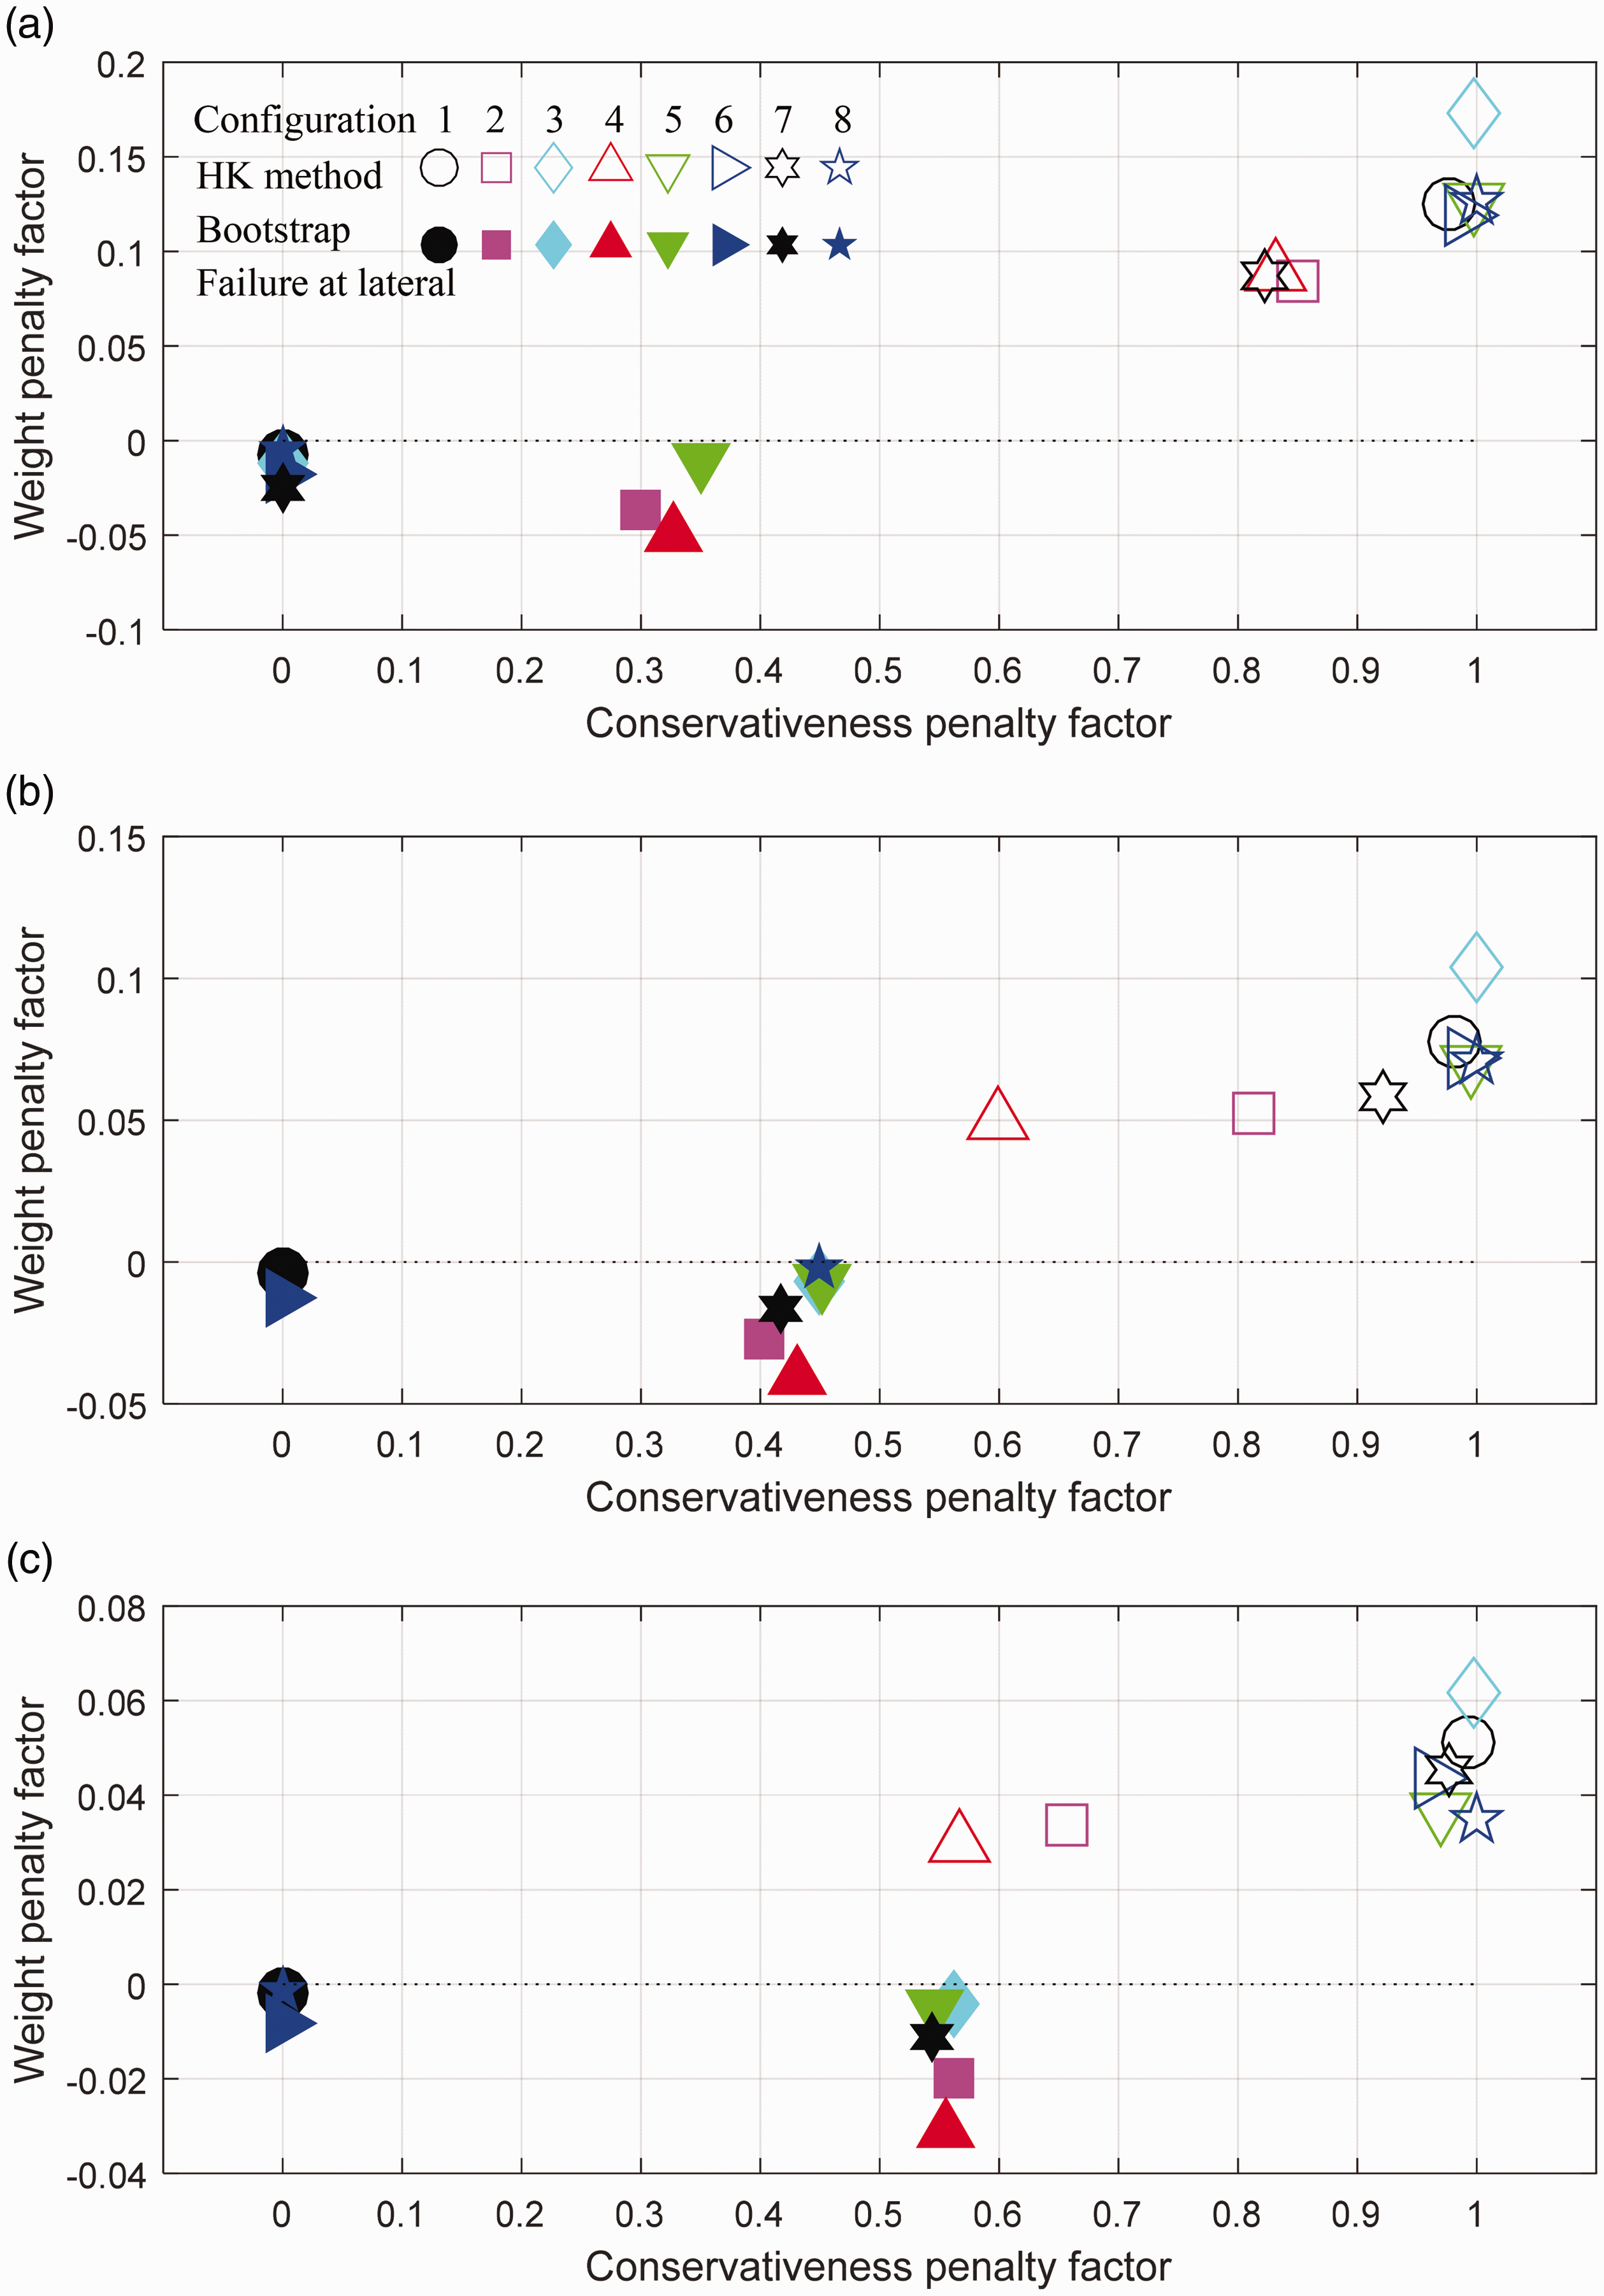
Empirical cumulative distribution of the estimated B-basis allowables using Hanson-Koopmans method: (a) at configuration 2 and (b) at configuration 4.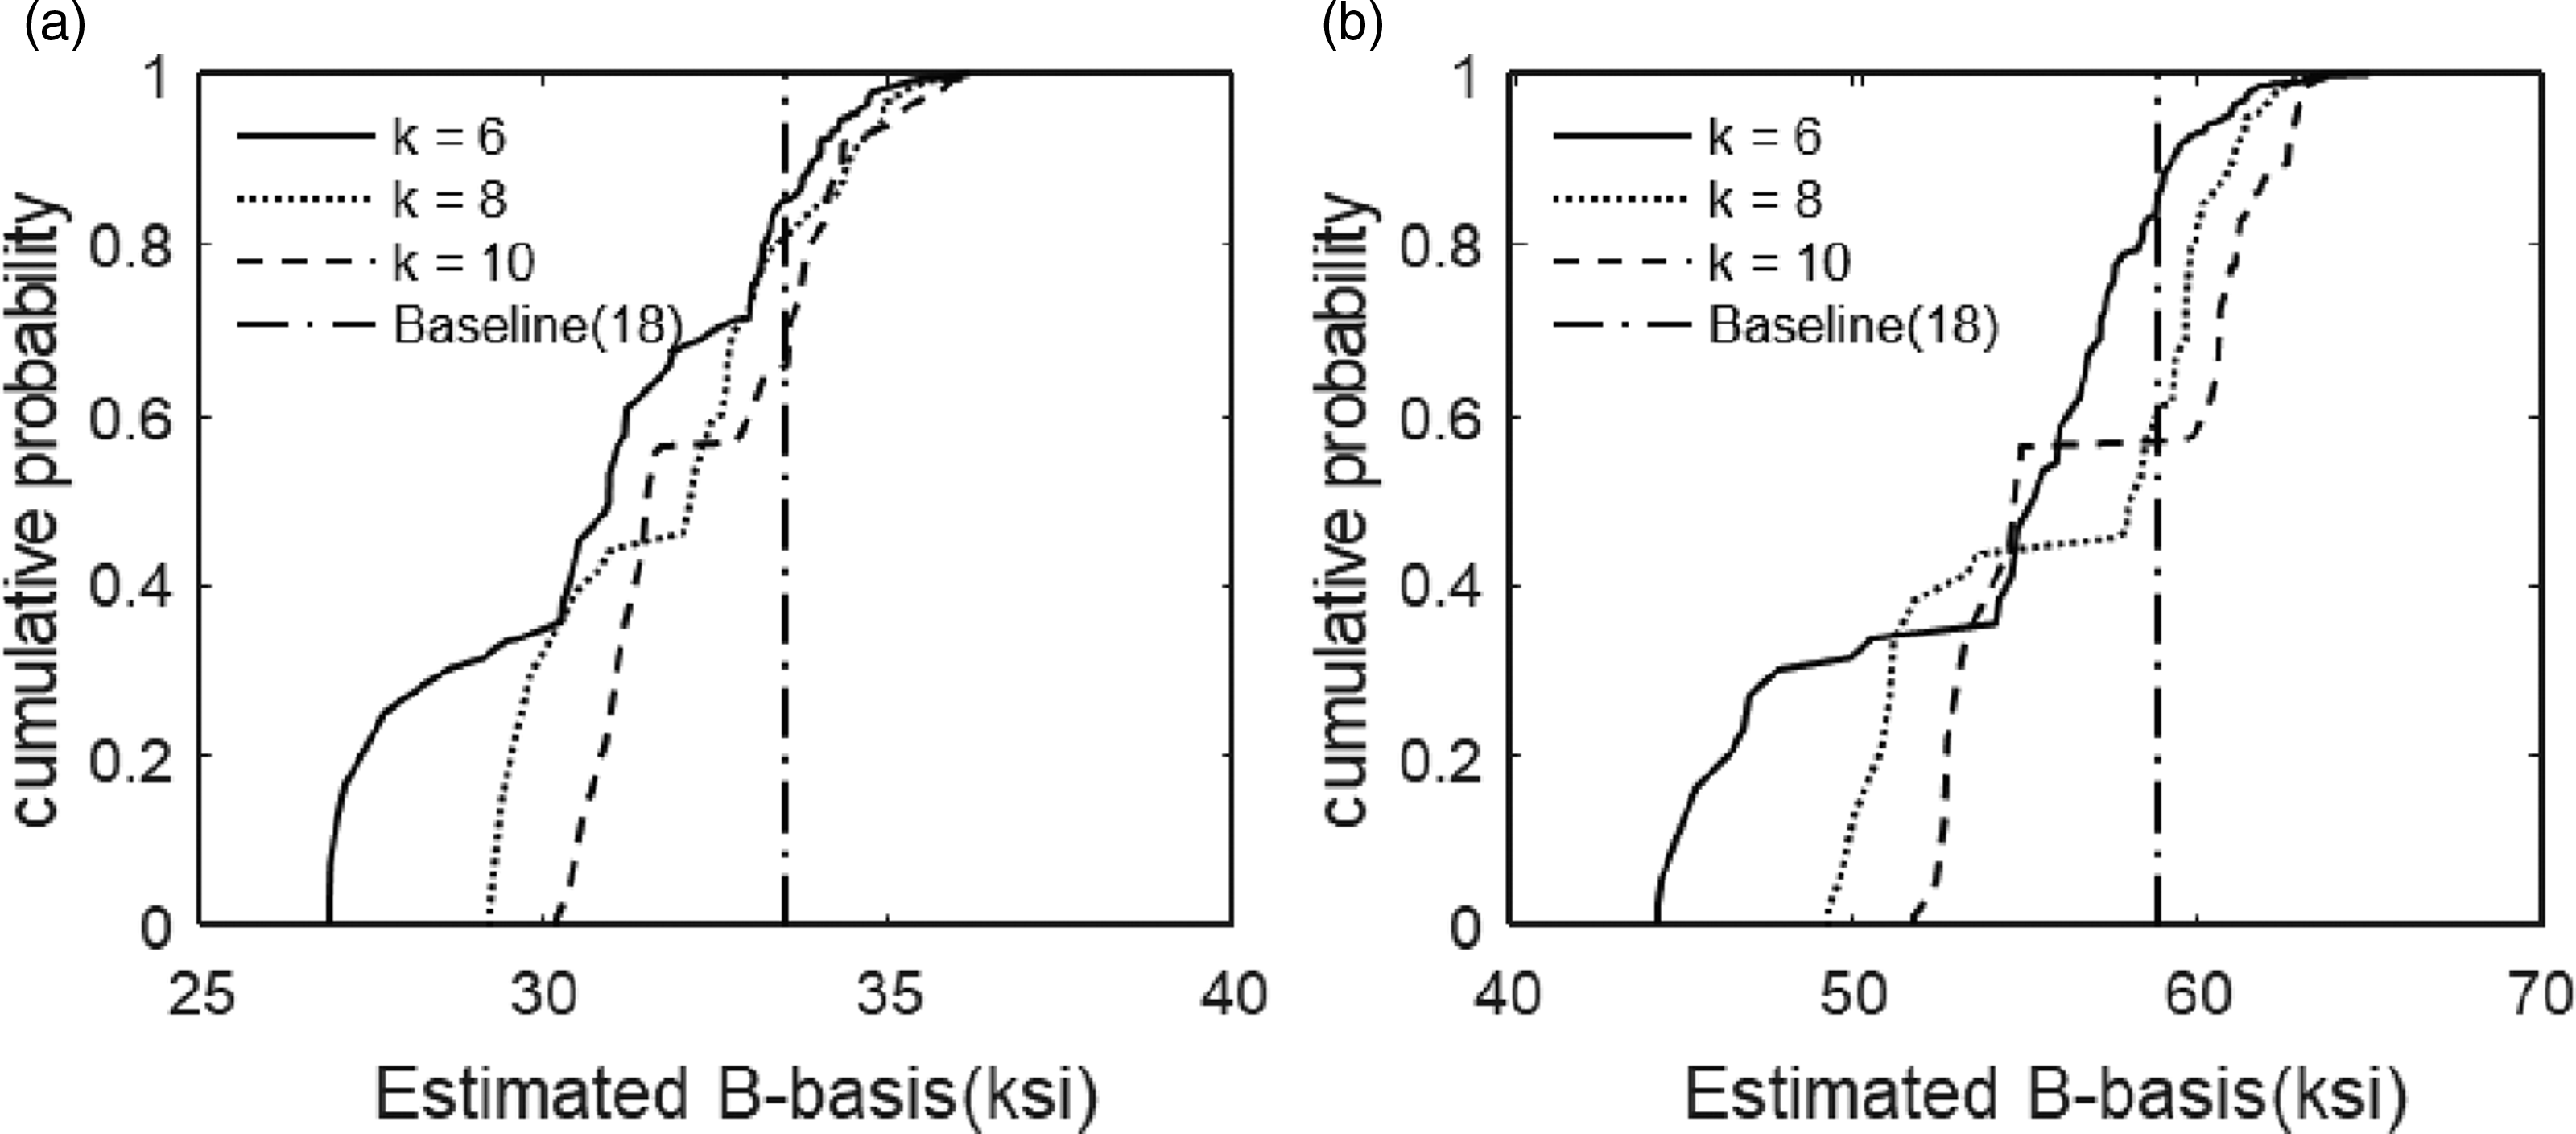
A further study is performed to investigate the trend of decreasing CF with an increasing number of samples for Plot of an exponential function with a 0.9 base.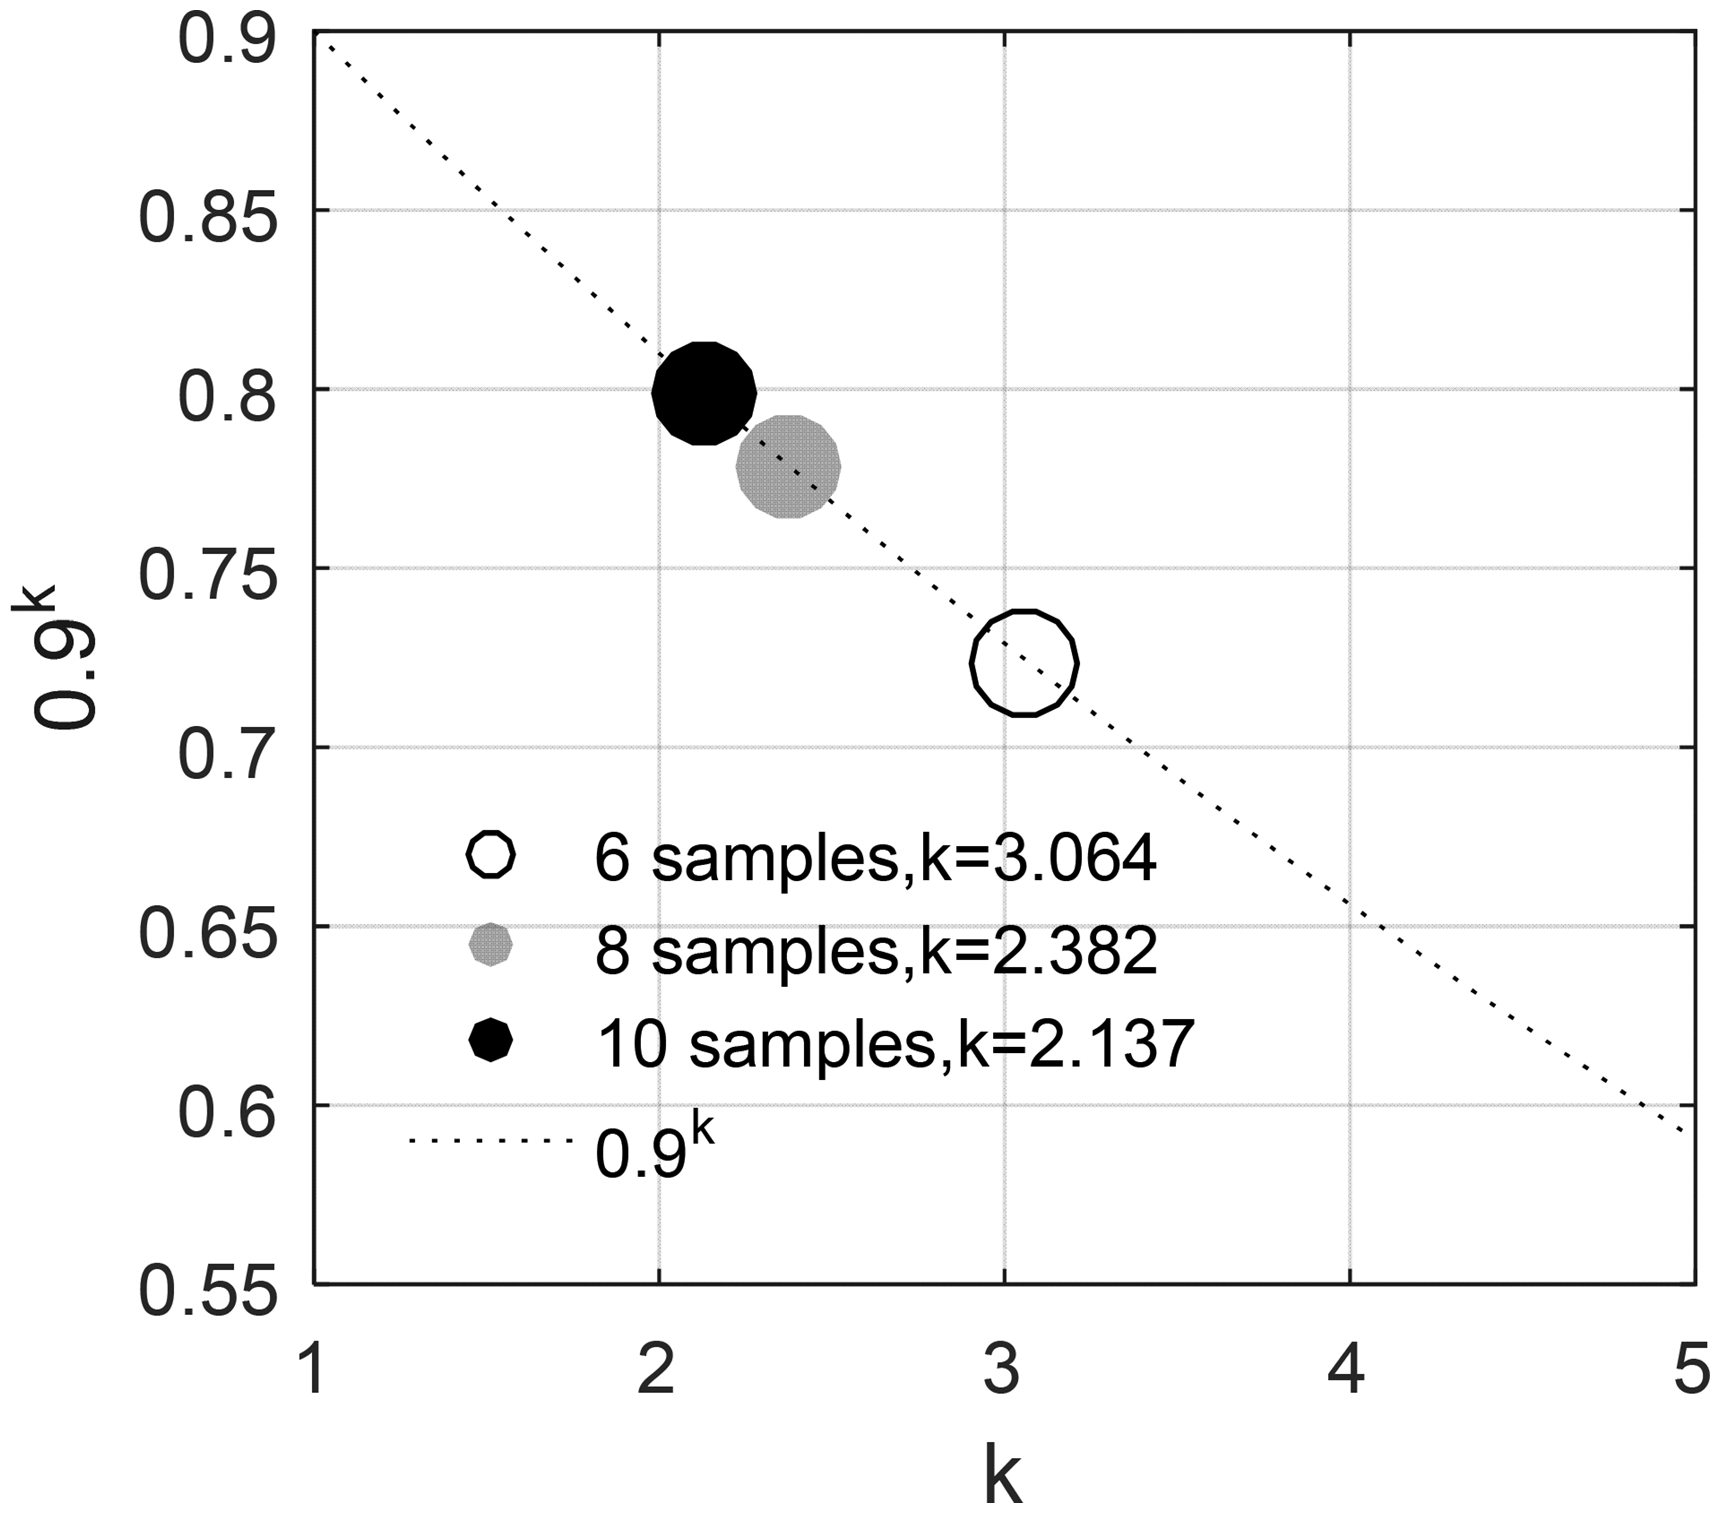
Bootstrap-assisted HK method for small-size samples
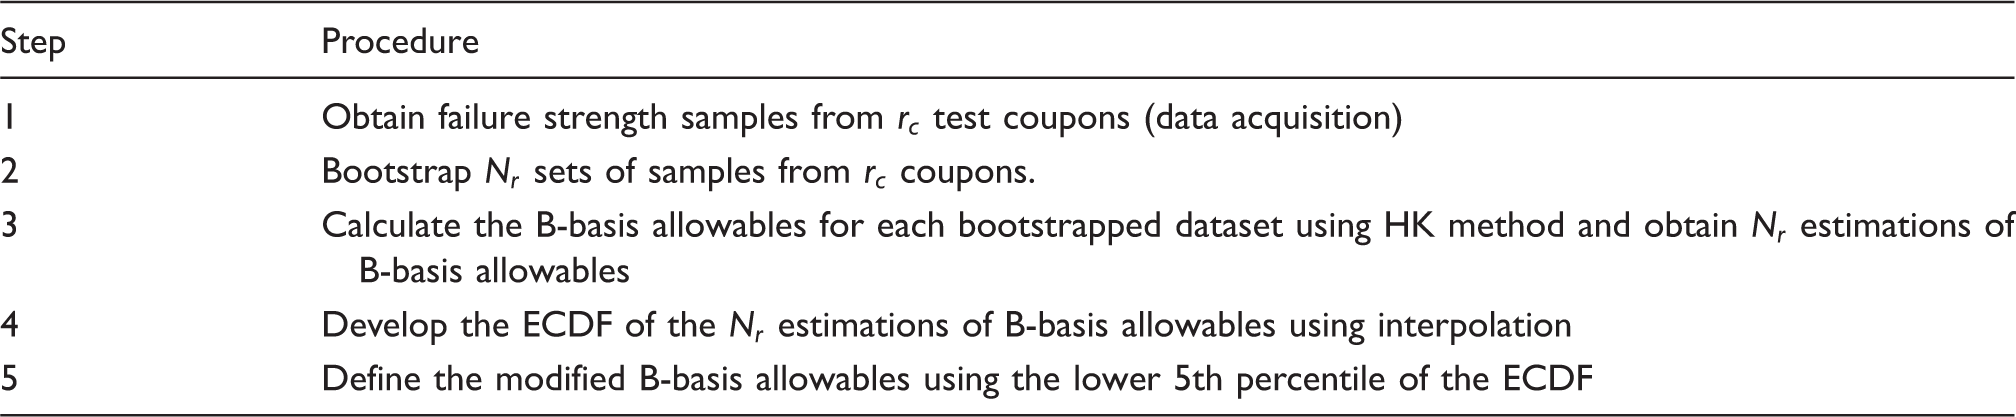
Bootstrap-assisted HK Method
The
Flowchart for the Bootstrap-assisted Hanson-Koopmans method from replicates.
B-basis allowables of OHT tests using the bootstrap-assisted HK method
Weight penalty factor versus conservativeness penalty factor from the 1000 sets of replicates. Each set of selected data has 6,8, or 10 replicates. 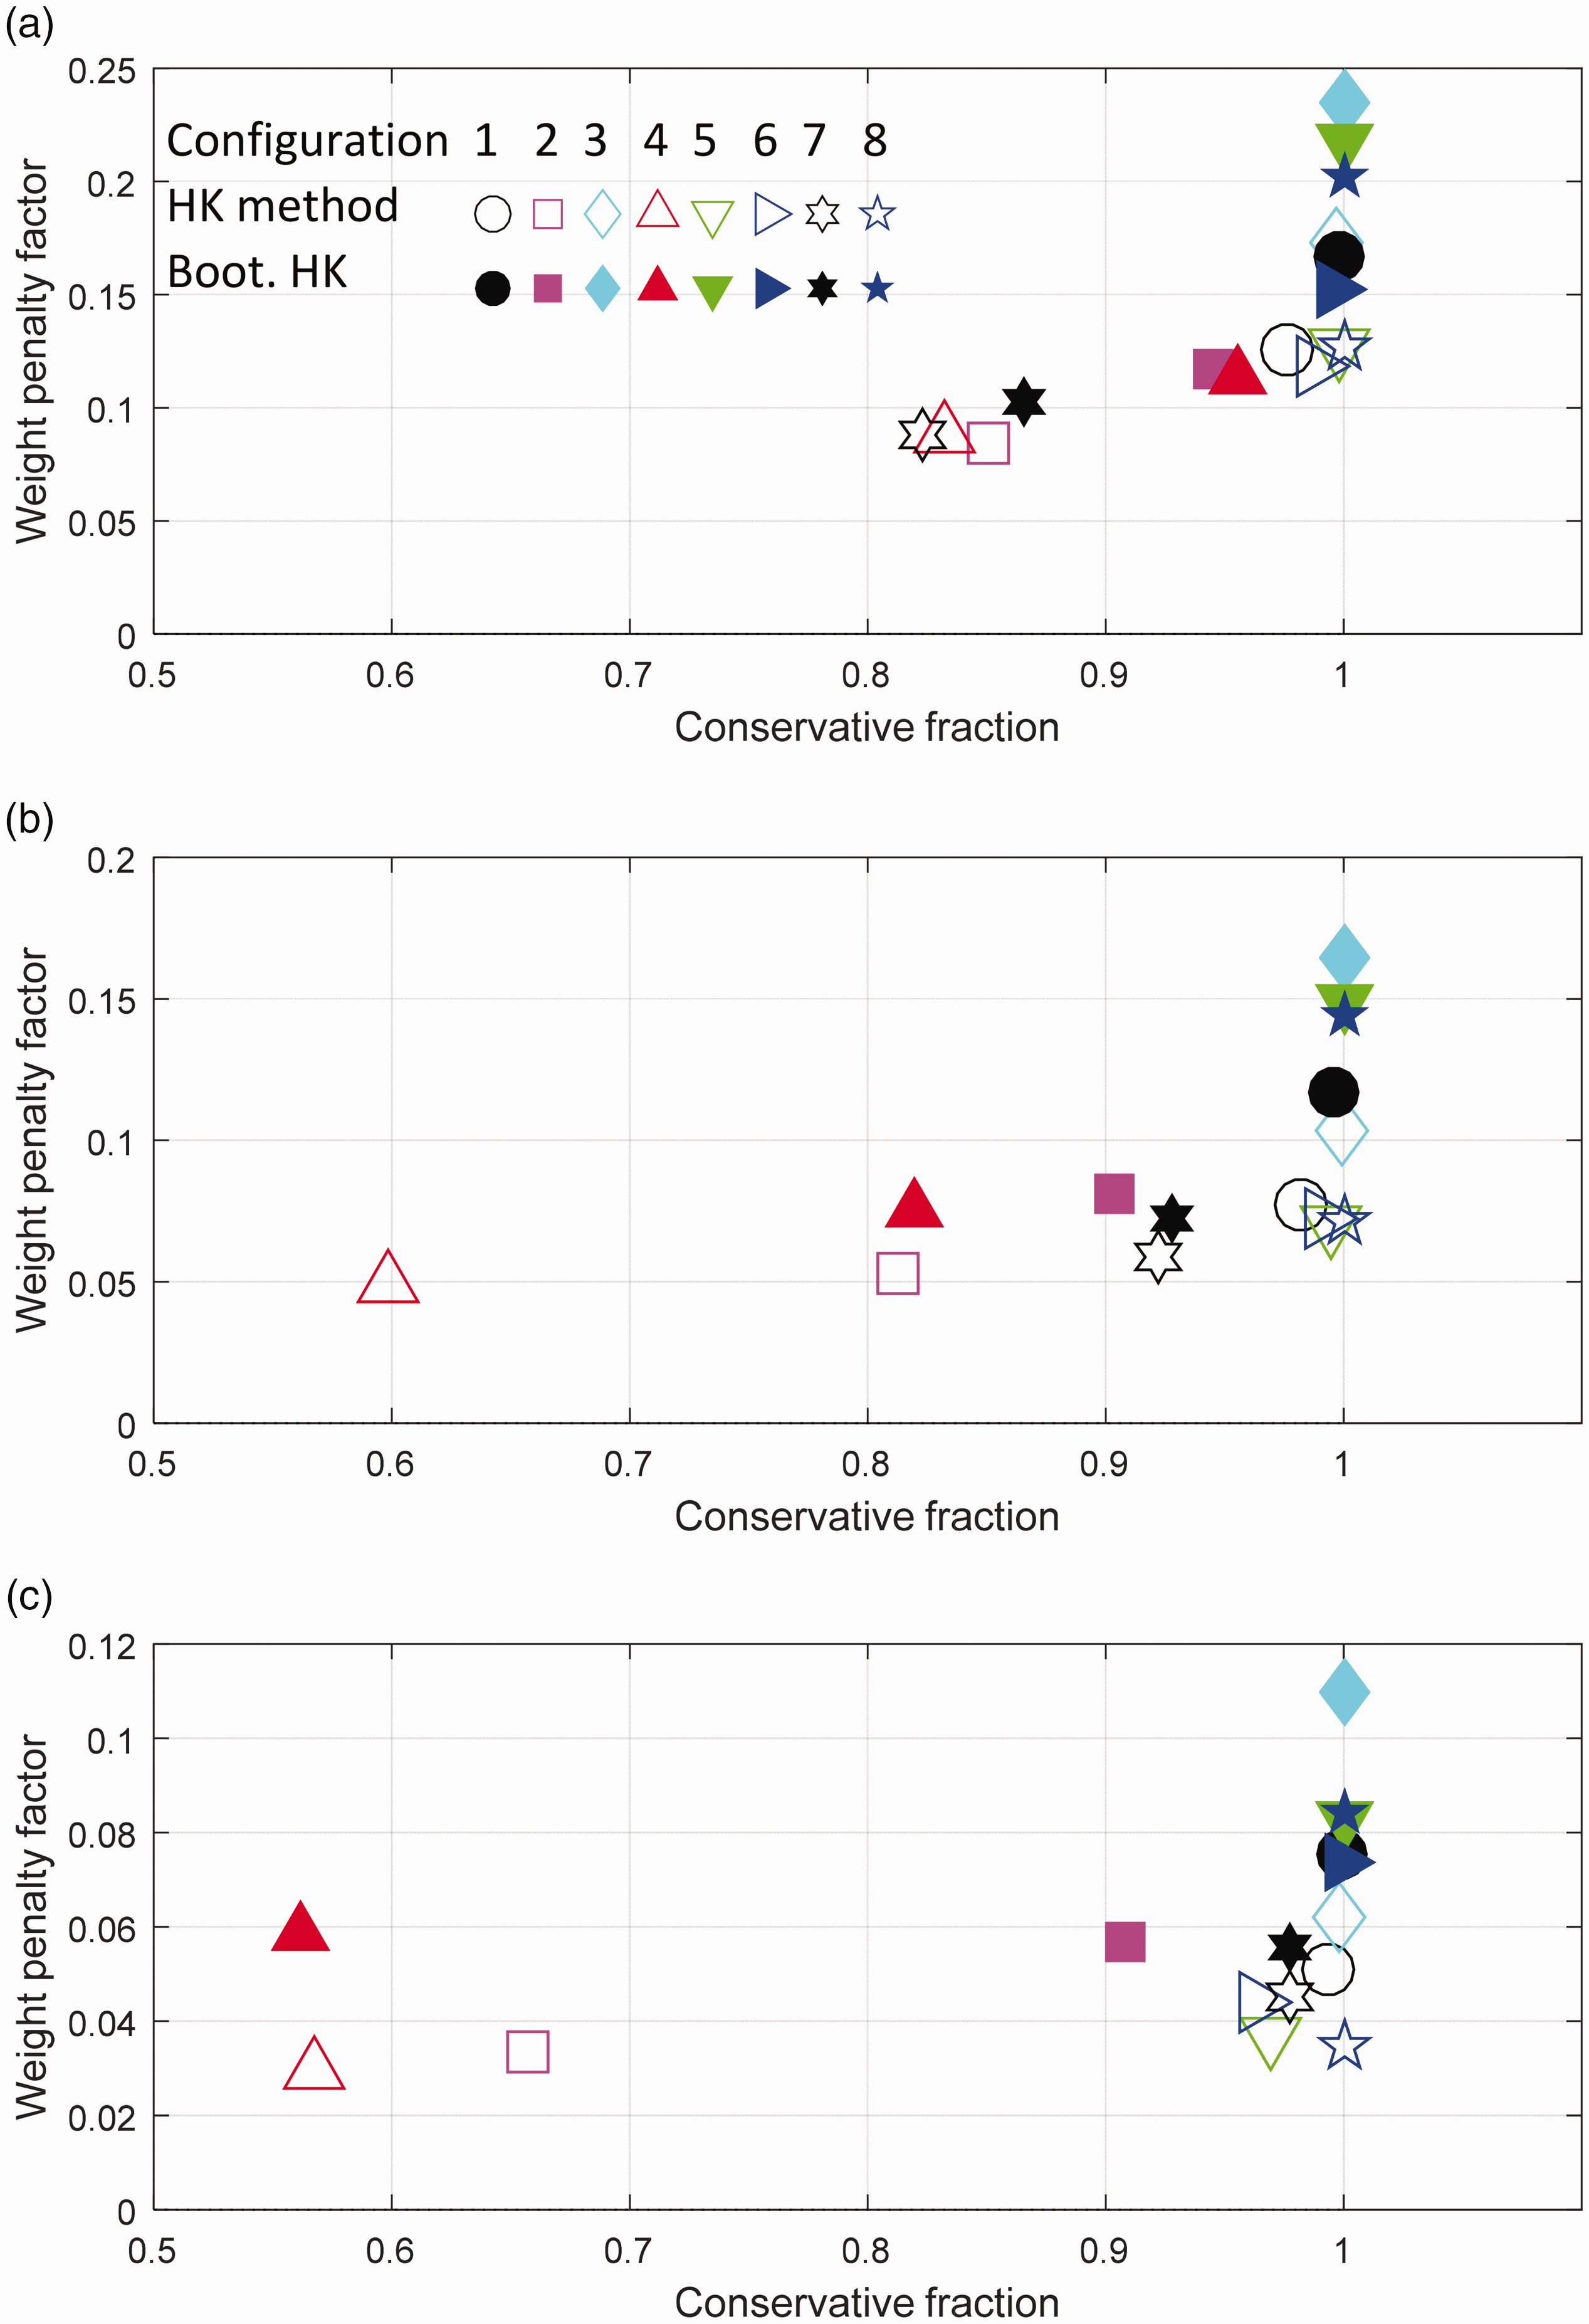
The Empirical cumulative distribution of the estimated B-basis allowables at the configuration 2 (a) to (c) and configuration 4 (d) to (f). (a) Configuration 2 with k = 6, (b) Configuration 2 with k = 8, (c) Configuration 2 with k = 10, (d) Configuration 4 with k = 6, (e) Configuration 4 with k = 8 and (f) Configuration 4 with k = 10.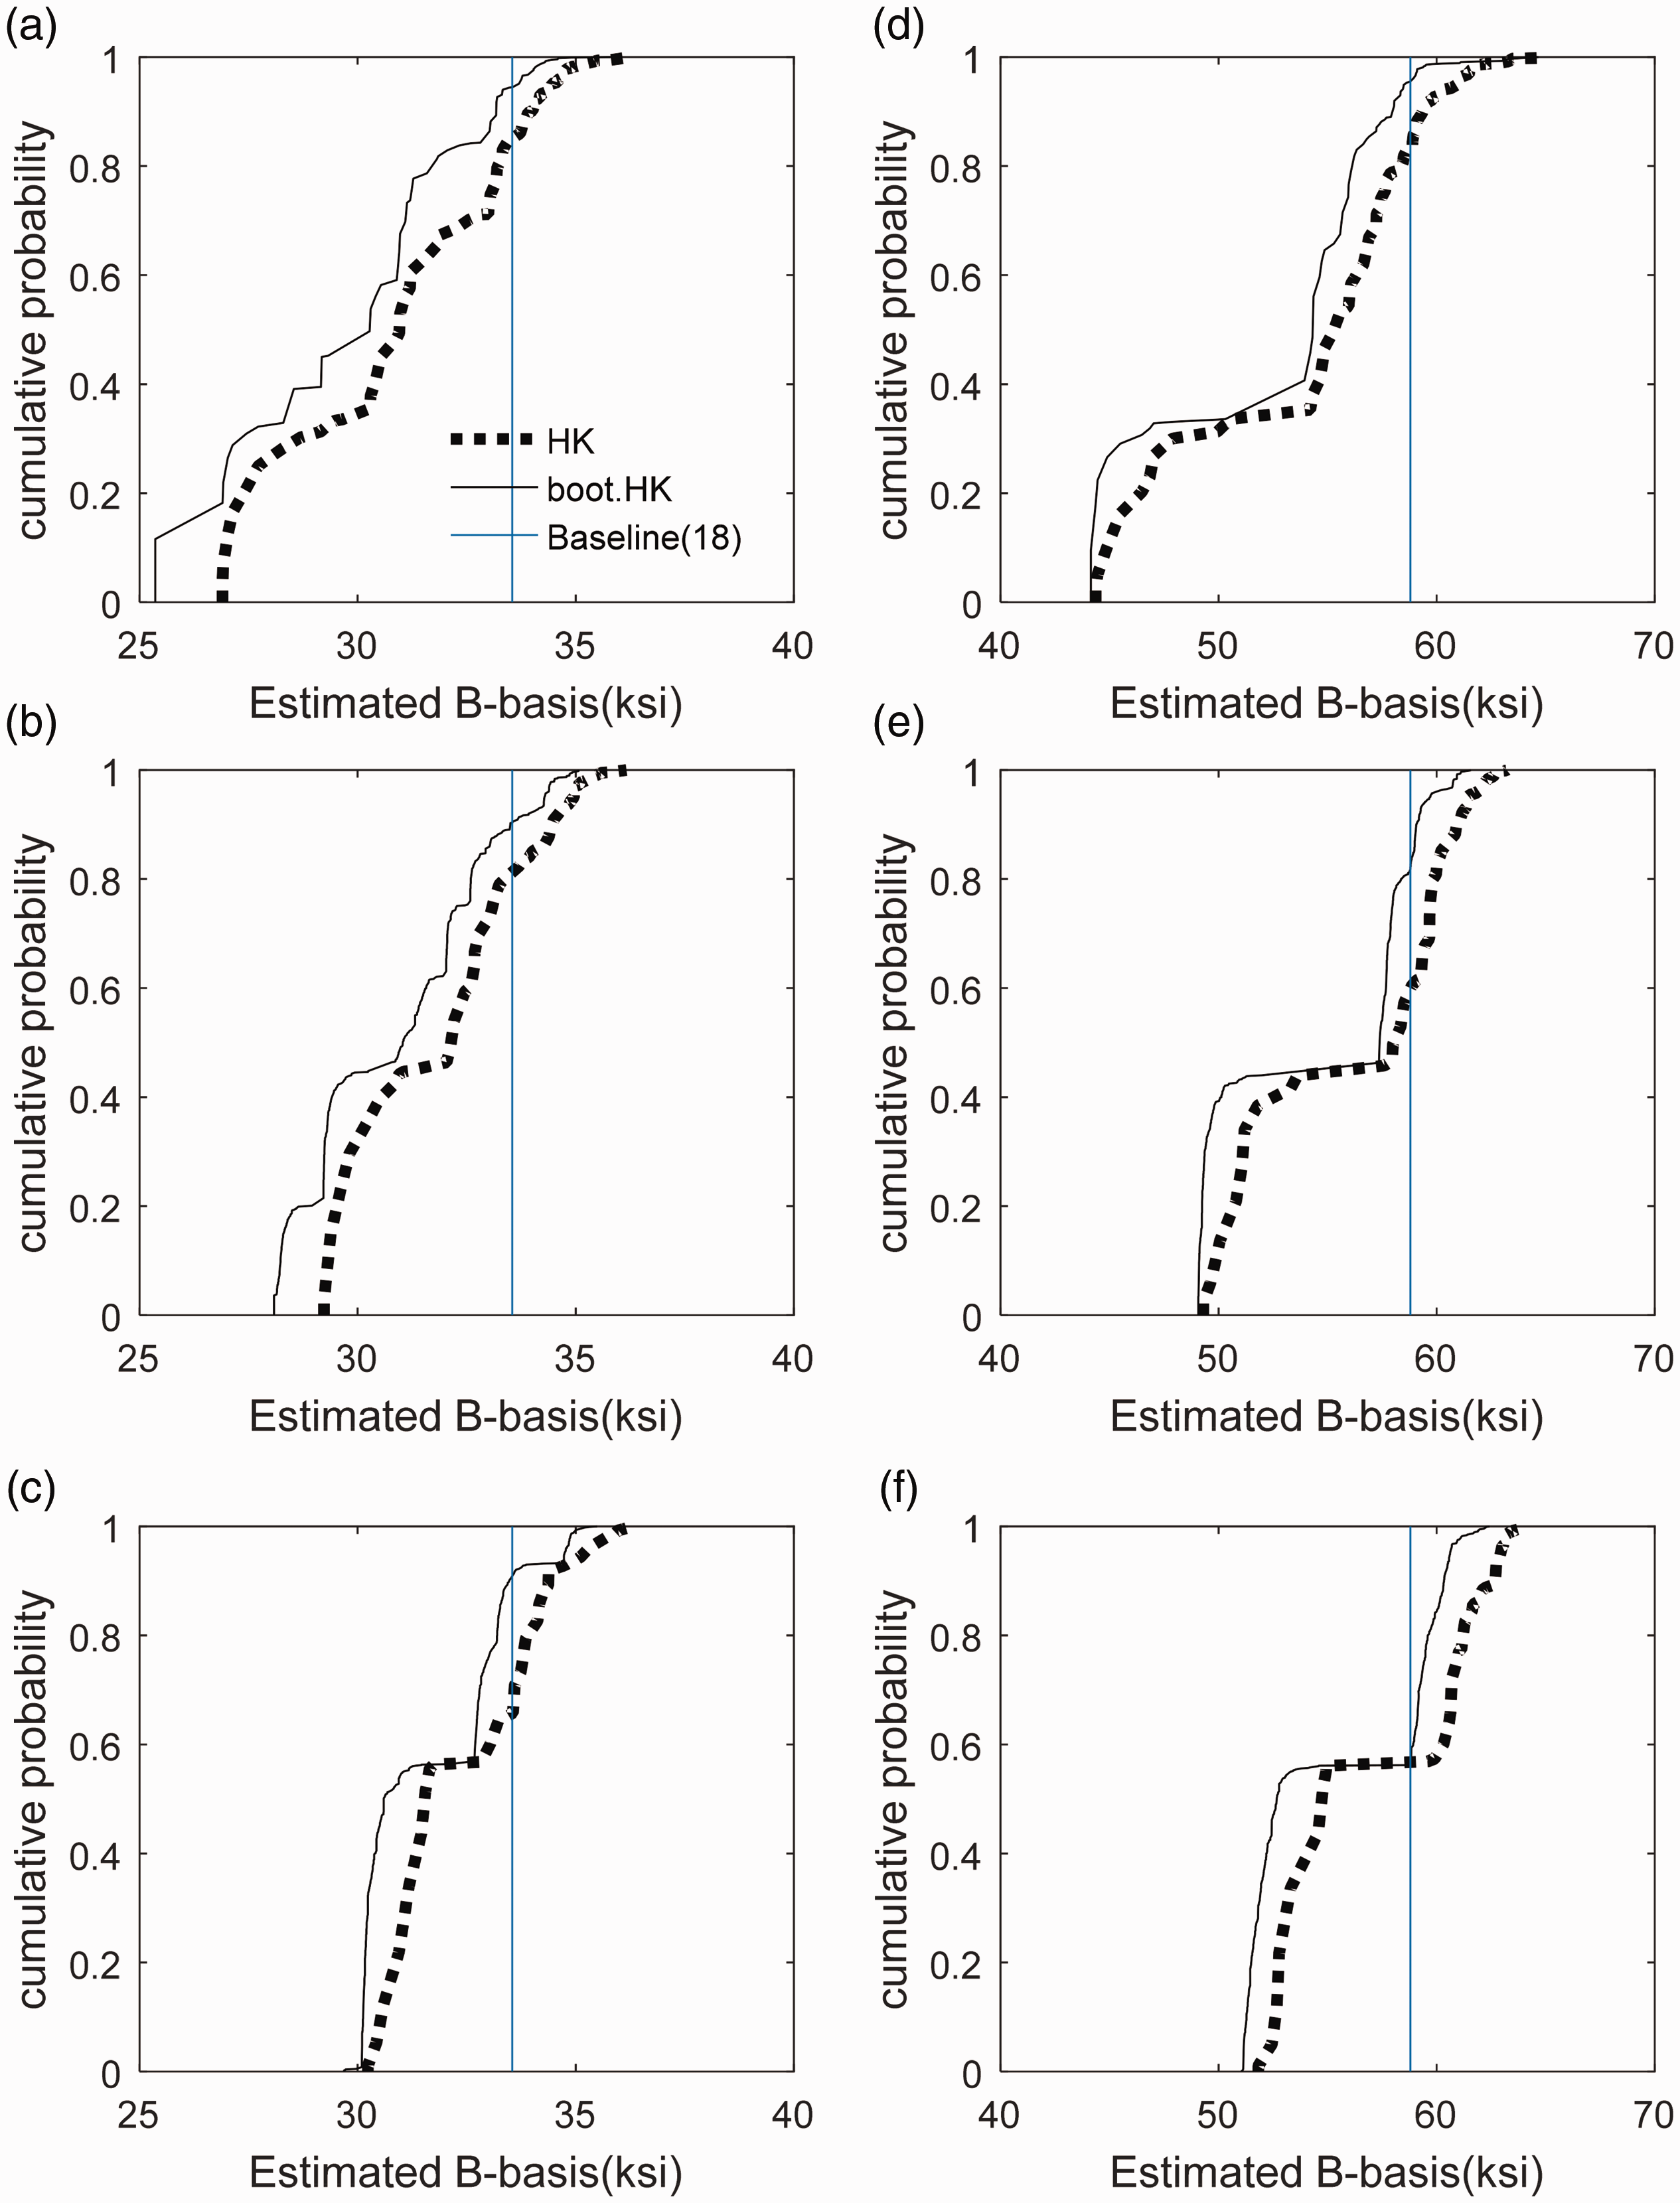
Conclusions
Composite materials have been routinely used in load-bearing structures due to their outstanding capability to be tailored to specific load paths and conditions, resulting in weight efficient designs. Reliable stress limits, called design allowables, are of critical interest to designers to balance safety, performance, and economic value. The properties of composite laminates usually suffer from significant variation due to the complexity and inherent variability of the manufacturing process. Estimating the design allowables is challenging because of complicated failure mechanisms and the limited number of samples.
This paper examines the estimation of B-basis allowables from a limited number of samples demonstrated in OHT strength testing experiments. The conservativeness and weight penalty (margin of B-basis allowables) are evaluated for the bootstrap confidence interval
Based on the study, it was observed that
Footnotes
Acknowledgements
OHT test data were furnished by National Institute for Aviation Research (NIAR) at the Wichita State University.
Declaration of Conflicting Interests
The author(s) declared no potential conflicts of interest with respect to the research, authorship, and/or publication of this article.
Funding
The author(s) disclosed receipt of the following financial support for the research, authorship, and/or publication of this article: This research was supported by DARPA contract W911QX-13-C-0137.