
Abstract
In the present study, the creep behavior of polyetherimide semipreg and epoxy prepreg composites was studied using dynamic mechanical analyzer and focused on structure vs. property relationships in glassy, glass transition, and elastomeric regions. The main contribution to the field is to study pre-impregnated materials concerning creep behavior, mainly based on different analytical models, and microstructure. Two different reinforcements were used (carbon fiber and glass fiber) for each matrix. Findley, Burger, and Weibull analytical models were applied with an excellent fit for the most of them. The impregnation quality, verified by C-scan and the void content by acid digestion, shows different impregnation behaviors, mainly for epoxy/CF, which also influenced molecular motion behavior. The creep behavior was mainly influenced by matrix type than reinforcement architecture and void content. In addition, the creep was higher for epoxy in the glassy region; however, in the glass transition region, higher deformation was found for polyetherimide composites. Previous behavior is mainly attributed to higher energy storage in the glassy region which plays a significant role in the dissipation (glass transition energy), resulting in the energy loss or the drop of storage modulus in a narrow temperature range – more abrupt. This behavior was corroborated by time-temperature superposition curves in which the low deformation obtained for polyetherimide composites at low temperatures is maintained only until the glass transition temperature. Epoxy composites showed a higher initial creep deformation, but the values were almost constant with temperature, even when the temperature passes by the glass transition temperature.
Introduction
The necessity of the aerospace industry to enhance the performance of commercial and military aircraft is constantly driving the development of improved high-performance structural materials. Inside of this context, prepregs (for thermoset matrix) and semipreg (for thermoplastic matrix) have become accepted where performance, material qualification, and product consistency are requirements for several fields such as aerospace, marine, defense, offshore, and renewable energy sectors. 1
Pre-impregnated composite fibers are mainly used in primary and secondary aircraft components and aerospace industry as military jets, helicopters, and space satellites. Some advantages include reduction of the risk of poor impregnation quality, process optimization by using an intermediary product before the process, and the correct amount of each constituent material is already present and interacting, low thermal expansion, among others.2,3 Semipreg is a particular type of prepregs in which only a portion of the fiber arrangement is impregnated with resin (the other one is maintained in a dry state). 4 The dry regions allow a pathway for entrapped air to escape from the laminate leading to lower porosities in the final composite.
Due to their viscoelastic nature, long-term dimensional stability and mechanical resistance have to be considered, mainly in primary structural applications. The knowledge of the macroscopic properties of polymers is better understood on the comprehension of the microscopic behavior since relaxation times due to molecular mobility phenomena are dependent on temperature. 5 These processes are attributed to short-term diffusion of some segments of the molecular chain (microBrownian movement) and are limited by chain rigidity or restrictions imposed by the reinforcement. 5 The evaluation of viscoelastic and creep properties allows predicting the material deformation in the function of time when subjected to a stress load and temperature. Dynamic mechanical analyzer (DMA) allows a low-stress load due to the sensibility of the equipment, generating a more precise response concerning the microstructure of the material. The characterization of the creep behavior of the composites could be performed with different analytical models.1,5
Some studies of the group were performed about the creep behavior of composite materials.6,7 Each composite system presented particular characteristics that were dependent on the composite characteristics. For example, Almeida et al. 6 studied the creep behavior of different angle plies using Findley and Burger’s models, and the main results showed that a larger difference in fitting was observed at higher temperature and as the angle ply increased, Burger’s model adjusted as well as Findley’s. Some studies about creep resistance in long-term periods can also be found in the literature. Du et al. 8 studied the creep behavior of a lightweight natural fiber-reinforced polymer composite/honeycomb sandwich panels in 720 h, c.a. one month. The creep properties were evaluated in ambient conditions and at 65% relative humidity. The main results showed that the higher humidity leads to an acceleration of creep strain, and a linear viscoelastic property was observed when the stress level was less than 30% of their failure stress. Yang et al. 9 studied the tensile creep behavior of polyamide nanocomposites using higher load stress, where the activation energy volume could be calculated. Hence, any composite material presents distinct characteristics, depending on matrix nature and reinforcement type/architecture. Creep tests at room temperature can be extended by months or years to be finalized, making it impracticable and making it necessary to extrapolate the results from short-term data. One of the most used methods is the time-temperature superposition (TTS) in which it considers that higher temperatures are equivalent to short times and vice versa. The main advantage of the technique is to reduce costs with high reliability of the results obtained. 10 In literature, some studies were found related to it.11–15 Although many studies were evaluated in relation to creep behavior, there is notice in literature to creep behavior in pre-impregnated materials. Hence, the main contribution to the field is to study pre-impregnated materials concerning creep behavior, mainly based on different analytical models, and microstructure. The type of pre-impregnated materials also was studied. A partial and a total impregnated reinforcement with resin and the influence on the void, dynamic mechanical and creep behavior was deeply studied.
Analytical section
Creep response can be analyzed by analytical functions in which microstructural changes are considered. All models are curve fitting but are related with different properties. Basically, Findley quantitatively measures the deformation over time; Burger divides the curve in elastic, viscous and viscoelastic components and the respective contribution of each one in the creep behavior. Fancey represents the amount of mechanical elements which fails at a determined time, and finally TTS gives notion of the creep behavior in times not accessed experimentally. Findley’s
16
is one of the most used models, and it is based on an empirical model formerly developed for metals, as described in equation (1).

Burger’s or four-parameter model
17
is based on a Maxwell with Kelvin-Voigt models combination (equations (2) and (3)). The total stress is divided into three distinct parts: instantaneous elastic deformation (


Fancey
18
developed an analog mechanical model in which the action of time-dependent latch elements describes the viscoelastic response. The model represents viscoelastic changes occurring though incremental jumps as opposed to continuous motion. The “failure” of discrete elements is represented by a Weibull-based equation (equation (4)).

The evolution of the relaxation process in function of the time can be investigated based on Williams-Landel-Ferry (WLF). The WLF equation is given by equation (5).

Experimental
Materials
Two different thermoset prepregs and two different thermoplastic semipregs were studied in this work: (i) epoxy/carbon fiber (named Epoxy/CF), (ii) epoxy/glass fiber (named Epoxy/GF), (iii) polyetherimide (PEI)/carbon fiber (named PEI/CF), and (iv) polyetherimide (PEI)/glass fiber (named PEI/GF). The semipregs PEI/carbon fiber and PEI/glass fiber were processed and donated by Toray Advanced Composites. For semipregs, both carbon and glass reinforcement were Harness-Satin (5 HS) configuration and final thickness of 1.92 mm. Epoxy/carbon fiber and epoxy/glass fiber were processed at UNESP (Guaratinguetá, Brazil) through hot compression molding with 0.44 MPa pressure and using two different curing temperatures: 180℃ for epoxy/carbon fiber and 150℃ for epoxy/glass fiber. For prepregs, both reinforcements were plain weave style and final thickness width of 1.90 mm.
Specimens studied and their characteristics.
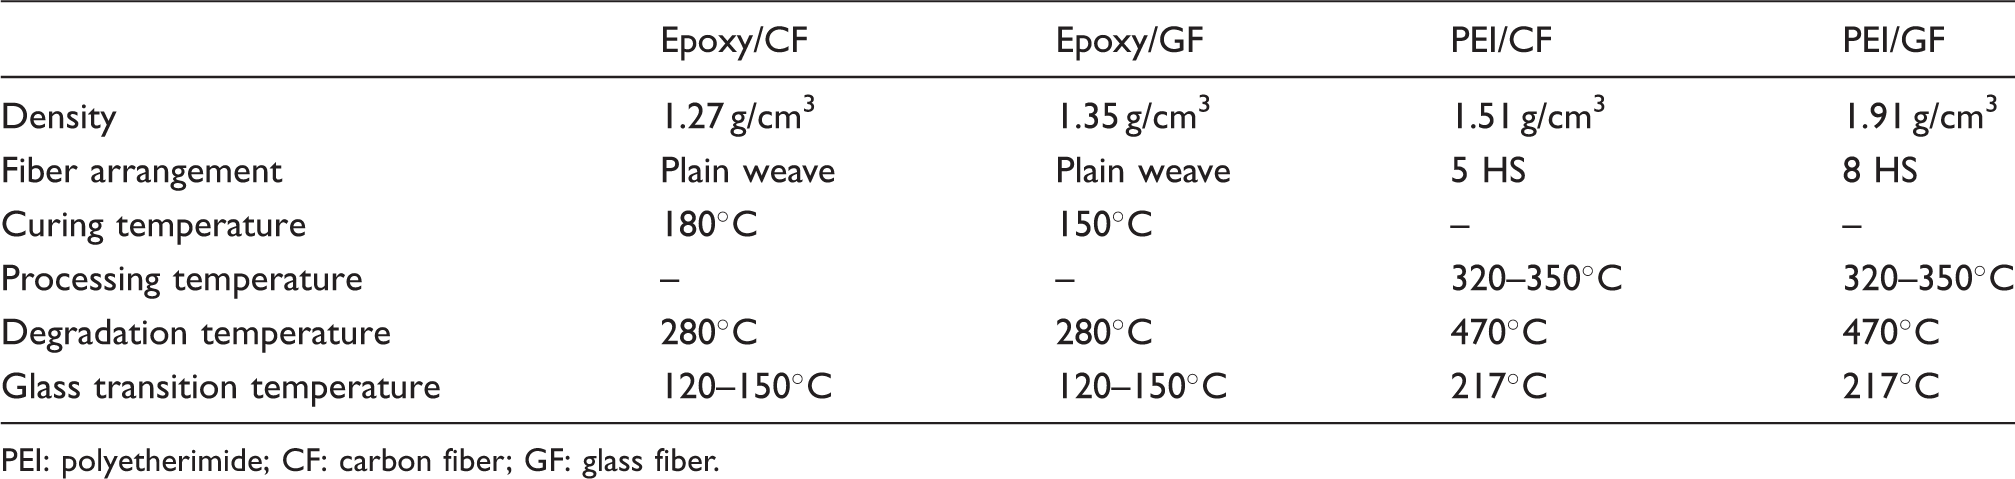
PEI: polyetherimide; CF: carbon fiber; GF: glass fiber.
Composites characterization
Acoustic inspection C-scan microscopy
C-scan characterization was performed, aiming to evaluate eventual defects as internal voids or delaminations from the manufacturing process. C-scan was carried out for all laminate composites using Sonotron NDT equipment, model ISONIC 2006 from Aeronautics Institute of Technology – ITA (São José dos Campos, Brazil). Data were collected using the pulse-eco method with a plane transductor of 10 MHz, and the gain was set to vary from 0 to 60 dB.
Acid digestion procedure
This analysis was performed, aiming to determine the volumetric content of fiber, matrix, and the void of the processed composites. Acid digestion analyses was performed according to ASTM 3171 standard (Proc, B) using a Marconi equipment (UNESP, Brazil). The samples were weighed and submitted to the acid digestion process with sulfuric acid at 190℃ for 2 h. Fibers resulted from the process were removed after to use hydrogen peroxide, and posteriorly washed with distilled water. The resulting fibers were weighed, and the mass was converted in volumetric percentage of the composite by considering the density and mass of each material.
Dynamic mechanical analysis
Aiming to determine the viscoelastic response in temperature function, DMA was performed using a Dynamic Mechanical Analyzer Q800 from TA Instruments. The properties were measured using three-point bending with pre-load of 0.1 N, ω = 1 Hz, and amplitude of 20 µm. The sample dimensions were 10 mm × 35 mm × 2 mm. Two different heating rates (10℃/min and 3℃/min) were used for epoxy matrix 19 composite, while for PEI matrix composite, a heating rate of 3℃/min was used. Epoxy composites were heated and re-heated from 25℃ to 350℃ and PEI composites from 25℃ to 250℃.
Dynamic runs and creep tests were both performed in the same equipment and clamp; 20-min soak was applied to ensure that the specimen reached equilibrium after each temperature for all different procedures. The stress (5 MPa) was applied and held constant for 20 min for subsequent analysis. During the test, strain data were collected, and they were plotted vs. time. For creep TTS, temperatures from 30℃ to 350℃ for epoxy/carbon fiber composite and from 30℃ to 250℃ for PEI composites (from 30℃ to 190℃). All tests mentioned above were performed in steps of 20℃ and involving all three regions of the composites (glassy, glass transition, and rubbery states).
Results and discussion
Impregnation behavior
Resin impregnation quality across laminate was evaluated by C-scan (Figure 1). The color label is in the function of sample width; hence, each color represents the emitted signal returned by a probe. Considering that all laminates have a width between 1.92 mm and 1.96 mm if no porosity is presented, a green color is expected (representing a signal equivalent to 2.0 mm). Any other color is indicative of possible defects in the laminates.
Attenuation C-scan map for (a) epoxy/carbon fiber, (b) epoxy/glass fiber, (c) PEI/carbon fiber, (d) PEI/glass fiber.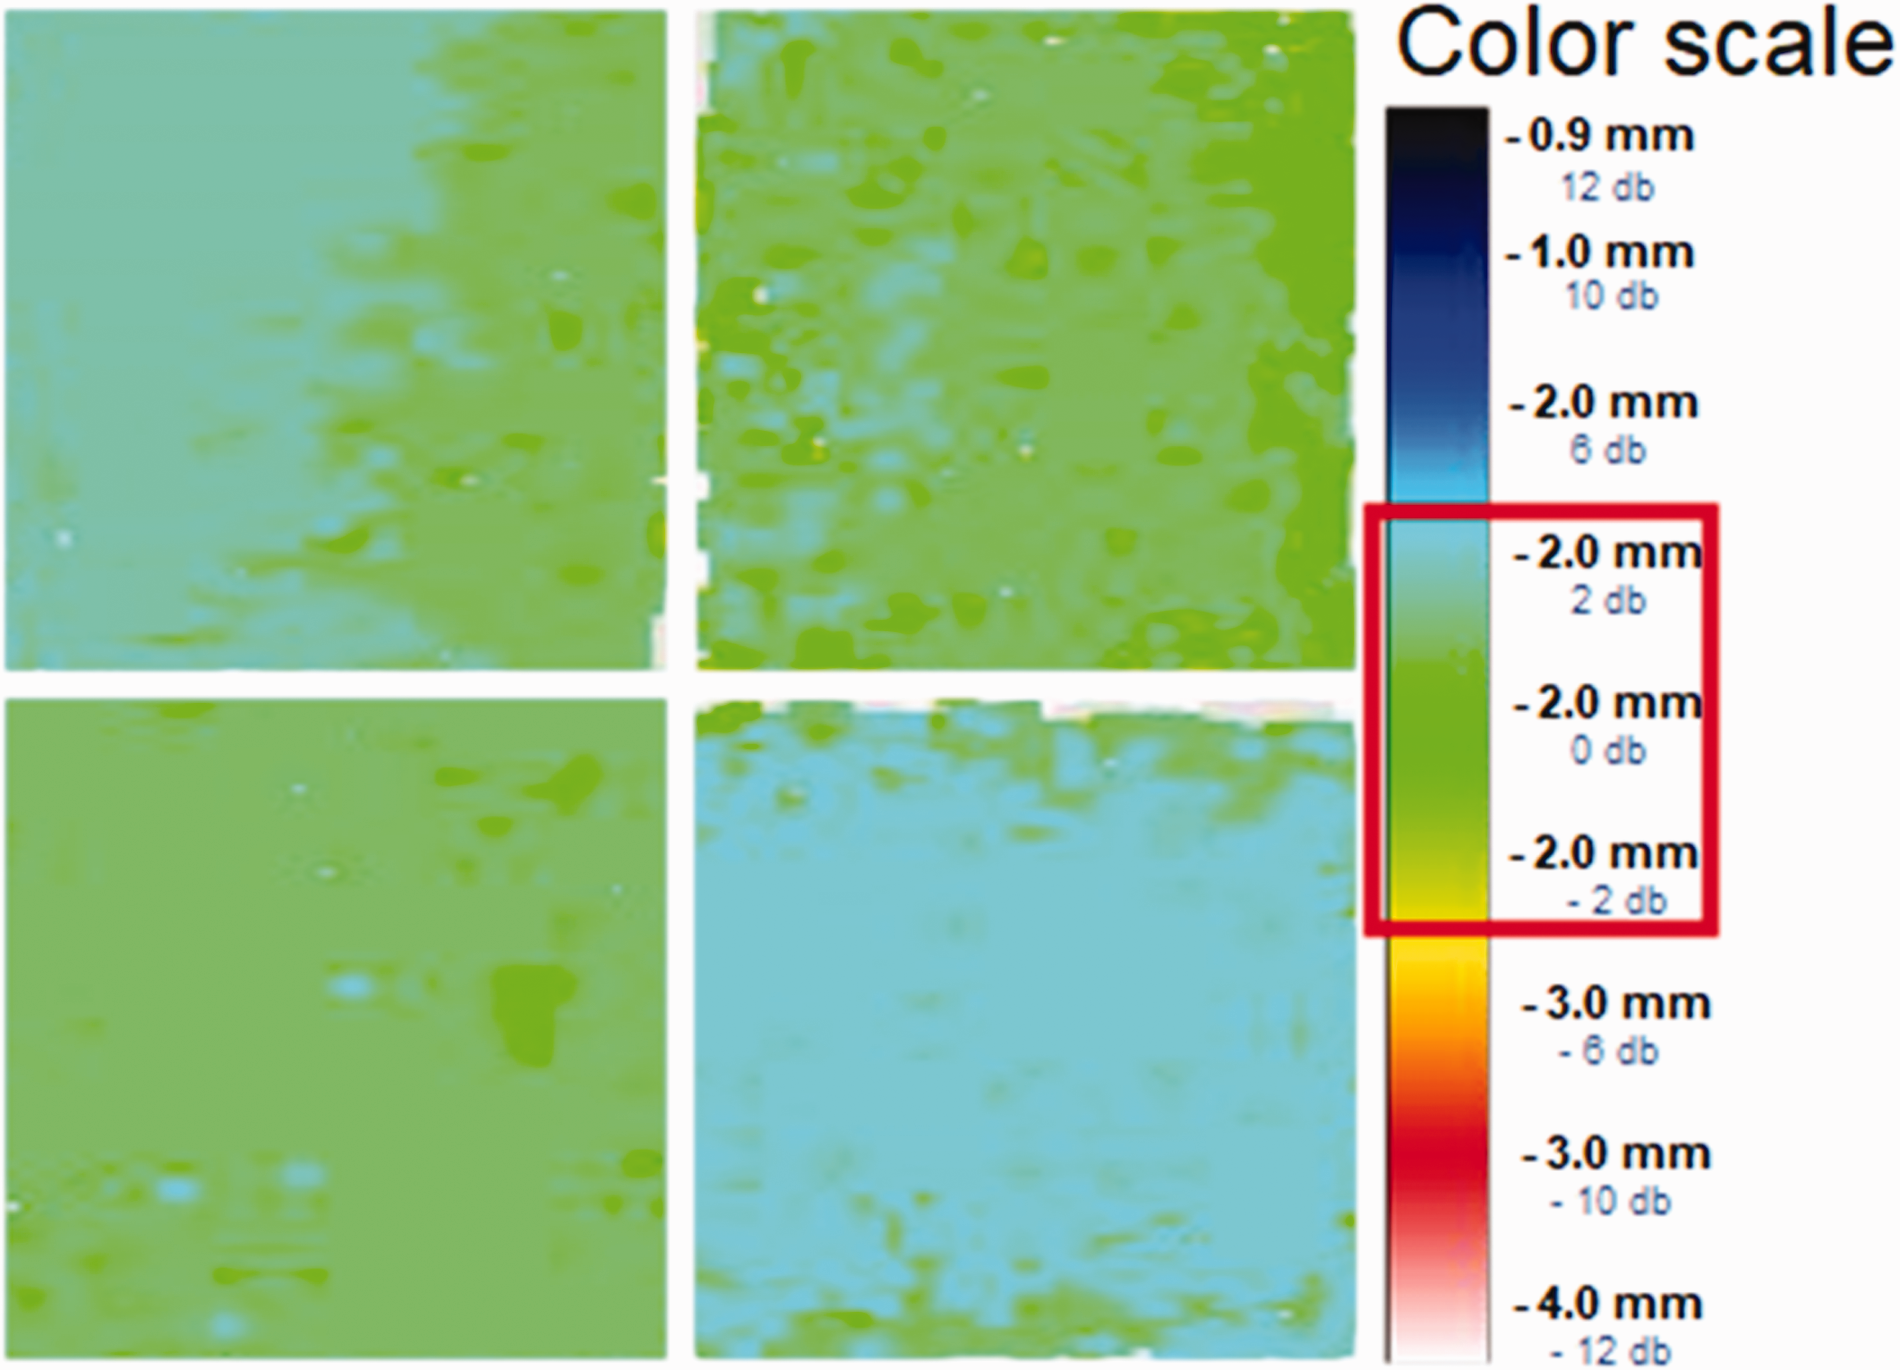
Since the refraction index differs from fiber to fiber, each attenuation map was separately analyzed. For each composite, an excellent compaction was obtained, which was not observed in resin-rich regions or delamination. In particular, Figure 1(a) presents notorious color differences, suggesting a possible pressure variation applied during processing. However, the results did not invalidate the excellent homogeneity of all laminates since the color variation is in the attenuation range corresponded to its width.
Acid digestion results for all pre-impregnated composites studied.
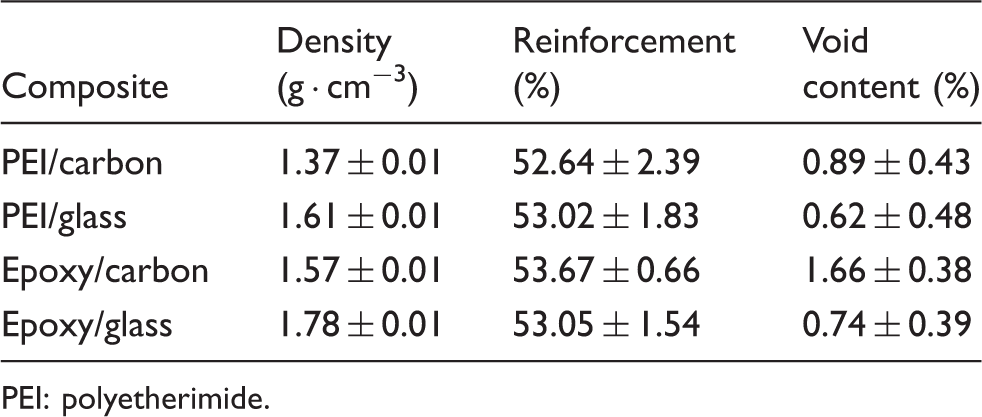
PEI: polyetherimide.
The reinforcement content was c.a. 53 vol.% for all composites studied. Higher density for glass fiber composites is expected due to its higher specific gravity. Carbon composites presented higher void content in comparison to glass fiber – plain weave presented a higher value (1.66%). According to the void formation mechanism 4, the dry state of the semipreg fabric is considered as governed by microflow, hence the void formation is reduced when compared to processes where macroflow control. 4 As a matter of fact, the higher packing capability of carbon fibers results in higher resistance to the percolation of the matrix by a porous media than glass fibers, and this phenomenon was already observed in previous studies.20–23 The plain weave also increases tortuosity of the flow and decreases the impregnation velocity, promoting more porous regions for preforms that require longer impregnation time – due to the high resistance of the medium to flow. 20 On the other hand, the absence of dry state for epoxy system (prepreg) combined with the lower and tortuosity space between carbon fiber tow induced higher void formation for carbon fiber/epoxy through trapping air and volatiles generated during processing. 24 Lower than 2% of void content values were found for all composites studied, which is useful for structural application.
Dynamic mechanical behavior
Figure 2 shows the dynamic mechanical analysis curves for the composite studied. Figure 2(a) presents the storage moduli for all studied composites. The plateau is maintained up to 175℃ for all composites with the exception of epoxy/glass fiber (100℃). At temperatures below Tg, polymeric chain movement is restricted by neighbors, and higher load-bearing capacity is governed by the capacity of the chain storage deformation imposed without conformational changes due to molecular movement.
25
If the barriers for the segmental motion of the backbone are high, higher hindrances in the activation of the backbone segmental motion are achieved. In this sense, PEI has more stiff backbones in comparison to epoxy, so higher modulus is expected. On the other hand, from the glass transition temperature, the influence is due to packing ability: rigid chains and bulky side groups present difficulty in packing these complex-shaped molecules and leave excess free volume resulting in higher dynamic fragility. On the other hand, flexible molecules are less fragile by their better packing ability during vitrification.
9
Dynamic mechanical analysis for studied prepreg composites: (a) storage modulus, (b) tan delta and (c) loss modulus.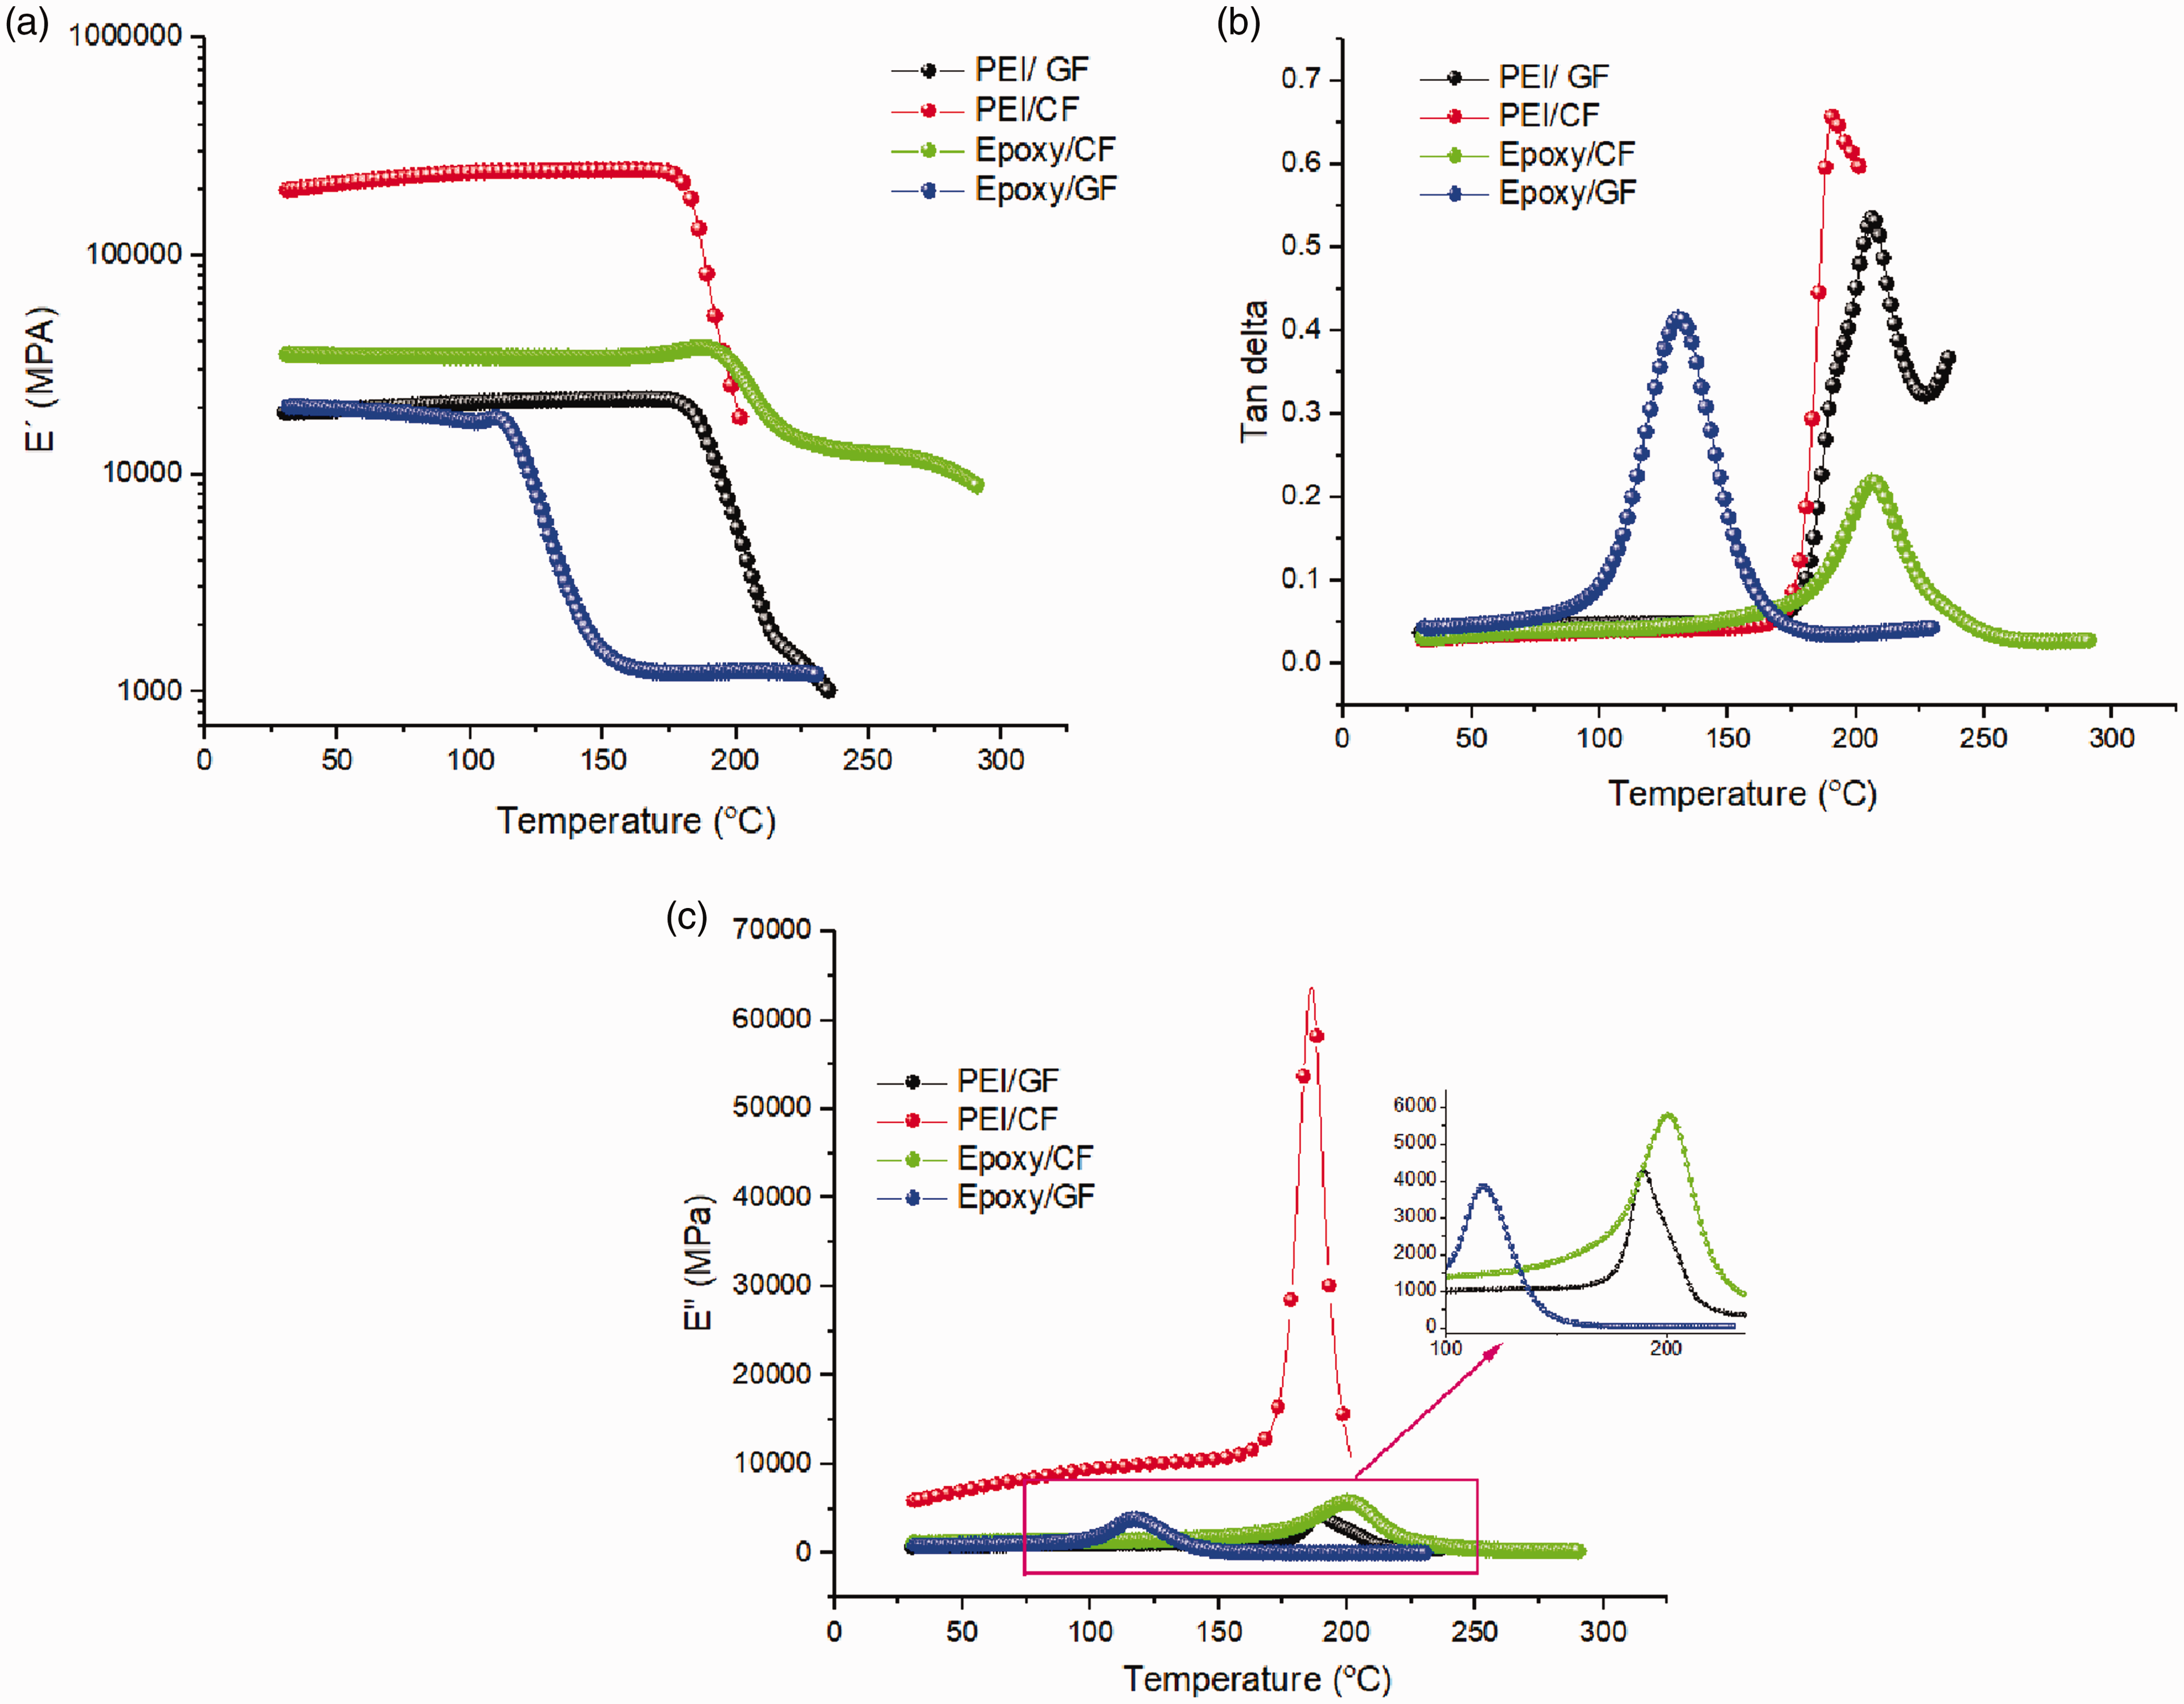
Despite a similar curve shape format, storage modulus values distinct to each other due to changes in the molecular response. The type of reinforcement also influences the storage modulus. Carbon composites had higher values when compared to glass ones. Similar values were obtained, except for PEI/carbon fiber laminate, due probably to the architecture of 5HS that promotes higher mechanical effectivity when compared to plain weave, due to lower superposition between weft and warp, reducing tension dots. Fiber restricts molecular chain mobility, increasing load-bearing capacity, and modifying macromolecular structure – higher restriction results in higher modulus.25,26 Since fiber content is similar, the difference may be attributed to higher PEI tenacity in comparison to epoxy. For epoxy composites, a slight shoulder is observed before modulus decay. This behavior is attributted to stress-relieving. 6
Figure 2(b) shows the loss modulus curves. It was considered the beginning of molecular mobility as comparison among the samples, being Tg values as PEI/carbon fiber (162℃), PEI/glass fiber (170℃), epoxy/carbon fiber (160℃), epoxy/glass fiber (95℃). The reason is that molecular mobility is previously detected in loss modulus than in storage one. The fall drop-in storage modulus occurs after a considerable energy to be stored and so some energy dissipated as heat. By the loss modulus, all conformation rearrangement promoted by the cooperative movement process, which alters configurational internal energy or entropy is previously detected. 27 Higher peak height for PEI/carbon fiber is attributed to higher dissipation due to higher storage energy in the glassy state.
Figure 2(c) presents tan delta behavior for all studied composites. Higher values were found by PEI/glass fiber (0.53) and PEI/ carbon fiber (0.65), in comparison to epoxy/glass fiber (0.41), epoxy/carbon fiber (0.22). This is probably an indication of poorer interface stress transferring in this region. Higher modulus for PEI composites allows higher energy dissipation at the glass transition region, and hence higher molecular mobility is achieved for these composites in comparison to epoxy ones.
The width of tan delta curves is indicative of molecular response occurring in the polymeric system. Polymeric chains which necessities lower molecular cooperation takes higher time to relax and vice-versa. So, higher width suggests higher differences in the relaxation process. From this point of view, epoxy/carbon fiber laminate relaxes in a broader range in comparison to PEI/carbon fiber, suggesting a more heterogeneous structural system. This can be due to the higher void content present in the acid digestion test.
Creep
Figure 3 shows creep behavior for all composites and tested temperatures. Higher deformation by temperature was observed, as expected, and the increase of temperature promotes higher molecular mobility of the molecules reducing rigidity of the materials and facilitating chain slippage.
Creep curves for: (a) PEI/carbon fiber; (b) PEI/glass fiber (c); epoxy/carbon fiber; and (d) epoxy/glass fiber.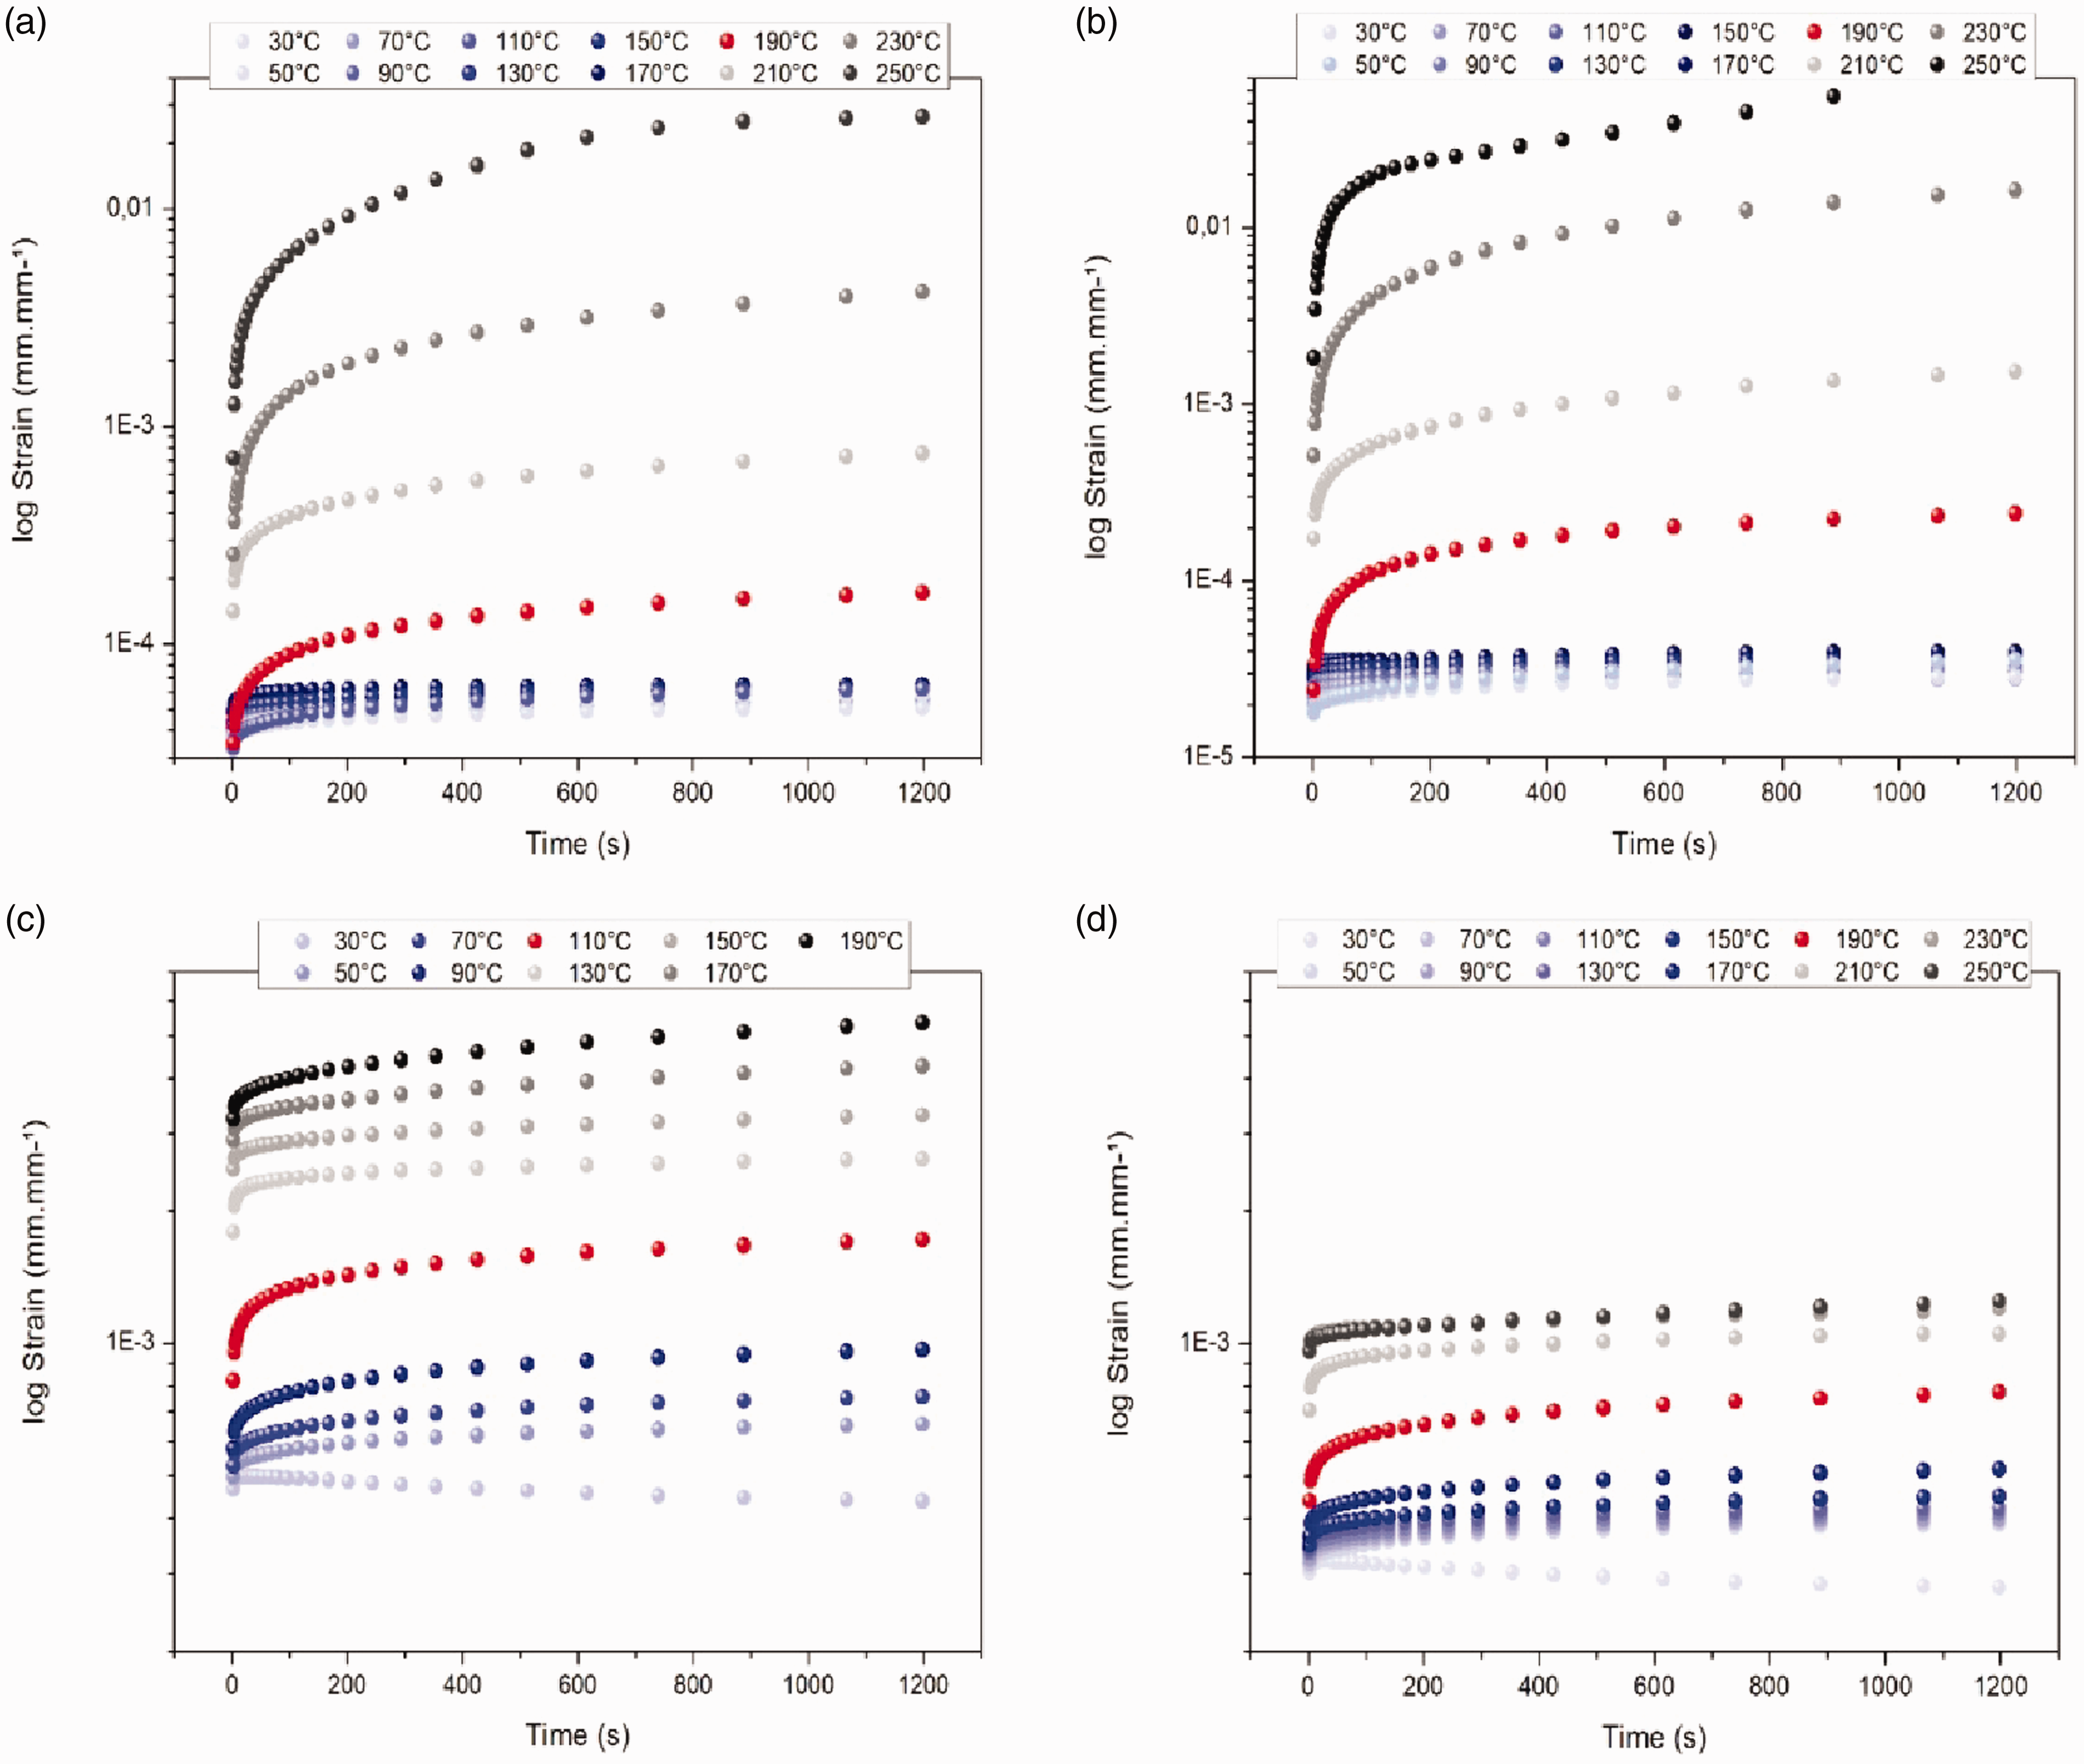
According to Yang et al., 28 creep response can be divided into three different stages: (i) primary (vitreous/elastic), (ii) Secondary (viscoelastic), and (iii) Tertiary (viscous). Regarding the glassy region (indicated as blue color in Figure 2), epoxy composites showed higher creep resistance, while PEI composites demonstrate to be more temperature dependent. Epoxy chain molecules have lower molecular cooperativity than PEI; consequently, lower energy capability is allowed to be stored in the glassy region.9,27 The matrix seems to have more influence on creep behavior than the architecture of the reinforcement. PEI creep curves are closer to each other in comparison to epoxy composites in the glassy region; therefore, this demonstrates higher creep stability in this region and so higher dimensional stability promoted by molecular restriction caused by aromatic imide groups. 27
At Tg (region II), higher deformation of PEI composites is due higher stiff of the backbone chain. 9 According to Sokolov, higher stiff of the chainbone reduces the molecular packing capability. Consequently, higher free volume, the capability to store energy increases by backbone chain stiffness, and hence higher dissipation occurs at the glass transition region with faster chain rearrangement and increasing chain slippage. Therefore, this phenomenon increases the deformation, as can be observed at Tg for PEI composites.
At region (III), the response is primarily viscous, and the molecules are quite free to move; thus, the deformation is a consequence of the “history” of the deformations aforementioned. Higher specific volume of styrene groups allowed higher energy to be stored in the glassy region, and consequently, higher molecular mobility is observed in the glass transition and viscous states.
Analytical models
Findley model
Findley’s parameters for all composites studied.
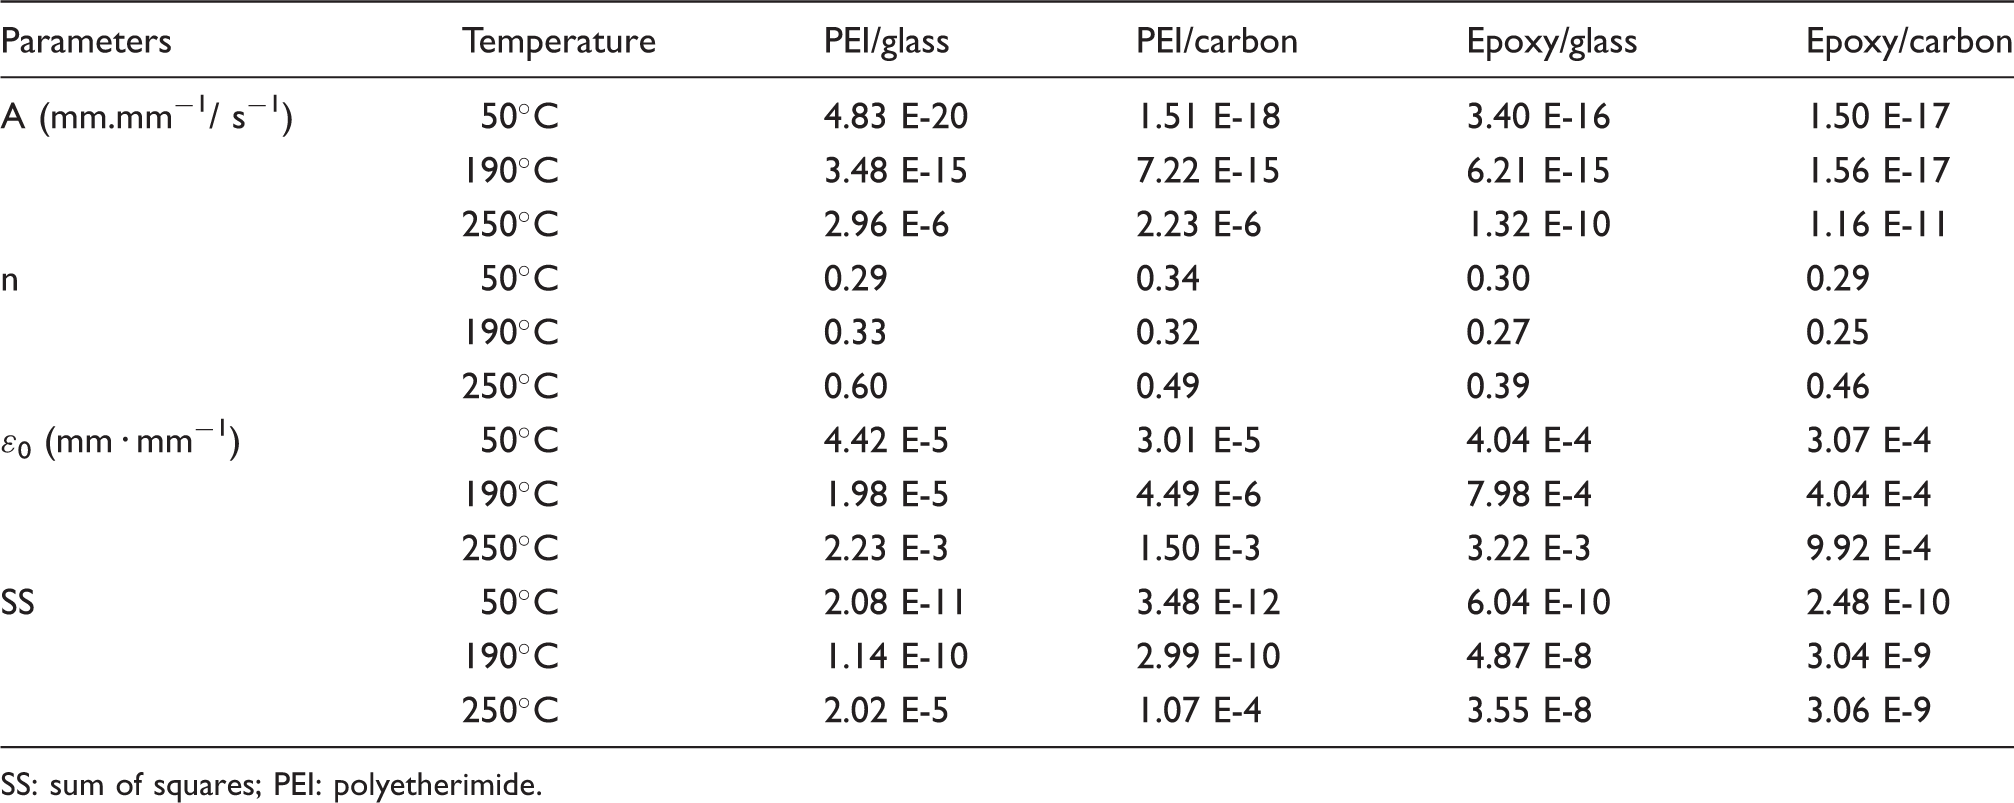
SS: sum of squares; PEI: polyetherimide.
In general, Findley model showed a satisfactory fit to describe the creep behavior for all composites in all temperature ranges studied. The minimum correlation coefficient was 0.97 for all curves.
Weibull model
Weibull parameters for all composites studied.
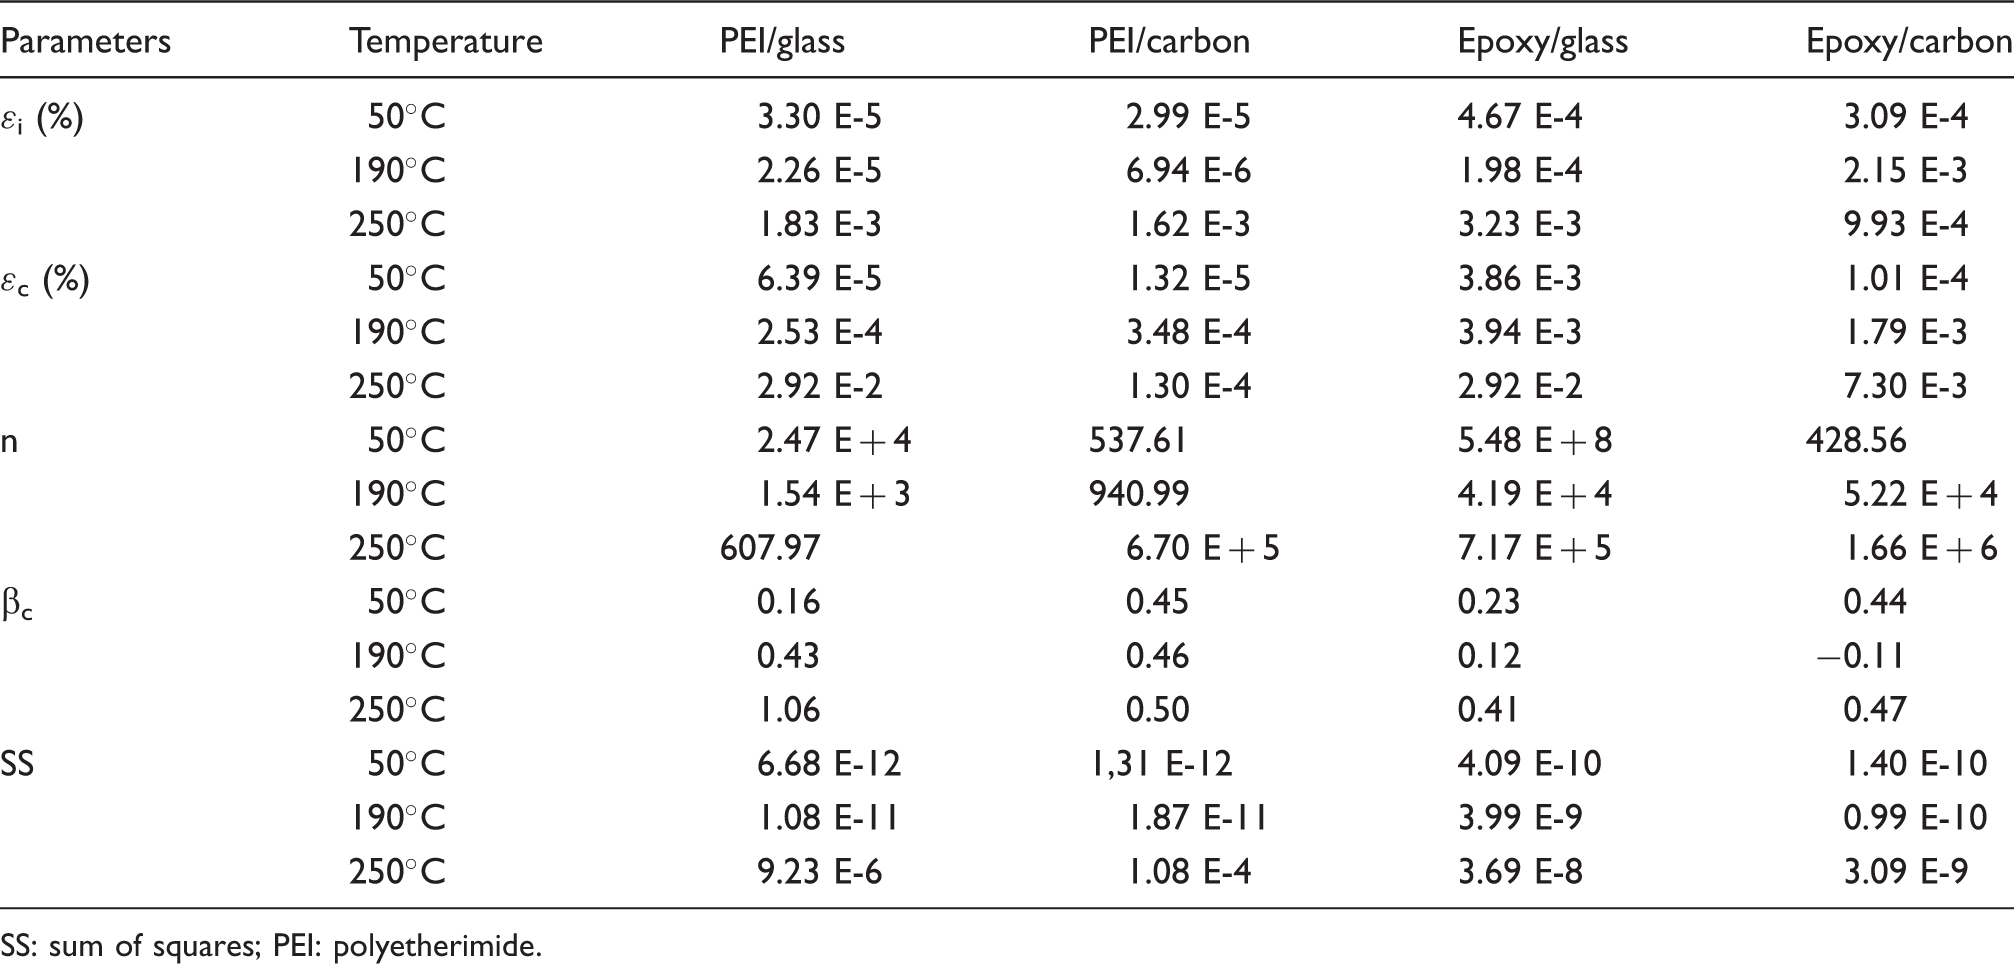
SS: sum of squares; PEI: polyetherimide.
βc showed higher and lower variation values for carbon composite with temperature in comparison to PEI composites. More “homogeneous” failure occurs for carbon composites, i.e. more chain segments failure in a narrower range.
ɛc parameter is referred as latch-activation with time, and it can be observed a progressive activation of the latch elements with temperature. At higher temperatures, a higher number of latches are activated: again, a higher variation of the results is obtained for PEI composites. In molecular terms, it is suggested that viscoelastic changes occur in a more cooperatively way, in which chain segments “jumps” faster among stability positions. n values tend to increase by temperature (exception for PEI/glass fiber), being a constant, which is dependent on the material and temperature. In general, the Weibull model presented a satisfactory fit to describe creep influence under conditions studied (above 0.98 R2).
Burger model
Burger parameters for all composites studied.
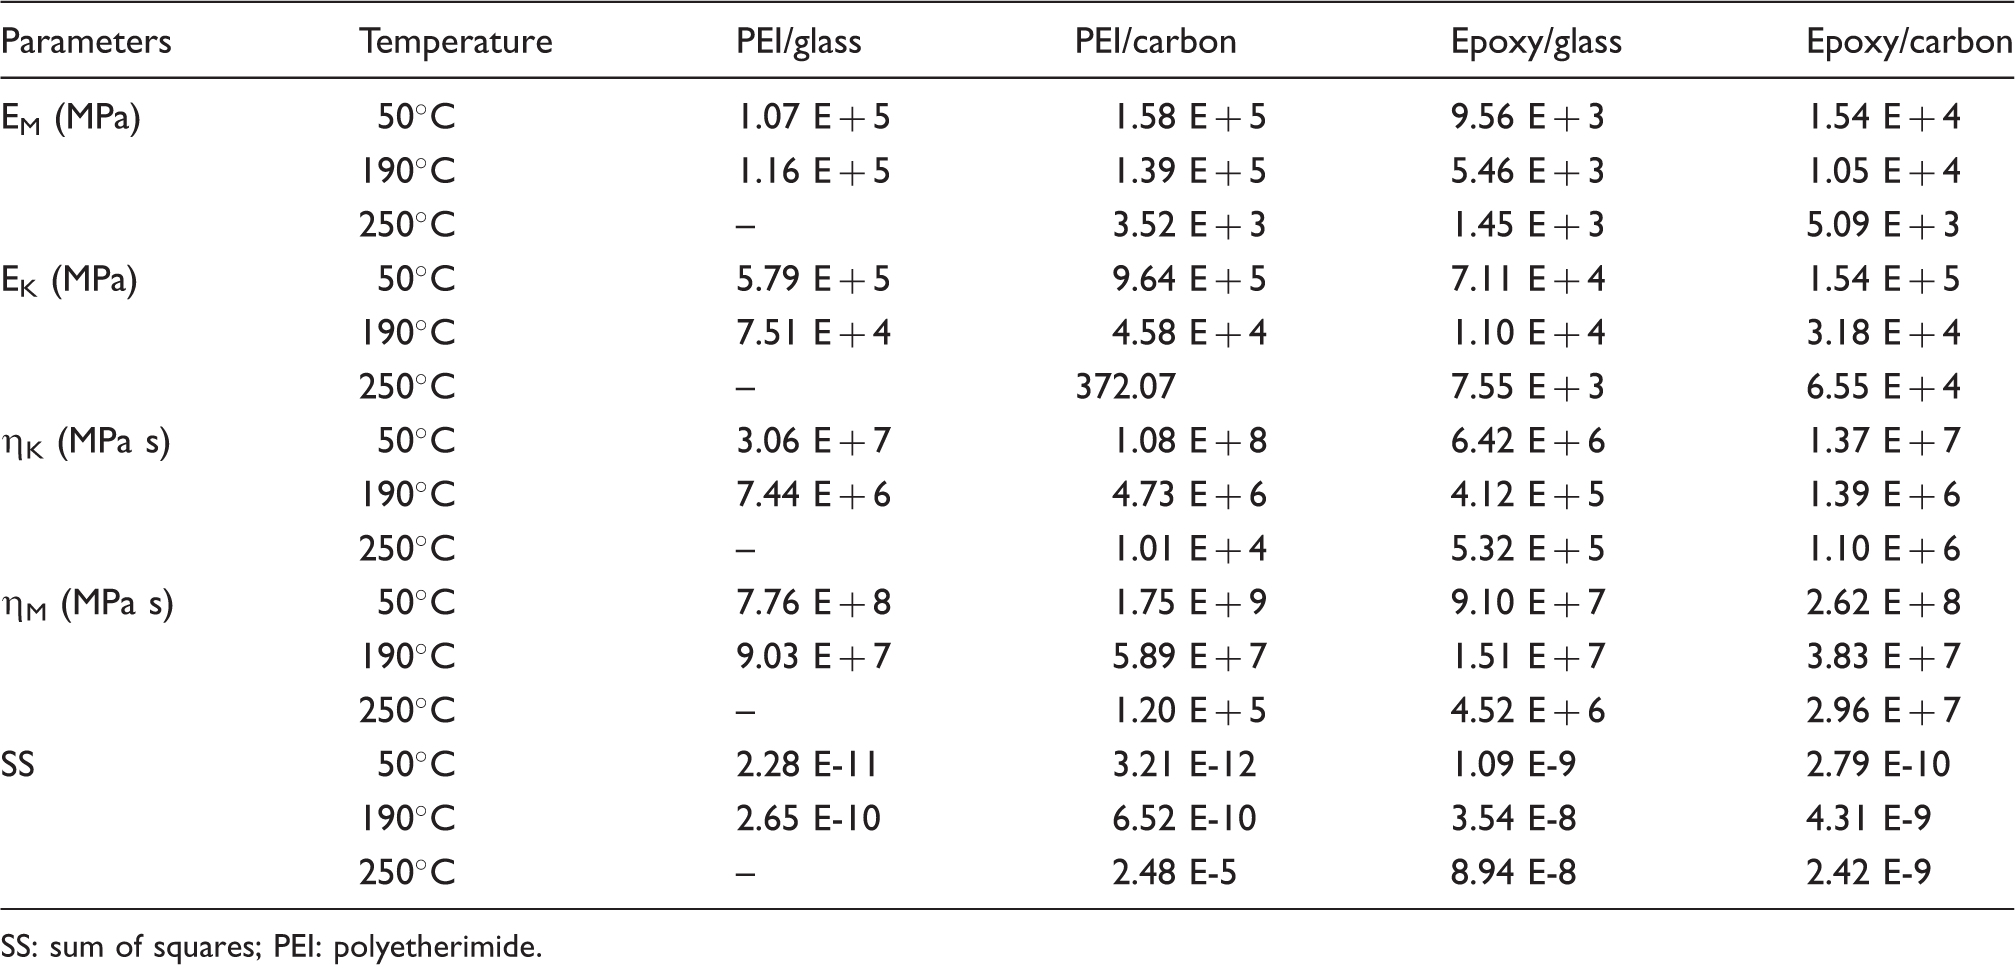
SS: sum of squares; PEI: polyetherimide.
EM is the elastic deformation, and it is associated with the elastic rigidity of the material. In general, for all composites, EM tends to decrease with temperature because the material becomes softer, and this contributes to the decrease of the instantaneous modulus. 28 PEI/carbon fiber showed higher EM values at the glassy temperature (the same behavior was observed for dynamic runs). However, the epoxy matrix showed lower values in relation to PEI composites, indicating lower rigidity as corroborated for other analytical models. This result can be associated with ɛ0 from Findley’s model. 28
Retardant elasticity modulus (EK) and viscosity (ηK) are associated with rigidity and viscous flow of the amorphous polymeric chains, respectively. In general, both parameters were reduced with temperature for all composites. The viscous slippage of the chain molecules occurs faster by temperature. The decrease of both parameters with temperature is due to higher energy absorption by the active polymeric chains; hence, rigidity decreases. When compared to epoxy laminates, PEI composites showed higher values, demonstrating higher molecular mobility regarding viscous flow and corroborating with dynamic runs,
ηM indicates the permanent viscous flow, and it is analyzed as a measure of the amount of the residual stress after the application of stress. This parameter relates to the viscous part of the material, and the results seem to corroborate with tan delta peak height (dynamic runs). Higher the peak height for a given composite, higher the predominance of the viscous element over the elastic one. The results showed that the higher permanent viscous flow showed by PEI is also observed in the dynamic runs (by analyzing the maximum height of the tan delta peak). PEI/glass fiber at 250℃ was not fitted using Burger’s equation.
To better visualize the effect of temperature on different composites, a schematic representation is presented (Figure 4(a) and (b)).
Schematic representation of the stress transferring for PEI and epoxy composites.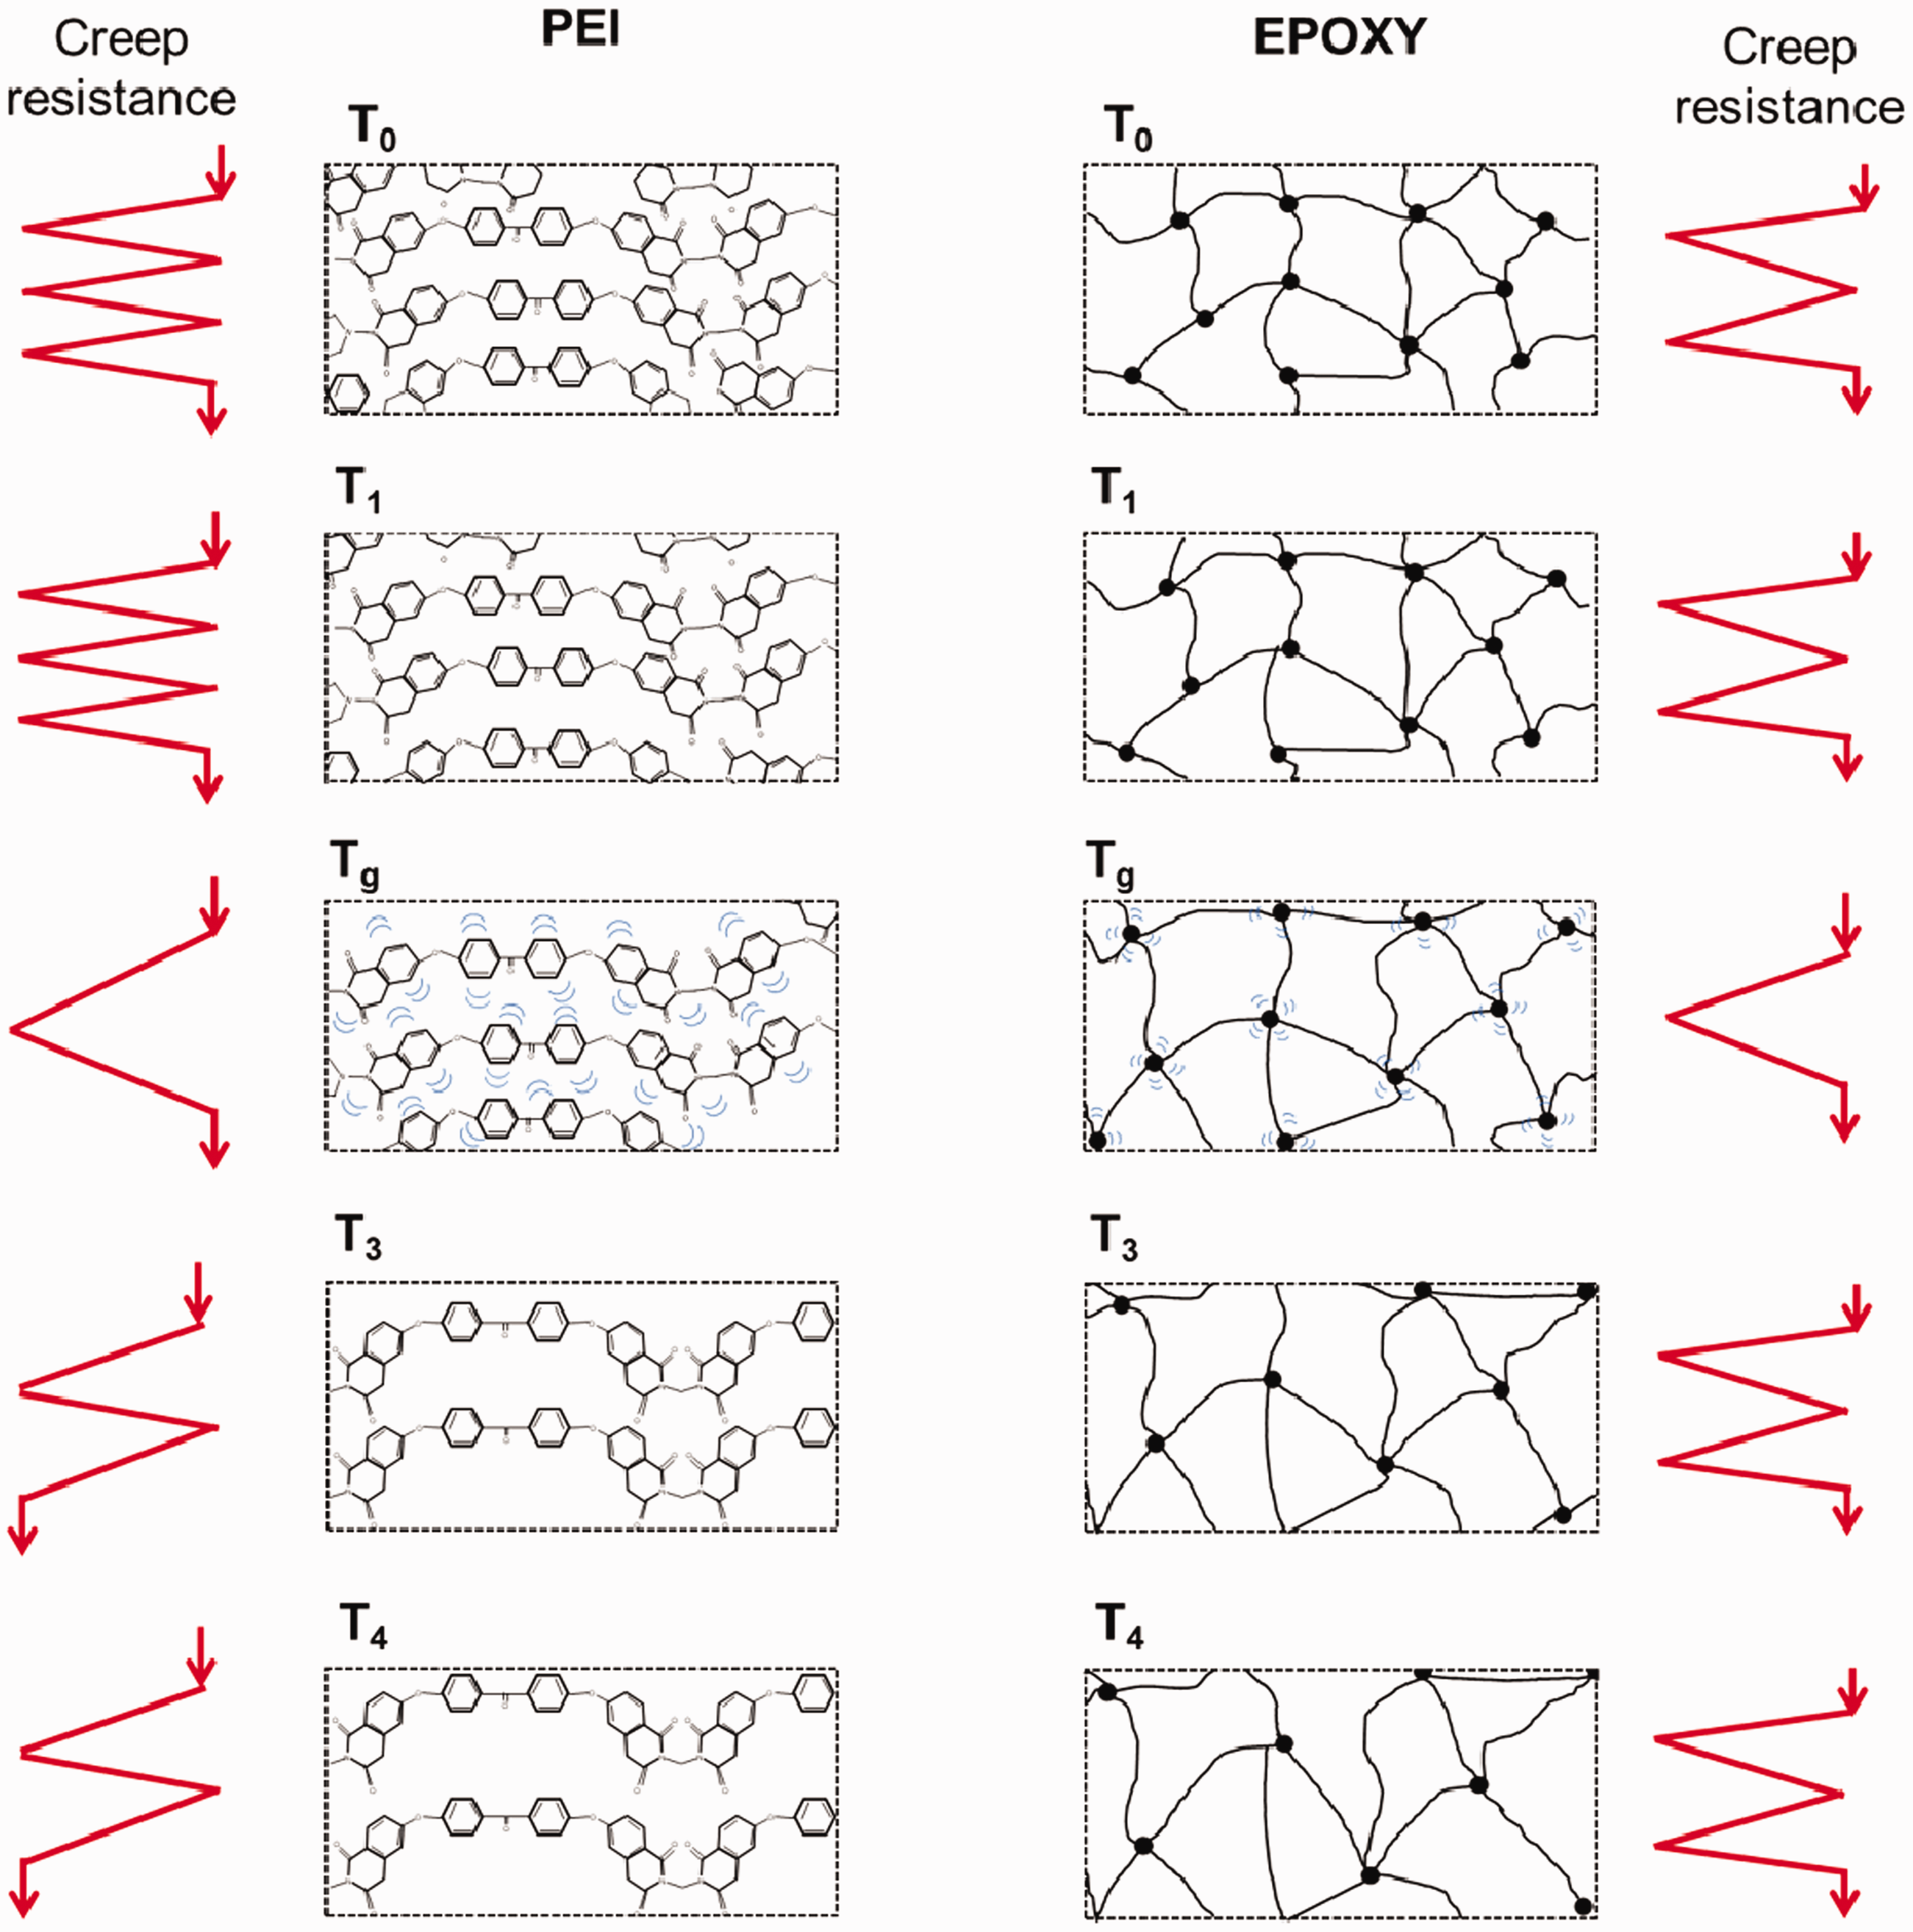
Time-temperature superposition
Master curves for all composites were obtained using a reference temperature of 30℃ (Figure 5). The same behavior was observed for all composites, i.e. deformation increases by time. At lower times, the chain segments are in a frozen-in state, and it is necessary more energy to cooperativity motion during creep; consequently, the deformation is smaller. With time, more chain segments are activated, and the velocity of the chain orientational increases.
30
From Tg, relaxation is related to conformational changes of the polymeric chains and are resulted of rotation of chemical bonds.
27
Higher molecular mobility increases the free volume and allows the matrix to begin the plastic deformation earlier. In the elastomeric region, the segments store higher energy in comparison to the glassy state due to the viscous slippage of the molecules; hence, damping is low. More significant abrupt change from glassy to glass transition temperature reflects higher deformation in function of time (Figure 5(a) to (d)). This behavior is observed for PEI, where higher strain occurs in the glass transition zone. Epoxy/carbon fiber composite showed higher creep resistance and lower deformation at glass transition, indicating that higher height energetic barrier must be overcome to active molecular movement. For the applied stress (5 MPa), the tertiary creep stage was not observed. This stage corresponds to a faster creep rate, and the final rupture occurs.16,28 TTS master curves showed to be successfully applied using short-term experiments broadening all viscoelastic regions.
TTS curves for all composites studied.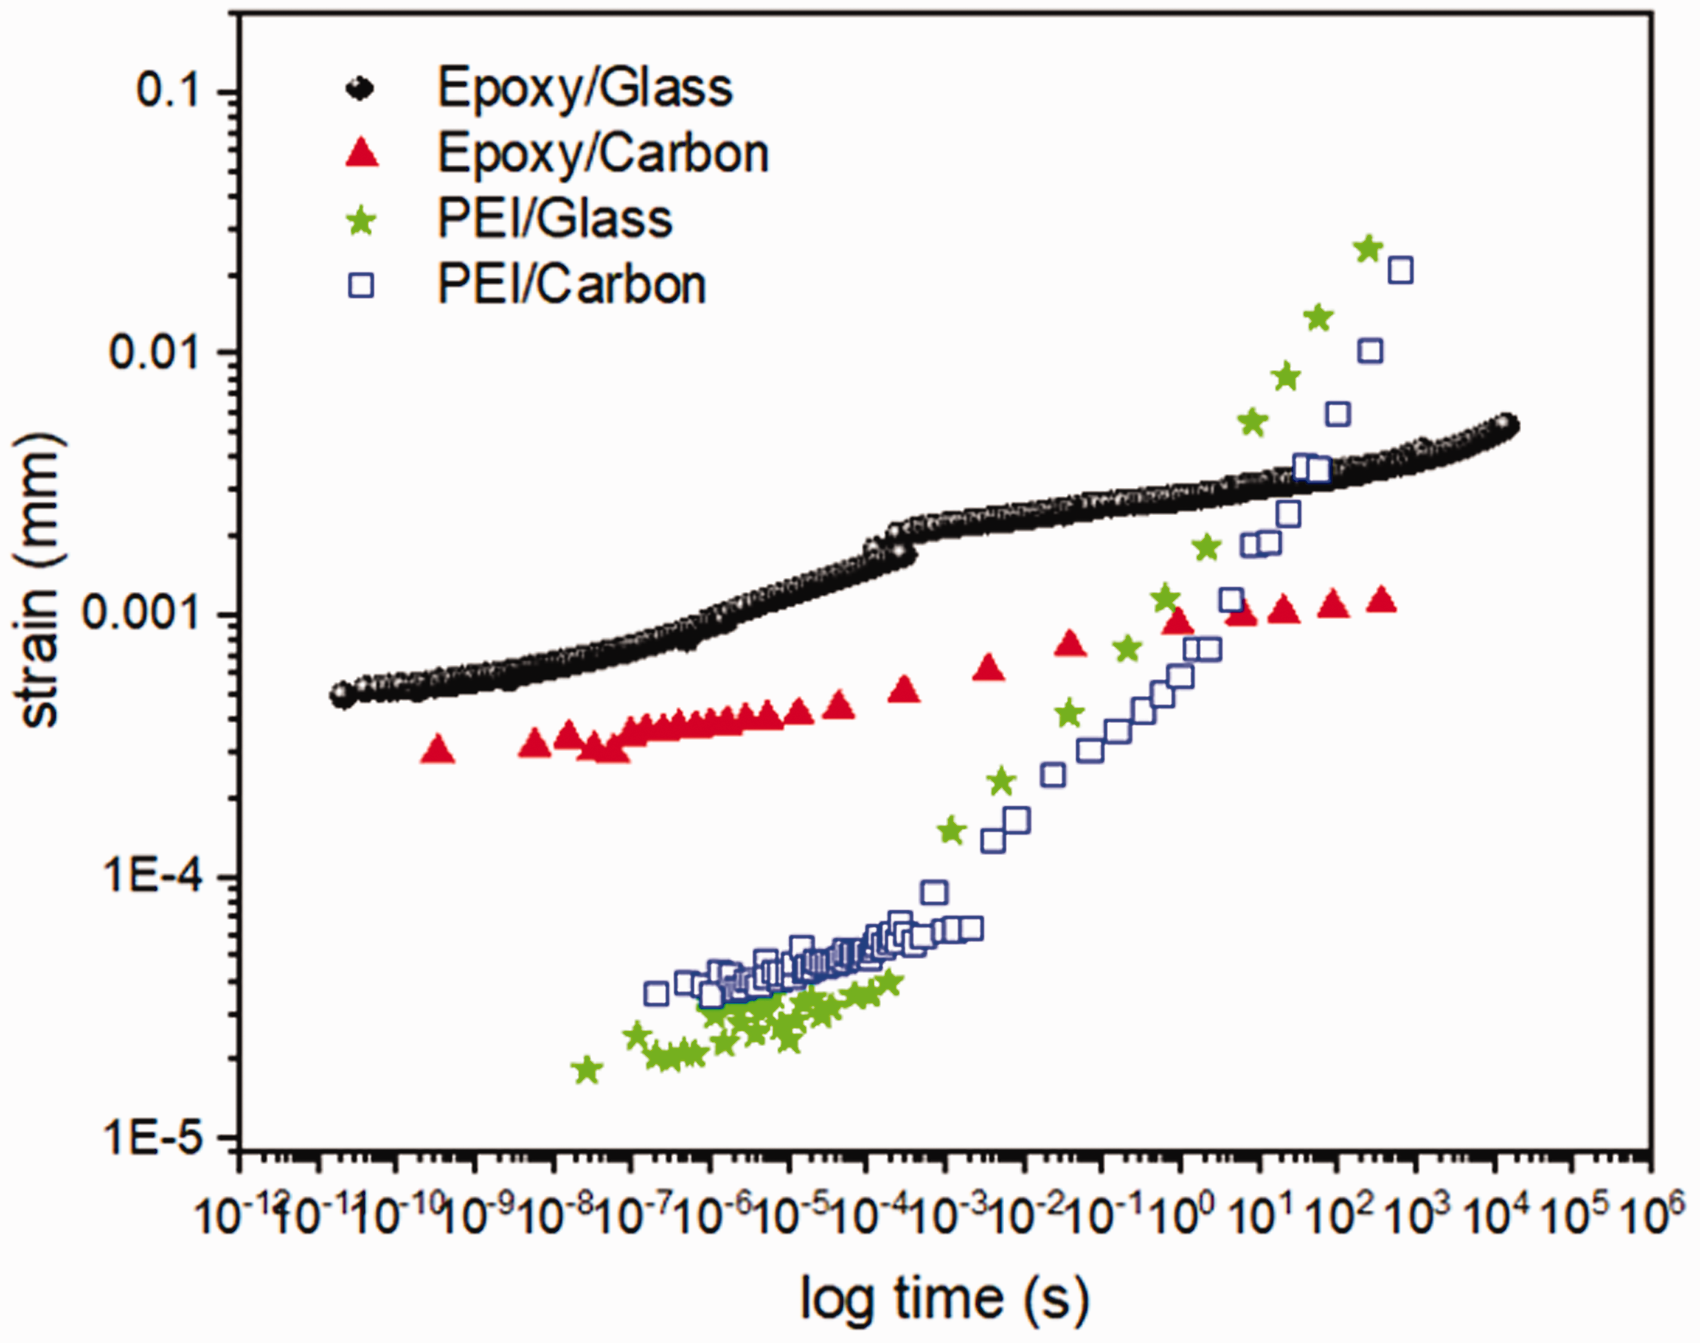
Conclusions
In the present study, structure vs. property relationship using creep test for PEI and epoxy composites under low stress was studied. The higher void content for carbon composites (independently of the matrix used) in comparison to glass composites are due their higher packing capability. Also, the absence of a dry state for carbon architectures gives lower and tortuosity space between tows and contributes to higher void formation. The higher storage modulus was not influenced by the void content and seems to be more directly connected with fiber/matrix interaction and with the higher intrinsic properties of carbon fiber. As the composite passes from the glassy to the elastomeric state, the energy dissipated is proportional to the energy storage so far. That is the reason PEI/CF dissipates much more energy in the glass transition region in comparison to the others. This characteristic influences the creep behavior, mainly in the glass transition region, where higher creep was observed for PEI/CF composites.
The creep behavior was mainly influenced by matrix type than reinforcement architecture and void content. Findley, Burger, and Weibull models showed excellent fit for most composites with similar results in the glassy and elastomeric regions. Tg showed an anomalous effect (comparing the numerical values obtained) due to higher energy loss in a shorter time range and can be attributed to the higher stiffness of the chainbone in comparison to epoxy composites. However, the energy loss occurred in a shorter time interval.
The results were corroborated in TTS curves, in which in the glass transition region, higher deformation was observed for PEI composites. Epoxy composites showed a more linear behavior over time in comparison to PEI composites. This abrupt change in the properties can lead to catastrophic failure of the material. Hence, the choice of material is extremely dependent of the application and range of temperature.
Footnotes
Declaration of Conflicting Interests
The author(s) declared no potential conflicts of interest with respect to the research, authorship, and/or publication of this article.
Funding
The author(s) disclosed receipt of the following financial support for the research, authorship, and/or publication of this article: processes numbers: 153335/2018-1 and 303224/2016-9), FAPESP (processes numbers 2017/10606-4, 2017/16970-0, and 2018/07867-3) and Coordenação de Aperfeiçoamento de Pessoal de Nível Superior – Brasil (CAPES) – Finance Code 001.