
Abstract
The arrangement of the constituents of organic-composite friction materials is a key factor of their microstructure and thermal and mechanical properties which can influence braking performance. Among these constituents, fibres can present complex morphologies and different arrangements depending on their type and the process of manufacturing. Besides, synergistic effects acting between these constituents and the resulting properties are still not well investigated. This work relates to rock- wool used for brake friction materials, and for which the process can lead to various arrangements. The focus is on synergies between these fibre arrangements and the other material constituents, in ways that reveals the link between the resulting microstructural characteristics and properties of organic composite materials. To achieve these objectives, two simplified formulations are elaborated with two distinct arrangements of rock wool fibres. The friction materials are investigated in terms of microstructure, thermo-physical and mechanical properties. It is found that fibre arrangements affect carbonaceous particle distribution, porosity, and fibre-matrix adhesion. On one side, homogeneous distribution and regular size of fibre bundles results in a better connectedness of conductive particles and thus enhances thermal conductivity. On the other side, a regular fibre bundles repartition lead to a more homogeneous distribution of strain localizations and a softer mechanical response.
Keywords
Introduction
Properties and performances of friction materials depend of many factors (process parameters, composition, microstructural characteristics), many studies show the effect of several constituents of friction materials with different functions, ratios, particle size and orientation but no studies focused on the synergistic effects between theses constituents and the resulting properties and performances of organic friction materials used for brake lining.1–3 These latter are known for their important heterogeneity. This heterogeneity is induced by the variety of constituents (morphology, sizes, properties, etc.) and the manufacturing process with its multiple steps (mixing, preforming, hot moulding and post curing). The material design is still based on the know-how of manufacturers and results from a long experience generally acquired by trial and errors. Among all constituents of friction materials, fibres present complex morphologies and different arrangements (bundles or separated fibres) depending on their type and the process of manufacturing. Moreover, with their different arrangements they lead to different mechanical behaviors and affect thermo physical properties. Previous works have demonstrated that fibre size, ratio, arrangement and fibre matrix adhesion play a significant role in the mechanical behavior (stiffness, strength, failure strain and energy storage capacity) and have a major impact on the braking performances of several fibre-reinforced composites.4–7 However, these studies did not focus on the link between microstructural characteristics induced by synergistic effects between fibres and the other constituents and the resulting properties and performances.
Thus, the current study aims to reveal the impact of this constituent, namely rock wool fibres, on the other constituent arrangements and orientation. Besides, the objective of this research is to establish the link between microstructural characteristics induced by theses synergical effects and the resulting properties of friction materials. To achieve this target, an experimental approach based on material simplification is used. Microstructural characteristics are thoroughly investigated using 2 D and 3 D analyses.
Methodology: Material simplification
To make clear the analysis of synergistic effects induced by the arrangement of fibres on the microstructure and the resulting properties, the design of friction material has been simplified. The original material is a commercial formulation involving more than 20 constituents. The simplified material consists in reducing the number of constituents and narrowing the range of constituent size. The aim of this methodology is to limit synergistic effects and to control microstructural heterogeneity of these organic composite materials which complicate the comprehension of the link between microstructure and the resulting properties and performances. 8 Although many research involve simplified materials to master manufacturing parameters and constituent functions and to access to these material properties and performances, the link with material microstructural properties was still not well mastered and required going further in these material simplifications.9,10
The reduction of the formulation is performed according to the classification of the constituents with respect to their expected function (lubricant, abrasive, etc.) which leads to a tribologically relevant behaviour compared to fully formulated brake linings. 8 One constituent of each class is used according to the class volume fraction of the original formulation. 10 This selection leads to a simplified formulation used as a baseline and given in Table 1.
Simplified materials: formulation and constituent size.
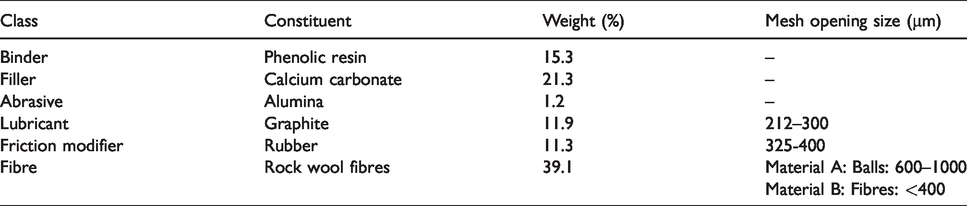
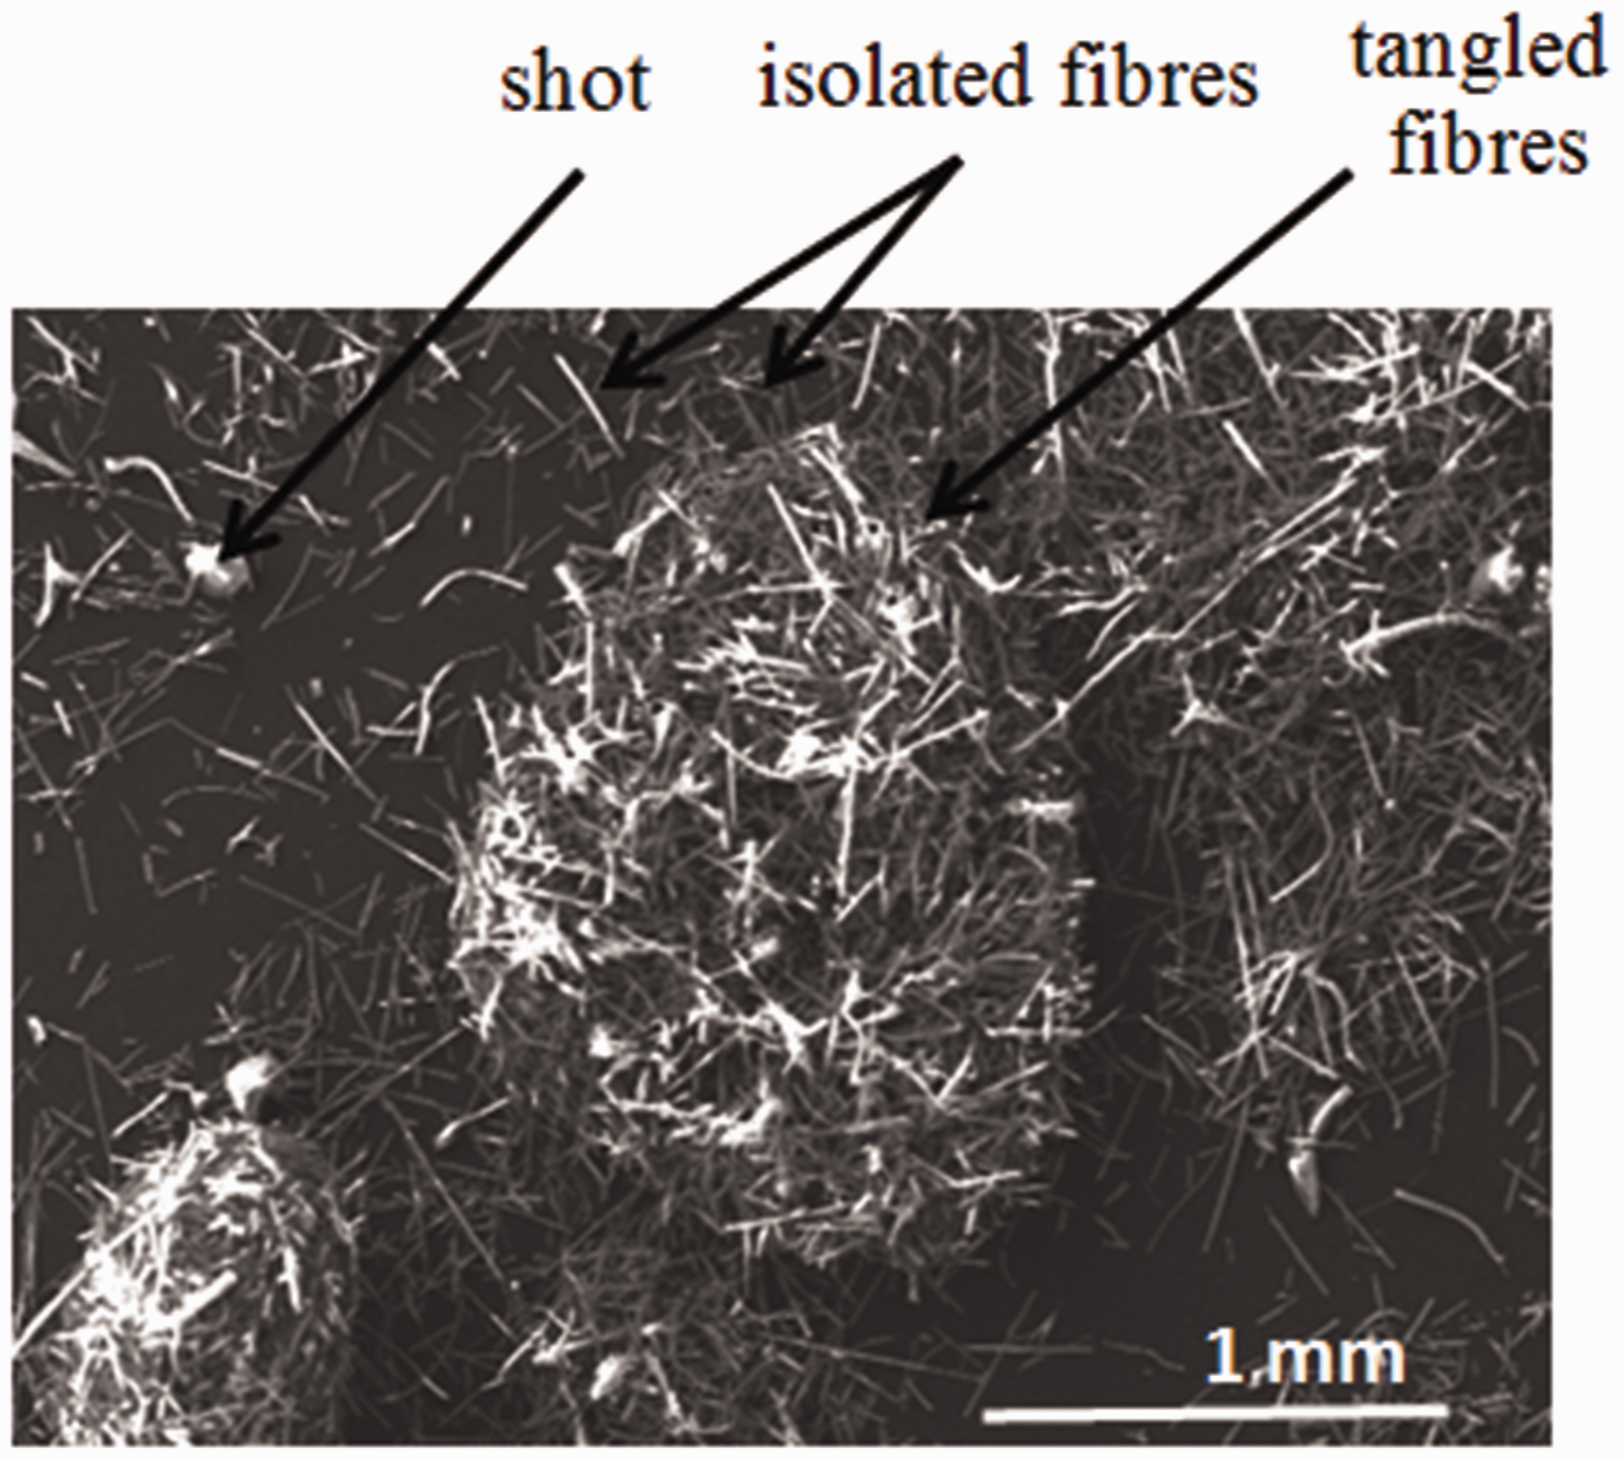
Reduction of the size distribution of constituents has been carried out using sieving method. 11 Selected sizes of constituent are shown in Table 1. It should be noted that rock wool present various morphologies: coarse particles named “shot” have rounded shapes, while thin fibres of 5 to 10 µm in diameter varies in a large range of length. Rock wool fibers can be found isolated or in the form of entangled balls (Figure 1). Rock wool was calibrated passing through sieves. Three mesh opening sizes were used: 400 µm, 600 µm and 1000 µm. It should be noted that small shots and fibres were collected when passing through the smaller mesh diameter sieve (400 µm). Two materials were elaborated depending on selected fibre morphologies and sizes with the same weight proportion of rock wool (Table 1). The material named A contains fibres as balls in the range of 600 – 1000 µm and the material named B is made with isolated fibres which size were below 400 µm. Since these fibres are very cohesive, they became tangled up in a different way during the process and manipulations. 12
Rock wool fibre morphologies.
Morphology of the two types of fibre bundles was assessed by Optical Microscopy (Figure 2). Micrograph of fibre balls exhibits a regular bulky form containing voids inside (Figure 2(a)) whereas fibre entanglements present irregular flat form and contained compacted fibres (Figure 2(b)). Apparent density of the resulted fibre entanglements is higher than that of fibre balls with respectively 0.71 g/cm3 and 0.4 g/cm3.
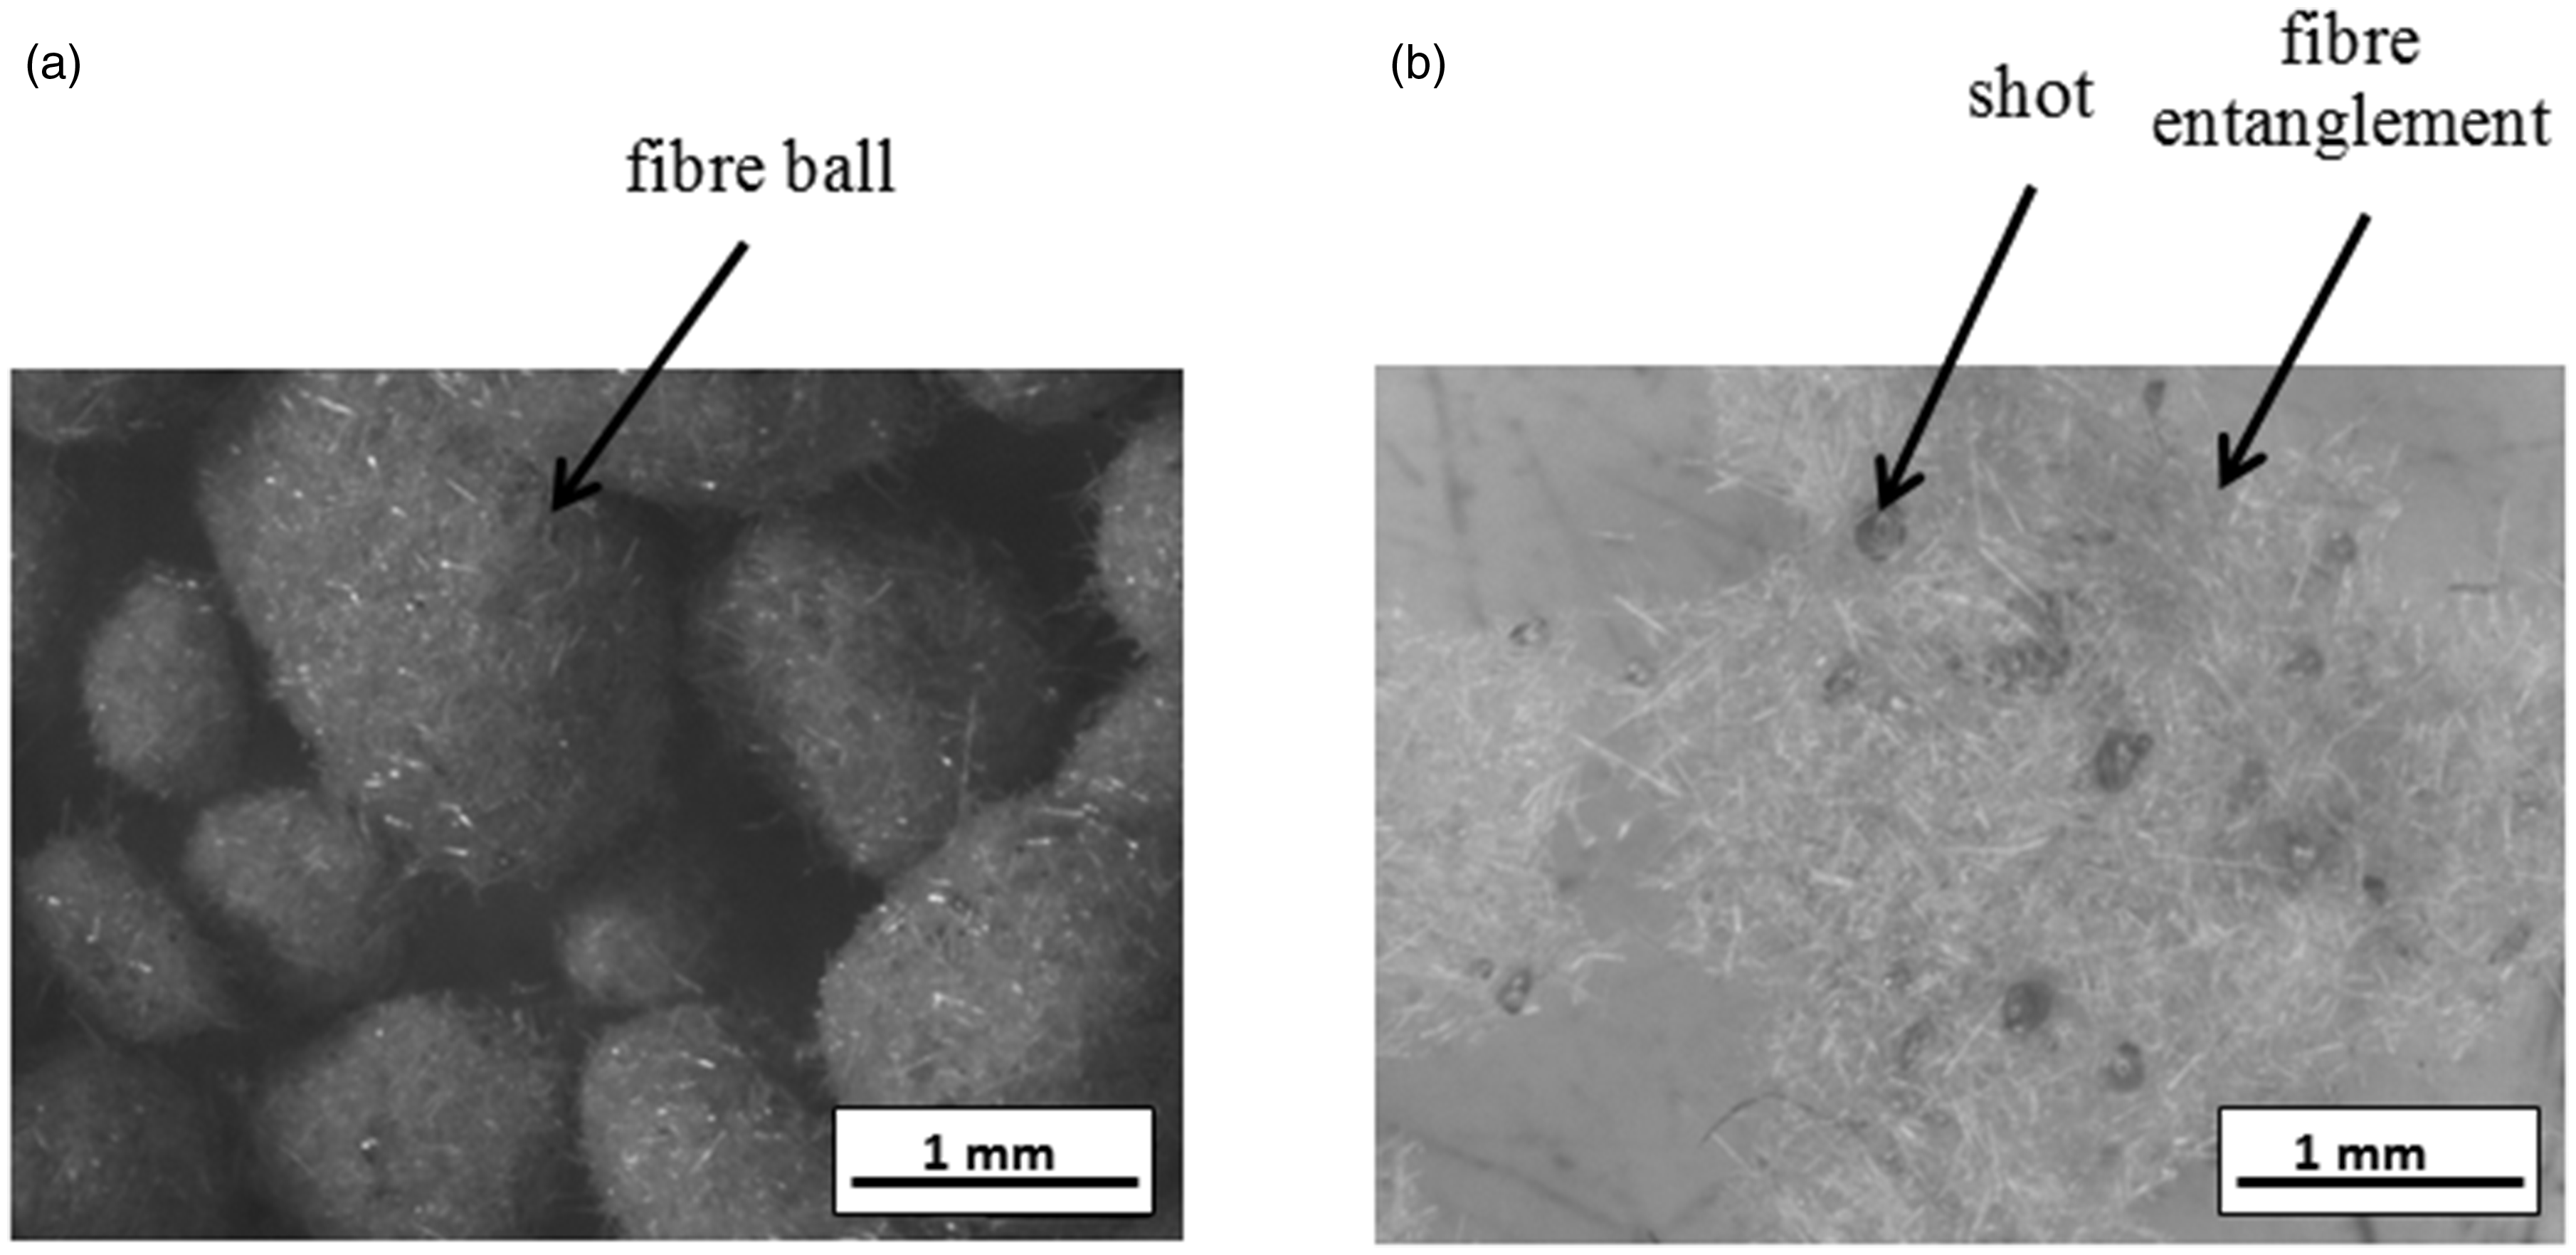
Fibre bundle morphologies and arrangements: (a) fibre balls (material A), (b) fibre entanglements (material B).
The elaboration process of the simplified materials started with a mixing in a laboratory mixer which reproduces the same mixing mechanisms of the industrial one. Constituents were incorporated in the mixture with defined order and duration of introduction sequences (Table 2).
Mixing duration and order of introduction sequences of constituents for material A and material B.
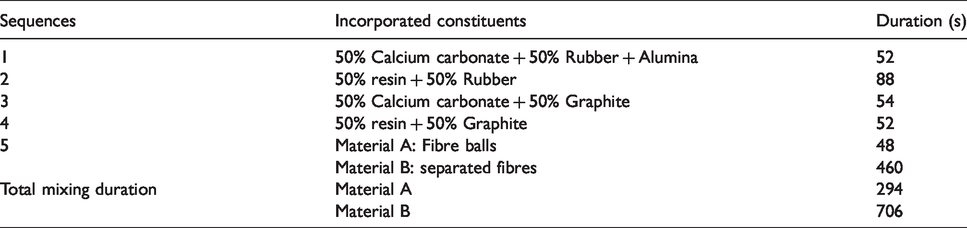
Parameters of mixing were investigated in previous work. 12 In fact, it has been suggested a suitable order of introduction mixing sequences and an optimal mixing duration permitting a good distribution of particles. It consisted in alternating the mixing of fine (resin, alumina, calcium carbonate) and coarse particles (graphite, rubber) to avoid particle segregation and fine particle agglomeration. Rock wool fibres were introduced in the final sequence with two different ways for investigated formulations. To elaborate the mixtures of A and B materials, the same order and duration of introduction sequences of all constituents except rock wool fibres were performed. A short mixing time (48 s) of fibre balls was performed so that the initial form and size of fibres is not modified. On the contrary, a longer time (460 s) of mixing for B was used to enhance dispersion and distribution of rock wool fibres in the mixture (Table 2). After mixing, a succession of steps was performed: a cold preforming then a hot moulding during 11 min at a curing temperature of 140 °C under pressure of 200 bars, and finally a post curing at 160 °C for 8 hours. A series of finishing operations was performed at the end of the manufacturing process to obtain a flat plate 400*400 mm width and 16 mm thick. For this study, specimen sampled from the elaborated plates are cylindrical with a parallel axe to the normal direction of the manufactured plate, considering the transverse isotropy of microstructure and properties of these materials. 13 The normal direction is the direction of compression during cold preforming and hot moulding steps which corresponds to the direction of the normal load application on brake lining in use.
Microstructural investigation
2D Microstructural characterization
Microstructures were characterized using Scanning Electron Microscopy (SEM). Micrographs of Figure 3 illustrate the constituents of the two composite materials: the smallest constituents (alumina and calcium carbonate) are not discernable from the phenolic resin while the other constituents appear embedded. A lack of cohesion can be seen between some rubber particles and the matrix.
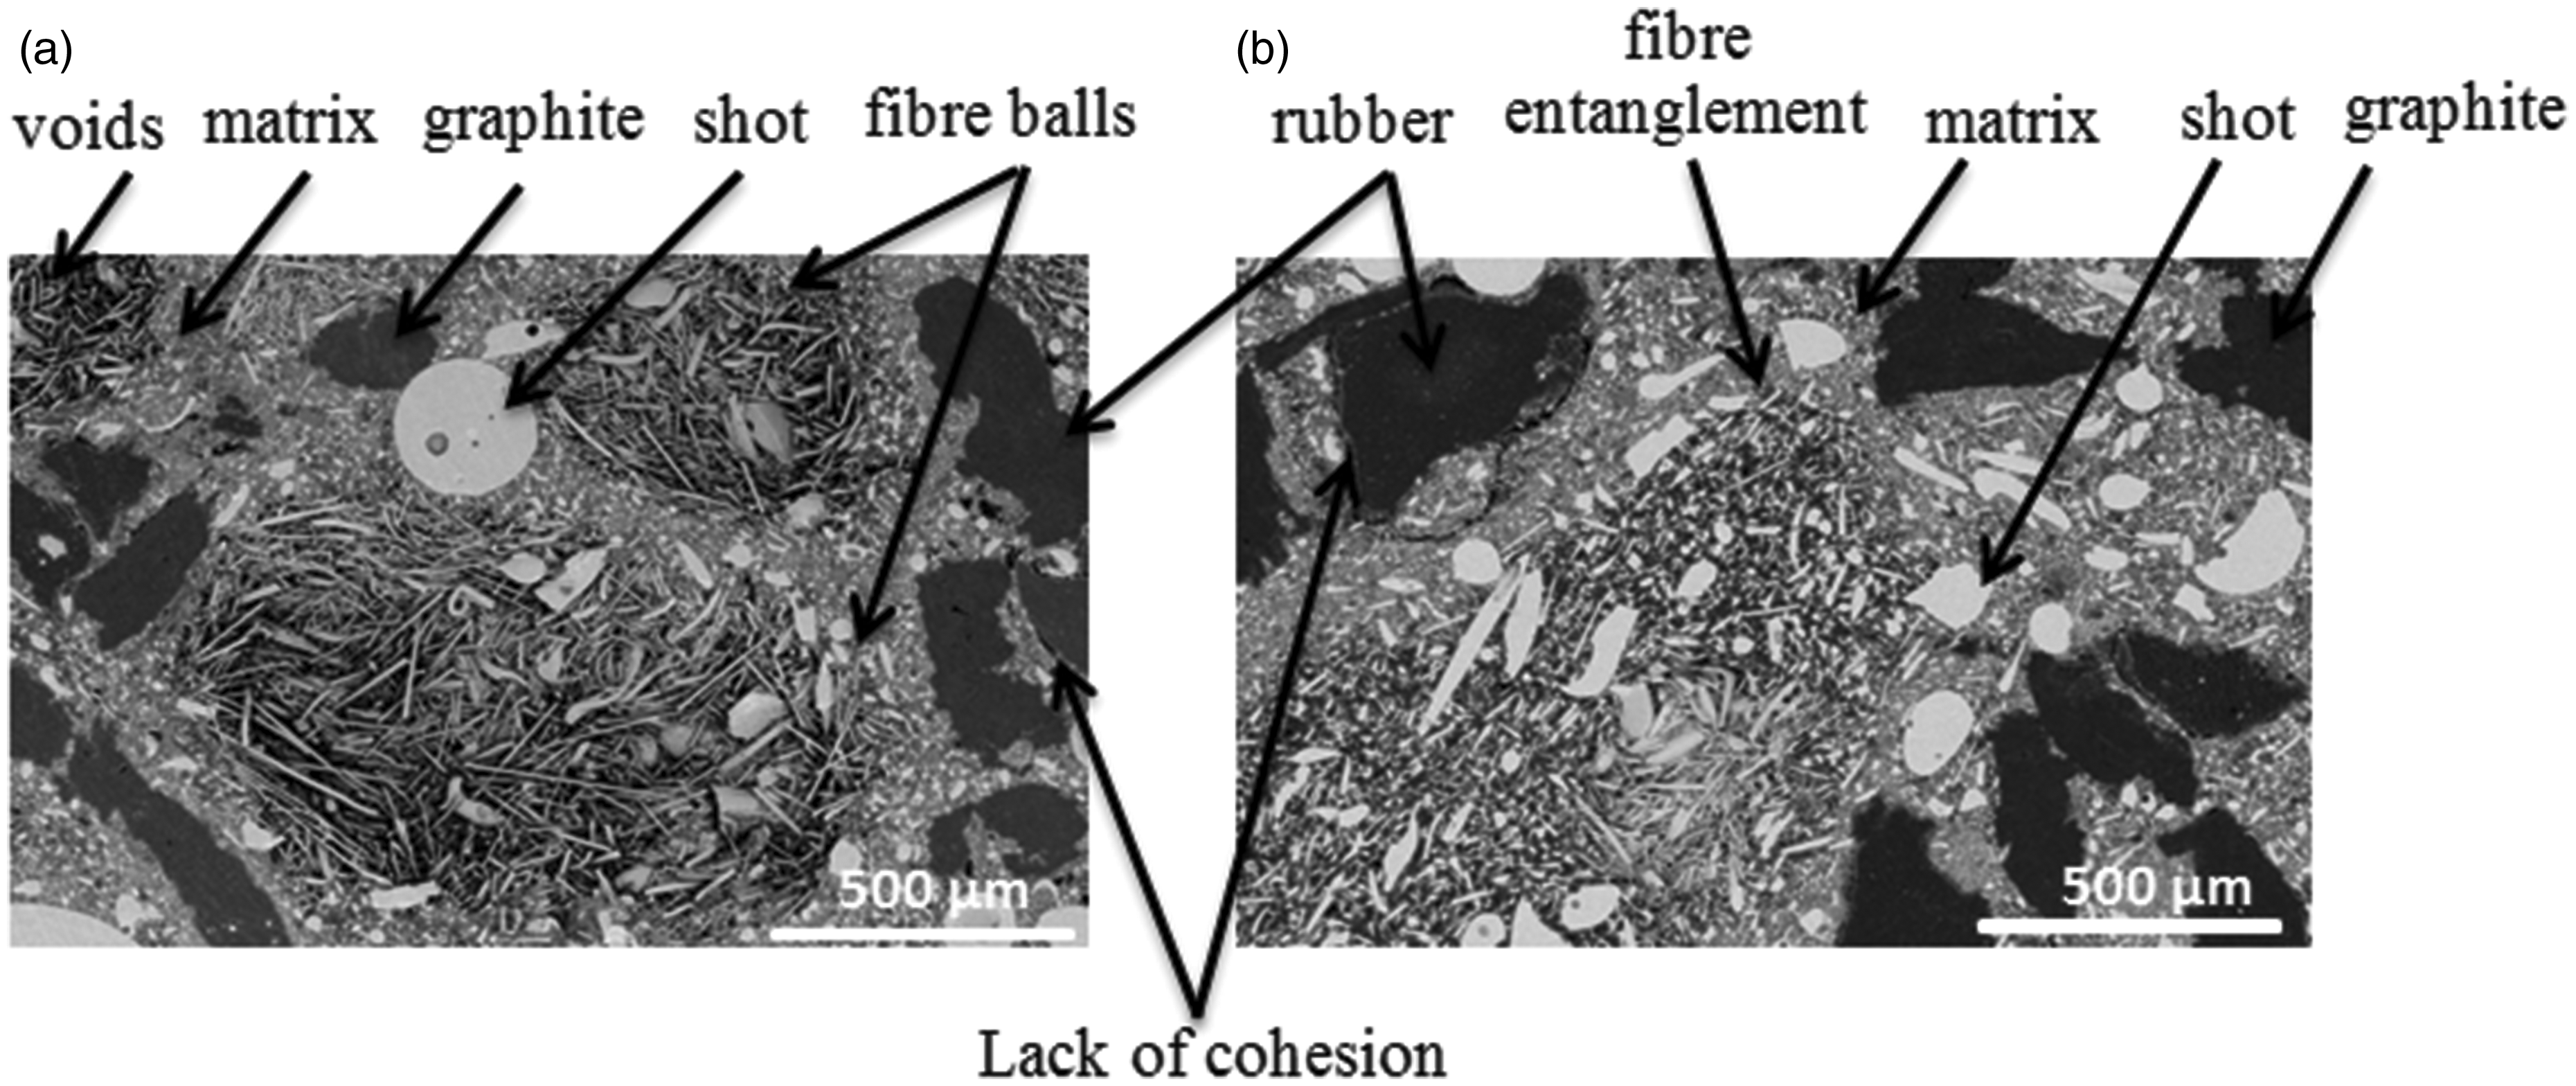
Microstructure of materials (a) A and (b) B (SEM secondary electron).
As shown in Figure 3(a) fibre balls of material A present voids between fibres. On the contrary, in Figure 3(b) material B fibre bundles appear to be more compact and to contain fewer voids. Besides, their outlines are indistinguishable compared to those of material A which have regular shapes. Moreover, fibres in material B are partially embedded in the matrix which creates two different resin-fibre interfaces (Figure 3(b)). On some parts of fibre entanglements, other composite material particles seem to be wrapped on (when fibres are isolated), whereas in other parts, these particles are less tricked (when fibres are tangled up). This may be explained by the fact that when fibres in material B are initially separated with calibrated size (< 400 µm), space between the isolated fibres and composite material particles is (more important) large. Therefore, fibre matrix adhesion is better established in this case. Microstructural characterization presented in Figure 4(a) shows the presence of regular size of rock- wool fibre balls which seem to be homogeneously distributed on the materiel surface of material A. Figure 4(b) illustrates that fibre entanglements are dispersed randomly on the material surface and present various sizes and morphologies. It should be noted that fibres in material B are tangled up again during mixing step and consequently lead to a variable size and irregular morphology of tangled fibres.
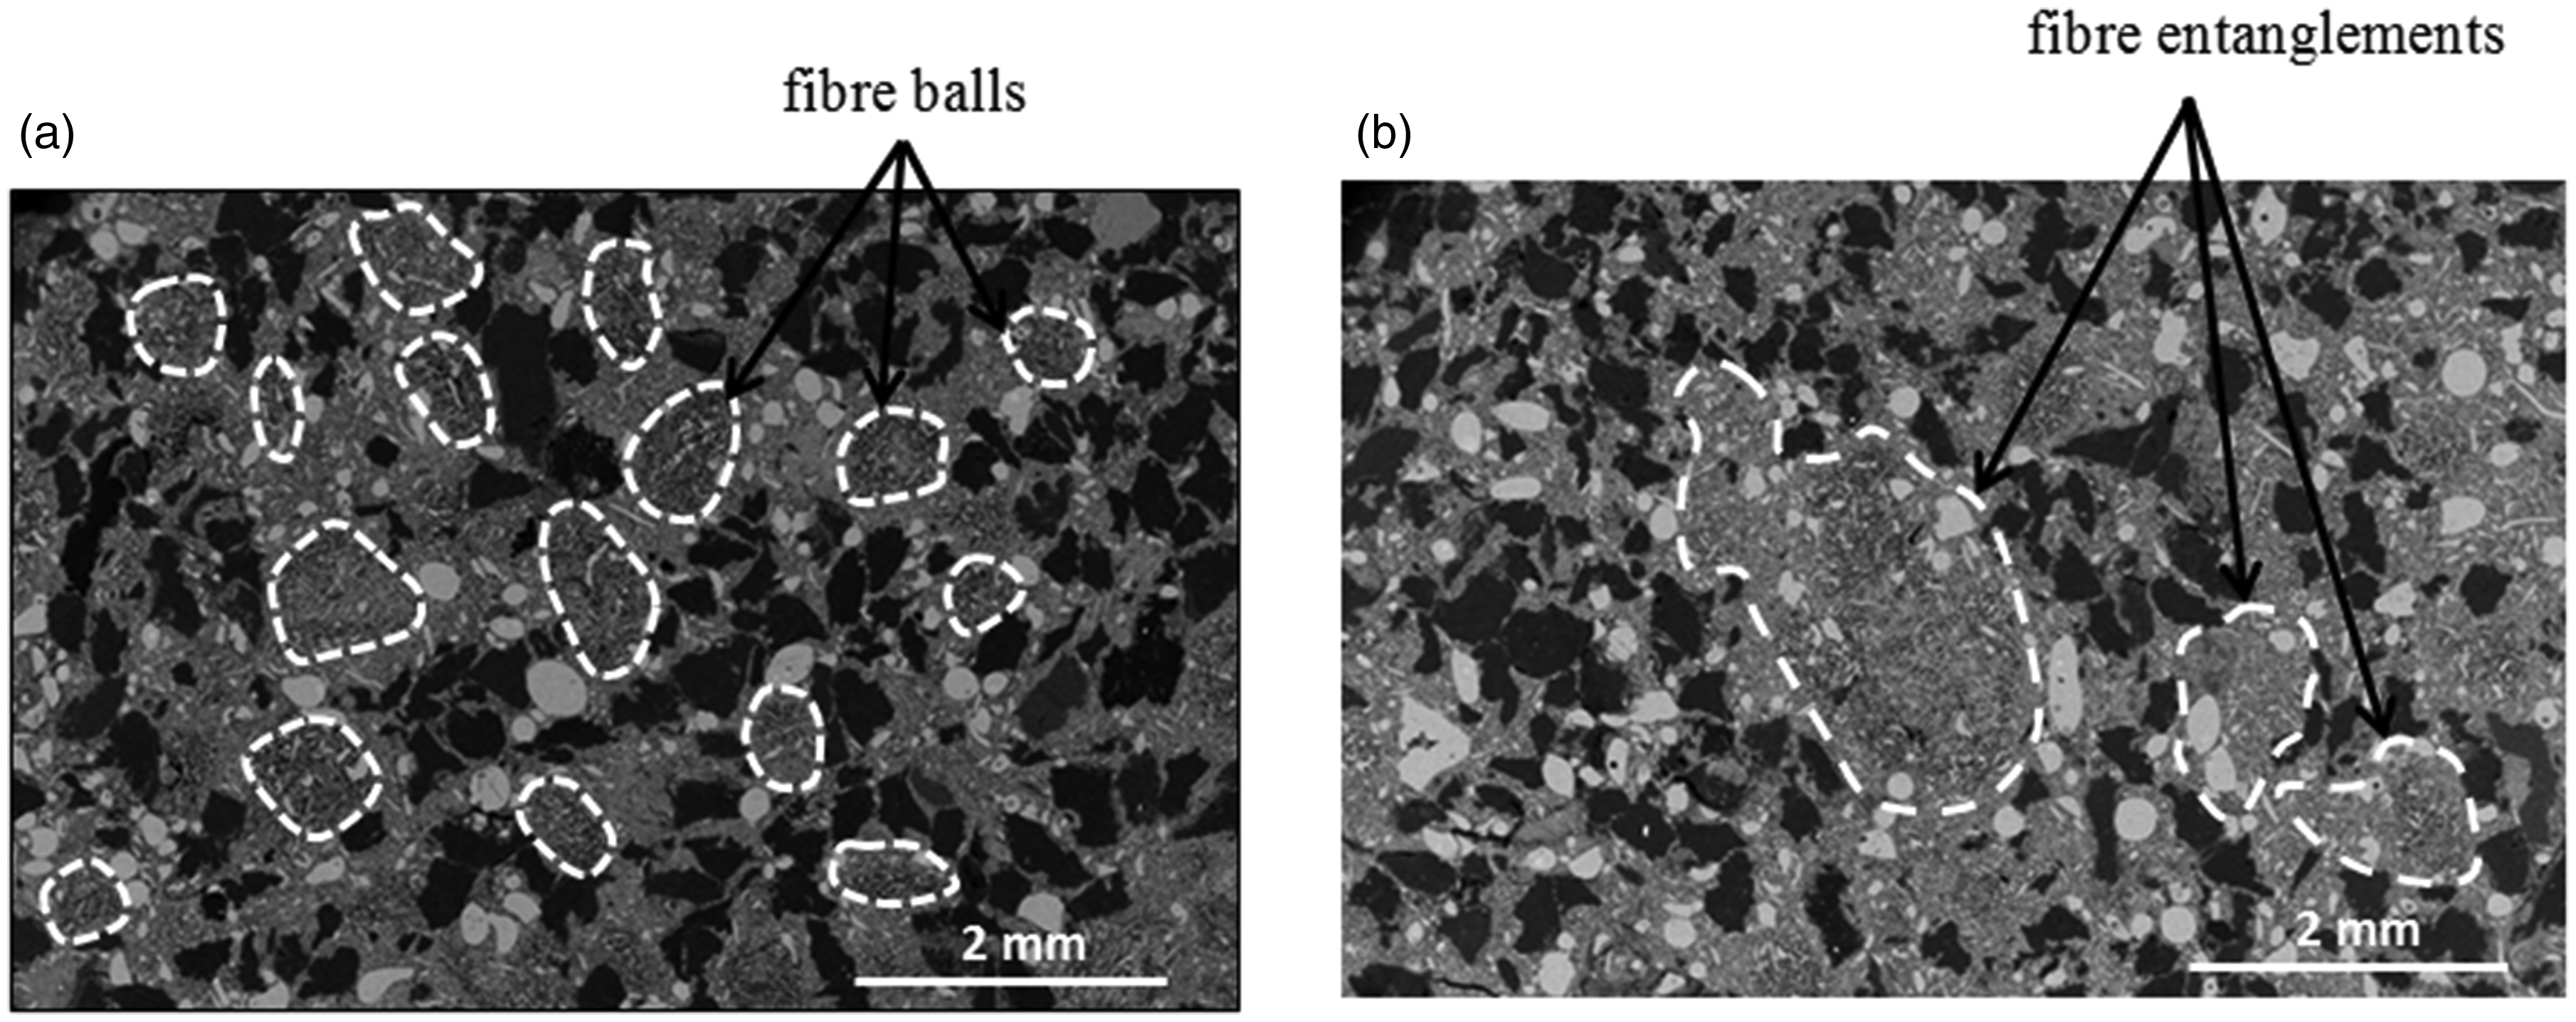
Fiber bundles: (a) even sized fibre balls (material A) and (b) uneven size of tangled fibres (material B) (SEM secondary electron).
3 D Microstructural characterization
Constituent arrangement and distribution in the volume
3D microstructural analyses are performed using X-ray tomography. This technique is based on the differences in X-ray attenuation values produced by differences in the density of the constituents within a sample. It provides reconstruction of the internal microstructure of the scanned sample. X-ray tomography was used for microstructure analyses of the two studied materials A and B. Cylindrical specimen with a radius of 6 mm and a length of 16 mm were extracted from each material in the normal direction (Z direction) and scanned using an X-ray microtomographic apparatus: Ultratom, RxSolution©. The X-ray beam energy used was 160 kV at 40 μA. Resulting volumic images have a voxel size of 4.4 µm3. Image J 1.46r software of the Wayne Rasband National Institutes of Health USA (http://imagej.nih.gov/ij) was used to analyze reconstructed images. This technique permits to evaluate particle distribution in the volume, internal microstructure, and defects and to highlight constituents of interest. To separate each of fibre balls and carbonaceous particles (graphite and rubber) from the other constituents, adequate thresholding, filters, and binary operators were applied. It should be noted that this step presented some difficulties caused by the similar gray scale intensity of constituents. Volumic particle distribution was determined by the constituent area fraction calculation of each scanned slice of the specimen length. In all 2 D slices and 3 D reconstructions, fibre balls/entanglements and carbonaceous particles are highlighted respectively in orange and green. Shots and matrix are marked with respectively yellow and grey colors. Voids are highlighted in red. 2 D longitudinal and orthogonal slices are presented respectively in the XZ and the XY planes. 3 D reconstruction in Figure 5 show that fibre bundles of material B have uneven sizes (Figure 5(b)) and are less numerous compared to A (Figure 5(a)).
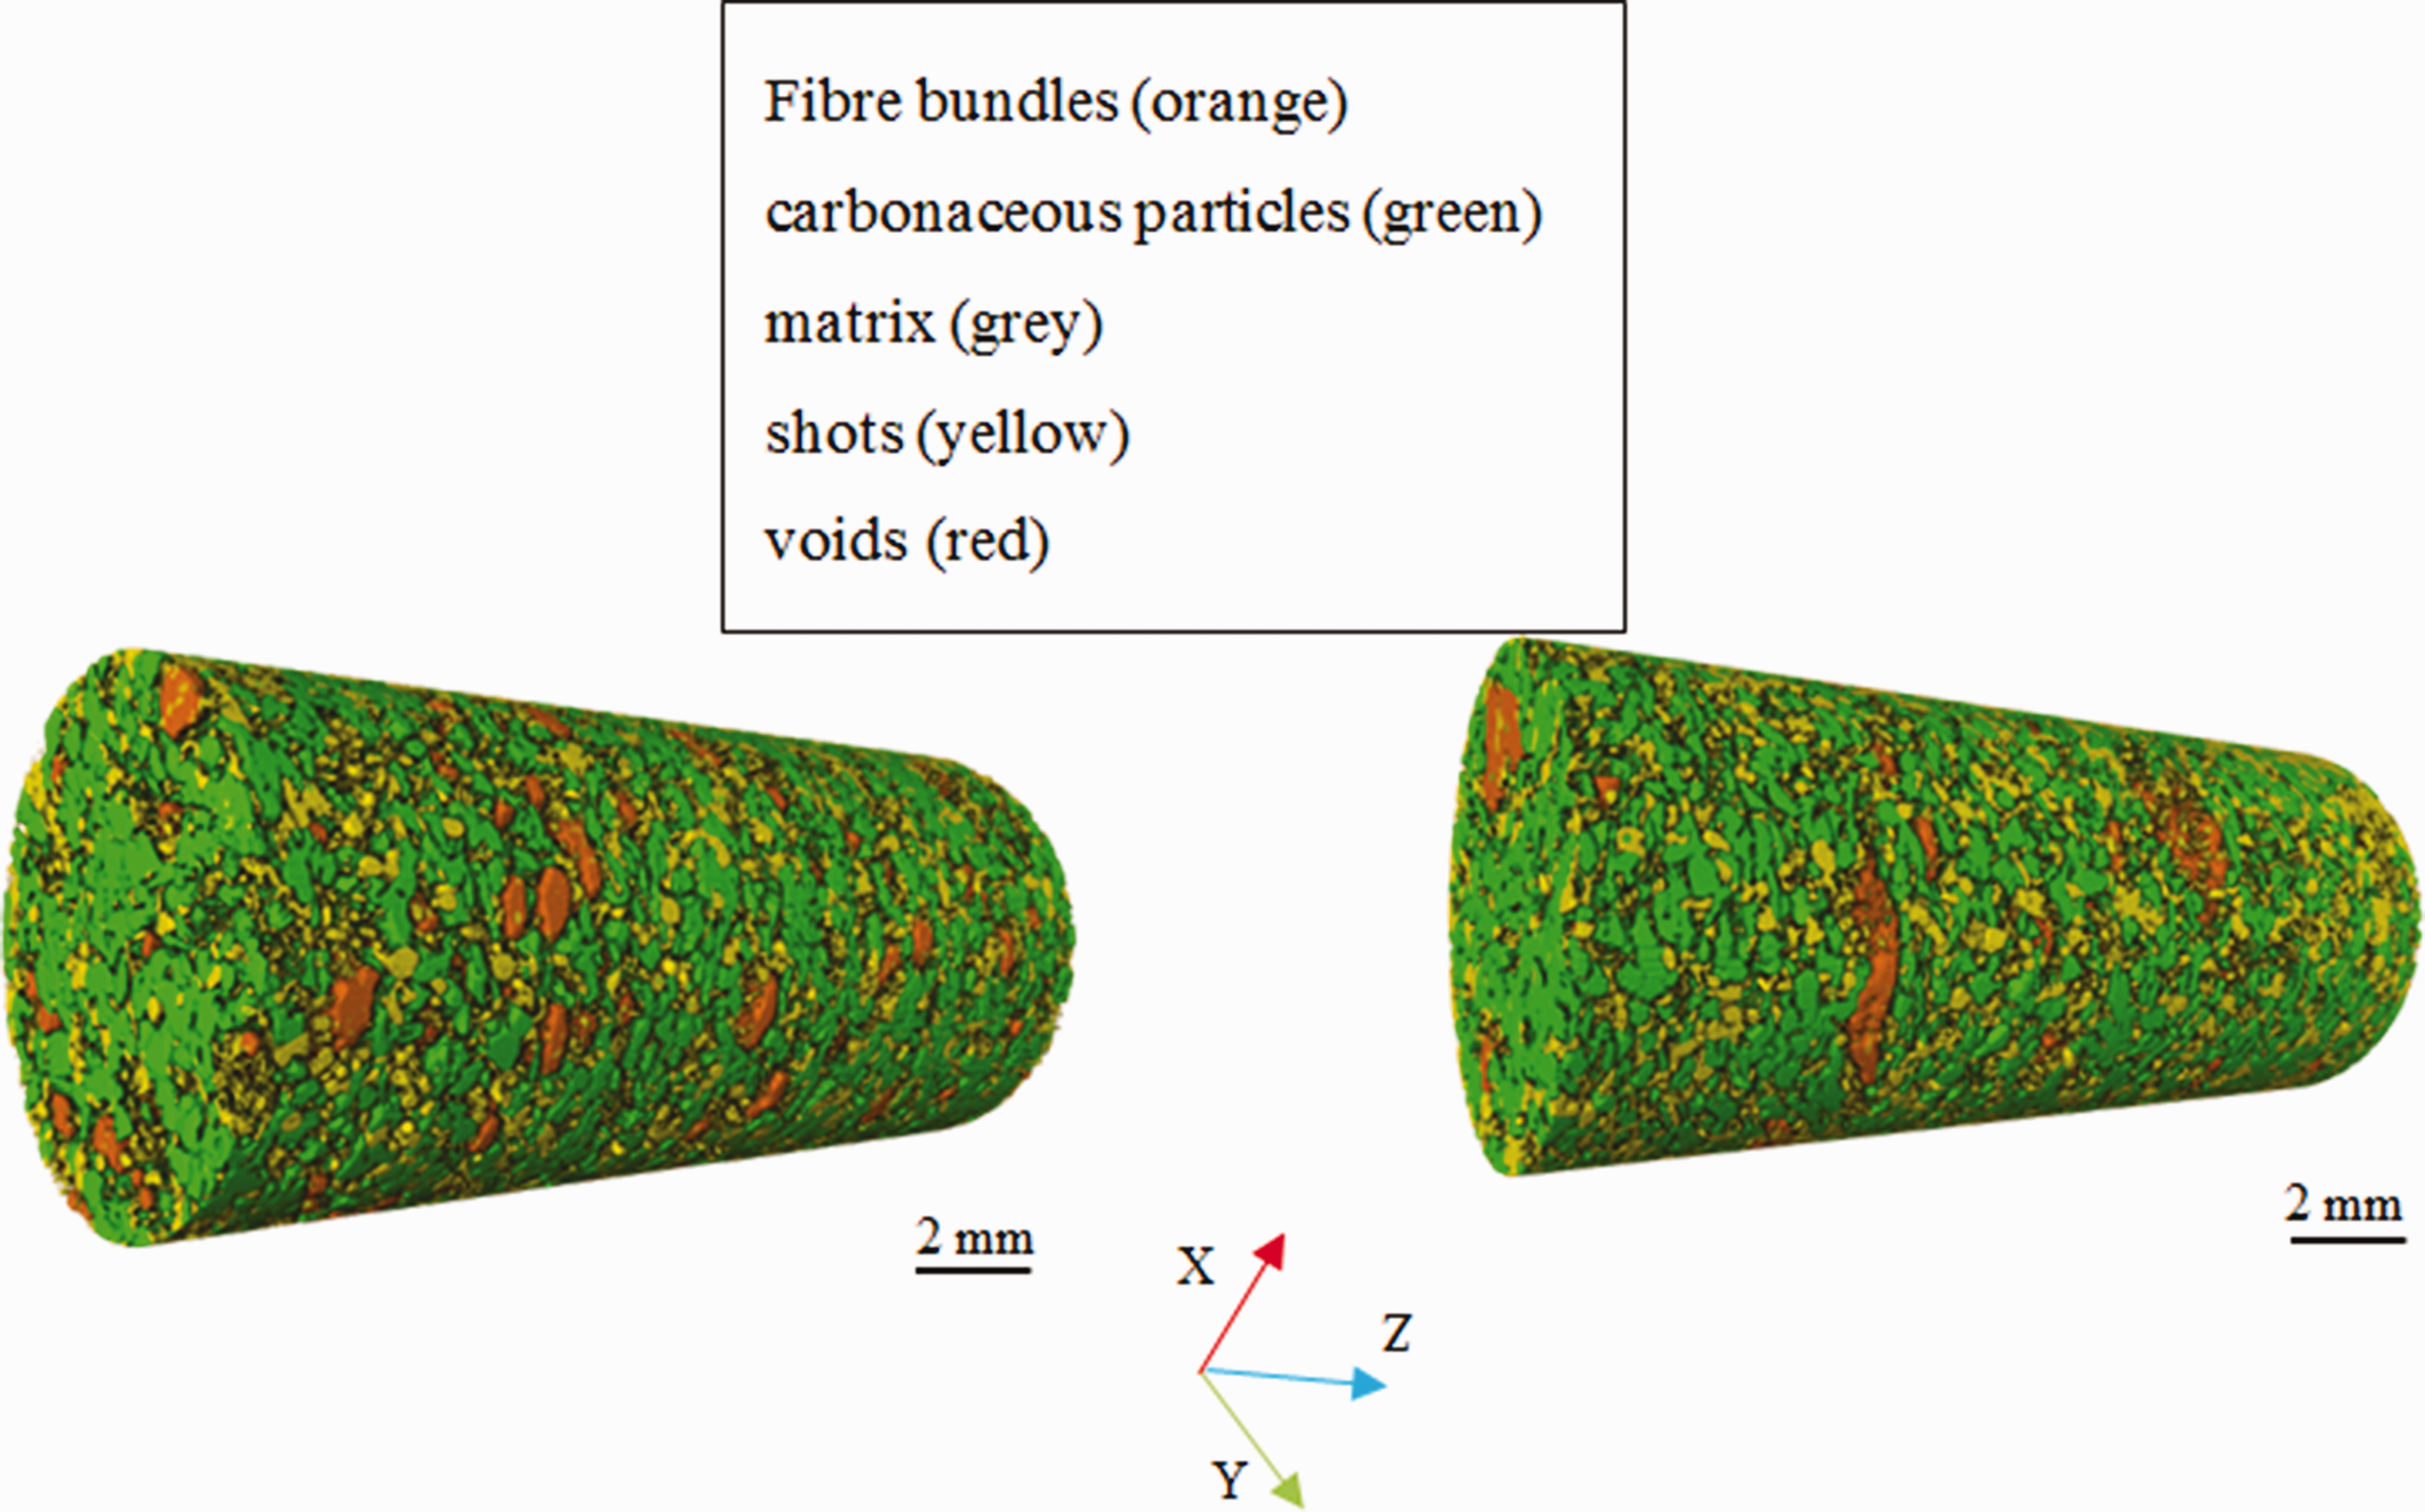
3 D ingredient distribution: (a) material A and (b) material B (X-ray tomography).
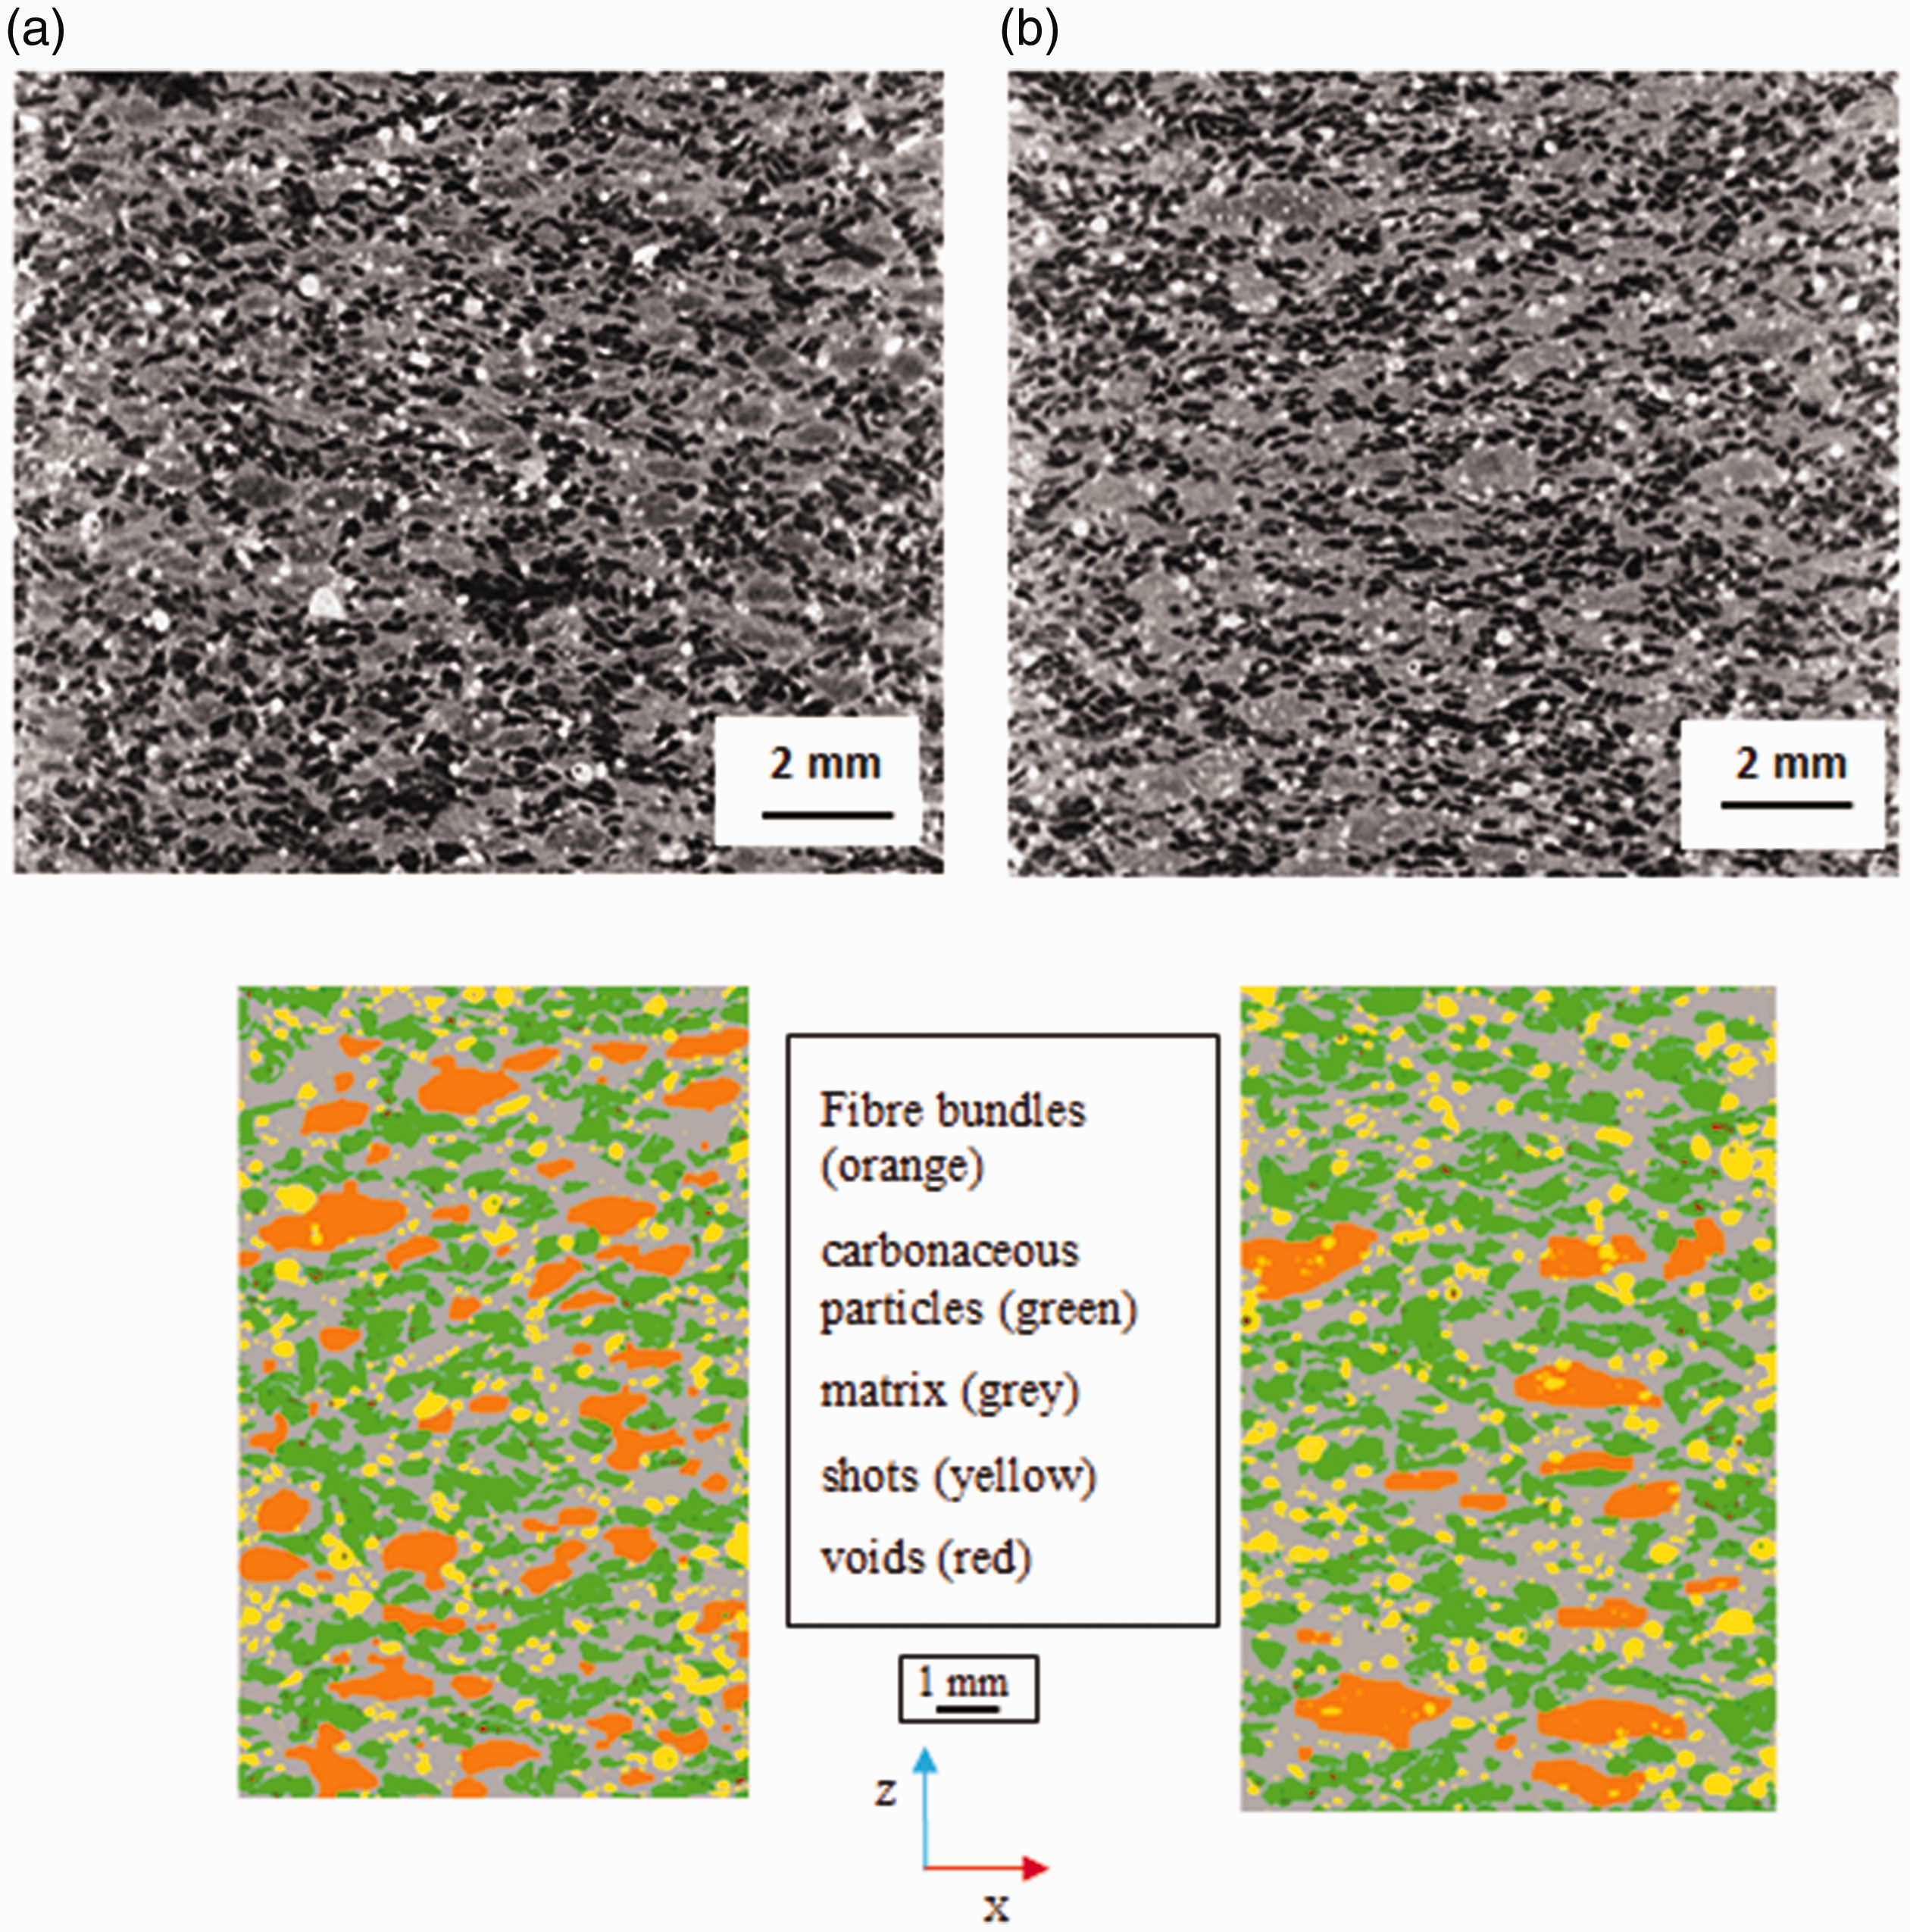
In Figure 6(a), fibre balls of material A are distributed more homogenously in the material volume than fibre entanglements in material B. In fact, in some areas, carbonaceous particles seem to be more numerous than others for material B due to the presence of variable size and shape of fibre entanglements (Figure 6(b)). This indicates that the resulted tangled fibres during the process present a wide and random distribution.
Ingredient distribution along normal direction (XZ plane): (a) material A and (b) material B (X ray tomography).
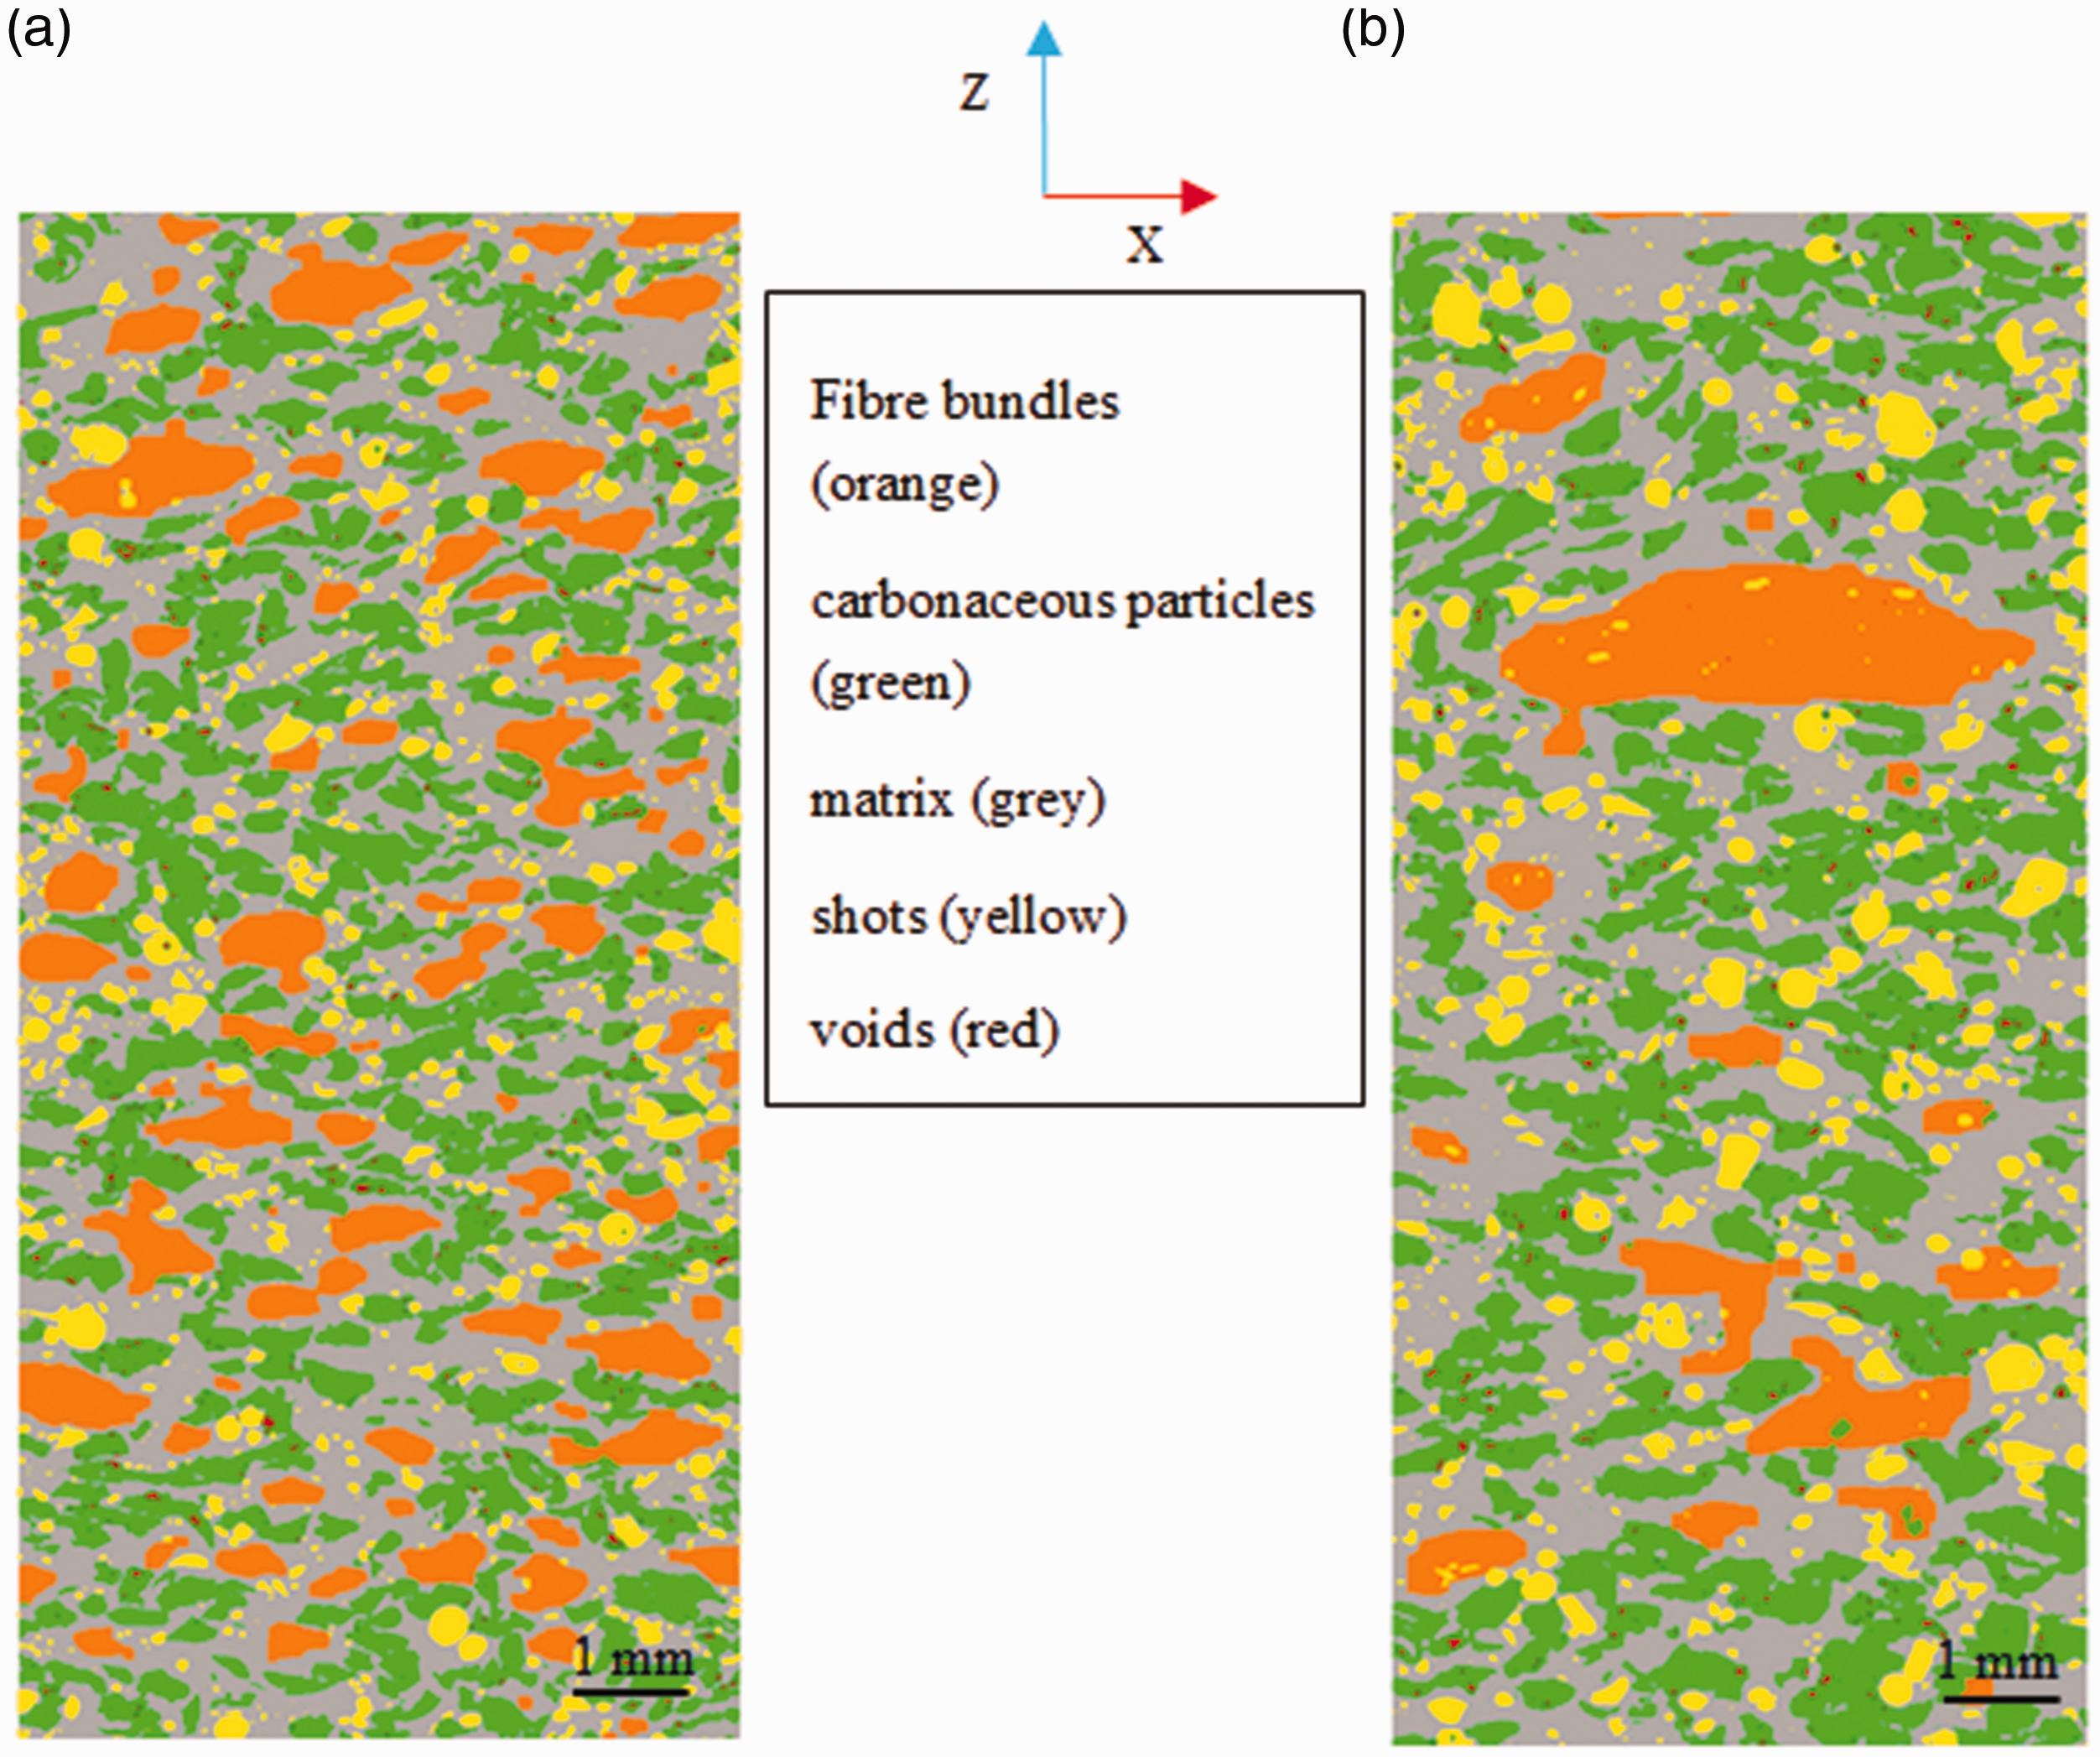
These results are more explicit in 2 D orthogonal visualizations of the two materials in Figure 7. In fact, it displays irregular shapes and size of material A fibre entanglements varying from 0.5 mm to 3 mm. For material A (Figure 7(a)) fibre balls present more regular shapes which did not exceed 1 mm. Besides, Figure 7(a) shows that carbonaceous particles have uniform repartition on each slice surface for material A. On the contrary, material B presents lopsided surface distribution of carbonaceous particles (Figure 7(b)).
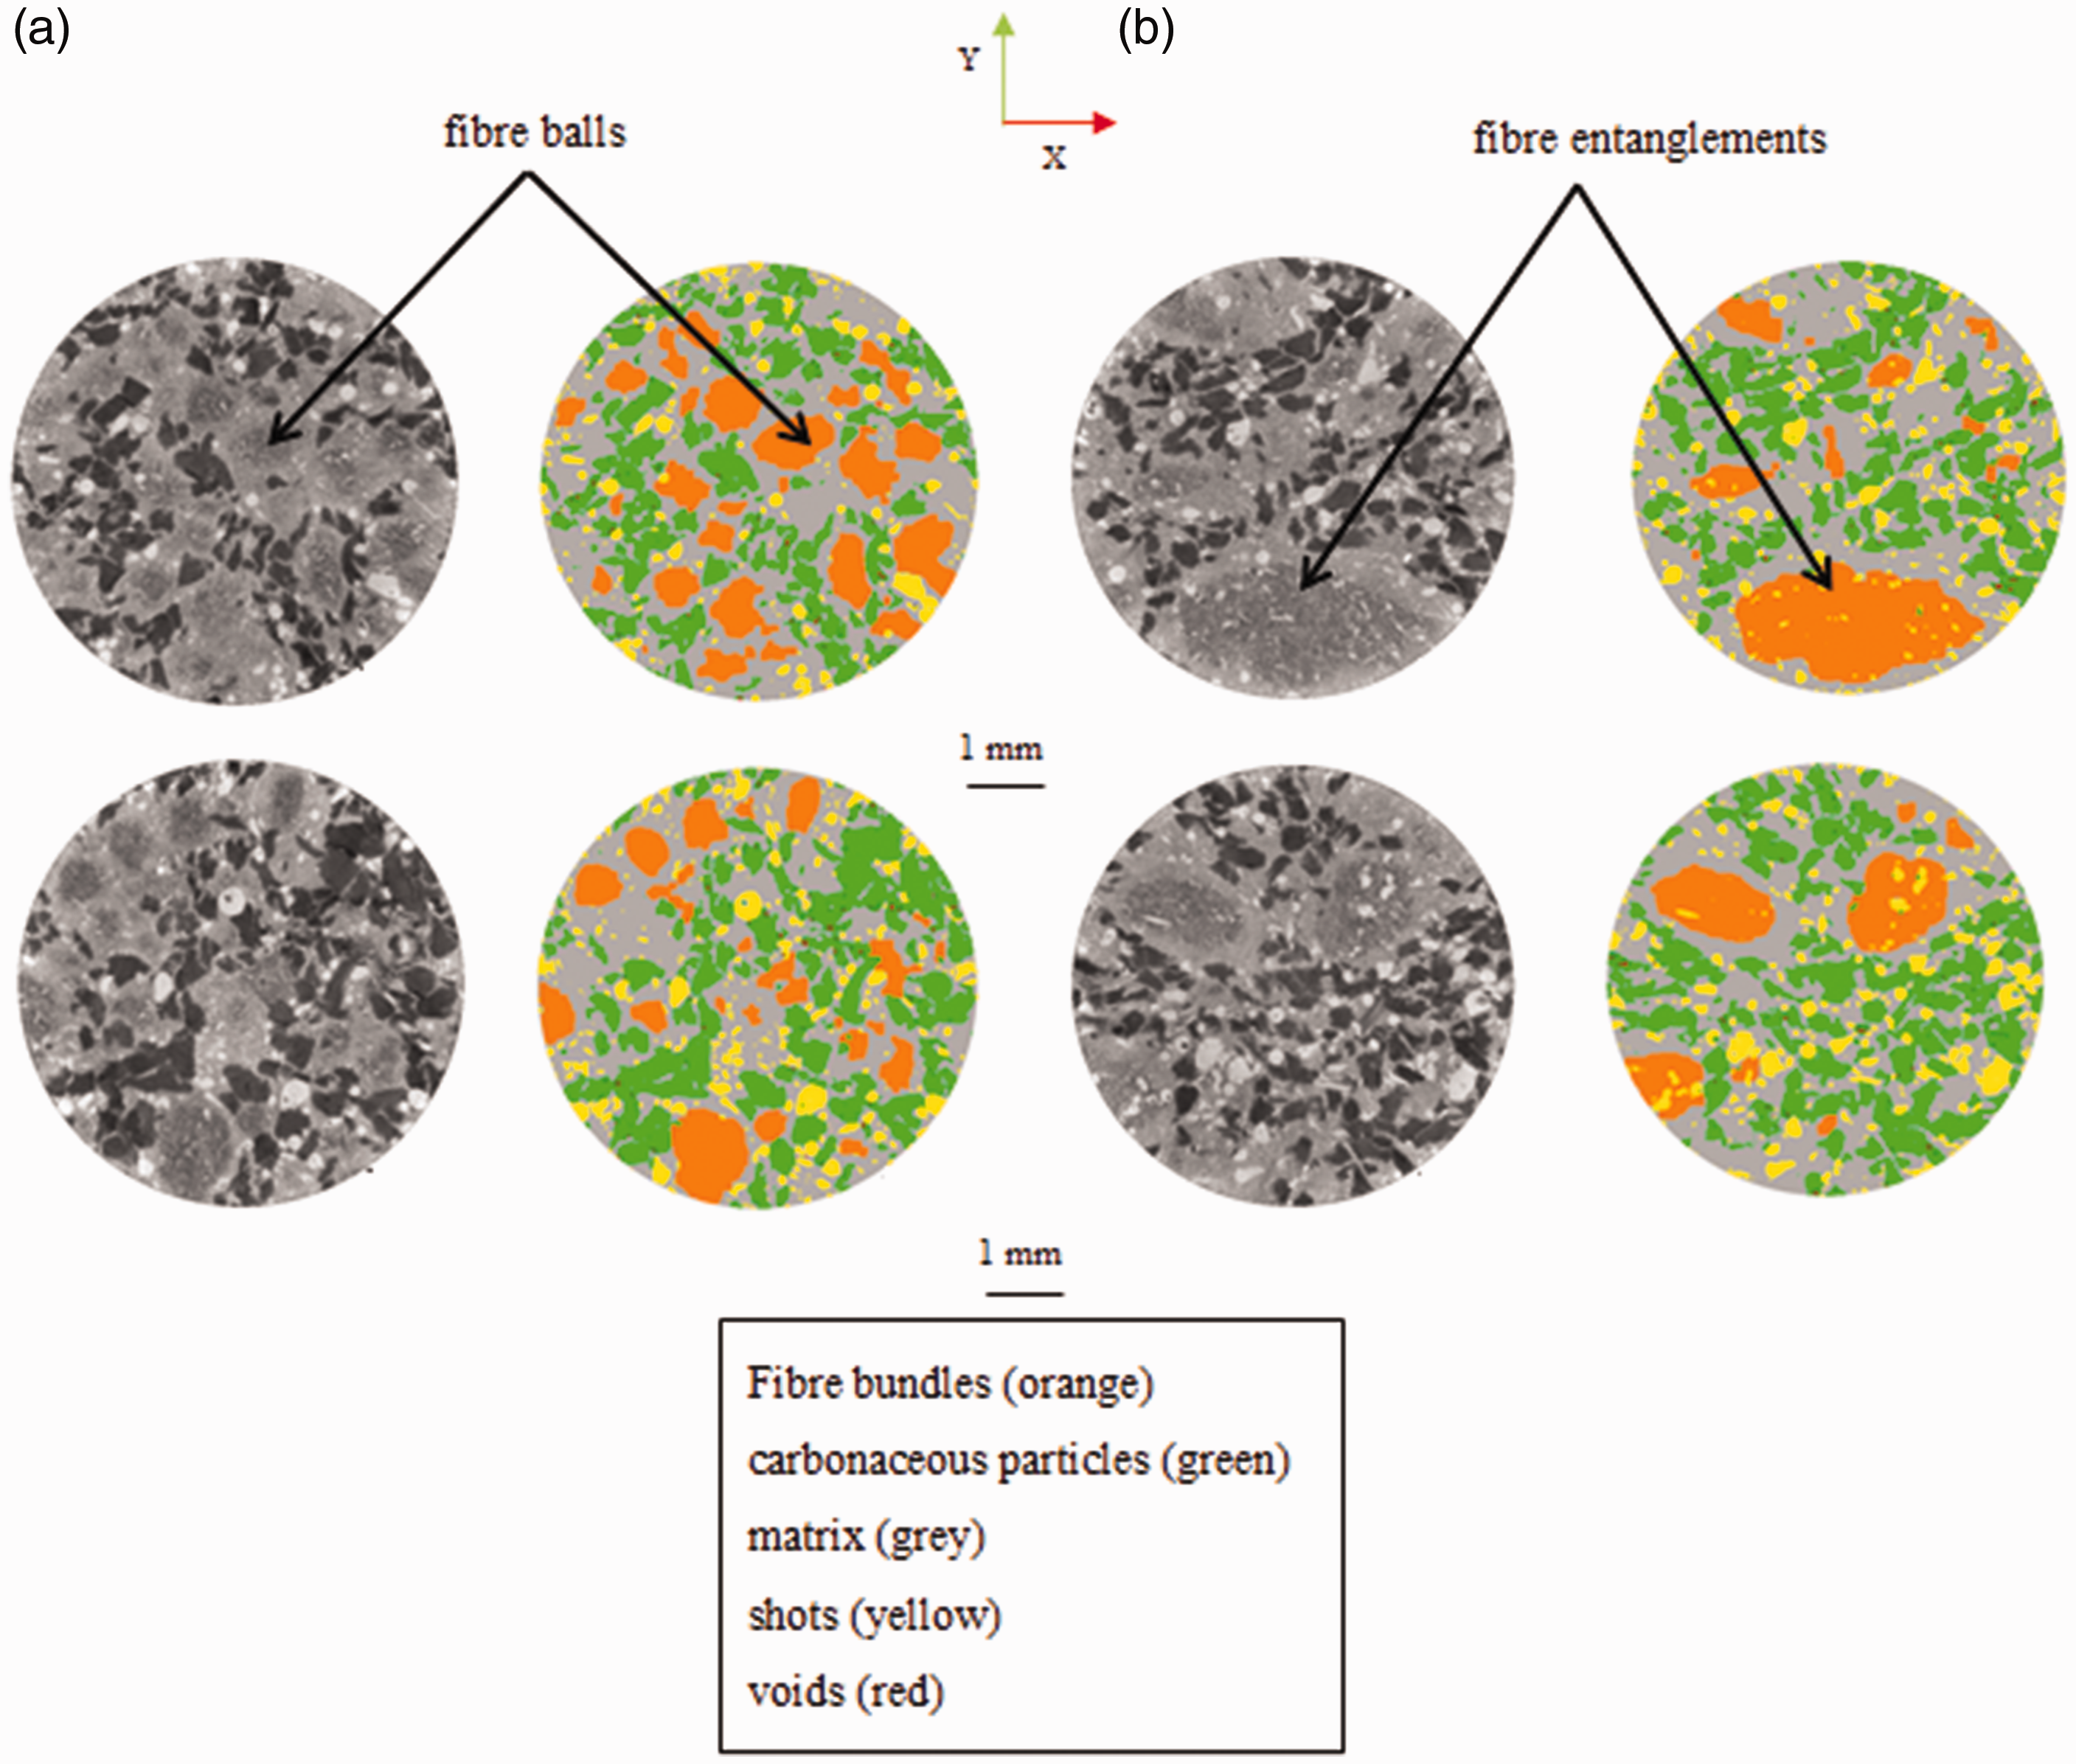
Distribution of components in the tangential plane (XY plane): (a) material A and (b) material B (X-ray tomography).
These observations are confirmed by results of area fraction of fibre bundles versus the cylinder length in Figure 8. Fluctuations of fibre ball volume fraction are more important for material B than those of material A. In fact, the standard deviation is more important for material B fibre bundle distribution with 5.16 compared to material A with 2.89 as shown in Figure 8(a) and (b).
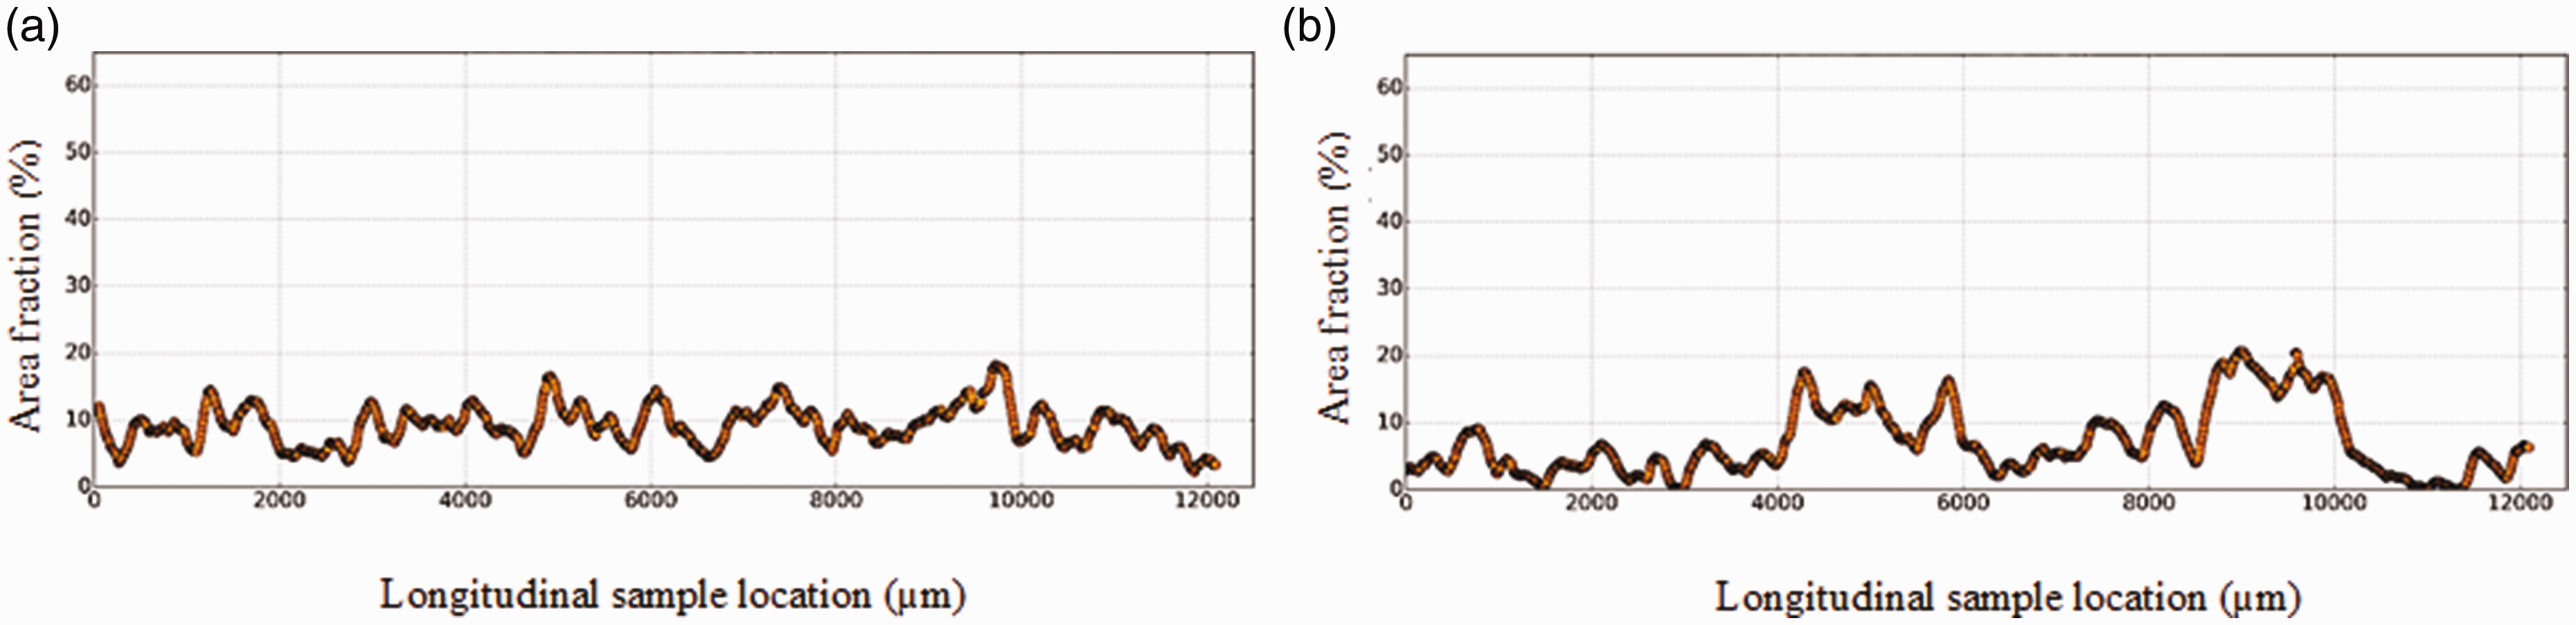
Fibre bundle distribution according to the longitudinal location Z along the sample, in (a) material A and (b) material B.
Besides, the calculated standard deviation of carbonaceous particle fraction area values is 3.91 for material B compared to 2.81 for material A (Figure 9(a) and (b)). This demonstrates that fibre bundle size and distribution has an impact on carbonaceous particle repartition on the material volume.
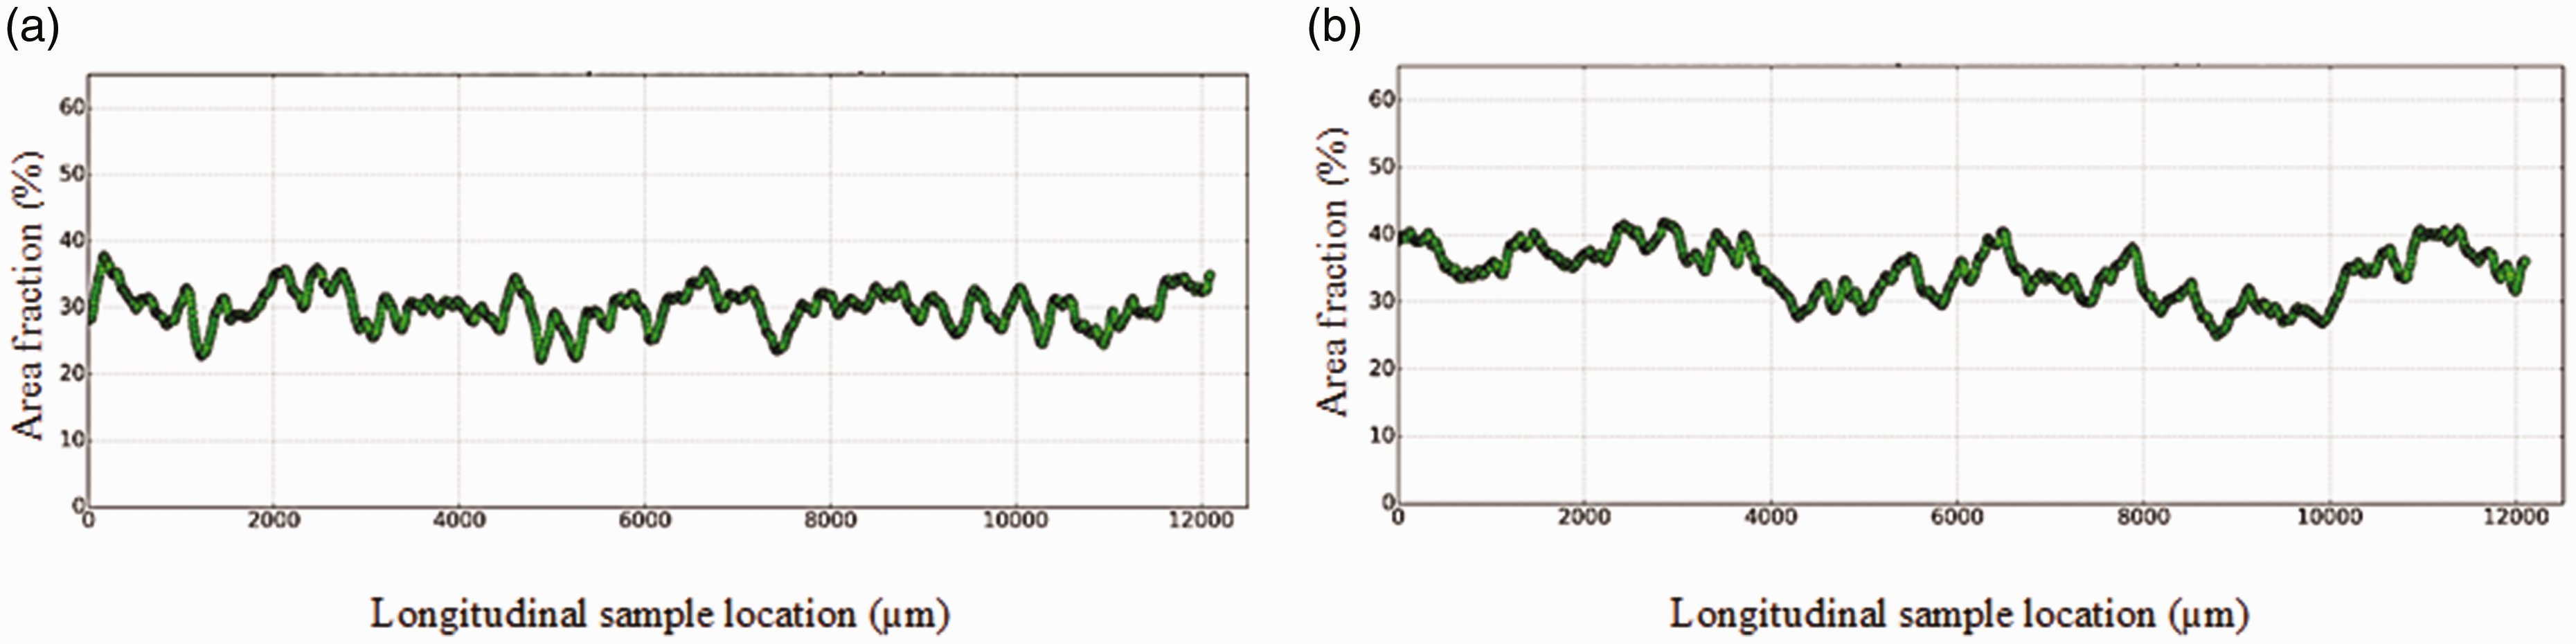
Carbonaceous particle distribution according to the longitudinal location Z along the sample, in (a) material A and (b) material B.
Particle repartition in the material volume in terms of inter-particle distance and spatial distribution was further investigated using 3 D visualizations. This latter was performed on samples with a radius of 16 mm radius and length of 16 mm. These specimens were sampled from the two materials and then analyzed using X-ray tomography. Figure 10 shows that carbonaceous particles are well distributed in all over material A regions compared to those of material B and constitute a network throughout the scanned sample.
Constituent spatial (XZ plane) distributions in (a) material A and (b) material B.
Figure 10(a) shows that particle-particle contact of carbonaceous particles is better established for material A. This indicates that the homogenous particle distribution namely that of fibre bundles contributes to a better contact between carbonaceous particles namely graphite. Besides particulate volume fraction of these particles seems to be more important in the different regions of material A volume which advantages the thermal conductivity. 14 In material B, more numerous graphite free areas are noticed since the irregular shape and the big size of fibre entanglements impact particle distribution (Figure 10(b)). Thus, inter-particle distances of graphite are more important and these conductive particles/matrix interfaces are more numerous. In this case, the plenty of matrix areas behave as barriers to the heat transfer. 15 Thus, heat acquired by material B material will take a longer time to diffuse through the thickness of the sample.
Size and shape distribution of fibre bundles
X-Ray tomographic data can be treated to extract information on size and shape of fibre bunles in the sample volume. Fibre bundle size expressed by their equivalent diameter are ranging in 180-900 µm for material A (Figure 11(a)), while for material B they are in the range of 250-1600 µm with few particles of size higher than 1 mm. Figure 11(b) confirms that fibre bundles have a random size distribution in material B volume.
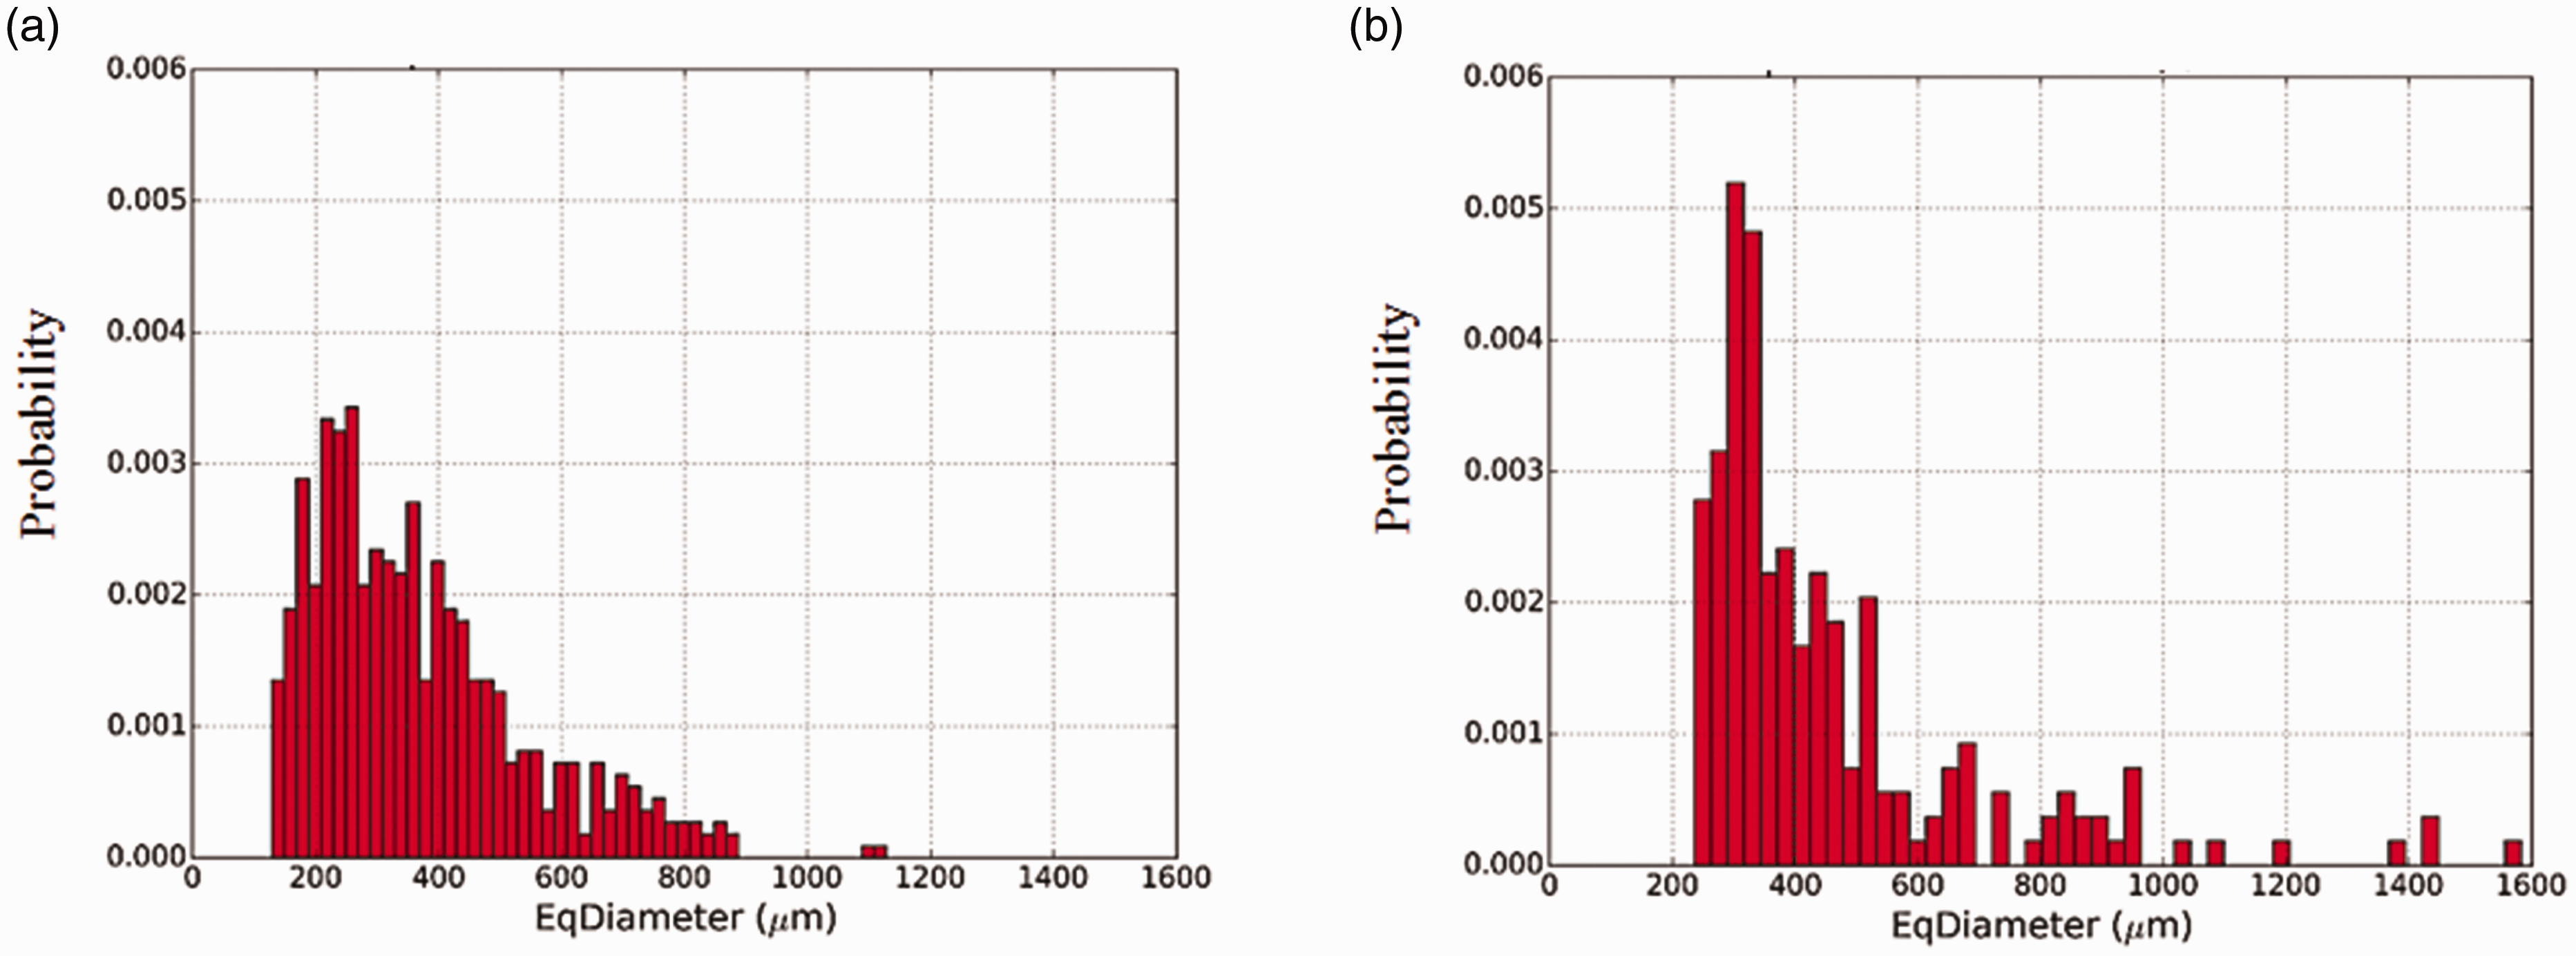
Equivalent diameter of fibre bundles in (a) material A and (b) material B.
Feret boxes are defined as the bounding box consisting of two orthogonal Feret diameters. Figure 12 illustrates the Feret diameter in the X against Z direction. For material A, fibre bundle shapes appear to be less ellipsoidal than those of material B (Figure 12(a)). Figure 12(b) shows that fibre bundles in material B presents mostly elongated shapes in the X direction.
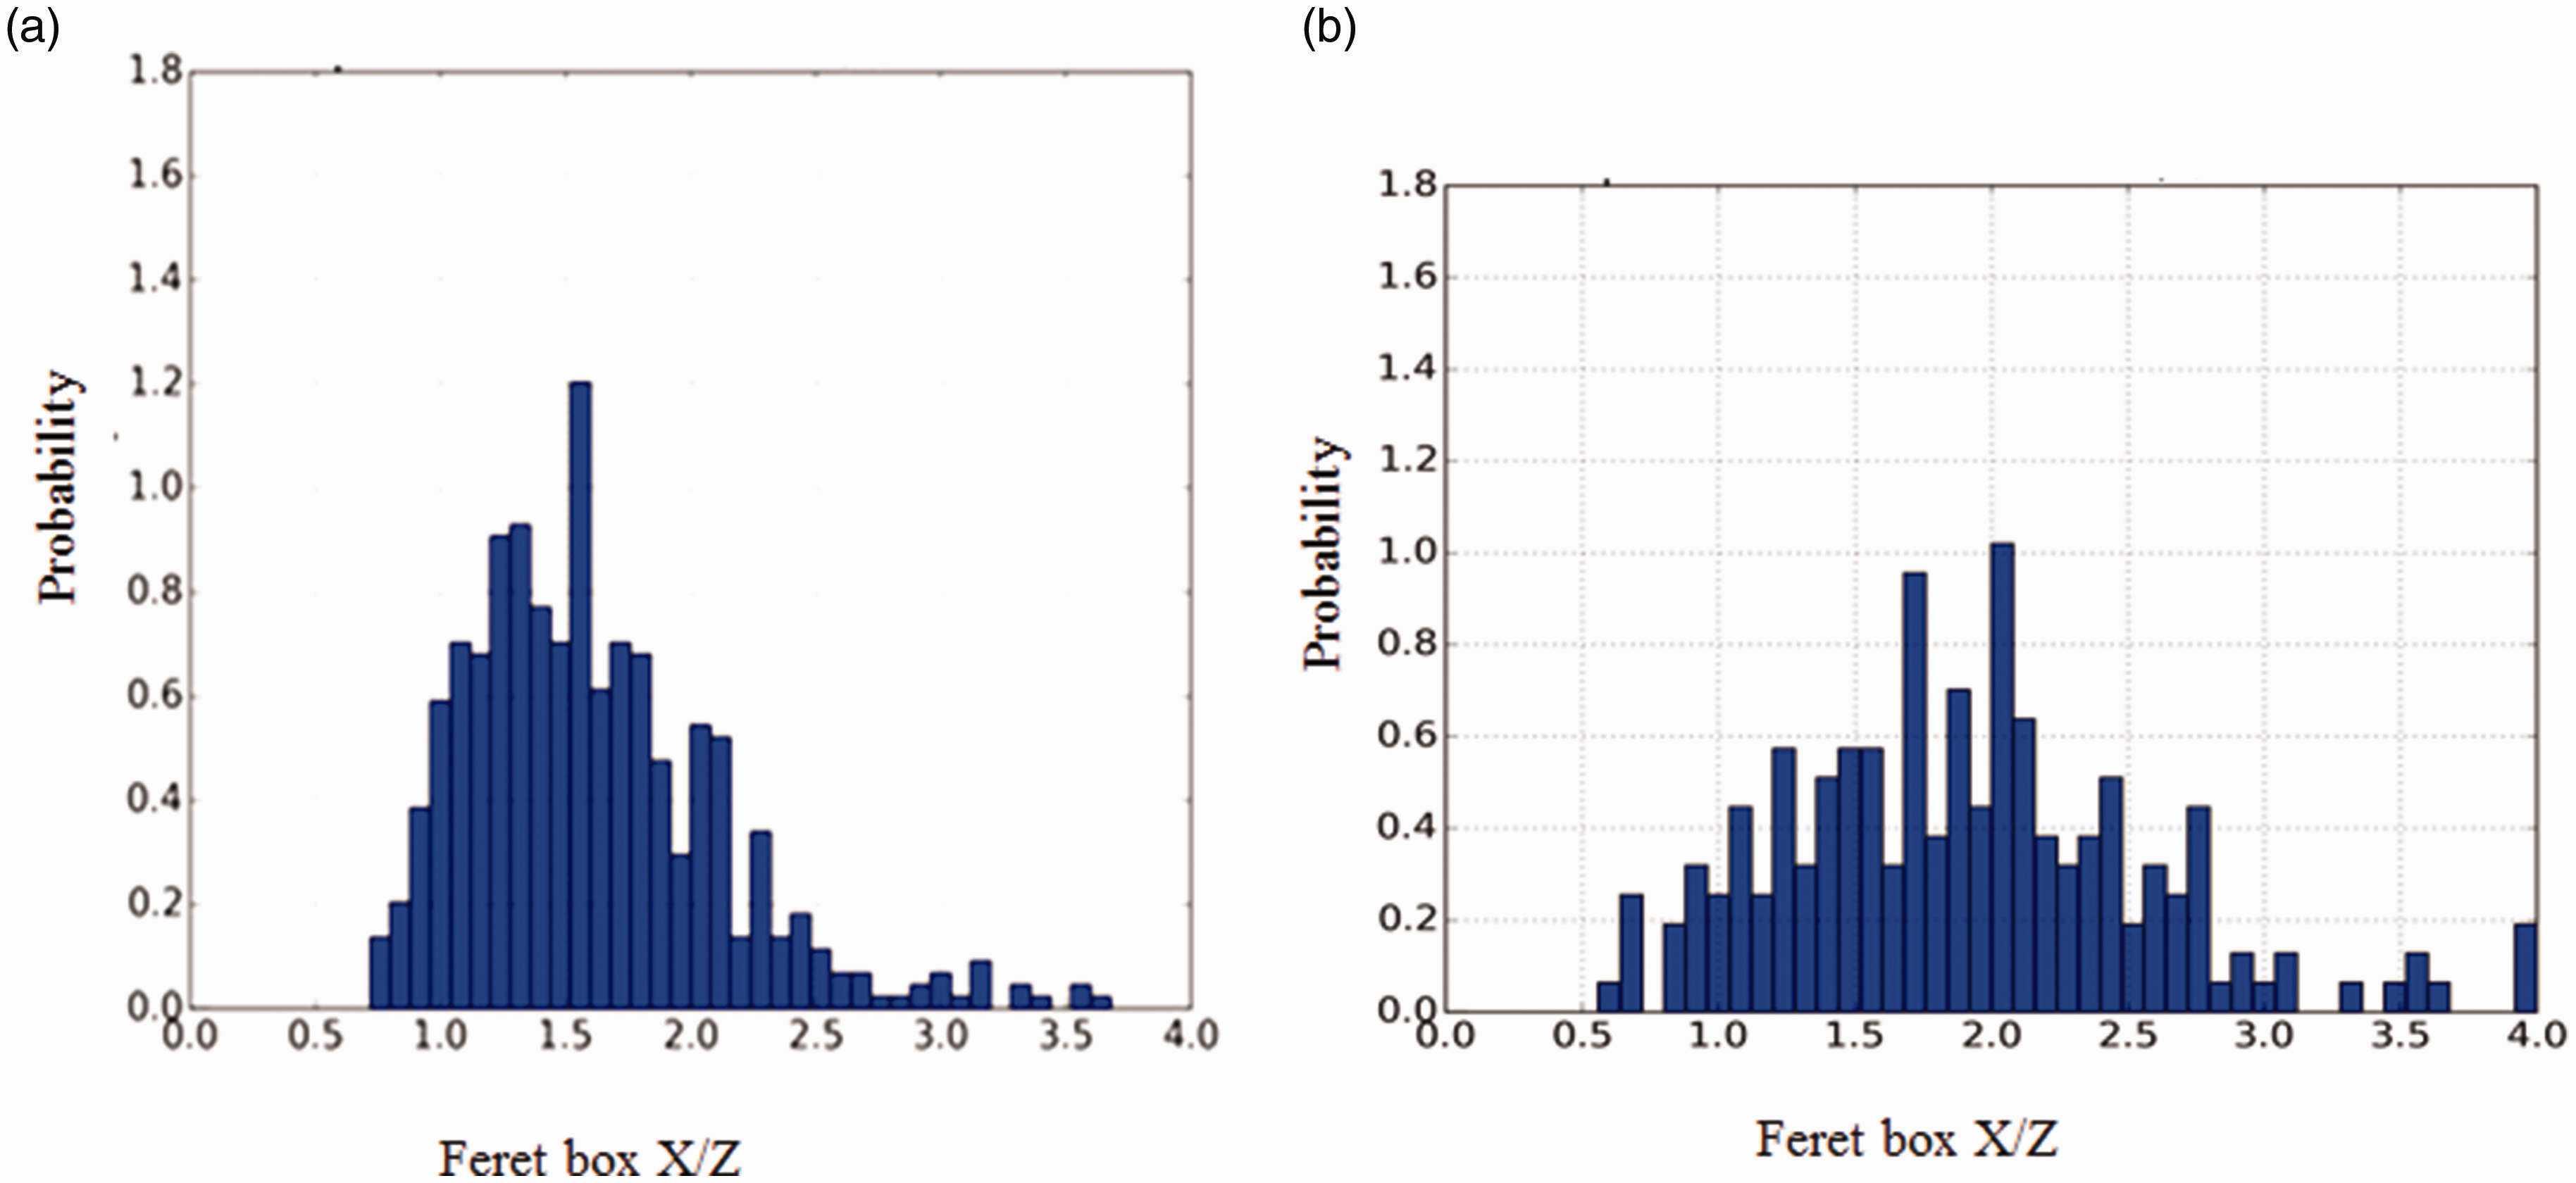
Feret boxes X/Z of fibre bundles in (a) material A and (b) material B.
Impact on thermo physical and mechanical properties
Thermo physical characterization
Composites were characterized for physical (density and theoretical porosity) and thermo physical (thermal conductivity and thermal expansion) properties. Density was measured using Archimedes’ principle. Samples were first weighed in air and then in water using a Mettler Toledo electronic balance with 0.5 g accuracy. Porosity was calculated using the following expressions:


Where ρm is the bulk specific density, g/cm3, mi is the weight, %, of each constituent of the formulation, g, and ρi is the absolute density of each constituent of the formulation g/cm3. Thermal Expansion 
Three specimens of each composition were measured, and an average value was reported, with a standard deviation value (Table 3).
Thermo physical properties of for material A and material B.
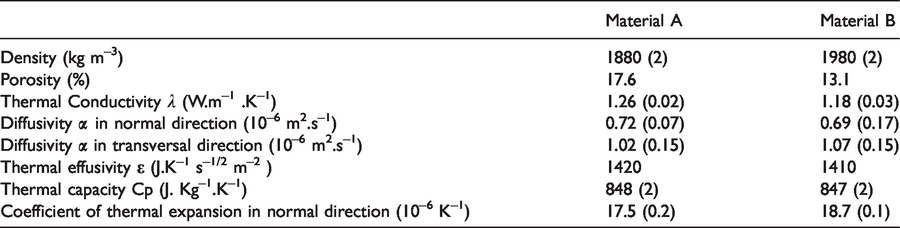
As microstructural analysis showed in ‘Microstructural investigation’ section, fibre matrix adhesion is better developed in some parts than in others in material B. This may be responsible of the higher values of thermal expansion. According to Table 3, material A has a lower density and a higher porosity than the second material. This may be related to the lower density of fibre balls and the large number of voids inside them. Results show that thermal conductivity and effusivity values are higher for material A than those of material B. The first material presents higher thermal conductivity thanks to its carbonaceous particle distribution which presents a reduced inter-particle distance. On the contrary, for material B, the high photon scattering induced by the plenty of the insulating matrix areas impacts the thermal resistance. It should be considered that thermal conductivity depends highly on the anisotropy of the material. 16 In fact, this property is affected by the distribution and orientation of conductive particles in the material. Diffusivity is higher in transverse direction for the two materials.
Mechanical characterization
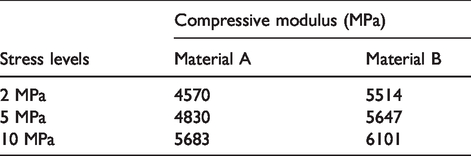
Mechanical characterization consists on a compression test. Three stress levels of 2, 5 and 10 MPa were applied to the sample. The application of each stress level was performed five times. The speed of plateaus displacement is 0.01 mm/s. 11 Digital Image Correlation (DIC) method was used to provide a full-field information and to identify strain/stress localization.17,18 Post treatment of all results was performed using a Digital Image Correlation platform (http://yadics.univ-lille1.fr/). For this test, specimens have parallelepiped form with a dimension of 20 mm and a height of 16 mm. Specimens were machined in the normal direction to the plane of brake lining. Compressive modulus is determined using measurement of displacement and strain fields. According to Zhang, secant modulus present indicators of elastic and damage contributions. 19 Strain fields given in the compression direction (Ezz (%)), for 10 MPa, are illustrated in Figure 15. The resulting compressive modulus of the two materials are given in Table 4. We notice that this modulus increases with load for the two materials, but stiffness is different for each material. Moreover, these results reveal that the lower the load, the higher the stiffness difference is.
Compressive modulus obtained for different stress levels of material A and material B.
Link between microstructure and thermo physical and mechanical properties
Results of thermo physical characterizations show that fibre arrangement and size have an impact on thermal and physical properties. The higher values of thermal conductivity of material A can be explained by the homogenous particle distribution of its constituents especially that of carbonaceous ones. When conductive particles, namely graphite, are more homogeneously distributed and well-connected in the volume, they create conducting bridges leading to a shorter path for the heat conduction. 20 For material A, the homogeneous repartition of fibre balls and their regular bulky form impose to other constituents, namely the carbonaceous ones, to cluster in small interstices. These clusterings create bridges between the thermal conducting particles in the material volume and provide shorter heat conduction paths, which improve thermal conductivity (Figure 13). As shown by the 3 D analyses in ‘Microstructural investigation’ section, inter-particle distance of carbonaceous particles is bigger for material B. Besides, the presence of big fibre entanglements in material B may constitute an insulator barrier which affects the material conductivity. According to Krause et al., 14 the larger the mean inter-particle distance (between two conductive particles), the lower the average thermal conductivity is. Microstructural analyses show that fibre ball distribution is more regular and reduces the mean inter-particle distance between carbonaceous particles. Besides, their small sizes are much less disturbing for the heat transfer. However, fibre entanglements for material B with their big size and with matrix big areas behave like barriers to the heat transfer, playing an insulating role for thermal conductivity. In fact, these areas scatter phonons considerably. Therefore, thermal resistance is reduced due to the big inter-particle distance between the conductive particles (Figure 13(b)).
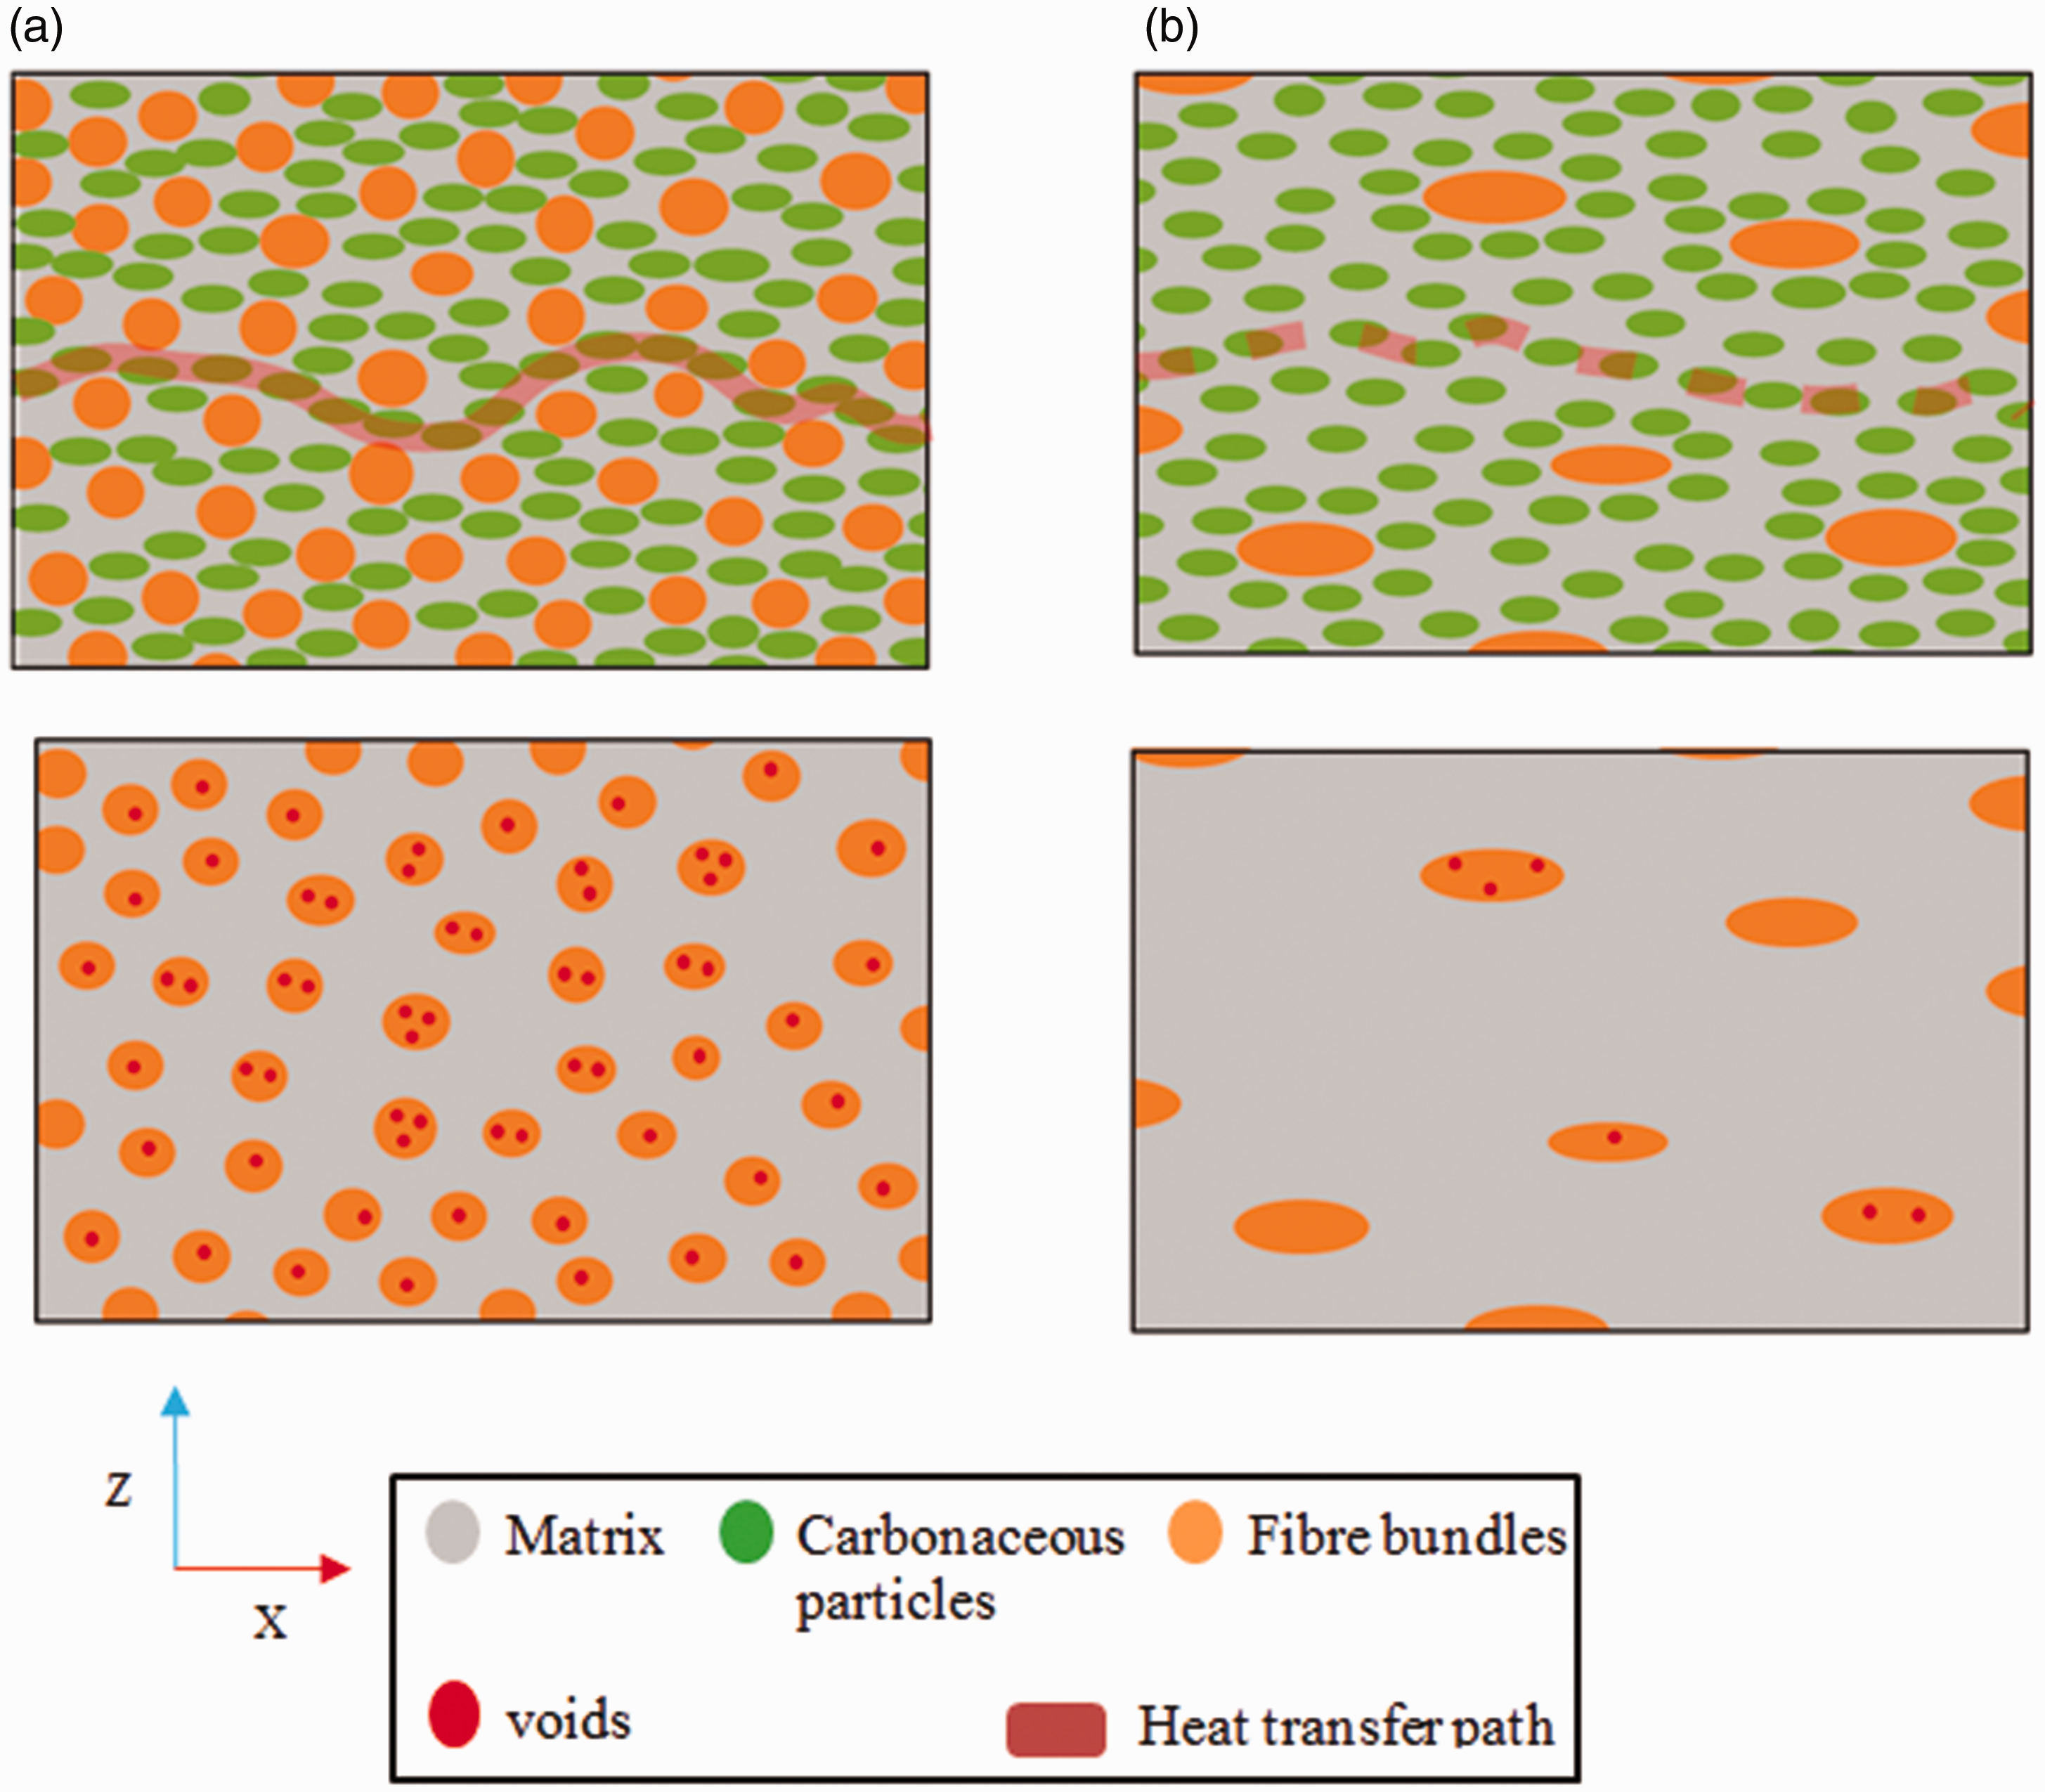
Schematic presentation of carbonaceous particles spatial distribution and heat transfer paths: (a) material A and (b) material B.
Thermal expansion may be related to matrix/fibre bundles interface which was better and more homogeneously established for material A. The low cohesion, noticed for material B, lead to fibre sliding. Moreover, orientation and morphology of fibre bundles may affect this property.8,21 In fact, when this clustering of fibres is flattened in normal direction, fibres are mostly oriented in transversal direction and do not lock thermal expansion, thus dilatation is boosted. For material B, fibre bundles are more flattened compared to those of material A, which can explain its higher sensivity to thermal dilatation. These results agree with several research2,22,23 which confirm that fibre distribution affect thermal properties of composite materials. Diffusivity depends on graphite particle orientation. When these latter are oriented in the parallel direction of the heat transfer, diffusivity is higher. 16 This is the case for the two investigated materials, diffusivity is higher in the transversal direction where carbonaceous particles are more elongated in this direction and thus more interconnected (Figure 14). This arrangement of conductive particles creates shorter path of heat transfer in the transversal direction.
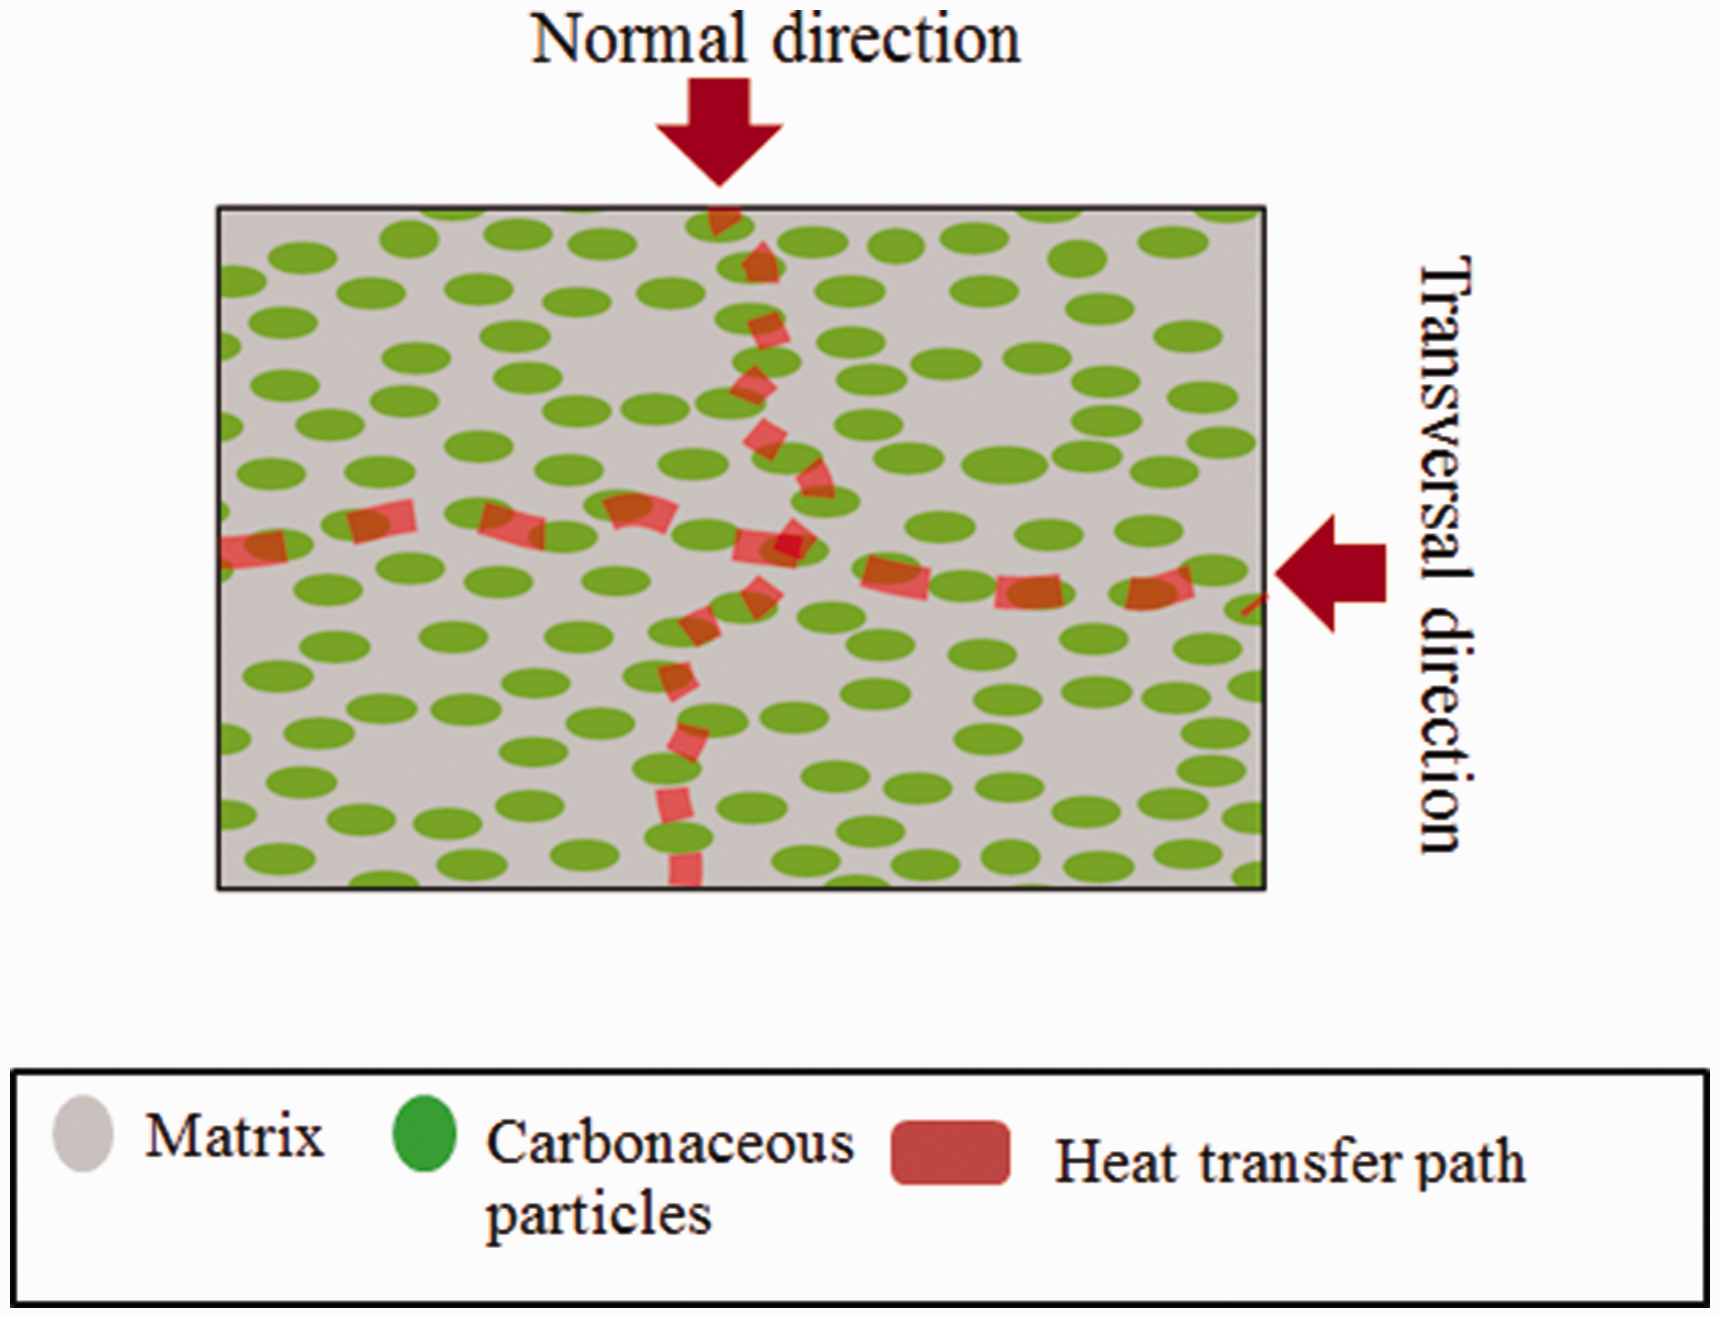
Schematic presentation of conductive particles orientation against heat transfer directions.
Distribution of strain localizations are found to be more homogeneous in material A (Figure 15(a)). Moreover, for this material, fibre balls undergo higher compressive strains (in deeper blue) than fibre entanglements in material B (Figure 15(b)).
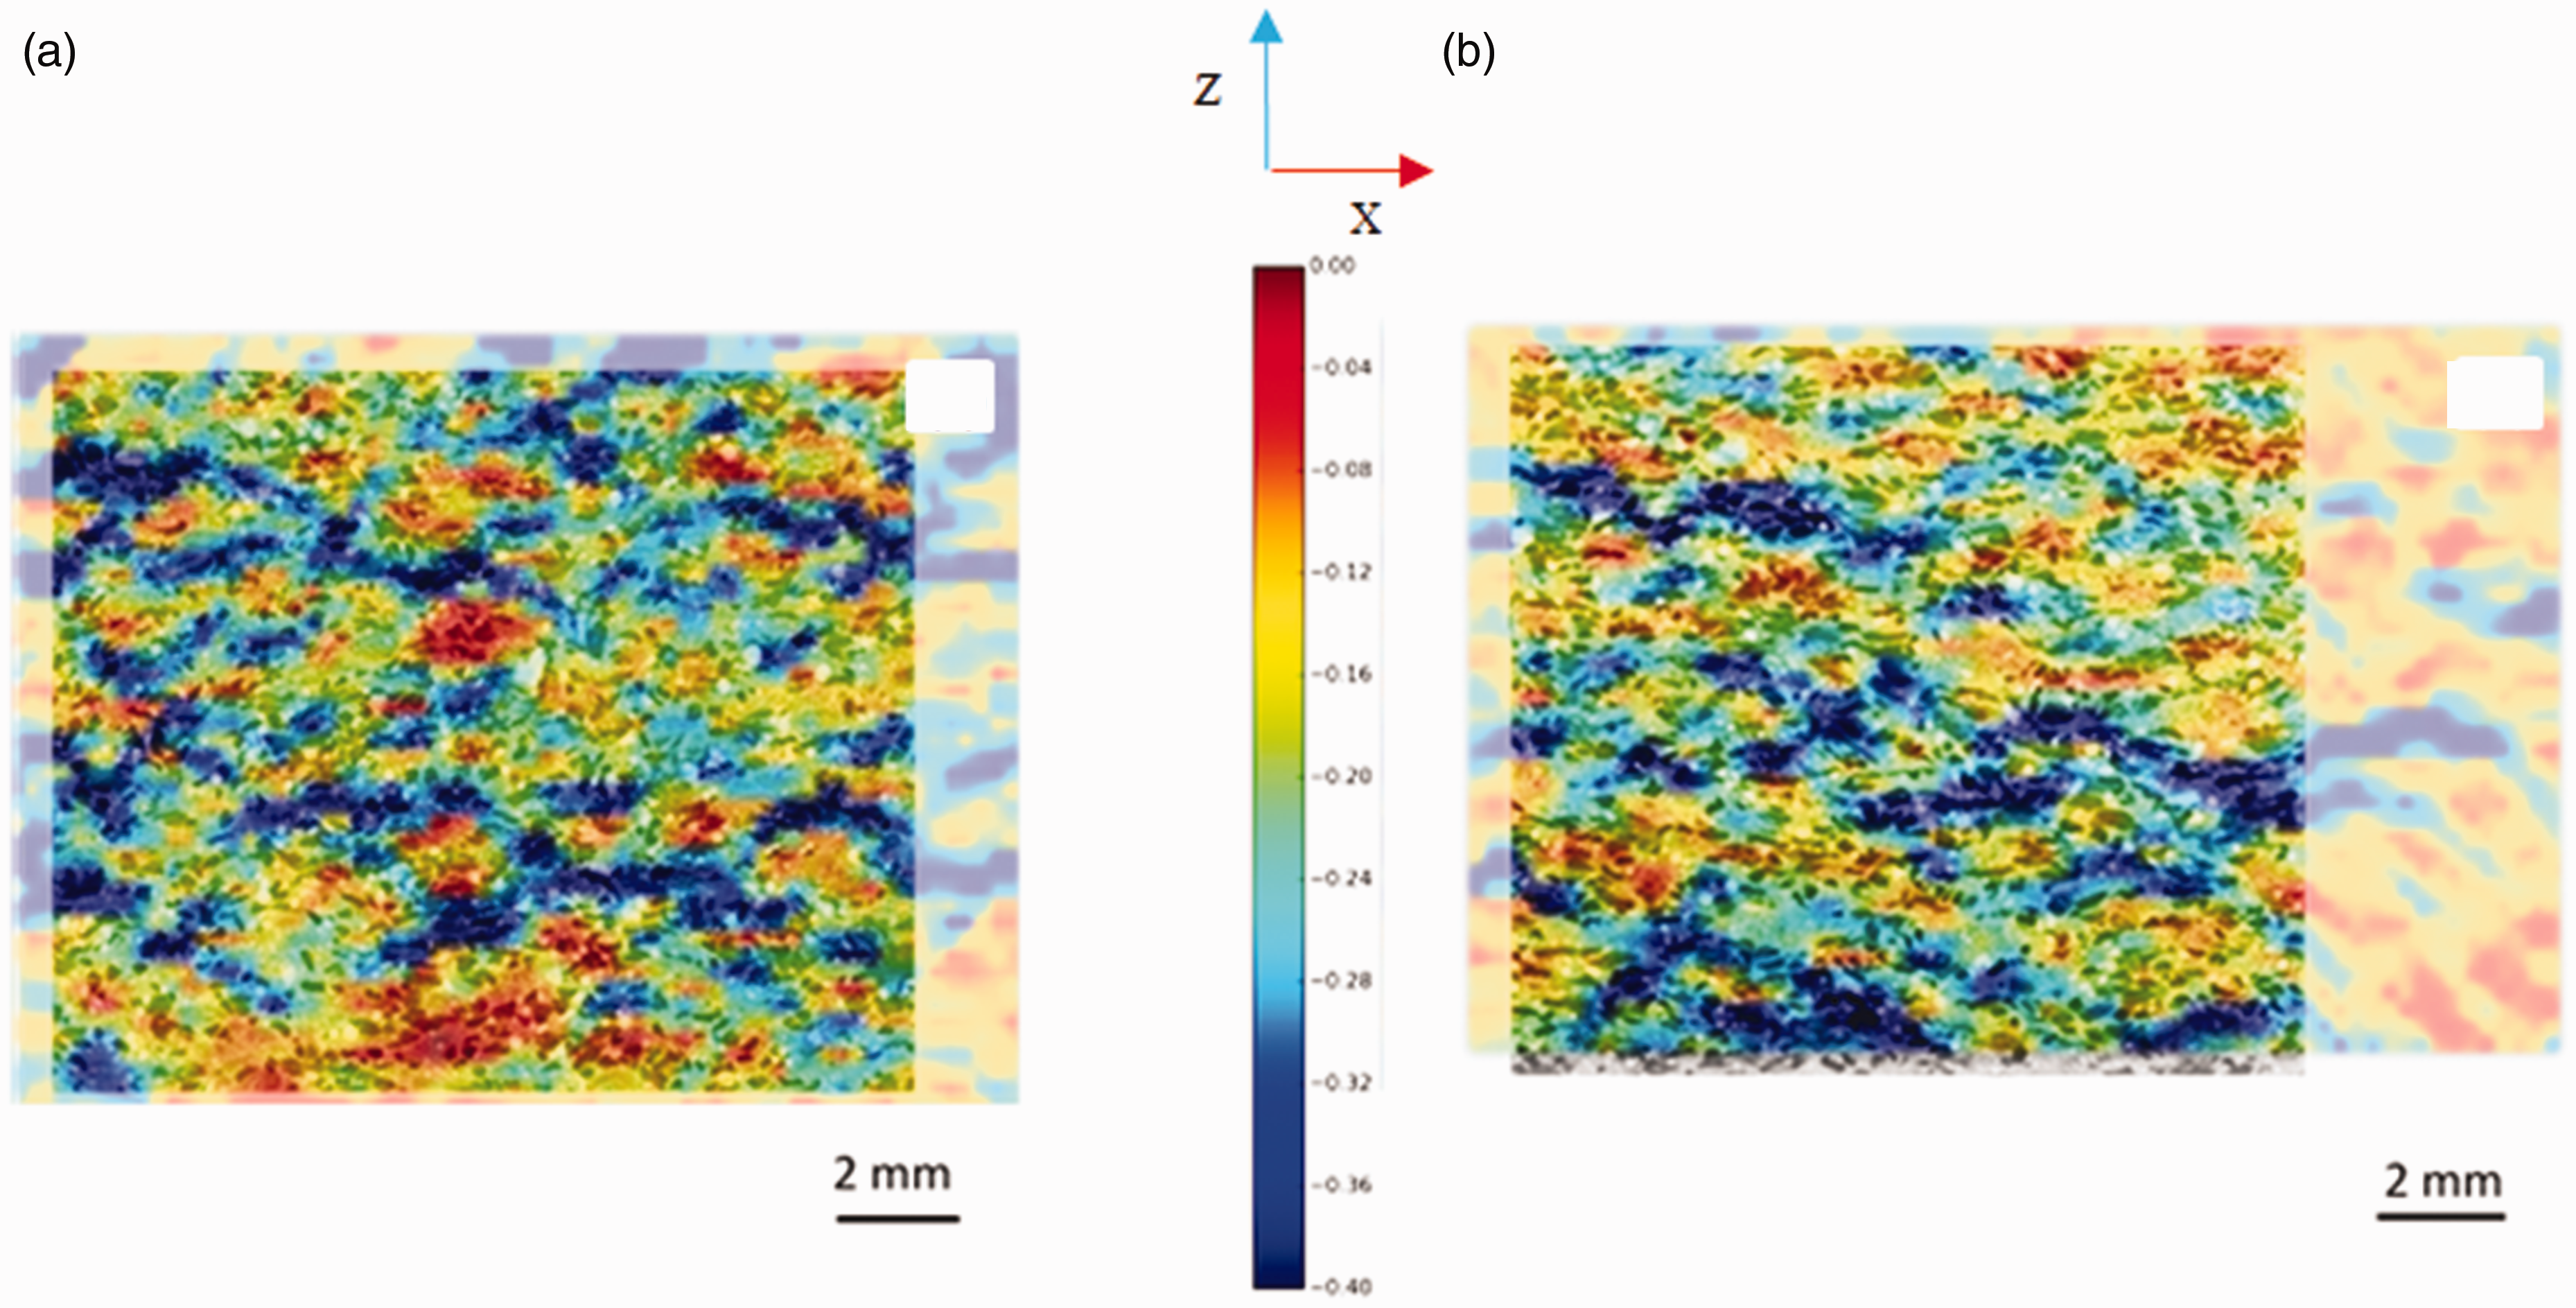
Strain fields Ezz (%) in the compression direction for 10 MPa superimposed on the microstructure of (a) material A and (b) material B.
Figure 16 show that strain localizations correspond to porosities and to carbonaceous particles, which are less stiff, then the other constituents. More numerous porosities are included in fibre bundles of material A which explains the higher compressive strains (Figure 16(b)).
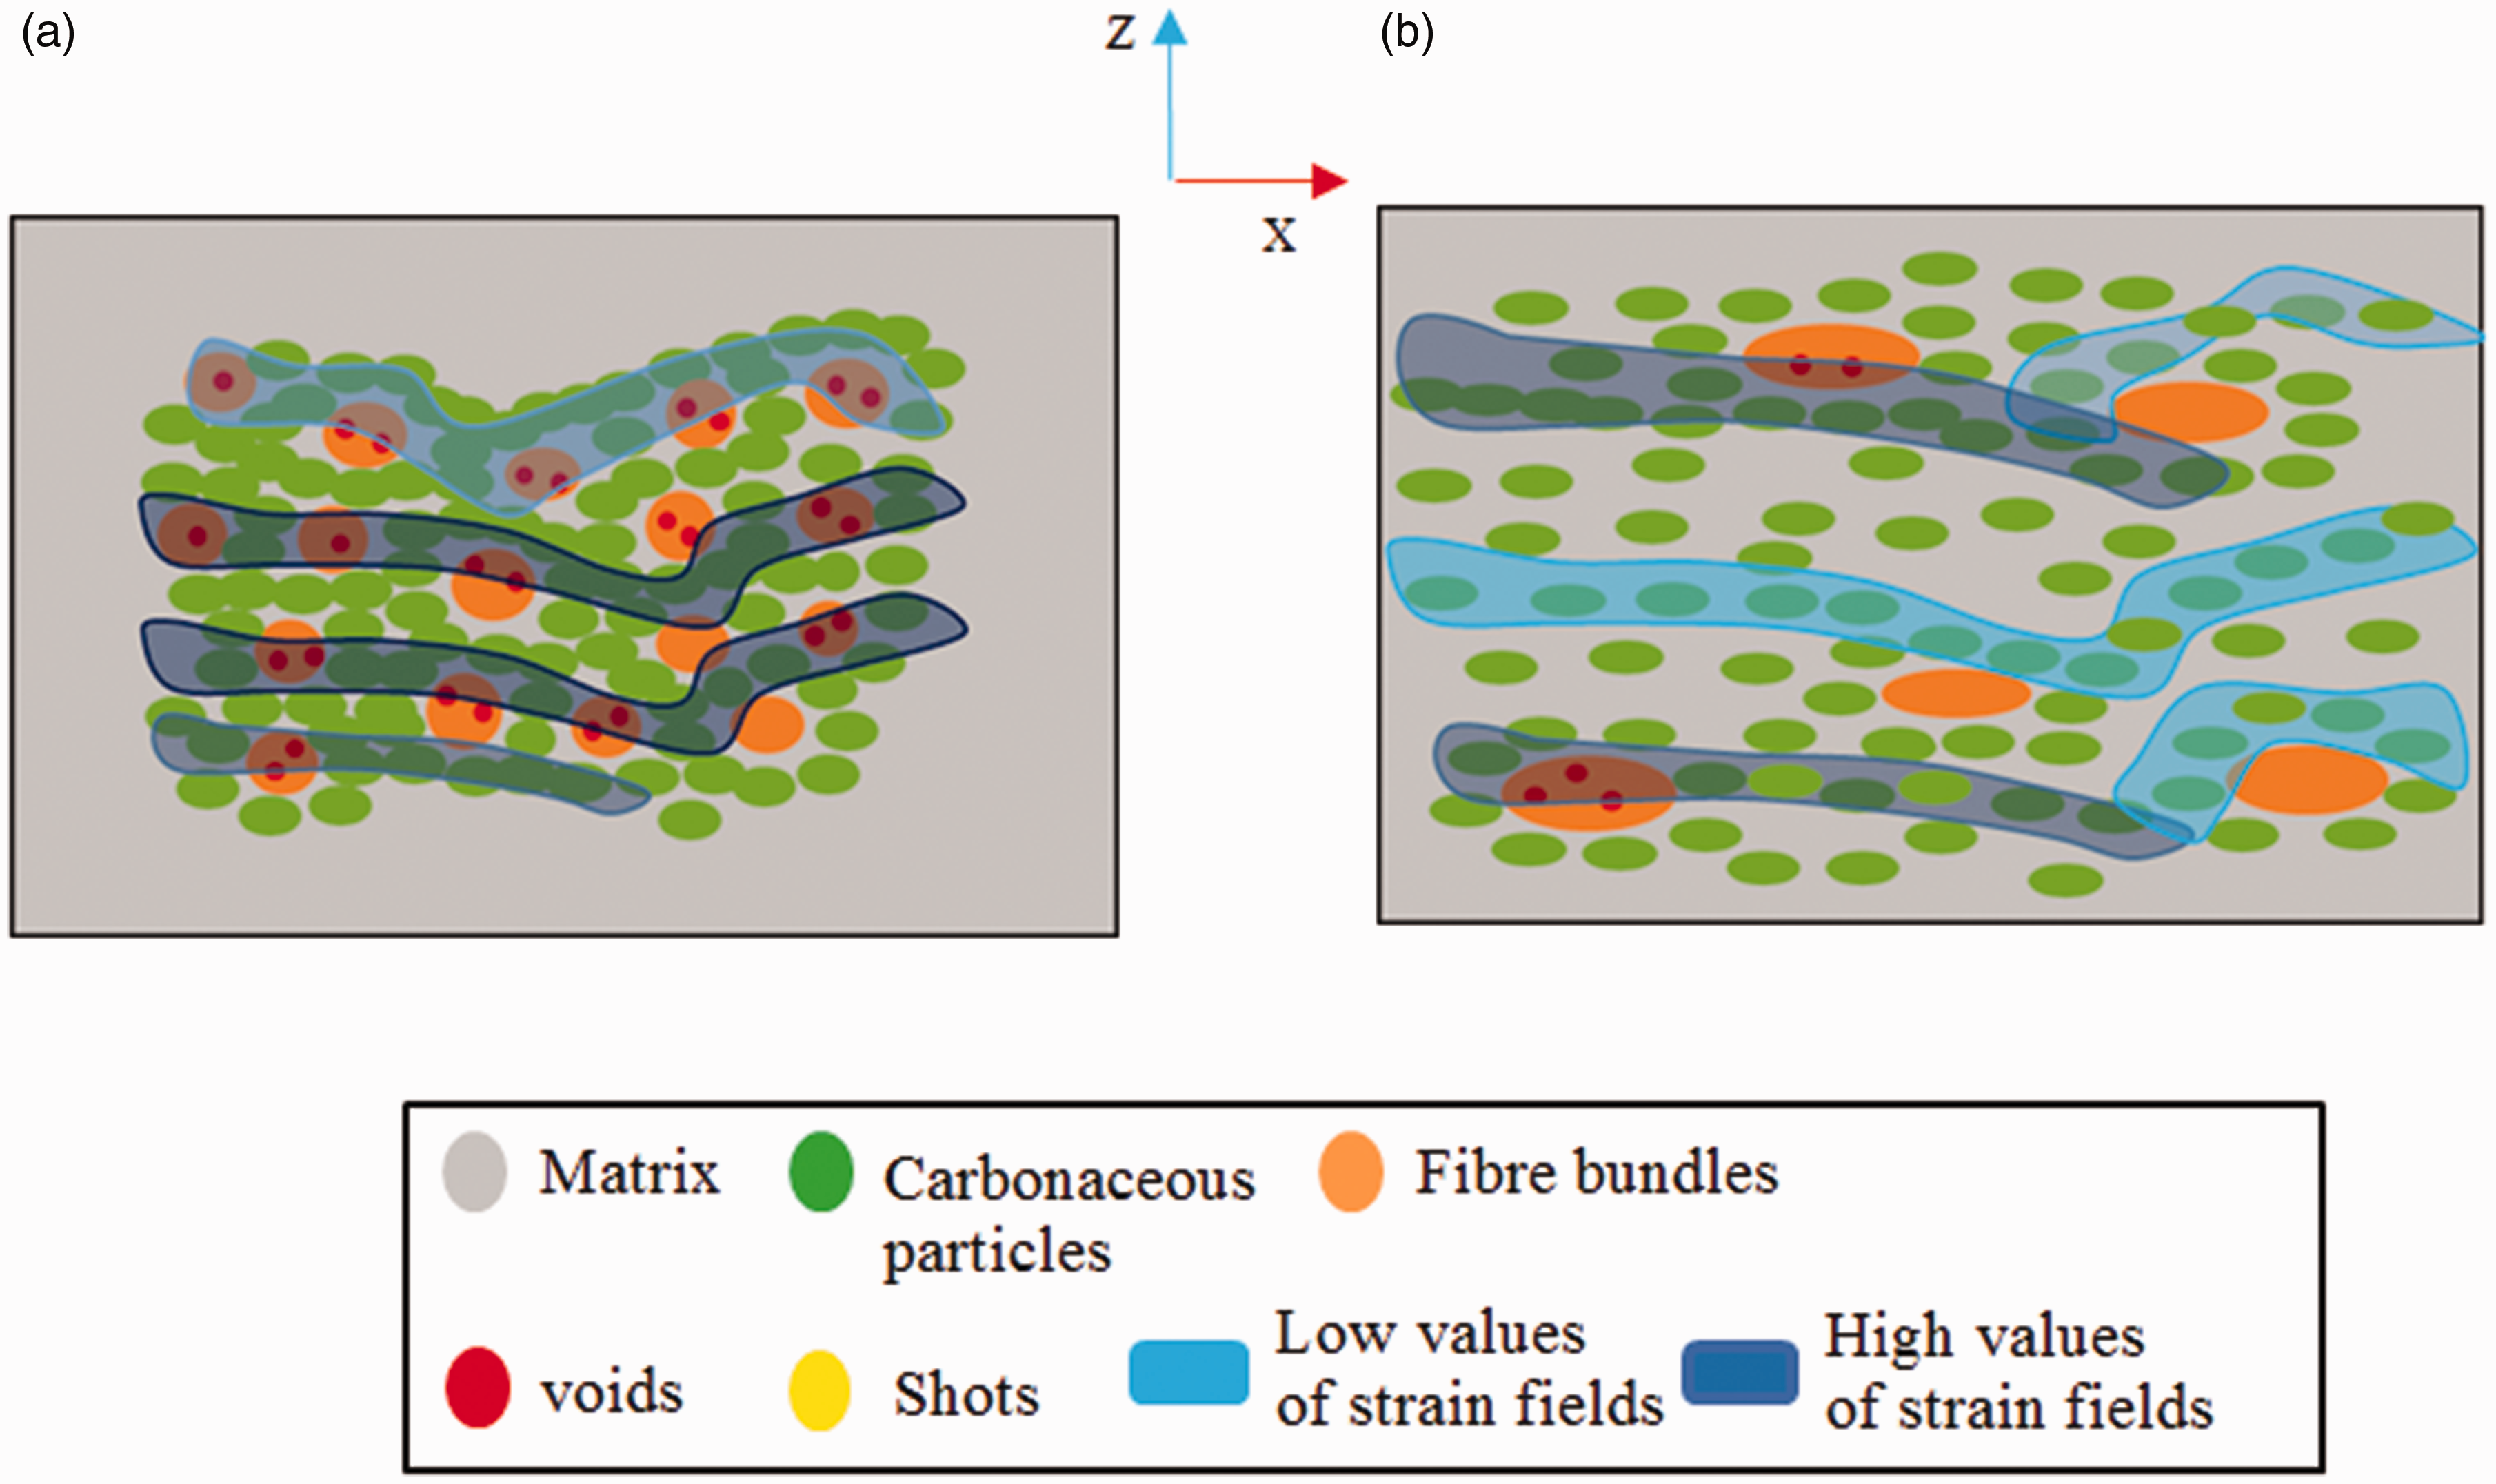
Relationships between localisation of strain fields and ingredient distribution: (a) material A and (b) material B.
According to Table 4, compressive modulus values decrease with stress level. This may be related to these materials porosities. In fact, at low solicitation (2 MPa), porosities, which are slightly compressed, are partially closed. As the load increases, compression closes more porosities, which leads to the rise of stiffness.13,24 Compressive modulus is found to be lower for material A due its porosity distribution. Indeed, according to Bilger, void distribution has an impact on the overall properties of porous material namely stiffness and on the local mechanical fields. 25 This study shows that the stiffest responses correspond to random microstructures with no particularly void clusters. On the contrary, the softest responses correspond to microstructures with a connected cluster of voids. Results demonstrate that for a given class of microstructure, the response seems to be softer when the void size is variable than when it is constant. This can be applicated to the investigated materials. In fact, material A contains fibre balls with variable size and interconnected voids (Figure 13(a)) contrary to material B with no void clustering inside its compacted fibre entanglements (Figure 13(b)). This explains the softer response of material A. Therefore, it can be noticed that incorporating fibres in the form of bulky bundles results in: i) more porosities, which induce less density; ii) a better quality of the interface between fibres and matrix, which limits thermal expansion; iii) a better connectedness of conductive particles, which enhances thermal conductivity; iv) porosities inside bulky fibre bundles lowers compressive modulus; v) homogenous distribution of fibre bundles and then carbonaceous particles leads to a more homogeneous distribution of strain localizations and a softer mechanical response.
Conclusions
This paper discussed link between microstructural characteristics induced by synergistic effects between rockwool fibres and the other constituents and the resulting properties. It was concluded that:
fibres are arranged with different sorts during the manufacturing process for the two studied materials. This induces several differences in terms of microstructure heterogeneity and has an impact on carbonaceous particle distribution and the interface adhesion between fibres and matrix. homogenous distribution of fibre bundles and then carbonaceous particles leads to a more homogeneous distribution of strain localizations and a softer mechanical response. regular size and form of fibre bundles results in a better connectedness of conductive particles and thus enhances thermal conductivity. bulky form of fibres induces a better quality of the interface between fibres and matrix and therefore limits thermal expansion
Nomenclature
Probability: particle amount per size class divided by width of size class. Equivalent Diameter: diameter of an equivalent spherical particle in terms of physical properties (aerodynamic, hydrodynamic, optical, and electrical) to that of the investigated non-spherical particle. Bounding Box: smallest rectangle that can be drawn around a set of points such that all the points are inside it. Feret box: bounding box consisting of the orthogonal Feret diameters. Feret diameter: longest distance between any two points along the region of interest boundary.
Footnotes
Acknowledgements
This work is part of thesis MOBIDOC funded by the European Union under the PASRI program. The authors thank the Ministry of Higher Education and Scientific Research in Tunisia, the Ministry of Foreign Affairs and the National Center for Scientific Research in France, and the Joint Committee of University Cooperation for their support for cooperation between the Laboratoire de mécanique multiphysique et multiéchelle and the Laboratoire des Systemes Electro-Mecaniques at the University of Sfax. The present research work has been supported by the ELSAT2020 project co-financed by the European Union with the European Regional Development Fund, the French State and the Hauts-de-France Region Council. The authors gratefully acknowledge the support of these institutions. Special thanks are also due to the STUGAFREM company (Sfax, Tunisia) for the supplying of the brake lining samples.
Declaration of Conflicting Interests
The author(s) declared no potential conflicts of interest with respect to the research, authorship, and/or publication of this article.
Funding
The author(s) received no financial support for the research, authorship, and/or publication of this article.