
Abstract
The effect of porosity in composite materials has been studied for years due to its deleterious effects on mechanical properties, especially matrix dominated properties. Currently there is an increasing use of composites in infrastructure worldwide, for example bridge components, residential and building structures, marine structures such as piers and docks, and large industrial chemical tanks. Most of these applications use fiberglass composites. Unfortunately, most of the published literature has focused on carbon fiber composites, in which fiber diameter and gas-fiber interactions are different than fiberglass composites. Therefore, the present study was undertaken to revisit the effect of porosity but specifically in fiberglass composites. The goal of this experimental study was to implement and evaluate various methods for creating porosity in fiberglass composites in a controlled manner in terms of obtaining repeatable void content, morphology, and location within the laminate. The various methods included using different amounts of autoclave pressure, adding a small amount of water between prepreg layers, and using dry fabric layers to starve the laminate of resin. Ultrasonic C-scan nondestructive evaluation was used to assess the quality of the cured panels, as well as optical and electron microscopy and void content measurements via resin burn-out. The cured panels were mechanically tested using the short beam shear (SBS) method. The results showed that the water spray method proved to be the best in terms of producing noticeably different levels of porosity, although the panels required drying to remove residual water after cure. The voids from all three techniques were either oval or elongated in-plane between the plies, but they were not uniformly distributed in-plane. The use of C-scan proved to be helpful for characterizing overall uniformity of each panel, although the results could not be used to directly compare void content between panels. The use of SBS testing was successful for evaluating void dominated properties in panels with high void content, although it was not very sensitive to coupons with lower void contents. Several interesting observations are offered in this manuscript of the fracture surface details and their relation to the SBS load deflection curves. Overall, it was found that the failure mechanisms were mixed mode and the voids did not serve as failure initiation sites. However, the voids participated mainly in the horizontal propagation of cracks between layers, presumably making it easier when they were intersected by a crack and reducing SBS strength.
Introduction
Porosity in polymer matrix composites are regions in the matrix void of any resin material. These can be located in the matrix between plies (interlaminar) as well as internal to the fiber strands (intralaminar). It is most frequently introduced during the fabrication process, including layup and during the cure cycle. The mechanisms for introducing porosity can vary, but the two general categories are air entrapment during layup and void nucleation from volatiles (moisture, solvents) during the cure cycle. 1 Nucleation porosity is generally caused by insufficient pressure during curing. If the volatiles are entrapped when the resin gels, then the porosity is locked into the material, either internally (not visible from the outside) or as visible blisters in the outermost layers.2,3
The use of high pressure in autoclaves is very successful at minimizing void size and content. However, other processes that involve lower pressures are more susceptible to void formation. For example, for vacuum bag only (VBO) curing, the void content was found to increase exponentially with resin moisture content. 4 Therefore, it is critically important to control certain factors such as the moisture content of the materials and the ability to trap air. These issues are easier to control on the laboratory scale compared to a large scale manufacturing environment. As a result, research studies sometimes appear to be in conflict with actual manufacturing experience where conditions are difficult to control uniformly (pressure, vacuum, environment, etc.).
The effect of voids on the properties of composites has been studied for several decades, with many publications for carbon fiber composites and fewer for glass fiber composites. The most complete literature review on the formation, characteristics, and effect of voids on mechanical performance was published recently by Mehdikhani et al. 5 Porosity is commonly interpreted as regions in the laminate where the solid has been removed and replaced by empty air pockets. The volume occupied by porosity is treated as having “zero property”, for example, no mechanical strength, zero density, etc. 6 Hence, porosity can affect the composite’s physical and mechanical properties. It can reduce thermal and electrical conductivities in all composite directions. Porosity affects the mechanical behavior such as delamination, deformation, strength, crack growth, and fatigue life.4,7–15
Porosity weakens the composite mechanically. Stresses develop around foreign inclusions and can cause delamination and other damage. 16 Porosity above a critical level affects static and fatigue strength of composite parts and creates a greater susceptibility to water penetration and environmental effects. During subsequent loading, porosity acts as stress concentration nuclei of further damage growth resulting in strength degradation. Reduced porosity levels are thus essential for ensuring the performance of fiber-reinforced composite structures.
Porosity has a detrimental effect on the matrix-dominated properties, such as interlaminar shear strength, compressive strength and modulus, and bending properties. Mechanical properties decrease as the void content increases, for example interlaminar shear strength (ILSS) values decreased by about 34% for carbon/epoxy fabric laminates when the void content increased from 0.55% up to 5.60%.17–19 The effect of porosity on the mechanical properties of composite laminates is influenced by a large number of factors, such as void shape, size, and location. 18 Porosity is often randomly distributed in the composite and can have several morphologies, although most commonly spherical or elliptical in shape. In another study, the reduction in ILSS fatigue resistance depended on pore shape and size, not the overall void content. 1 Also in that study, fracture toughness GIC increased with higher void content panels due to multiple crack growth fronts, while GIIC was insensitive to porosity level.
One of the initial challenges in studying the effect of porosity in composites is finding a method of introducing porosity in a controlled fashion. Perhaps the most complete experimental report published to date was made for unidirectional carbon/epoxy composites. 1 The techniques investigated included the use of a hot press with different levels of pressure, and the use of void forming materials in between plies such as water, foaming agents, and volatile organic solvents. Using microscopy it was found that the pores were elongated in-plane, the maximum pore length was proportional to the overall porosity content, and the increase in void content was due to the largest pores increasing in size. Another insightful study of unidirectional carbon/epoxy composites used serial sectioning, microscopy, and image analysis to compile statistical data about void aspect ratio and sizes. 20
More current studies have focused on the comparison of Nondestructive Evaluation (NDE) results with true images obtained by the method of destructive serial sectioning. Lambert et al. were the first to use CT scanning to measure and plot over 10,000 voids within the gage length of fiberglass fatigue coupons.
14
One of the major conclusions from that study was that the overall void content and shape did not correlate with fatigue life; the only void parameter that did correlate was the size of the largest void in the localized region of the laminate where crack propagation was likeliest to occur. Hakim et al. investigated a wider range of NDE techniques and compared them to serial sectioning results.21–25 This approach revealed the following about each NDE technique:
Thermography gives a general idea about the locations of porosity near the surface since porosity prevents thermal waves from going deeper in the sample. Ultrasonic methods detect porosity near the surface because back scattering and back reflection prevent ultrasonic waves from penetrating the sample. Radiography penetrates the entire thickness and reveals porosity; however it does not give any depth information about porosity. X-ray laminography gives about 100 hundred scan images through-the-thickness, which locates the depth of porosity detected by x-ray radiography; however, its major disadvantage is there are many artifacts. High-resolution X-ray CT is the best method for detecting and quantifying porosity since it produces 2400 clear scans through the sample’s thickness. The destructive method of serial sectioning exposes the composite’s internal structure and provides a very clear idea about the type, shape, size, distribution and location of the porosity contained in the composite material; however, damage and cracks are the most common defects during the serial sectioning process.
Hakim et al. also correlated porosity contents obtained by NDE and destructive techniques with their effect on mechanical and thermal properties, including static and fatigue Mode I interlaminar fracture toughness and thermal conductivity. 26
The bulk of the current literature has focused on carbon fiber composites. The current study was undertaken to shed more light specifically on porosity generation in fiberglass composites. The goal was to implement and evaluate several of the strategies reported in the literature for controlled porosity formation, specifically for fiberglass composites using autoclave curing in this study. To this end, three basic strategies were investigated: variation in pressure, use of water spray in between plies, and the use of embedded dry fabric layers. The second main goal was to evaluate the effect of the generated porosity on the interlaminar shear properties, which was attempted using the short beam shear technique. The porosity was characterized with ultrasonic C-scan and optical microscopy.
Experimentation
Materials
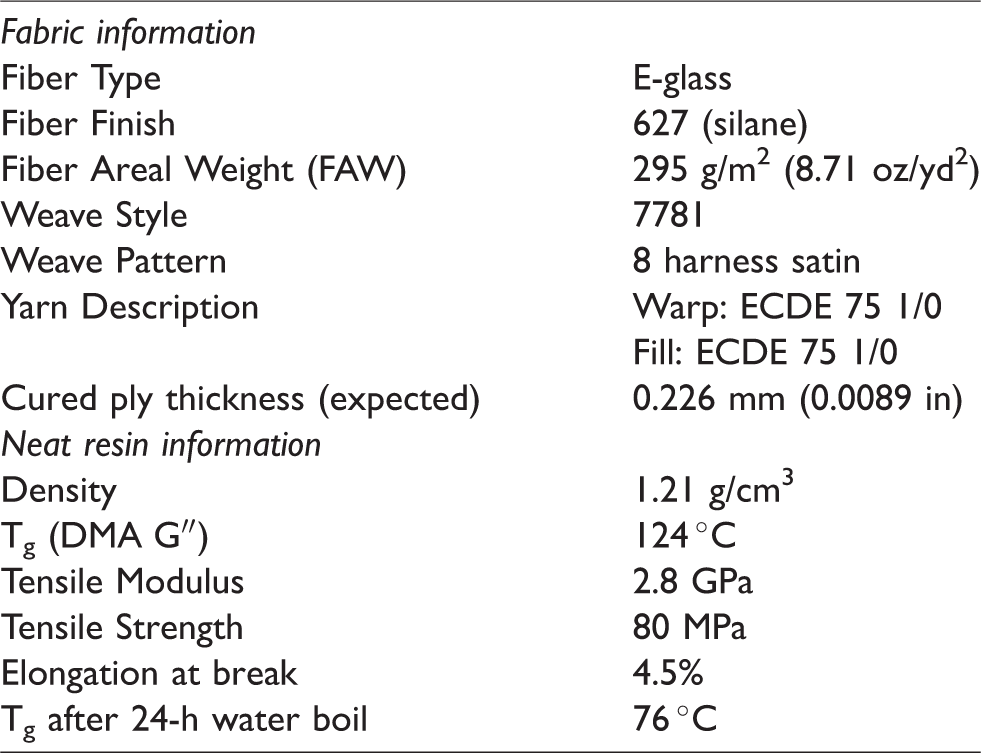
All panels were fabricated from a fabric prepreg comprised of E-glass fibers (see Table 1) and epoxy resin at a loading of 30 ± 2 wt%. The prepreg was obtained from Fibre Glast Development Corporation on a 1.3-m-wide roll. This product is designed for vacuum bag/oven cure or vacuum bag/autoclave cure. It is considered to be a “net resin” prepreg, whereby it contains all the required resin to make high fiber volume panels without the need to bleed excess resin. No information on the composition of the epoxy resin system was given by the vendor, although various neat resin properties are given in Table 1. The prepreg curing behavior was characterized using Differential Scanning Calorimetry (DSC). The weight fraction of fiber and resin was verified experimentally using ASTM D3529 Constituent Content. 27 Thermogravimetric analysis (TGA) was used to verify that the prepreg itself did not emit any volatiles that could produce voids.
Prepreg constituent properties (from vendor).
Processes
Three strategies were investigated for producing composite panels with various amounts of porosity (see Table 2). It was anticipated that the morphology of the porosity could also vary from method to method. All panels were cured in an autoclave (Econoclave 2×4 – 200P800F-2S2P4T, ASC Process Systems). The first strategy involved curing panels with different amounts of pressure. High pressure has the ability to consolidate prepreg layers and drive out air that was trapped during the layup process. The highest pressure condition, 5.9 bar, was selected because it is typical for an autoclave and usually leads to low porosity. The other two conditions were selected to allow for lesser degrees of compaction, which was based on dry fabric compressibility data found in the literature since prepreg compaction data was not available. For example, autoclave pressures of 5.9 bar, 3.1 bar, and 0.34 bar, plus the additional 1 bar of vacuum bag pressure for each panel, corresponds to fiber volume fractions of approximately 0.65, 0.60, and 0.50, respectively, for a stack of dry 7781 E-glass fabric. 28 Furthermore, the vacuum bag was used to induce volume expansion of any entrapped air in the laminates, not primarily as a source of compaction. In addition, vacuum bag sealant was used as an impermeable resin dam to minimize the removal of volatiles, which is a similar strategy used in other literature studies (see Table 1 in Centea and Hubert 29 ).
Panel fabrication experimental matrix.
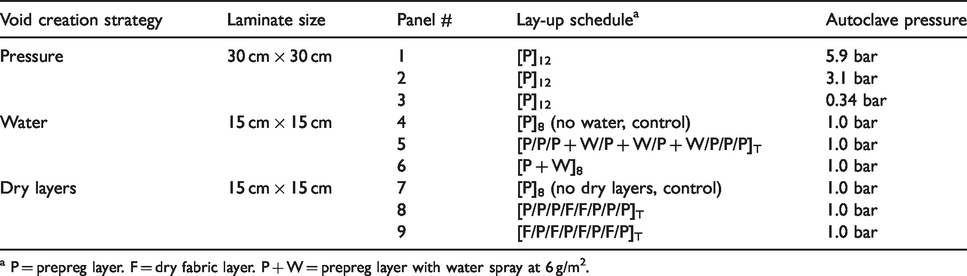
a P = prepreg layer. F = dry fabric layer. P + W = prepreg layer with water spray at 6 g/m2.
The second strategy involved adding water between plies, in order to produce bubbles and/or pockets of steam between and/or within prepreg plies during the cure cycle due to water vaporization. The voided areas become fixed in place during resin gelation, even though the water eventually condenses during cool-down. The vapor pressure of water at the cure temperature (154 °C) is 5.2 bar. This is much higher than the pressure used for those panels in order to maximize void formation. The third strategy involved the use of some layers of dry fabric to starve the panel of resin, leaving dry areas between and possibly within prepreg plies. The dry fabric was the exact same fiber type, weave pattern, and fiber areal weight as contained in the prepreg (see Table 1). The general layup procedure and other details are described next.
The size of the first three panels (#1–3) was 30 cm × 30 cm × 12 plies thick. They were fabricated by a hand lay-up process. The prepreg contained a plastic release ply on each surface. First, the lower release ply was removed from the first layer, and the prepreg was laid down on an aluminum plate covered with non-porous Teflon release film (Release Ease 234 TFNP, Airtech International Inc.). This ply was manually compacted with a metal rolling pin in different directions (parallel to the edge, diagonal, etc.). The top release ply was then removed, and another prepreg layer was added in the same way as the first. The process was repeated until all plies were added. All layers were aligned with the fabric warp direction parallel to each other. Panels #1–3 were cured in the autoclave using a pressure of 5.9, 3.1, and 0.34 bar (85, 45, and 5 psi), respectively.
After fabricating the first three panels, the size of the panels was reduced in order to conserve material and simplify the layup process. The size of the remaining panels (#4–9) was 15 cm × 15 cm × 8 plies thick. The procedure for laying up the panels containing water was the same as above except that water was applied between three internal layers (Panel #5) or between all layers (Panel #6). The procedure for applying water was as follows. First the prepreg’s release ply was removed from one surface and the prepreg was laid down on a plate with the exposed side facing up. A porous Teflon bleeder ply (Release Ease 234 TFP, Airtech International Inc.) was placed over the exposed prepreg, a small paint roller lightly soaked in water was used to apply water uniformly over the surface of the porous release ply, and then the Teflon bleeder ply was removed. The bleeder ply helped with the main challenge of distributing a thin film of water uniformly over the surface without beading or pooling. The average amount of water applied was about 6 g/m2 per surface treated. After applying the water, the prepreg was placed water-side down on the existing stack of prepregs. Finally, a panel without water (Panel #4) was also fabricated as a control. Panels #4–6 were cured in the autoclave with a pressure of 1.0 bar (15 psi).
The procedure for laying up the panels with dry layers was the same as Panels #1–3 except that dry fabric layers were used instead of prepreg layers for the middle two plies (Panel #8) or every other ply (Panel #9). A panel without dry layers (Panel #7) was also fabricated as a control. Panels #7–9 were cured in the autoclave with a pressure of 1.0 bar. Panels #4 and #7 were identical except they were cured in separate autoclave runs, therefore they were used to evaluate repeatability of the process.
The autoclave curing process is described next. Each prepreg stack was removed from its lay-up plate and placed on a non-porous Teflon film located on the autoclave’s main steel curing plate. A non-porous Teflon film was then placed on top of the lay-up stack, followed by a caul plate. The caul plate was comprised of a steel plate with smooth non-stick film adhered to it. A dam structure was built around the perimeter of the panel using one layer of vacuum bag sealant. The entire assembly was covered with another non-porous Teflon sheet to help prevent any resin migration if any escaped from the panel and sealant dam. Most of the autoclave’s curing plate was covered with a cotton breather ply (Airweave N10, Airtech International Inc.), and the entire plate was covered and sealed with a nylon vacuum bag (Wrightlon WL 6400, Airtech International Inc.). The bag contained one port that led to a vacuum pump, and one port that led to a vacuum sensor. After a vacuum leak check, the plate and vacuum bag assembly was placed into the autoclave.
The cure cycle involved a ramp at 5.5 °C/min from ambient to 154 °C with immediate pressurization using nitrogen. The autoclave pressure was maintained at 5.9, 3.1, 1.0, or 0.34 bar throughout the cure cycle. The vacuum bag was vented to the atmosphere when the autoclave temperature exceeded 93 °C. This is a common practice used to minimize the chance of resin migration toward the vacuum source when the resin viscosity is low. The temperature was held at 68 °C for 1 hour, and then cooled to ambient at approximately 5.5 °C/min.
Characterization
Each cured panel was inspected with ultrasonic C-scan testing to assess overall uniformity, presence of voids, etc. The custom constructed apparatus was comprised of a water tank, in which the panels were laid flat near the bottom. A 0.64 cm diameter, 5 MHz transducer was rastered across the panel surface from above with a 0.5 mm step size in the X and Y directions. The system was operated in pulse-echo mode, where the signal traveled downward through the panel, reflected off a flat plastic reflector plate under the panel, and returned to the original transducer after traveling upward through the panel. The signal was gated such that the reflector plate amplitude image was collected as the main data, rather than considering any portion of the energy that reflected from the top or bottom surfaces.
Following C-scan inspection, each panel was cut into smaller samples for various destructive tests. The curing behavior was characterized with differential scanning calorimetry (DSC). A TA Instruments Q2000 DSC unit was used to test a sample taken from panel #1, as well as a sample of fresh prepreg. DSC testing was conducted from 40–325°C at 10 °C/min with a nitrogen purge of 50 mL/min. In addition, small samples (approximately 2.5 cm × 1 cm) were cut from at least three locations of each panel and tested for thickness using digital calipers and density using water buoyancy (ASTM D792 30 ) Void content was measured for two small squares (approximately 2.5 cm × 2.5 cm) extracted from random locations on each panel using ASTM D3171 Procedure G Matrix Burnoff. 31 At least one sample of each panel was potted in epoxy and polished with a Buehler Automet/Ecomet 250 rotary grinding/polishing unit. A Zeiss AX10 microscope was used to analyze the cross section of each sample for porosity.
The short beam shear (SBS) test (ASTM D2344 32 ) was used to help determine the effect of porosity on void-sensitive and resin-dominated mechanical properties. Generally the SBS test is used as a measure of interlaminar shear strength and delamination resistance. This test was performed with an Instron 5985 load frame, 5 kN load cell, and short beam shear strength fixture with 3.2 mm diameter support cylinders and 6.35 mm diameter loading nose. Five specimens were cut from each panel. Specimen size was approximately 15.5 mm in length and 5.9 mm in width. A span-to-depth ratio of 4.5:1 was used, and the deflection rate was 1.27 mm/min. The coupons from the water spray panels (#4–6) were dried for 85 hours at 50 °C before testing to ensure the matrix was not plasticized with water. The weight loss of the coupons ranged from 0.4 wt% for Panel 4 (no water), 0.7-1.1wt% for Panel 5 (low water) depending on location, and 1.2-1.9wt% for Panel 6 (high water). Finally, the sides of polished SBS coupons (post-test) were analyzed with optical microscopy, as well as Scanning Electron Microscopy (SEM) using a ProX Phenom desktop SEM unit (Nano Science Instruments, Pheonix, AZ) operating at 15 KeV.
Results and discussion
The results of the constituent content analysis of the as-received prepreg were as follows:
Prepreg resin content = 30.1 wt% Fiber areal weight (FAW) = 298.4 g/m2 (8.79 oz/yd2) Overall areal weight (OAW) = 427.2 g/m2 (12.6 oz/yd2)
These results compare well with the manufacturer’s specification sheet. The DSC results for the prepreg, given in Figure 1, show an exothermic peak that was bimodal in shape. This implies that there were two separate cure reactions, which could be due to the use of two different curing agents. The total heat of reaction of the prepreg was 76.4 J/g. When adjusting for resin content (30.1%) this corresponds to a heat of reaction of 254 J/g for the resin. This is a little low for a freshly mixed epoxy resin (usually 400–600 J/g), which implies that the resin was B-staged by the manufacturer. This is not surprising given that this prepreg was designed for room temperature storage with a shelf life of 6 months at ambient. In the current study, all panels were fabricated within 1 month of receipt of the prepreg from the manufacturer. The cured composite had a heat of reaction of 5.3 J/g, which indicates that the composite was highly cured.
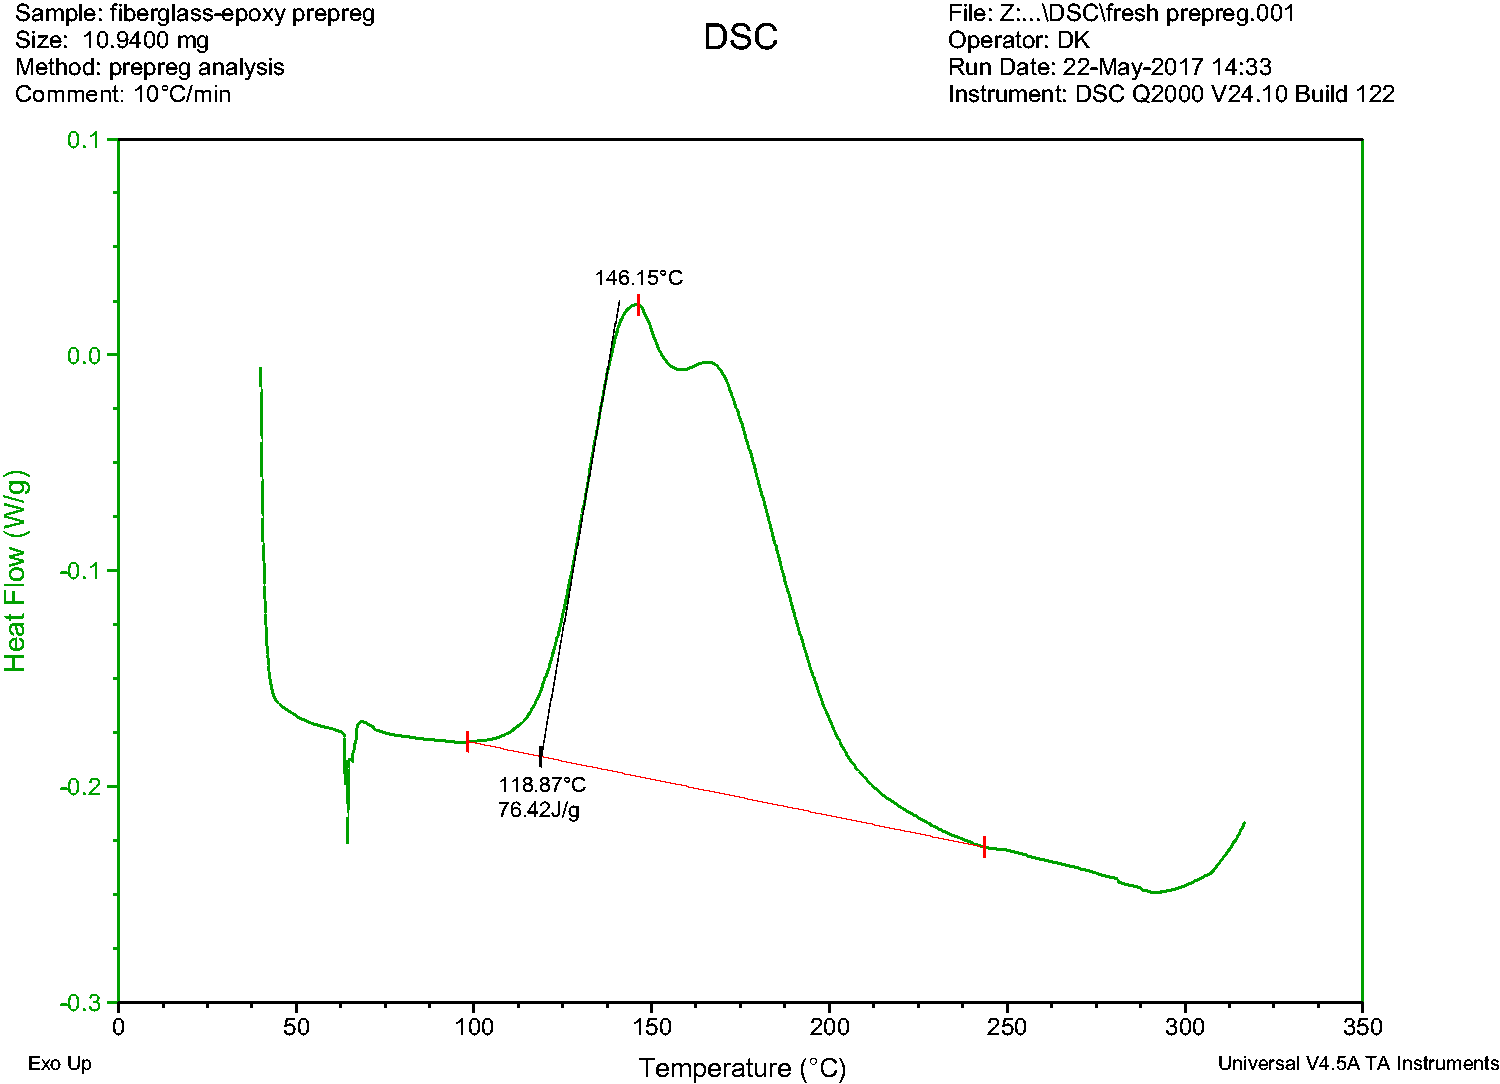
DSC results for as-received prepreg sample.
The C-scan color scale is given in Figure 2. Generally the color scale spans from cold (blue) to hot (red/purple). Blue/cold means the ultrasonic signal had a
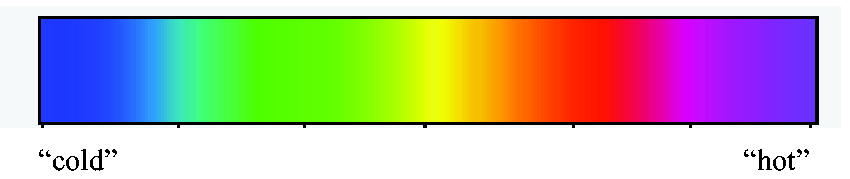
Interpretation of C-scan color results. Blue (“cold”) indicates the ultrasonic signal had a
The C-scan results for each panel, along with a panel photograph and cross section photomicrograph, are given in Figures 3 to 5. The effect of autoclave pressure (panels 1–3) can be seen in Figure 3. The C-scan results for the 5.9 bar panel indicate uniform consolidation with low attenuation. The 3.1 bar panel appears less uniform and has somewhat more attenuation, although this could be due to a slight increase in thickness. In contrast, their photomicrographs show that they are both well consolidated with little or no voids. The 0.34 bar panel produced very high ultrasonic attenuation. Furthermore, voids appeared to have coalesced in one of the corners, which was also visible to the naked eye (see photograph). The photomicrograph of the 0.34 bar panel revealed large, mostly spherical voids throughout the bulk. The morphology of the voids was different in the noted corner section, where they were more elongated parallel to the layers. Through image analysis, the void contents of the 0.34 bar samples were estimated to be about 11–12 vol% at the edge and 4% in the bulk. The void contents of other samples from these locations were also assessed with the matrix burnoff technique as is discussed later.
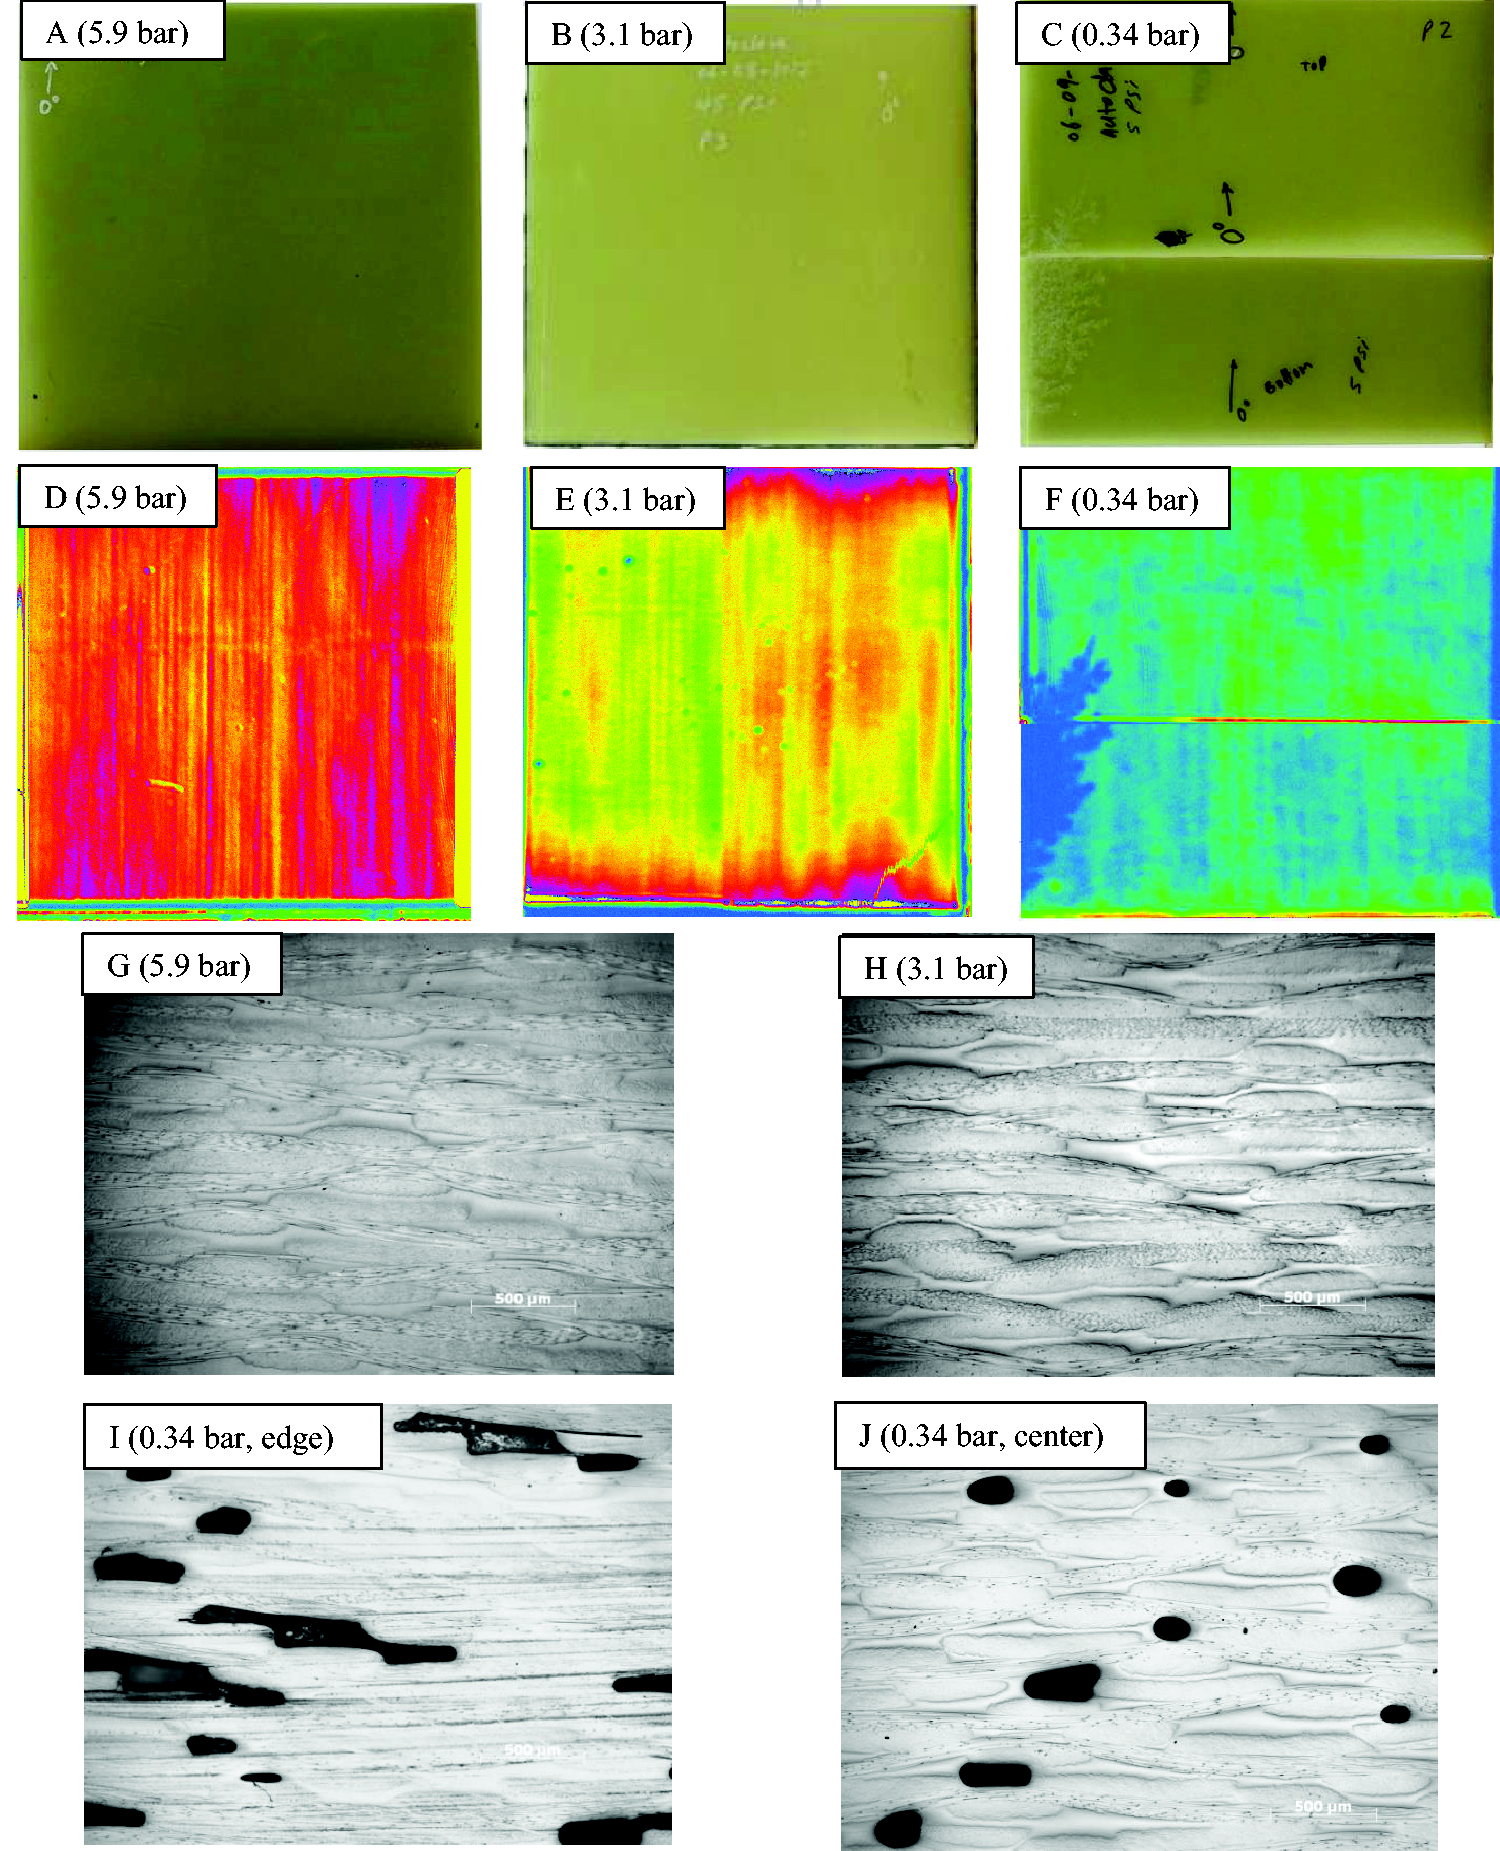
Results for Panels #1-3 (autoclave cured panels) – (a–c) photographs of cured panels, (d–f) C-scan results, and (g–j) photomicrographs of polished cross section at 50× magnification. The autoclave pressure used to fabricate each panel is given in each figure.
The effect of water spray (Panels 4–6) can be seen in Figure 4. The C-scan result for the dry panel indicated excellent consolidation and uniformity, which was confirmed by the cross section photomicrograph. The C scan results for the two water spray panels indicated that water migrated and collected in certain areas. This was visually evident, and supported by C-scan results in panel #5 where most of the panel had pockets of water except for the upper right corner which was well consolidated. In Panel #6, there was so much water that the C-scan results did not show the variation very well because the attenuation was high everywhere. In this case, the visual appearance showed the variation better. In addition, the water spray panels had a rough top surface: this indicates water migrated to the top (through the plies or around the edges). The photomicrographs for the two water spray panels show a high degree of porosity, with the morphology being elongated parallel to the layers. It is interesting that the voids in the low water panel (#5) were not confined to the center of the panel, but they were also observed near the top and bottom of the panel. Furthermore, these voids were not uniformly distributed: some local areas had a low amount of voids while other locations had a high amount. This had an effect on short beam shear results, which will be discussed later. For the high water panel (#6), there was so much porosity that the voided areas were connected interlaminarly. In contrast, the voids in the low water panel remained separated.
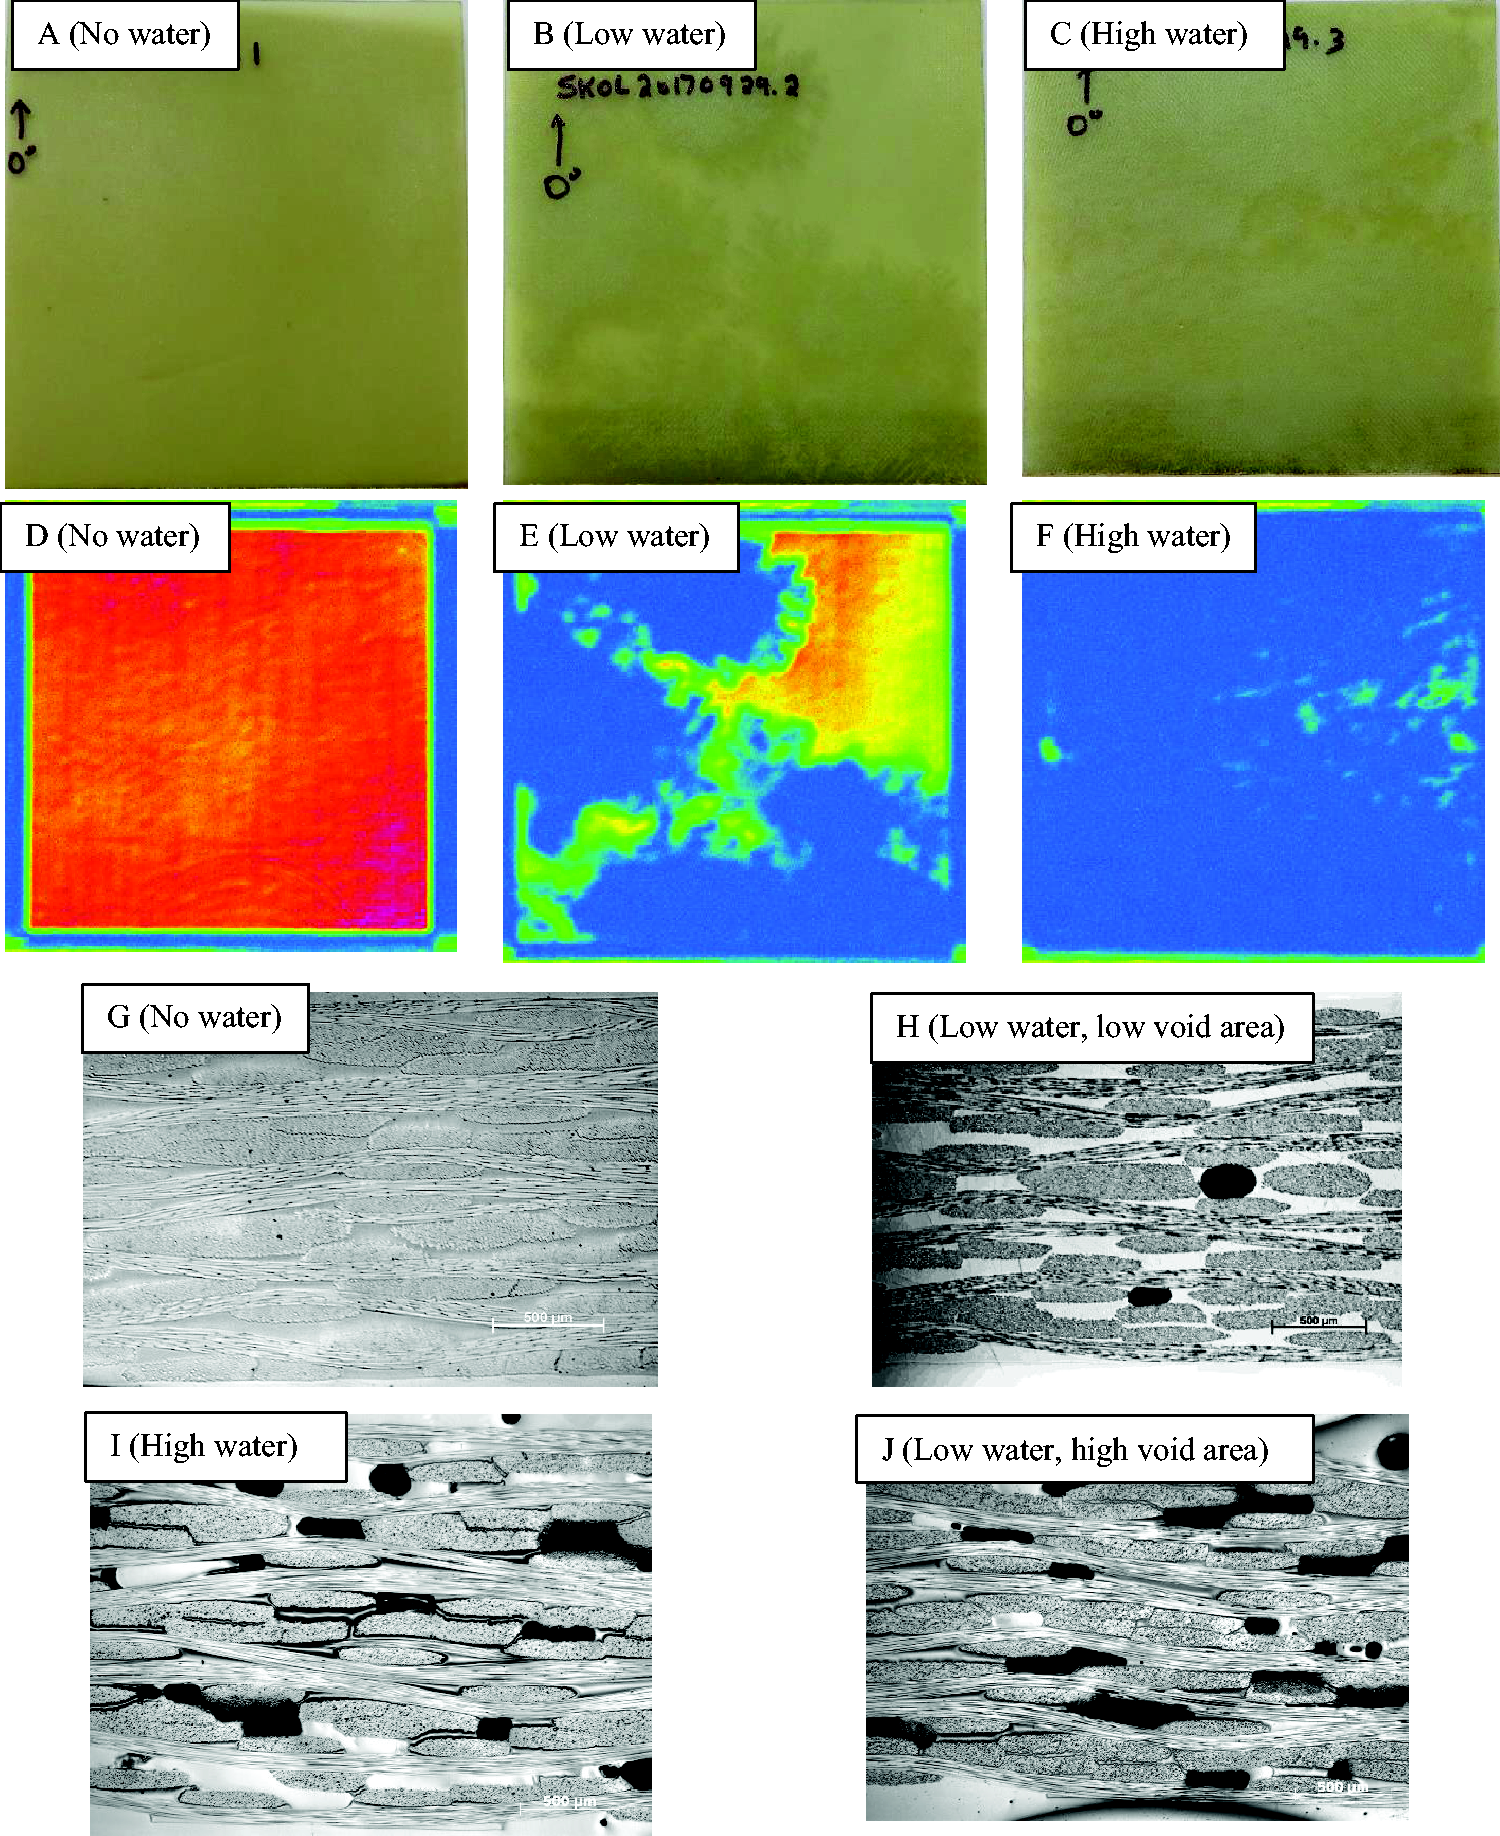
Results for Panels #4-6 (water spray panels, 1.0 bar) – (a–c) photographs of cured panels, (d–f) C-scan results, and (g–j) photomicrographs of polished cross section at 50× magnification. The level of water spray used to fabricate each panel is given in each figure.
The effect of dry fabric layers (Panels 7–9) can be seen in Figure 5. The C-scan result for the control panel (no dry layers) indicated some non-uniformity, however the photomicrograph showed excellent consolidation with little or no voids. The panel containing two dry layers in the middle showed a medium amount of attenuation and high uniformity. The photomicrograph for that panel revealed spherical type voids located near the center of the thickness. The panel with alternating dry layers exhibited very high ultrasonic attenuation as expected. The photomicrograph revealed elongated voids in between layers. This panel (#9) was so porous and fragile that it was eliminated from further testing.
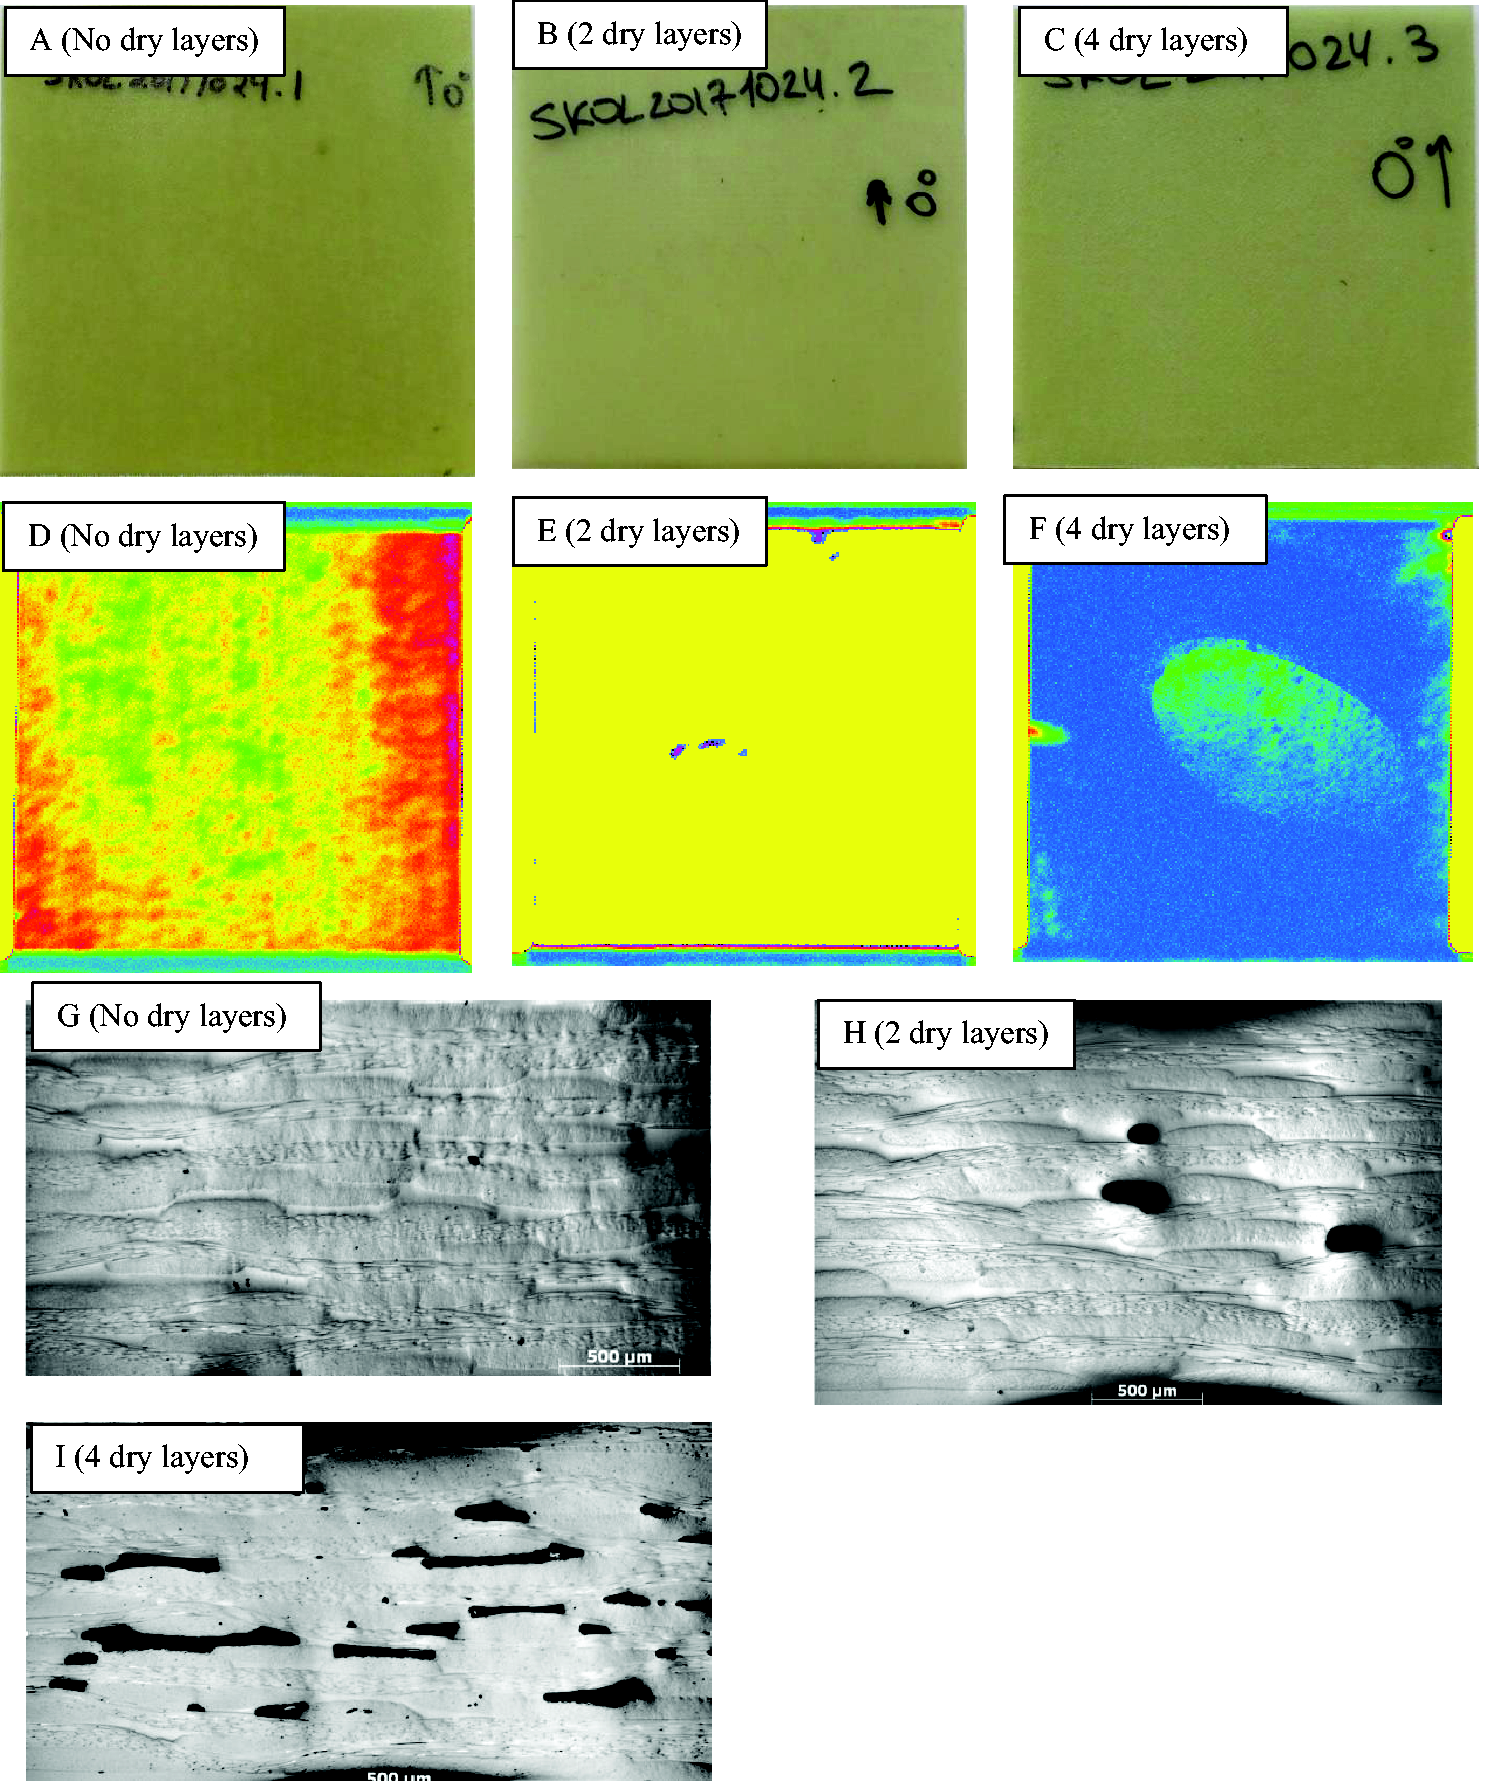
Results for Panels #7–9 (dry layer panels, 1.0 bar) – (a–c) photographs of cured panels, (d–f) C-scan results, and (g–i) photomicrographs of polished cross section at 50× magnification. The number of dry layers used to fabricate each panel is given in each figure.
A summary of the collective numerical test results for this study is given in Table 3. The void content results are summarized in Figure 6. For Panels #1–3, the void content did not monotonically increase as pressure decreased. Panels #1 and #2 both had a low void content (≤0.5%) while the 0.34 bar panel contained 2% porosity in the best location, and over 6% porosity in the visibly worst location. Panels #4–8 were all cured at 1.0 bar (i.e. intermediate pressure to panels #2 and 3). Of these, Panels #4 and #7 served as control panels (normal layup, no intentional porosity). Although Panel #4 exhibited low void content similar to Panels #1–2, it is not clear why Panel #7 resulted in significantly higher porosity (2%). Nevertheless, this is consistent with the photomicrograph and C-scan results of Panel #7 which indicate slightly more porosity than Panel #4. These two panels, which were intentionally fabricated as a redundant baseline condition, clearly illustrate the potential for variation in porosity even when processing conditions are identical. The variation can also be attributed at least partly to the relatively low number of samples tested from each panel and the inherent uncertainty in the void content measurement technique.
Summary of numerical test results.
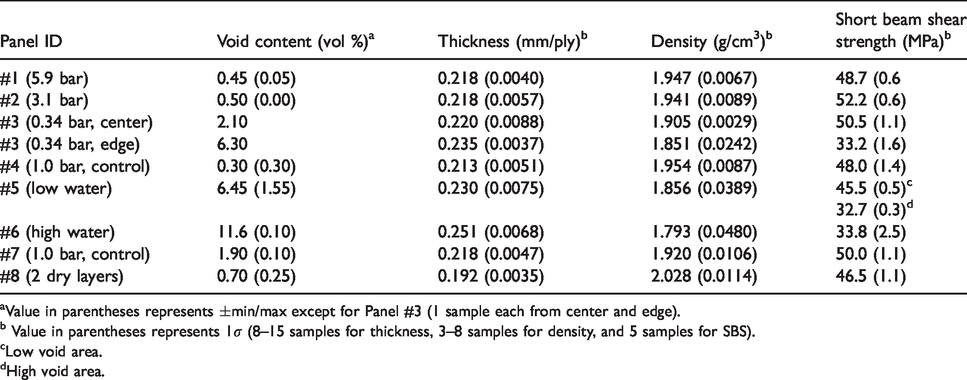
aValue in parentheses represents ±min/max except for Panel #3 (1 sample each from center and edge).
b Value in parentheses represents 1σ (8–15 samples for thickness, 3–8 samples for density, and 5 samples for SBS).
cLow void area.
dHigh void area.
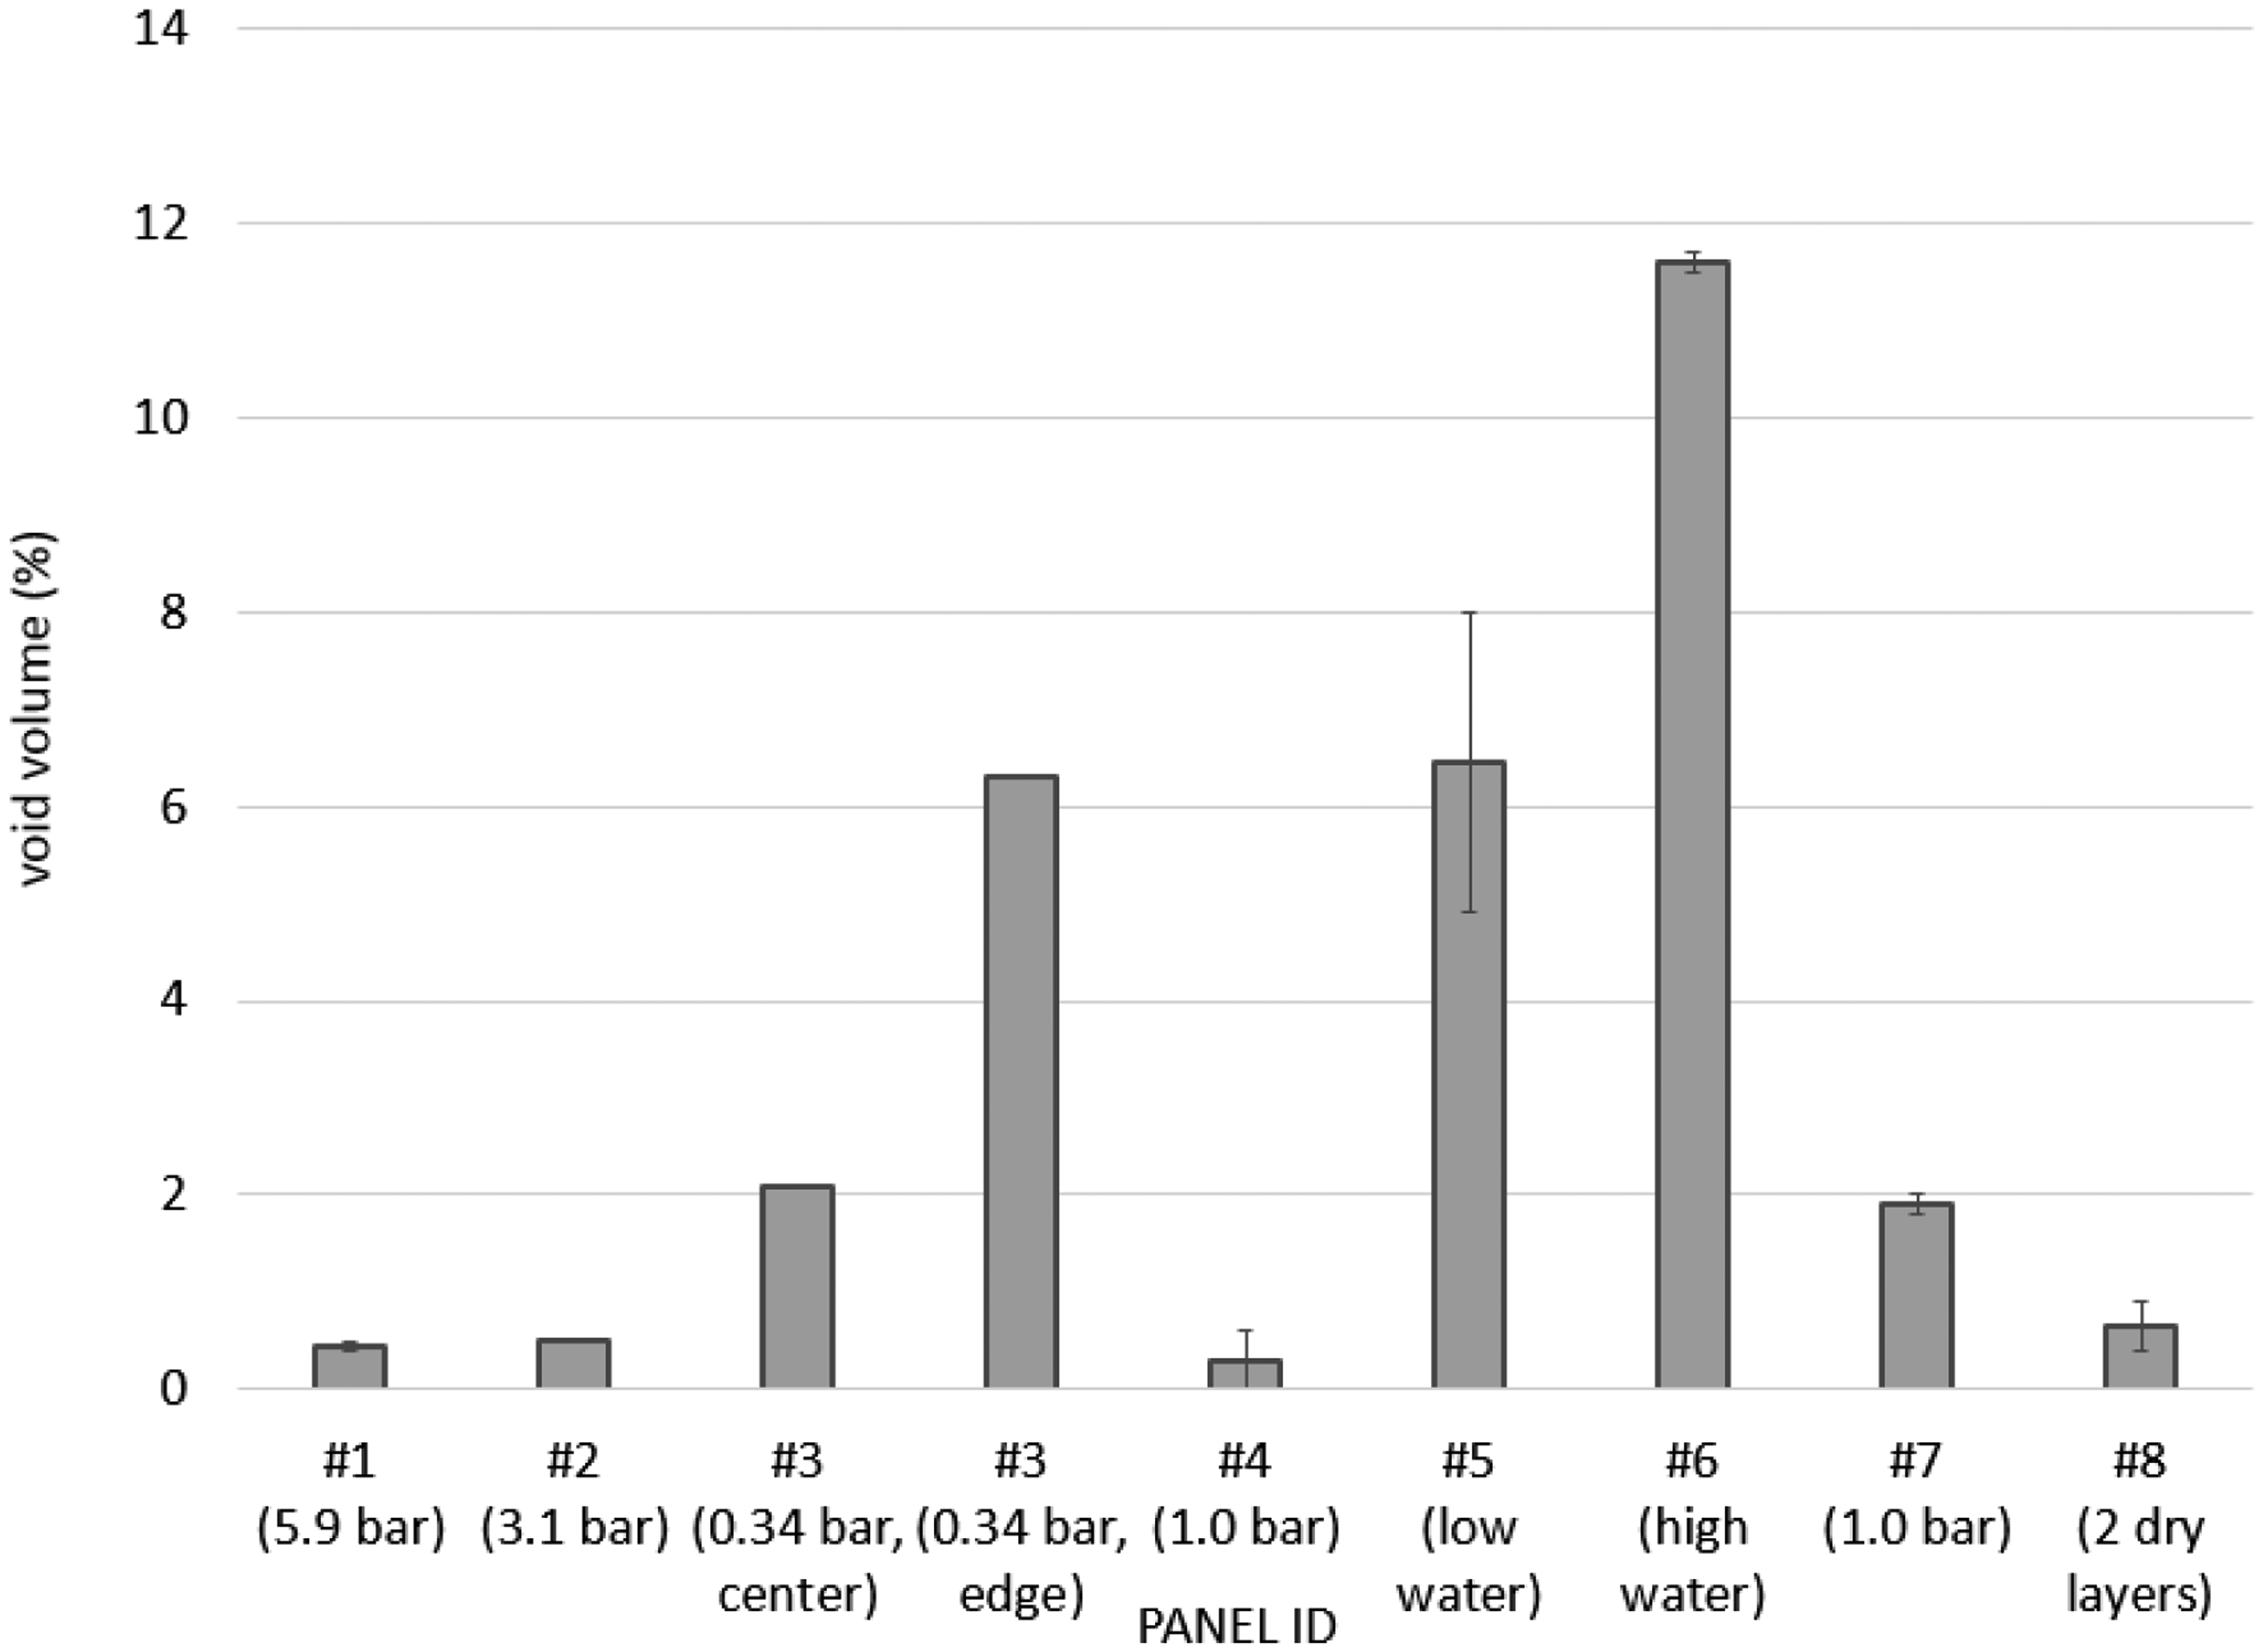
Panel void content results. Error bars represent minimum and maximum values of two measurements made for each panel, except #3 center and #3 edge (one measurement each location.).
The effect of adding water was to monotonically increase the void content to almost 12% (compare Panels #4–6). For Panels #5–6, one sample was taken from one visibly high void content area and one visibly low void content area. For Panel #5, the measured void contents correlated with the expectation (one high, one low), but it is interesting for Panel #6 that the measured void content of both samples was essentially the same.
The effect of having 2 dry fabric layers actually resulted in a reduction in porosity (Panel #8). This was attributed to two effects: a) the prepreg layers contained enough resin to mostly fill the dry layers (this is consistent with thickness results shown next), and b) the porosity took the form of a few segregated large voids as can be seen in Figure 5. It is suspected that the samples randomly selected for void content measurement did not include these features.
The panel thickness results are summarized in Figure 7. The effect of reducing autoclave pressure (Panels 1–3) had no significant effect on panel thickness except for the edge of Panel #3 where the porosity was visibly the highest. This illustrates the possibility for voids to migrate and coalesce, as has been observed in other literature studies. 1 As seen in Figure 3(I) and 3(J), the voids at the edge have coalesced into elongated regions near the corner, whereas in the center of the panel the voids remained spherical. It is not clear why the voids congregated in this particular region, although it is to be expected that the voids would migrate toward an edge in order to follow the vacuum source. The overall uniformity of these panels’ thickness values, despite large differences in autoclave pressure, could be attributed to the use of impervious vacuum bag sealant as the resin dam. This trapped most of the resin and may have allowed the resin phase to bear a portion of the compaction pressure, therefore resisting compaction from the higher pressures used. The control Panels #4 and #7, which were cured at 1.0 bar in separate autoclave runs, had the same cured ply thickness or slightly less than the panels cured at 3.1 and 5.9 bar. This was attributed to the fewer number of plies (8 plies vs. 12 plies) and smaller dimensions (15 cm × 15 cm vs. 30 cm × 30 cm), which made them easier to consolidate. The effect of increasing water content produced a monotonic increase in thickness for the water spray Panels (#4–6). This illustrates the ability of voids to “loft” a panel. Interestingly, the resin starved panel (#8) was the thinnest panel produced in this study. This was attributed to the lower resin content, which nicely illustrates the contribution that the matrix makes to the panel thickness. Because these panels were dammed, there was little or no resin loss which forced the resin into the two dry layers. Therefore, the resin starved panel could be compacted to a greater degree while still containing some localized porosity. Overall, the thickness was not a good indicator of void content except for the water spray panels. The density results are summarized in Figure 8. Generally, these were inversely proportional to the trends in panel thickness as expected (thinner panel = higher density).
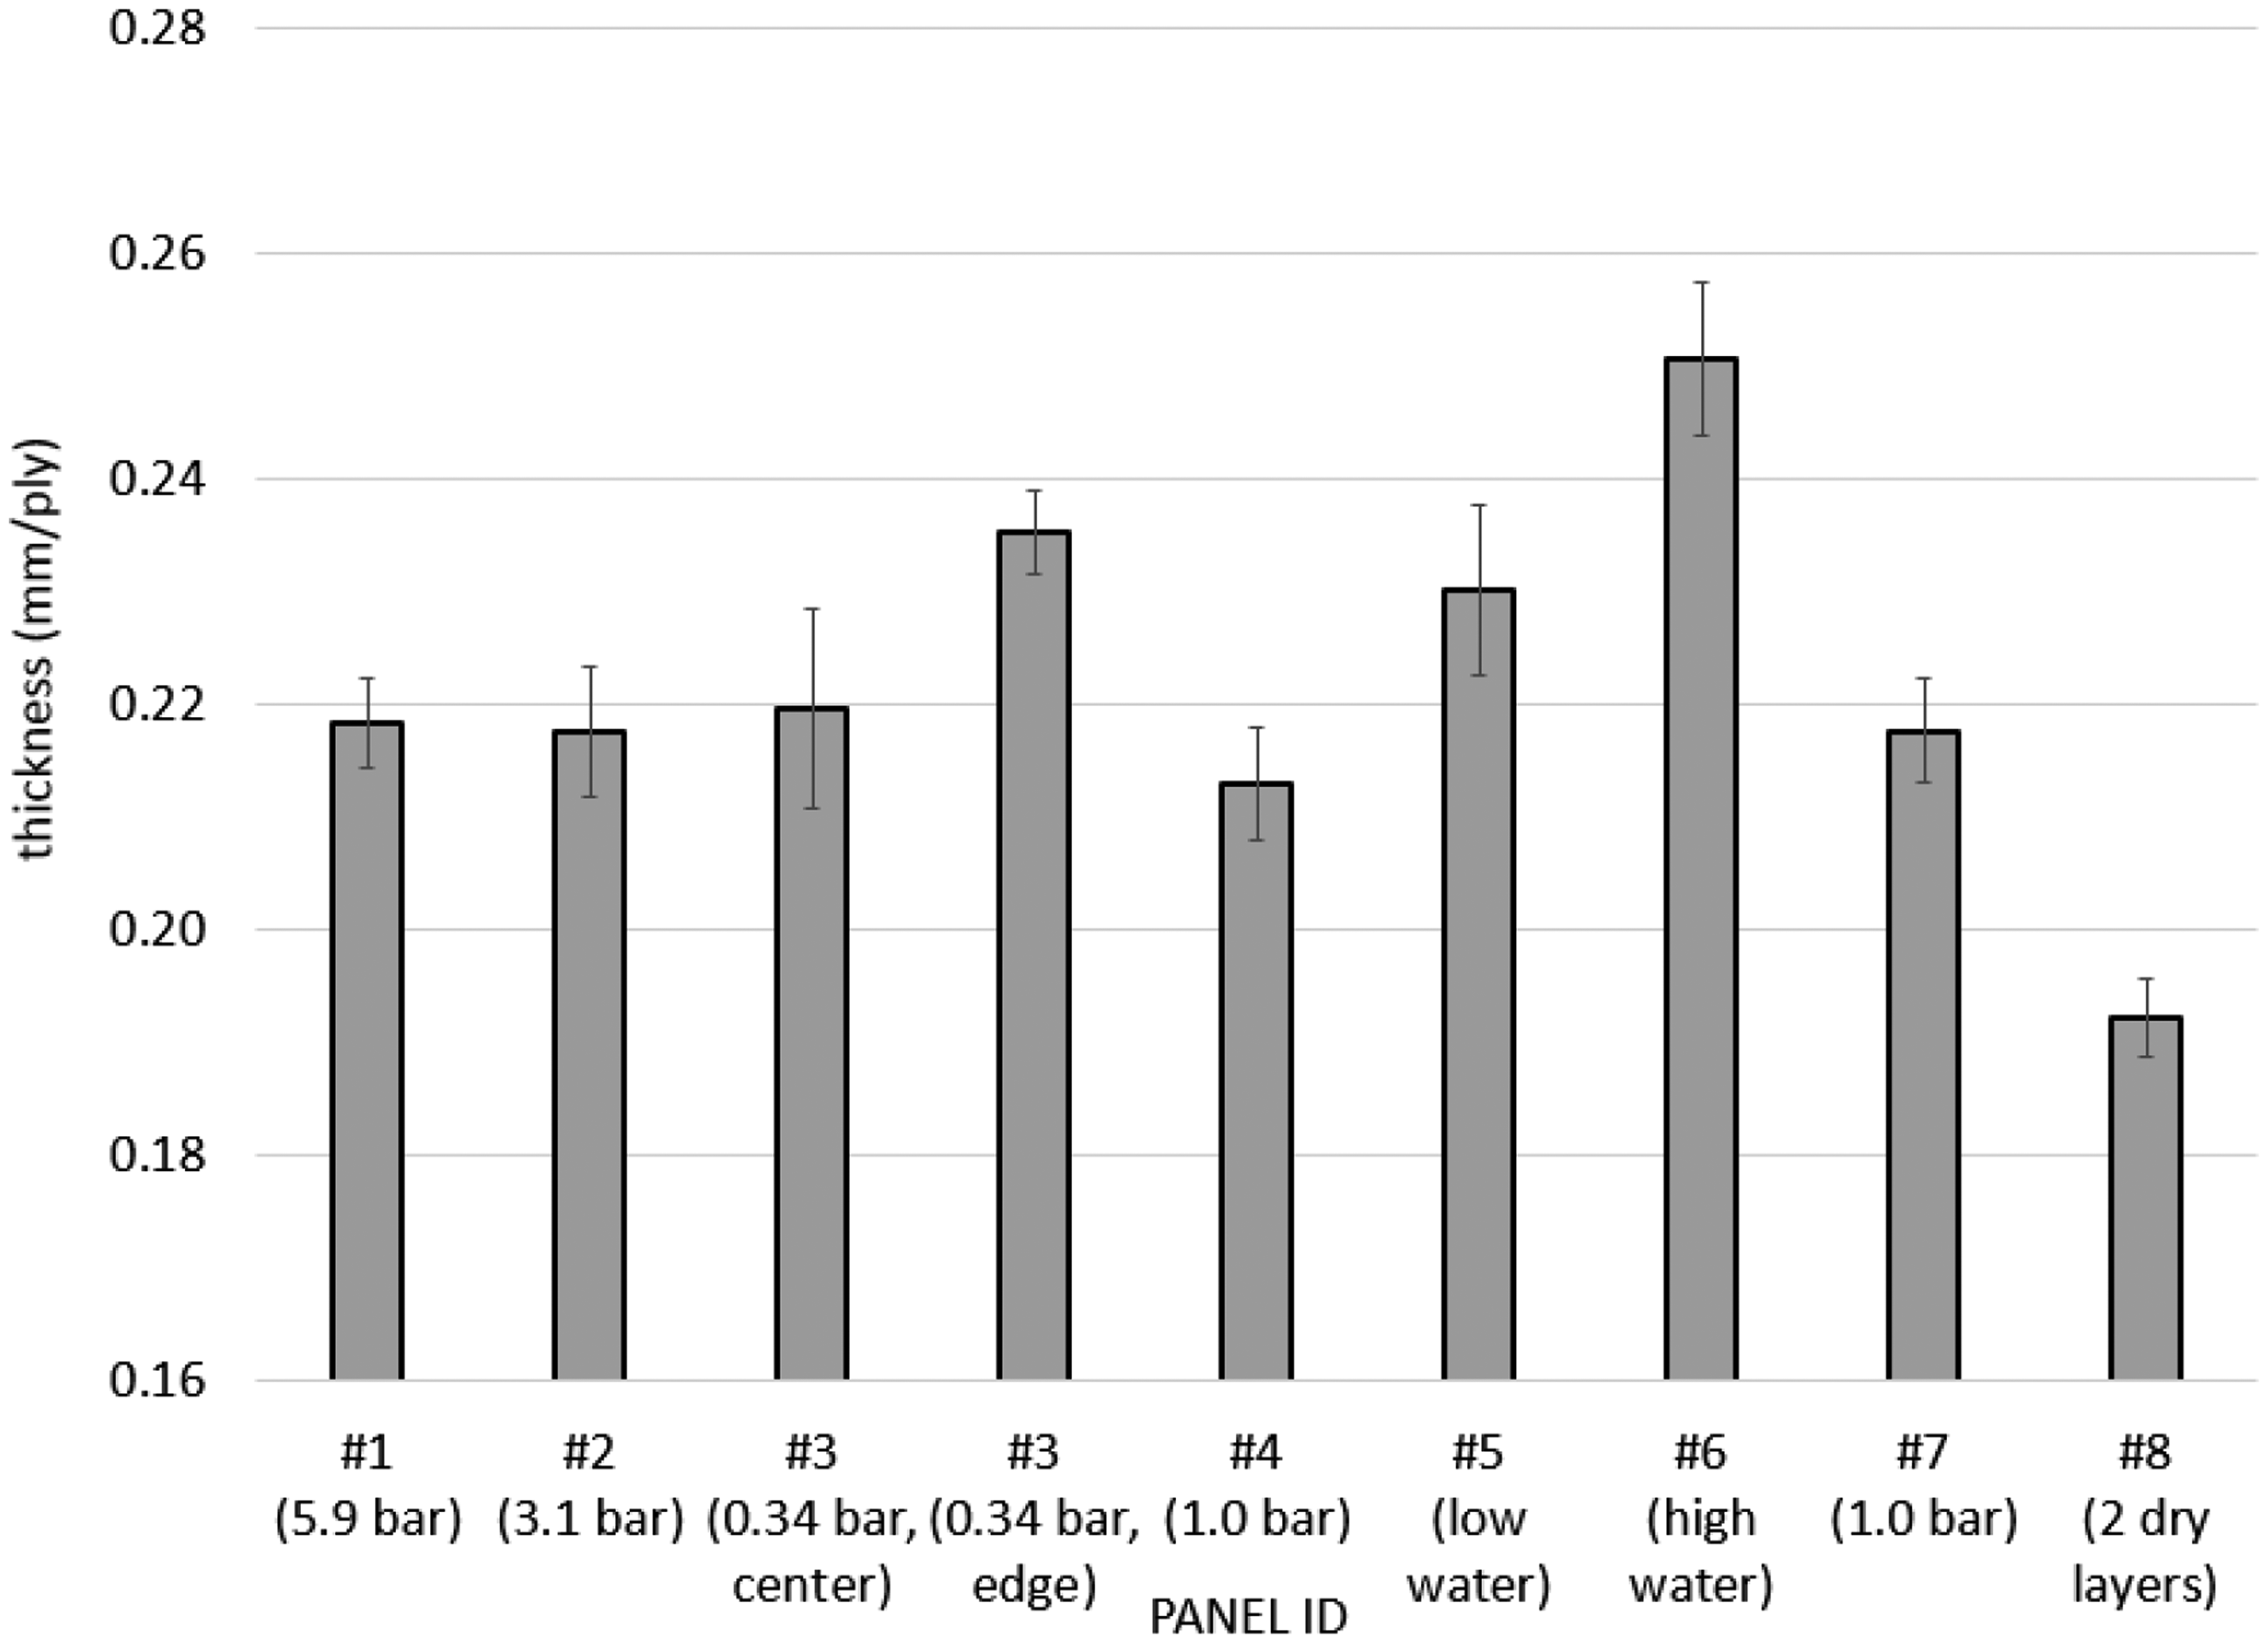
Panel cured ply thickness results. Error bars represent ±1σ of 8–15 measurements taken at random locations in the panel.
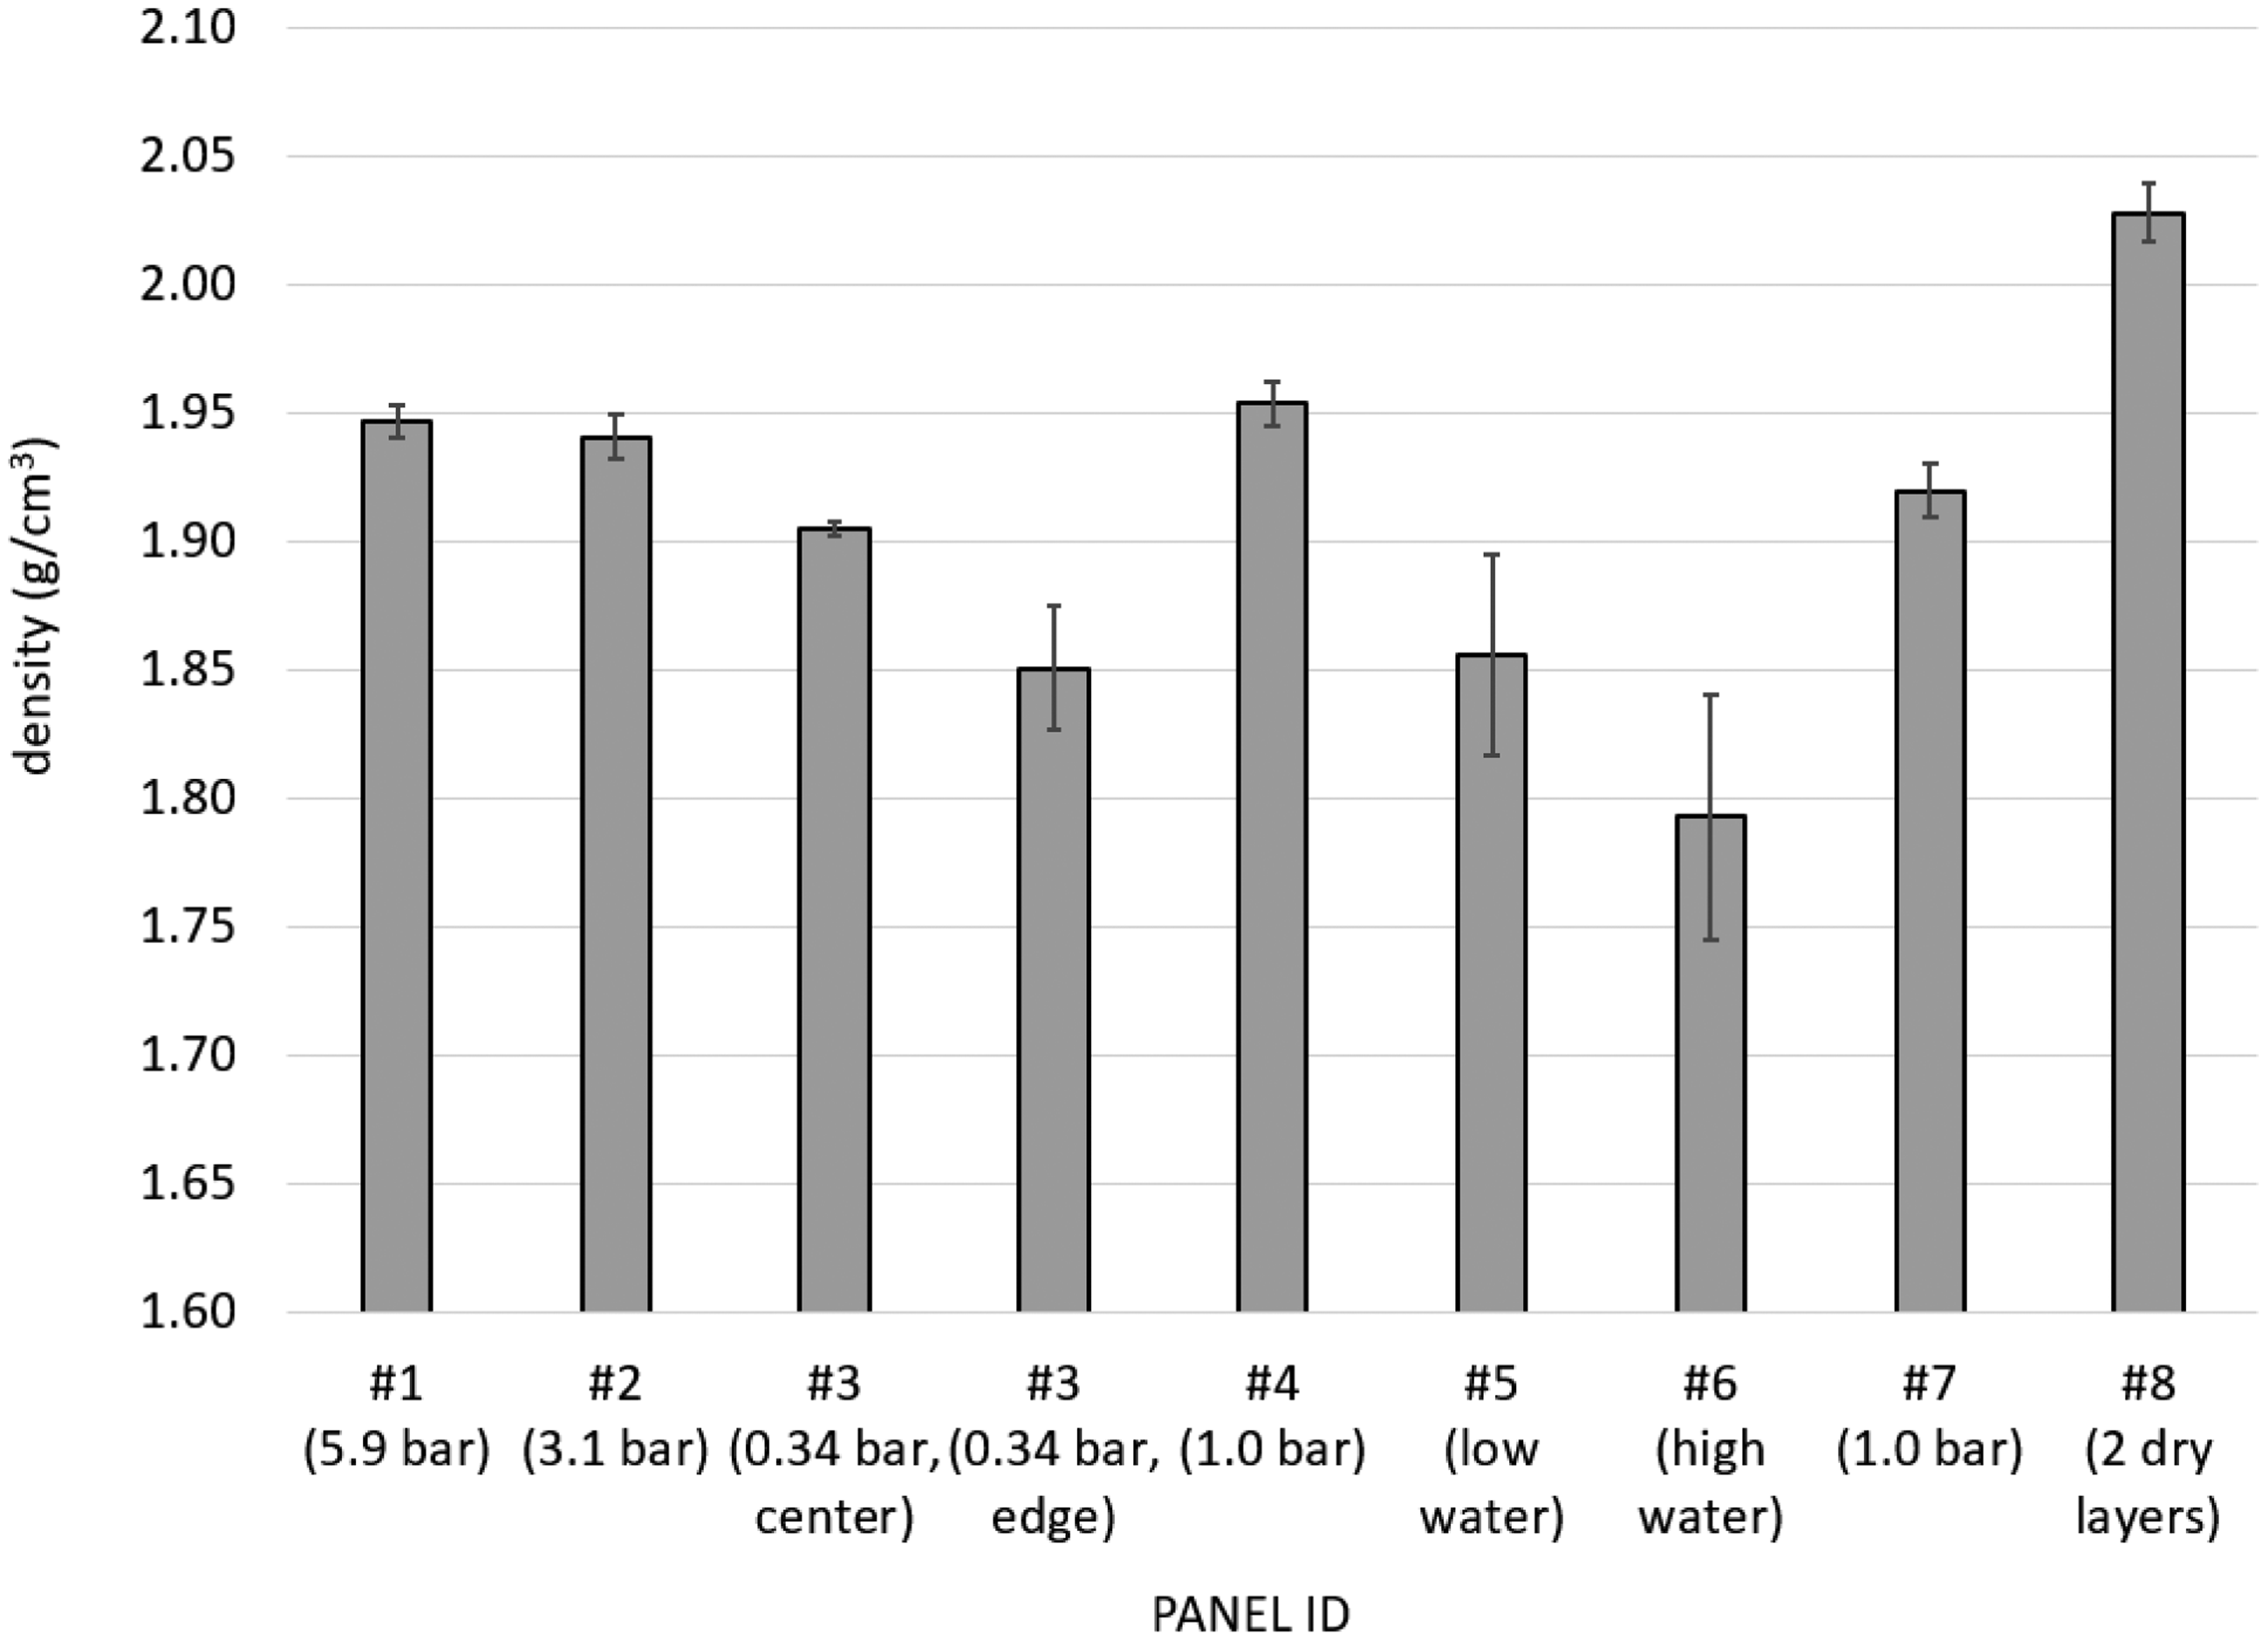
Panel density results. Error bars represent ±1σ of 3–8 measurements taken at random locations in the panel.
The short beam shear (SBS) results are summarized in Figure 9. There was little or no significant difference in SBS strength for panels having a void content of 2% or less, in which case a strength of about 50 MPa was achieved. The panels containing higher porosity (Panel #3 edge, Panel #5 high void area, Panel #6) exhibited a significantly lower SBS strength in the range of 30–35 MPa These results indicate that SBS shear strength was only sensitive to high levels of porosity, with the threshold occurring somewhere between 2–5% void content. The lower porosity panels that contained isolated spherical voids did not appear to suffer loss in SBS strength. In contrast, the high void content panels, which shared a similar morphology, contained voids elongated parallel to the plies and interconnected in some cases.
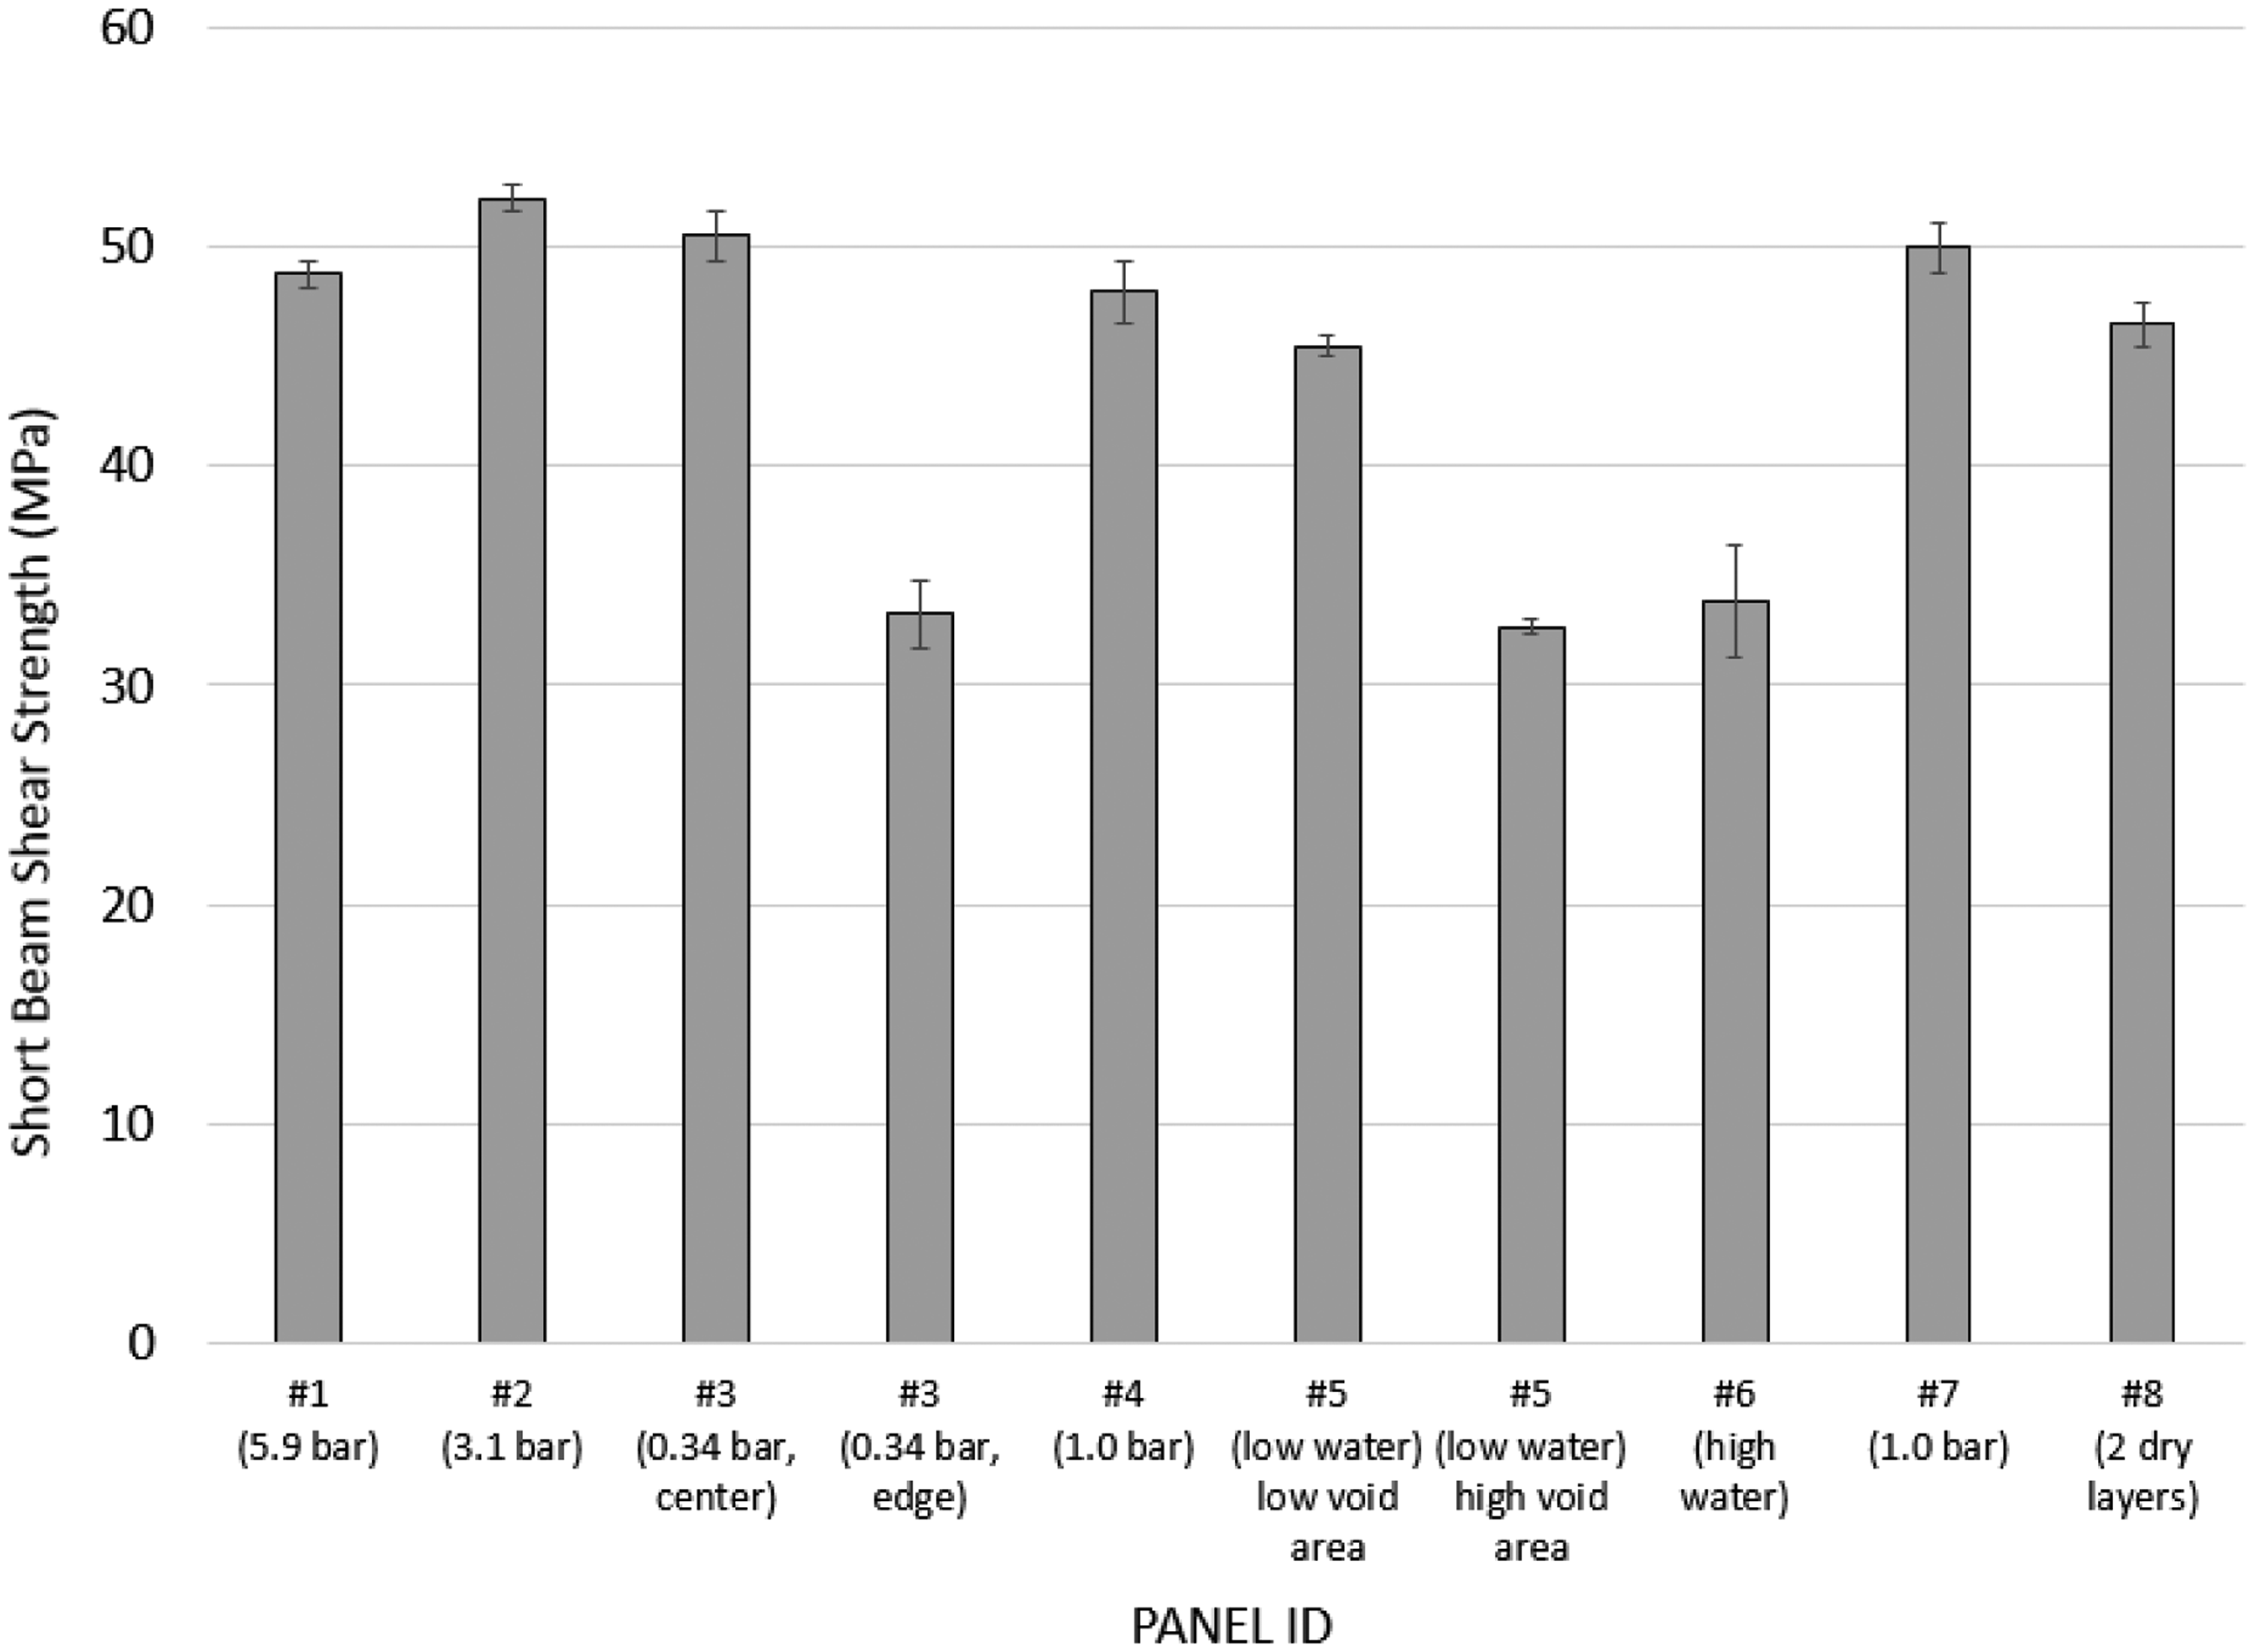
Short Beam Shear results. Error bars represent ±1σ of five coupons each condition.
Failed samples were analyzed with optical microscopy by potting and polishing the side of SBS coupons (see Figure 10). This allowed for viewing of the interlaminar fracture features and their relation to the voids. A common type of SBS failure crack pattern is illustrated by Panels #1–2, as was observed in early literature studies. 33 The fracture initiated under the loading pin at the top center of the specimen, leading to a localized area of compressive bucking of the fibers (shown more clearly in later SEM images). The cracks then propagated downward through the panel in a 45° “stair stepping” pattern to the left side in this coupon, leaving a large visible area of successive delaminations through the thickness. For coupons taken from Panel #3 center location (2% porosity), some of the delaminations ran through voids while others did not. For coupons taken from Panel #3 edge location (6% porosity), most of the delaminations propagated laterally through the voids. The voids helped ease the process of delamination, resulting in significantly lower SBS strength.
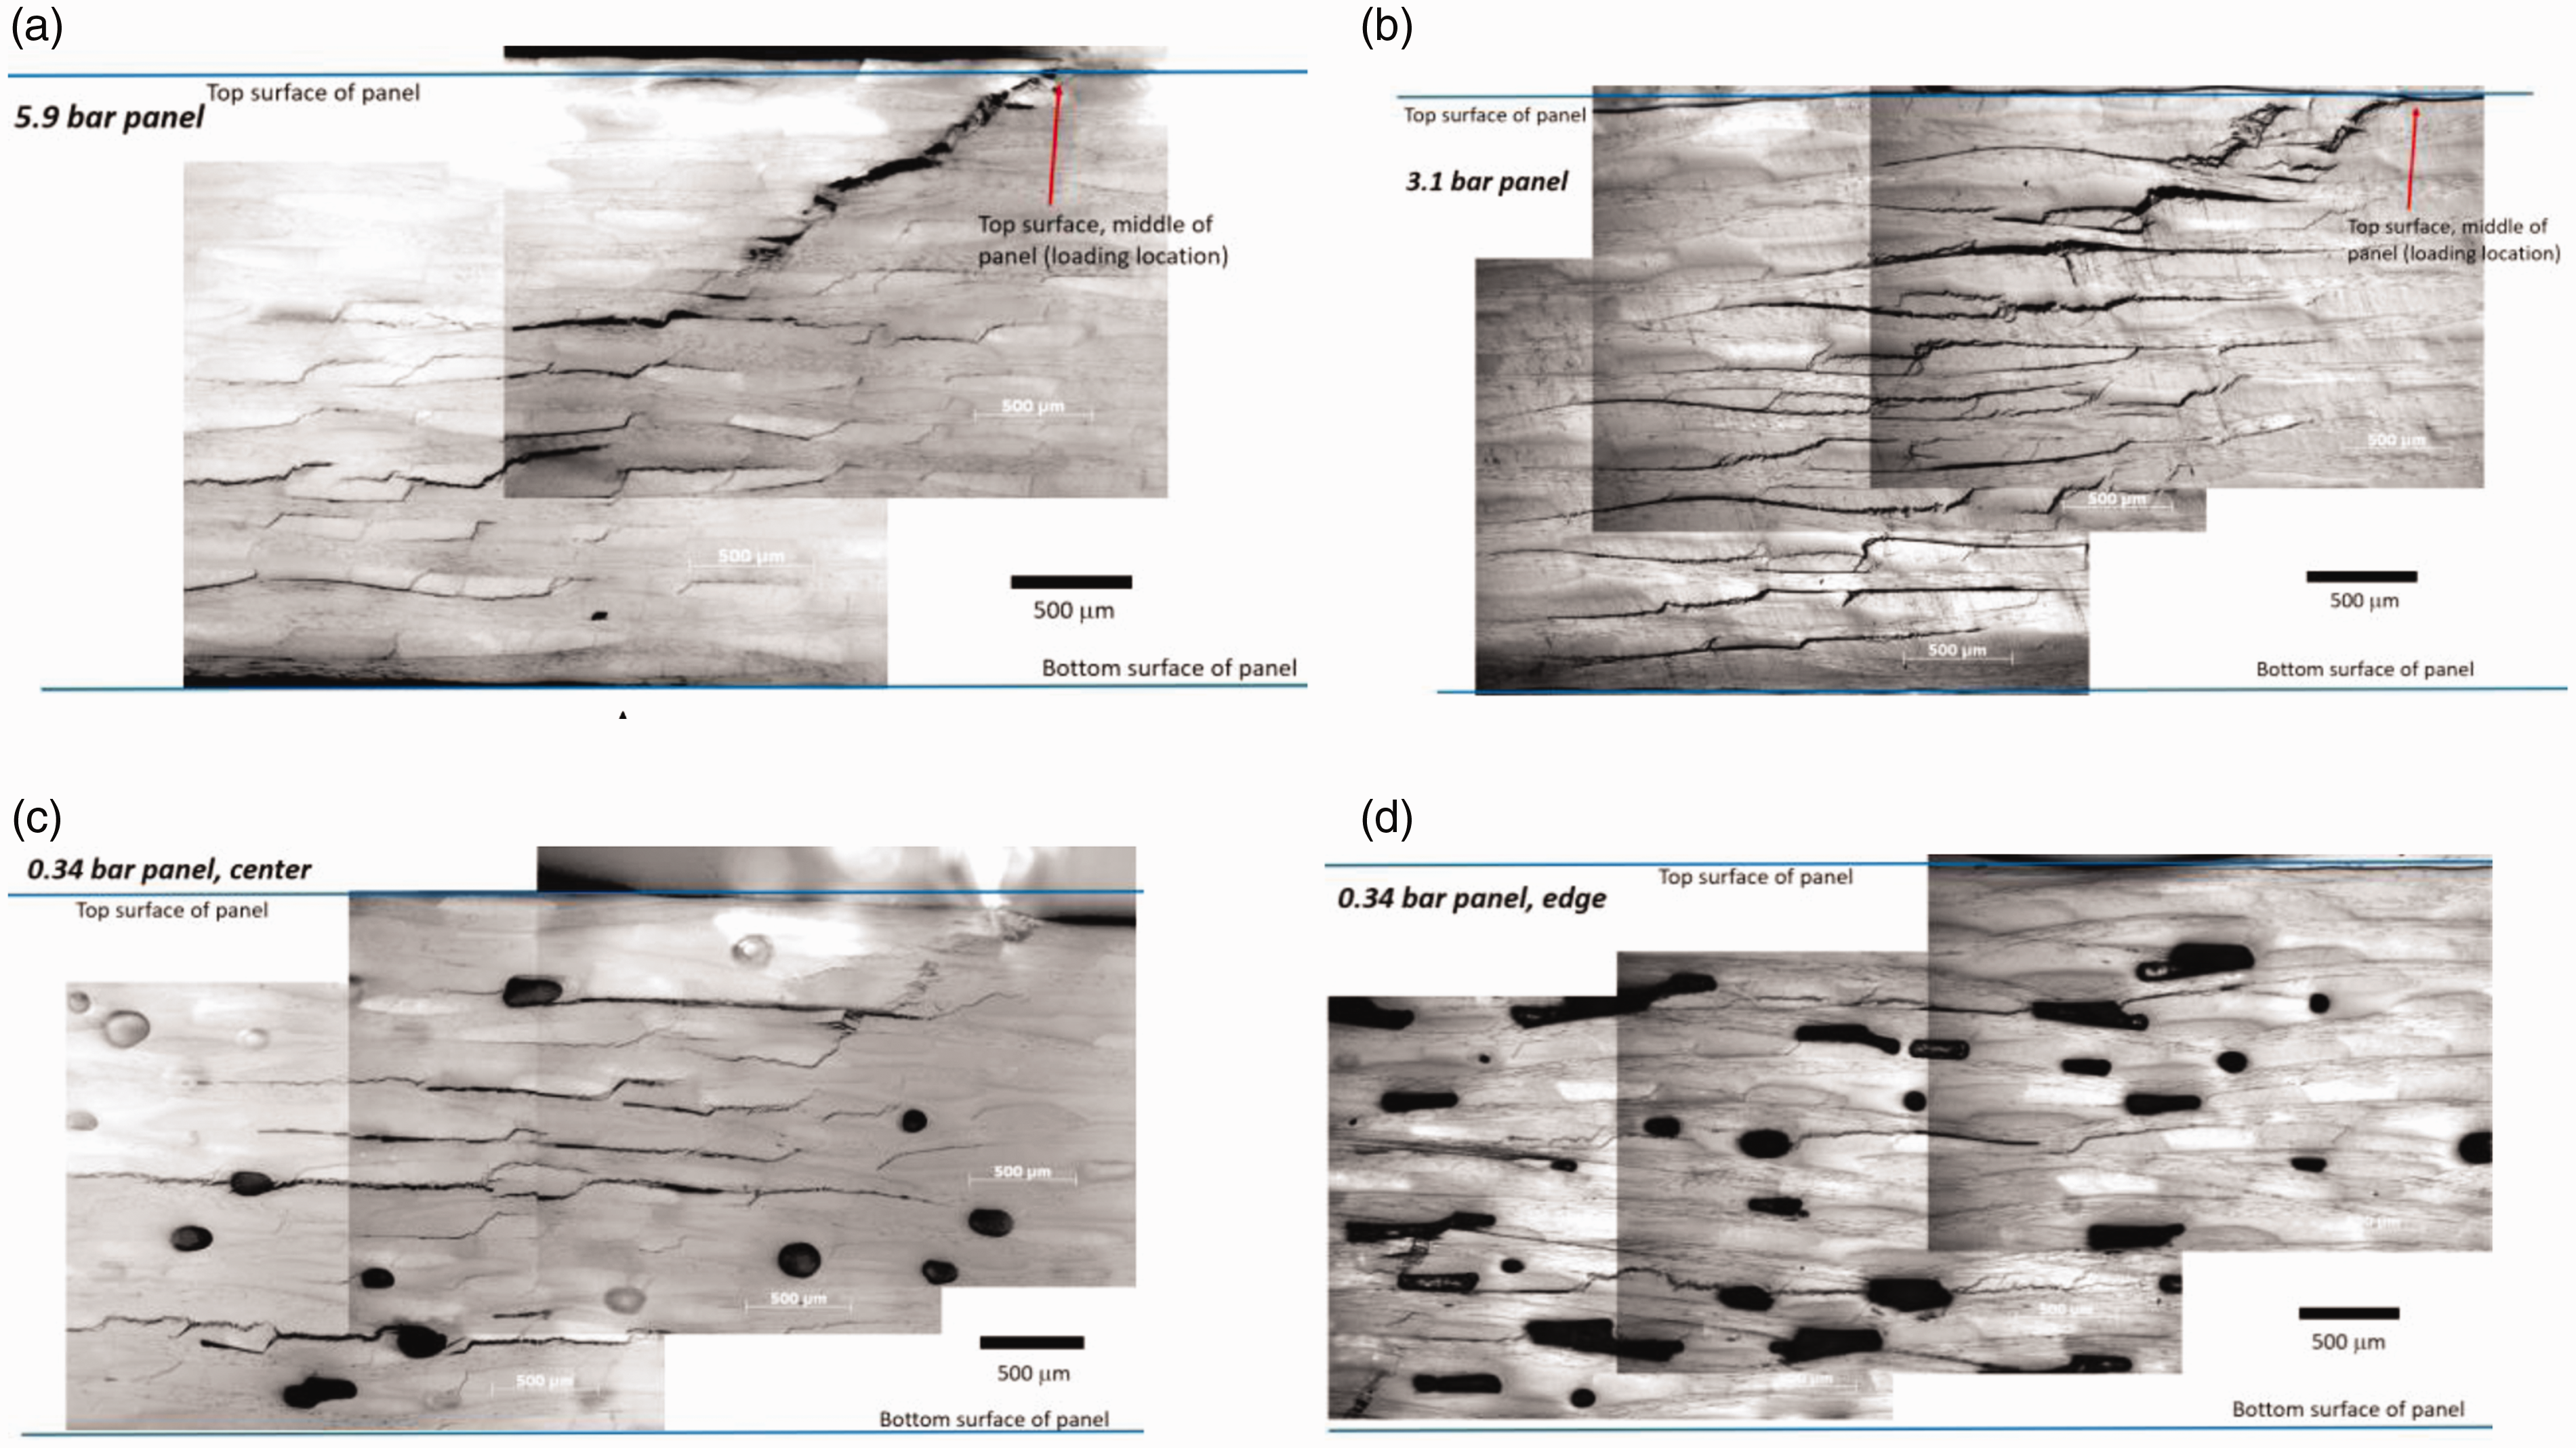
Photomicrographs of SBS failure surfaces for Panels #1–3 (autoclave cured panels) – (a) 5.9 bar, (b) 3.1 bar, (c) 0.34 bar, center of panel, and (d) 0.34 bar, edge of panel.
Photomicrographs for Panels #4–6 are given in Figure 11. Panel #4 (control, no water) had a similar fracture pattern as Panels #1–3. However, Panels #5–6 showed little or no signs of delamination or crack propagation. Their failure could be classified as inelastic deformation as per ASTM 2344. Consistent with this result, the load-deflection curves for these panels were also different (see Figure 12). The water spray panels lacked a distinct load-drop point that would signify a crack propagation or delamination event. Instead, the curves were more rounded in shape. This effect can NOT be attributed to plastization of the matrix from water because the SBS coupons were dried for several days immediately prior to testing. Interestingly, the other high void content panel – Panel #3, edge – also displayed a rounded load-deflection curve, yet its microstructure revealed crack propagation in between plies and through its voids. The load-deflection curves and photomicrographs for Panels #7–8, although not shown here, were similar to Panels #1–3, i.e. clear crack propagation.

Photomicrographs of failure surfaces for water spray panels: (a) Panel #4, (b) Panel #5 high void area, and (c) Panel #6.
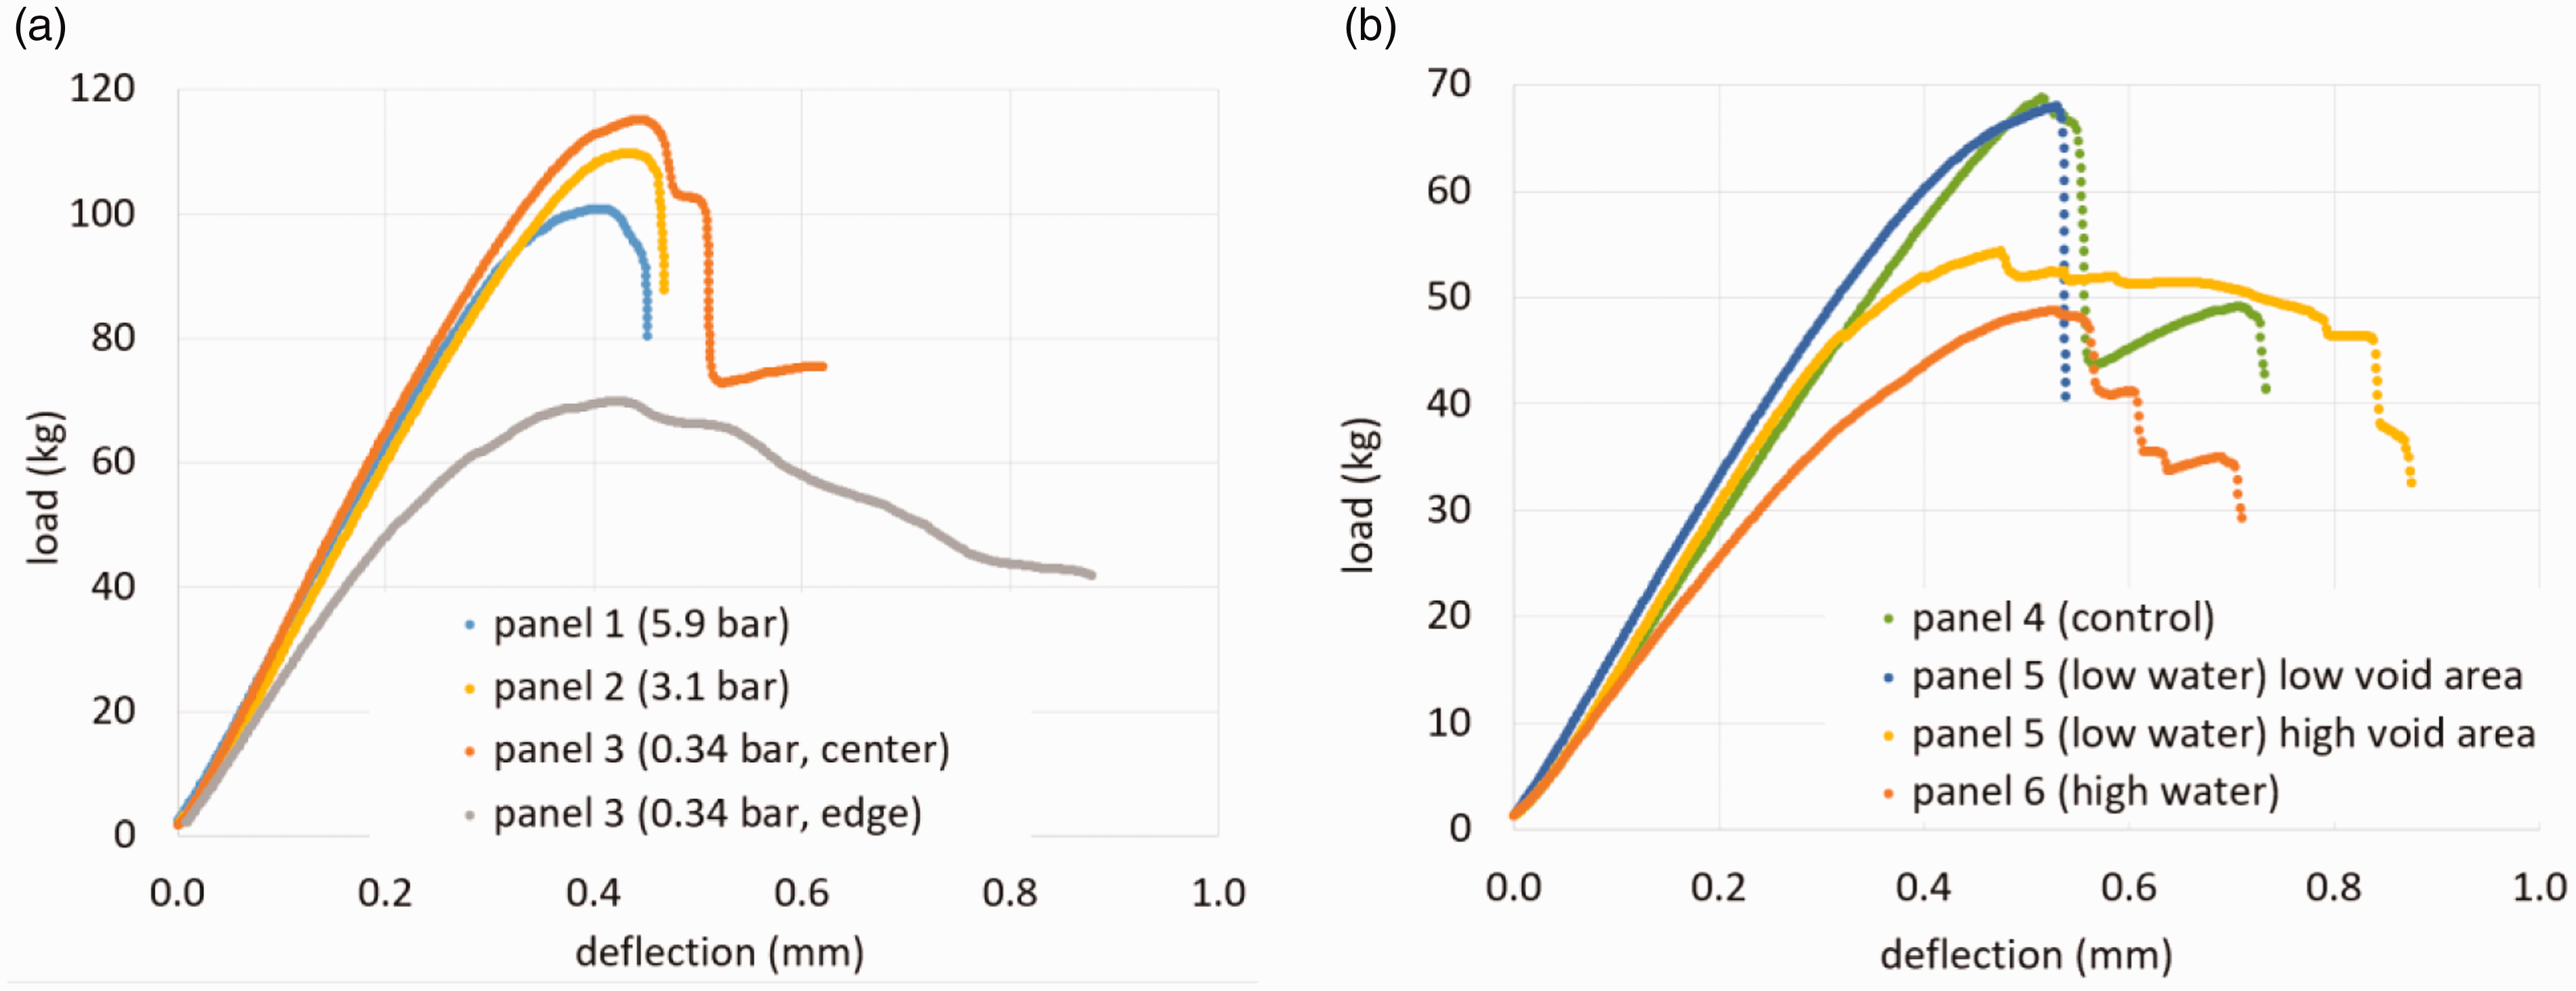
Loading curves for short beam shear coupons. One typical result is given here for (a) each of Panels #1–3 and (b) Panels #4–6.
Overall, the short beam shear results were mixed mode, and not characterized by a single delamination failure. Therefore, the test was not an ideal measure of void dominated properties for the materials. Only specimens with very high amounts of porosity exhibited a significant decrease in SBS, but the failure mechanism were not consistent.
The SEM image given in Figure 13 illustrates several key features of the failure initiation site in the SBS coupons. As expected, there was some localized damage in the area immediately beneath the loading pin. However, the main cracks appear to have initiated from the area where the axial fiber tows buckled, which was slightly below the surface and to the left of the loading pin site. Another common feature was that cracks mainly propagated horizontally along the periphery of fiber tows, rather than through resin rich pockets as shown in Figure 14. In contrast, when cracks propagated downward at a 45° angle, it often occurred through a resin rich pocket.
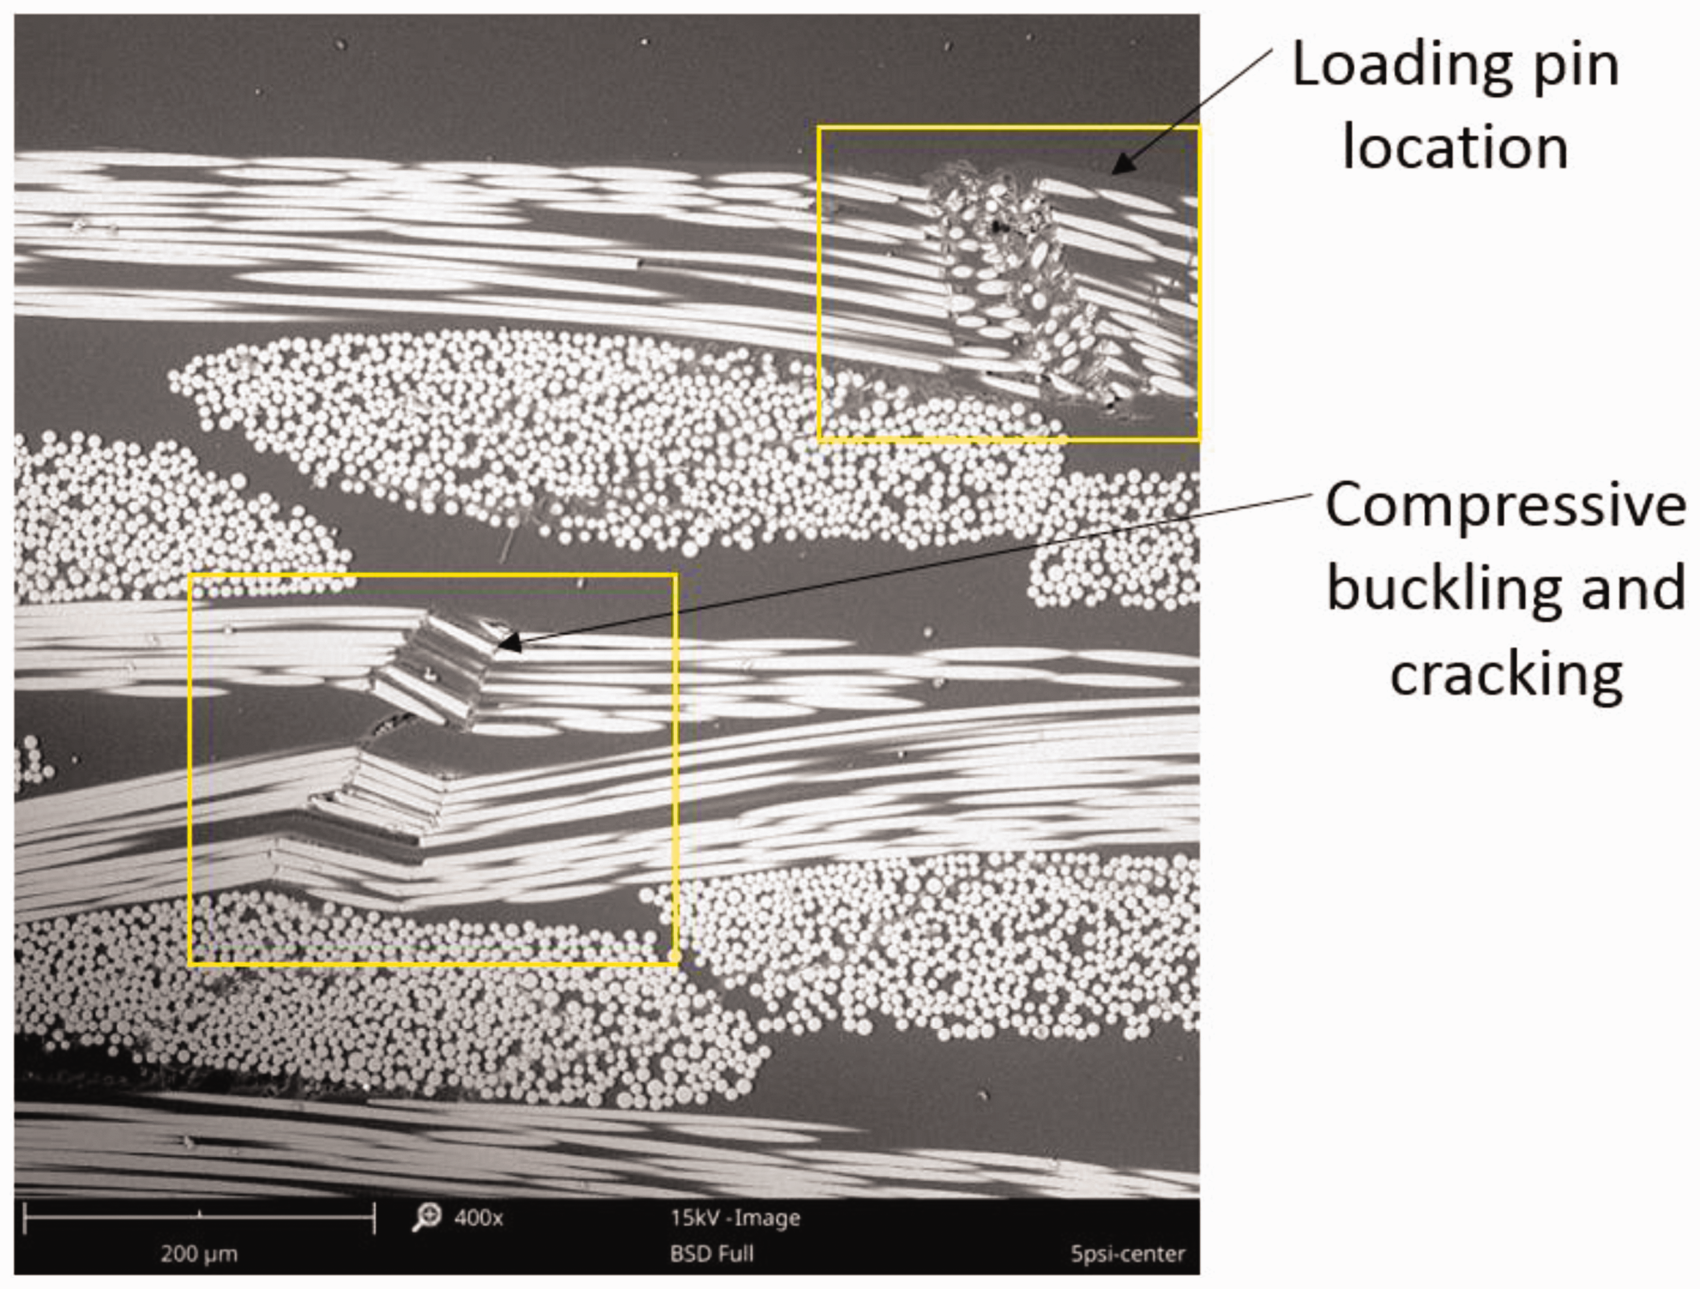
SEM image (400×) of polished edge of failed SBS coupon (same sample as displayed in Figure 10, lower left).
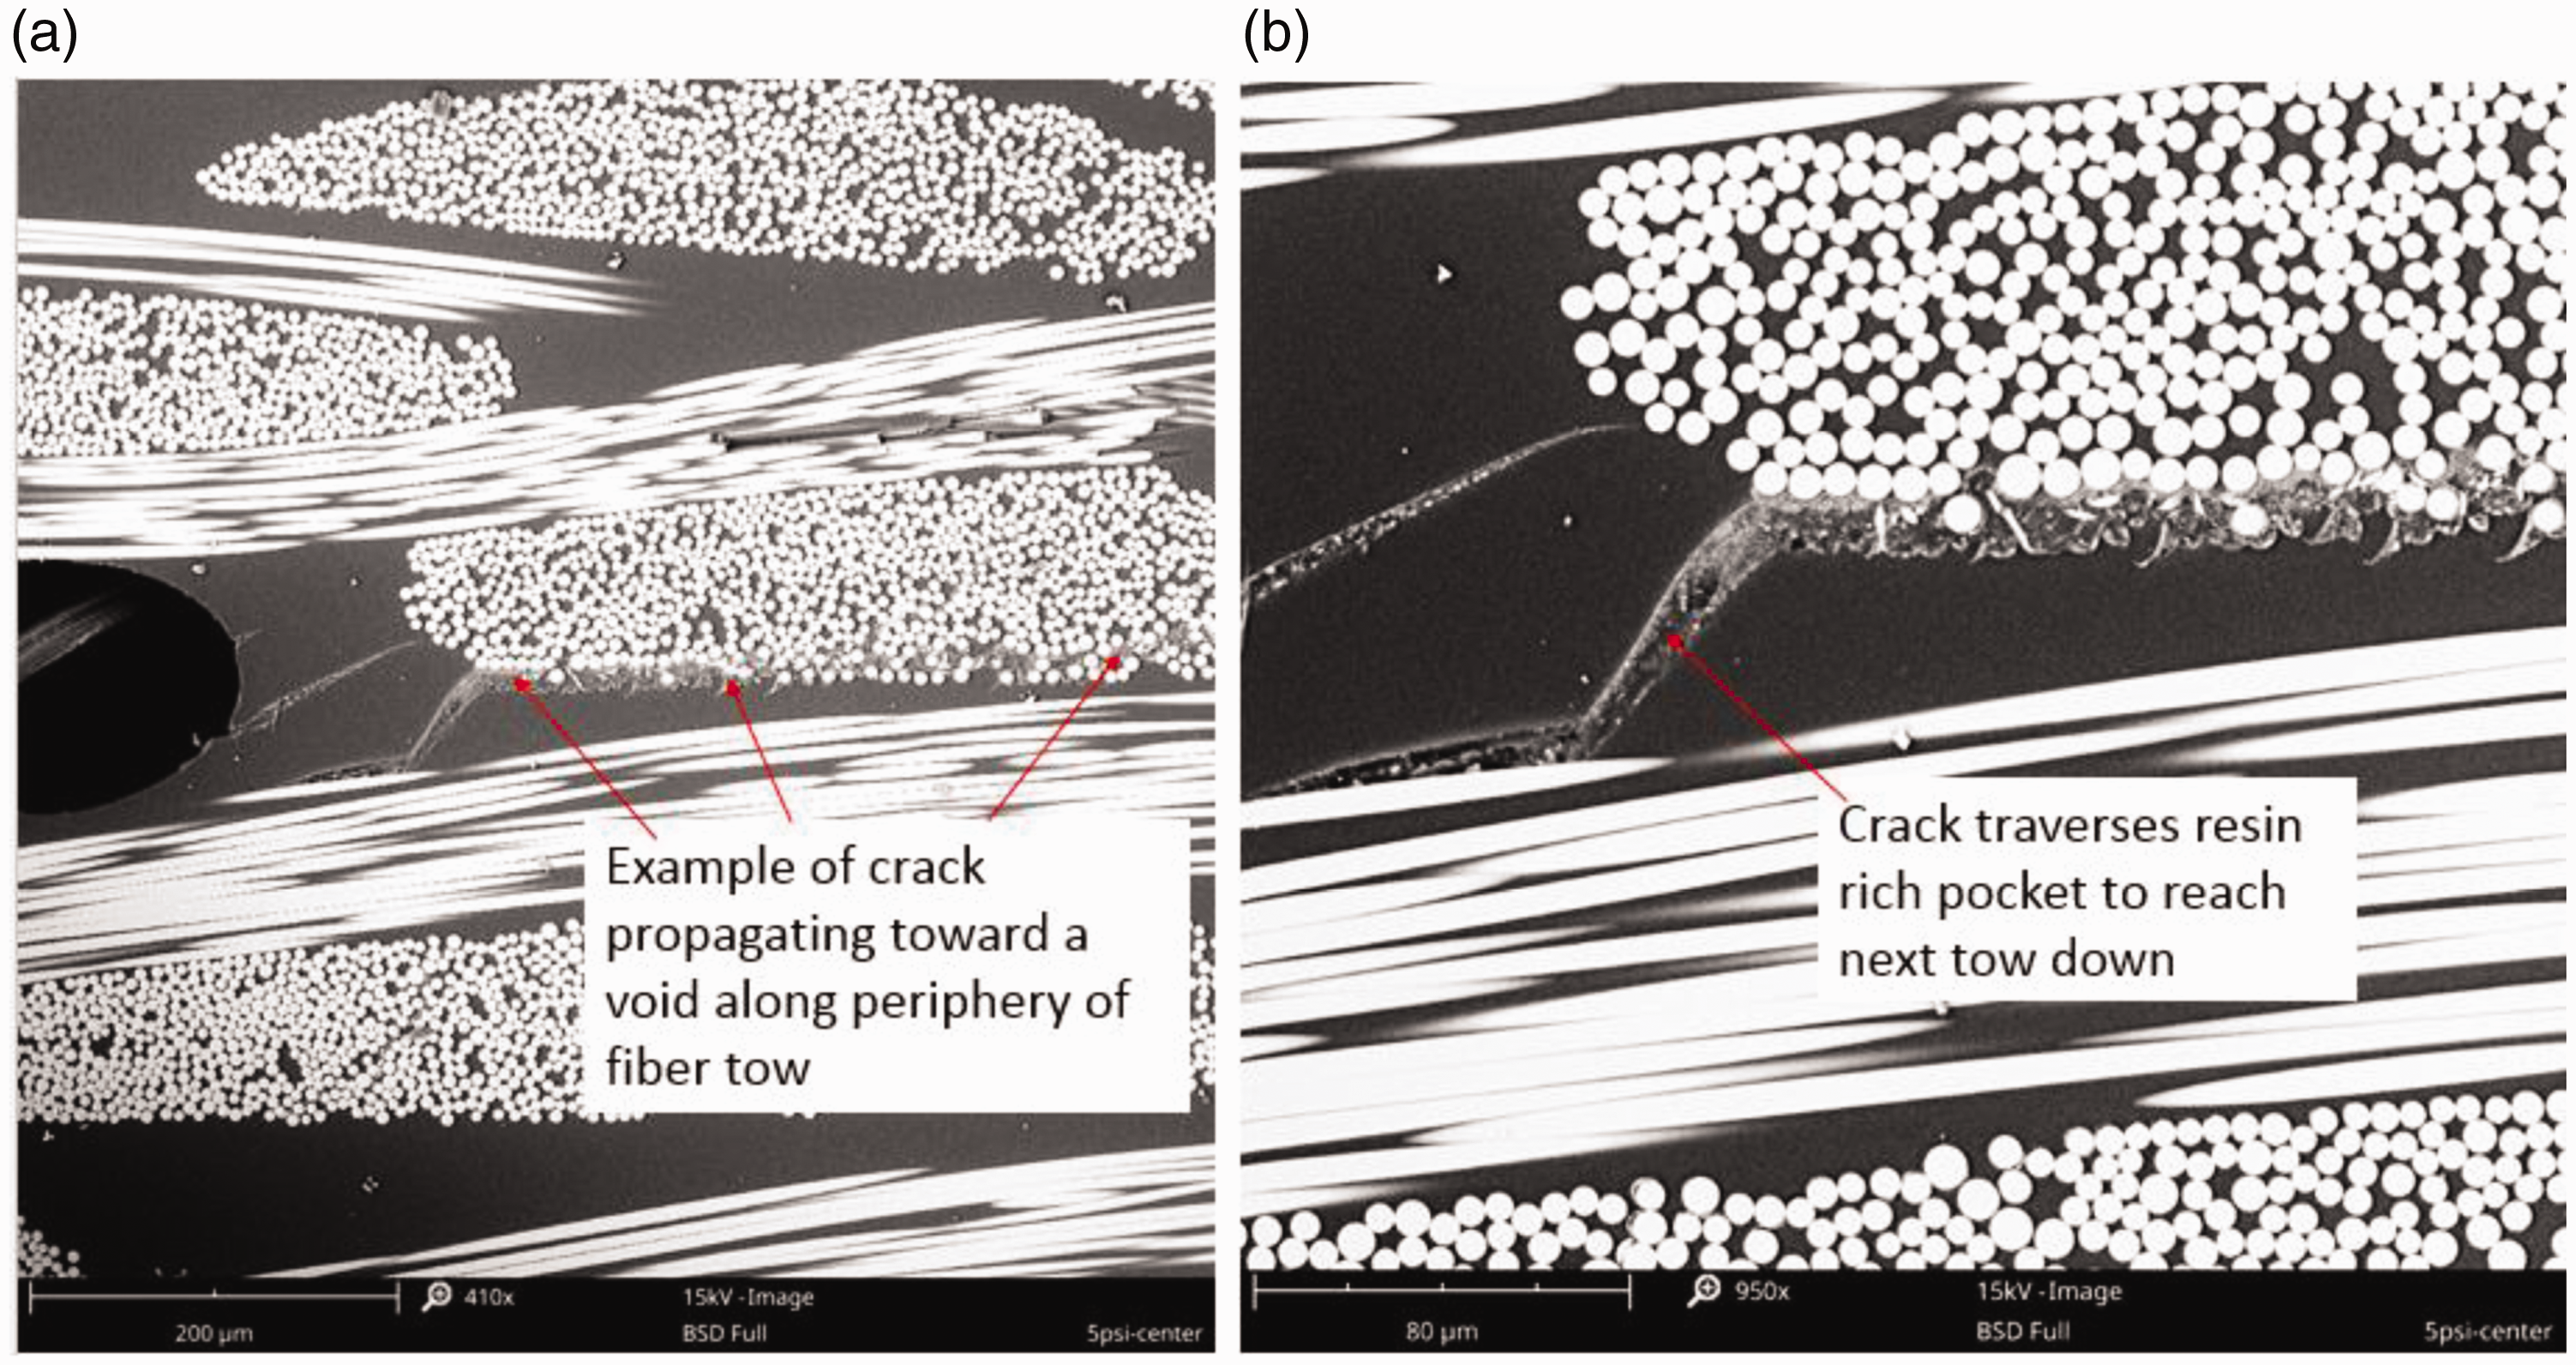
(a) SEM image (410×) showing the nature of crack propagation along periphery of fiber tows, (b) enlargement (950×) of Figure 14(a) showing crack traversing through resin rich pocket.
Details of how a propagating crack interacted with a void are given in Figure 15. Here the crack is seen as propagating from right to left along a fiber tow and into the bottom right side of the void. The crack emerged from the upper left side of the void where a transverse fiber bundle was located. From that point, it propagated essentially along the periphery of the tow, not penetrating it by more than a few fibers. In this example, the crack eventually deflected 45° downward through a resin rich pocket before it reached the edge of the tow.

SEM images of (a) (upper right) example of a crack that propagated from right to left along fiber tows into a void and (b) out the left side of the void. (c) A close up of the crack leaving the void (image b enlarged). (d) The crack continued to propagate along the periphery of the adjacent transverse fiber tow.Note. The same void is shown in all images.
In summary, in SBS coupons that exhibited failure by pronounced crack propagation, the voids did not appear to serve as crack initiation sites. The cracks initiated from compressive buckling near the top of the panel, and propagated downward in a 45° stair step from a combination of horizontal runs (along the periphery of fiber tows) and 45° runs through resin rich zones. The voids participated mainly in the horizontal propagation of cracks, presumably making it easier when they were intersected by a crack. Not all voids were reached by propagating cracks though.
Conclusions
Three strategies for introducing controlled porosity in composites were implemented and evaluated using fiberglass/epoxy prepregs and autoclave curing. The water spray method proved to be the best in terms of producing noticeably different levels of porosity, although the panels required drying to remove residual water after cure. The effect of using different pressures to generate voids was not linear over the pressure range investigated (0.34, 1.0, 3.1, 5.9 bar): significant porosity was only generated at the 0.34 bar condition. The use of dry layers led to either too much porosity (i.e. too many dry layers) or actually reduced porosity due to better ply compaction. The porosity from all three techniques was either oval or elongated in plane between the plies, but it was not uniformly distributed. However, as a general strategy for future studies, it would be possible to extract samples from various locations of the panel, characterize the porosity of each individual coupon via density, and therefore have a way of correlating mechanical results with void content. The use of C-scan proved to be helpful for characterizing overall uniformity of each panel, although the results could not be used to directly compare void content between panels. The use of SBS testing was successful for evaluating void dominated properties in panels with high void content, although it was not very sensitive to coupons with lower void contents. Several interesting observations are offered in this manuscript of the fracture surface details and their relation to the SBS load deflection curves. Overall, it was found that the failure mechanisms were mixed mode and the voids did not serve as failure initiation sites. However, the voids participated mainly in the horizontal propagation of cracks between layers, presumably making it easier when they were intersected by a crack and reducing SBS strength.
Footnotes
Acknowledgements
The authors also wish to thank Dr. Ray Ko of the University of Dayton Research Institute for C-scan analysis and results.
Declaration of Conflicting Interests
The author(s) declared no potential conflicts of interest with respect to the research, authorship, and/or publication of this article.
Funding
The author(s) disclosed receipt of the following financial support for the research, authorship, and/or publication of this article: Funding for this study was provided by Skoltech, Skolkovo Institute of Science and Technology, Director Iskander Akhatov, Master Research Agreement 625-MRA.