






Abstract
This paper presents the development of novel Carbon-Fibre Reinforced Polymer (CFRP) laminates, tailored for the application of Digital Volume Correlation (DVC) and Computed Tomography (CT) to experimental mechanics analyses of these materials. Analogous to surface-based Digital Image Correlation (DIC), DVC is a relatively novel volumetric method that utilizes CT data to quantify internal three-dimensional (3D) displacements and implicit strain fields. The highly anisotropic and somewhat regular/self-similar microstructures found in well-aligned unidirectional (UD) materials at high fibre volume fractions are intrinsically challenging for DVC, especially along the fibre direction at microstructural length-scales on the order of a few fibre diameters. To permit the application of DVC to displacement and/or strain measurements parallel to the fibre orientation, the matrix was doped with a sparse population of sub-micrometre particles to act as displacement trackers (i.e. fiducial markers). Barium titanate particles (400 nm, ∼1.44 vol. %) were found to offer the most favourable compromise between contrast in CT images and the ability to obtain a homogeneous distribution in 3D space with sufficient particle compactness for local DVC analyses. This property combination was selected following an extensive Micro-focus Computed Tomography (µCT)-based qualitative assessment on a wide test matrix, that included 38 materials manufactured with a range of possible particle compositions, mean sizes and concentrations. By comparing the tensile behaviour of the particle-adapted material alongside its particle-free counterpart, we demonstrate through the application of in situ Synchrotron Radiation Computed Tomography (SRCT) that the macro- and micromechanical responses of the newly developed CFRP are consistent with standard production materials indicating its suitability as a model system for mechanistic investigations.
Keywords
Introduction
One of the many strategies for achieving a carbon neutral economy by the 2050s is the use of lightweight, adaptable materials, with high specific properties for transport applications. In this regard, Carbon-Fibre Reinforced Polymers (CFRPs) outperform many monolithic materials, and are increasingly used in transport applications due to their desirable strength- and stiffness-to-weight characteristics. However, any material to be certified for use in high performance and safety critical structural applications, must be accompanied by a good understanding of its mechanical behaviour. 1 As such, knowledge of damage initiation and propagation in composites, and the transition from subcritical to critical damage is key to the design process, along with the development of improved materials.2,3
CFRPs are known to display complex failure modes, typically involving multiple interacting damage mechanisms, occurring over varying length-scales. For example, fibre breaks are highly localized forms of damage, and are limited to a few micrometers in scale. Delaminations on the other hand may occur over millimetre to metre scales, depending on the structure’s size and geometry. 4 In tension, the failure of fibres within 0° plies is regarded as a critical damage mechanism, with the strength of an axially loaded unidirectional (UD) composite being dominated by fibre strength.4–6 Understanding the fibre fracture process, therefore, becomes essential for achieving a comprehensive interpretation of CFRP tensile failure, alongside the various other forms of composite sub-critical damage.7,8
A range of predictive models have been developed and adapted to simulate the processes that lead to ultimate failure in fibre fracture-dominated situations.
4
These commonly include the following concepts:
Fibre strength as a stochastic quantity.
9
This is typically presumed to follow a Weibull distribution.
10
Stress (or strain) transfer mechanisms, or load shedding rules.
11
Around single fibre breaks, the surrounding matrix transfers load, primarily in shear, into adjacent fibres.
9
This stress transfer mechanism reintroduces stress into the broken fibre,
12
while the break (i.e. crack) also triggers local stress concentrations in the nearby intact fibres.13,14 The stress (or strain) concentration factors (SCFs), defined as the relative change in the average stress (or strain) over the cross-section of an adjacent fibre due to the presence of a fibre break, increases the probability of fracture in these intact fibres.1,13,15,16 Evolution of fibre breaks with ongoing loading. Fibre breaks are initially spatially distributed and evolve into cluster of breaks. These clusters consist of multiple interacting fibre breaks, prior to the onset of unstable failure.1,4,5,17–20 The propagation of a ‘critical cluster’ in an unstable, self-sustaining manner. This is associated with the catastrophic failure of the composite.9,13,18,20
Acknowledging that damage in composite materials is a three-dimensional (3D) problem, and in the endeavour to validate these underpinning assumptions of fibre failure-based strength theories, recent years have seen a departure from ‘traditional’ damage assessment methods (e.g. optical microscopy and material sectioning, 21 acoustic emission,2,6,21 scanning electron microscopy 22 etc.) in favour of X-ray Computed Tomography (CT); with this non-invasive 3D imaging technique being further divided into Micro-focus Computed Tomography (µCT) and Synchrotron Radiation Computed Tomography (SRCT). While both acquisition methods can deliver usable micrometre and sub-micrometre voxel resolution levels, superior scans are commonly achieved through SRCT (the beam is brighter, monochromatic, coherent and parallel, thereby avoiding issues such as beam hardening and cone beam artefacts, and facilitating phase enhanced imaging 23 ). Moreover, µCT is characterised by significantly longer scanning times, on the order of hours, as opposed to seconds for SRCT, especially at sub-micrometre resolutions. 23 Near composite failure this may be expected to promote hold-at-load artefacts, whereby the viscoelastic response of the polymer matrix may result in time-dependent strain variation and subsequent failure of UD composites.6,24–26
The pairing of SRCT with in situ tensile loading has led to a paradigm shift in identifying detailed sequences of damage accumulation down to fibre-level, in 3D, within the bulk of real engineering materials under load.1,4,19,20,27,28 As such, considerable progress was made in terms of model validation 29 by specifically studying the evolution of breaks with ongoing loading.1,4,19,20 Recently, developments have seen the use of uninterrupted scan strategies 19 (but at the expense of image quality), mainly aimed at capturing the critical nature of damage required to trigger final failure. Nevertheless, this remains a somewhat hypothetical concept, as even the latest SRCT instruments do not permit observations to be made at sufficiently high temporal resolution to capture the final state of damage in the last instant prior to failure. 19
Experimental studies involving the stress (or strain) transfer mechanisms associated with fibre fracture have received limited attention despite developments in CT methods. Therefore, direct experimental evidence to validate one of the underpinning assumptions of fibre failure-based strength theories remains primarily based on Raman spectroscopy studies.30–33 These measurements are, however, limited to the surface of the material (as they require visible light transmission), and have been generally performed on model microcomposites with a sparse distribution of fibres, which may not exhibit fully-representative stress/strain states.
To bridge this gap in the literature the authors have considered the coupling of in situ SRCT with Digital Volume Correlation (DVC) for a strain-based quantification of the local deformation surrounding fibre break sites in representative materials subjected to a continuously applied load. 8 An extension of the two-dimensional (2D) Digital Image Correlation (DIC) technique, 34 DVC was developed for volumetric measurements, and initially demonstrated as a means to estimate the effective continuum strain tensor in trabecular bone subjected to axial compression. 35 The general objective of the DVC is to track a set of multiple reference volumes between the undeformed and subsequent deformed states of a structure, in order to determine the associated displacement vectors. This may be achieved by employing a correlation criterion (function) to identify underlying patterns within a time (applied load)-series volumetric data set.35,36 In combination with high-resolution 3D imaging, DVC is a tool capable of quantifying the internal/bulk microstructural responses of a material between different load states, by extracting relevant parameters (e.g. local displacements and strains). 37
Ideally, X-ray-based DVC analysis requires the presence of a sufficiently stochastic, isotropic array of features (or texture) which provides X-ray contrast/attenuation.38,39 The highly anisotropic and somewhat regular/self-similar microstructures found in conventional unidirectional CFRPs at high fibre volume fractions are, therefore, intrinsically challenging for DVC, particularly for the analysis of displacements/strains along the fibre direction. The simple cylindrical structure and relatively smooth surfaces of the filaments yields little structural variation along the fibre direction, leading to poor image correlation, and correspondingly inaccurate displacement estimates in this direction within a given ply. 40
This paper is the first from a series documenting the application of DVC to displacement and/or strain measurements parallel to the fibre orientation, ultimately aimed at mapping strain fields at fibre break sites7,8 and other damage critical sites. Here we focus on the material development required to perform such measurements. Following a similar approach to that taken by Brault et al. 41 to generate individual features unique to a particular sub-set, the authors have explored the insertion of sparse populations of significantly smaller particles (<1 µm, as opposed to 150 µm used in Brault et al. 41 ) within the matrix to act as displacement trackers – i.e. fiducial markers.
Whilst adding particles to a material clearly changes its microstructure, previous studies have shown that for low particle concentrations, the mechanical properties of thermosetting matrices can be largely preserved.42,43 This work represents the first detailed evaluation of potential fiducials for DVC on CFRP materials at truly micromechanical levels, resulting in the development of a model system, which may have wide utility for understanding fundamental mechanisms of failure and quantitatively informing mathematical model development.
Materials and methods
Material development
Carbon-fibre and resin system
Fibres suitable for drum winding and prepreg production were selected, specifically, a 12 K non-twisted TORAYCA T700SC-50C tow (Toray Industries Inc., Tokyo, Japan 44 ). This is a polyacrylonitrile-based (PAN) high strength (4900 MPa), standard-modulus (230 GPa) fibre, with a 7 µm nominal diameter. 44 This fibre type has been extensively used in previous works,1,4,5,19,28 providing a database of comparable measurements. A SiPreg SR 8500/KTA 313 dual-component epoxy matrix was used (Sicomin, Châteauneuf-les-Martigues, France 45 ). As per the manufacturer specifications, the resin is characterized by a low initial viscosity (7.0 Pa.s at 20°C), low reactivity, and upon curing has a 65 MPa and 3.7 GPa tensile strength and tensile modulus, respectively. For this work, the former characteristics are considered desirable, allowing for both particle doping and fibre impregnation, without inducing premature curing during manufacture (‘Material manufacturing’ section).
Particle systems
To create microstructural fiducial patterns, the resin was filled with dilute concentrations of a range of commercially available particles of approximately spherical shape (US Research Nanomaterials Inc., Houston, TX, USA
46
). In absorption mode X-ray CT, the imaging contrast arises from the different linear attenuation coefficients of the constituent phases.23,47,48 The attenuation coefficient ‘μ’ (dominated by the photoelectric effect) for a specific point (X, Y, Z) within the material, is given by:
23
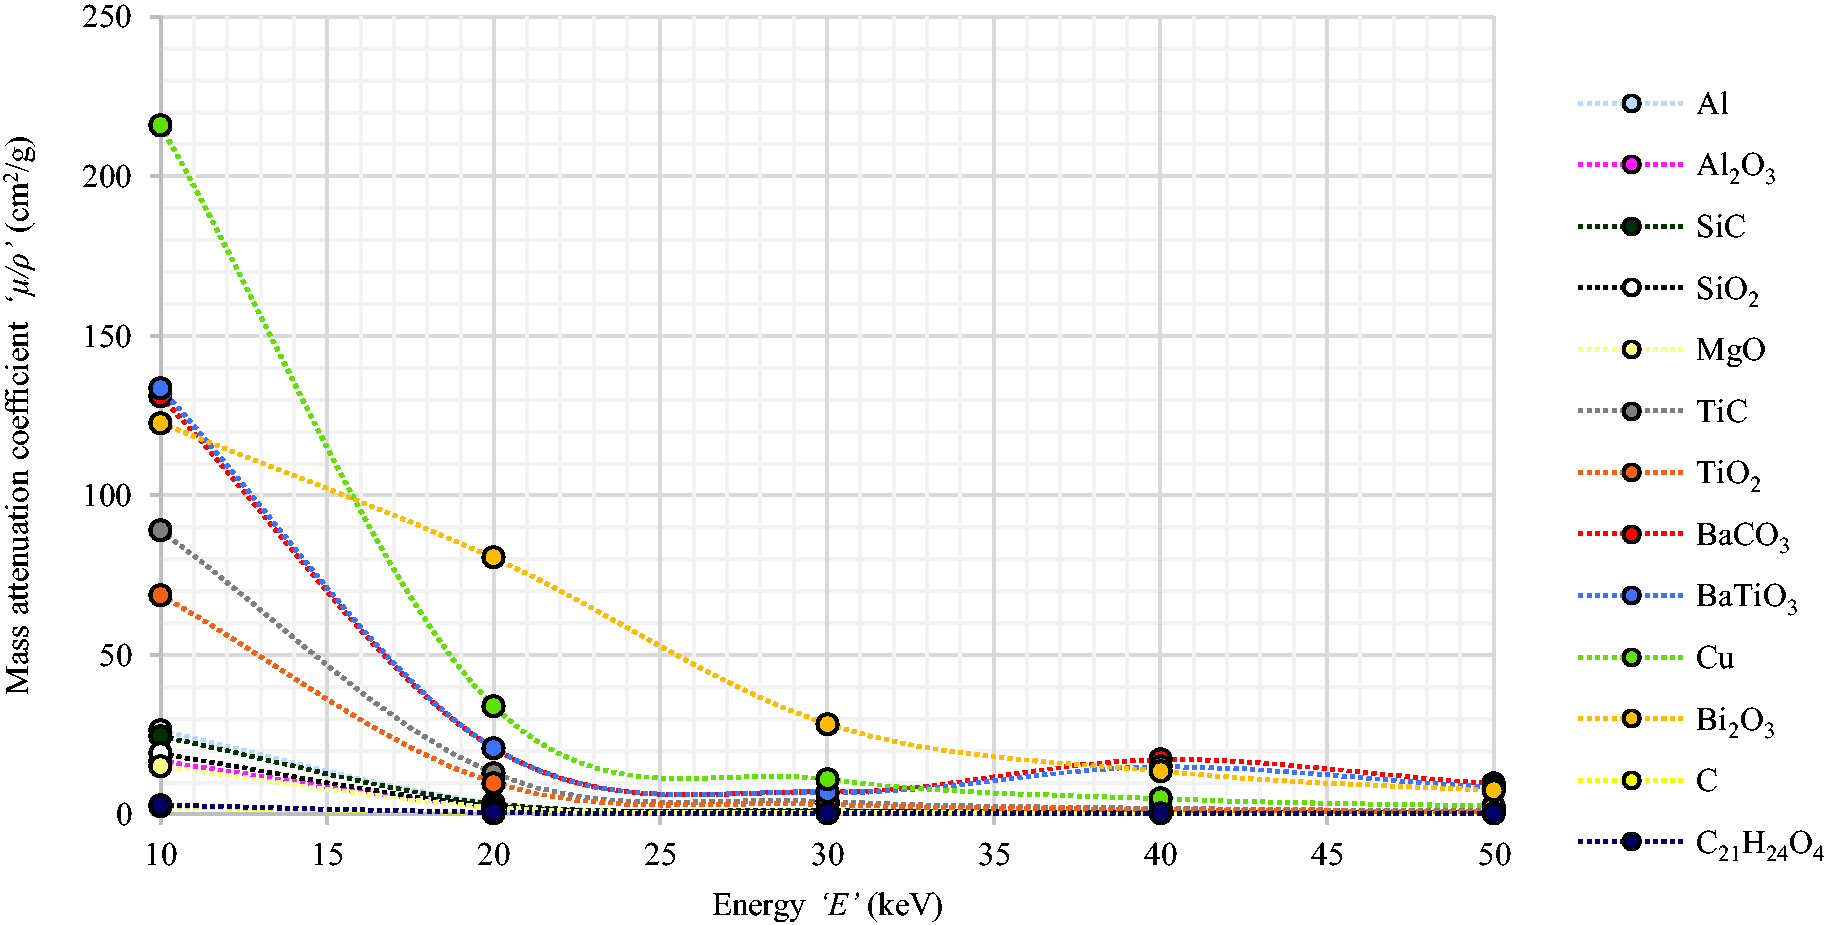
Attenuation profiles for elemental media and compounds, representative of the different phases: matrix, carbon-fibres and fiducial markers. The attenuation of the matrix was estimated using bisphenol A diglycidyl ether (DGEBA), C21H24O4. Based on NIST data National Institute of Standards and Technology (NIST). 49
Experimental matrix showing the particle compositions in conjunction with the concentrations used.

Note. Approximate values based on element (or compound) density.
Experimental matrix showing the particle compositions in conjunction with the nominal particle sizes used.

aAs specified by the manufacturer.
Material manufacturing
Cross-ply laminates, with a [90/0]s layup and thickness of ∼1 mm were manufactured by drum winding at KU Leuven, Belgium. Prior to fibre impregnation, the particles were dispersed in the epoxy system using a combination of high-shear mixing and heated ultra-sonication (U100H bath, Ultrawave Ltd., Cardiff, UK 50 ). No additional treatment was applied to the particle surfaces. To remove entrapped air, the thermosetting mixture was degassed for 10 minutes at ambient temperature. The amount of resin used was 150 g, with 31.5 g of hardener, following the manufacturer’s specified mixing ratio of 100/21 (by weight). A nominal 25% tow overlap was targeted during the winding process, with a maximum spool tension of 0.53 N. To control the volume fraction of the matrix following impregnation, the tow was passed through a metering die with an orifice slot of 0.2 mm x 9 mm. The temperature of the tow spreader and final guide roller were set to 50°C. The fibre sizing was left intact. For a schematic diagram of the manufacturing setup, the reader is referred to Schöberl et al. 7 The drum winding process resulted in uniaxial prepreg tape, ∼0.25 mm thick x ∼350 mm x ∼1900 mm, which was cut and laid up to produce the desired [90/0]s cross-ply layup. As indicated in Figure 2, the prepreg stack was cured in an autoclave for 280 minutes at 0.5 MPa (5 bar) and a maximum temperature of 120°C. To minimize void content in the cured material, a vacuum of ∼0.07 MPa (∼0.7 bar) was maintained throughout the autoclave process. The particle-modified CFRP is identified as ‘doped material’ throughout the rest of this paper.

Schematic illustration of the cure cycle used as part of the autoclave process.
A subsequent set of similar cross-ply laminates was fabricated, without the application of any fiducial markers (‘undoped material’). Identical processing parameters (including shear mixing and sonication) were used in the fabrication of both composite types.
Specimen geometry
Microstructural analysis
Unnotched specimens (∼1 mm × ∼15 mm × ∼1 mm) were machined via water-jet cutting from the manufactured CFRP plates. Three to six specimens, each representative of a different material, were stacked together to form 75 mm long ‘matchsticks’ for conventional static µCT scanning (i.e. no load applied) – see ‘Micro-focus computed tomography’ section.
Tensile testing
Double-edge notched specimens were machined via water-jet cutting for in situ SRCT imaging (see ‘Synchrotron radiation computed tomography’ section). The geometry is based on previous work of Scott, Schöberl, Garcea, Rosini, Moffat, Wright and co-workers,4,5,8,19,20,27,28 although here the total specimen length was increased to 100 mm, as reported in Schöberl et al. 8 and Rosini et al. 20 This was performed to (a) minimize the risk of pull-out from the central 0˚ portion of the gauge region, and (b) to accommodate a smaller X-ray propagation distance, by providing sufficient clearance between the top of the loading rig and detector optics. Once cut, the T-shaped sections of the specimens were tabbed with 1.5 mm thick aluminium sheet. Aerospace-grade adhesive, Scotch-Weld EC-9323 B/A (3 M Company, Maplewood, MN, USA 51 ) was used to bond the tabs onto the CFRP surface. Adhesive curing was performed at 65°C for 2 h according to the manufacturer’s recommendations. The key specimen dimensions, the tabbed assembly and an exemplar microstructure with high contrast fiducial markers are collectively shown in Figure 3. Tensile loading was performed in situ by using a modified CT5000 single-actuator electromechanical rig (Deben Ltd., Woolpit, Suffolk, UK 52 ) retrofitted with a Poly(Methyl Methacrylate) – PMMA reaction tube (25 mm outer diameter and 3 mm wall thickness). Using position control, loading was performed at a displacement rate of 0.2 mm/min up to a prescribed load point. A small applied preload was used (max. 75 N) to ensure that the specimen did not move during initial acquisition and/or manipulator stage translation. Typically, ten load steps were applied for stepwise in situ measurements, with somewhat smaller load increments being made at high loads, close to failure. This was applied on the basis of the work of Scott et al., 4 where fibre breaks have been shown to accumulate exponentially with applied stress, with the majority of breaks occurring above ∼90% UTS. To alleviate potential effects of specimen relaxation under load (and thus potential movement during CT acquisition), scanning was carried out with a slight reduction in load (∼10%) from the most recent peak level applied.
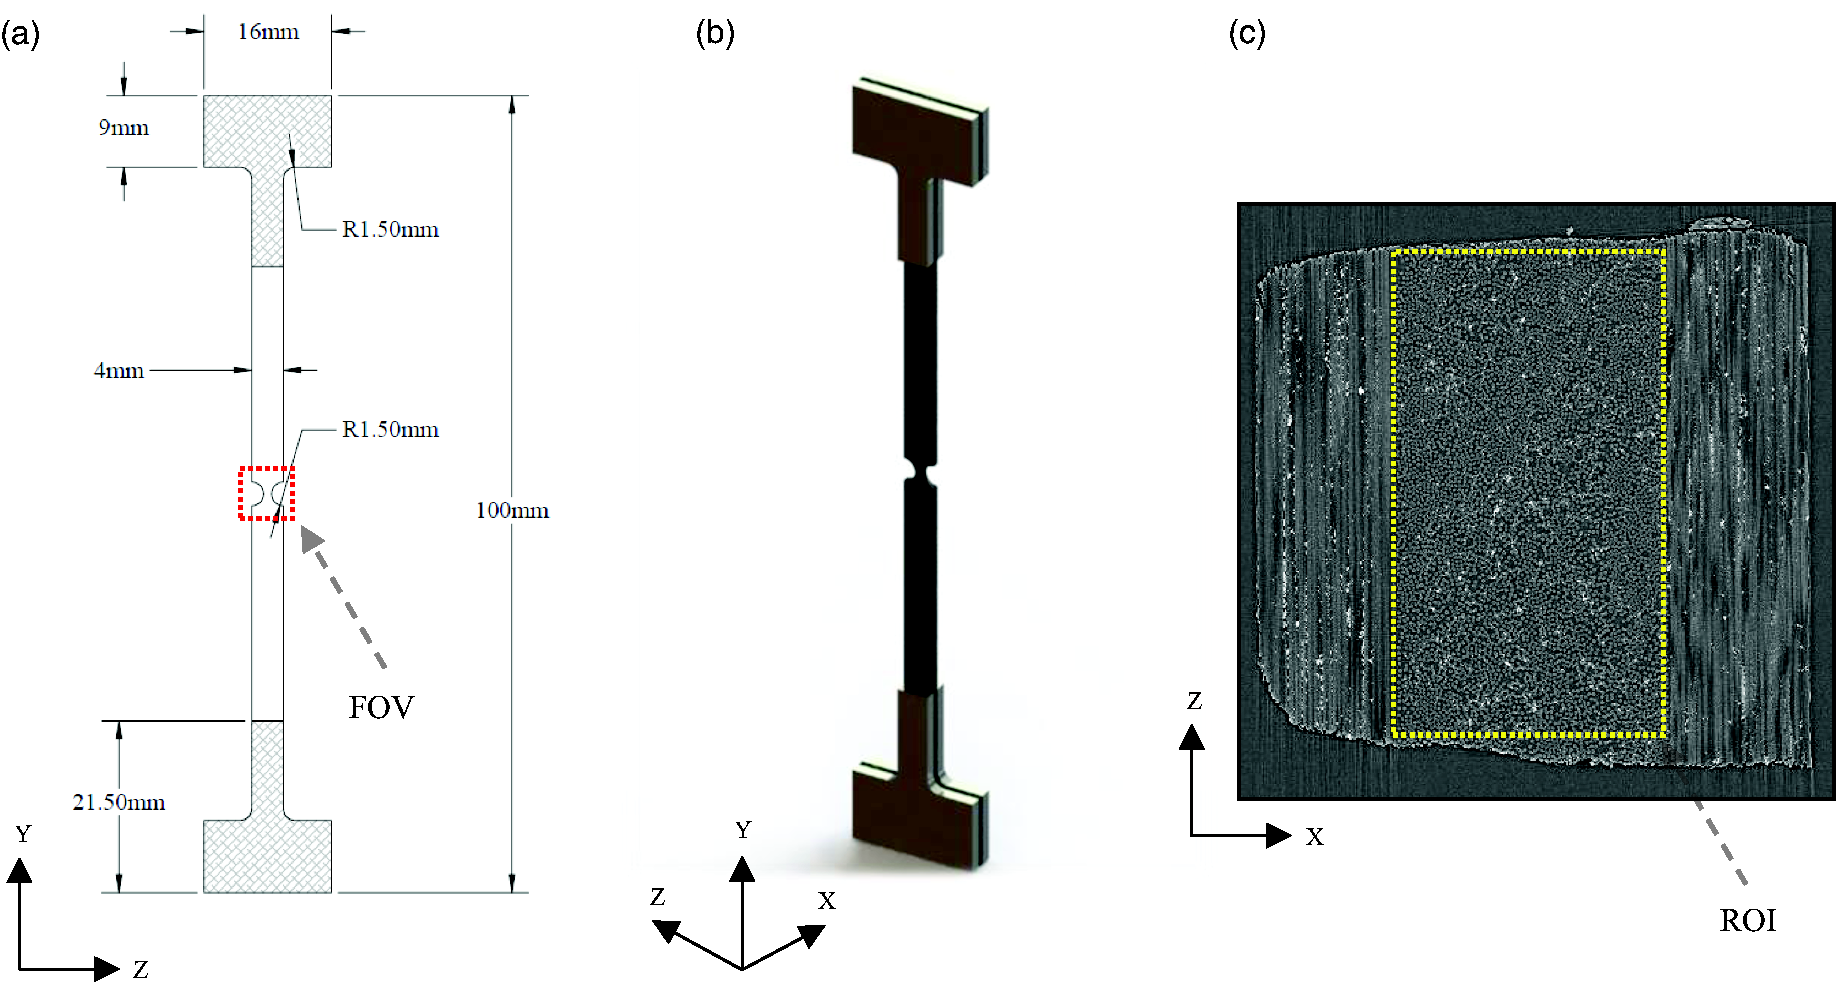
Tensile specimens: (a) key specimen dimensions and field of view (FOV), (b) tabbed assembly (CFRP plus aluminium tabs), (c) SRCT slice showing a cross-section of the notch region doped with high contrast fiducial markers (BaTiO3, 400 nm ∼1.44 vol. %), including the region of interest (ROI), which encompasses the 0° plies.
Based on µCT imaging, three specimens were subjected to SRCT-based tensile testing: one doped with BaTiO3 particles (400 nm, ∼1.44 vol. %, see ‘Microstructural analysis’ section) and two undoped: ‘A’ and ‘B’. Table 3 summarizes the double-notched specimens studied, together with the associated fibre volume fractions (Vf), measured through digital segmentation. Due to experimental time constraints, the undoped specimen ‘B’ was not loaded to fracture.
Basic characteristics of the double-notched specimens subjected to SRCT-based tensile testing.

Micro-focus computed tomography
Micro-focus CT measurements were carried out at the µ-VIS X-Ray Imaging Centre at the University of Southampton, UK. Scans were conducted in a Xradia 510 Versa (Carl Zeiss AG, Oberkochen, Germany 53 ) polychromatic system, equipped with a tungsten transmission target. A 2048 × 2048-pixel detector was used, with a chip size of 13.5 µm. To achieve matching SRCT voxel resolution levels, a two-stage magnification approach was implemented (Resolution at a Distance or RaaD 53 ) combining the geometric magnification of the X-Ray imaging with a set of barrel-mounted scintillator lenses. Scans were conducted at 20x magnification, yielding a voxel size ranging from ∼0.65 µm to ∼0.77 µm. A 2x detector ‘binning’ was used, resulting in a maximum field of view (FOV) of ∼0.74 mm x ∼0.75 mm× ∼0.76 mm. The beam energy was set to 50 kVp and the current to 80 µA. The number of projections acquired per scan was 1601, at a maximum exposure of 7 s, resulting in ∼3.11 h per tomograph. Acquisition was performed over a rotation of ±180°. A source-to-object and object-to-detector distance of ∼13 mm and ∼13 mm, respectively, was used. The data was reconstructed using conventional absorption-based Filtered Back Projection (FBP).
Synchrotron radiation computed tomography
In situ SRCT measurements were performed at the ID19 beamline, European Synchrotron Radiation Facility (ESRF), Grenoble, France. A 2560 × 2160-pixel detector was used, with a chip size of 6.5 µm. Scans, with a monochromatic beam, were conducted at a 10× magnification, yielding a voxel size of 0.65 µm and a FOV of ∼1.66 mm × ∼1.40 mm × ∼1.66 mm. The beam energy was set to 19 keV, with 2996 projections acquired per scan, at an exposure of 25 ms, resulting in ∼75 s per tomograph. Acquisition was performed over a rotation of 180°. A propagation distance of ∼30 mm was used, while the data was reconstructed using conventional absorption-based FBP. Figure 4 illustrates the SRCT experimental setup.
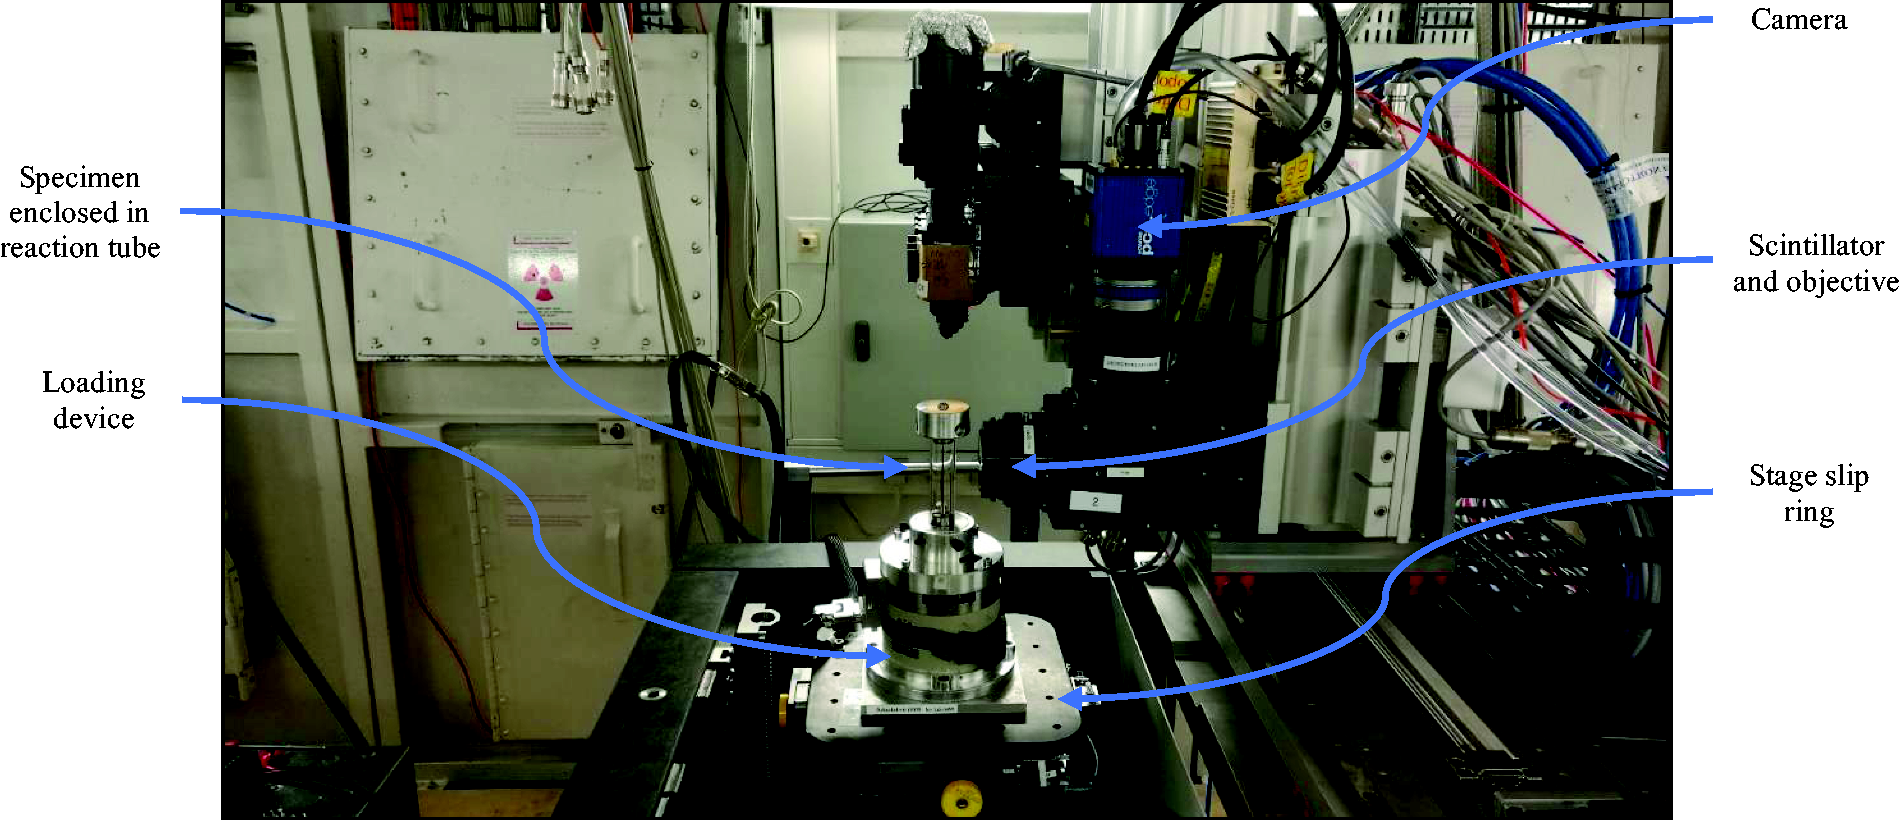
SRCT experimental setup illustrating the key components (ID19 beamline, ESRF).
Image processing
Volume images were extracted from the centre-notch gauge section of the 0° plies, ensuring that the same region of interest (ROI) exists across each load step, for each specimen in part (Table 4). Fibre breaks were hand-counted within the volume stack to minimize false positives/negatives. To ensure that no fibre breaks were omitted (and/or mislabelled), three distinct counts (iterations) were performed across each of the volume stacks. The location of each fibre break was marked in Fiji ImageJ 54 with the centroid coordinates being extracted. Attention was given to centre each mark onto the associated fibre break in 3D space, to within a single-voxel. Fibre break centroids were finally sorted into single, non-interacting fibre breaks (‘singlets’) or clusters of fibre breaks (‘N-plets’), whereby N indicates the number of interacting breaks within a given cluster (e.g. three 7-plets are the equivalent of three fibre break clusters, each comprising 7 interacting breaks, and accounting for 21 breaks in total).
ROI from the 0° plies used for fibre break data quantification (SRCT data, 1 voxel = 0.65 µm).

Following a similar geometrical (proximity) criterion to that used by Swolfs et al. 1 and Scott et al., 4 a cluster is defined here as two or more broken fibres with an axial and radial separation of 10 and 2 fibre diameters, respectively, measured from centre-to-centre. A fibre diameter of 6.8 µm (as opposed to 7 µm) was used to set this criterion, as detailed in Breite et al. 55 This essentially creates a ‘bounding cylinder’measuring 136 µm in the fibre direction (2 × 10 × 6.8 µm) and 27.2 µm in diameter (2 × 2 × 6.8 µm) for each fibre break centroid. If more than one fibre break is located within the boundary of this cylinder, then the respective fibre breaks are considered to be part of the same fibre break cluster. It is important to note that the term ‘cluster’ does not have a consistent definition throughout the literature, so results from different studies must be compared carefully. 19 As noted in Table 4, all post-processing is conducted within a volume of ∼0.34 mm3, extracted from the 0° plies. Additionally, for computational cost reduction reasons, a 32-bit floating point to 8-bit integer conversion was performed for the SRCT data.
Results and discussion
Microstructural analysis
Given the number of materials manufactured, and the evident microstructural variations, initial triage of microstuctures was carried out qualitatively, based on µCT data. This rationale was used to determine the combination of particle composition, size and concentration that results in reasonably homogeneous distributions in 3D space, with sufficient particle compactness for local DVC analyses, without gross anomalies (large voids, clumping etc.). Representative µCT slices from each material are provided in Appendix 1. To preserve the tensile behaviour of a commercially representative material, whilst still allowing the application of DVC parallel to the fibre direction,7,8,40 the authors have established a series of considerations:
Particles must be reasonably attenuating (more so than the carbon-filaments), without introducing X-ray imaging artefacts (particularly streak patterns). Particle size must be small enough to allow for incorporation between individual fibres, essentially creating parallel ‘strips’ of fiducial marks with respect to the fibre direction (Y), minimising influence on fibre packing (and hence misalignment and presence of resin-rich regions). Particles should be sufficiently large to be detectable at the available voxel resolution levels (on the order of three voxels across). Particle concentration must be low enough to prevent agglomeration, yet sufficient for DVC analyses at microstructural length-scales (on the order of one fibre diameter).
Following the above considerations, the materials doped with various particle system are ranked in Table 5. For more detailed comments, the reader may consult Appendix 2. A ‘three-tick' system was used to summarize the overall attributes (one tick = poor, two ticks = adequate, three ticks = excellent).
Ranking system highlighting the overall attributes of the different materials manufactured.

Based on this qualitative analysis, two fiducial markers systems appear to outperform the others on balance: (1) barium titanate (400 nm, 7.5 wt. %) and aluminium (800 nm, 10 wt. %) – Figure 5. This can be further reduced to the barium titanate system based on the following considerations:
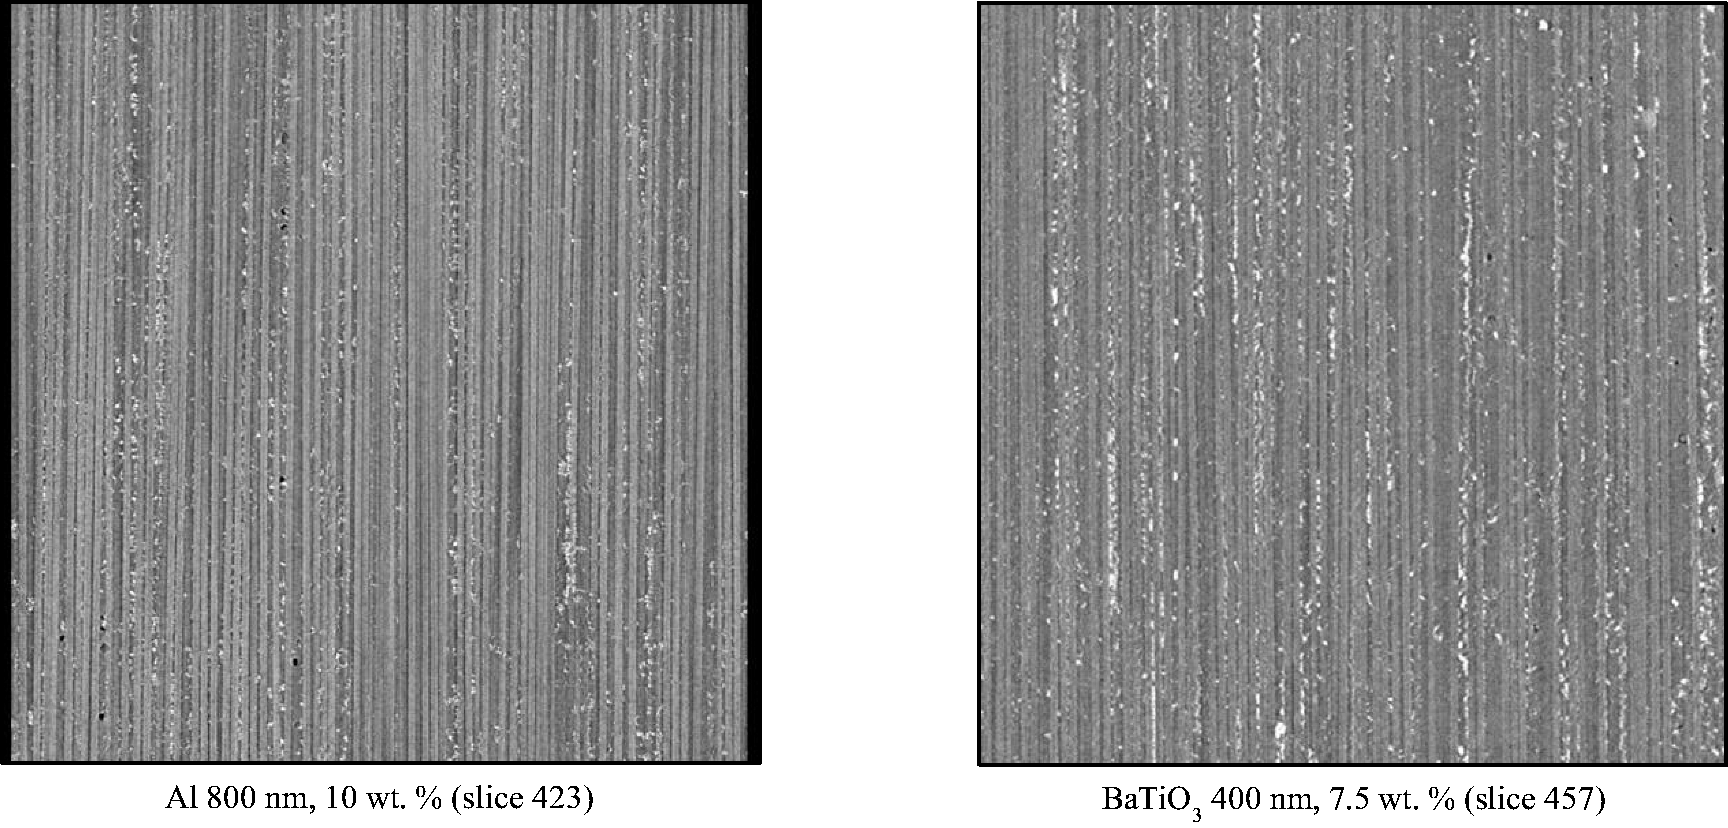
Representative µCT slices showing the doping of the CFRP with aluminium and barium titanate, respectively (0° plies shown).
A better inter-fibre deposition is achieved, which may be attributed to a smaller particle size.
Higher intrinsic density, which translates into a lower volumetric content of ∼1.44 vol. % vs. ∼4.17 vol. % (considered favourable for preserving the mechanical behaviour of standard production materials).
More attenuating at the energies available, which results in a superior imaging contrast next to the carbon-filaments.
As such, the barium titanate particles (400 nm, ∼1.44 vol. %) were judged to offer the most favourable compromise between contrast in CT images and the ability to obtain a homogeneous distribution in 3D space with a sufficiently fine particle distribution for local DVC analyses. Using a threshold of 48/255 for a fully stretched greyscale, the average microvoid content for this material was computed at ∼0.1 vol. %, with a corresponding standard deviation of ∼0.04% across the stack (i.e. individual CT slices). The result is consistent with the acceptable levels of less than 1 vol. % in aerospace-grade applications. 56 The low levels of microvoid content are primarily attributed to the autoclave curing, rather than being an intrinsic characteristic of the drum winding manufacturing process. This becomes more obvious if the CT slices shown here are compared to those in Scott et al., 57 whereby the lack of autoclave curing in a similar filament wound material resulted in fewer voids, but with a substantially larger size: 15 µm in diameter and 105 µm in length, where the length of the void was aligned with the fibre axis.
Fibre break behaviour
A summary of fibre break behaviour as a function of loading is shown in Table 6. Load is presented as a function of force applied, stress (minimum nominal cross-section of the 0° plies, as in literature1,4,19) and fraction of specimen UTS, respectively. It is clear that the undoped specimens achieve significantly higher peak nominal stress (in excess of ∼3000 MPa) cf. the doped composite (∼2300 MPa). Of the undoped samples, only specimen ‘A’ was taken to final fracture, failing at 3651 MPa. The different failure stresses can be expected to be somewhat governed by difference in the volume fraction of fibres (∼55% vs. ∼63%), rather than just the presence of the fiducial marker system. It is noted that:
Summary of fibre break behaviour as a function of applied load, stress and % UTS: (a) doped specimen, (b) undoped specimen ‘A’, (c) undoped specimen ‘B’. Based on in situ SRCT tensile data.

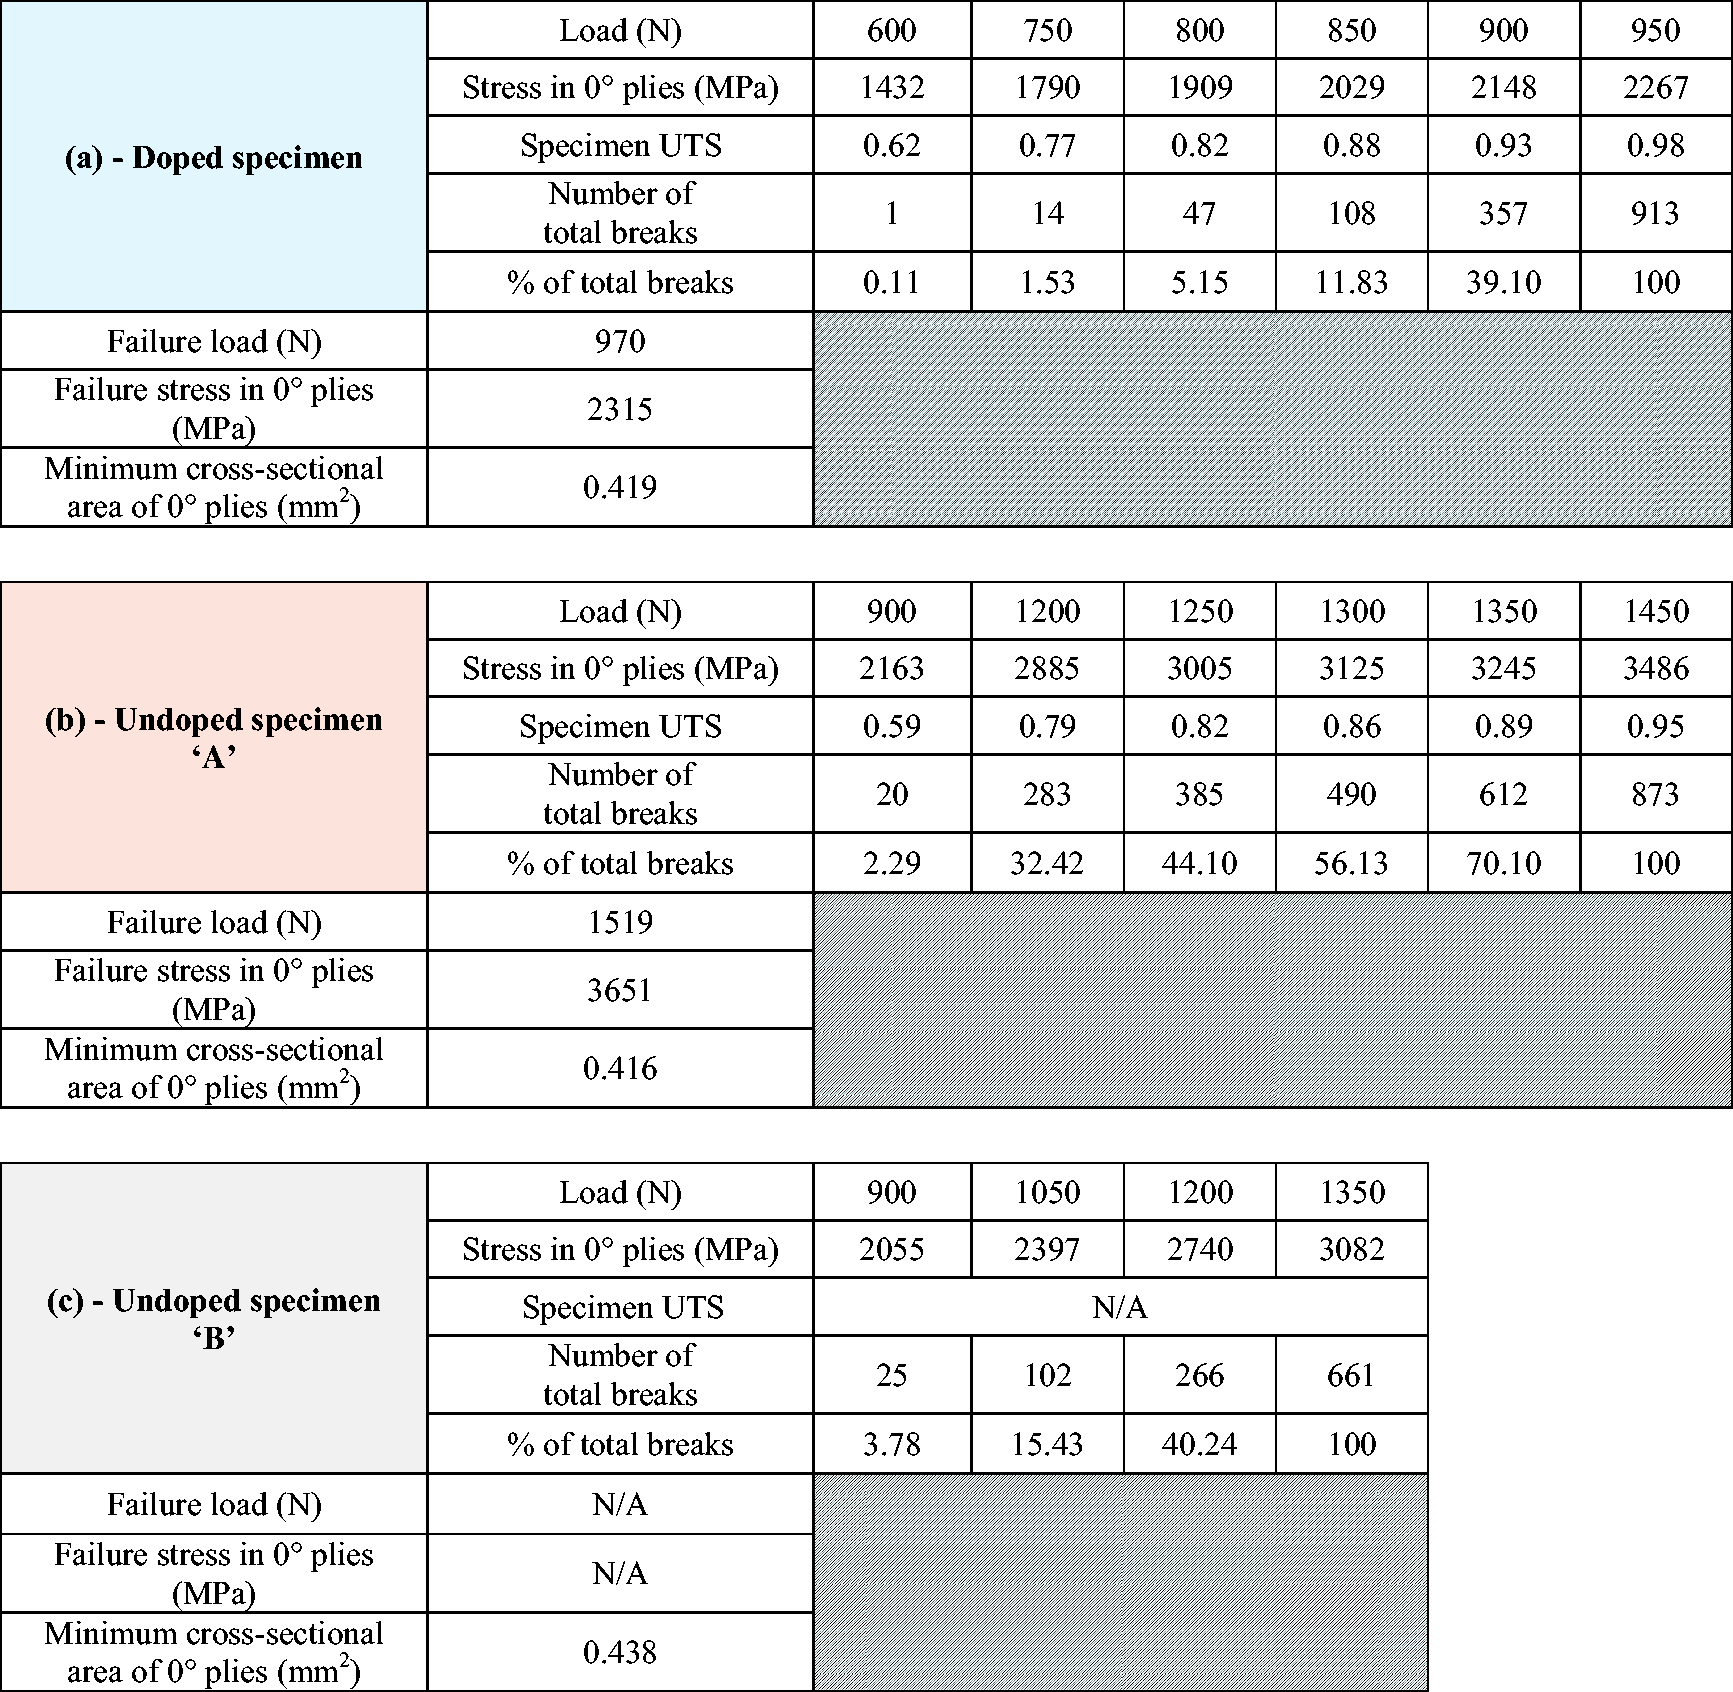
It is not the doped specimen that manifests an anomalous behaviour, but rather the undoped specimen ‘A’. More specifically, the failure stress of the composite is surprisingly high for the fibre type used, even if the higher volume fraction is accounted for – on the order of 15% above an equivalent fibre strength of 4900 MPa.
The double-edge notched specimens used are expected to experience high specimen-to-specimen variability due to the small gauge volumes. This is because any intrinsic flaws (or the lack of) in the fibres will have a higher impact on such a small gauge volume. In this context, according to the weakest link theory (i.e. Weibull distribution), very small volumes are found to exhibit high strengths. 1 For example, Tanaka et al. 58 have shown that the average size of critical flaws decreased with decreasing gauge length, whereby a higher fibre strength was reported in conjunction with smaller flaw sizes. Likewise, an experimental size-scaling is reported by Okabe and Takeda. 59 Therefore, it seems possible that the undoped specimen ‘A’ may have been simply a region which was characterized by fewer flaws within the load bearing section of ∼1 mm3.
As noted in the introduction, the mechanical properties of the thermosetting matrices can be preserved, provided that the particle concentration used is low; and since the matrix is responsible for the load transfer around a fibre break, it may also be expected that the micromechanical response of the composite is not fundamentally interfered with.
Figure 6 shows that fibre breaks accumulate exponentially with applied stress in all three specimens, as reported in literature.1,4,5,19 The two undoped specimens ‘A’ and ‘B’ show reasonable consistency in terms of accumulation rate, with a slightly more rapid accumulation in the latter. Conversely, the doped specimen exhibits the most rapid accumulation of breaks, particularly noticeable above a composite stress of ∼2000 MPa. This trend holds if the volume fraction differences are accounted for in terms of equivalent fibre stresses for the two materials, in spite of the subsequent shift that results over the horizontal axis – position of the undoped specimen curves are swapped, with undoped specimen ‘A’ exhibiting a slightly earlier (lower stress) onset of fibre breaks, cf. undoped specimen ‘B’.
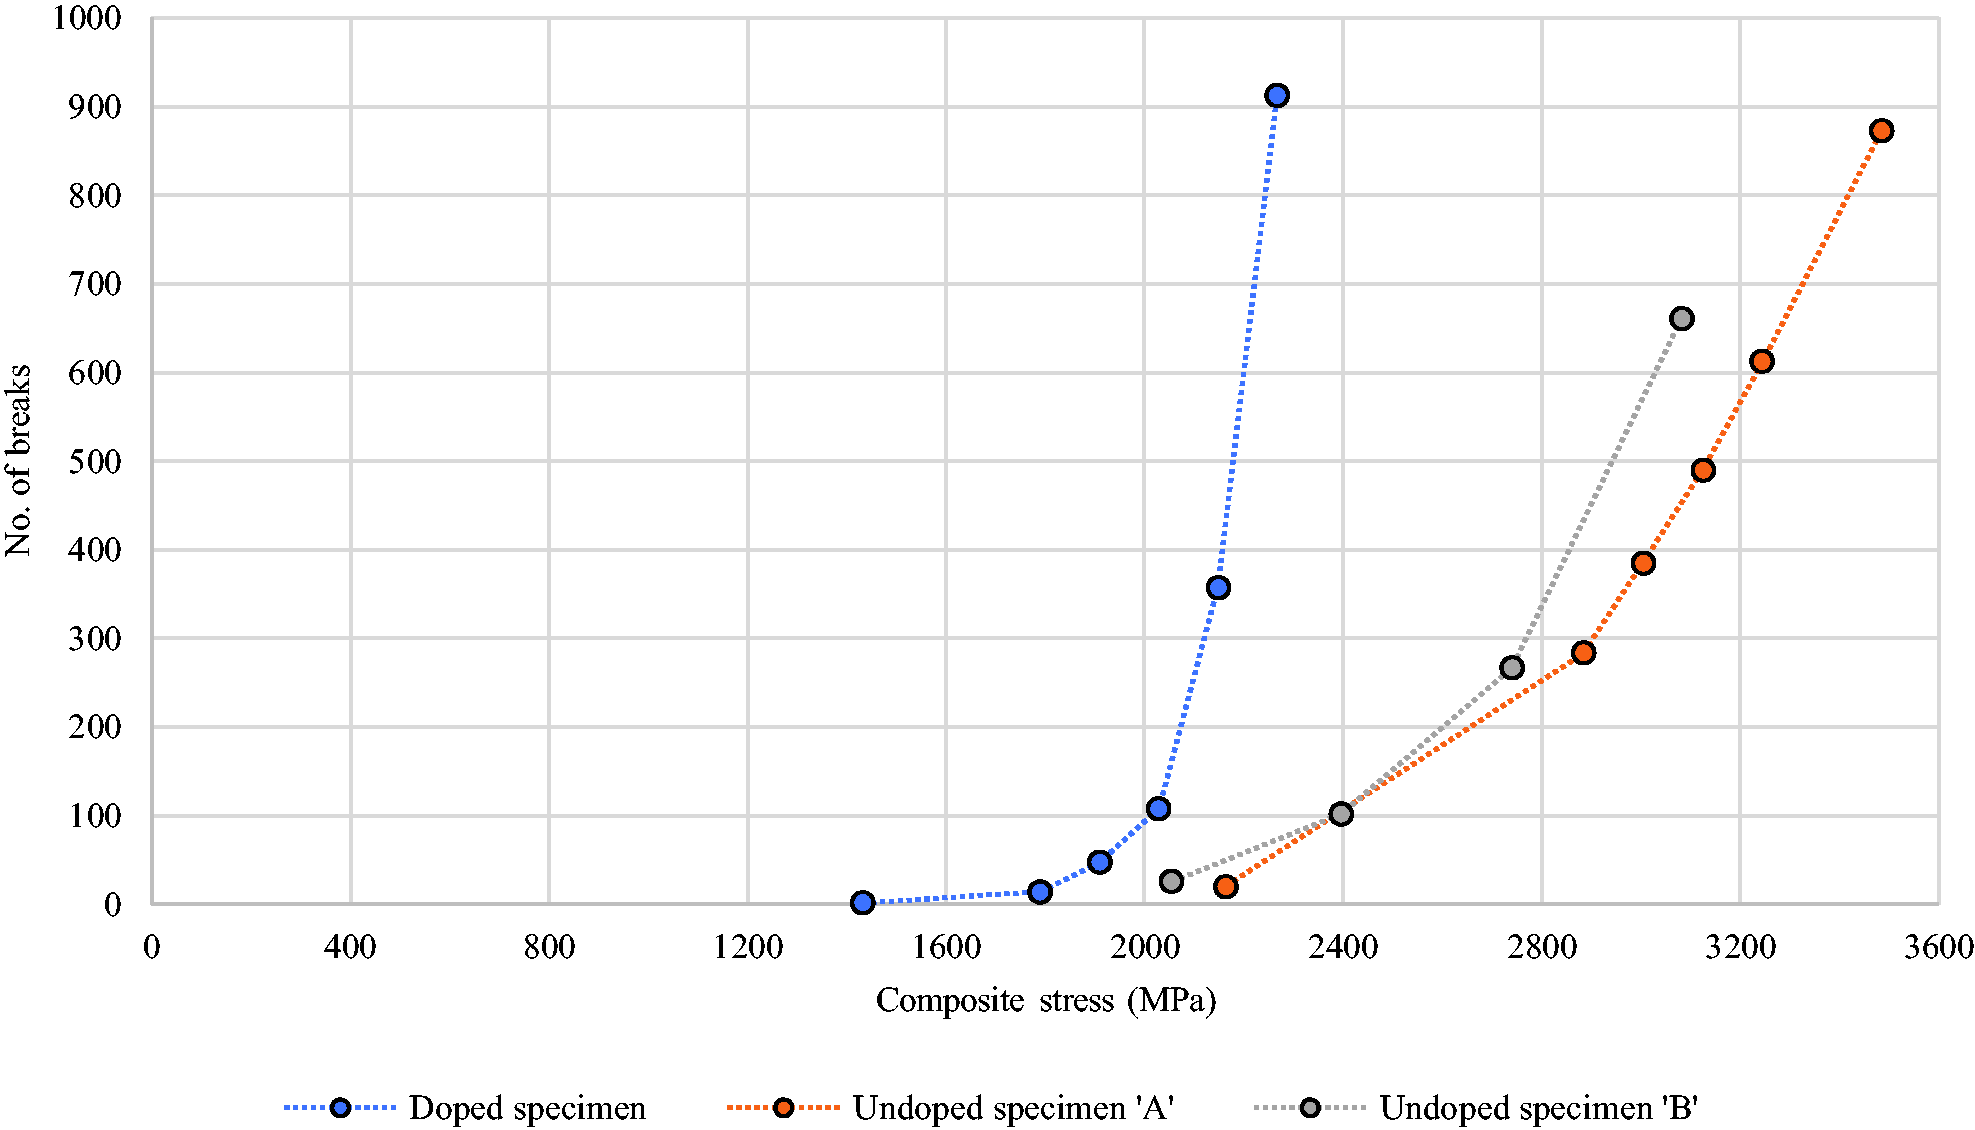
Fibre break accumulation as a function of applied stress for the three specimens subjected to in situ SRCT tensile testing. Data shown for an equivalent ROI volume of ∼0.34 mm3 for each specimen.
Figure 7 exemplifies the same effect in terms of fraction of specimen UTS. Likewise, it indicates that the total number of breaks close to fracture is on the same order for doped and undoped materials (913 and 873 breaks, respectively), resulting in a difference of less than ∼5% – notwithstanding the slightly different fraction of UTS achieved in each case (98% and 95%, respectively). Given the lower fibre volume fraction of the doped specimen it can be noted that the proportion of fibres fractured is actually higher in the doped case. However, the statistical nature of fibre behaviour should be recognised, that otherwise identical specimens, representative of T700-series composite, have been reported to exhibit greater variability than seen between the current doped and undoped materials. This is particularly reported in Garcea et al., 19 whereby specimens were characterised by 581 and 418 breaks, respectively, at 99.9% UTS within the load bearing reduced cross-section of 0.45 mm2 – implying that one material presented ∼40% variation in number of breaks. In this context, the presence of BaTiO3 particles does not appear to have had an exceptional effect on the total number of breaks at fracture, and from this perspective, the doped material replicates the essential behaviours of the undoped counterpart, allowing it to be considered as a useful model system.
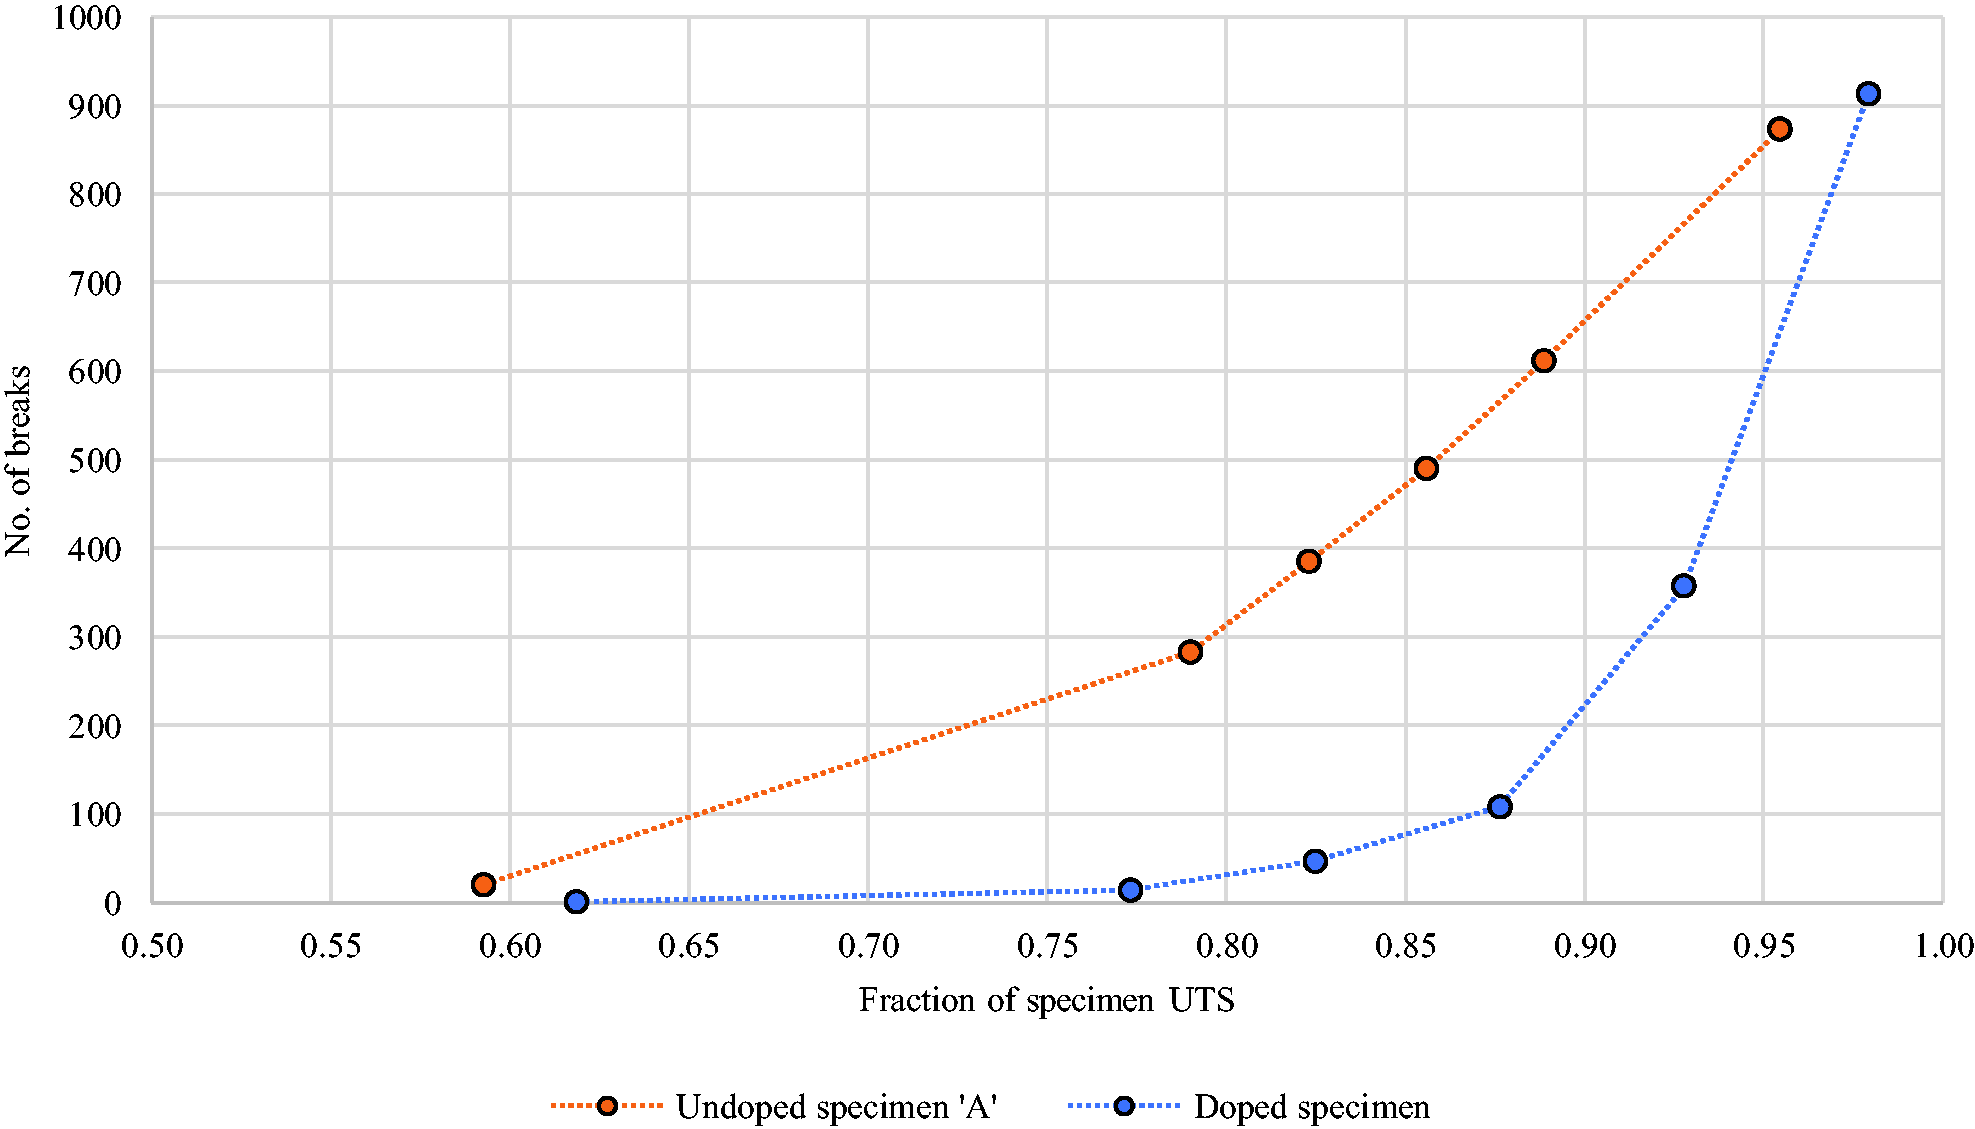
Fibre break accumulation as a function of % UTS for the two specimens loaded to fracture. Based on in situ SRCT data. Data shown for an equivalent ROI volume of ∼0.34 mm3 for each specimen.
We note that the accumulation rates may be influenced by the volume fraction of fibres. A high fibre volume fraction material has more intact fibres closely-packed around any given broken one, which may be anticipated to result in a stronger ‘shielding effect’. 13 On this basis, numerical models indicate that for a random packing, the nearest (intact) neighbouring fibres shield the second nearest neighbouring fibres from the stress concentration associated with a fibre break. Indeed, a higher fibre volume fraction results, on average, in more intact fibres at small distances from the break, and thus with high SCFs. However, when the SCFs are compared at a fixed radial distance from a broken fibre, the higher fibre volume fraction results in a lower SCF. 13 In turn, this ‘shielding effect’ may translate into an overall accumulation of breaks, with the shallower trend seen in the undoped specimen ‘A’.
The total number of fibre breaks found in the present work is consistently higher than that previously reported in the literature, based on an aerospace-grade CFRP with similar reinforcing fibres (i.e. T700-series).1,4,19 For example, Swolfs et al. 1 reported less than 500 breaks/mm3 at 94% specimen UTS, which is reasonably consistent with that reported by Scott et al. 4 and Garcea et al., 19 respectively. While it is beyond the scope of this work to establish why this is the case, the higher number of fibre breaks reported here may be associated with intrinsic defects arising from the prepreg drum winding process (e.g. abrasion of the fibre surfaces by the metering die, guide rollers etc.) and/or during the lay-up stage, which was not automated, and thus involved extensive manual intervention. The fact that a CFRP based on T700-series fibres and manufactured via filament winding can exhibit a considerably higher number of breaks, as opposed to its aerospace-grade counterpart, is also shown by Scott 60 and Morton, 61 acknowledging that the filament wound materials in Scott 60 and Morton 61 were not subjected to autoclave curing. It is also worth noting that given the combination of individual microvoids and a low void volume fraction, no obvious/direct mechanistic correlation was found between the location of the broken fibres and the location of microvoids, nor between the total number of breaks and the volume fraction of microvoids. This is in contrast to that reported in Scott et al., 57 whereby significantly larger, and more numerous voids (by vol. %), than found in the present work, were shown to have a clear influence on fibre break location. In Scott et al., 57 a significant proportion of fibre breaks occurred within half a fibre diameter of a void.
The specimen variability becomes even more evident if the fibre break behaviour is decoupled into singlets (Figure 8) and fraction of singlets to N-plets (Figure 9), respectively. It can be observed that the rate of singlet accumulation in the undoped specimen ‘B’ matches more to that in the doped specimen, as opposed to that in the undoped specimen ‘A’.
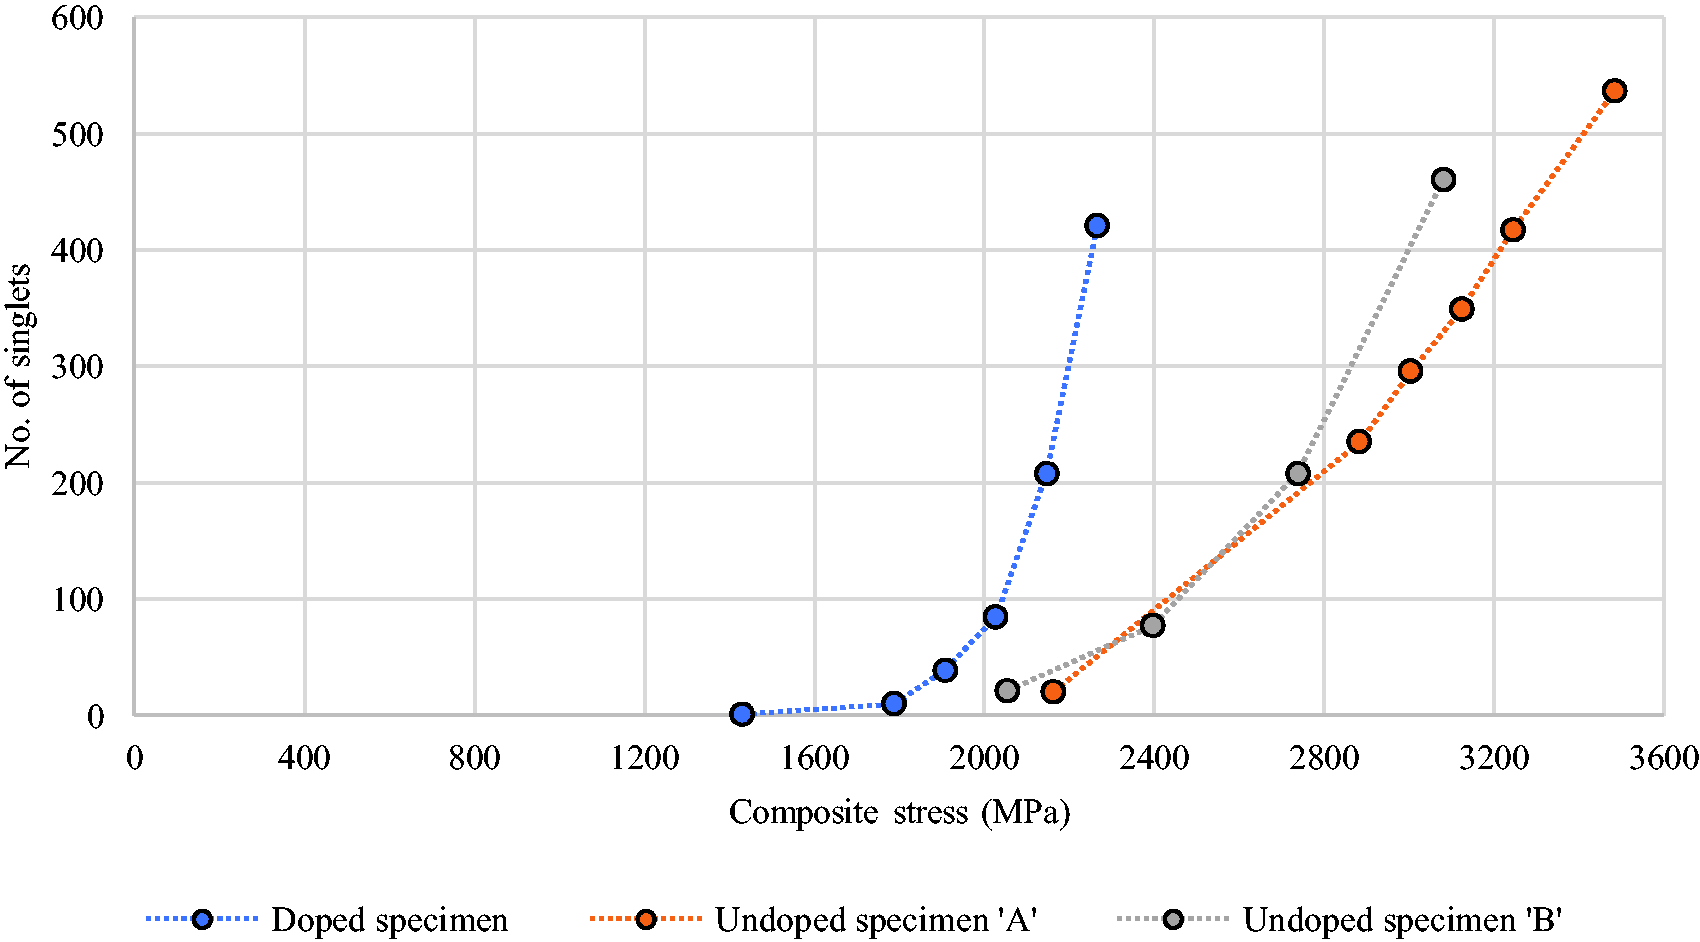
Number of singlets as a function of applied stress for the three specimens subjected to in situ SRCT tensile testing. Data shown for an equivalent ROI volume of ∼0.34 mm3 for each specimen.
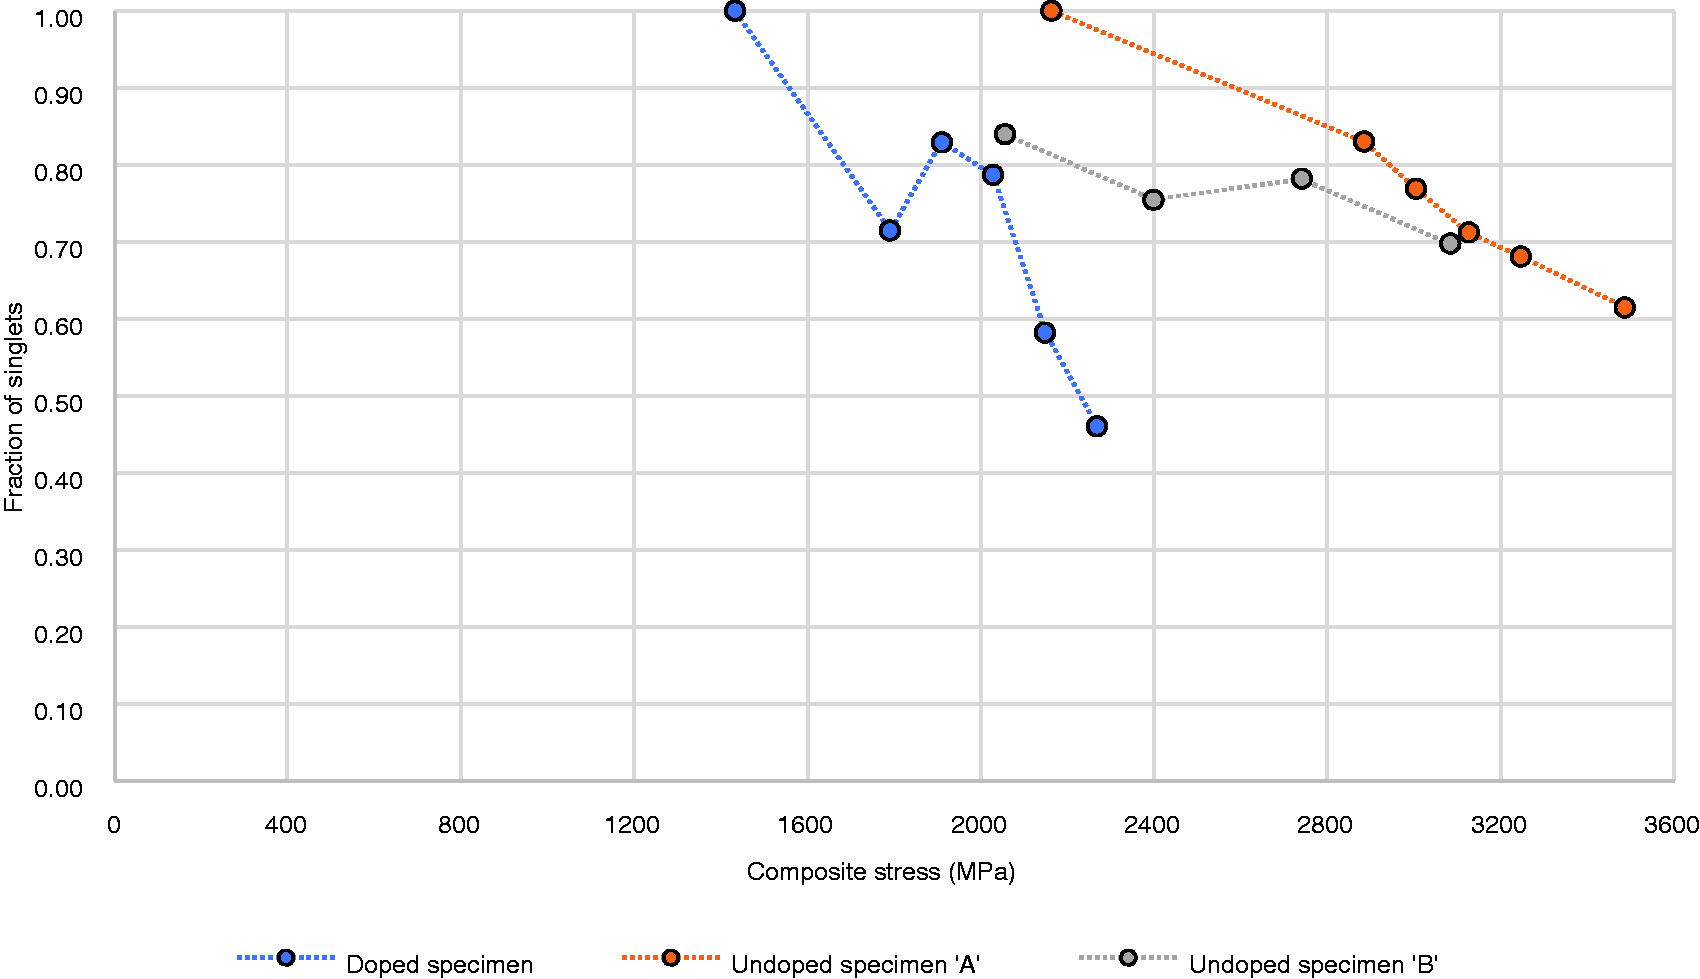
Fraction of singlets to N-plets as a function of applied stress for the three specimens subjected to in situ SRCT tensile testing. Data shown for an equivalent ROI volume of ∼0.34 mm3 for each specimen.
The doped specimen is also associated with the lowest number of singlets (421), which is ultimately linked to the lowest fraction of singlets to N-plets (46%). As the difference in the number of singlets between the specimens is considerably higher compared to that reported in the literature (e.g. 339 vs. 331 at 99.9% UTS in Garcea et al. 19 ) it would initially appear that doping with barium titanate has had an effect on the distribution of non-interacting fibre breaks. However, also shown in Garcea et al. 19 is that even larger differences can be expected in terms of the proportion of singlets to N-plets (cf. total number of breaks), for identical specimens: 58% and 79%, respectively – a difference which is undoubtedly higher than found here between the doped and undoped specimen ‘A’.
Furthermore, while Figure 9 shows a general decrease in the proportion of singlets to N-plets, the trend is only monotonic in the case of the undoped specimen ‘A’. This occurs due to the appearance of clusters of breaks at relatively low applied stresses, that unlike singlets, do not exhibit a particularly steep evolution until closer to failure (i.e. above ∼90% UTS) – e.g. the largest cluster (12-plet) in the undoped specimen ‘B’, appears at an intermediate applied stress of 2397 MPa – forming an ‘early cluster’. Taken together, these observations indicate that there is variability in damage progression irrespective of the inclusion of BaTiO3 particles, which is consistent with the specimen-to-specimen variability in fibre break evolution observed in other material systems.19,61
Cluster behaviour
The accumulation of clusters of breaks as a function of applied stress is summarized in Figure 10, while Figure 11 presents the visual distribution of these clusters in 3D, at the maximum stress recorded prior to fracture.
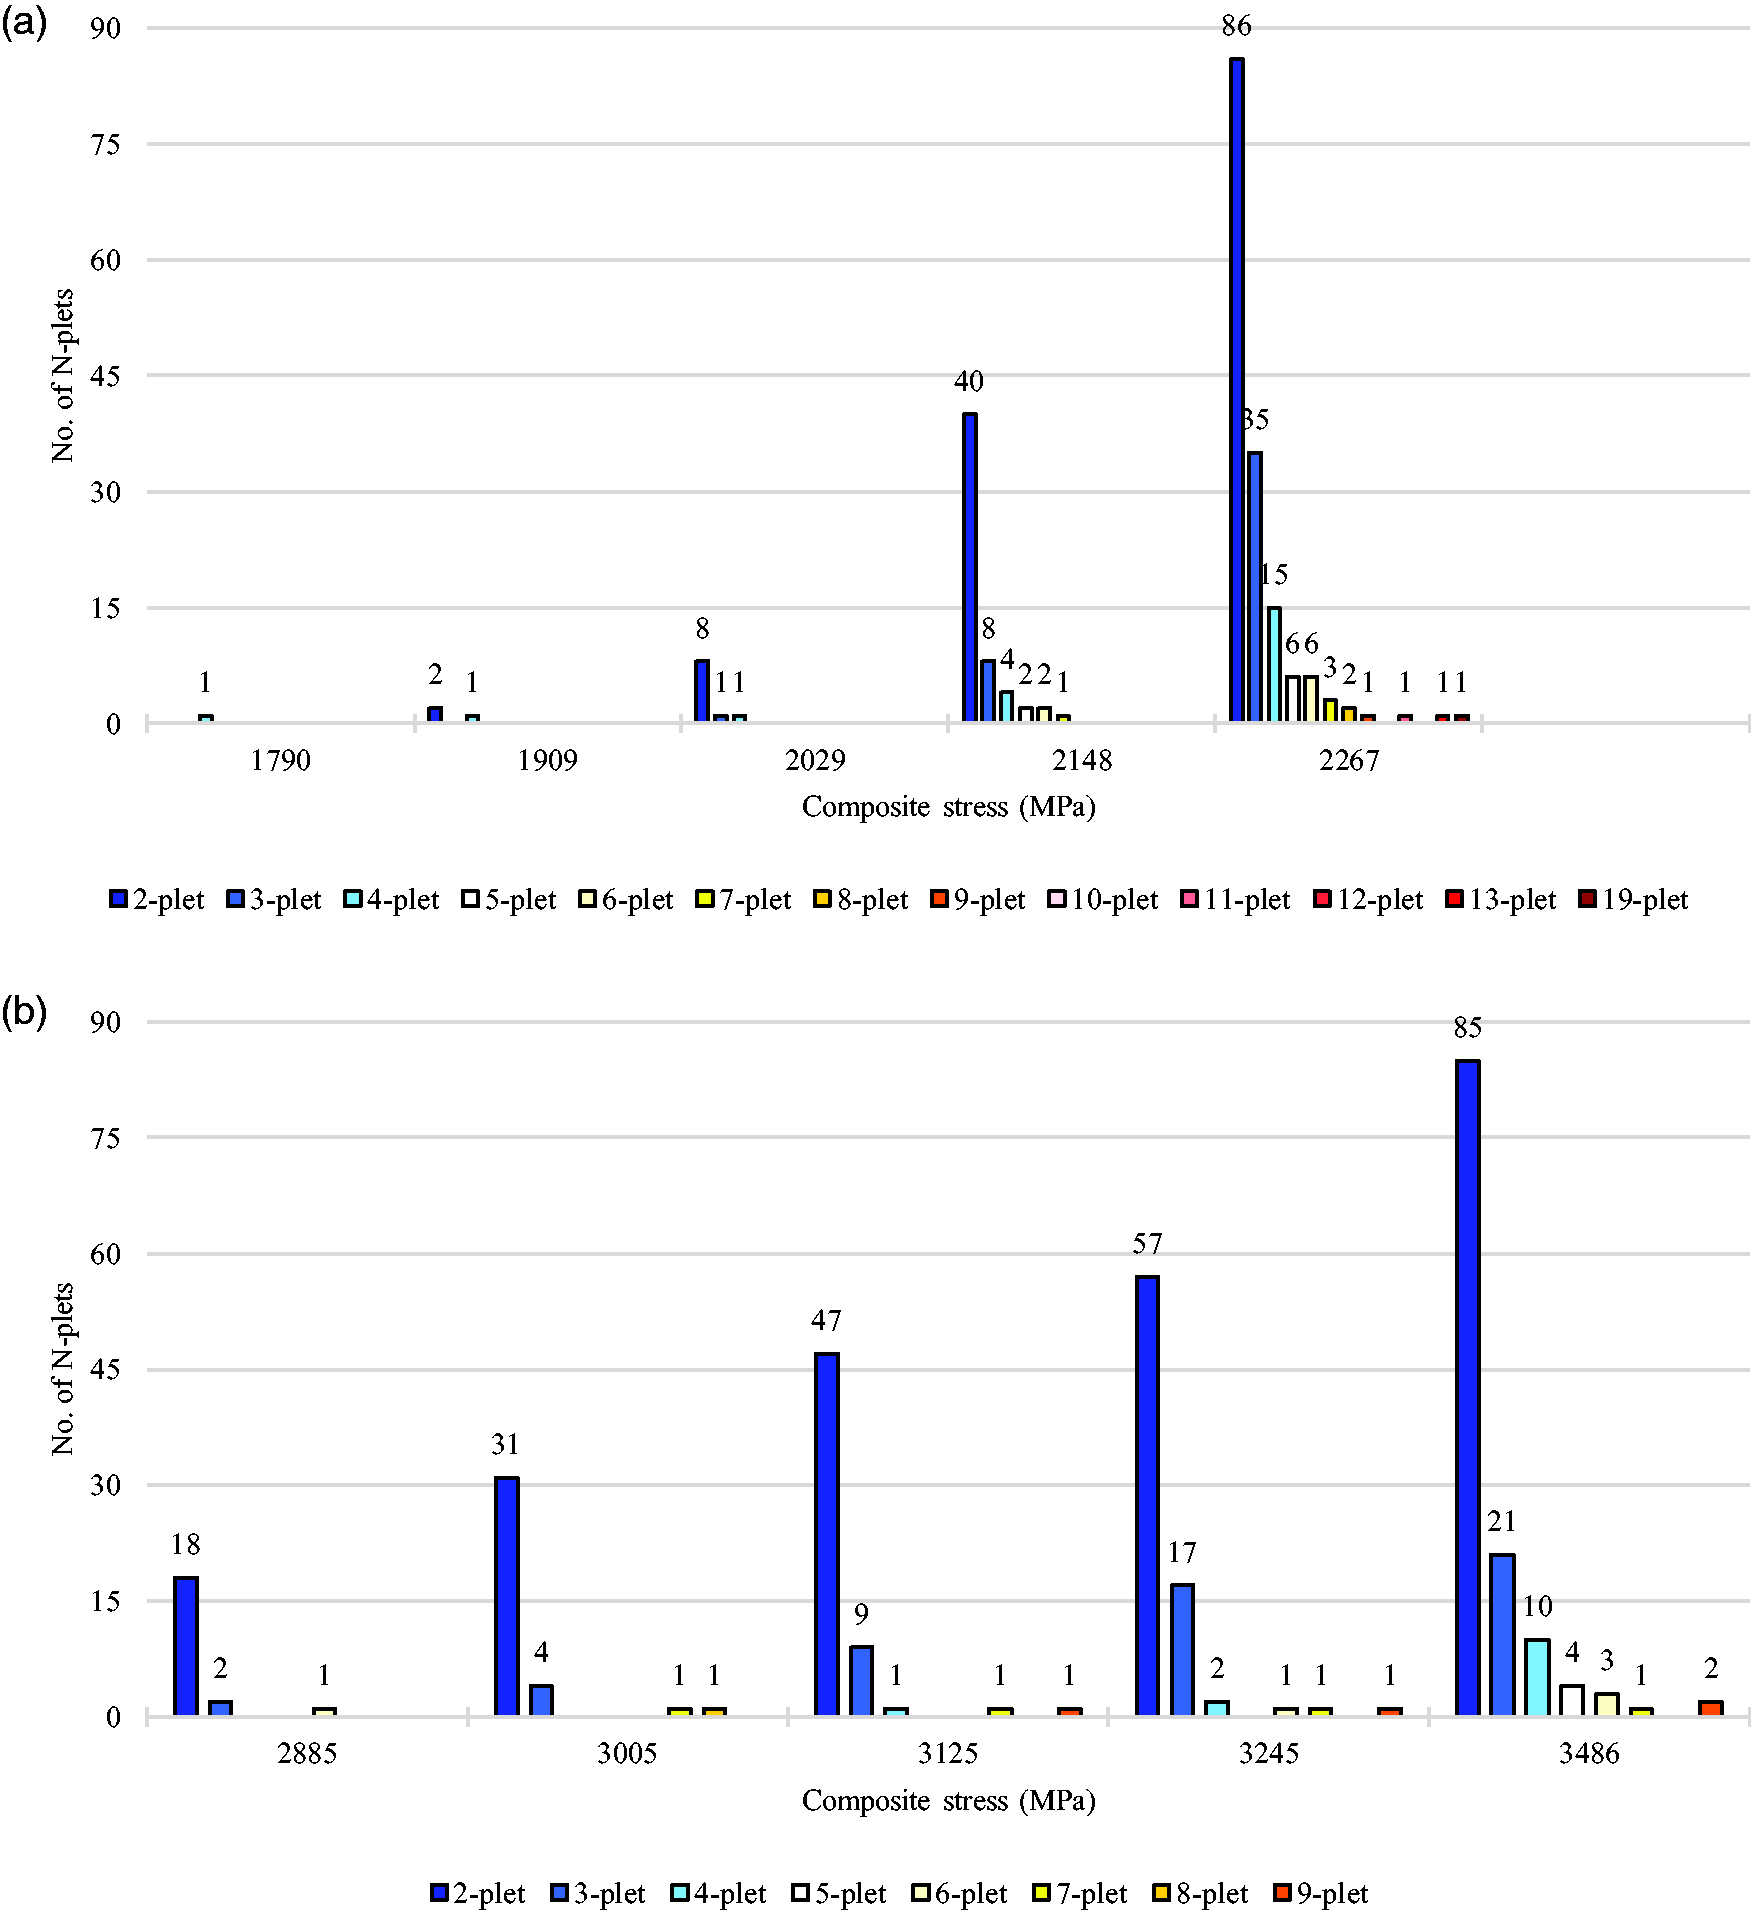
Distribution of N-plets as a function of applied stress for the three specimens subjected to in situ SRCT tensile testing: (a) doped specimen, (b) undoped specimen ‘A’, (c) undoped specimen ‘B’. Data shown for an equivalent ROI volume of ∼0.34 mm3 for each specimen.

Distribution of N-plets in 3D space at the maximum stress recorded prior to fracture: (a) doped specimen – 2267 MPa, (b) undoped specimen ‘A’ – 3486 MPa, (c) undoped specimen ‘B’ – 3082 MPa. Visualizations reconstructed from break centroid coordinates. Each volume corresponds to ∼0.34 mm3.
The largest clusters found in this work were: a 19-plet in the doped specimen, two 9-plets in the undoped specimen ‘A’ and an ‘early’ 12-plet in the undoped specimen ‘B’. It was also noted that the largest cluster(s) of one 19-plet in the doped specimen encompasses a similar number of breaks to the two 9-plets in the undoped specimen ‘A’ (19 vs. 18); with the two 9-plets forming adjacent to each other (Figure 11).
The 19-plet found in the doped specimen is larger than the 14-plet at 94% UTS reported in Scott et al., 4 as well as than the 10-plet and 4-plet, respectively, at 99.9% UTS reported in Garcea et al. 19 – notwithstanding that in Garcea et al. 19 a cluster of breaks only encompassed breaks that were directly adjacent to one another, potentially making an equivalent ‘distance-based’ cluster significantly larger (see ‘Image processing’ section). At 93% UTS, which is closer to the maximum value reported in Scott et al., 4 the largest cluster of breaks in the doped material is a 7-plet, making it half the size of the largest cluster reported in Scott et al. 4 In terms of the morphology of largest clusters, this is consistent between the doped and undoped materials. It is important to note, that these are all diffuse clusters (Figure 11), meaning that unlike the largest cluster reported in Scott et al., 4 they are separated by greater axial and radial distances.
Figure 10 shows a similar trend to that reported in literature,1,4,5,19 whereby larger clusters typically appear with increasing stress. Overall, the undoped specimen ‘A’ exhibits the shallowest rate of cluster accumulation, followed by the undoped specimen ‘B’ and doped specimen, respectively. As such, there is distinct variability in behaviour, consistent with that reported in Garcea et al. 19 Figure 10 also shows that for both material types, large clusters of breaks generally form without a reduction in the number of smaller clusters. Furthermore, a ‘break-by-break’ accumulation with applied stress is not observed for the larger clusters. A notable example is the ‘early’ 12-plet in the undoped specimen ‘B’, which formed in a single increment or ‘burst’, and does not exhibit any further growth. This behaviour generally agrees with the experimental data previously reported in Swolfs et al. 1 and Scott et al. 4 for hold-at-load scans. Again, the doped material is seen to replicate the key behaviour (cluster formation) of undoped, and more broadly, other carbon-fibre composite systems, validating its use as a model system, with the capability to allow tracking of local strains. 7
Ultimately, within the statistical power of the current sample gauge volumes, it appears that the behaviour of clusters is stochastic, whereby specimen failure is likely to be determined by intrinsic stochastic factors, such as fibre strength and local microstructure, 19 rather than particularly the inclusion of barium titanate. A much larger number of specimens would need to be examined to provide a statistically significant conclusion regarding the relative contribution of the fiducial markers compared to the intrinsic variability. This, however, is not trivial to achieve in practice due to the limited availability and cost of the SRCT beam time required to achieve such results.
Summary and conclusions
A model Carbon-Fibre Reinforced Polymer composite was developed to permit the application of Digital Volume Correlation to displacement and/or strain measurements parallel to the fibre orientation, with the ultimate goal of allowing the mapping of strain fields at fibre break sites. To generate individual features unique to a particular sub-set, the work has explored the insertion of sparse populations of sub-micrometre particles within the matrix to act as fiducial markers.
To preserve the tensile behaviour of a commercially representative material, whilst still allowing the application of DVC parallel to the fibre direction, a series of considerations were established. The key trade-off required ensuring that the volume fraction of fiducial markers was able to satisfy the imaging requirements, yet was low enough to minimize any substantial disruption in the separation and packing of fibres at tow-level. Out of the 38 test materials manufactured, barium titanate particles (400 nm, ∼1.44 vol. %) were found to offer the most favourable compromise between contrast in CT images and the ability to obtain a homogeneous distribution in 3D space with sufficient particle compactness for local DVC analyses. This property combination was selected following an extensive µCT-based qualitative assessment on a range of possible particle compositions, mean sizes and concentrations.
In situ SRCT and subsequent image analysis has shown that the response of the doped material is mechanistically representative of undoped materials made by the same manufacturing route, and is consistent with other materials made by other processes – at least in terms of the fibre fracture response. Some variability in mechanical behaviour is discerned between individual specimens, and material types (doped and undoped), which may be attributable to both manufacturing inconsistency and a potential contribution of the doping particles. Notwithstanding these effects, we identify the doped materials as a suitable model to characterise for the first time the localised, three-dimensional load shedding processes associated with fibre break accumulation within the bulk of CFRPs.
While the development of the present material is mainly intended to promote the understanding of the fundamental aspects of UD composite tensile failure, a similar methodology may be applied to off-axis ply orientations. Furthermore, acknowledging that the benefits of displacement/strain mapping should outweigh differences in the material behaviour, we envisage the methodology being adapted to probe the understanding of composite behaviour not only under different loading conditions (e.g. compression, torsion, time-varying), but also at larger length-scales (e.g. up to the structural level) and in the context of multiaxial or discontinuous reinforcements.
Footnotes
Acknowledgements
The authors would like to acknowledge the European Synchrotron Radiation Facility (ESRF) for provision of synchrotron radiation facilities and would like to thank Dr. Lukas Helfen and Ms. Elodie Boller for assistance in using beamline ID19. Accompanying acknowledgement is given to Dr. Richard Boardman, Dr. Kathryn Rankin, Dr. Orestis Katsamenis and Mr. Nicholas Hale from the µ-VIS X-Ray Imaging Centre at the University of Southampton. Mr. Stephen Wilby from the Engineering Materials Group at the University of Southampton is also credited with assistance during the experimental campaign. Credit is further extended to Mr. Simon Beever – University of Southampton Engineering Design and Manufacturing Centre (EDMC) and Mr. Adrian Walker – Safire Associates UK for the short notice water-jet cutting of various components required for the experimental work.
Declaration of Conflicting Interests
The author(s) declared no potential conflicts of interest with respect to the research, authorship, and/or publication of this article.
Funding
The author(s) disclosed receipt of the following financial support for the research, authorship, and/or publication of this article: The research leading to these results has been conducted within the framework of the FiBreMoD project and has received funding from: (1) the European Union’s Horizon 2020 research and innovation programme under the Marie Skłodowska-Curie grant agreement No. 722626, and (2) the µ-VIS X-Ray Imaging Centre at the University of Southampton, supported by EPSRC grant agreement No. EP/H01506X/1.
