
Abstract
The growing industrialization over the past century has led to increased exposure of structures to such aggressive conditions as found in sewer networks. The rehabilitation and maintenance of sewer systems call for innovative wastewater collection systems based on their design life cycle and operational conditions. Acid exposure is one such condition whose impacts on sewer systems strengthened with FRP sheets still await adequate research. The present paper reports the results of a study conducted in an aggressive concrete sewer chamber in an industrial zone, chosen as an outdoor test design to investigate the effects of an acid environment on the bond strength of FRP sheets bonded on the concrete surface via either of the two techniques of externally bonded reinforcement (EBR) or externally bonded reinforcement on grooves (EBROG). The results show that the bond strength of the EBR specimens depends on both exposure type and duration while the aggressive environment has no significant effects on the bond strength of EBROG specimens. Generally, maximum bond strength in EBR specimens decreases by up to about 19.7% with increasing exposure duration to 6000 h. In the case of EBROG specimens, however, maximum bond strength initially increases by 8.9% after 3000 h of exposure before it declines by 3.6% after 6000 h.
Introduction
Numeral application of fiber-reinforced polymer (FRP) composites in strengthening and rehabilitation of different members of reinforced concrete (RC) structures worldwide necessitates the investigation of the FRP-to-concrete bond resistance in harsh environmental exposures during the time. Different surface bond techniques were used for FRP-concrete joints, i.e., externally bonded reinforcement (EBR) and externally bonded reinforcement on groove (EBROG). The bond quality, however, is affected by such factors as the ambient conditions of concrete, surface preparation of the substrate concrete, FRP application method and workmanship, FRP quality, and resin durability.1,2 Many studies of FRP-concrete surface bond behavior investigated concrete exposure to the different alkaline, acidic, freeze-thaw, salt water, high temperature, and UV conditions.3–10 These studies were mostly conducted under laboratory-accelerated conditions, using specimens strengthened via the conventional EBR or near-surface mounted (NSM) techniques. The present study is different in that it investigates the effects of two surface preparation techniques (i.e., EBR and EBROG) on the bond behavior of FRP-concrete under the aggressive outdoor environment in domestic concrete sewer chambers.
Few studies have been reported on the effects of external aggressive conditions such as acidic environments on FRP-strengthened structures. These scant studies have, however, revealed that such aggressive conditions might cause premature FRP debonding in concrete specimens strengthened via the EBR technique. The objective of the current study, and its novelty, is the investigation of the impacts of environmental conditions, such as the acidic ones observed in sewer chambers, on concrete specimens strengthened via the novel EBROG technique.
Experimental study
Specimen preparation
For this study, 24 concrete prism specimens, 350 × 150 × 150 mm in size, were prepared. The concrete was designed to give a compressive strength of about 35 MPa with a w/c ratio of 0.57. The concrete mix per cubic meter consisted of 216 kg/
Mechanical properties of the carbon fibers and epoxy matrix.

Strengthening methods
EBR method
In this method, the surface of the concrete specimen is prepared initially by sandblasting and cleaning before a layer of epoxy is applied uniformly on the concrete surface. FRP sheets are then installed on the surface and saturated with epoxy.
EBROG method
In this method, two grooves, 200 × 8 × 10 mm (length × width × depth), at a center-to-center distance of 18 mm are made on each side face of the specimen. This is followed by cleaning the concrete surface by washing (without any sandblasting) and the grooves with an air jet before they are filled with an appropriate epoxy. Finally, FRP sheets are installed using proper amounts of the epoxy on the concrete surface.11–25
In both strengthening methods, FRP sheets were cut into pieces 735 × 48 mm (length × width) bonded on 200 mm of the concrete surface, leaving 35 mm unbonded to avoid stress concentration.13,25 Besides, a length of 500 mm of the FRP sheet was left as the free end length. Figure 1 presents the specimens in detail. Furthermore, steel plates, 100 × 100 × 2 mm, attached at the FRP free end length served to protect the fibers against damages under the testing machine.
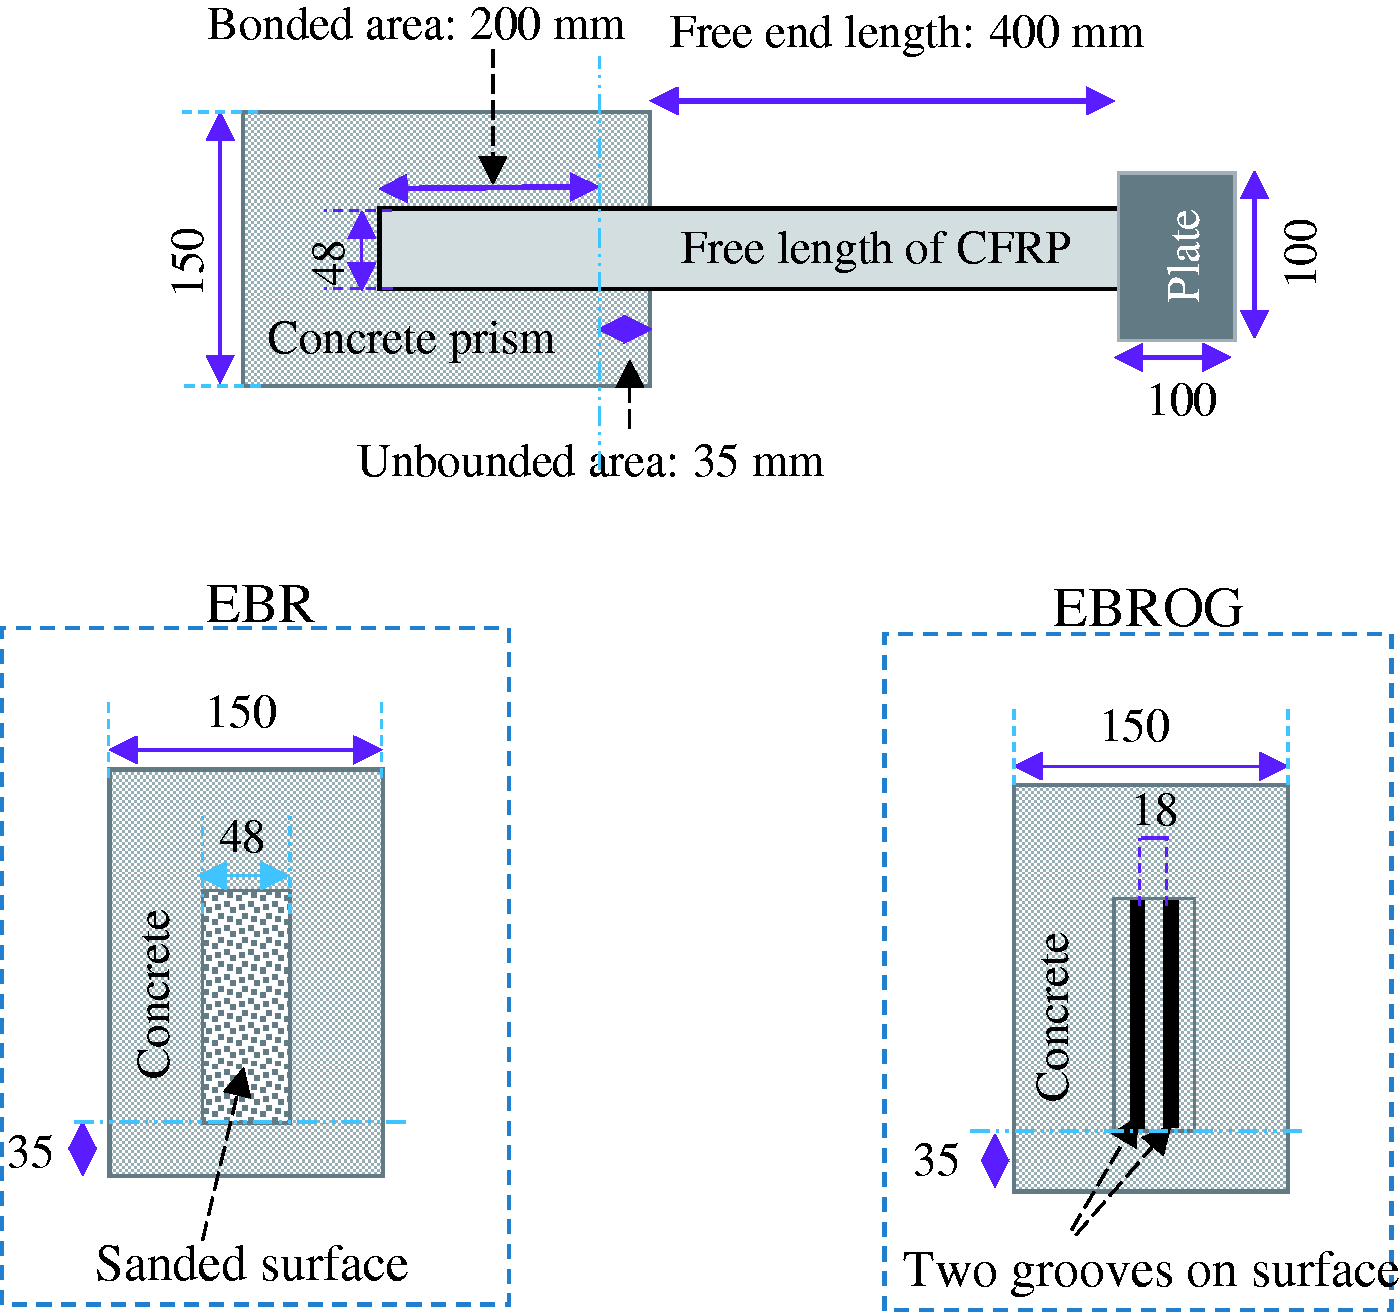
Specimen specification (dimensions in mm).
Environmental exposure
The long-term durability of the CFRP-concrete bond is an important factor involved in the durability of sewer systems strengthened with FRP composites and exposed to an aqueous environment, especially at relatively high temperatures. Besides, the moisture and chemicals present in the environment might penetrate the concrete to cause further deterioration in the FRP-concrete bond through FRP debonding or peeling, leading thereby to localized stresses.
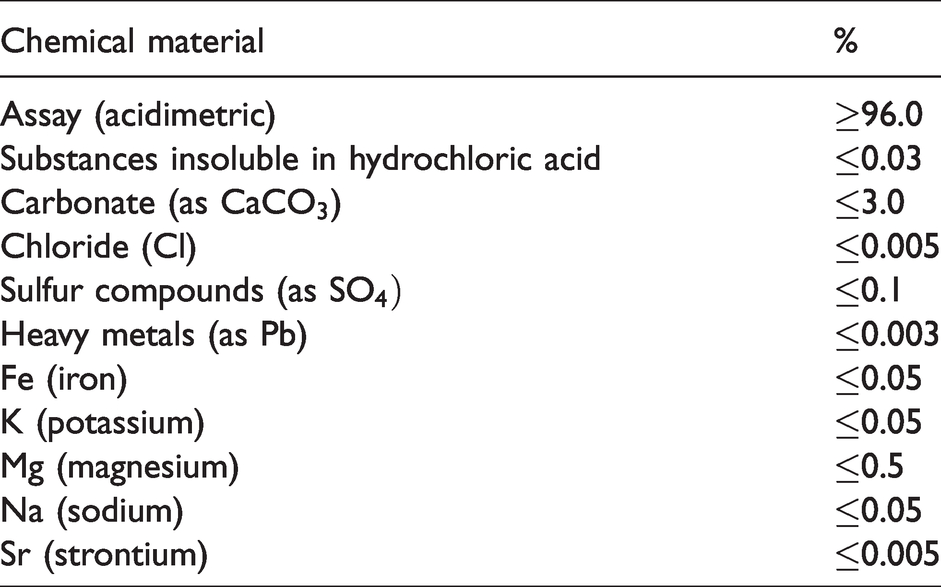
The fib bulletin 14 26 identifies the three major categories of outdoor, outdoor accelerated, and laboratory accelerated test designs. For this study, an aggressive concrete sewer chamber was chosen as an outdoor test design. Examination of the chamber revealed that the concrete chamber had undergone deterioration up to a depth of 110 mm. Table 2 reports the chemicals detected in the test environment. Accelerated corrosion times were defined at 1000, 3000, and 6000 h.
Chemicals detected in the test environment.
In this experiment, eighteen specimens categorized into three groups were placed in three separate steel baskets hanging from the manhole of the sewer chamber to expose the specimens to the acidic vapor, rather than the acidic solution, in the sewer chamber. Furthermore, six specimens were tested as reference ones under normal conditions. Figure 2 shows the specimens suspended in the concrete sewer chamber.
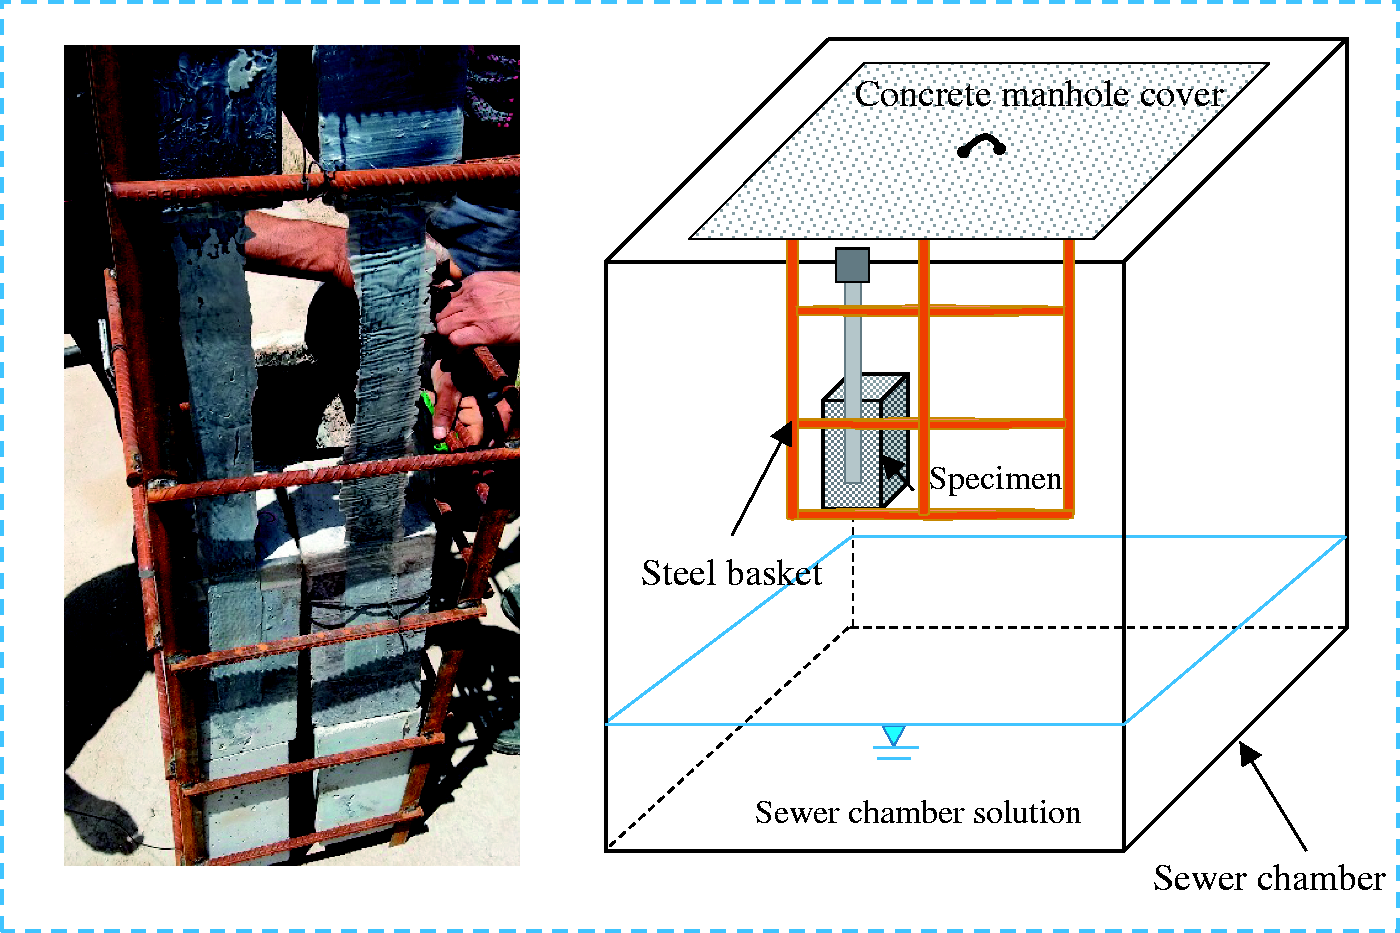
Placement of the specimens in the concrete sewer chamber.
Using a single shear test machine with a maximum capacity of 50 kN, single shear bond tests were conducted on the specimens after different durations of exposure to environmental conditions. To avoid rigid body movements during the tests, the specimens were mounted on steel supports and firmly clamped. The specimens were loaded monotonically at a constant rate of 2 mm/s under displacement control conditions. The test setup is shown in Figure 3.
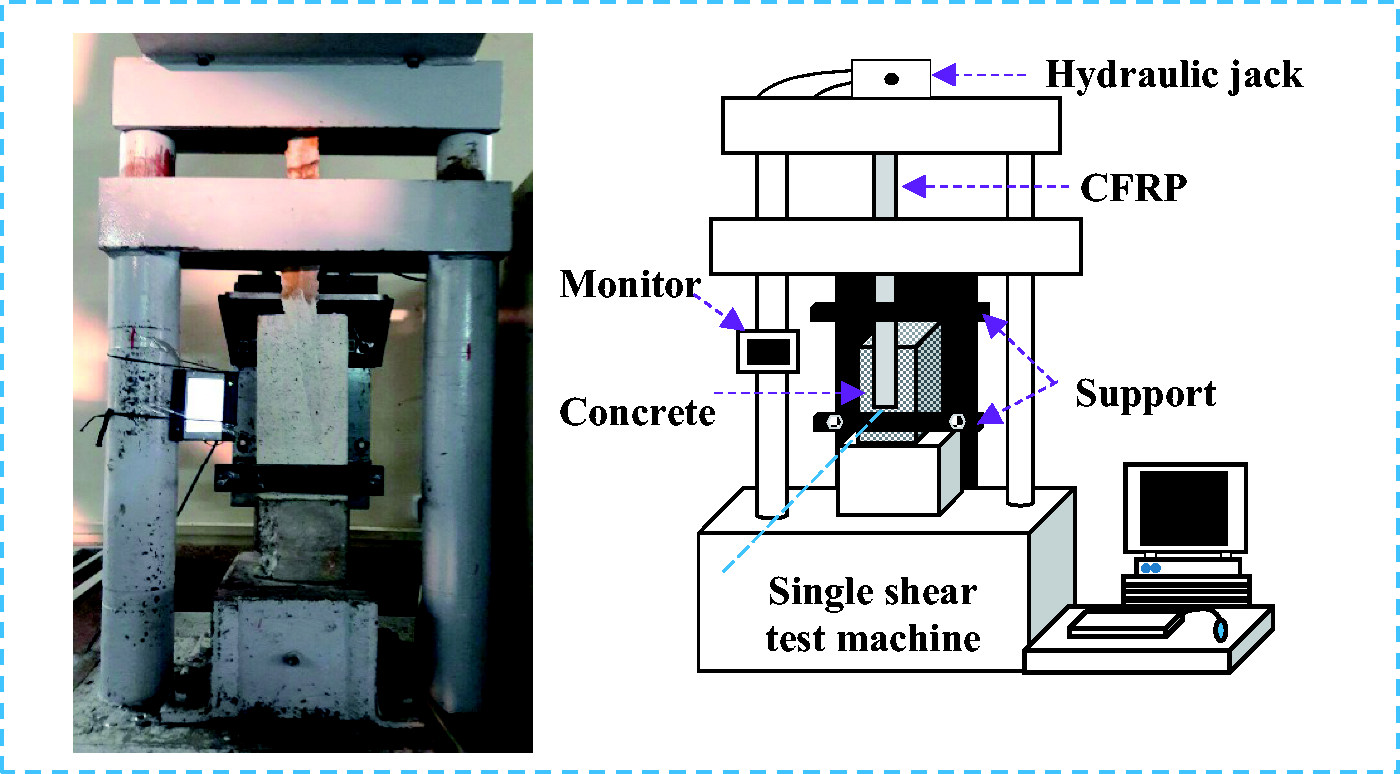
Test setup.
Particle image velocimetry technique
Particle image velocimetry (PIV) is a photomechanical technique 27 whereby a series of digital images are taken of a deformed object to be compared with that of the same object before deformation or with a reference image. 28 The PIV system used consisted of a digital camera (Canon 5D Mark II) with a resolution of 21.0 megapixels (5616 × 3744 pixels) installed at a distance of 1.0 m from the specimen face. Two white light projectors were also deployed 1 m away from the specimen at angles of approximately 45° on both sides of the specimen. Digital images were automatically taken from each specimen undergoing deformation using a remote control to obtain load-slip curves as well as slip, strain, and stress full-fields. GeoPIV8 software (Cambridge University) was used to process the images.29,30 The images need to have a proper texture for creating features for the image processing system to operate. Since the CFRP sheets lacked any proper color texture, the white color was used on the CFRP-concrete bond as the base background color, and the five black, pink, yellow, green, and blue colors were then sprayed on the surface. 13
Results
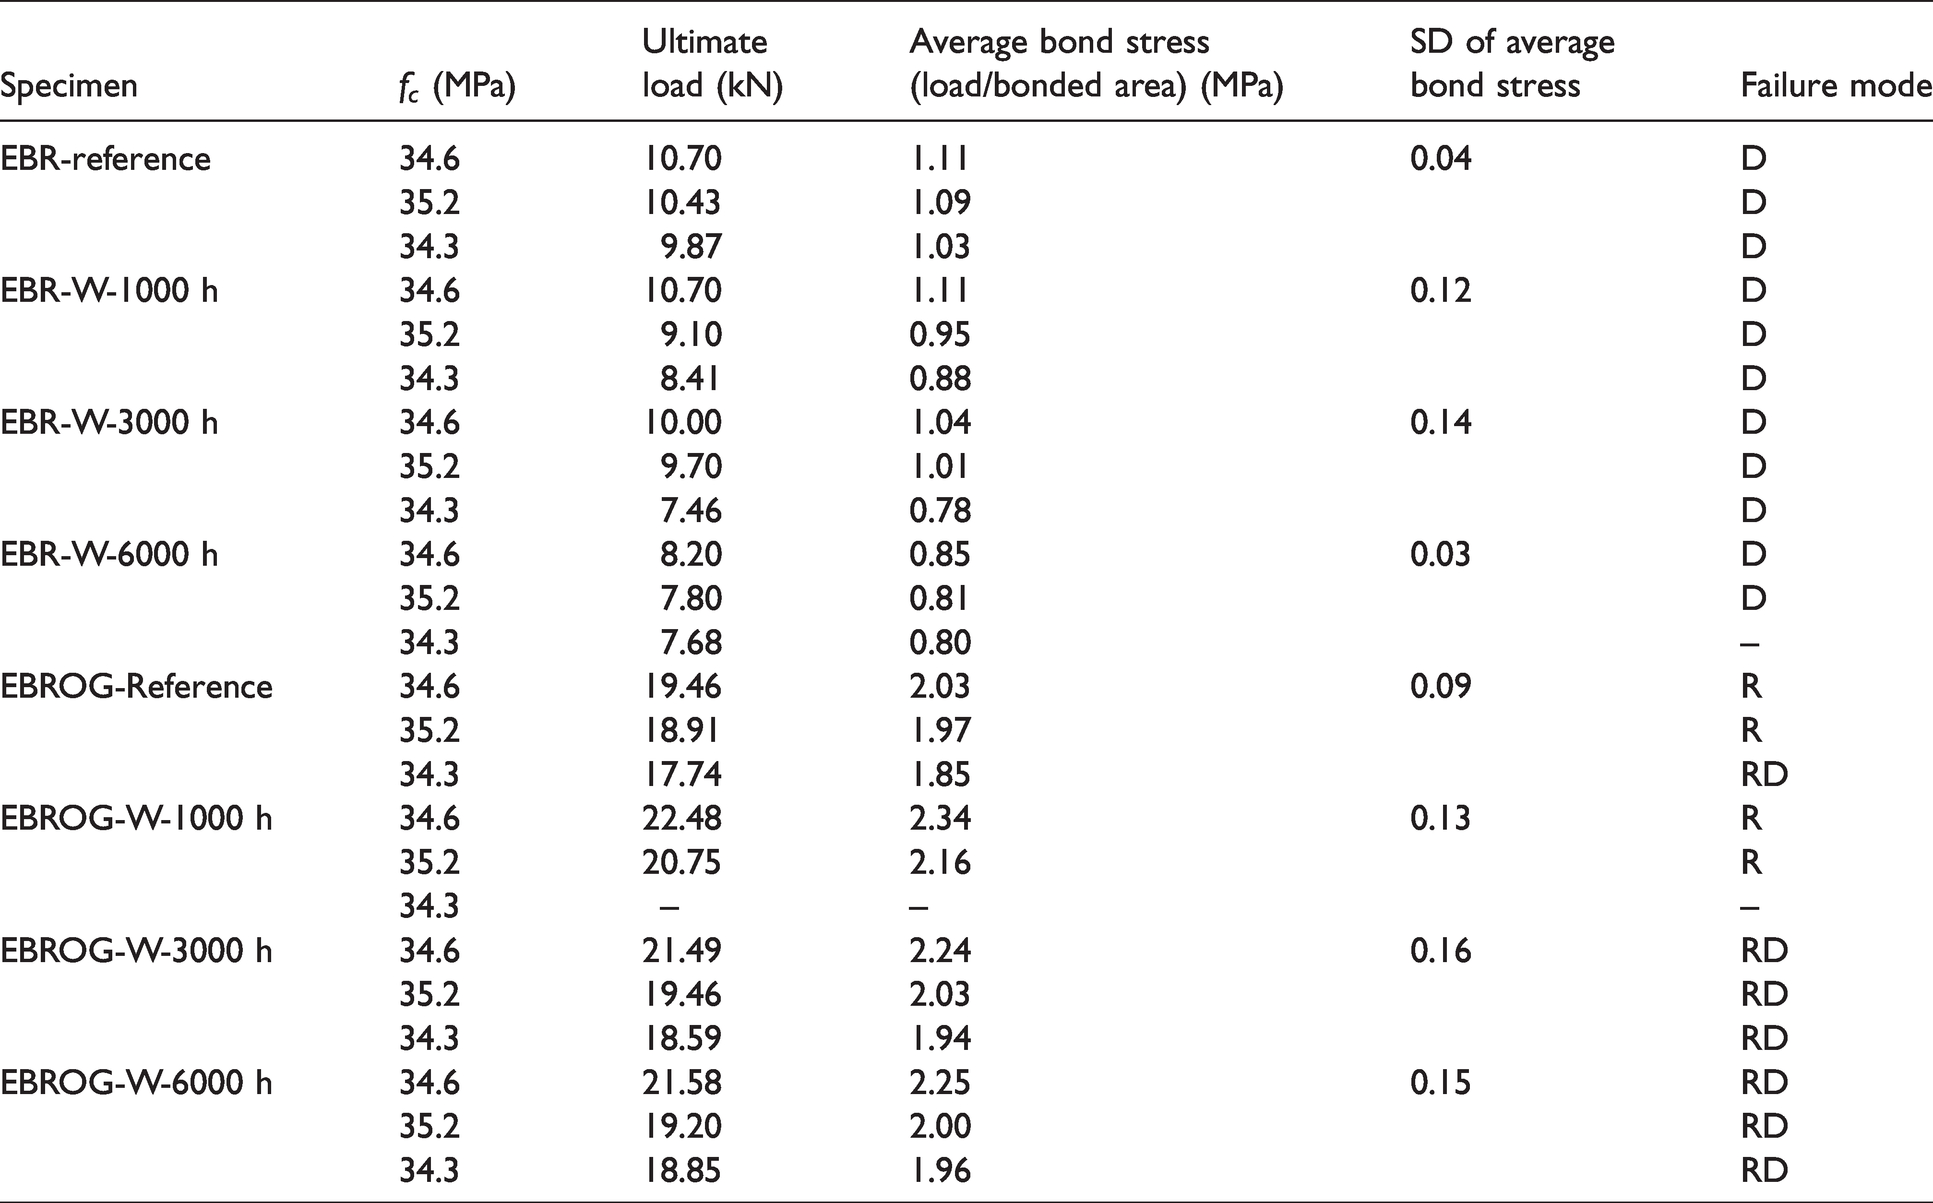
Table 3 reports the experimental results expressed as ultimate bond load, average bond stress, and failure mode of the bonded area in the EBR and EBROG techniques. Figure 4 shows the average values of the ultimate bond load for the EBR and EBROG specimens exposed to the control and aggressive environments. The ultimate bond load recorded in the reference conditions (9.83 MPa) is higher in the EBR specimens than it is in the aged ones. The average percentages of bond strength decay are 4.4, 7.9, and 19.7% for the specimens exposed to the aggressive environment for 1000, 3000, and 6000 h, respectively. On the other hand, the bond strengths of concrete-CFRP specimens in the EBROG method increased by 8.9% after 1000 h, by 3.3% after 3000 h, and by 3.6% after 6000 h compared to that of the control (i.e. 19.19 MPa), which may be considered within the test variability, indicating that the aggressive environment is not effective with the EBROG technique. These findings indicate the significant effect of surface preparation on improving bond performance and durability.
Test results.
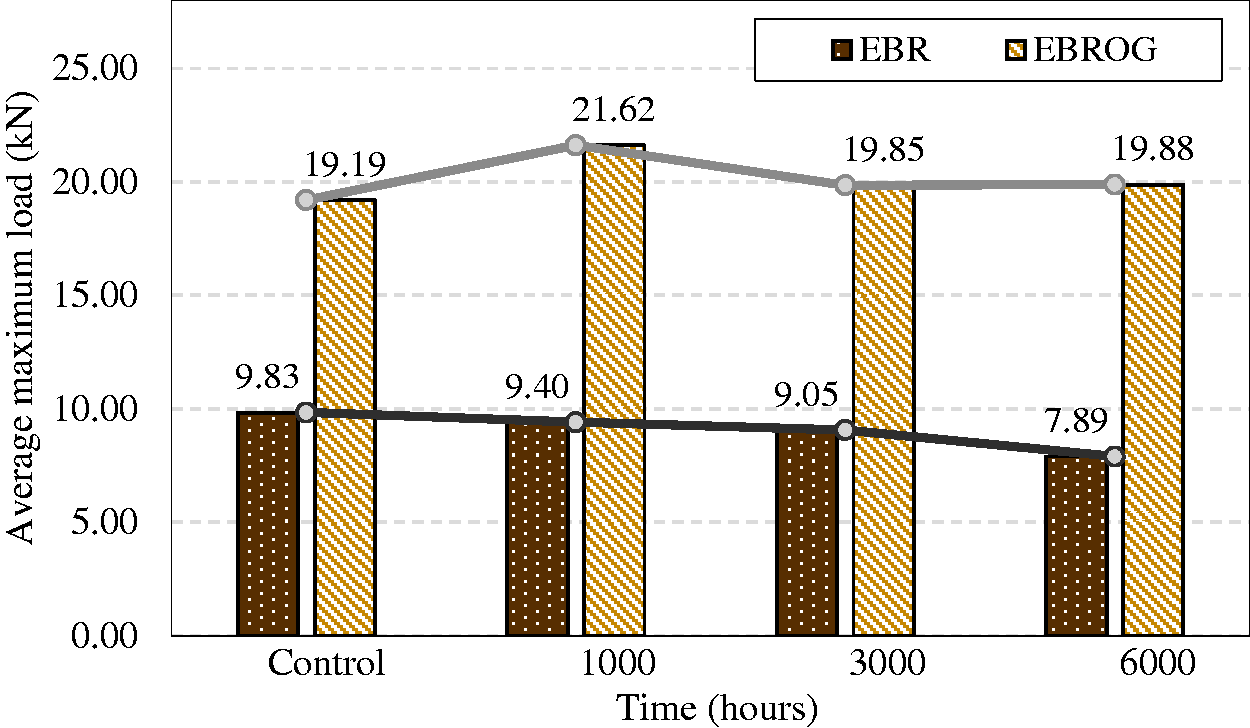
Average values of maximum debonding load for the control and experimental specimens.
Based on Table 3, three types of failure modes may be observed in the specimens: debonding (D), rupture (R), and rupture with debonding (RD). The EBR specimens (debonding) revealed a shift in failure mode from one of substrate concrete separation under the reference conditions to clearly observed debonding under the aggressive environment after 6000 h, which is, a shift from cohesive debonding to detachment from the substrate. This indicates that the long-term exposure to the aggressive environment not only affected bond strength but also the failure mode (Figure 5). In the EBROG specimens, the typical FRP rupture failure mode was observed in specimens aged for 1000 h (Figure 6). After 3000 and 6000 h, however, both FRP rupture and deboning were observed to occur in these specimens.
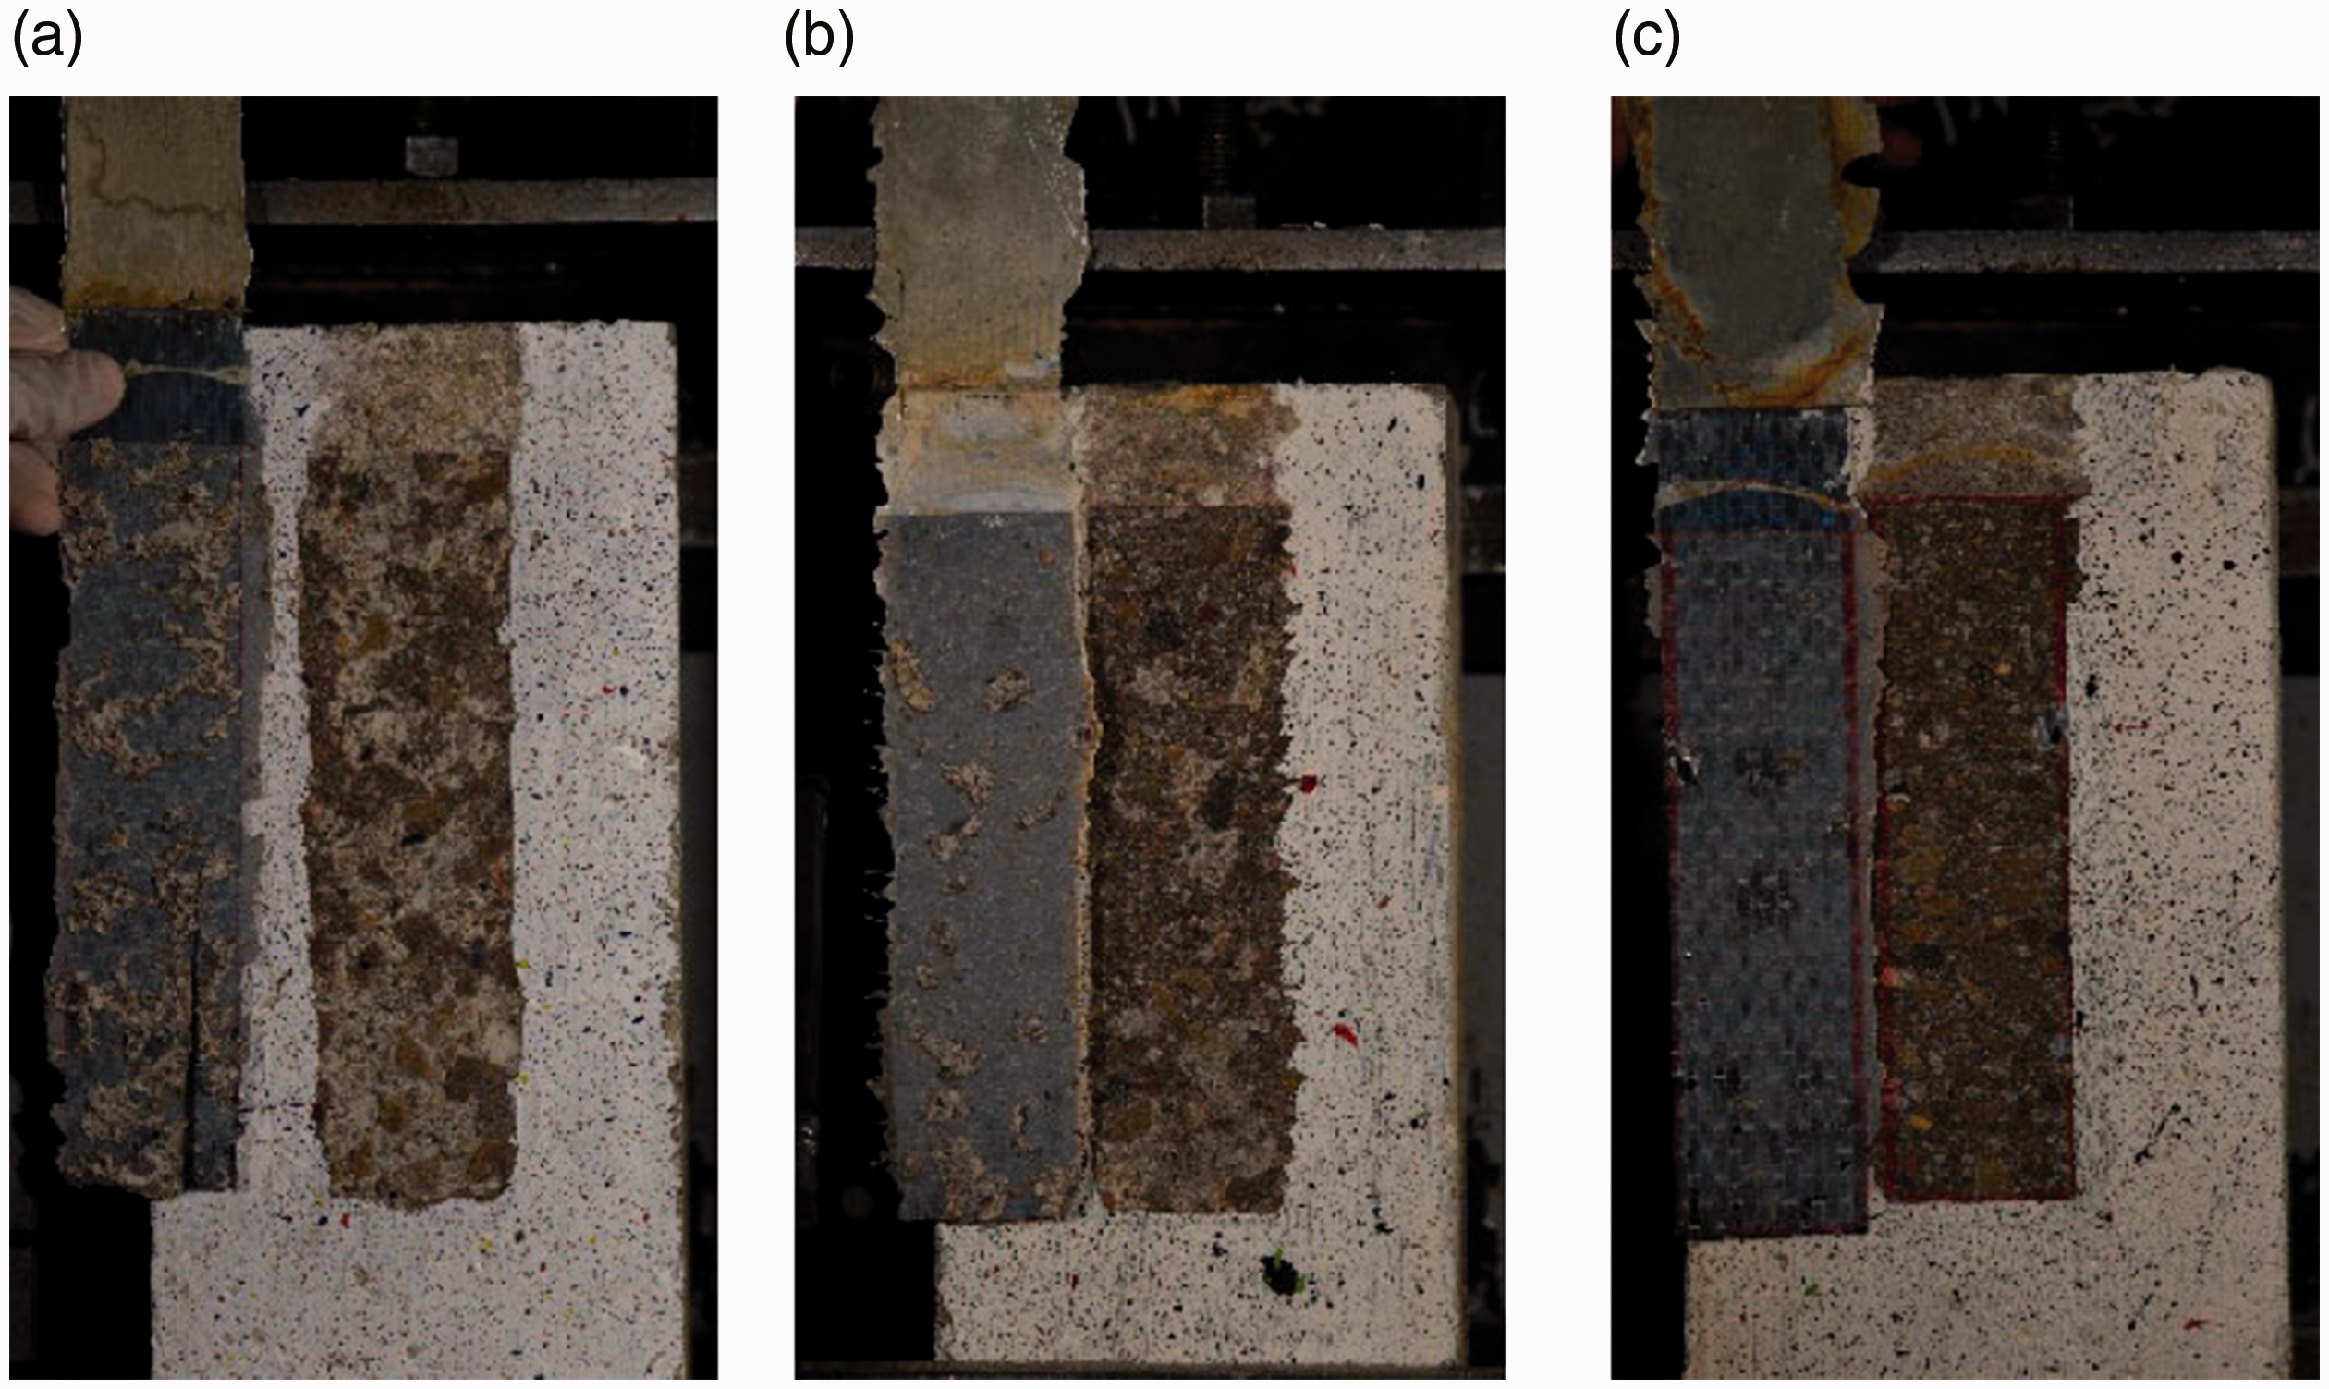
Failure modes in the EBR specimens after: (a) 1000 h, (b) 3000 h, and (c) 6000 h.
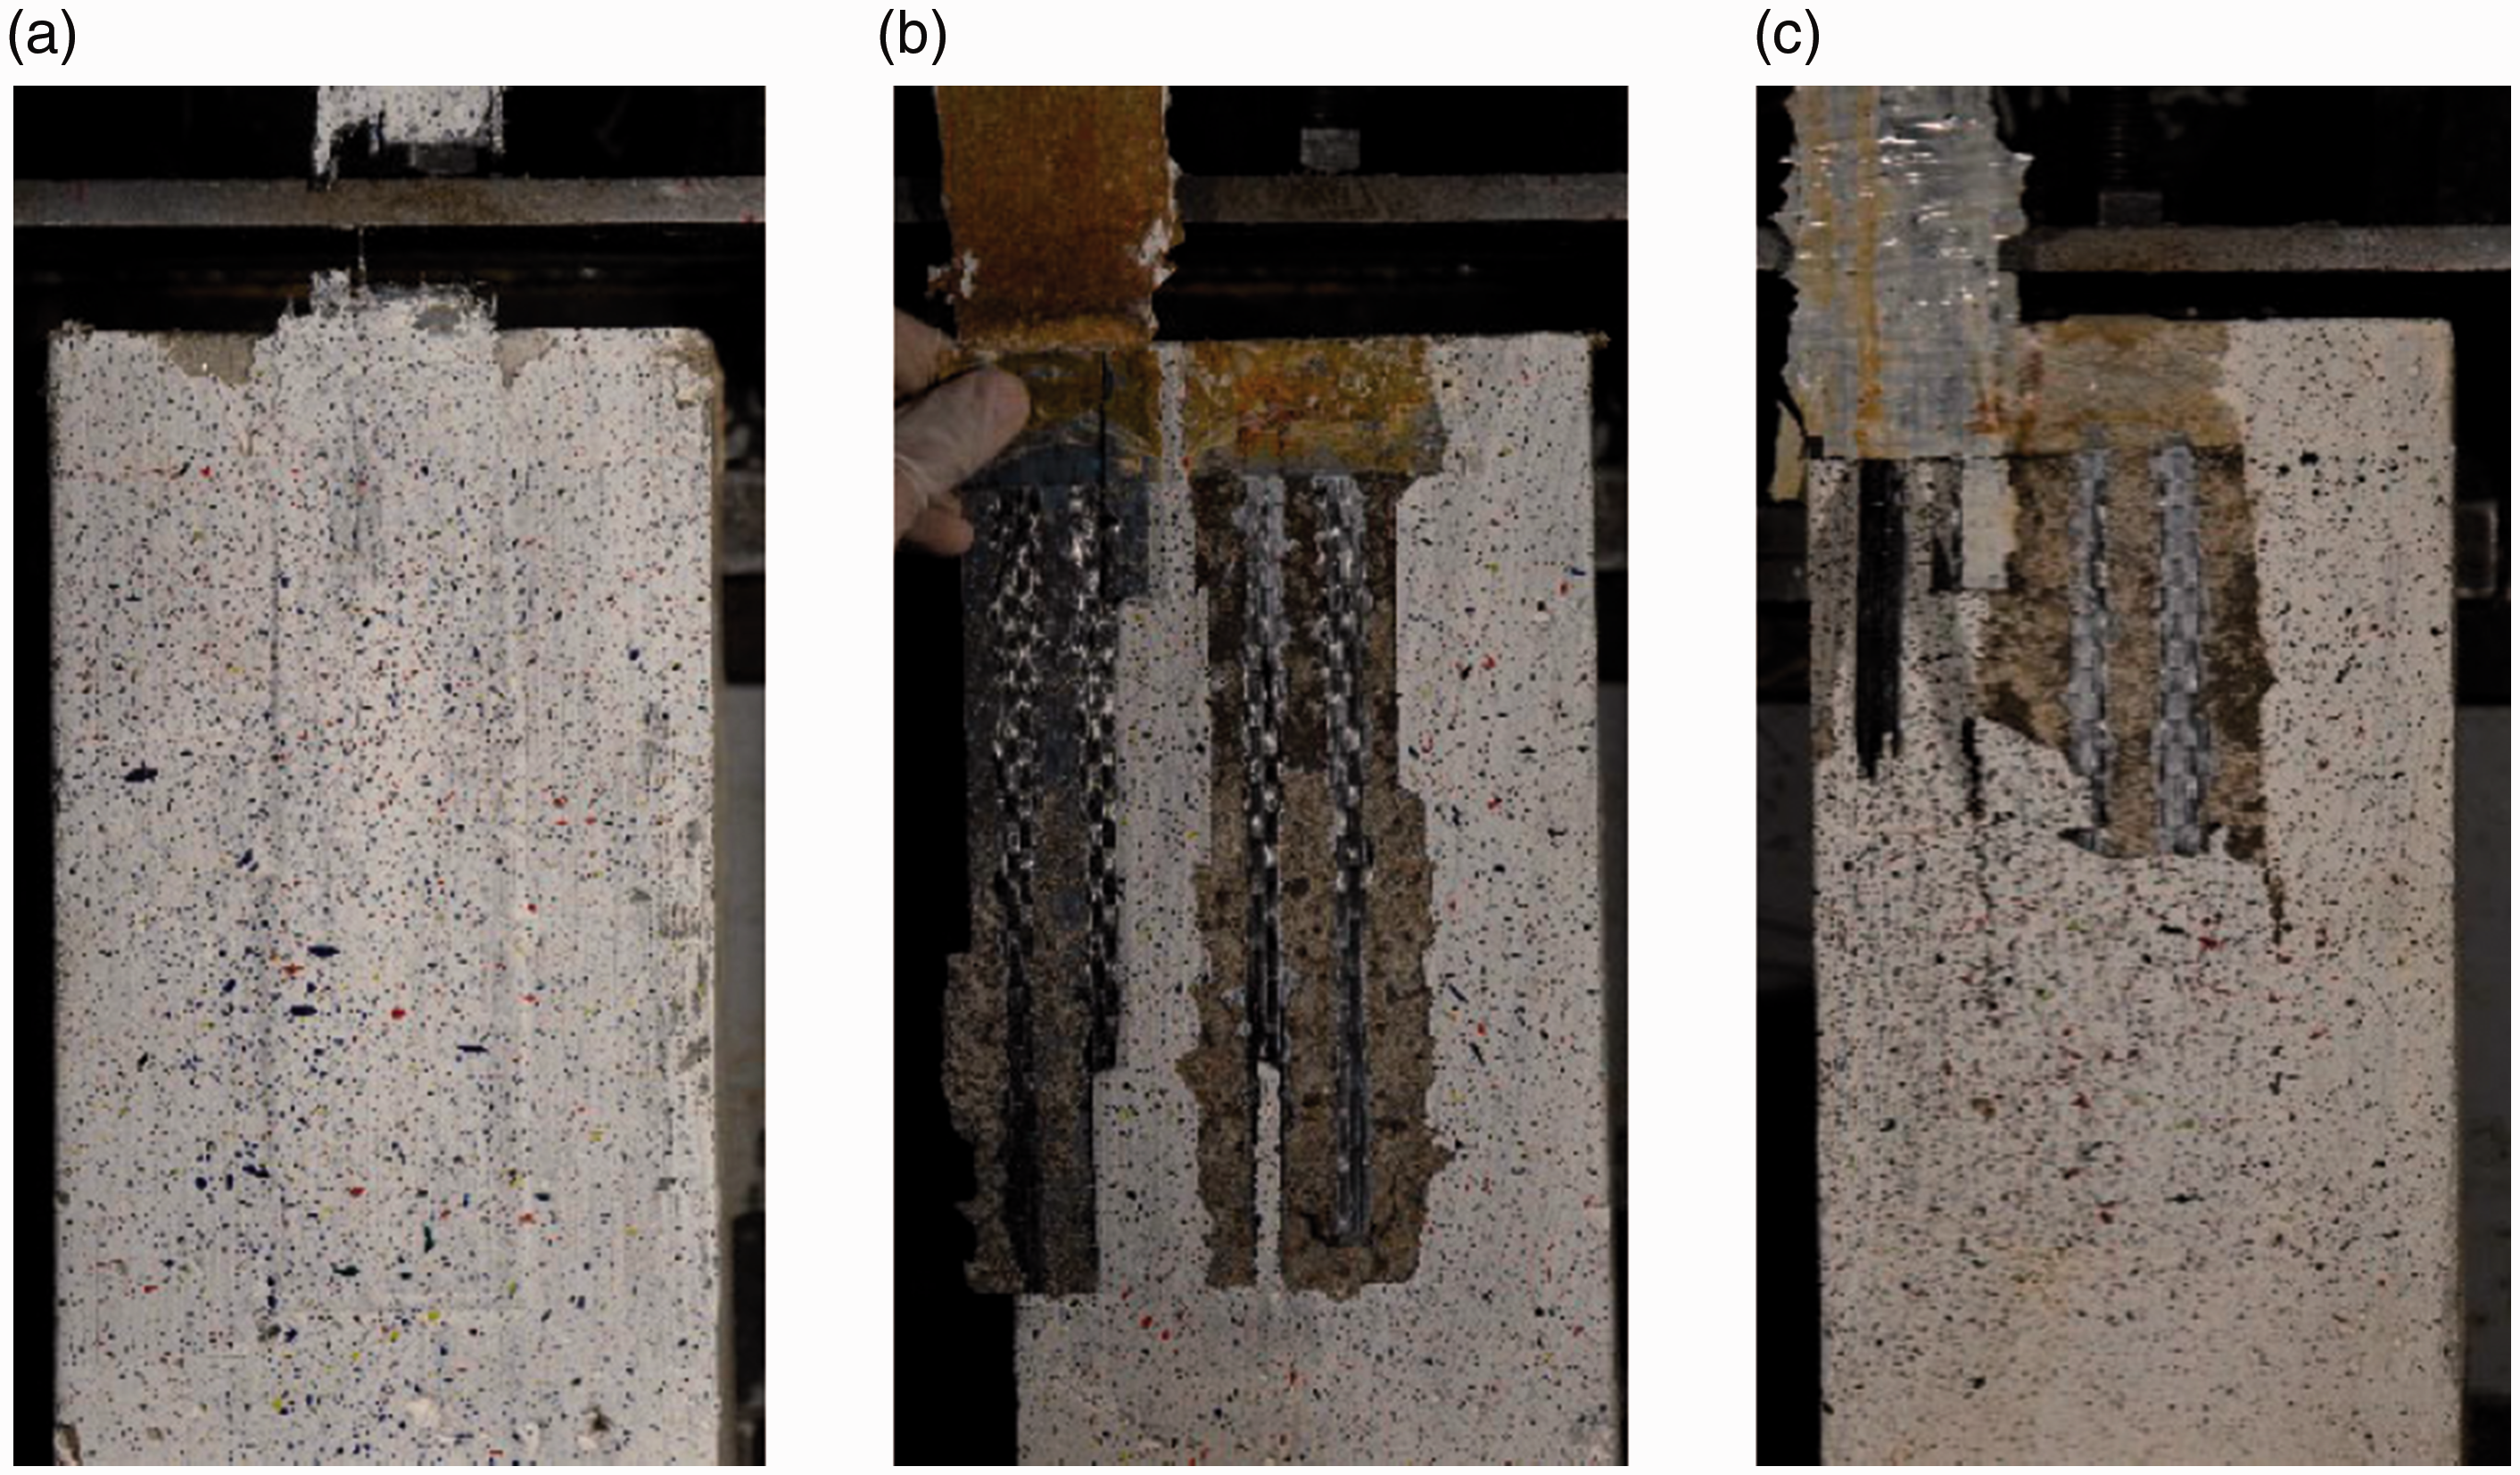
Failure modes in the EBROG specimens after: (a) 1000 h, (b) 3000 h, and (c) 6000 h.
Load-slip curves
Figure 7 compares the load-slip curves for the CFRP-to-concrete bond stiffness using the PIV technique after 1000, 3000, and 6000 h of exposure to the aggressive environment. The comparison in this figure is made from the mean curves. Slip is the relative displacement between CFRP reinforcement and concrete substrate, which is a key factor affecting FRP-to-concrete bond behavior. To determine the amount of global slip, a linear interpolation using the deformation of the right and left patches on the outer edge of the concrete prism was employed. The deformation of the concrete substrate was calculated using this interpolation.
31
The procedure is captured by the following equations


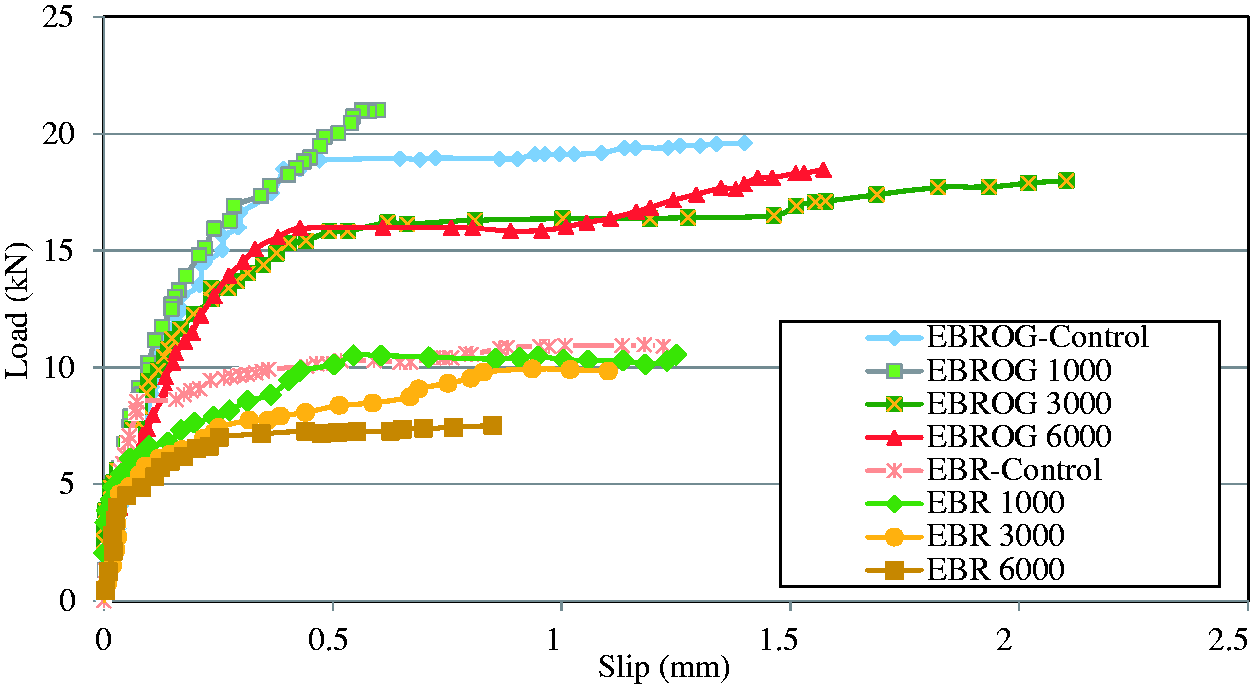
Load-slip curves using PIV results.
At the beginning of loading, no significant differences are observed in bond stiffness among the EBROG specimens. However, bond stiffness decreased in the EBR specimens with time (especially under higher load). Finally, it is seen that slips decreased in EBR specimens with time.
It is observed in Figure 7 that in the EBROG specimen when the time increases from 3000 h to 6000 h exposure, the slip decreases from 2.15 mm to 1.55 mm. It should be noted that the EBROG-1000 specimen experienced an FRP rupture failure mode while the EBROG-3000 and EBROG-6000 specimens exhibited a combined failure mode of FRP rupture and debonding.
Figure 8 presents a better comparison of the slips by showing the bond-slip distribution along the CFRP strip. In the EBR specimens, maximum slips of 1.21 mm, 1.09 mm, and 0.9 mm were observed after 1000, 3000, and 6000 h, respectively. In the EBROG specimens, however, only the slips observed after 3000 and 6000 h were comparable due to the identical failure modes (FRP rupture with debonding) after these exposure durations. More specifically, the slip value obtained with the EBROG specimens decreased by 9.4% after 6000 h relative to that recorded after 3000 h. Finally, it is noted that the EBROG curves are more regular in shape and uniform in behavior than those of the EBR specimens.
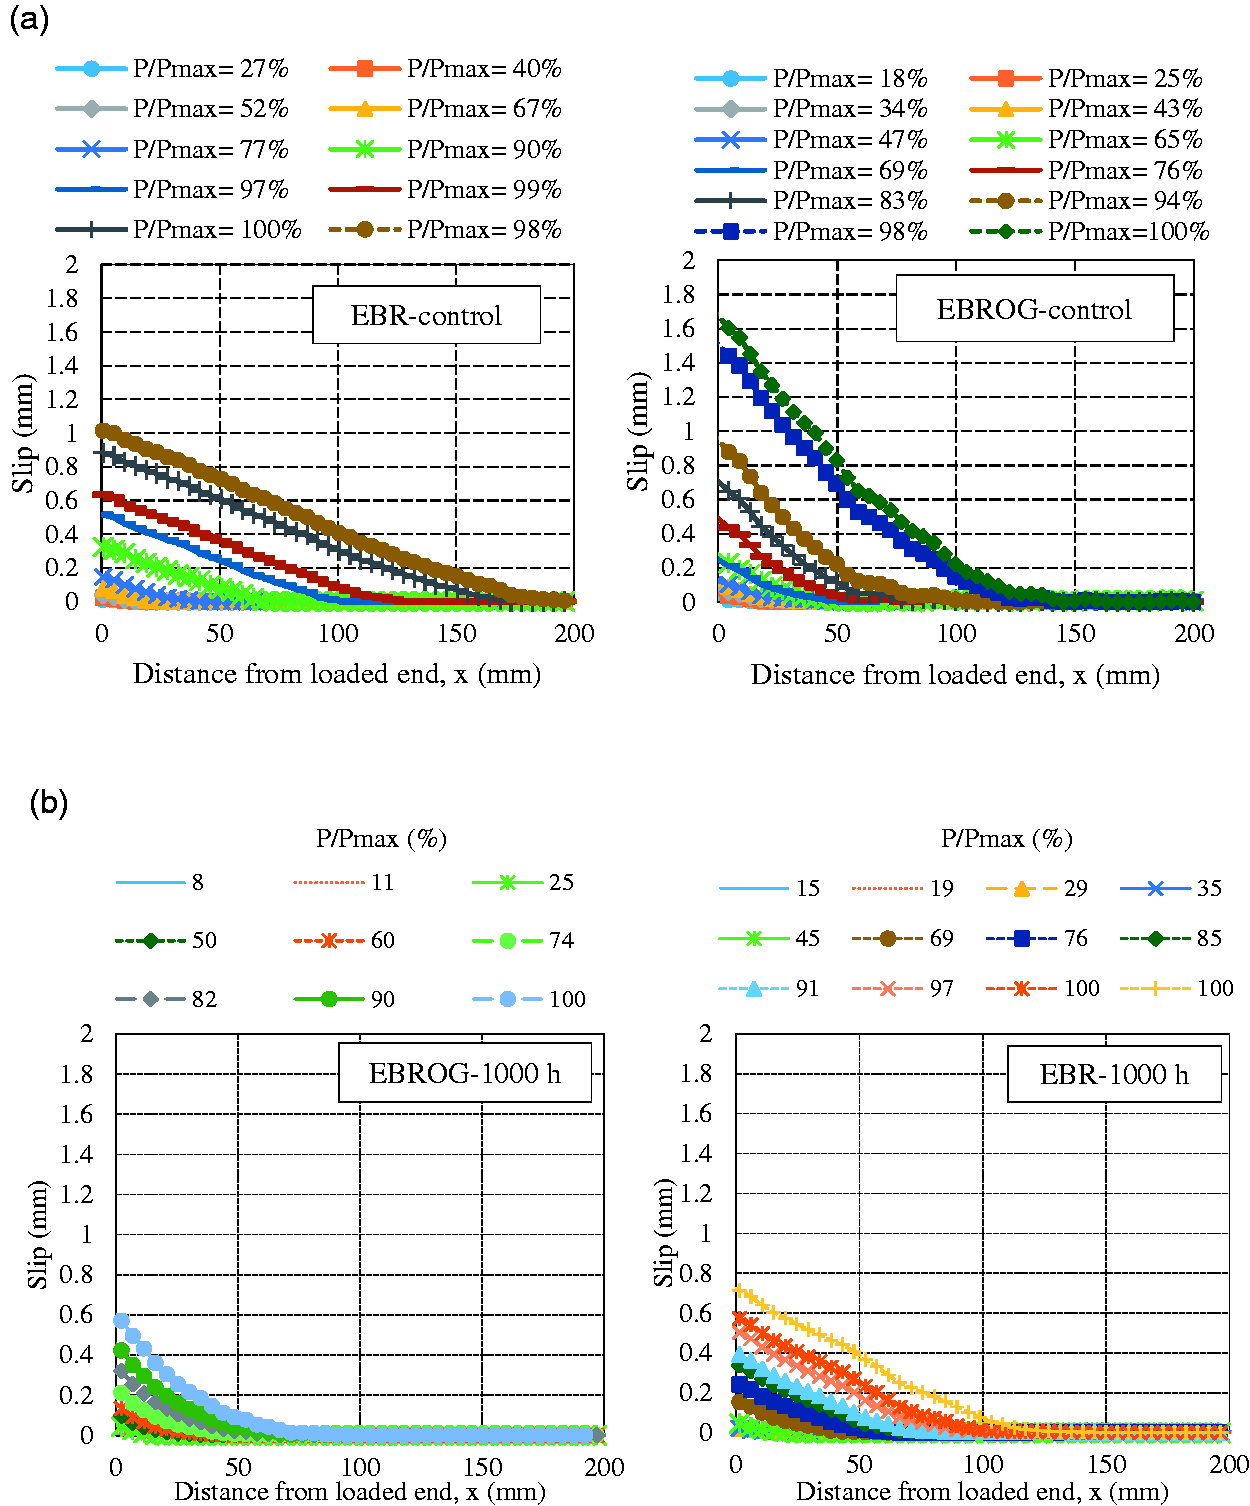
Bond-slip distributions in the EBR and EBROG specimens after exposure of: (a) zero (control), (b) 1000 h, (c) 3000 h, and (d) 6000 h.
Strain distribution along the bond length
The PIV technique was employed to derive the strain distributions along the CFRP strip at different load levels for the specimens subjected to the aggressive environment (Figure 9). To evaluate the strain values at the bond area of the CFRP-concrete interface, strain field measurements were made using patches of 256 × 256 pixels spaced at 128-pixel centers.
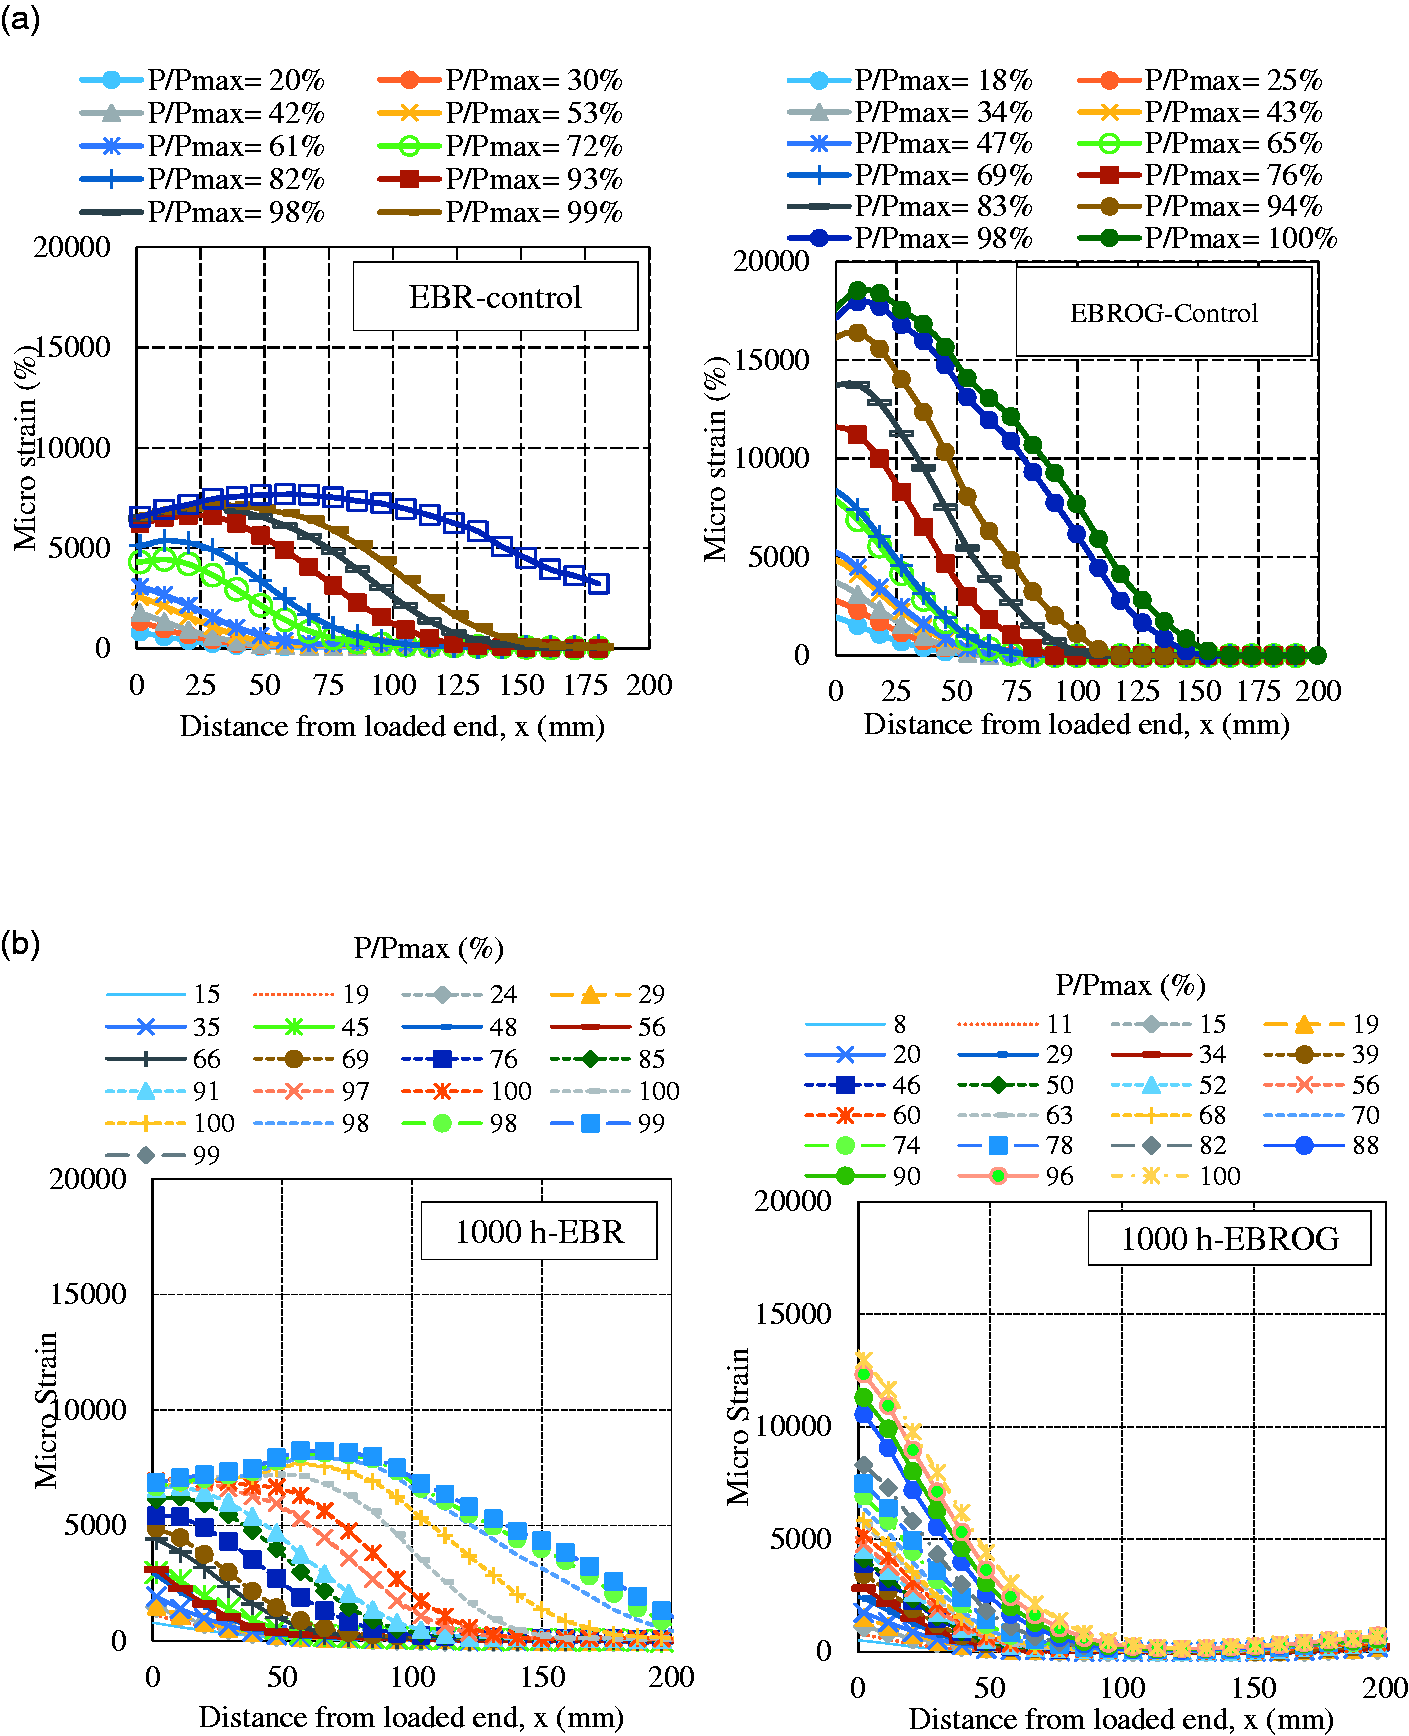
Strain along the FRP-concrete bond in the EBR and EBROG specimens after exposure of: (a) zero (control), (b) 1000 h, (c) 3000 h, and (d) 6000 h.
The EBR specimens exhibited a similar strain distribution behavior for all the exposure durations of 1000, 3000, and 6000 h. According to Figure 9, the CFRP-concrete interface exhibited a two-stage bond behavior as it changed from a regular (under a lower loading) to an irregular shape (under a higher loading) with stiffness declining as loading increased. A significant reduction (about 23.4%) in strain value was observed after 6000 h of exposure. This observation is confirmed by the similar change reported in the literature 10 for specimens exposed to an alkali environment. It worth mentioning that the maximum strain reduction is essentially related to the bond load variation.
The EBROG specimens exhibited different behaviors (Figure 9). Tests results of the effects of 1000, 3000, and 6000 h of exposure to the aggressive environment on the CFRP-concrete bond stiffness revealed lowered strain values (13,960 microstrains) after nearly 3000 h of exposure, with a recovery to the initial value (14,246 microstrains) after 6000 h when compared with those of the control specimens.
Bond stress distribution
In the single-shear test, the average interfacial shear stress may be obtained from the following equation

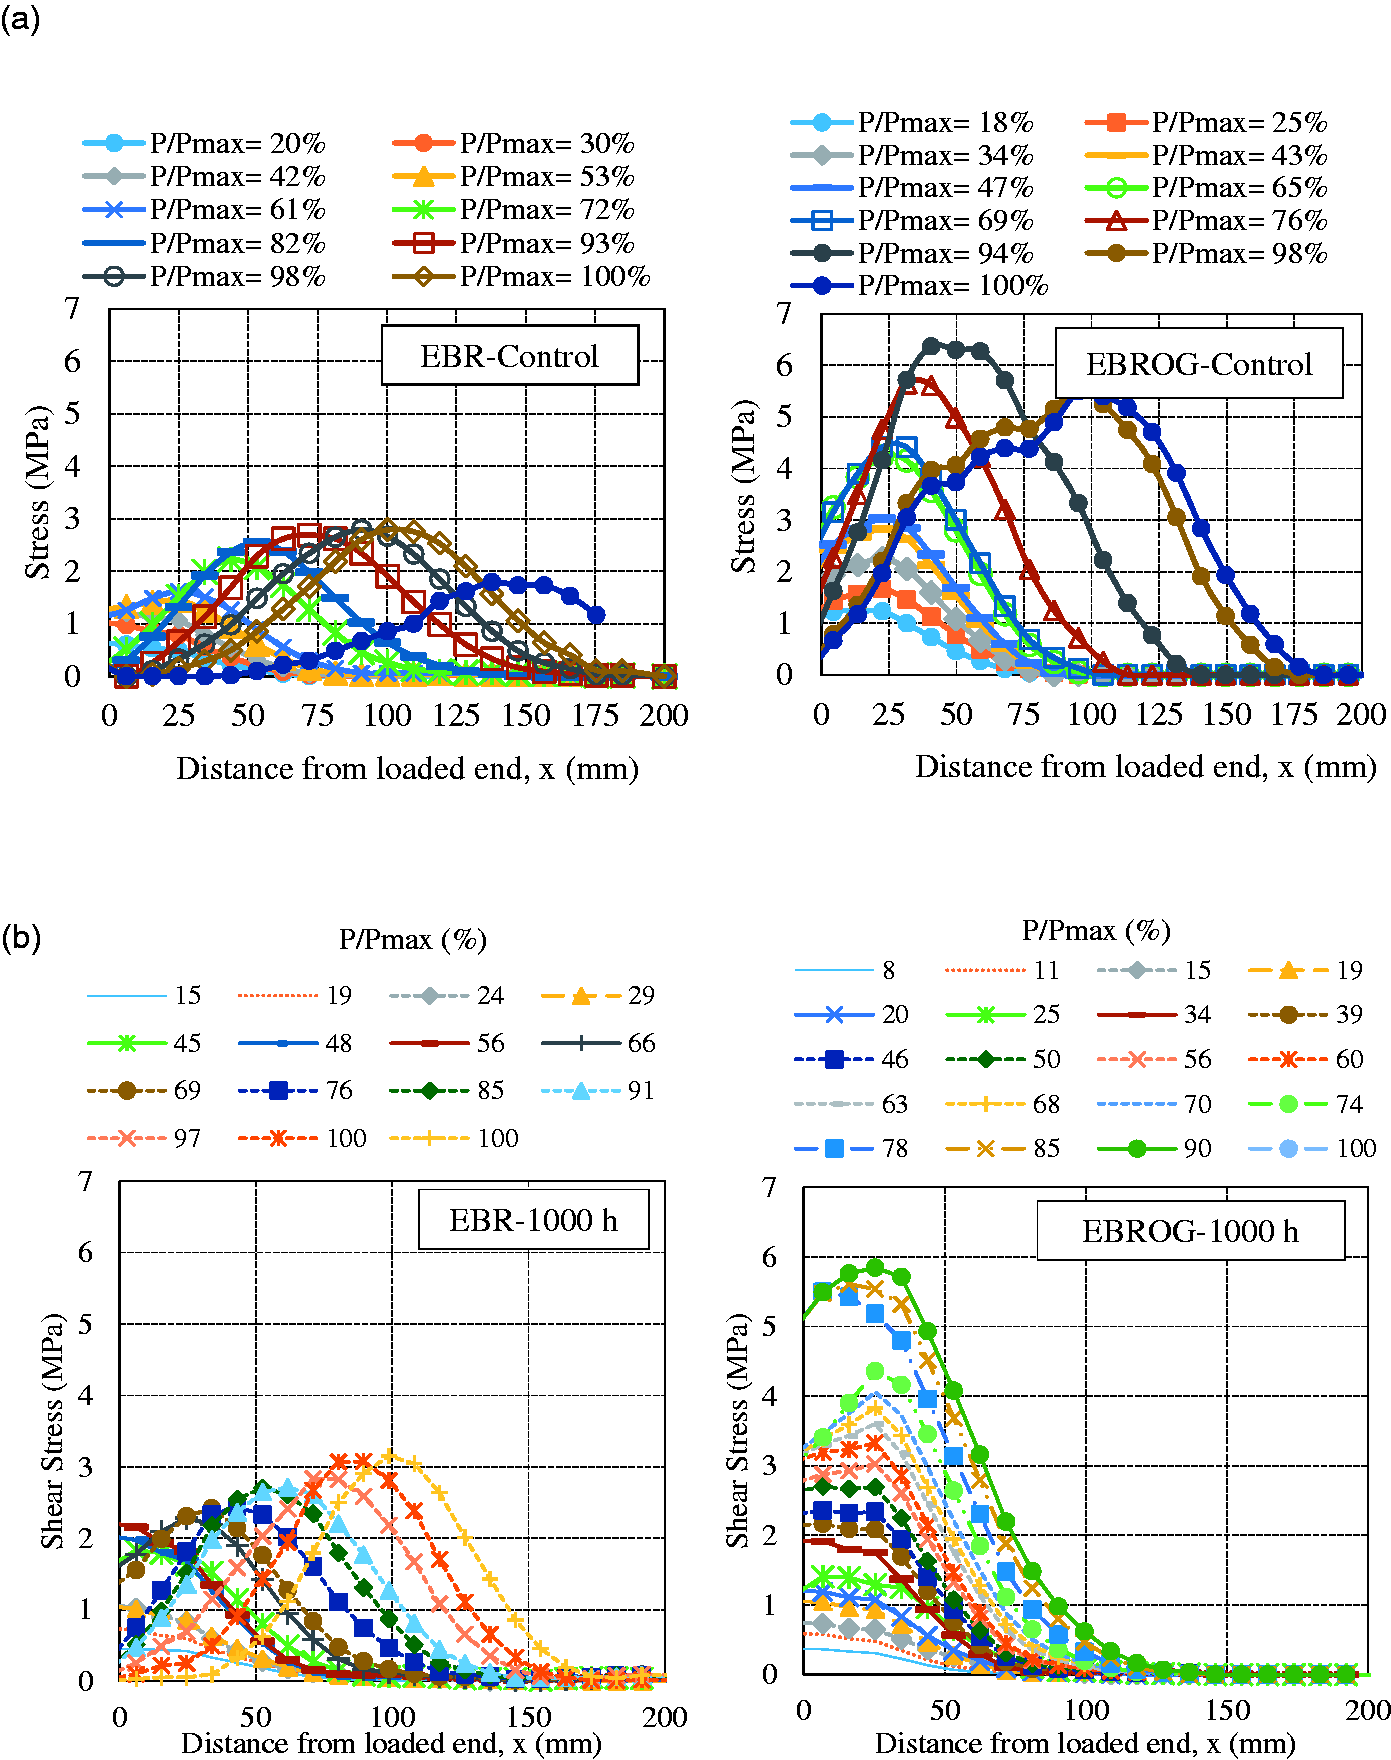
Stress along the FRP-concrete bond in the EBR and EBROG specimens after exposure of: (a) zero (control), (b) 1000 h, (c) 3000 h, and (d) 6000 h.
The maximum bond stress distribution curves derived for the aged and control specimens are compared in Figure 11. Generally speaking, maximum stress is observed to occur close to the ending load with long exposure to the aggressive environment. As shown, the interfacial bond stress firstly increases gradually from zero to its peak value and then decreases gradually to zero, which forms a bell-shaped distribution curve along the CFRP sheet. The bell-shaped interfacial bond stress curves shift gradually from the loaded end to the other end as the CFRP debonding propagates. The width of the bell shape distribution shows a little variation at different exposures. It is also evident that the peak shear bond stresses in both the aged and control EBROG specimens were greater by two times than those recorded for the EBR specimens treated under identical conditions.
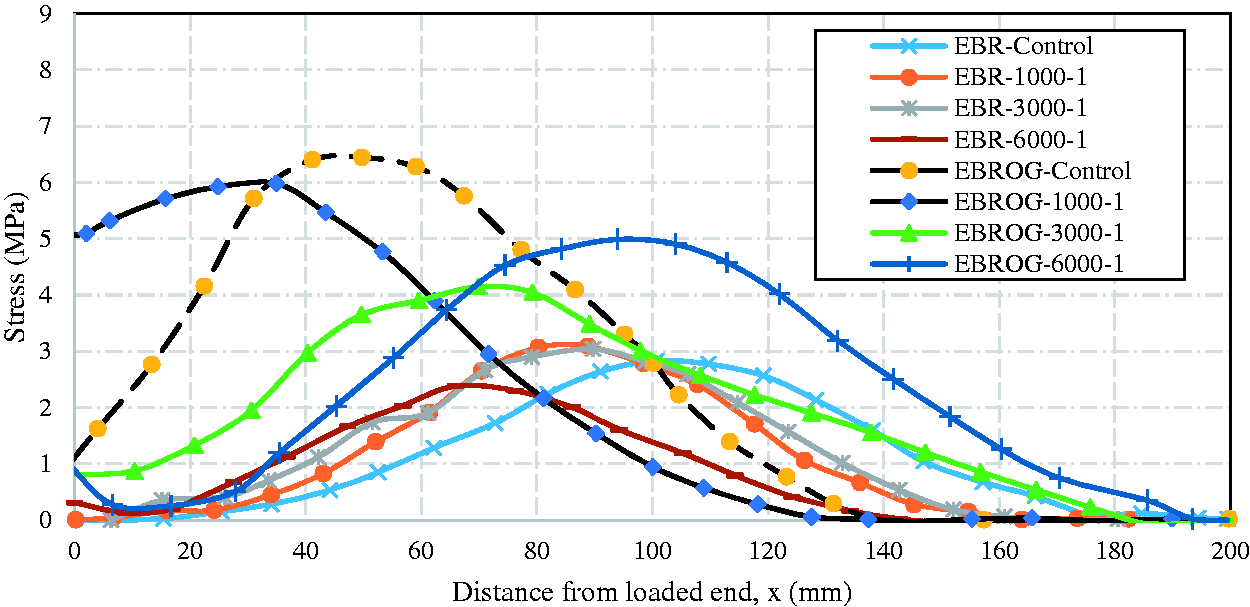
Comparison of bond stress distribution along the CFRP-concrete bond at ultimate load in the EBR and EBROG specimens.
Bond-slip relationship
The bond-slip relationship is the constitutive relationship of the bond behavior. Such a relationship depicts the interfacial shear stress versus slip at a specific location. The bond-slip graphs for the EBR and EBROG specimens tested in this study are presented in Figure 12. The graphs show that the shear stress and the corresponding slip initially increased linearly up to the peak value followed by a minor nonlinear section before and after the peak stress. Upon reaching the peak stress, the curve descended slowly until the bond interface debonded completely or rupture occurred. Although the initial stiffness of the specimens was nearly the same, the values of peak shear stress and the corresponding maximum slip were significantly different due to intrinsic differences between the EBR and EBROG joints behavior, also due to the exposure environment conditions. It is observed in the graphs that the EBROG specimens not only possess the higher loads (by two times than that of EBR specimens treated under identical conditions) but also the larger slips, indicating their more energy absorption upon failure.
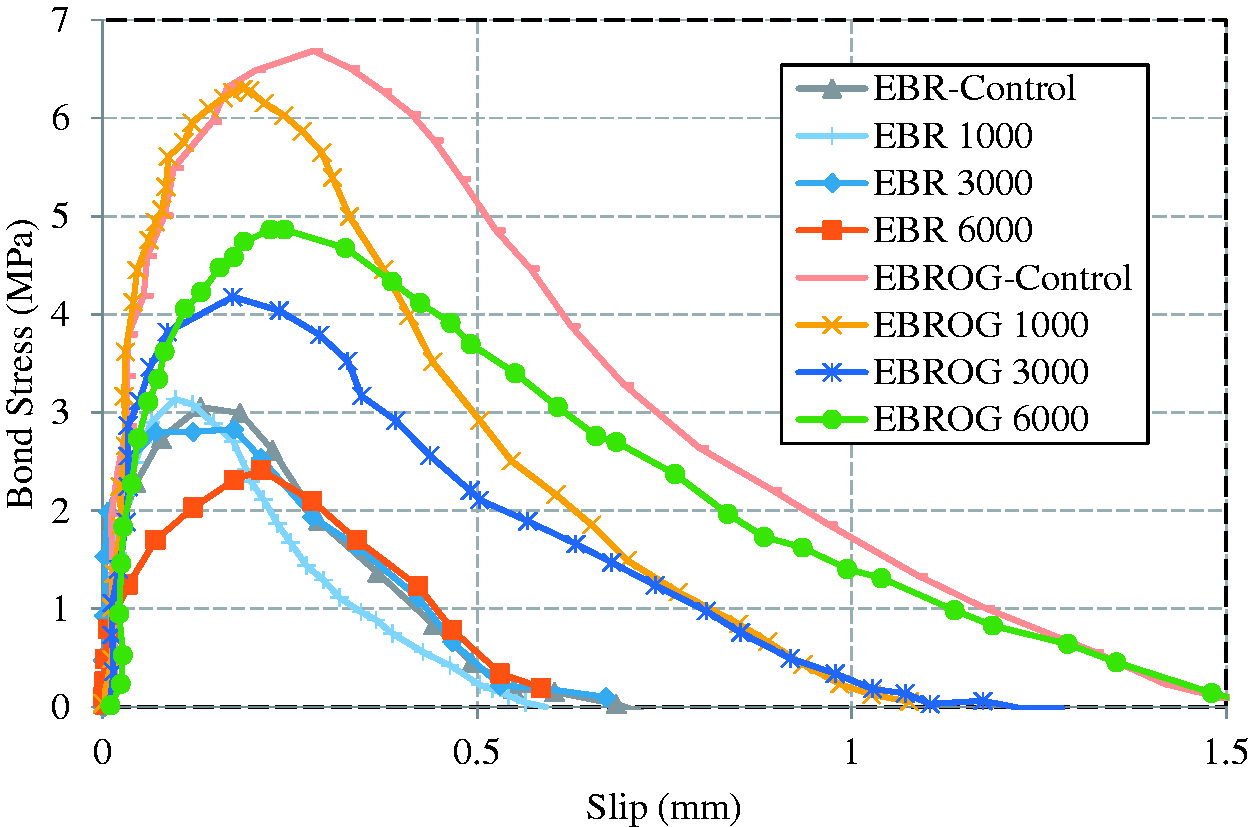
Comparison of bond-slip graphs of the EBR and EBROG specimens.
Slip, strain, and stress fields
The digital images of the slip, strain, and stress contours on the CFRP surface corresponding to different loading stages are shown in Figure 13(a) to (c), respectively, for both EBR and EBROG specimens after 6000 h of exposure. An area of 50 × 150 mm was adopted on each specimen and patches of 256 × 256 pixels spaced at 128 pixels center-to-center were generated using the PIV method. The grooves on the EBROG-6000 specimens created a stronger FRP-to-concrete bonding as evidenced by the higher slip, strain, and stress values they recorded. In both types of specimens, microcracks formed at low loading levels while higher loading levels led to macrocracks before debonding occurred. The same process was observed in the EBROG-6000 specimens but only later during the third exposure time. Finally, it is clear from the stress fields that high-stress contours moved further away from the loaded end as the loading level increased.
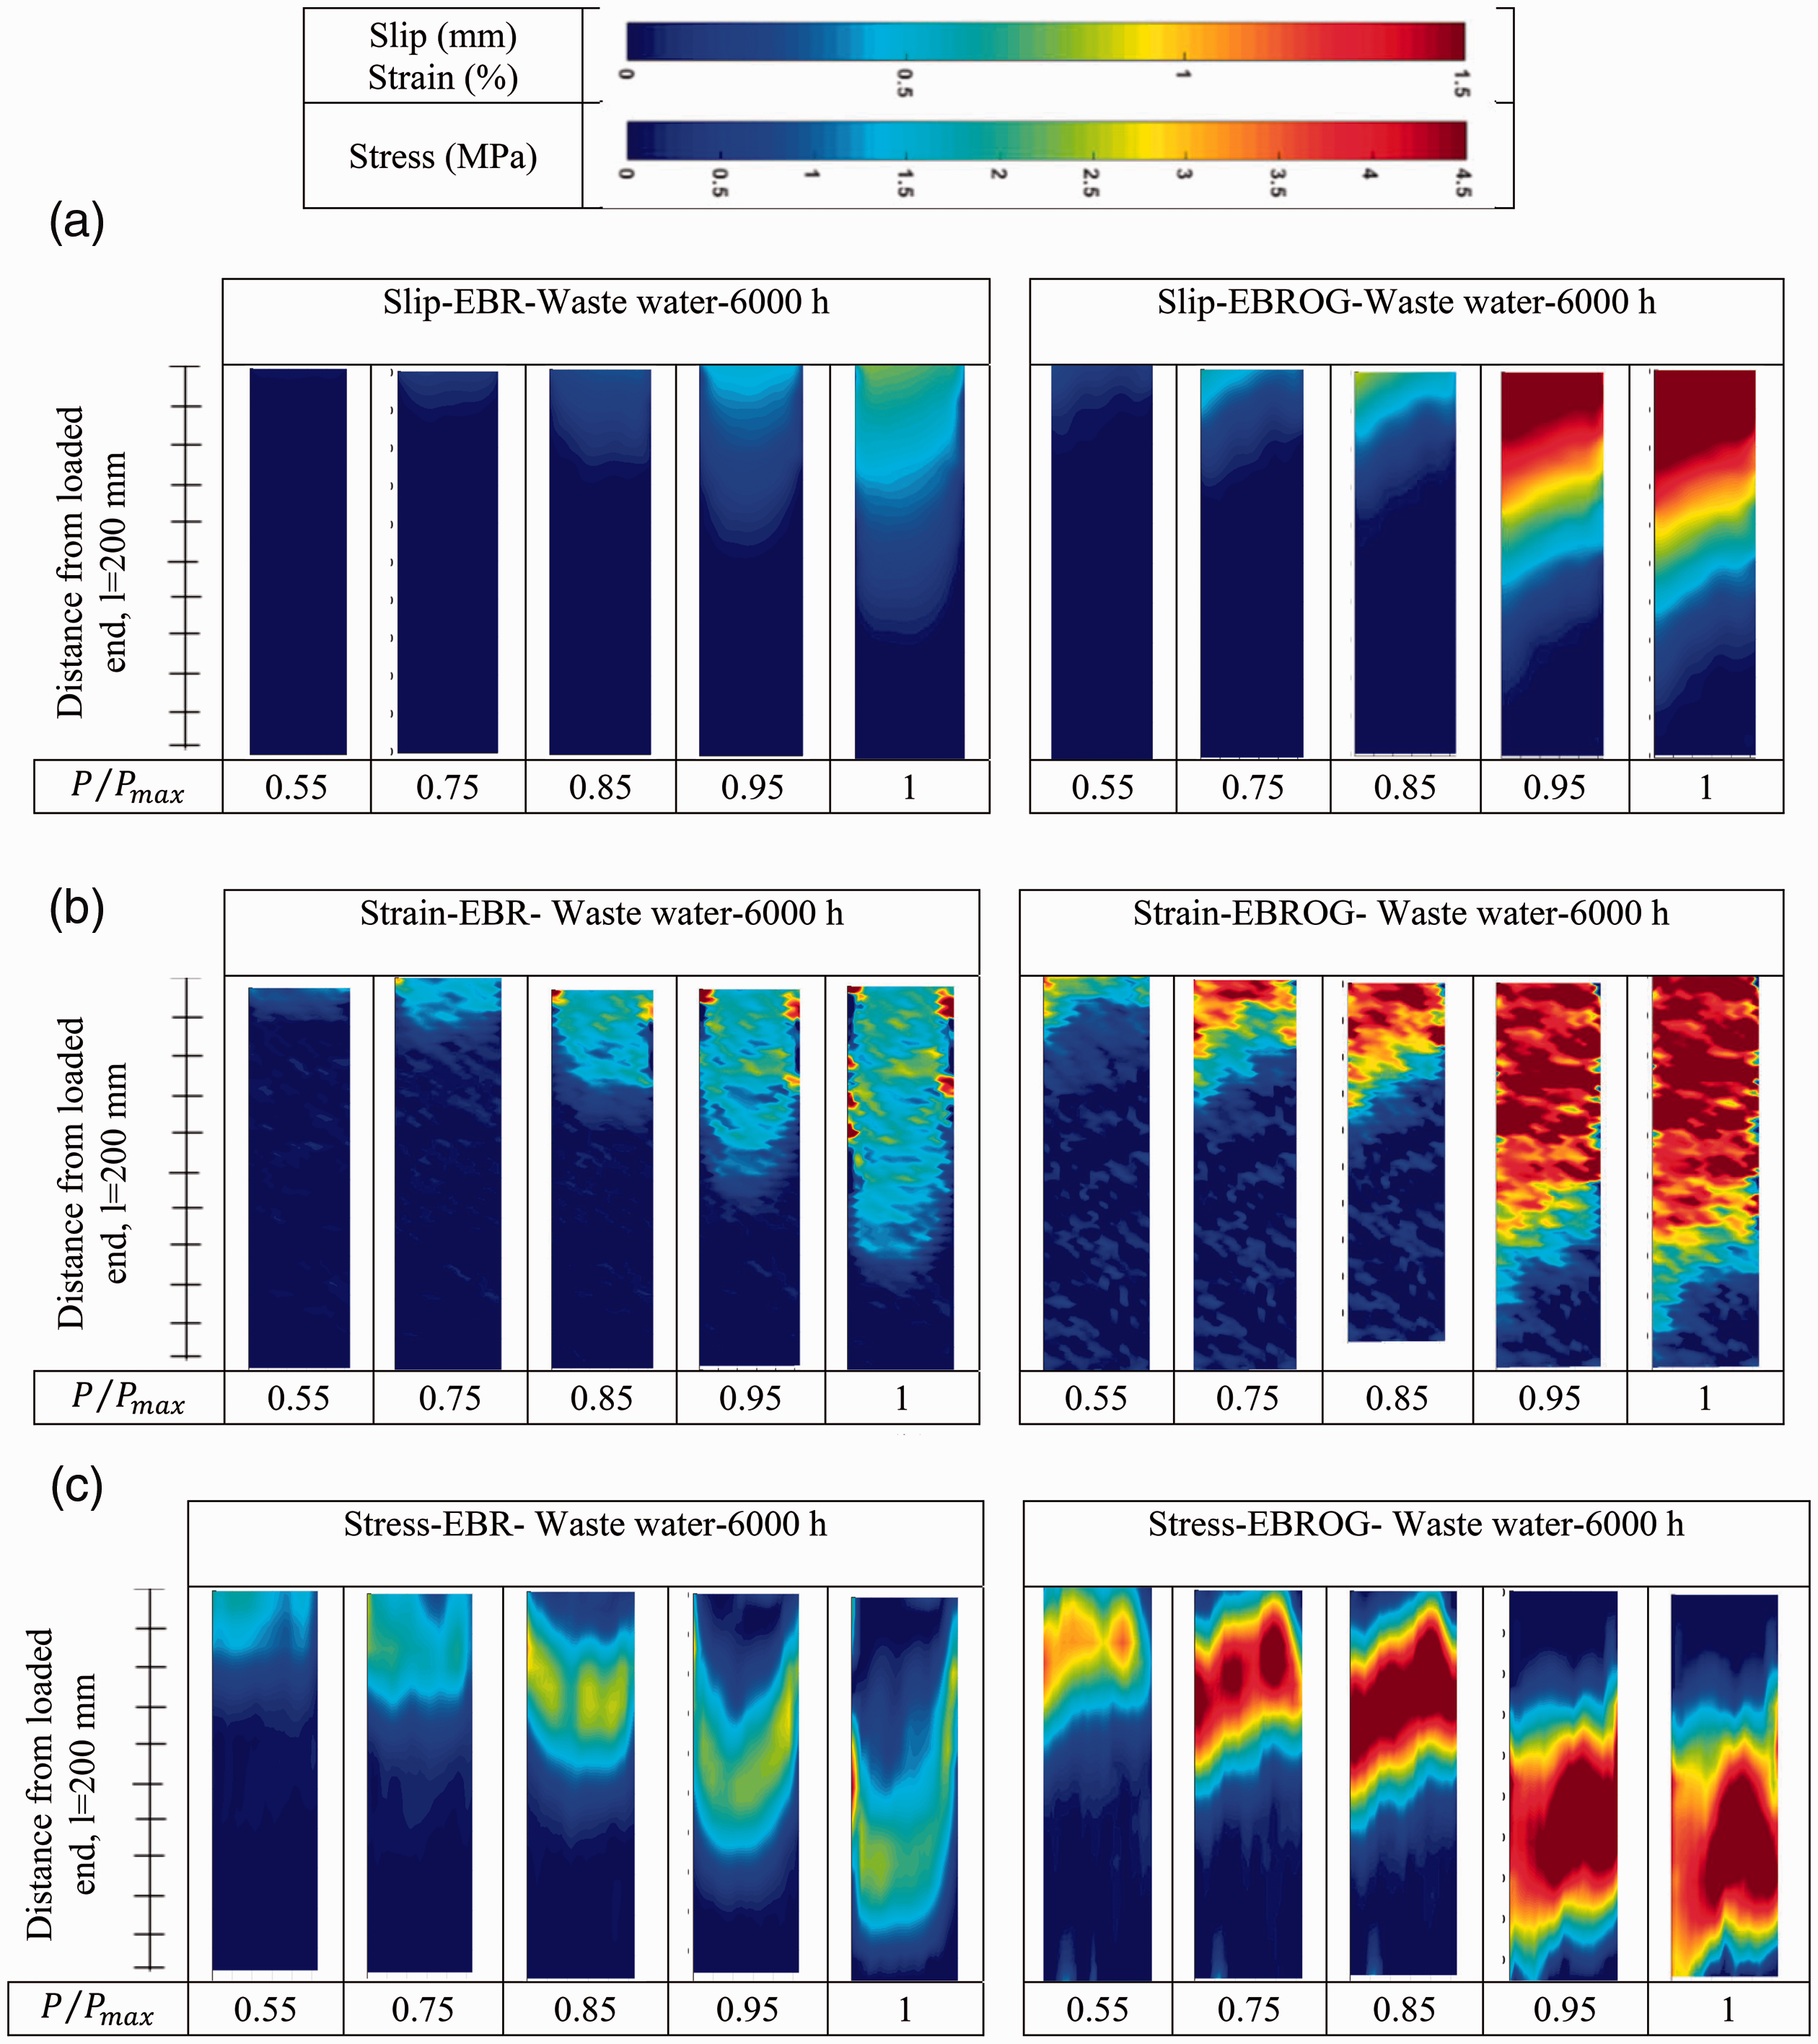
Contours at different loading stages in the EBR and EBROG specimens: (a) slip contours, (b) strain contours, and (c) stress contours.
Conclusion
This study may be regarded as a leap forward in understanding the impact of environmental factors on the failure mechanism in CFRP-strengthened concrete. Using the single shear test set-up and the PIV technique, the effects of the two surface preparation methods of EBR and EBROG as well as the effect of the aggressive concrete sewer chamber on the CFRP-concrete bond were studied in detail. The following conclusions might be drawn from the results obtained:
The ultimate bond load of the CFRP-concrete interface strongly depends on the surface preparation method employed. While the bond strength of the EBR specimens depends on both type and duration of exposure to the harsh environmental conditions, the bond strengths of EBROG specimens are not significantly affected by the aggressive environment. This may be attributed to the grooves cut out on the concrete surface and to the formation of macro- and micro-cracks under the FRP–concrete bonded area. Three different failure modes (CFRP debonding, CFRP rupture, and CFRP rupture with debonding) were observed in the EBR and EBROG specimens. Long exposure of the EBR specimens to the aggressive environment was observed to lead to less concrete debris left on the epoxy when compared with the situation in the reference specimens. In the case of the EBROG specimens, the failure mode was observed to change from CFRP plate rupture to concrete shearing with an increasing exposure period. Maximum bond strength in the EBR specimens decreases with time by up to about 19.7% after 6000 h. In the EBROG specimens, maximum bond strength initially increased by 8.9% after 3000 h before it reached 3.6% after 6000 h. In general, the EBROG specimens recorded maximum bond strengths two times greater than that measured for the EBR specimens. The maximum slip, strain, and stress values of the CFRP system in the EBR specimens decreased at the different stages of loading with increasing exposure to the aggressive conditions. This is while a different trend was observed with the EBROG specimens which underwent a failure mode after 1000 h different from that after 3000 and 6000 h. For the specimens undergoing the same failure mode (i.e. after 3000 and 6000 h), maximum slip, strain, and stress values of the CFRP strengthening system increased while the prolonged aggressive conditions had no significant effects on their bond strength. This indicates the superior benefits of the EBROG technique over the EBR one used for preparing concrete surfaces for FRP strengthening.
Footnotes
Declaration of Conflicting Interests
The author(s) declared no potential conflicts of interest with respect to the research, authorship, and/or publication of this article.
Funding
The author(s) received no financial support for the research, authorship, and/or publication of this article.