






Abstract
Fiber reinforced composite materials are a heavily sought after material for next generation vehicles for light-weighting components due to their high specific strength and stiffness. However, these materials have relatively weak interlaminar strength and are prone to delamination. This is especially the case when a delamination crack already exists. Quasi-3D (Q3D) braided composites seek to solve this issue by weaving the bias tows into the adjacent (above and below) plies. The plies are physically connected through fiber tows as opposed to being bonded simply by the epoxy, and the composite will achieve a higher interlaminar strength due to fiber failure being required for crack propagation as opposed to simply matrix failure. The
Introduction
The ever-increasing demand for more fuel efficient vehicles has increased the necessity to use high-specific strength and stiffness materials. This is especially true with the budding electric vehicle divisions in the automotive industry because the range of the vehicles has been an important issue. Carbon-fiber reinforced polymers (CFRPs) have been proven in the aerospace, racing, and sporting industries as a prime example of this type of material. The use of CFRPs currently range from tennis racquets to Formula 1 chassis to commercial jet fuselages.
However, one major issue with CFRPs is the failure mode of delamination under out-of-plane impact loading. This is a major issue in the automotive industry due to high crash-safety standards. In a typical automotive crash, critical composite parts can experience impact loading in the through-thickness direction and cause delamination. If the delamination resistance of the composite can be improved, the composite can have better specific energy absorption properties and be a more viable candidate for crash-safety critical components like bumpers, roof headers, and frame rails.
There have been many proposed solutions for increasing the fracture toughness of laminated composites, and two of the most common methods include stitching1–3 and z-pinning.3,4 In both of these methods, the composite preform is first compiled, and the through-thickness reinforcement is later inserted into the preform. These reinforcements are also typically inserted orthogonal to the fibers in the laminate, purely in the 3-direction respective to the fibers. Stitched composites are manufactured by taking a preform and using a stitching machine to run a needle with a high-strength yarn through the preform,1–3,5 where z-pinning takes the preform and inserts small rods made of a metal or composite into the preform.3,4 Both of these methods have been shown to improve the mode I and mode II fracture toughness with typical increases in GIC of around 75%1,6 with the steady state crack growth resistance, GI, increasing by factor of 2.9–15.7 6 in stitched composites. Similar increases are found with laminates that are improved by z-pinning with the GI value typically increasing by one magnitude.7–9 Z-pins have also increased the mode II fracture toughness, GII, but not by as significant of an amount. Cartie et.al. found a 2–5 factor increase depending on the density and diameter of the pins being used. 7
While stitching and z-pinning may increase the fracture toughness of the composites, it has been found that they also reduce the in-plane properties that make them desirable initially. In a review paper by Mouritz, Leong, and Hersberg, tensile properties can be reduced anywhere from 30% to 45% and compressive properties can be reduced by 5% to 55% due to stitching. 5 The values for the degradation, along with whether or not the properties are actually degraded, largely vary between the papers reviewed; however, the majority of papers show degradation in the in-plane properties. This degradation has been attributed to fiber damage/breakage and fiber angle spreading due to the insertion of the needle in the stitching process. 5 Z-pinning also experiences fiber angle spread along with resin rich areas around the pin.3,4,10 For thick pins with a 2% pin density in the laminate, Mouritz found that there is a range of 7%–17% decrease in Youngthe papers reviewed; however, the majority of papers show degradation in the in-plane properties. 10 It is also found that tensile strength is typically degraded by 5%-10% and the fatigue performance is reduced. 9
Quasi 3-dimensional (Q3D) composites are seeking to solve the issue of in-plane property degradation that comes with the increase in fracture toughness. Q3D composites differ from other fracture toughness increase mechanisms by not using a through-thickness reinforcement that is orthogonal to the fibers. Instead, the fiber tows are braided in such a way that instead of each tow being constrained to a single layer, it is also braided into the adjacent layers from which it originates. In the case of the triaxially braided composites being investigated in this study, the bias tows are braided in this way and the axial tows remain straight within their respective layer. Figure 1 highlights a tow that bridges this interlaminar gap. This figure shows what a unit cell of a Q3D composite architecture used in this paper looks like. To give a more specific example, a bias tow in the third layer of a composite will not only be braided around the axial tows of the third layer, but it will also be braided around the axial tows of the second and fourth layers as well. These bias tows then bridge the gap between layers such that fiber breakage is required for crack propagation instead of simply matrix failure. When a preform of a Q3D structure is created, there are not individual layers as with traditional laminated composite. Instead, there is a single preform where every layer is now braided together. More information about Q3D composites can be found in US Patent US009273933. 11
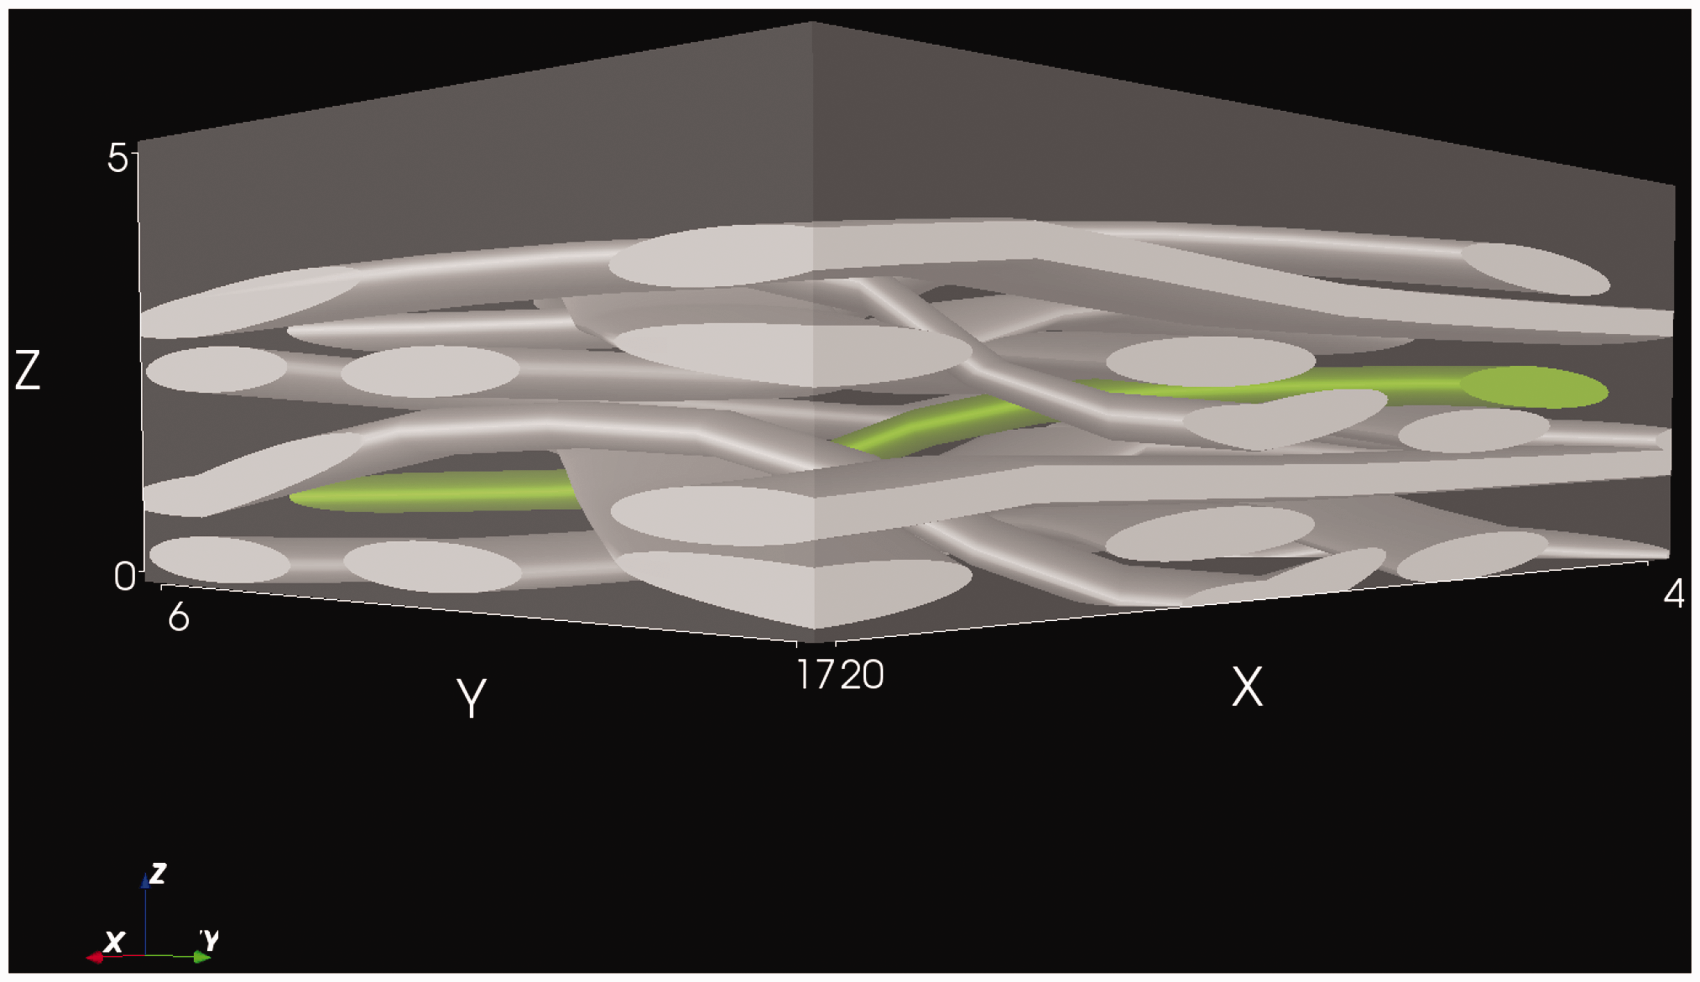
Q3D unit cell with the bias tow that is braided between the layers highlighted.
Because the bias tows are only braided into the adjacent layers and not through the full laminate, they remain relatively flat. There is also no post-processing of the preform required with needle or pin insertion, so there is no extra fiber damage, fiber spreading, or resin-rich areas that form. Rosario and Liu found that the Q3D architecture for biaxially woven composites have competitive in-plane properties to its laminated counterpart while also having increased impact properties.
12
Wu Zhou tested the in-plane tensile properties of the
This paper investigates Q3D composites and the effect that the bias tows bridging the ply interface have on the mode I and mode II fracture toughness. Attention is especially paid to the steady state growth of the crack as opposed to simply the initial values to determine the relationship between the crack length and the fracture toughness in both the UD and Q3D composites.
Materials and experimental techniques
Sample manufacture
The samples used in the current study are manufactured using the vacuum-assisted resin transfer molding (VARTM) method with a single [0

Schematic showing layers of laminates for fracture toughness testing with the tested architectures in the middle and the commercially available triaxially braided composite on the outer layers.

Q3D preform with unbraided tows on one end to allow for the application of the film used to create the pre-crack.
For the Q3D structure, the preform is braided in such away that on one end, the bias tows are not braided into the adjacent layers such that the thin film can be inserted to manufacture the pre-crack. The volume fractions of the laminates are 59.6%, 60.3%, and 59.8% for the UD, 2DW, and Q3D architectures, respectively. These values are obtained by initially weighing the dry fiber preform before resin introduction, and dividing that mass by the mass measured after the laminate is cured. The weight of the polyamide film is taken to account in this measurement. Because the density of these materials are known, this mass fraction can be converted into a volume fraction. These values are confirmed by sulfuric acid digestion following the ASTM standard D3171-15. 16
Mode I experiment
The Mode I experiments follow the testing basis given by ASTM standard D5528.
17
In this study, loading blocks are used on the end of the specimen with wires linking the loading blocks and the machine grips instead of pins as the standard suggests. This is to ensure that there is no interaction between the specimen and the machine grips that would alter the results. The side of the specimen is painted white, and markings are made every 5 mm with the first 20 mm being marked every 1 mm. This is so that the initial crack propagation can be better visualized because the initial fracture toughness, GIC, is defined by the first 1 mm of crack growth. An example of a specimen during the test is shown in Figure 4. A camera records the experiment by acquiring images at a rate of 1
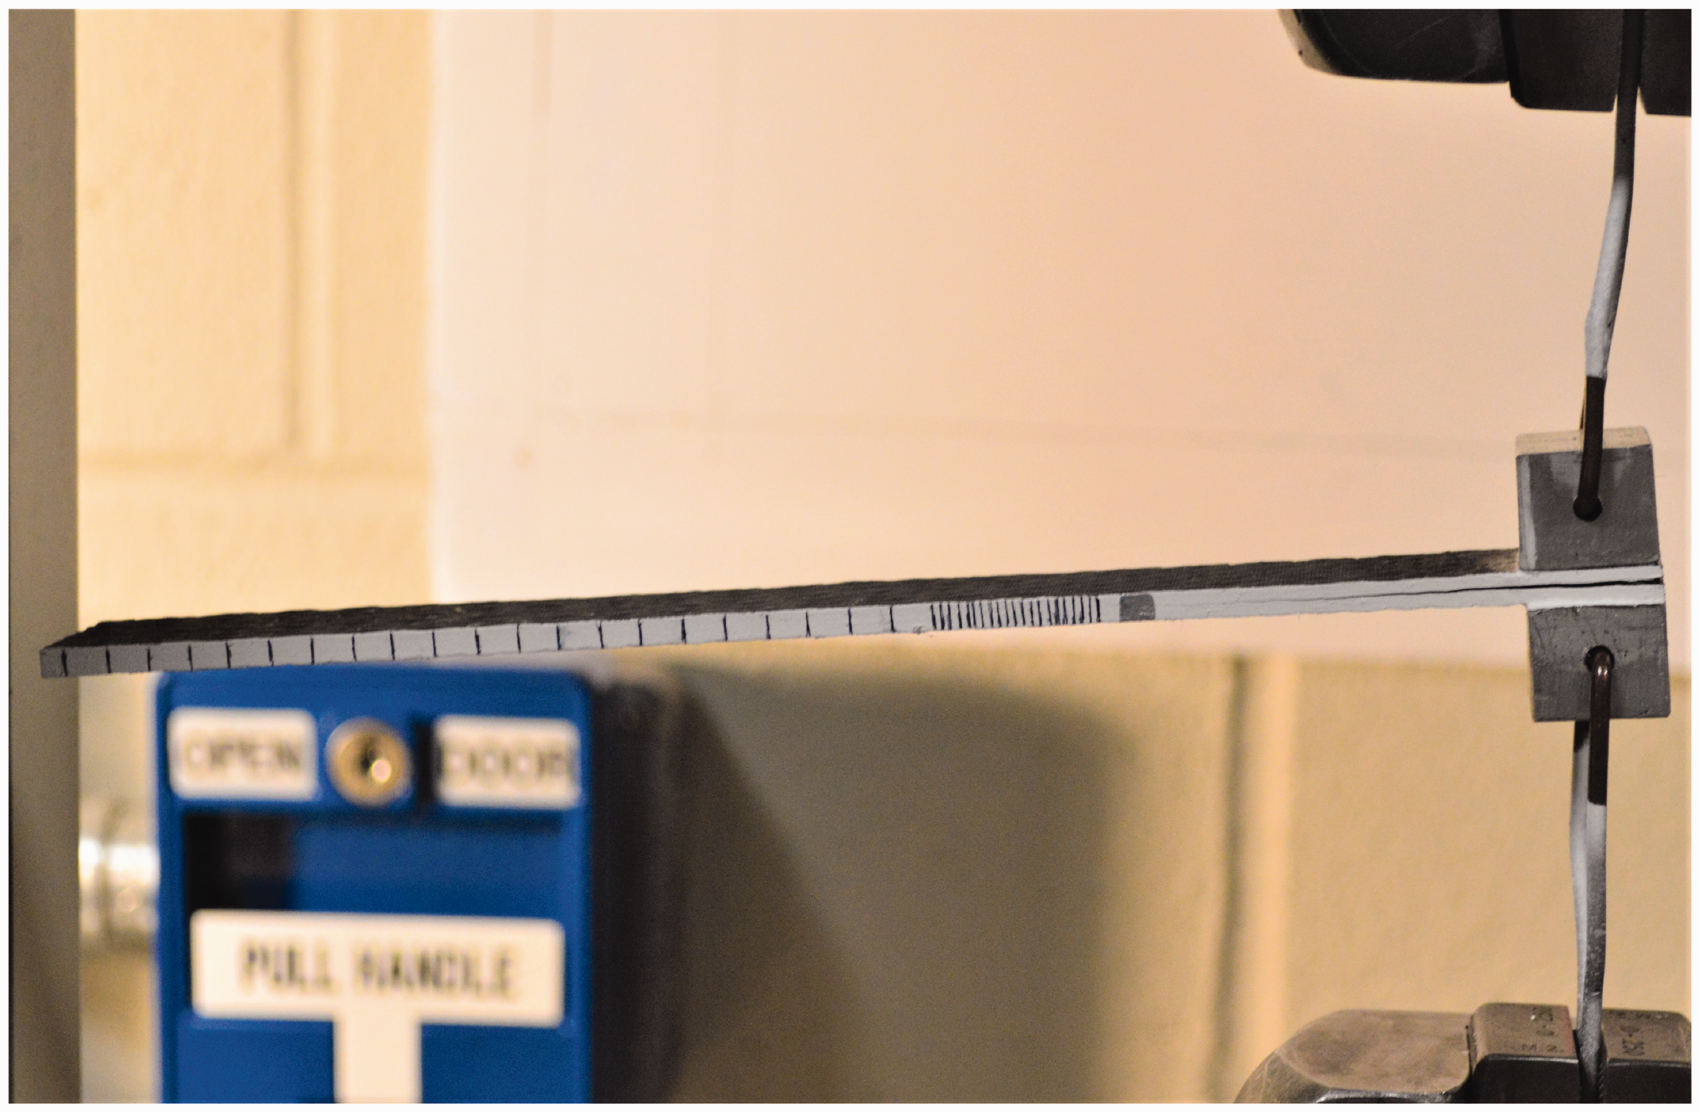
Mode I specimen at beginning of test showing the wires for loading and markings on side on specimen.
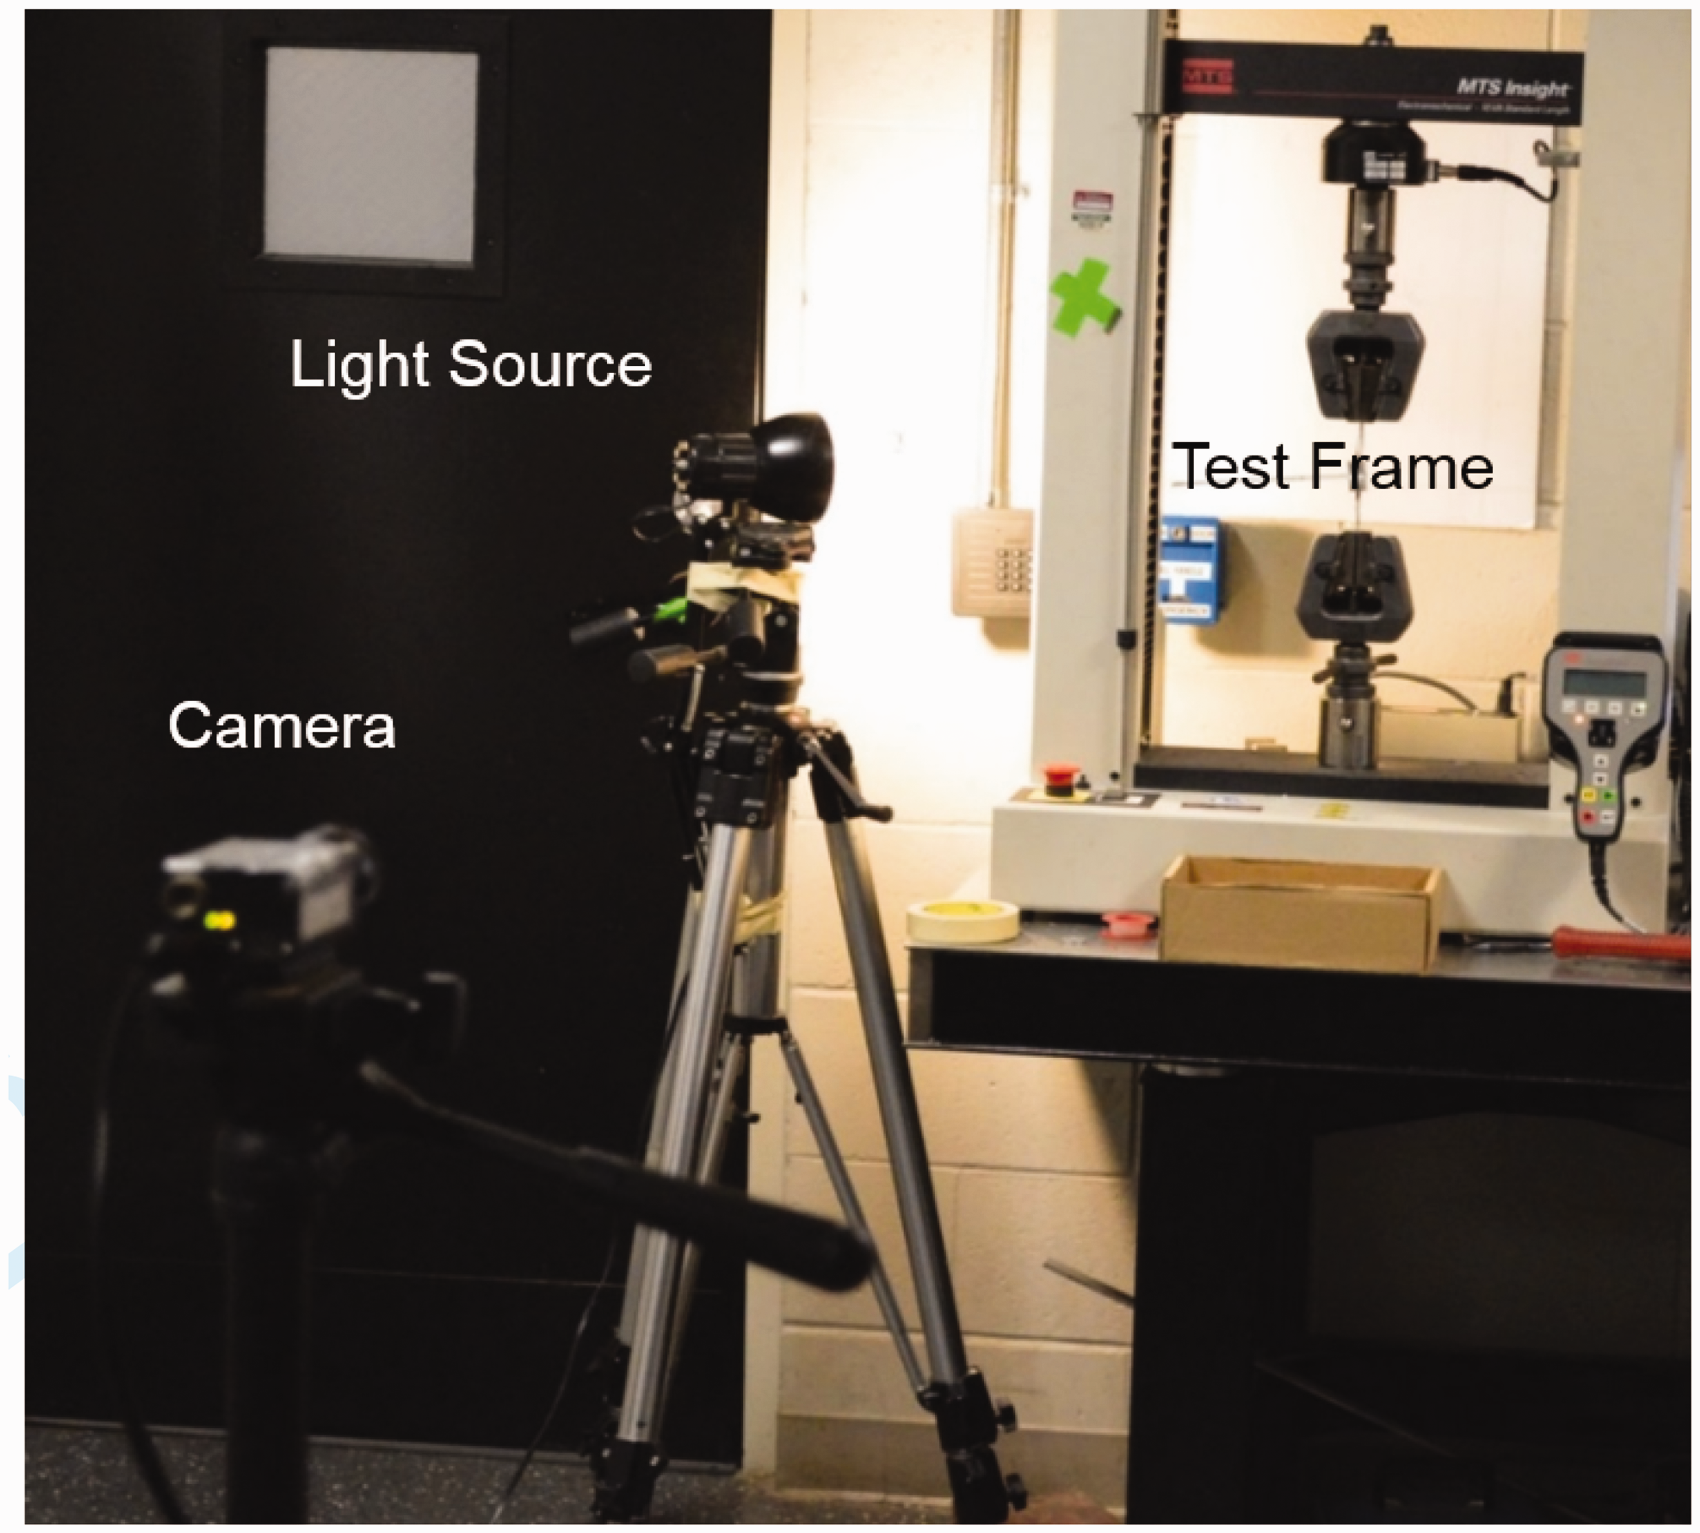
Test setup for Mode I experiment with camera and light source.
Mode I sample dimensions (mm).

Mode II experiment
ENF
The current standard for mode II fracture toughness testing is the end notched flexural (ENF) test outlined in ASTM standard D7905. 18 As with the mode I samples, the sides are painted white such that the crack and the compliance calibration markings can be seen more easily. This is shown in Figure 6. Crosshead speed during the test is 0.5 mm/min.
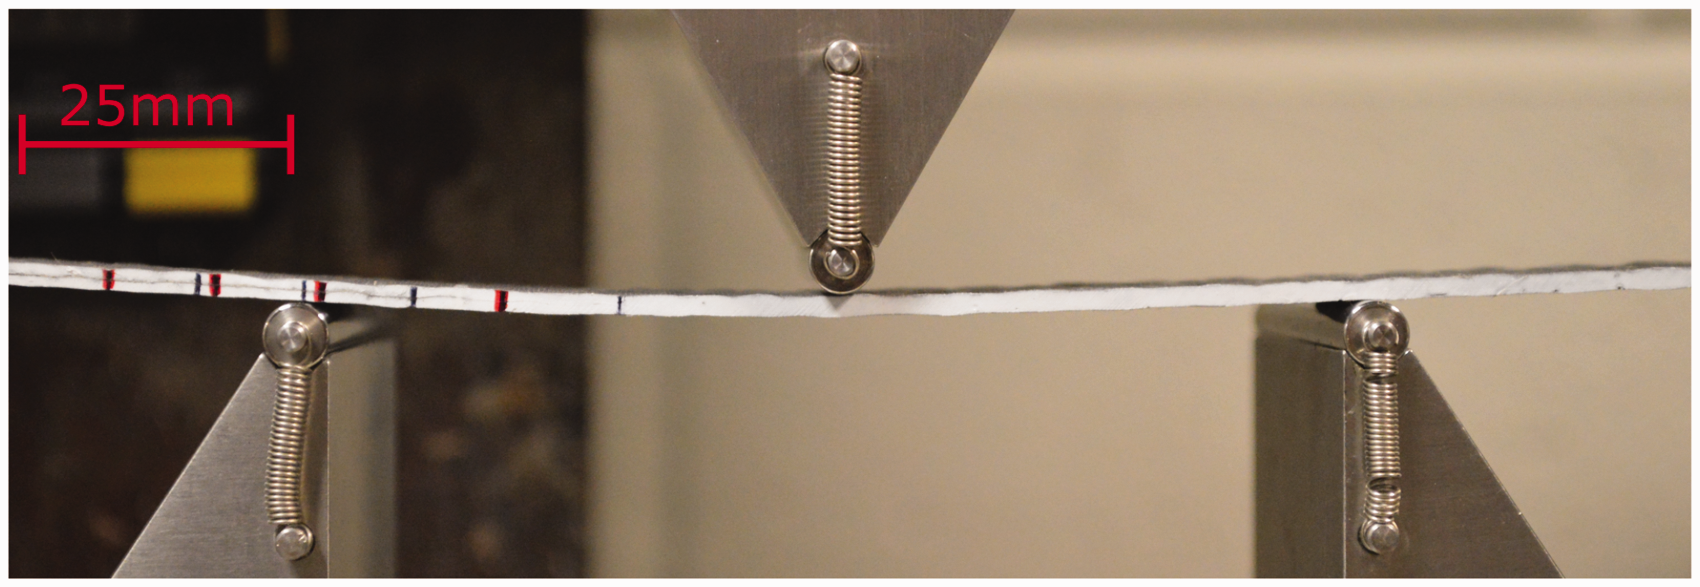
ENF specimen during test.
Compliance calibration is done at 3 initial crack lengths of 20 mm, 30 mm, and 40 mm. For the 20 mm and 40 mm crack lengths, the test is stopped at half of Pcrit, where Pcrit is the load required for crack propagation. For the 30 mm crack length test, the test is run until crack propagation and a significant load drop is achieved. The Pcrit value is determined experimentally for each crack length. Table 2 shows the dimensions of each of the Mode II samples.
Mode II sample dimensions (mm).

4ENF
In ENF tests, the crack propagation is always unstable. Therefore, the measured fracture toughness is for only one crack length. It is both difficult and time consuming to create a R-curve using the ENF test. Another method is needed to generate a R-curve from a single specimen, and multiple tests have been proposed. Of these tests, the 4-point ENF (4ENF) test proves to be the simplest while still providing stable crack growth.19–21 The 4ENF test is conducted in a similar fashion to the ENF test with the exception of it being a 4 point bend instead of a 3 point bend. This gives an area of constant moment between the two loading rollers instead of a moment peak at the single loading point. The precrack starts in this area, and the displacement is continuously increased until the moment is enough to cause crack propagation. Once the crack propagates, the moment drops just below the threshold to continue the crack growth. Very quickly, it rises above the point for crack propagation, and the cycle continues. This creates stable crack growth and allows for multiple crack lengths and loads to be measured such that a R-curve can be generated for a single specimen without the need to load, de-load, and re-load. Depending on the material properties and geometry of the specimen, some extra care may need to be taken to stop the specimen from sliding in a 4ENF test.
For the 4ENF tests conducted in this study, the spans are changed from the previous ENF tests and what is seen in literature.22–24 The geometry of the test is show in Table 3, and the graphical representation of these values is shown in Figure 7. A d/2L value of 0.5 is used to remain consistent with literature,22,23,25–27 and this is the determining factor for the geometry of this test. The loading span is set to 63.5 mm to ensure that two full interlaminar tows beyond the initial crack tip are within the loading span. With the standard d = 50 mm, the second tow is at/beyond the second loading roller, and the influence of the roller is not discernible from the influence of the interlaminar tow. For this reason, the inner span is increased, the outer is also increased to maintain the d/2L ration of 0.5. These testing parameters are summarized in Table 4.
4ENF sample dimensions (mm).

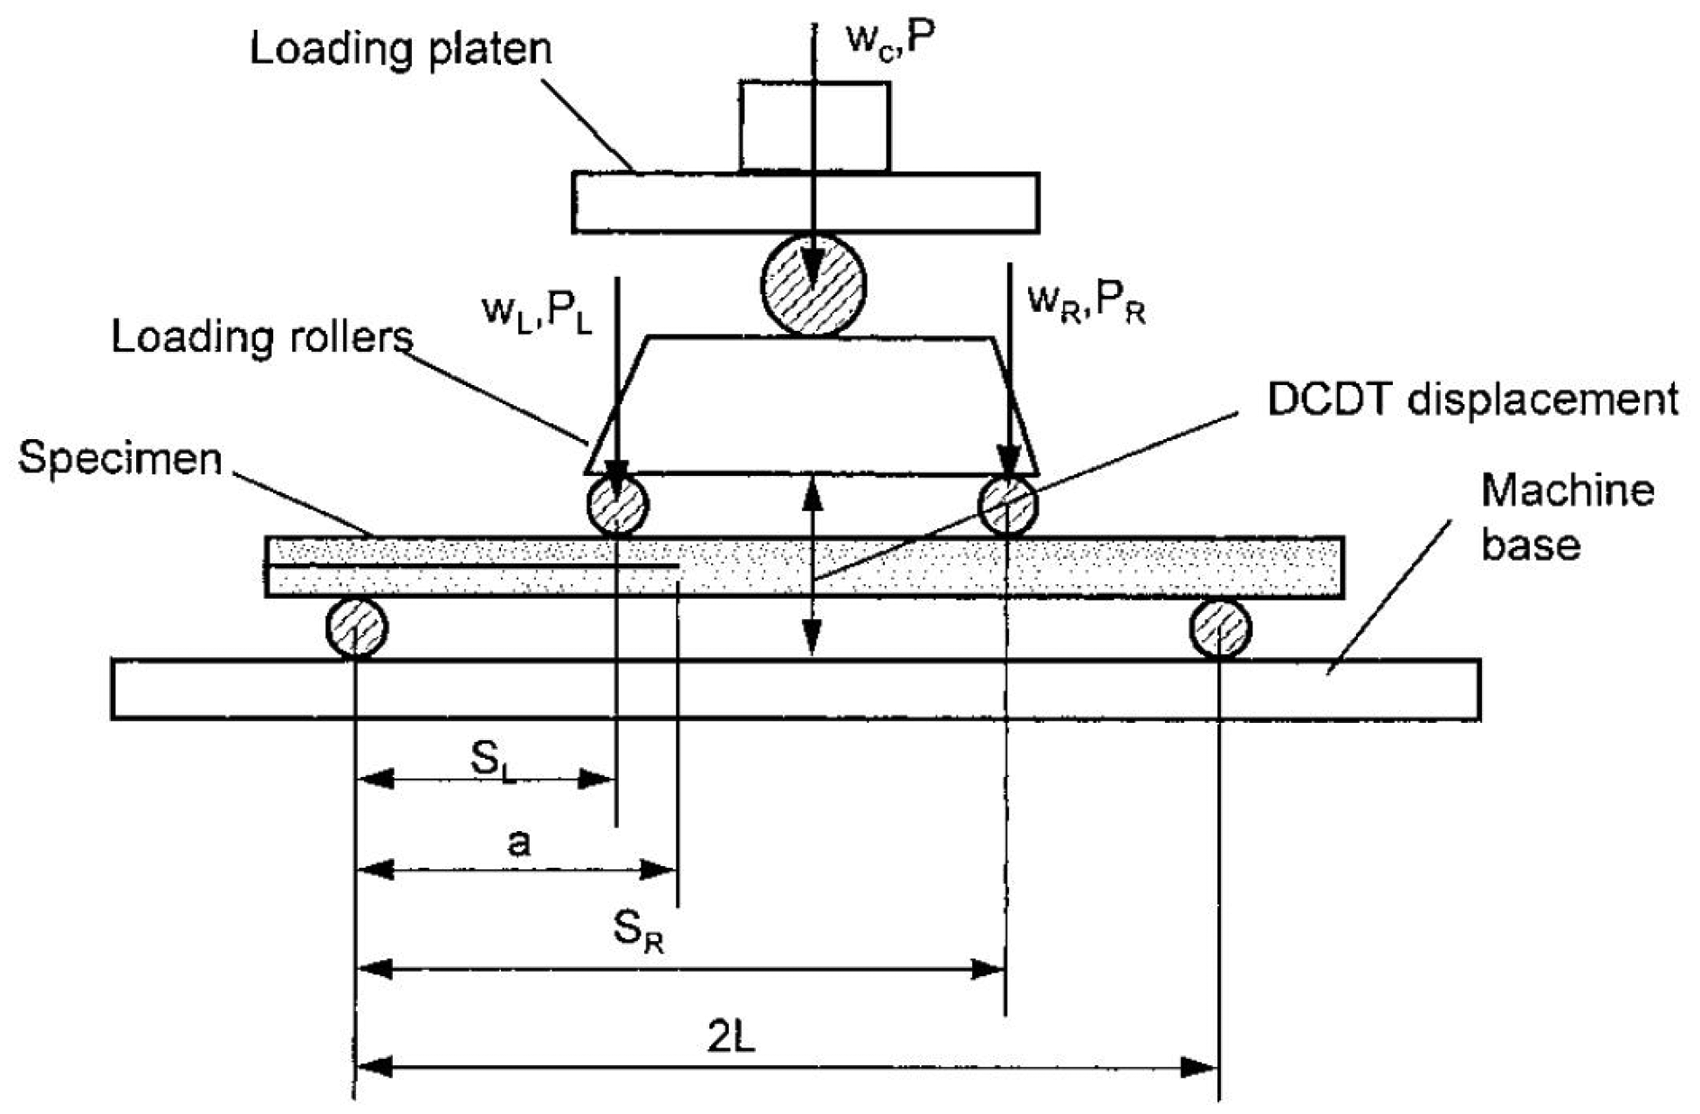
Representation of nomenclature for 4ENF test. 22 Not shown is d, which is the spacing between the loading rollers.
4ENF parameter dimensions (mm).

Results and discussion
Mode I
For mode I, the fracture toughness is calculated as a function of load, extension, crack length, and specimen geometry. In this study, the modified beam theory (MBT) is used to calculate the GI value. The initial fracture toughness value, GIC, is calculated at the point when the crack has propagated by 1 mm, and this is determined by using the images acquired during the test. Equation (1) is used for determining the GI value.

In this equation, F is an inclusion factor that takes into account how the specimen geometry is changing during the test. Equation (2) shows how the inclusion factor is calculated, and Figure 8 shows a representation of the variables used in calculating the GI value. The rotation correction factor, Δ, is determined by performing a linear regression on a plot of the cube root of compliance, 
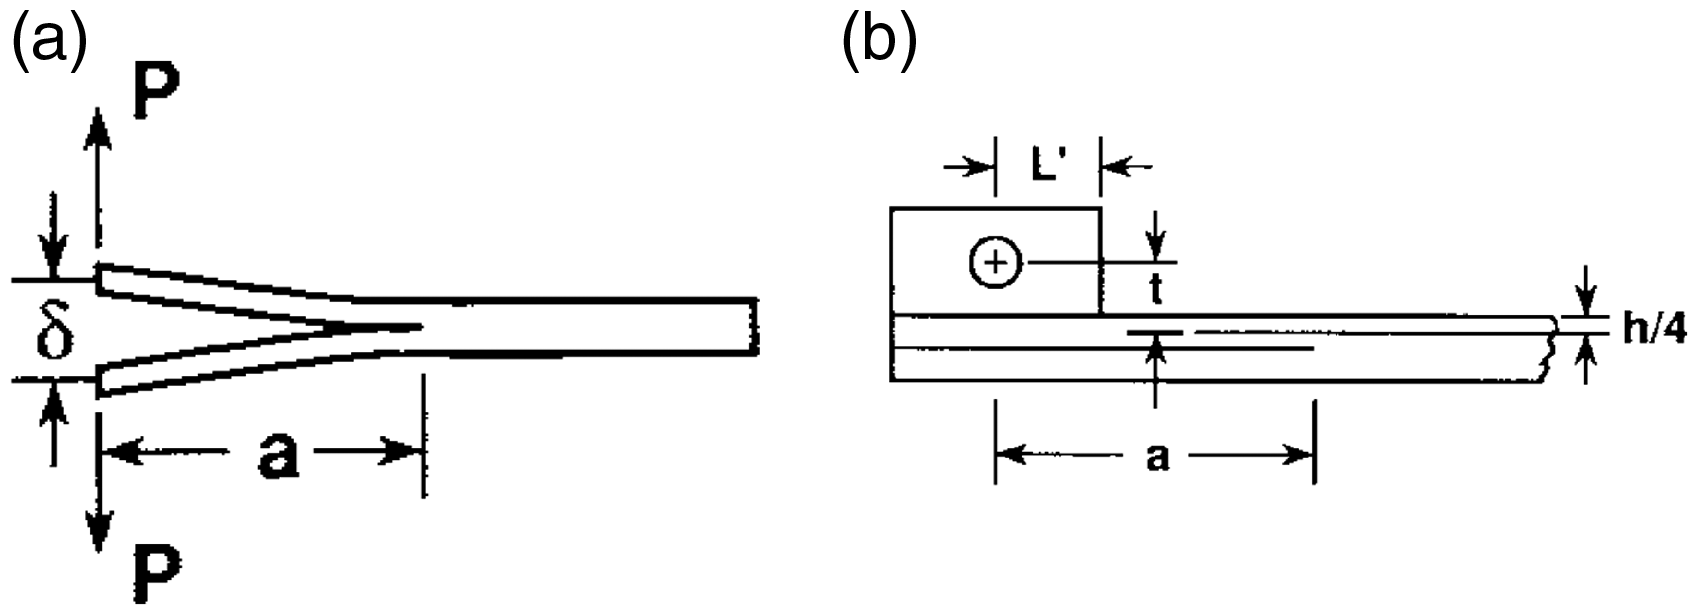
Representation for nomenclature in Mode I fracture toughness calculations from ASTMD5528. 17 (a) Mode I fracture toughness. (b) Inclusion factor, F.
Tables 5 and 6 shows the average mode I values for each architecture and the percentage difference between them. For the Q3D architecture, the GIC and GI values are an effective value because it includes fiber tow failure along with the matrix failure. It can be seen that the Q3D structure has a lower GIC value, but a higher GI value. This is due to difficulties in creating the pre-crack in the Q3D structure because of the through-thickness tows. The leading edge of the film can wrinkle, and this causes a stress concentration at the crack tip and a lower GIC value. Due to this, it these GIC are not truly representative of Q3D composite. It can be seen by the resistance curves shown in Figure 9 that the GI value increases quickly beyond this initial value.
Mode I averages.

*This is an effective value for Q3D.
Mode I architecture advantages (%).

*This is an effective value for Q3D.
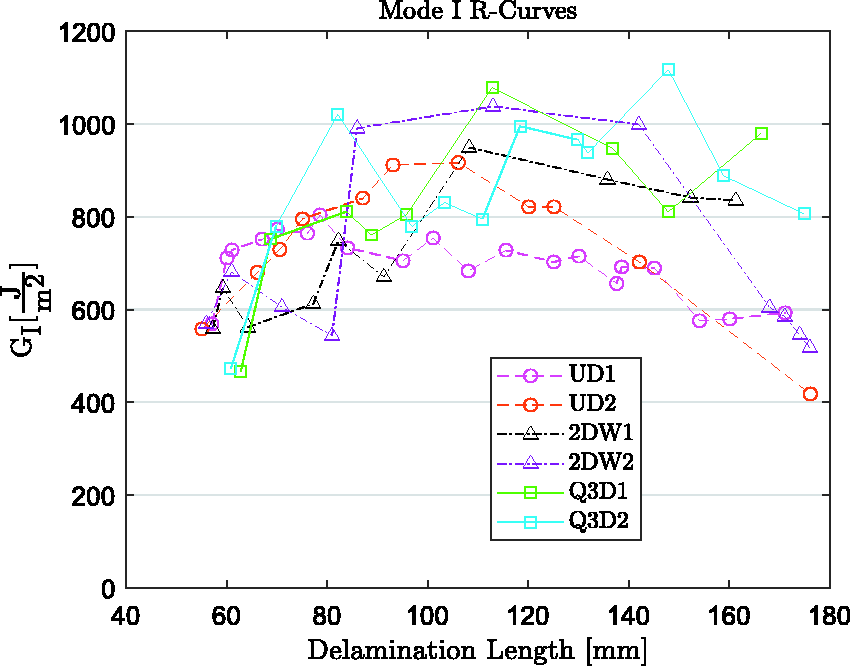
R-Curve comparison for all architectures.
Along with the fracture toughness values, the energy required to fully split the sample is reported. Each sample has the same length from the initial crack tip to the free end, so these energy absorption values can be properly compared. This value gives a better comparison of the delamination resistance of each of the material architectures because the amount of crack propagation and the lower initial values have less of an effect. Looking at a comparison of typical load-displacement curves for each of the architectures in Figure 10, it is seen that it takes more extension for the 2DW to fully split compared to the UD sample. The 2DW will also hold a higher load throughout the experiment, so it would have been expected to have a higher GI value, but this is not the case. This is due to the 2DW having lower fracture toughness values compared to UD initially, but increasing as the crack propagates. The crack also propagates in a stick-slip fashion for the 2DW causing it to have fewer GI values to report, thus lowering its average. The same can be said about the Q3D structure with the larger amount of low GI values initially, but few values as the crack propagates and the fracture toughness increases. The energy absorption takes this into account and allows for a better comparison to be made. The Q3D also has a larger increase in energy absorption compared to both the UD and 2DW than it does in fracture toughness.
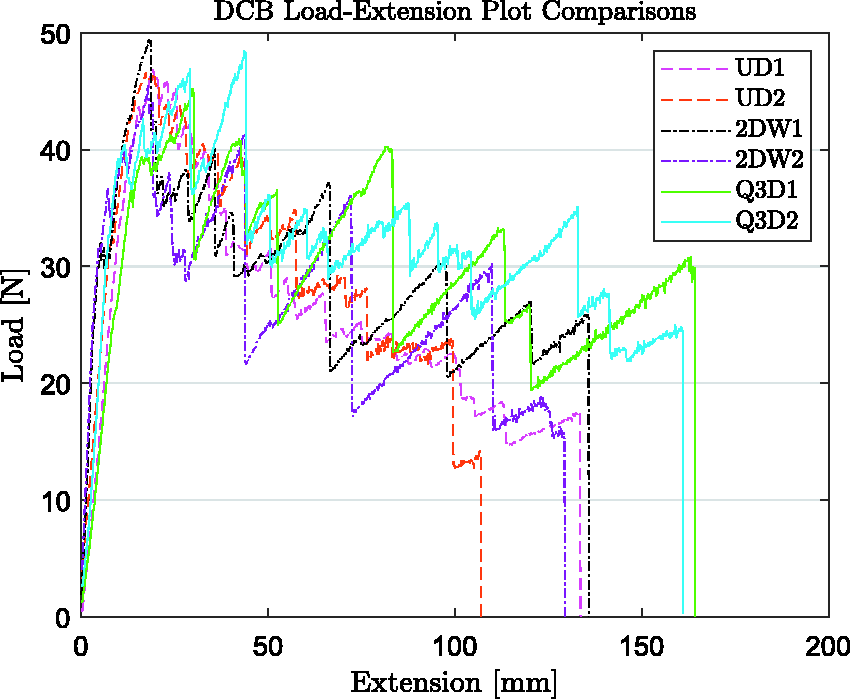
Comparison of load-displacement curves for all architectures.
The Q3D has a more pronounced stick-slip condition compared to the 2DW, and this is due to the interlaminar tows in the Q3D composite bridging the crack interface. The introduction of these tow requires fiber breakage for the crack to propagate, whereas the UD and 2DW simply require matrix failure. These tows support more load and require a larger crosshead extension before failure. Figure 11 shows the interlaminar tow clearly bridging the gap in the middle of a mode I experiment. After failure of this interlaminar tow, the crack will propagate until it reaches the next tow, and crack propagation will cease. At this point, the load will begin to rise again until the next tow fails. The interlaminar tows are spaced out by 26 mm as shown in Figure 12. Looking at the resistance curve for the Q3D architecture, it is seen that fracture toughness values are given for crack lengths spacing approximately 26 mm as well. The points for the resistance curve correspond to the points immediately before crack propagation that correspond to the max load.
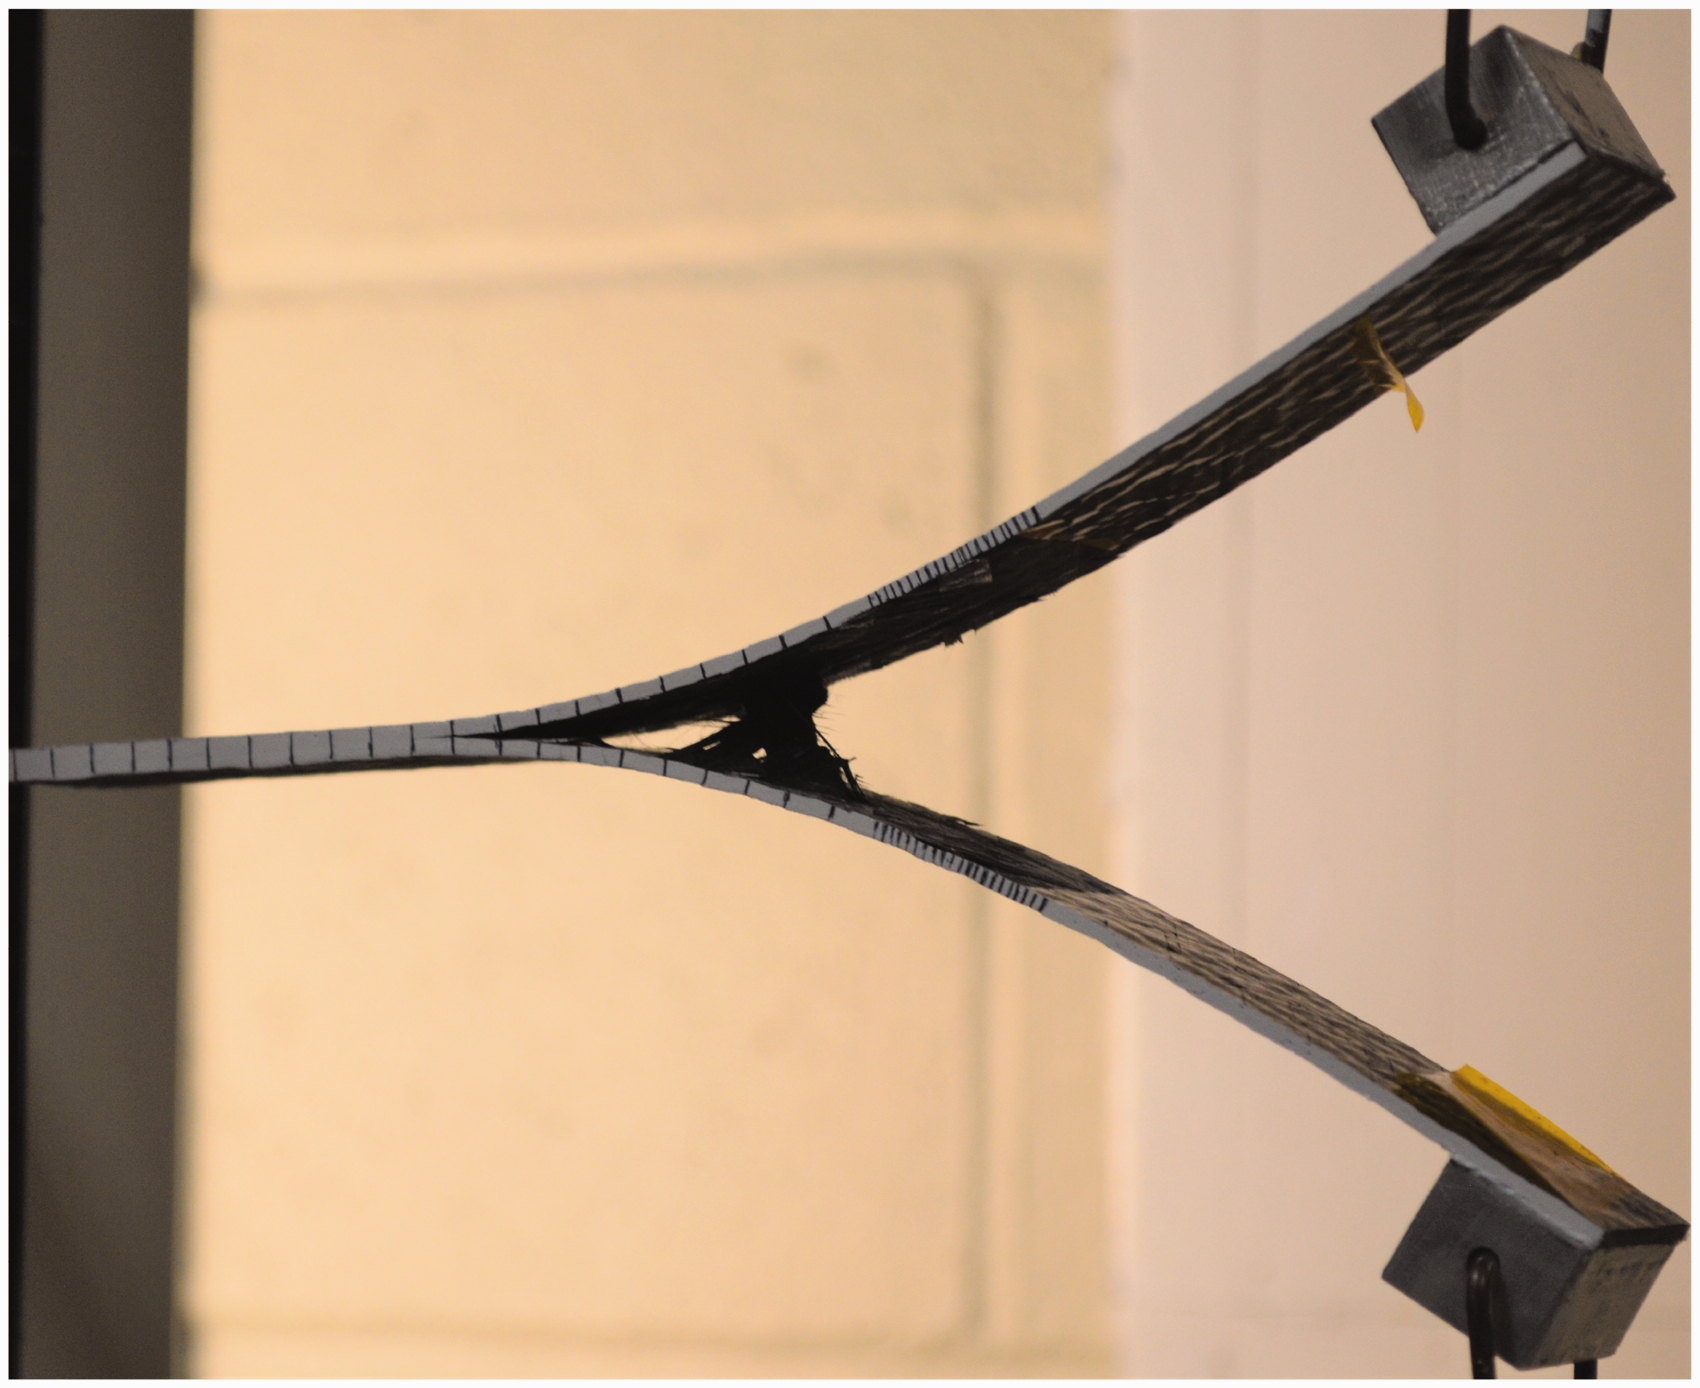
Fiber bridging crack gap of Q3D specimen.

Crack interface of Q3D specimen after DCB test. The 26 mm spacing of the broken interlaminar tows can be seen.
Mode II
ENF
The mode II tests have two different tests conditions: no pre-crack (NPC) and pre-crack (PC). For the NPC condition, the initial delamination for the NPC test is simply the manufactured pre-crack, where the initial delamination for the PC test includes crack propagation beyond this point as shown in Figure 13.
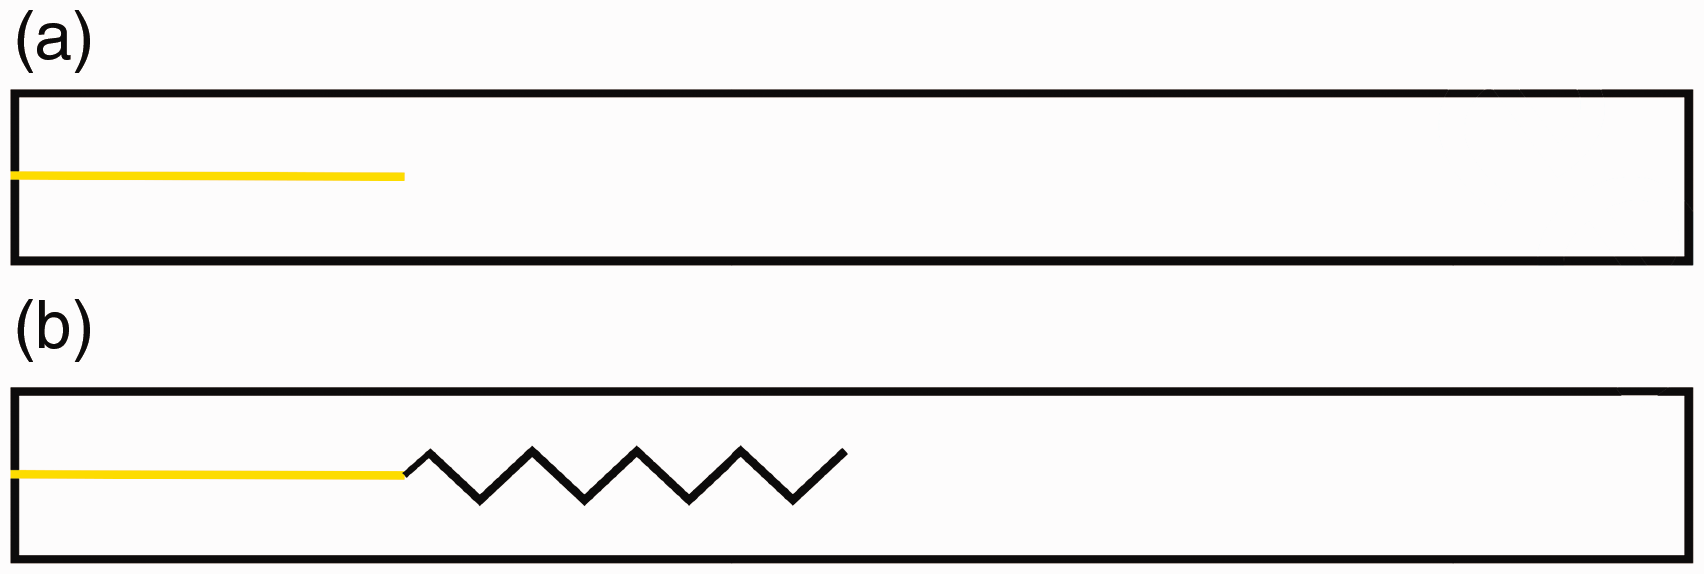
NPC and PC representations. The horizontal yellow line in both images represents the polyamide film used to manufacture the pre-crack. (a) NPC. (b) PC.
The ENF test used for mode II fracture toughness calculation does not give stable crack growth, and thus, only one GII value can be calculated for a single test. Once crack propagation begins, the delamination rapidly expands until it reaches the loading roller. The fracture toughness is calculated as a function of the initial crack length, max load, specimen width, and compliance calibration curve slope as shown in equation (3). The compliance calibration curve slope is obtained by the linear regression of the compliance vs crack length cubed plot. The compliance for a particular crack length is taken from the range of 90 N to the 
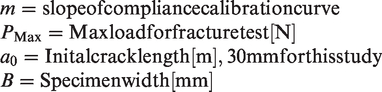
For a pictorial representation of the variables used for calculating GQ, Figure 14 can be referenced. GQ can be considered to be the GII value for the sample only when equation (4) is satisfied. If it is not satisfied, then the test must be redone to obtain a GII value.
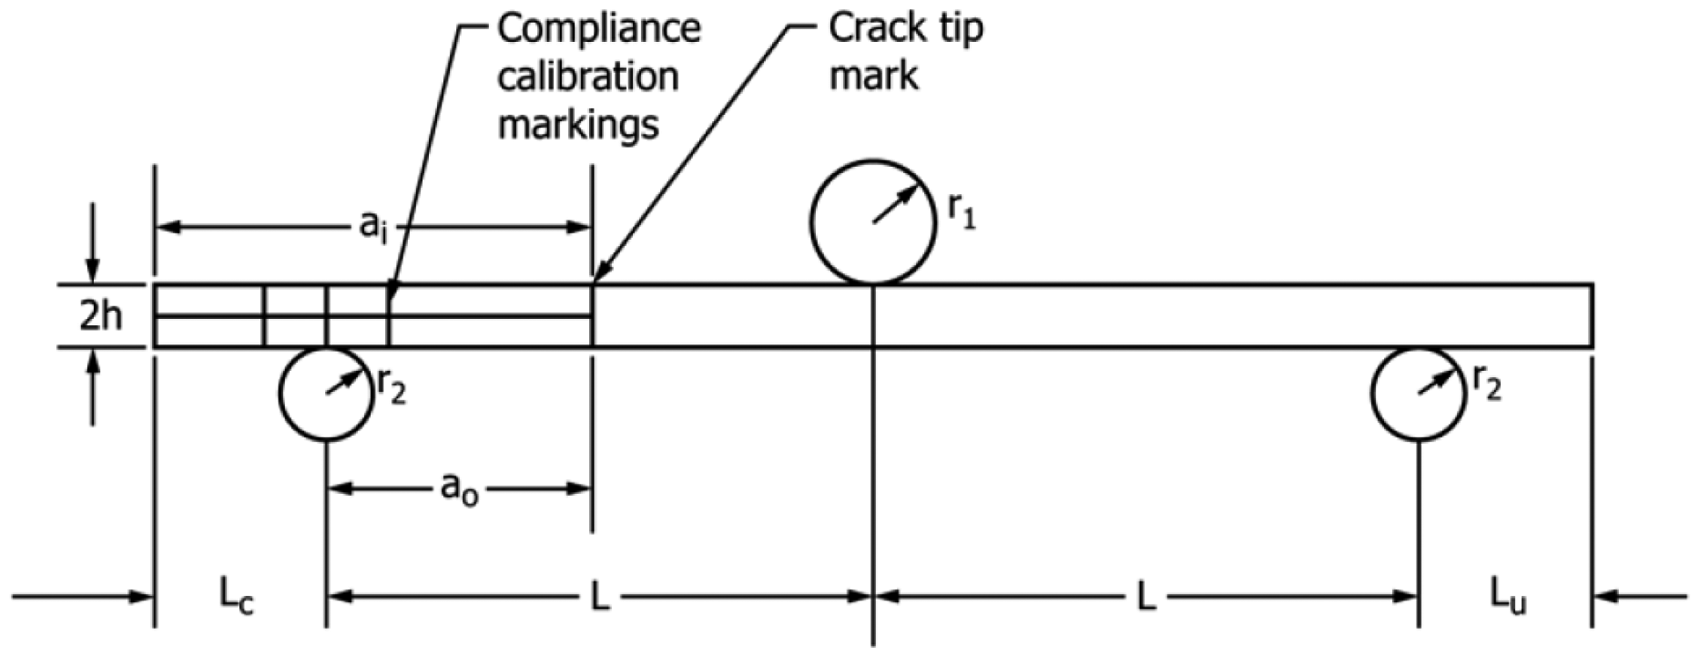
Representation of nomenclature for ENF test from ASTMD7905. 18
Pi and ai in this equation are the
As with the mode I tests, Q3D has a higher fracture toughness after initial crack propagation, but a lower value when the crack tip is manufactured from the film. The Q3D sees a higher increase in GII versus that 2DW and UD compared to the increase in GI. The Q3D architecture shows nearly a 47% increase in mode II fracture toughness compared to the UD and an 18% over the 2DW architecture. The GII values and percent difference are shown in Tables 7 and 8, respectively.
Mode II averages

Mode II architecture advantages (%).

Similar to the mode I DCB test, the load-displacement plots for the PC mode II tests in Figure 15 show that the Q3D architecture requires a larger load and extension before crack propagation. The PC plots are shown because they give a better representation of the effect that the Q3D architecture has on fracture toughness. The NPC test does not initially engage the interlaminar tow that increases the fracture toughness for the Q3D composite, and as with the mode I test, the issue with manufacturing the pre-crack for the Q3D structure also gives unrepresentative results. The larger load and extension required for Q3D shows that in mode II testing, the Q3D architecture will have a larger energy absorption than UD or 2DW.
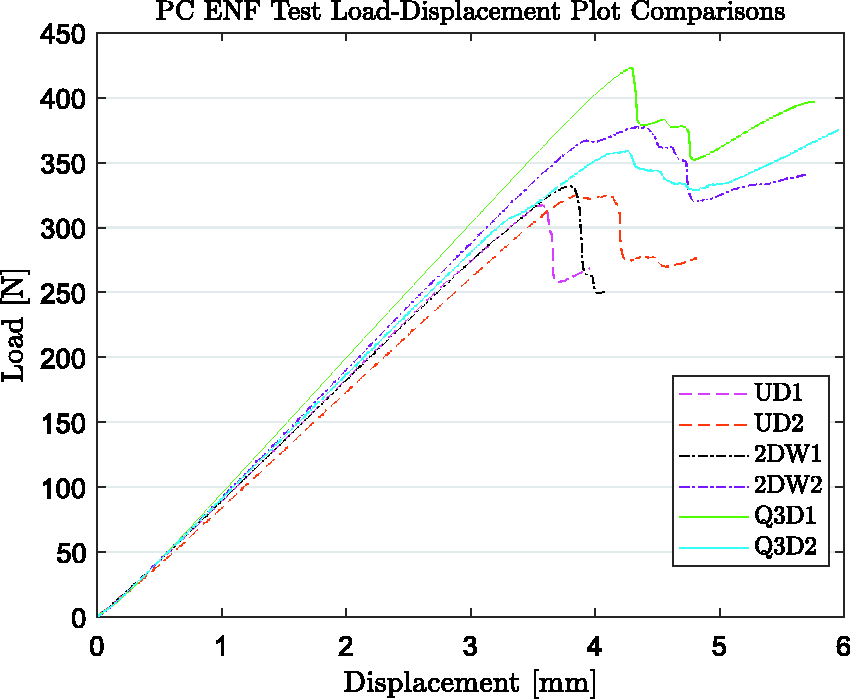
ENF test load-displacement curve comparisons for three different architectures during the PC test.
4ENF
In the 4ENF tests, there is no need to perform PC and NPC tests. This is because there is continuous crack propagation throughout the 4ENF test, so only the initial crack propagation is considered NPC, and the rest is considered PC. For this study, the initial crack propagation is ignored because the steady-state crack resistance is desired. As seen in the mode I and mode II tests, the Q3D architecture shows its advantage beyond initial crack propagation, and this is where the comparison will be drawn.
The values for fracture toughness through the 4ENF test are found in a similar manner to the ENF test. Similar to the ENF test, the compliance calibration is also used, and these measurements are taken at crack length of 25 mm and 45 mm to keep with the ±10mm from the ENF test. The main difference, however, comes from the equation used to calculate the fracture toughness. For ENF, the 
Table 9 shows the average values obtained in the initial and steady-state crack growth regimes of the R-curves. In the steady state regime, these values are about 20% smaller than what is obtained through ENF. This is contradictory to what is observed by Martin. 22 However, Martin mentioned that the specimens were tested a year later, and moisture absorption could cause an increase in the perceived toughness of the composite. A different span is used in the ENF and 4ENF tests in this study, and that could have an effect as well.
4ENF mode II averages

Figure 16 shows a comparison of representative curves from the UD and Q3D 4ENF specimens. This shows that the Q3D maintains a higher peak load, and it does not have that immediate drop. This would require more energy to achieve the same deflection and damage in the Q3D specimen as is seen in the UD specimen. This observation also agrees with the work done comparing Q3D and UD in out-of-plane impact tests. Liu, Rosario, Klann, and Zhou found that a Q3D structure has lower energy absorption and lower deflection than a UD sample, but it also has a much smaller damage area, leading to a higher specific energy absorption.12–14 Coppens and Liu also found that a larger amount of energy is required to fully perforate a Q3D laminate compared to a UD laminate. 28 The higher fracture toughness for steady-state crack growth along with the higher load sustainability point towards this higher specific energy absorption and larger required energy for perforation found in literature.
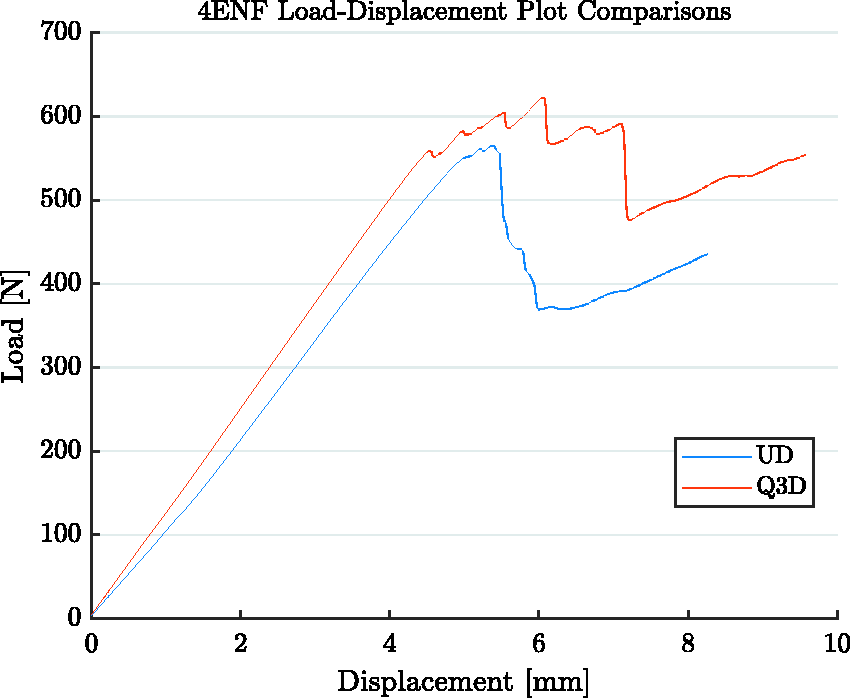
Comparison of representative load-deflection curves from UD and Q3D 4ENF tests.
A similar trend to the mode I R-curves is shown for the mode II R-curves in Figure 17. Initially near the pre-crack, the Q3D has a fracture toughness which is lower than that of the UD. However, beyond 50 mm, the effect of the through thickness tows is shown with a higher fracture toughness. Both the UD and the Q3D show the same downward trend beyond the large crack growth from ∼50–∼65mm. This shows that crack propagation is similar for both the UD and the Q3D between the interlaminar tows, but the interlaminar tows have a significant improvement on the fracture toughness: nearly 45%.
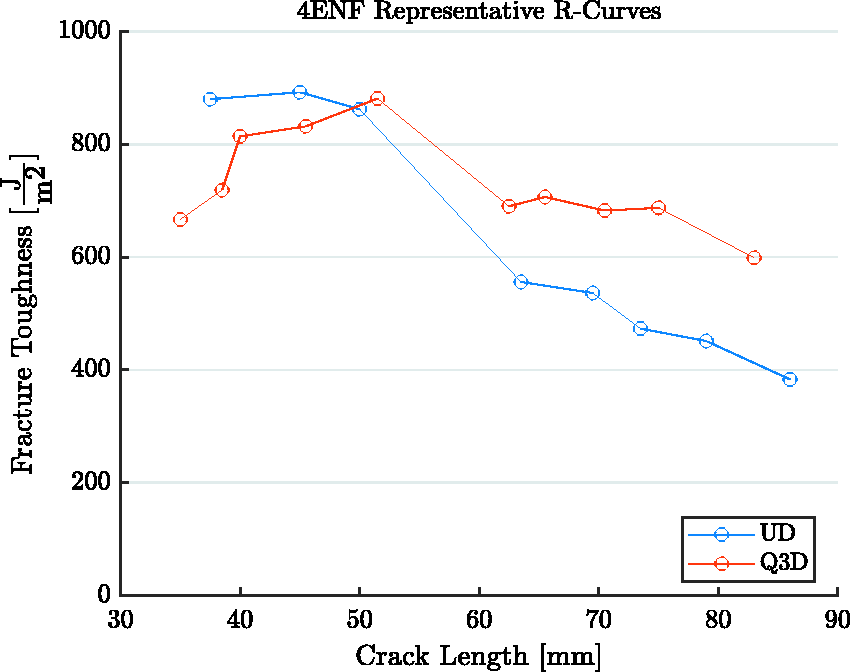
Comparison of representative R-Curves from UD and Q3D specimens.
In the mode I specimens, the higher fracture toughness comes from the interlaminar tows physically bridging the gap and breaking at a higher load. However, this is not the case for mode II. In mode II tests, the interlaminar tow of the Q3D laminate does not break. This is seen post-mortem in Figure 18.
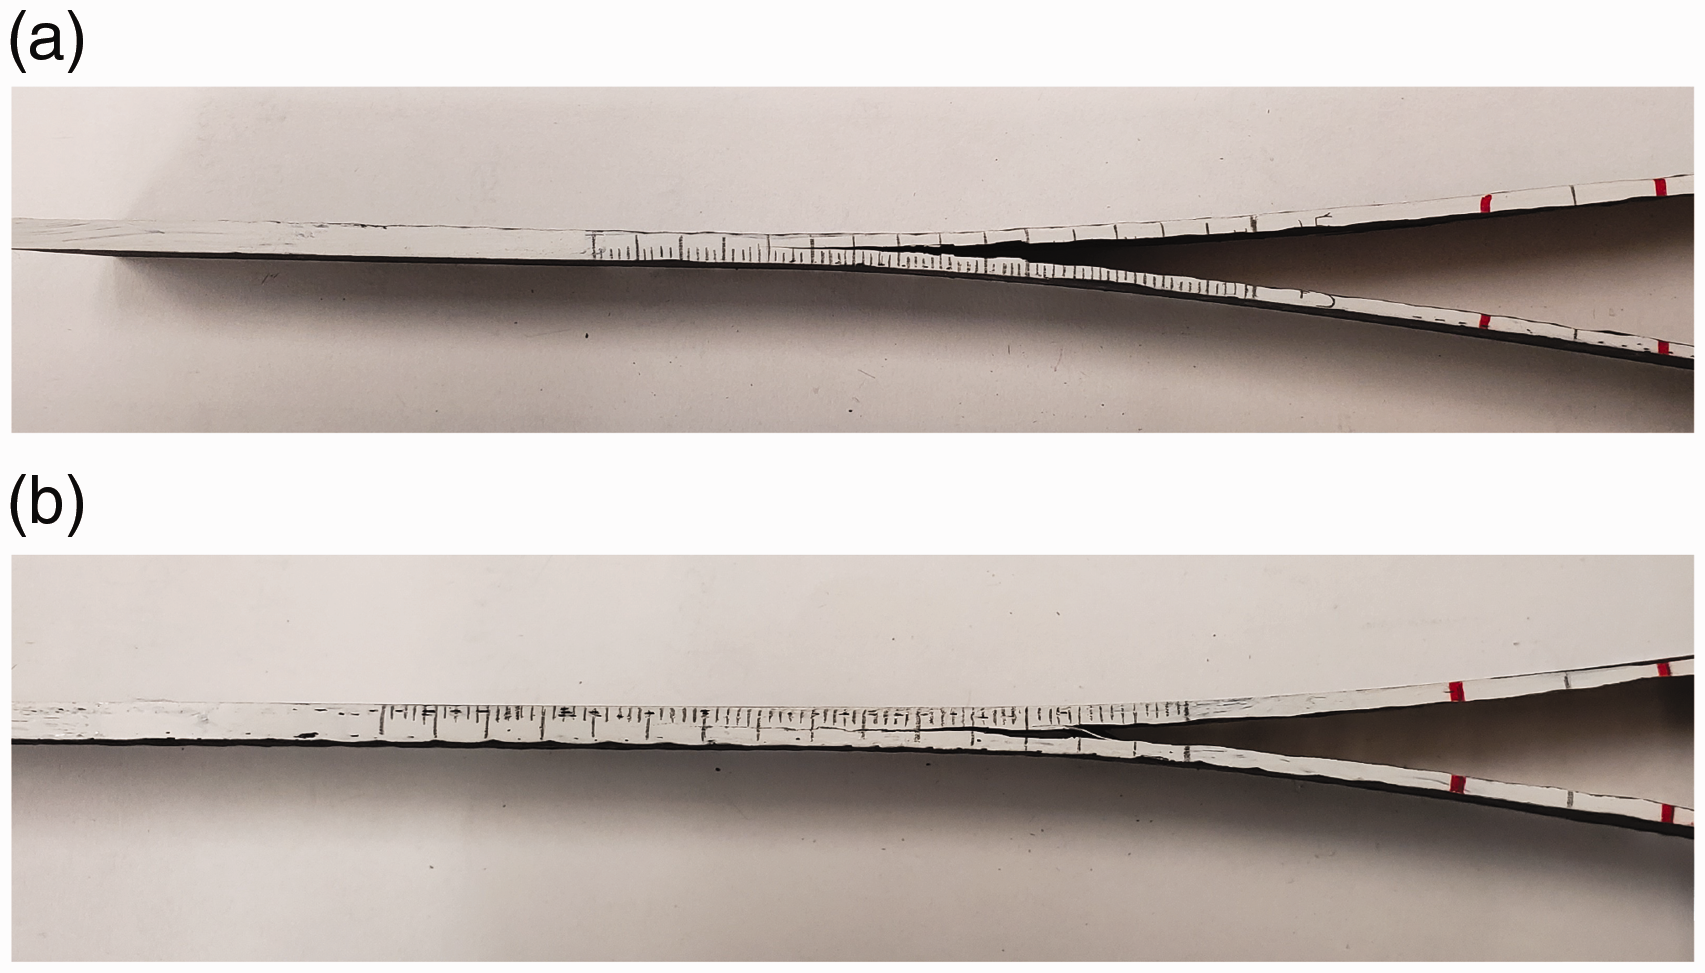
Images showing interlaminar tow still intact after 4ENF testing. (a) UD specimen after 4ENF. (b) Q3D specimen after 4ENF.
In these images, the same crack separation is given at the location of the support during the 4ENF test. The UD specimen shows less resistance to being pulled apart along the length of the crack where the Q3D is being held together by that interlaminar tow. This would mean that for the same crack growth, the Q3D structure will likely have better in-plane properties. This carries significant meaning for this study because this architecture is being investigated for a crash-sensitive component in an automotive vehicle.
Conclusion
Braiding a composite structure with the bias tows spanning multiple layers has shown to improve the interlaminar fracture toughness of laminated composite materials. Under mode I loading, a fracture toughness increase of over 20% is found when compared with UD and a traditionally braided laminate of the same fiber orientation. It has also been found that the Q3D composite requires more energy for the same amount of crack propagation compared to the UD and 2DW in both mode I and mode II testing. Using the energy absorption is found to be a good method to compare the fracture performance of composites because there is no discrimination due to the number of times that the crack propagates during the test. The Q3D architecture also shows an even greater increase in mode II fracture toughness with 47.3% and 18.4% increase over UD and 2DW composites, respectively when looking at the PC condition. The 4ENF test was also investigated to determine its effectiveness for producing an R-curve for mode II tests. An R-curve can be generate for mode II fracture toughness because the 4ENF test will give stable crack growth. When comparing the fracture toughness values of the 4ENF test to the ENF tests, the initial fracture toughness is over predicted, but the steady-state fracture toughness is under predicted.
Footnotes
Declaration of Conflicting Interests
The author(s) declared no potential conflicts of interest with respect to the research, authorship, and/or publication of this article.
Funding
The author(s) disclosed receipt of the following financial support for the research, authorship, and/or publication of this article: The authors would like to acknowledge the Ford Motor Company for their technical and financial support of this research through the MSU Alliance Project.
