






Abstract
Fabrication of TiO2 nanotubes (NTs) has extensive application properties due to their high corrosion resistant and compatibility with biomedical applications, the synthesis of TiO2 nanotubes over titanium has drawn interest in various fields. The synthesis of TiO2 NTs using novel in-situ step-up voltage conditions in the electrochemical anodization process is recorded in this work. For manufacturing the NTs at 1 hour of anodization, the input potential of 30, 40 and 50 V was selected. With increasing step-up voltage during the anodization process, an improvement in the NTs was observed, favoring corrosion resistance properties. The surface of NTs enhances the structure of the ribs, raising the potential for feedback over time. XRD was used to analyze phase changes, and HR-SEM analyzed surface topography. Impedance tests found that longer NTs improved the corrosion resistance.
Introduction
Materials engineering for biomedical applications is greatly encouraged to explore the biocompatible physical and chemical properties. The toxicity resulting from the direct interaction of blood ions with materials can be eliminated using surface modified materials that control the harmful chemical reaction. Modifying the material to possess a rough or porous surface elevates the material’s adhesion properties and wetting behavior. 1 Sol-gel, hydrothermal, electrospinning, electrochemical, template synthesis, etc., are the different types of fabrication techniques used in surface modification.2,3 Electrochemical anodization is the best among accessible traditional mechanisms for surface modification. 4 The template synthesis found that lesser effective in shape of output, thickness of shells and uniformity of finished components. Final fabricated passivation layer receives the poor mechanical strength and low corrosion resistivity on other synthesis method. 5 Electrospinning had spinning jet instability and post heat treatment for improve the crystallinity of fabricated samples. Hydrothermal process required a long fabrication time for nanotubes. 6 Overcome all there limitation electrochemical anodization is the best owing to simple fabrication technique and feasible method. The geometrical properties of nanotubes (NTs) diameter and length are tunable by changing anodization conditions such as input potential or current (constant voltage path or varying the input), electrolyte composition, and anodization process time. The mechanical, physical and chemical properties are the primary indicators to find a material’s applications.7,8
The NT’s geometry plays an important role in photocatalytic activity, 9 solar cells, 10 cell adhesion11,12 and advances application such as Photonic, 13 Li-ion microbatteries. 14 Increase the surface area of titanium with an extra porous layer or bamboo-type structure (TiO2) demonstrated with ridges 15 by involving the alternating-voltage (fluctuating conditions) 16 has improved the materials mechanical chemical, and physical properties. The surface change in TiO2 nanotubes ridges or extra tube lengths vertically aligned structures enhances surface wettability 17 and corrosion resistances. 16 The growth mechanism of TiO2 nanotubes complex and few theories to explain nanotubes formation have been mathematical described.18–20 The most general theory of field-assisted dissolution or dissolution equilibrium theory suggests that dissolution, directed and escalated by an input electric field, is the core of titanium nanotube preparation. 18 Five stages of initiation of embryo mechanism and deviation and fitting of embryo growths were reported by Xufei Zhu et al. 21 The boundary condition of the vibration model for single-wall carbon nanotubes has been derived. Different applied potentials and various times have been used to analyze the oxide barrier layer. 22 Crystallization improving the material's chemical stability, 23 corrosion resistance, 24 and cell viability25,26 have been demonstrated. Furthermore, the cell viability on titanium based materials has been considered on several aspects such as hydroxyapatite (HAp) deposition, 27 length and diameter of NTs,26,28 etc.
Zhaoxiang Peng and Jiahua Ni have fabricated the TiO2 nanotube under the step-up condition and they found that an increase in voltage profoundly damaged the nanotube structure after the rise in voltage. 17 In this study, damage of nanotube in step-up condition occurs but doesn’t destroy. Arenas et al. successfully fabricate the TiO2 nanotubes with different wt. % of NH4F and step up conditions and achieves the bottle shape nanotubular structures. 29 However, the growth of nanotube on titanium material step-up condition delivers different surface morphologies. Freitas et al. reported that constant voltage and pulsed voltage impact with nanotube surface changes positively impacted nanotube surfaces. The input current flow rate influenced the material; rippled surface absorbed from voltages variation. The TiO2 NTs with different structure morphologies using different step-up voltages and the effect of the anodized step-up process were reported. 30 Another team fabricated the two-layer NTs in three-electrode configurations. 31
With additional stirrer setup, further applied potential, two types of rotation direction, it is reported to obtain different promising surface morphologies. 32 However, the significant growth of NTs was obtained by different input potential, 21 ramp voltage 33 and fluctuation of potential. 34 Though many researchers report synthesizing the nanotube by electrochemical anodization at constant input voltages and ramp voltages, only a few reports are available with the novel in-situ voltage up conditions. However, the surface modified with TiO2 nanotubes are essential for biomedical applications.
Electrochemical fabrication of TiO2 nanotubes with the novel in-situ voltage method was presented in this research work. Fabricated samples were characterized with the high-resolution scanning electron microscope (HR-SEM), X-ray Diffraction (XRD), Raman spectra of TiO2 nanotubes, wetting behavior (contact angle measurement) and corrosion behavior was also analyzed.
Materials and methods
A combination of smooth and rough layers of TiO2 was fabricated using the step-up anodization process. The electrochemical unit consists of a conventional two-electrode setup. The stainless steel 316 L plate serves as a cathode and CP titanium as an anode. The obtained samples were initially polished with a sandpaper grit size of 320, 600, 1000, and 2000 and then chemically etched using 1:4:5 hydrofluoric acid, nitric acid and DI water.35,36 The etching time for all the samples was the 30 s. The anodization process was then carried out in two-stages. The voltage was manually tuned from 0 V to 30 V and was maintained for 30 min. Subsequently, the second anodization process, which was continuous, was done. In this step-up condition, the voltage was maintained at 40 V for 30 min of anodization time. Fabricated samples were washed with distilled water and then dried with air to remove the moisture. The samples thus obtained underwent heat treatment at 550 °C for 1 hour to get the crystallinity.
The figure (Figure 1) represents the anodization conditions. The anodization process are conducted in two-stage of anodization as Figure 1(a) 30 V-30min, 40 V-30min (sample - 1), (b) 30 V-45min, 40 V-15min (sample - 2), (c) 30 V-30min, 50 V-30min (sample - 3)and (d) 30 V-45min, 50 V-15min (sample - 4). All the experiments were carried out at room temperature.
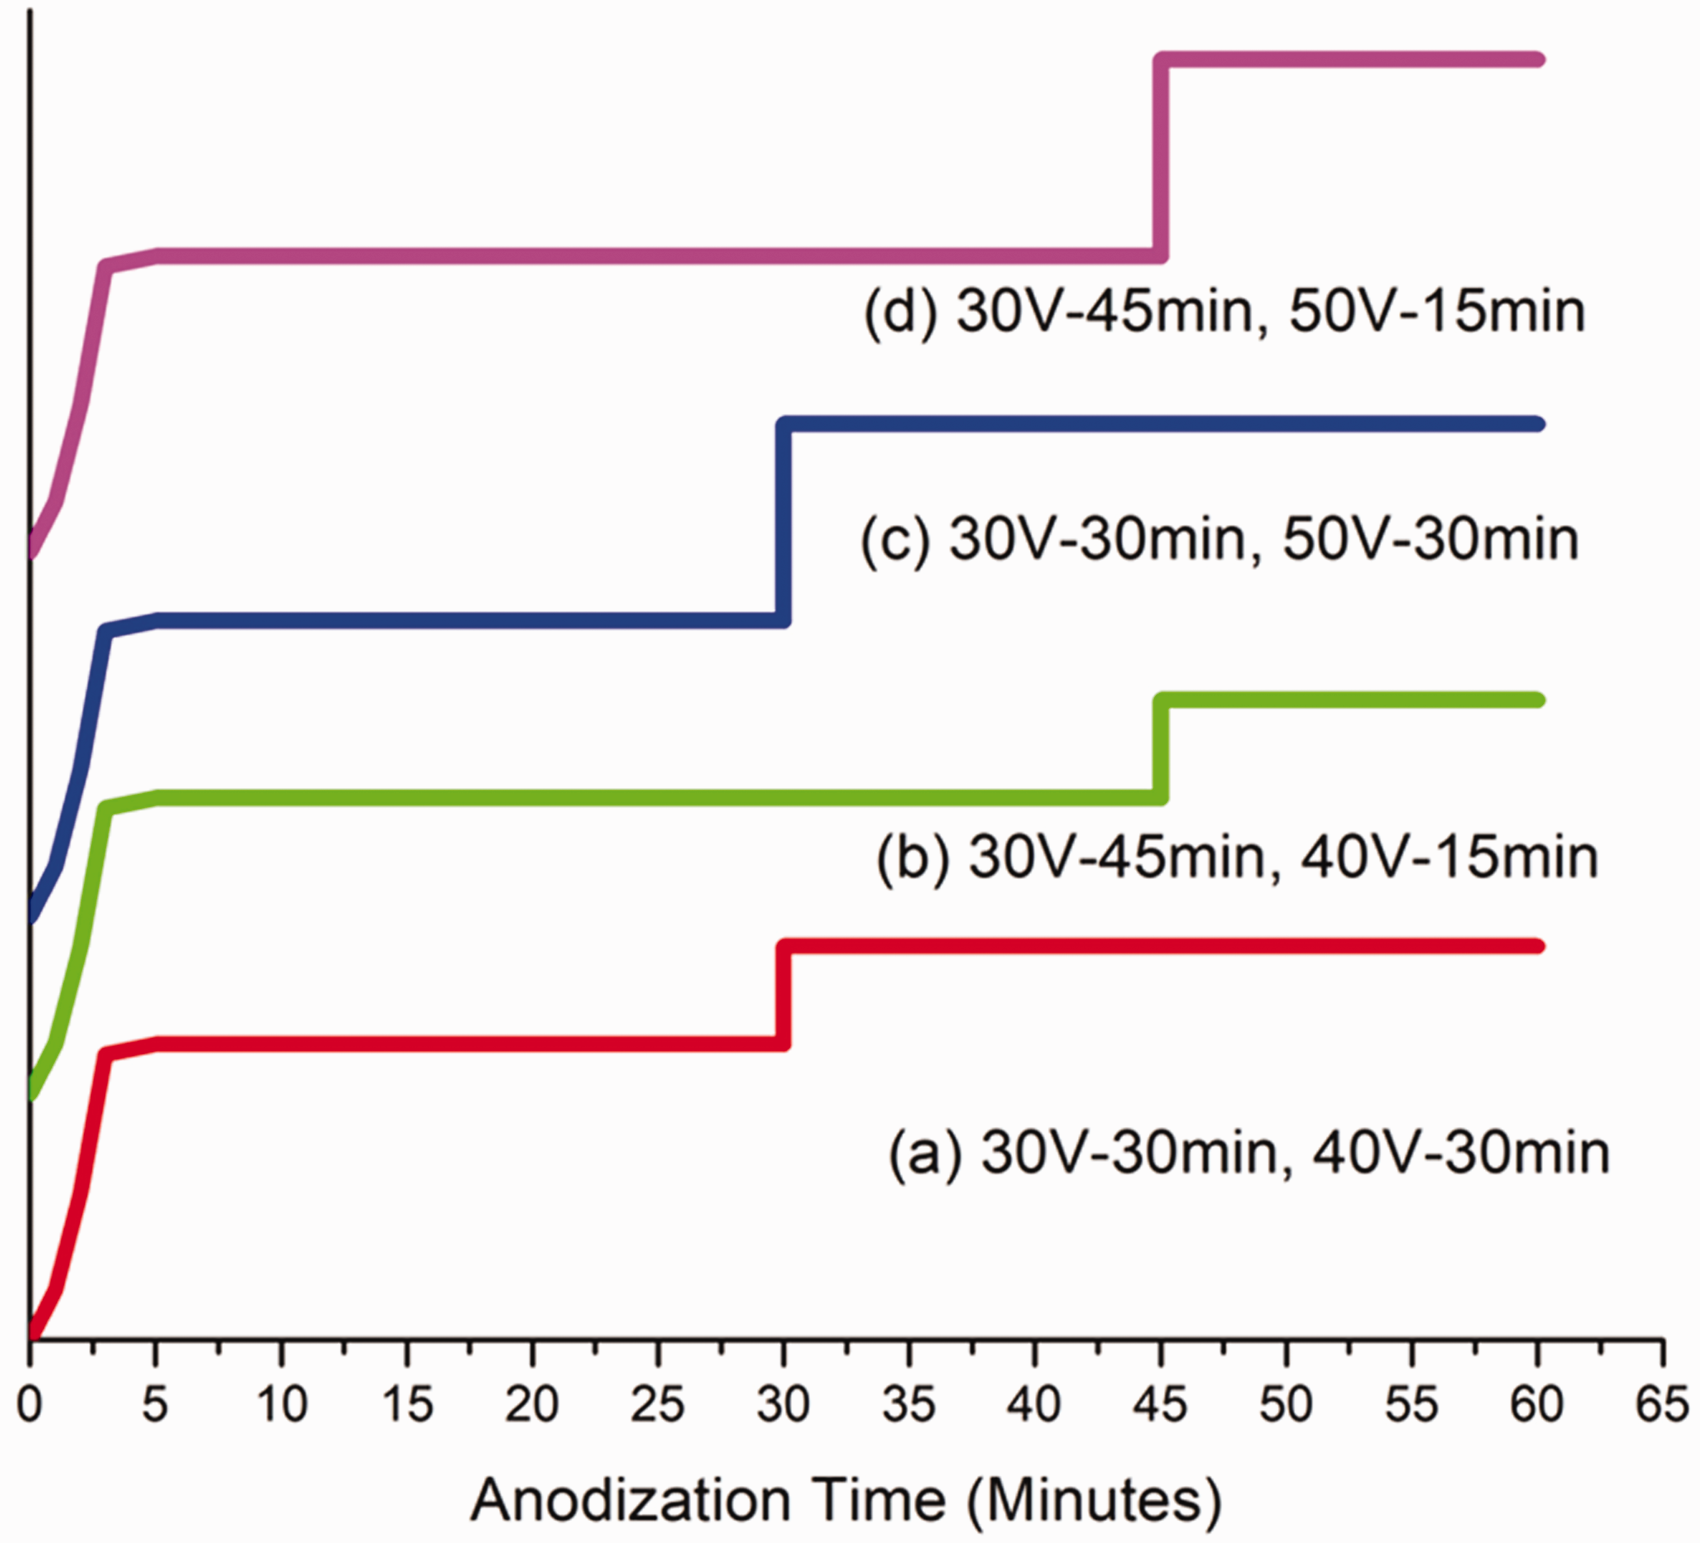
Schematic diagram of anodization condition.
Deposition of the hydroxyapatite layer and the behavior of the material in simulated body conditions were undertaken. For preparing artificially simulated body fluid which is similar to the ions in the human blood, NaCl (8.035 g), NaHCO3 (0.355 g), KCl (0.225 g), K2HPO4.3H2O (0.231 g), MgCl2.6H2O (0.311 g), 1.0 M – HCl (39 ml – if required for maintaining the pH value), CaCl2 (0.292 g) and Na2SO4 (0.072 g) were added in 100 ml DI water with continuous stirring condition. Artificially simulated body fluid was prepared using the method reported in ref. 37
Results and discussion
Surface morphological results
The high-resolution scanning electron microscope (HR-SEM, Hitachi S-400) was utilized to observe the nanotube's surface morphology. Figure 2(a) to (d) shows the surface micrograph of TiO2 nanotube fabricated on titanium plate by electrochemical anodization in the fluoride at stepped-up input potential voltages of different levels. Figure 2(a) shows the step-up condition of 30 V and 40 V each for 30 minutes of anodic anodization. Here, the morphology indicates that the initial anodization condition makes a minor rib structure on the nanotube’s surface.

Anodized TiO2 nanotubes under step-up condition (a) 30 V-30min, 40 V-30min (sample-1), (b) 30 V-45min, 40 V-15min (sample-2), (c) 30 V-30min, 50 V-30min (sample-3) and (d) 30 V-45min, 50 V-15min (sample-4).
With the increase in input potential, the rib structure starts to form in the NTs, as indicated by the arrow. Two surface morphologies are obtained using a single process: smooth surface in the first stage (bottom) and rough (Rib structure nanotube) in the second stage. The length of the nanotubes obtained was about 1 µm. During the second stage at 40 V, the ribs form sequentially. Initial input conditions favor the formation of rib structure over the nanotubes. Increased input potential condition helps in continuous formation due to increased charge transport rate in the second stage. Figure 2(b) shows the HR-SEM image of sample with initial voltage as 30 V for 45 minutes and second input potential as 40 V for 15 minutes. Increasing the input potential increases dissolution and the nanotubes form at different rib structures. An increase in the rib’s breadth is noticed while the length is 1.5 µm (approx.). However, the nanotube tip shows damage due to the rise in the input potential dissolution reaction. Figure 2(c) refers to a sample with 30 V for 30 minutes and then 50 V for another 30 minutes.
Normal anodization of 30 V shows growth with a smooth morphology while increasing the voltage to 50 V, and the nanotubes start to damage. Thus, nanotubes get damaged during the second part of anodization, but nanotubes' length increased to 2.5 µm (approx.). Figure 2(d) represents the anodization of 30 V for 45 minutes and 15 minutes for 50 V input potential voltages. Here, the length of the nanotube obtained was about 1.5 µm. Compared to Figure 2(b) and (c), nanotube end crack significantly reduces. These results of different morphologies are matched with the previous reports15,18 from the surface morphological effects. We find that an increase in input potential after 30 minutes of anodization leads to crack or nanotubes damage. The 50 V increased sample results deliver that crack and damage in the extension.
XRD analysis
X-ray diffraction studies were done using Riganku set up Cu-K∝ radiation (λ = 1.5418°A) at a scanning rate of 0.1 step size for a range of 20°-90° (2θ), 40 kV of tube voltage and 20 mA of electric current were maintained for structural analysis. Further, the effect of annealing temperature on phase transition was analyzed.
Figure 3 gives the XRD phase analysis of pristine TiO2 nanotubes fabricated under step-up conditions. The major TiO2 nanotubes peaks (JCPDS file: 89-4921) indexed at 25.5°, 38.5°, 40.2°, 48.2°, 53.1°, 62.5°, 70.9° are shown in Figure 3.38,39 The anatase and rutile phases of XRD JCPDS cards were identified files: Anatase: 21–1272; Rutile: 21–1276; and Brookite: 29–136038. Increase the intensity of the peak at 25.5° peak post-heat treatment shows an increase in crystallinity as also observed from the presence of ((101), (200)) peaks. It is noticed that brookite peaks form after annealing temperature of 450 °C for 1 hour and is similar to that annealed at 500 °C. However, the peak intensity increases after annealing at 550 °C.35,39,40
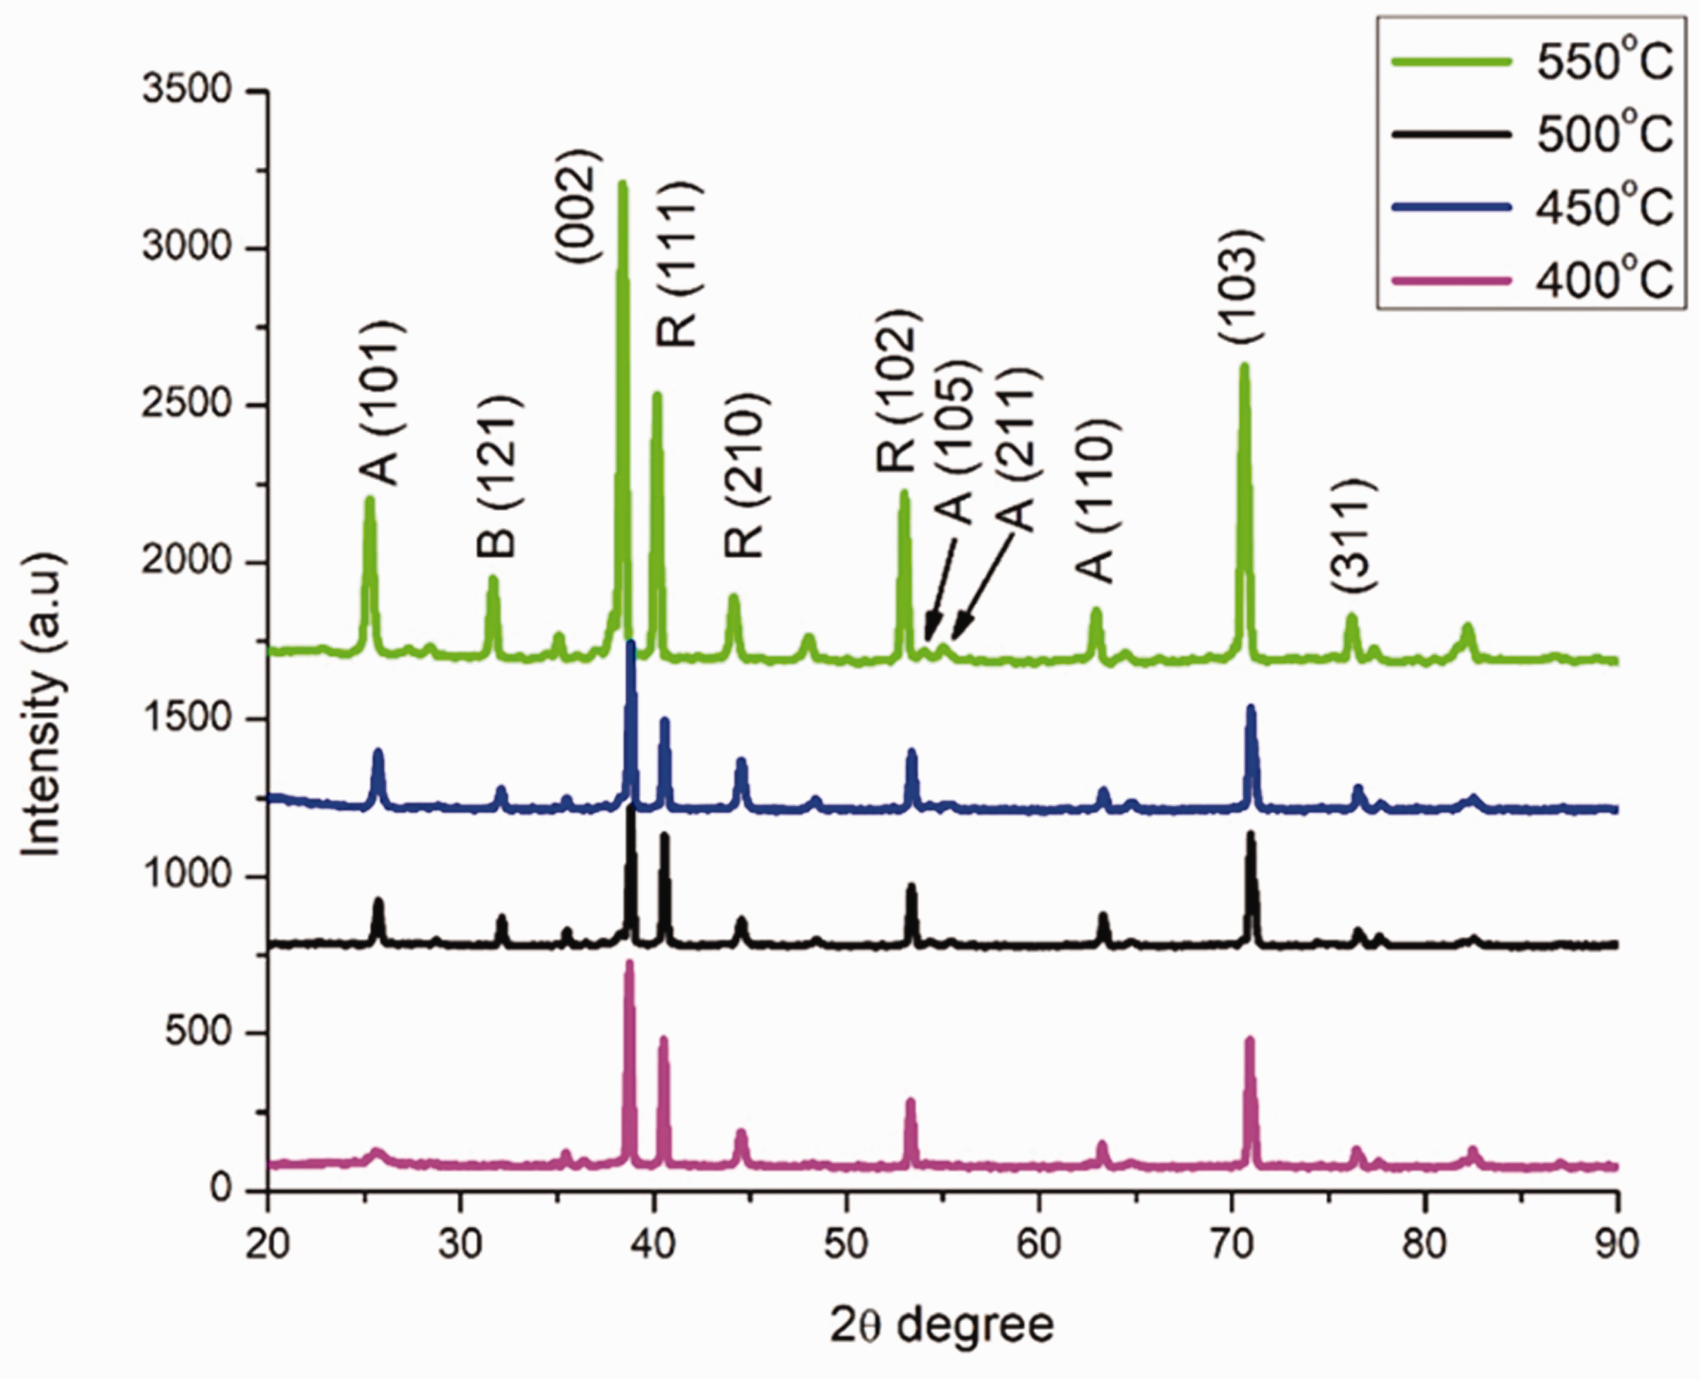
XRD patters of TiO2 nanotubes obtained by different annealing condition.
Raman shift analysis
The crystallographic phases of TiO2 nanotubes were analyzed by Raman spectroscopy (BRUKER RFS 27, resolution of 2 cm-1). Here, TiO2 nanotube crystallinity is indicated with four vigorous peaks found at 146, 396, 514, 636 cm-1 refer Figure 4.41,42 The inset in Figure 4 shows a detailed view of the region of interest, revealing anatase and rutile phases. The initial form of anatase was formed in 146 cm-1, followed by a 396 anatase phase of (A) B1g, another anatase phase of 514 cm-1 (A) A1g-B1g and (A) E1g anatase phases as indicated. 43 A or B mentioned as non-degradation mode in one dimention, E mentioned as double degradation in two dimention, T mentioned as triple degradation in three dimention and subscription 1 and 2 denoted as symmetric, non symmetric and principle symmetric axis all the notation were follow the group theriory. The subscription of g or u mentioned as the symmetric or anti symmetric refer to the inverison of coordinates. Hence, this spectroscopic analysis also reveals the phase transition because of annealing treatment and validates the XRD results. 43
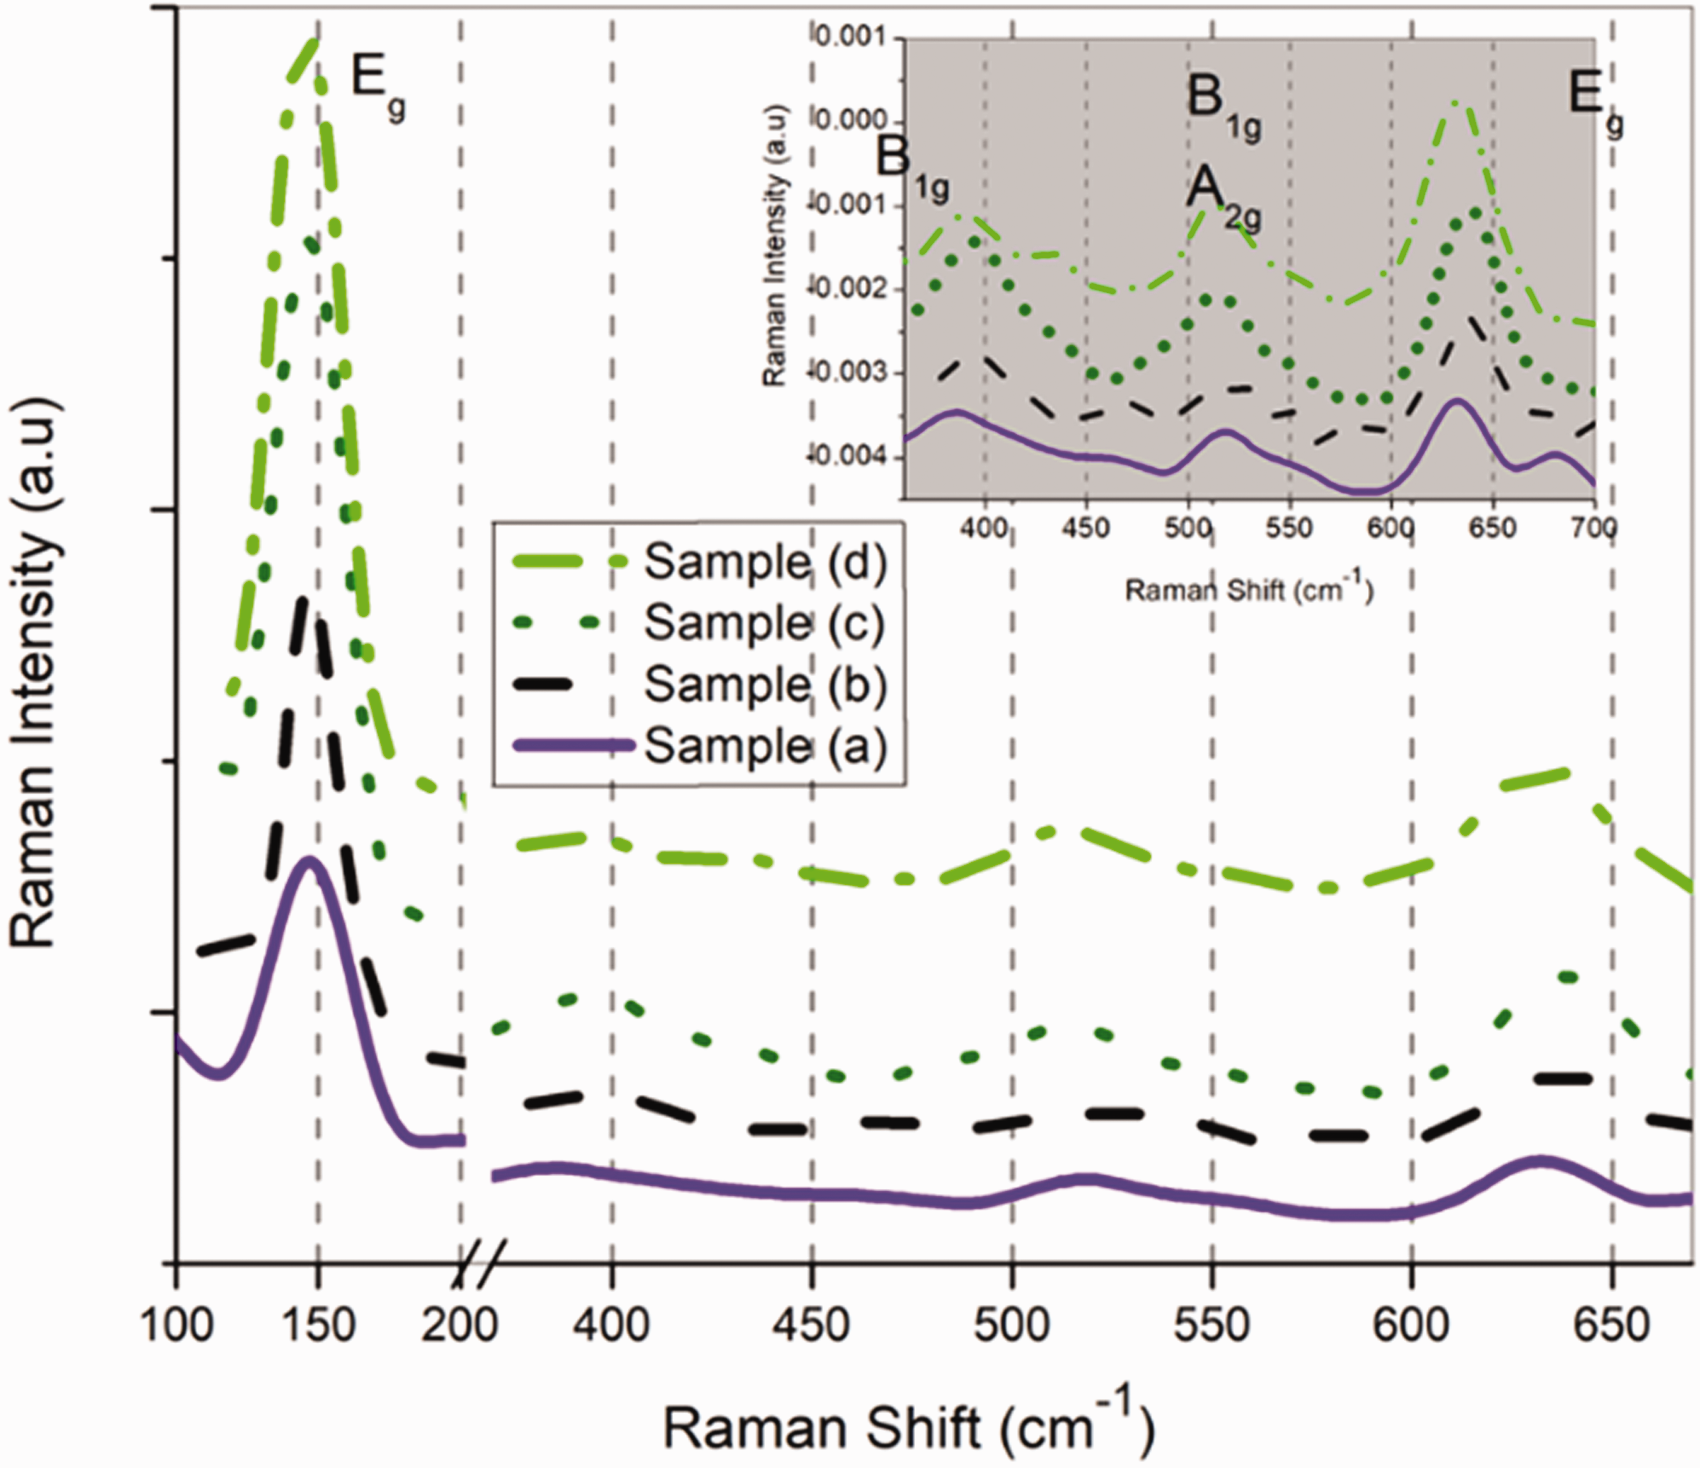
Raman spectra of TiO2 nanotubes.
Raman spectra can observe that the peak at 146 cm-1 on the different samples dramatically increases in intensity with annealing. Also, the peak broadens due to the calcination of 550 °C. The enhancement in peak intensity is attributed to increasing crystalline nature this observation is consistent with the XRD results.
Wetting behavior
Different surface morphology of the nanotube was fabricated and the surface layer has improved the hydrophobic and hydrophilic condition of the samples. Figure 5 shows the wetting behavior of anodized samples using contact angle measurement. The contact angle can see that anodized samples 1,2,3 and 4 with nanotube length of 1,1.5, 2.5 and 1.6 µm respectively showed the contact angle degrees as 128°, 118°, 49, and 92.806° (Figure 5(a) to (d)). When voltage increased to 40 V, surface wettability yields 128° and 118°. The other samples, 3 and 4, with an increased voltage of 50 V, show a lower contact angle of 48.583° and 92.806°. The change in water contact is attributed to modifying the surface area by increasing the diameter and length of the NTs. Such highly hydrophilic surface morphologies would improve the osteoblast behavior and enhance the osseointegration. 36
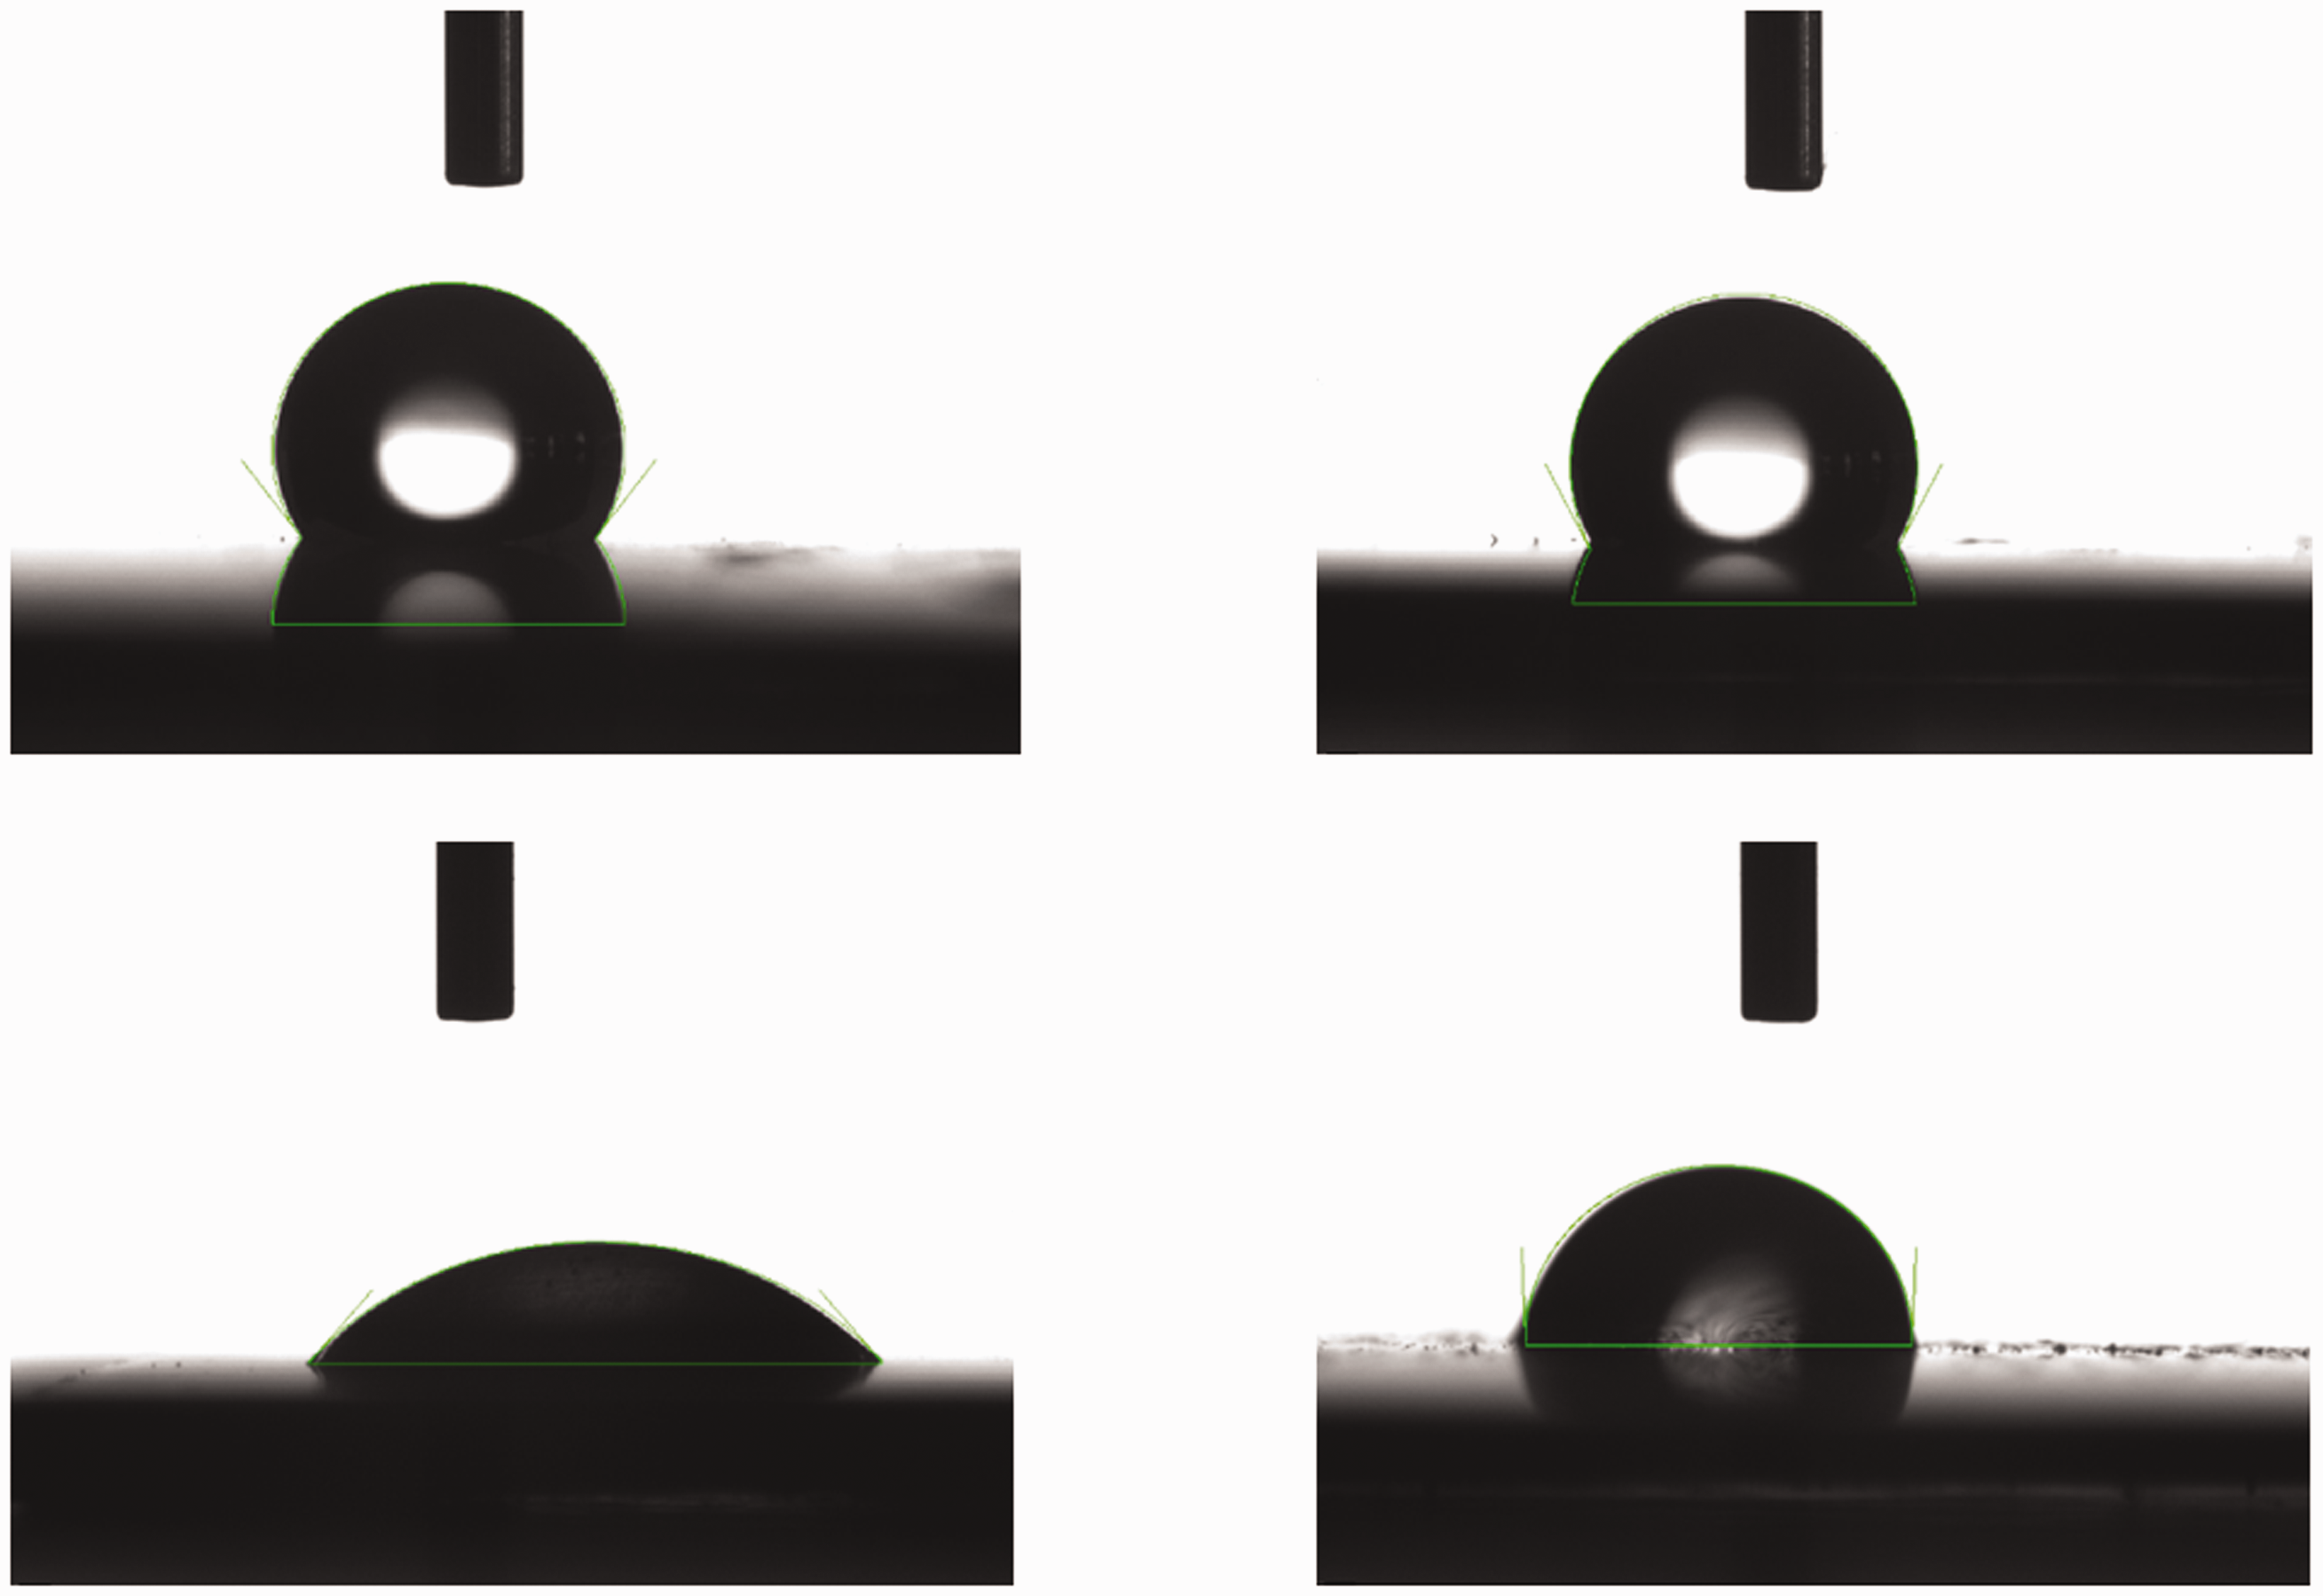
Wetting behavior of different surfaces (a) sample-1 (30 V and 40 V for 30 minutes each), (b) sample-2 (30 V and 40 V for 45,15 minutes respectively), (c) sample-3 (30 V and 50 V for 30 minutes each) and (d) sample-4 (30 V and 50 V for 45,15 minutes respectively).
Nano indentation
The mechanical behavior of the coated material surface strength is studied using (ISO 14,577) nanoindentation. Figure 6 illustrates the typical loading starting from point (a) and reaches the maximum load of 8 µN at point (b) with a constant load rate of 50 mN/s. After the load reaches the top end (b), the load is held for a few seconds from point (b) to (c). The holding process is stopped and the input load is unloaded using the same constant unload (50 mN/s) to measure the material’s plasticity (d).
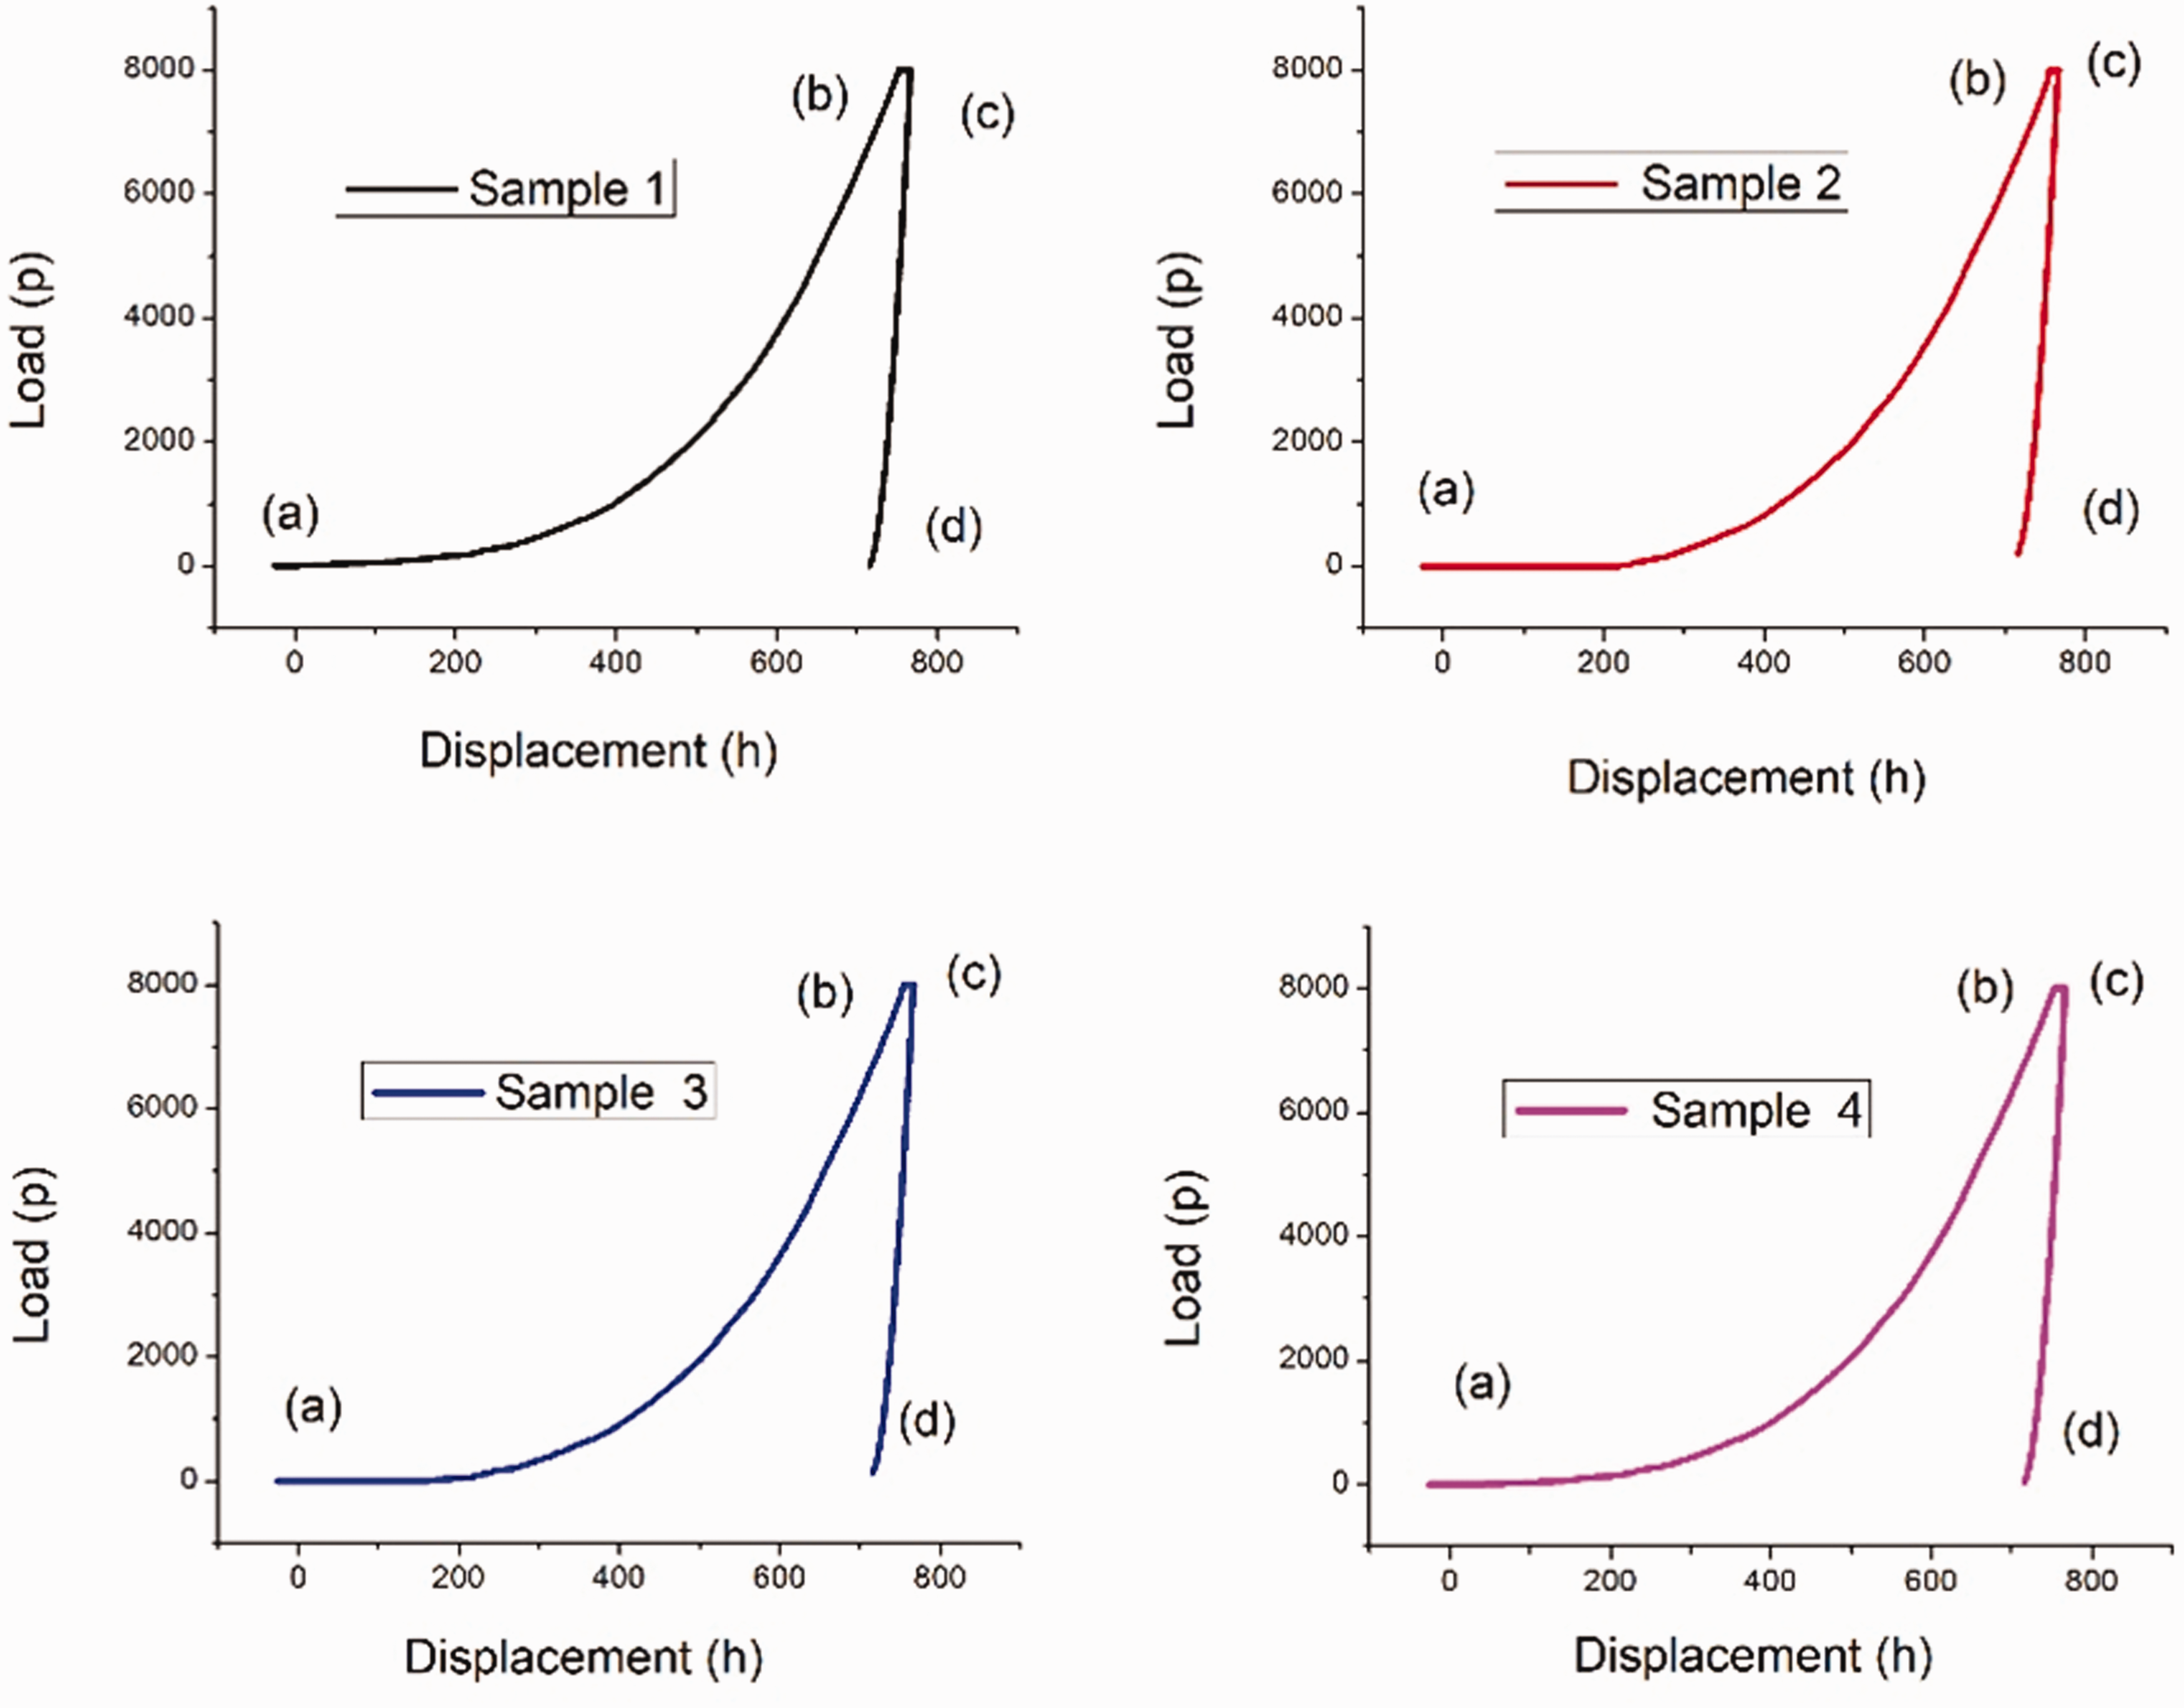
Nano indentation studies of four different TiO2 nanotubes.
Table 1 shows the nanoindentation results of anodized samples with the step-up condition. Evaluation of the nanotube properties considers the following: deformation contact depth impression of the indenter on the nanotubes (hc), the maximum load applied on the nanotubes (Pmax), unloading curve slope (S) to measure the stiffness of the nanotube, contact of the indenter and nanotubes projected contact area, (hmax) the highest depth travel by the indenter, and Er elastic modulus of the tip.
Summary of fabricated TiO2 nanotubes nanoindentation results.

For the nanoindentation test, an 8 µN load has been used as a maximum load for the sample analysis. The unloading curve (c)-(d) curved line and hr = hmax (w2 ≠ 0 – not a straight line) is not a pure plastic material. The penetration initially starts from the sample's surface area. From the initial indentation contact with the nanotubes deformation of the sample is the displacement begins to form the nanotube's surface. The maximum penetration depth achieved in the material can be determined by the hardness of the material 44 using equation (1).
For the nanoindentation test, an 8 µN load has been used as a maximum load for the sample analysis. The unloading curve (c-d) curved line and hr= hmax (w2 ≠ 0 – not a straight line) is not a pure plastic material. The penetration initially starts from load carried by the sample from the initial indentation contact with the sample that deformation of the sample is the displacement of the sample begins to form the surface of the nanotubes. The maximum penetration depth achieved in the material can be determined by the hardness of the material
44
using equation (1).

Then hf contact with the material can be expressed using equation (3) as
The hmax maximum displacement attained at the maximum load achieved (Pmax), S represents the contact stiffness arising from maximum displacement 
Evolution of finding the stiffness S, the fitting of unloading data ‘power law’ can be expressed as following, 
Here, Amax indicates as the contact area projected in indenter and the material hmax, β variation in the geometry, E* reduced elastic module. 46
Table 1 shows the nanoindentation results of anodized samples with step up condition. Initially, the contact depth of the samples are high due to the low strength of the sample. Sample 1 delivers the minimum length indicating the increased strength of the sample. All the experiments reach the predetermined maximum load.
The unloading data could determine the rate of elastoplasticity/plastic deformation. The relation between indentation contact and the material surface indicates that a low penetration, high strength material (sample 1) delivers the contact surface (A). During the unloading process, the sample showing less penetration renders the high elastic modulus shown in the last column. However, the maximum strength material (high strength nanotube) contact depth and contact are of the materials that deliver high durability compared to others.48,49
Initially, the contact depth of the samples is high due to the low strength of the sample. Sample 1 delivers the minimum length indicating the high strength of the sample. All the experiments reach the predetermined maximum load. The unloading data could determine the rate of elastoplasticity/plastic deformation. The relation between indentation contact and the material surface indicates that a low penetration sample, high strength material (sample 1) delivers the level contact surface (A). During the unloading process, the sample showing less penetration renders the high elastic modulus displayed in the last column.
Electrochemical studies
Electrochemical behavior in artificial simulated body fluid results for all samples are shown in Figure 7. Corrosion potential (Ecorr) and corrosion current density (icorr) are the two significant factors calculated from impedance spectroscopy. The substrate chemical potential is measured using Ecorr, and is the thermodynamic parameter shown in Figure 7(a). If the corrosion resistance is high in tafel analysis the Ecorr values become low and icorr values are high. 50 The Ecorr and icorr values for samples 1-4 are -535, -246, -273, -262 mV and 1.98, 2.77, 3.03, 2.63 µA, respectively (Table 2). Corrosion potential decreases when the step-up condition increases but in corrosion current density condition, the values decrease in samples 1-3. The low values of icorr and high value of Ecorr suggest that the material has better corrosion resistance. The electrochemical impedance spectroscopy images are shown in Figure 7(b) and (c) with frequency versus magnitude and phase angle. An equivalent electrical circuit calculated the samples polarization resistance by fitting the (Inset: Figure 7(d)) along with the Nyquist plot. Figure 7(d-a1, b1, c1) shows the solid electrolyte of simulated body fluid, anodized sample, and deposition of SBF solution, respectively.
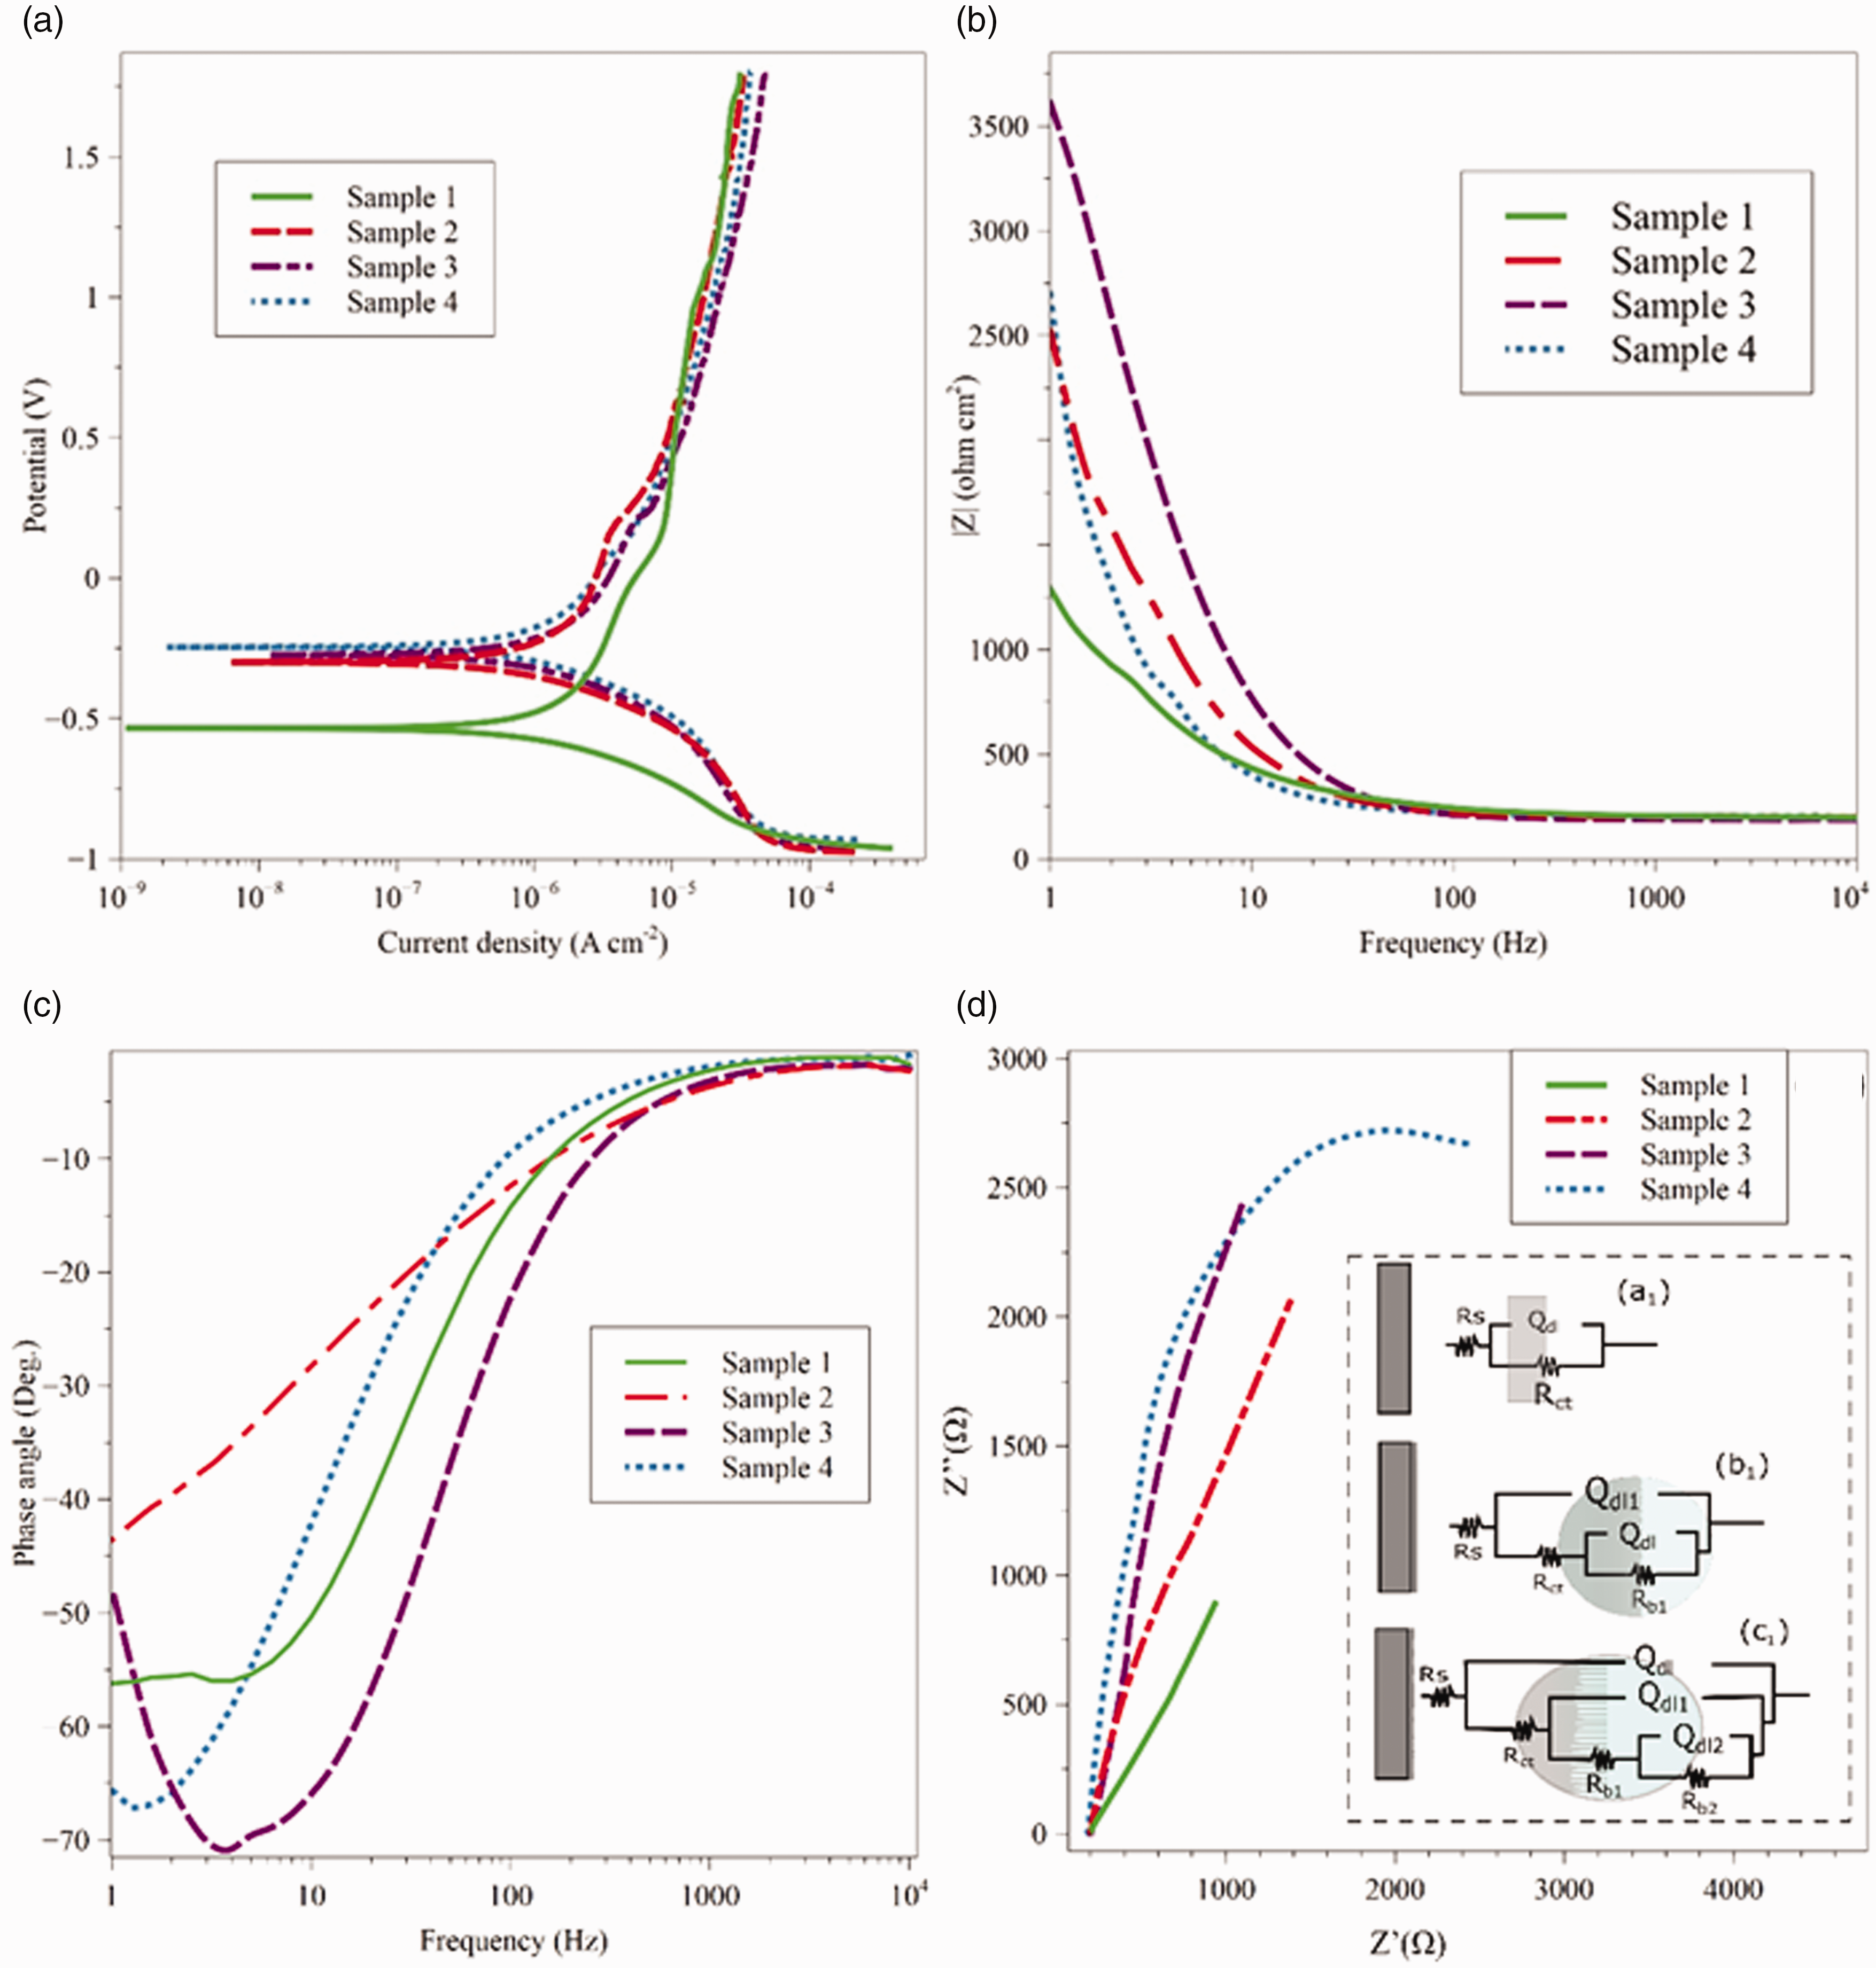
Electrochemical behavior of (a) potentiodynamic polarization curve, (b) impedance as function of frequency, (c) phase angle as a function of frequency and (d) Nyquist plot.
Effect of polarization analysis.

The electrochemical impedance spectroscopy analysis was carried out and results are shown in Figure 7(d). According to the Nyquist plot large capacitive the circle is obtained in the sample with maximum length. The enlargement in loop indicates the high corrosion resistivity of material. The stable structure improves the corrosion resistance thus increasing the suitability in the bio-implantation environment. The corroded specimen and the SBF relation manifests in the equivalent electric circuit (EEC) shown in Figure 7(d). The impedance spectrum was fitted with the EEC with the use of gamry software interface 1010 Rs solution resistance, Rct and Qdl represent the polarization resistance the passive layer polarization resistance. Qdl2 and Rd2 fitted with the equivalent circuit, Qdl2 and Rd2 represent double layer and charge transfer resistance capacitance, respectively. By comparing all the Nyquist results, the maximum capacitive loop indicates the maximum corrosion resistances.
Table 3 shows the corresponding results obtained from the EEC fitting model. The improvement leads to further investigation of cell attachment for hydrophilic condition and the hydrophobic state samples were increasing the corrosion resistance.51,52 Based on the previous summarized reports informs that increase the voltage with a reasonable anodization time delivers that different surface morphology of the nanotubes rib structure increases the corrosion resistance.23,50,53
EIS parameters for different length and structured sample.

Overall, incorporated in-situ voltage conditions and modified structures captivate 1) enhanced crystallinity, 2) good surface wettability, 3) Better mechanical property and 4) corrosion resistivity of the material. These promising features render this coating appealing suitable for the orthopedic application. Essential for preclinical examination, in-situ, bio-activity and animal study should be performed the interaction of coating performance with bones and tissues.
Conclusion
The conventional In-situ voltage condition used to synthesize the TiO2 nanotubes with different surface morphologies are obtained. The evolution of rib structure was absorbed due to the voltage change with respect to time. The sudden voltage change enhances the oxygen evolution helps to form nanotubes that can absorb the rib structure can be absorbed. The existence of rib structure enhances the strength of nanotubes confirmed by nano-mechanical properties. Changes in wetting behavior reveals that samples are promising bioactive action. The corrosion results revel that short length nanotubes are poor in resist the corrosion. The enlarged nanotubes with different rib structures are informed that they withstand corrosion and promise corrosion resistance.
Footnotes
Declaration of Conflicting Interests
The author(s) declared no potential conflicts of interest with respect to the research, authorship, and/or publication of this article.
Funding
The author(s) received no financial support for the research, authorship, and/or publication of this article.
