
Abstract
This study reports the reinforcement degree investigation of two types of rockwool fibers (F1 and F2), in nitrile rubber composites. The micro-computed tomography (micro-CT) 3D images showed that both fibers were well-dispersed in the NBR matrix, without a preferential orientation. The micro-CT analysis also allowed quantifying volume fraction, inter-fiber distance, and aspect ratio. Those morphometric parameters were used for supporting the composites rheological behavior assessment. Changes in the elastic modulus and phase angle followed the same trend of the inter-fiber distance values, regardless the type of fiber. Both volume fraction and aspect ratio data from the micro-CT analysis were used to predict theoretical values of elastic modulus using the Guth-Gold and modified Guth-Gold equations, and the results obtained were compared to the rheological experimental data. This analysis was helpful to better understand the rockwool fibers reinforcement degree differences in the production of the nitrile rubber composites.
Introduction
Rubbers are known for having unique properties such as high toughness, resilience, and fatigue resistance. For that reason, rubber composites are an excellent option for several demanding engineering materials and also for ordinary everyday applications.1–3 To address this challenge of meeting diverse technical requirements, rubber composites are prepared with a complex mixture of ingredients that should be properly dispersed and distributed in the rubber viscous matrix. A typical rubber formulation contains many more ingredients when compared to others engineering materials formulations. Some of those materials are the rubber itself (or a blend with others rubbers), cure (or vulcanization) system, reinforcement additives in macro or nano size (fillers and/or fibers), protective system and process aids. Along with the components of the formulation, the ultimate properties of rubber artifacts are influenced by different process types and conditions used to achieve the final product.1–4
The X-ray micro-computed tomography (micro-CT) is a non-destructive technique that allows a tridimensional visualization of the internal structure of a broad range of samples. Qualitative and quantitative analysis can be performed such as morphology assessment, detection of defects, and determination of volume fraction occupied by a specific component in the sample.5,6 The Micro-CT technique requires the analyzed samples to contain components with different X-ray attenuation coefficient in their composition, so that the yielded contrast can be good enough to discriminate the object of interest. When it comes to fibers, micro-CT provides a resource for accurate three-dimensional analysis of fiber architectures, manufacturing defects and damage, allowing the user to examine cross-sections that previously would require laborious and skilled mechanical sectioning with the chance of damaging or causing loss of material. 6
With respect to rubber materials, micro-CT has already been used for the elucidation of the fatigue mechanism of polychloroprene rubber, 7 the assessment of damages generated in unfilled EPDM rubber (Ethylene-Propylene-Diene polyMethylene) during a decompression test, 8 and on the investigation of rubber compounds contact against counter-surfaces. 9 Besides these examples of performance evaluation, Nusser et al. 10 discussed the advantages of using synchrotron x-ray computed tomography to assess silica dispersion (reinforce filler) in styrene-butadiene rubber. The analysis revealed that the breakdown of silica’s clusters leads to an increase in filler fraction volume, highlighting the importance of the correct measurement of the parameters to avoid misunderstandings. Chen et al. 11 used synchrotron radiation x‑ray nano-computed tomography to monitor and confirm carbon black network destruction and reconstruction in a natural rubber matrix during mechanical cyclic tests.
As stated, the microstructural information of rubber composites is extremely helpful to investigate the roles of the additives added to the formulation, helping to predict and better understand the ultimate properties of the materials. This study aims at investigating and comparing rockwool fibers reinforcement potential in a nitrile rubber (NBR) matrix, using the qualitative and quantitative micro-CT analysis along with a rheological investigation. Two types of rockwool fibers with the same length were used in this study. NBR is an important rubber widely used for demanding engineering applications in the oil and gas industry. The man-made rockwool fiber is an inorganic material that has attractive properties such as high modulus, thermal and chemical resistances, which makes it an interesting reinforcement fiber option for rubber composites. 12
Materials and methods
Materials
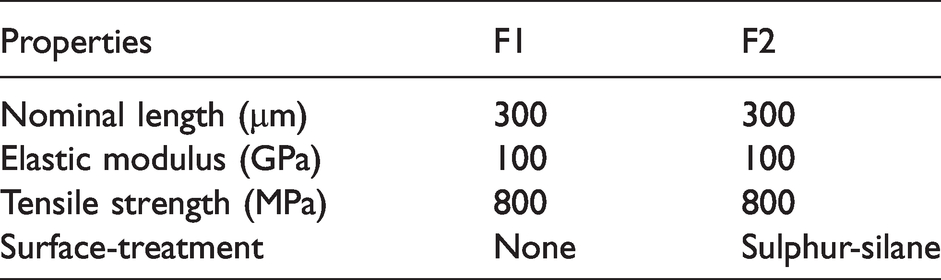
Lapinus kindly supplied two grades of rockwool fibers with nominal length of 300 µm, coded as F1 and F2. Table 1 presented typical properties according to the supplier.
Typical properties of F1 and F2 fibers (supplier’s data).
Nitrile rubber (NBR) with 33% of acrylonitrile content and Mooney viscosity of 50–70 ML 1 + 4(100 °C) (ASTM D1646) was supplied by Nitriflex. The vulcanization system components used were: (a) activator system components: zinc oxide, magnesium oxide, stearic acid, (b) Efficient vulcanization system components: tetramethyl thiuram disulfide (TMTD), dipentamethylene thiuram hexasulfide (DPTH), and N-Cyclohexyl-2-benzothiazolesulfenamide (CBS), and (c) Antioxidant: 2,2,4-trimethyl-1,2-dihydroquinoline (DHQ). All materials were used as received.
Rubber composite preparation
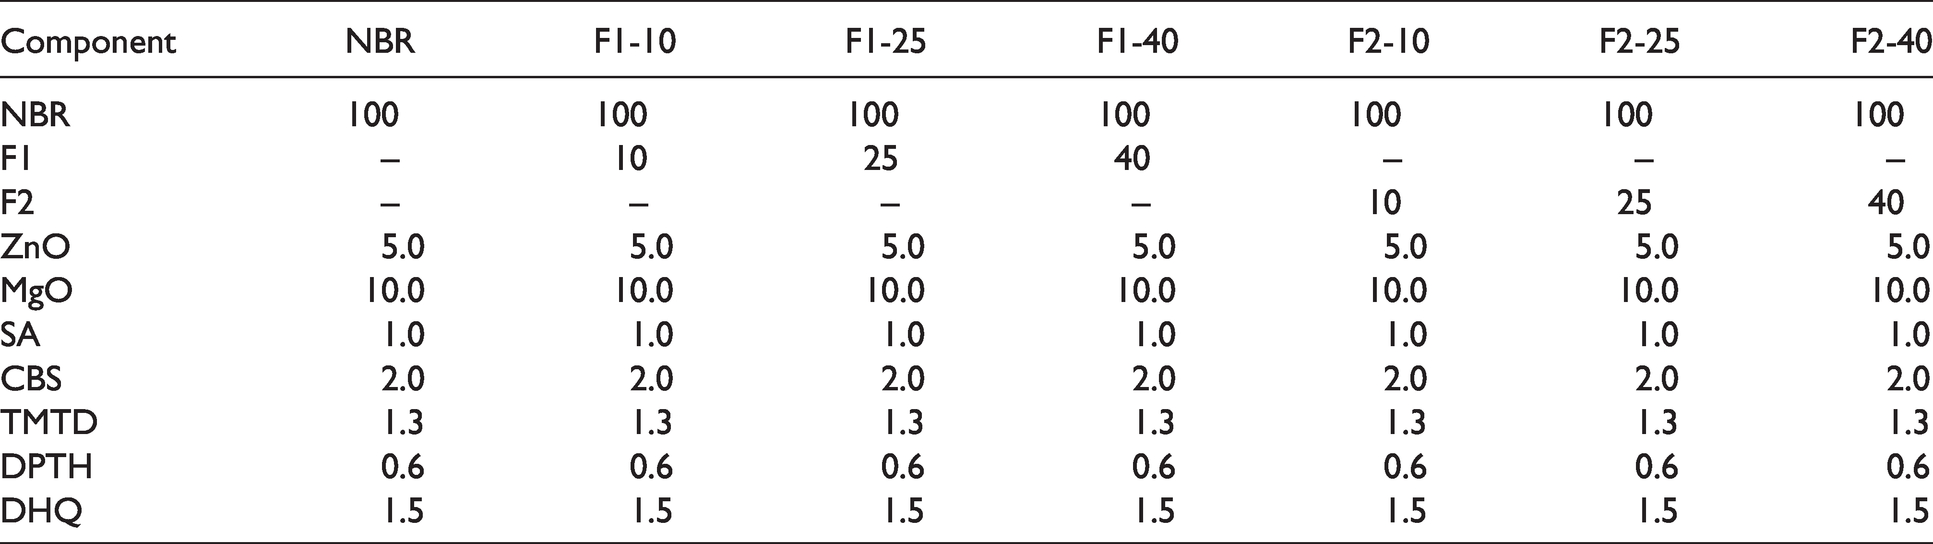
Table 2 presents the NBR/Rockwool composites formulations. The efficient vulcanizing system used was based on a formulation for oil field products, and it is useful for testing materials that require thermal resistance. The experimental code used for composites identification was YY-BB, wherein YY is F1 or F2, and BB is the fiber amount in phr. In addition, an unfilled NBR compound was prepared to be used as reference. The composites preparation is described in detail in our previous work. 12 Briefly, the composites were prepared in a two-roll open-mixer based on ASTM D-3187. Then, the composites were kept for 24 h at 25 °C before the vulcanization in sheets format using a hydraulic press (160 °C, 1.8 MPa) with their respective vulcanization time (t90), previously determined using the Rubber Process Analyzer (RPA 2000, Alpha Technologies) using test protocols based on ASTM D5289.
NBR/Rockwool fibers formulations (amount in phr).
X-ray computed microtomography
Specimens were scanned by a micro-CT (SkyScan 2211 Multiscale X-ray Nano-CT System, Bruker micro-CT, Kontich, Belgium) with a 20–190 kV tungsten X-ray source and a cooled 4032 × 2670-pixel CCD-camera. The samples were scanned at 45 kV, 300 μA and 750 ms without the use of a physical filter. The scans were taken over 360° with a rotation step of 0.31°. Each projection was averaged by 2 frames, which led to a total scan duration of about 30 min for each sample and a final voxel size of 0.9 μm. Micro-CT projections were reconstructed using the system-provided software, NRecon (version 1.7.4.6), and analyzed with CTAn (Bruker micro-CT, Kontich, Belgium, version 1.18.4.0) and Avizo® 9.0 (Thermo Fisher Scientific, Waltham, MA, USA). Figure 1 shows the raw images after reconstruction of one random slice taken from each of the studied samples.
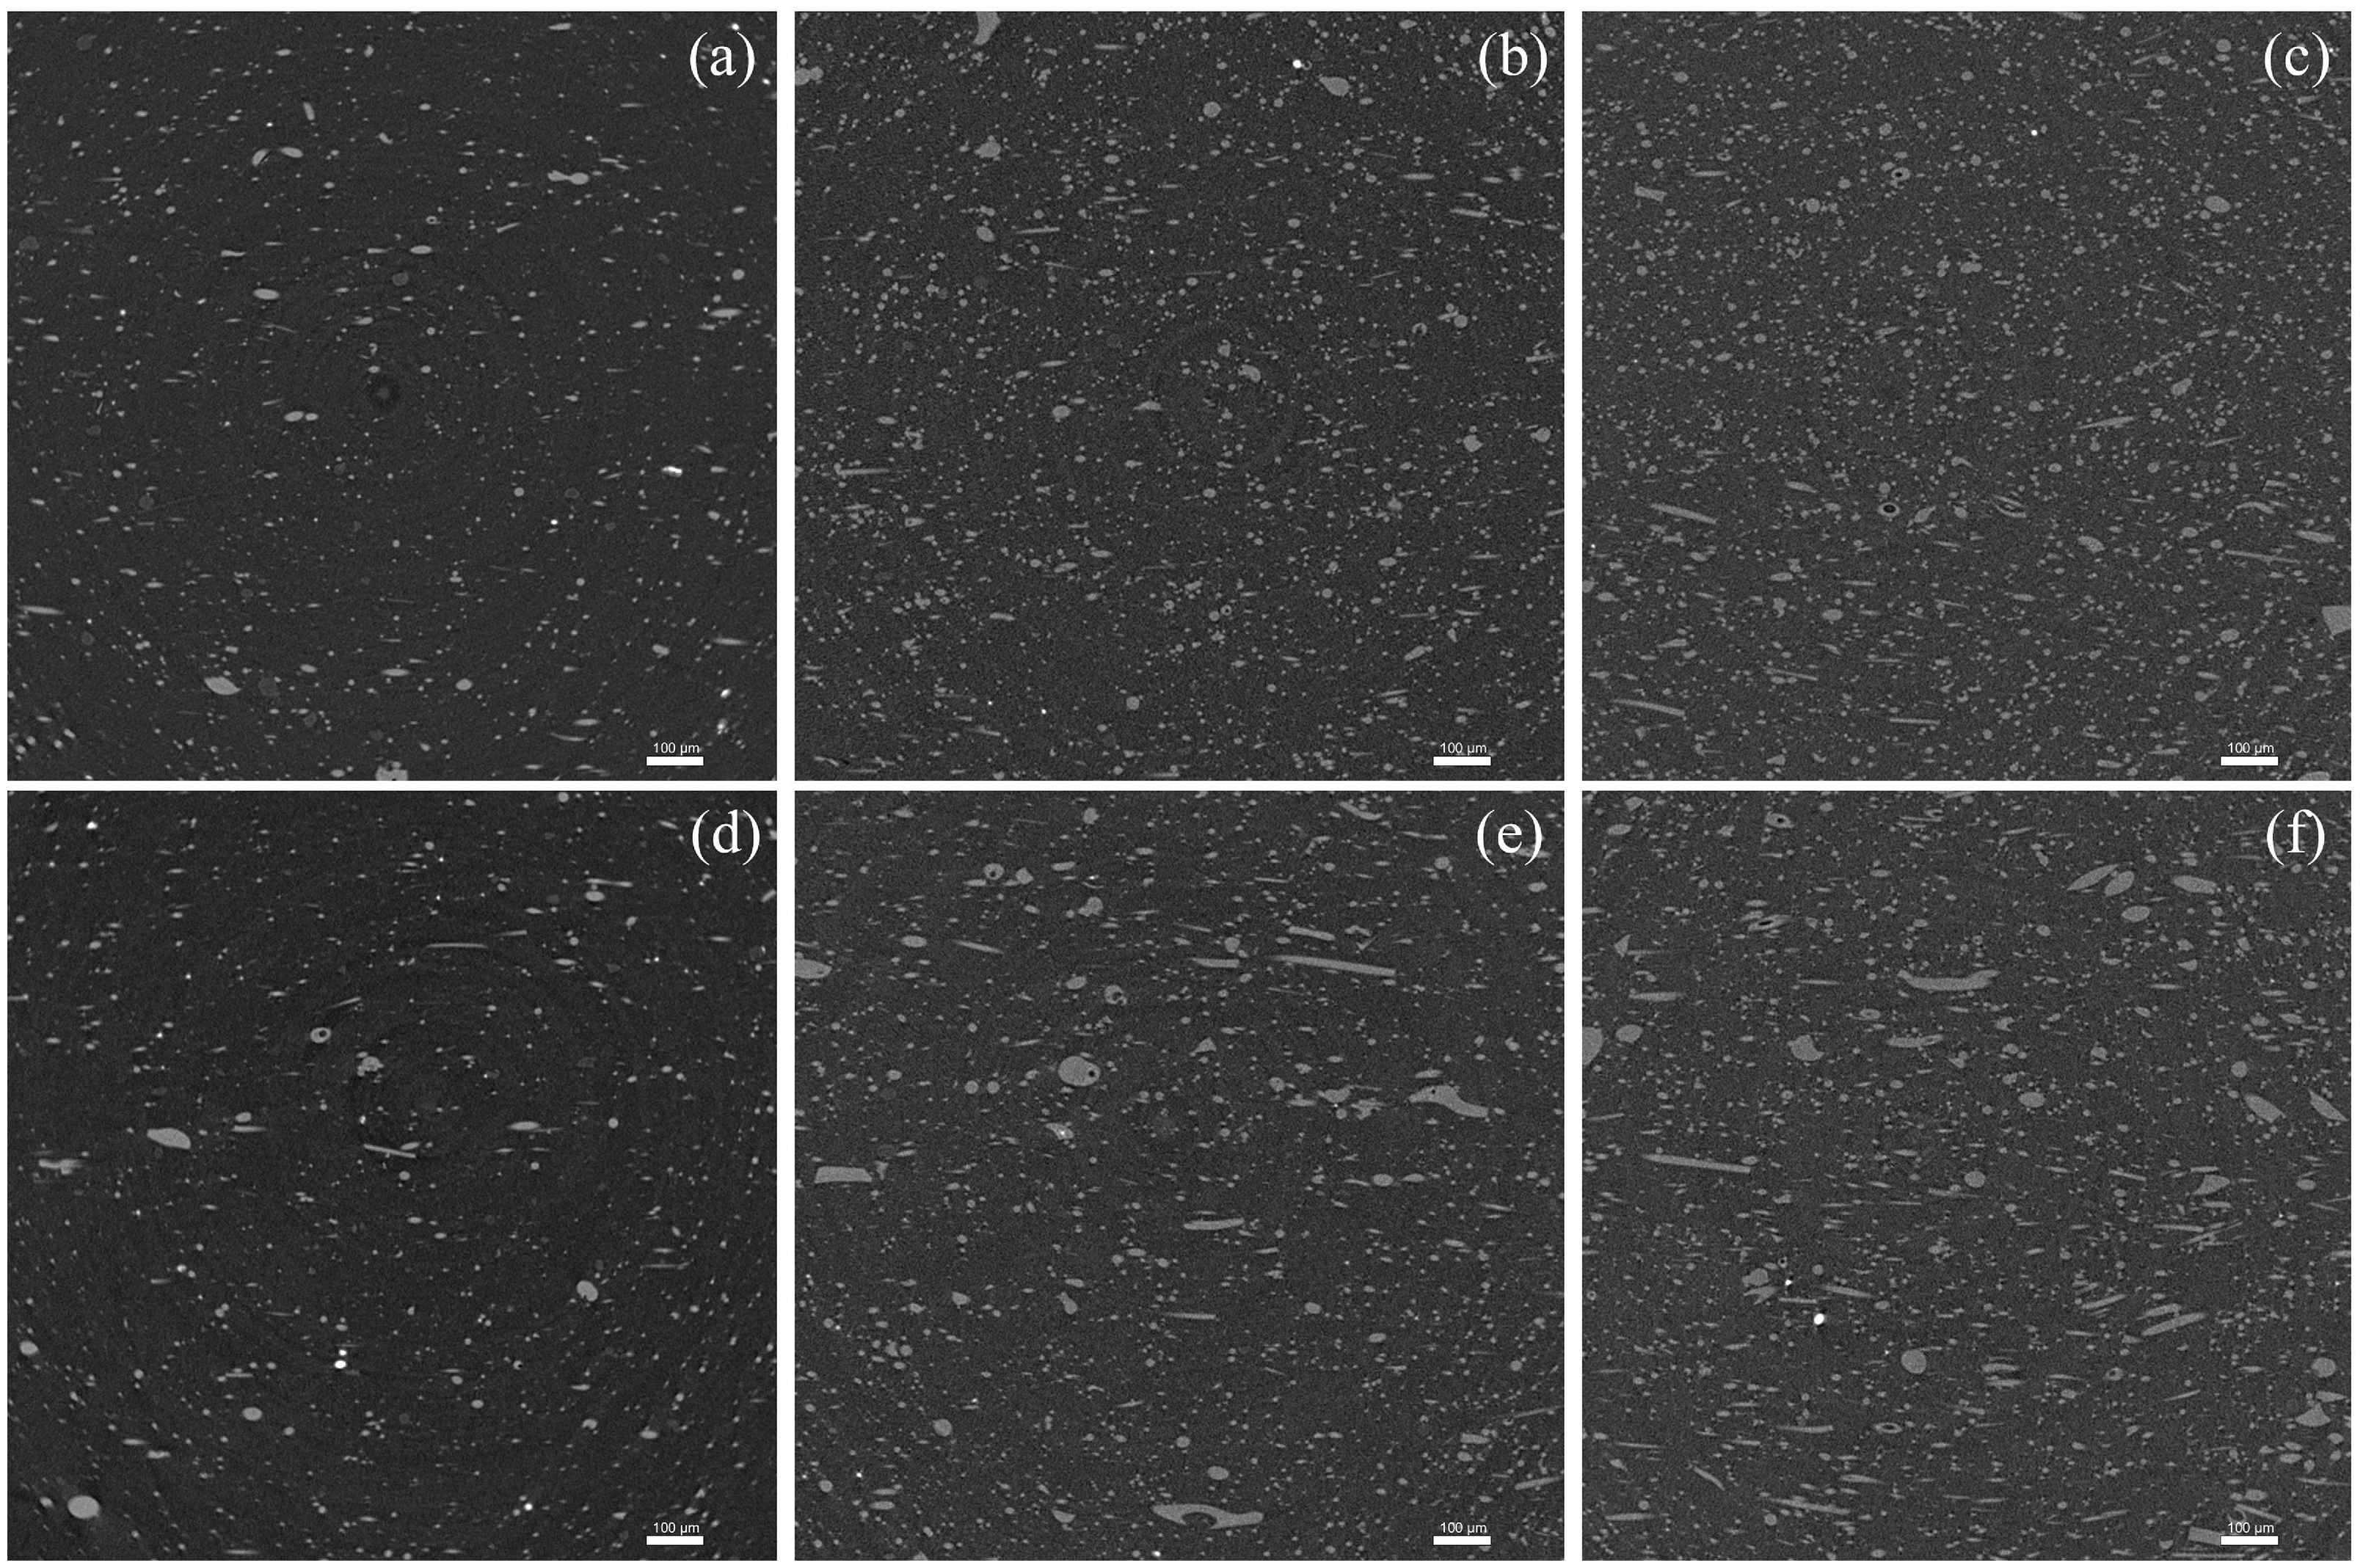
Raw images (100 µm) of one random slice of F1–10 (a), F1–25 (b), F1–40 (c), F2–10 (d), F2–25 (e), and F2–40 (f).
Image analysis of rubber composite
For the quantification of the fibers a non-local means filter was applied to the datasets to denoise them, 13 followed by the segmentation (global thresholding) of the fibers and a series of image processing were used to better clean the datasets, what included closing, opening, and removal of speckles. The following parameters were quantified: Fiber Length, Fiber Width, Fiber Volume, Feret Shape 14 and Fiber Orientation (the angle formed with the Z-axis, varying in the range [0, 90] degrees from the plane xy towards z. The Fiber Length and Width, also referred to as Feret Diameters, are a measure of an object size along a specified direction. It can be defined as the distance between the two parallel planes restricting the object perpendicular to that direction. 15 The width is calculated by taking the average of the minimum Feret diameters measured throughout each individual fiber, with a sampling over 200 directions, while the Length takes the average of the maximum Feret diameters.
Greyscale levels were converted into color by a computer algorithm for improved visualization of the fiber orientations according to the label presented in Figure 3 of the Results and discussion section. For both quantification and visualization of the fibers, Avizo® 9.0 (Thermo Fisher Scientific, Waltham, MA, USA) was used, with the exception for Fiber orientation and total volume of fibers, which was performed using CTAn (Bruker, Kontich, Belgium).
Figure 2 shows a detailed diagram with the steps taken for the micro-CT analysis. These steps are necessary to reach a precise quantification of the fibers. All the intermediate steps of image processing shown here are performed to increase the precision of the results, leading to lower errors while making sure that the post-processed images are representing the content of the samples. The Anisotropic diffusion filter is known to preserve borders, allowing for a more precise segmentation (threshold) and was chosen due to the lower computational demands compared to others of the same kind. Despeckling was used to avoid confusing noise with the fiber content; all contents smaller than 27 voxels were considered noise. The processes used for the analysis are ready-implemented and available in both aforementioned software.
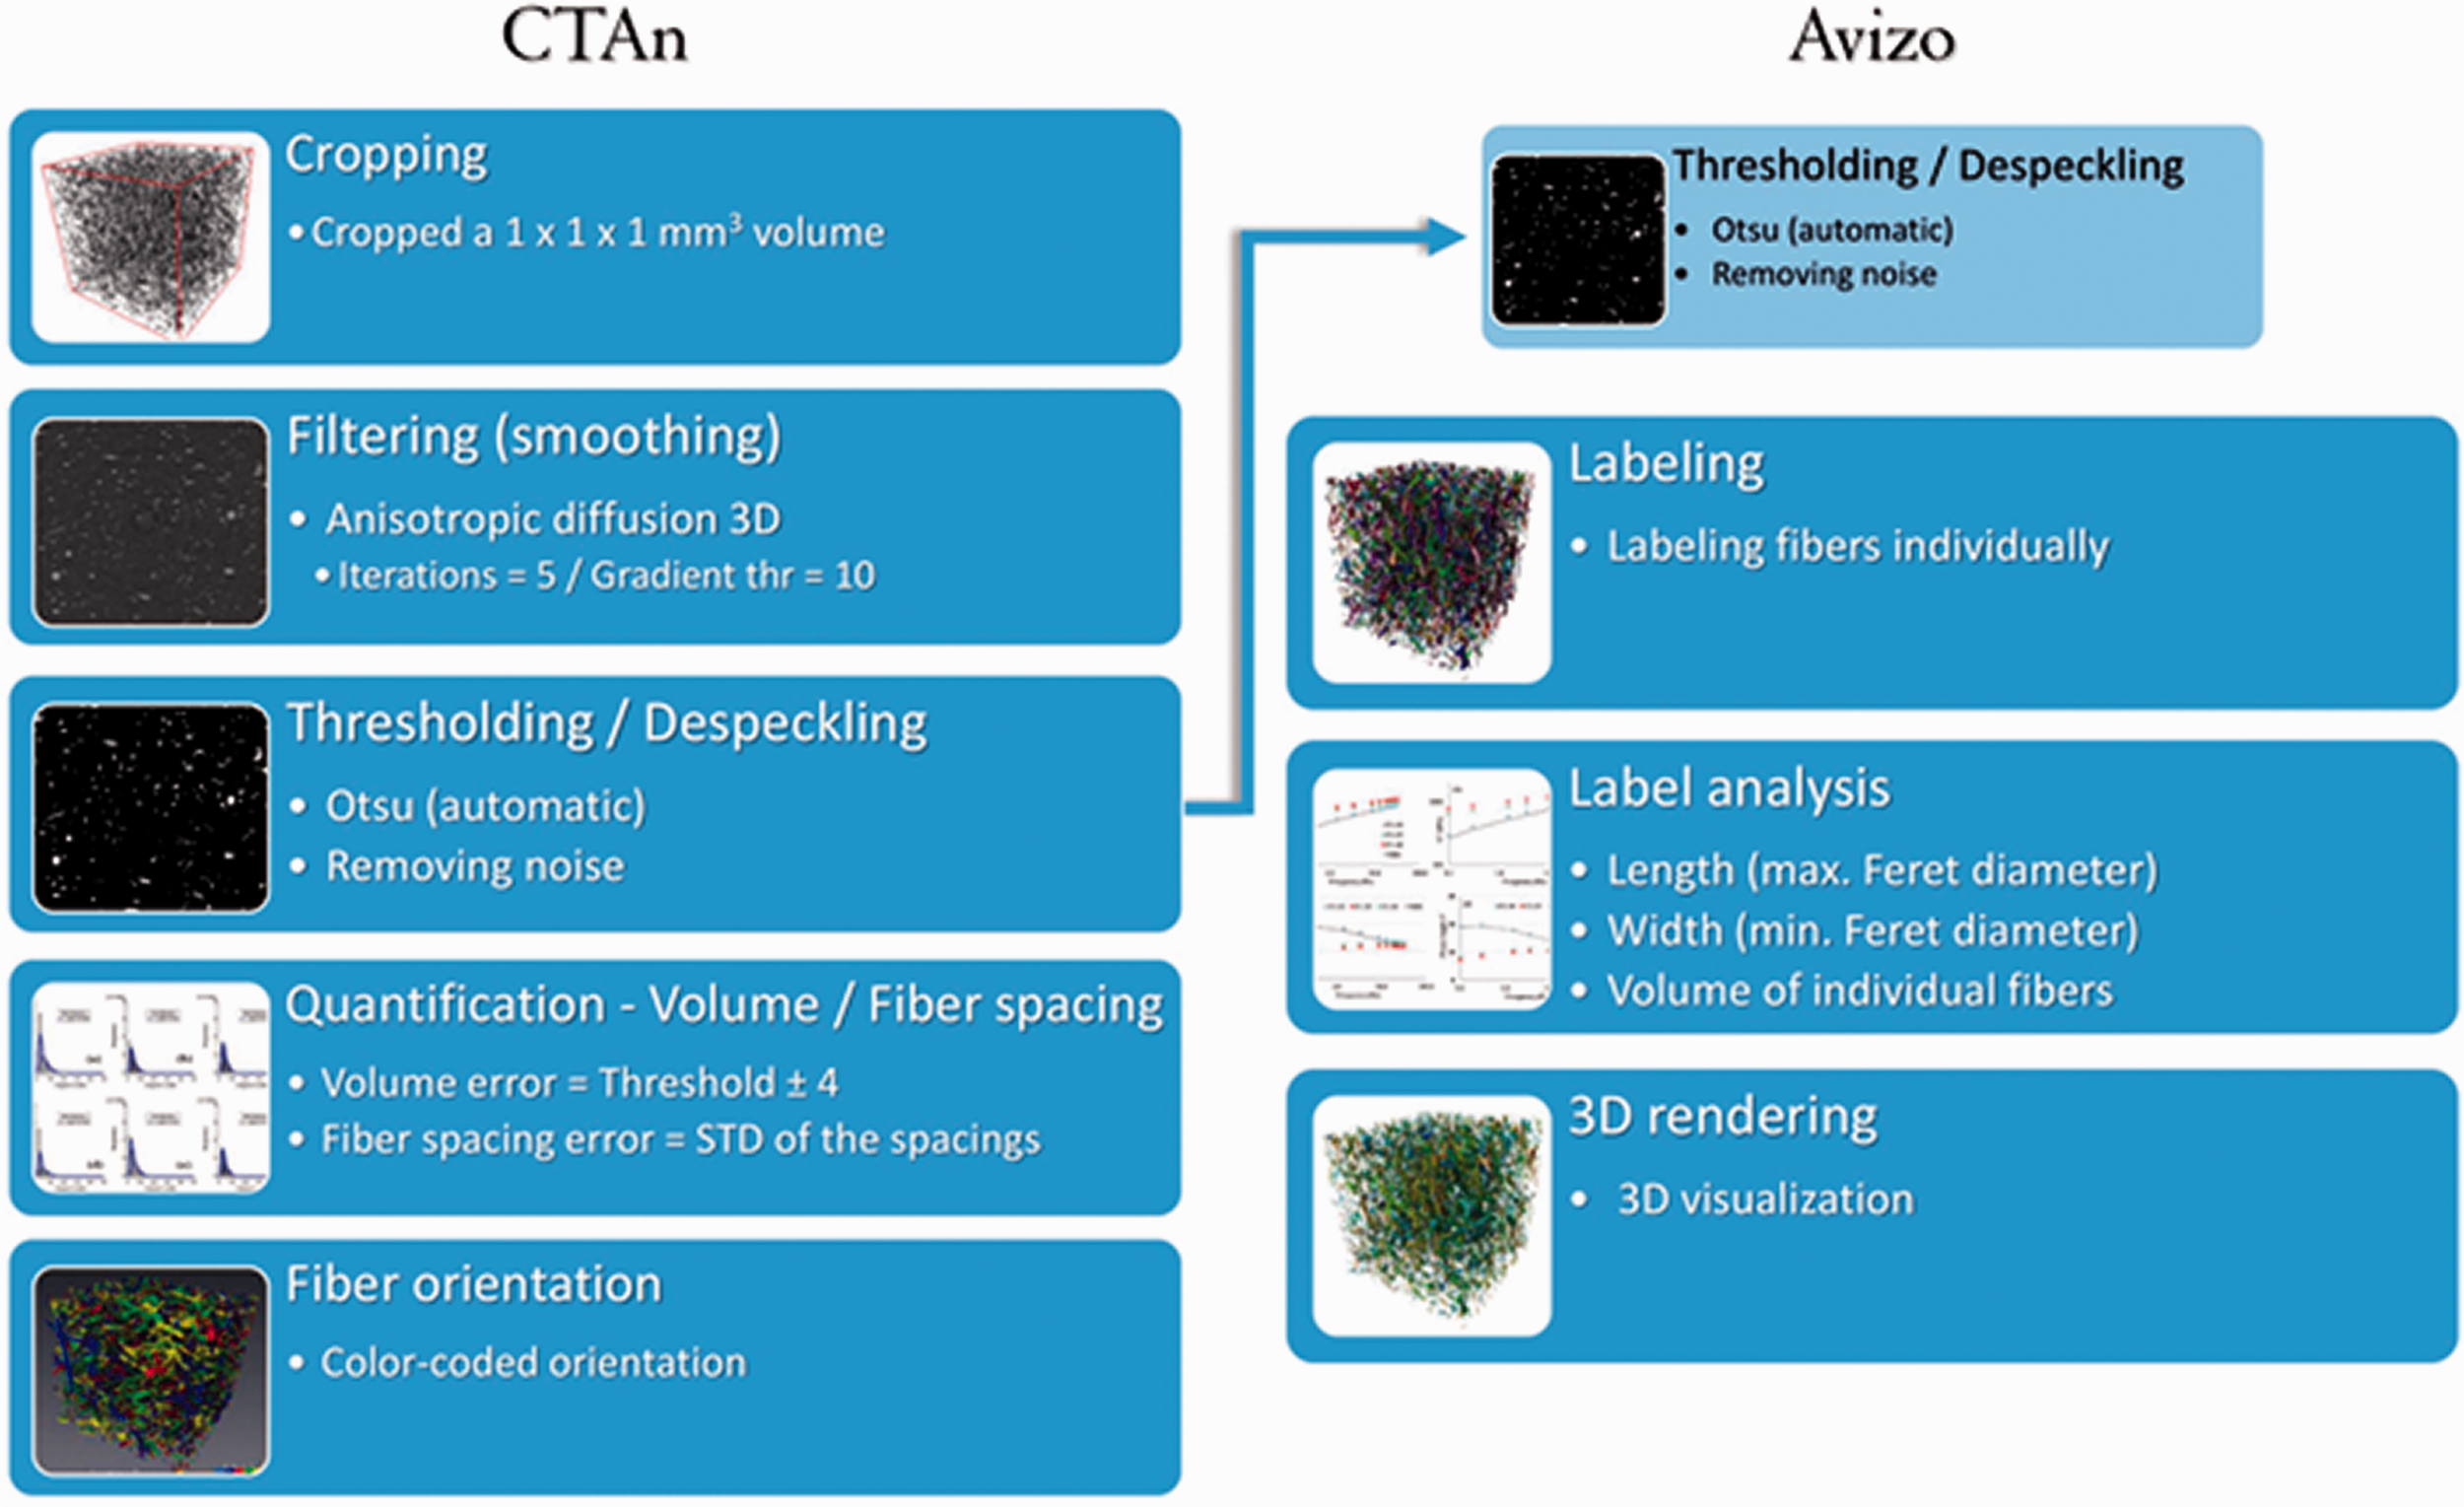
Diagram showing the sequence of steps taken for the micro-CT analysis of the fibers.
Rheological investigation by frequency sweep test
Rheological behavior was assessed using a Rubber Process Analyzer (RPA 2000, Alpha Technologies). The frequency sweep test ranged from 0.1 to 33 Hz, at 60 °C and sinusoidal shear strain of ±7%, which is within the rubber linear viscoelastic region, as well as, in the Payne Effect interval (0.7 - 11.5%) according to our strain sweep test reported in our previous paper. 12 The test protocol consisted of the following steps: (i) sample vulcanization at static mode at 0.0° of arc strain and 0.0 Hz of frequency at 160 °C for the respective t90 time; (ii) temperature reduction from 160 °C to 60 °C; (iii) sample conditioning for 2 minutes at 1 Hz, 2.8%; (iv) frequency sweep from 0.1 to 33 Hz at a constant strain amplitude of 7%. After collecting the data, the elastic shear modulus (G′) and phase angle (δ) curves were plotted against frequency.
Scanning electron microscopy analysis
The morphology of F1 and F2 fibers were assessed on a JEOL JSM-6510LV scanning electron microscope (SEM). The same analysis was also performed for the fractured surface of F1-40 and F2-40 composites after mechanical tests. All samples were fixed on the metal stubs using carbon tape and then they were sputtered with gold.
Results and discussion
Micro-dispersion characterization of rockwool fibers by micro-CT
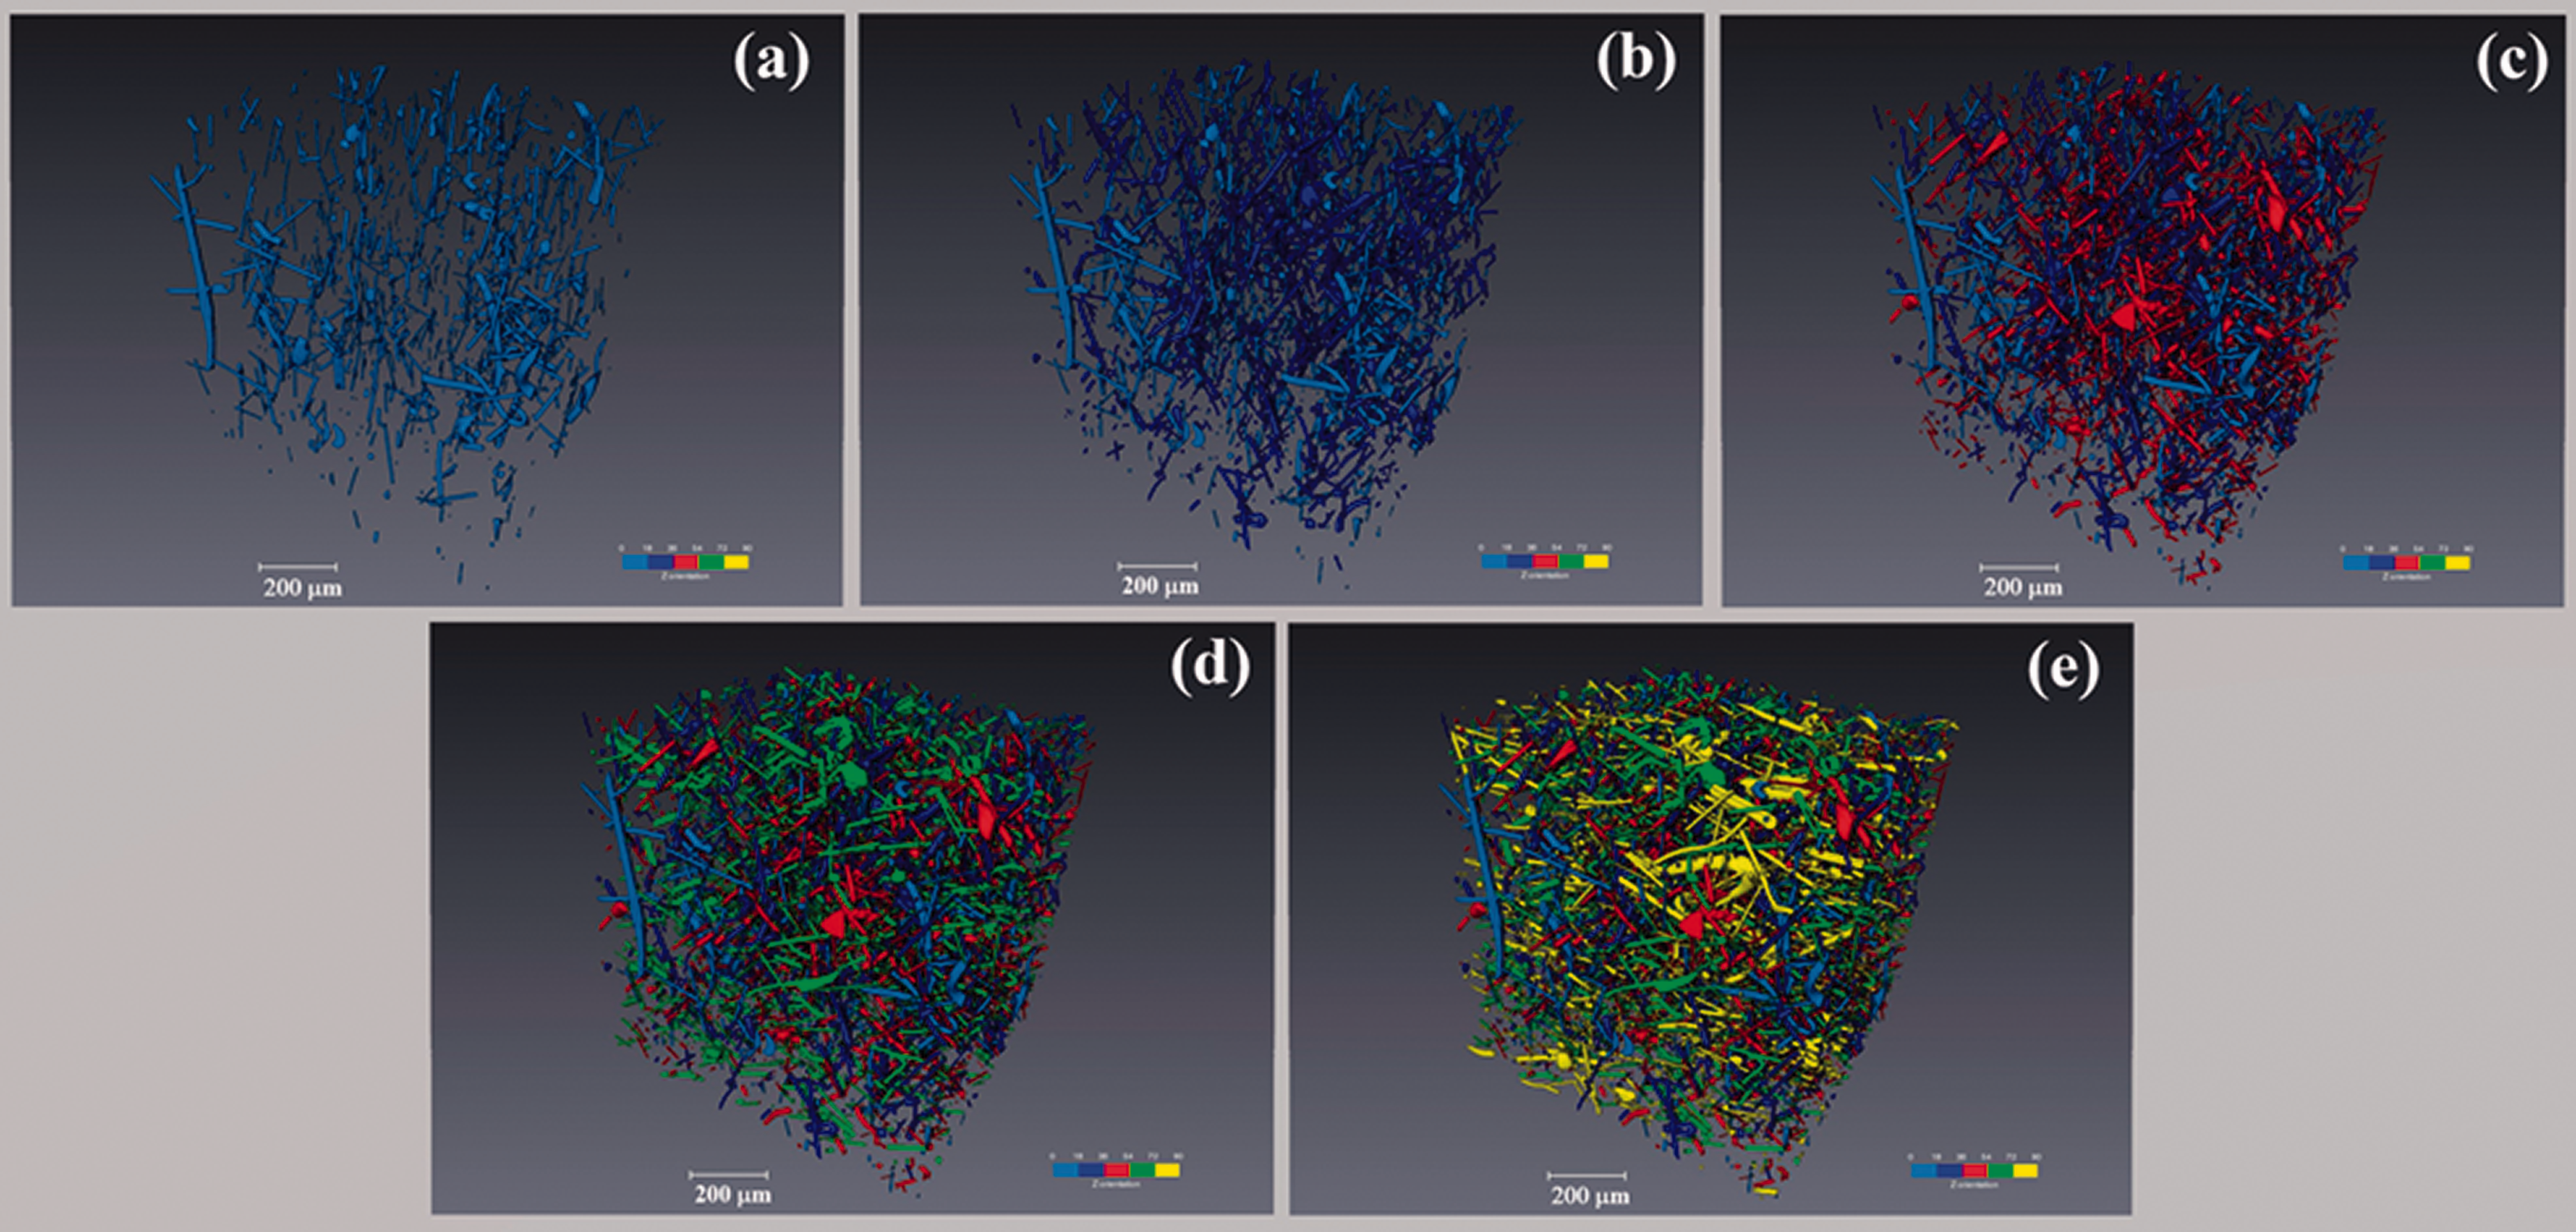
Figure 3 presents a sequence of 3D images for the F2-10 composite, showing that the rod-shaped fibers are well-distributed in the NBR matrix without a preferential orientation. The same behavior was observed for the other samples, as shown in the 3D images at Figure 4. Furthermore, the rod-like shape morphology of F1 and F2 fibers reproduced from micro-CT are equivalent to morphology observed from SEM (Figure 5).
Fibers’ orientation of F2-10. Fibers were color-coded according to their main orientation in relation to the Z-axis. (a) Light blue: 0–18°, (b) dark blue: 18–36°, (c) red: 36–54°, (d) green: 54–72° and (e) yellow: 72–90°.

3D images of analyzed samples (volume of 1.0 × 1.0 × 1.0 mm³) of NBR/Rockwool composites: (a) F1–10, (b) F1–25, (c) F1–40, (d) F2–10, (e) F2–25, (f) F2–40.
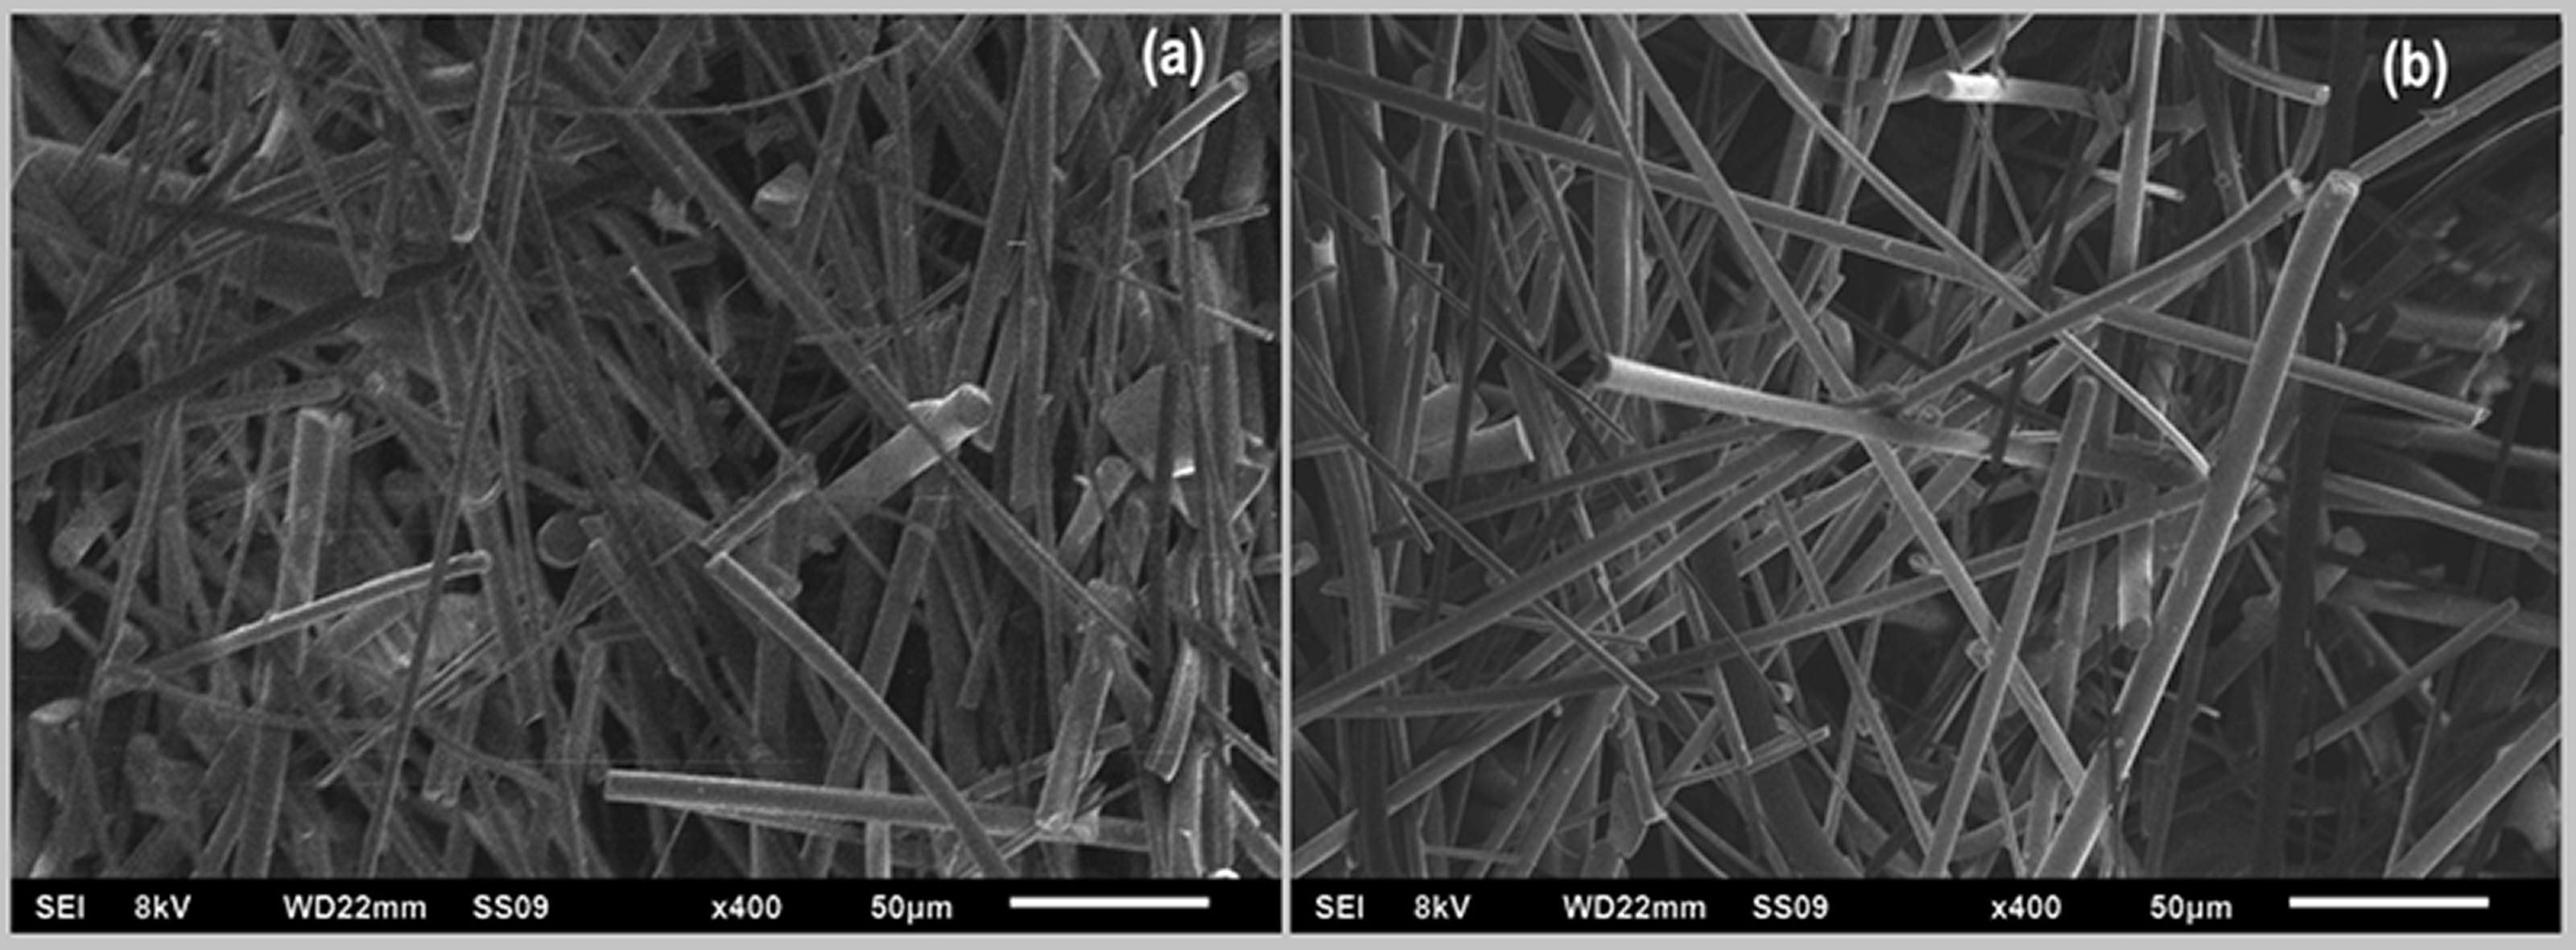
Morphology observed via SEM (50 µm) of Fibers F1 (a) and F2 (b). (Reproduced and adapted with permission from da Rocha et al. 12 ).
The computational processing method was used to assess the three-dimensional structure of the fibers, which allowed the quantification of some important morphometric parameters of the fibers in the rubber matrix, as summarized in Table 3.
Fiber morphometric parameters attained from micro-CT.
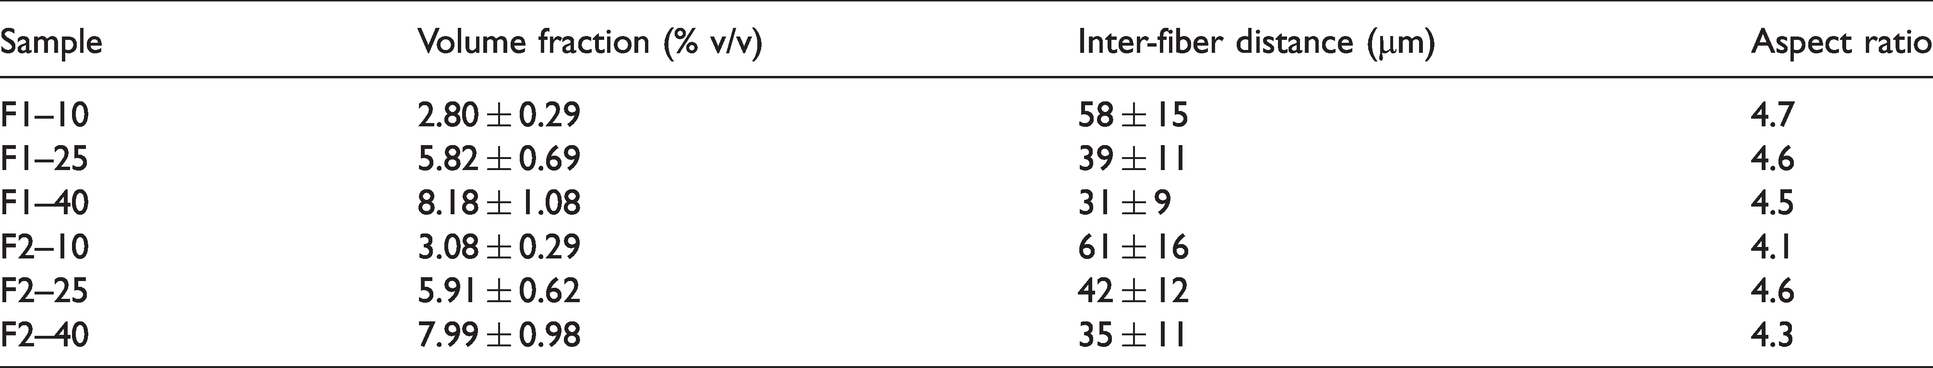
The precise quantification of fiber or filler volume fraction in the composites is useful because it plays an important role in predicting mechanical properties. 16 The volume fraction is calculated from the segmented fibers by counting the voxels labeled as fibers and the total amount of voxels inside the 1 x 1 x 1 mm3 sample volume that has been investigated. A global Otsu’s thresholding was used for labeling the fibers. 17 No difference in volume fraction values between the NBR composites with the same F1 and F2 fiber content were observed. This result was expected since we used identical amounts of F1 and F2 in the NBR composites, and they have the same nominal length.
The inter-fiber distance values comparison between pairs of samples (F1-10 vs F2-10, F1-25 vs F2-25, and F1-40 vs F2-40) indicates a similar distribution of F1 and F2 in the NBR matrix. On the other hand, it is observed that the most significant reduction (around 30%) of inter-fiber distance values happened when the fiber content was risen from 10 to 25 phr, regardless the type.
Along with the volume fraction, the fibers aspect ratio is also a key parameter that affects the mechanical properties of the composites. The aspect ratio is also referred to as Feret Shape, which is the ratio between the length and the width of the fibers (refers to the Image analysis of rubber composite section). Figure 6 presents the graphs of the aspect ratio frequency distribution for all composites. A strong positive distribution asymmetry is observed for all histograms allowing the aspect ratio data to be adjusted to a lognormal distribution (lognormal means values shown in Table 3). According to the literature, 18 some extension of the fibers can be broken down during the mixing step due to high shear rate action, which decreases the aspect ratio. Therefore, since no significant aspect ratio values differences are observed (Table 3) regardless the content and type of fibers, one can assume that both F1 and F2 fibers behaved the same way during the processing.
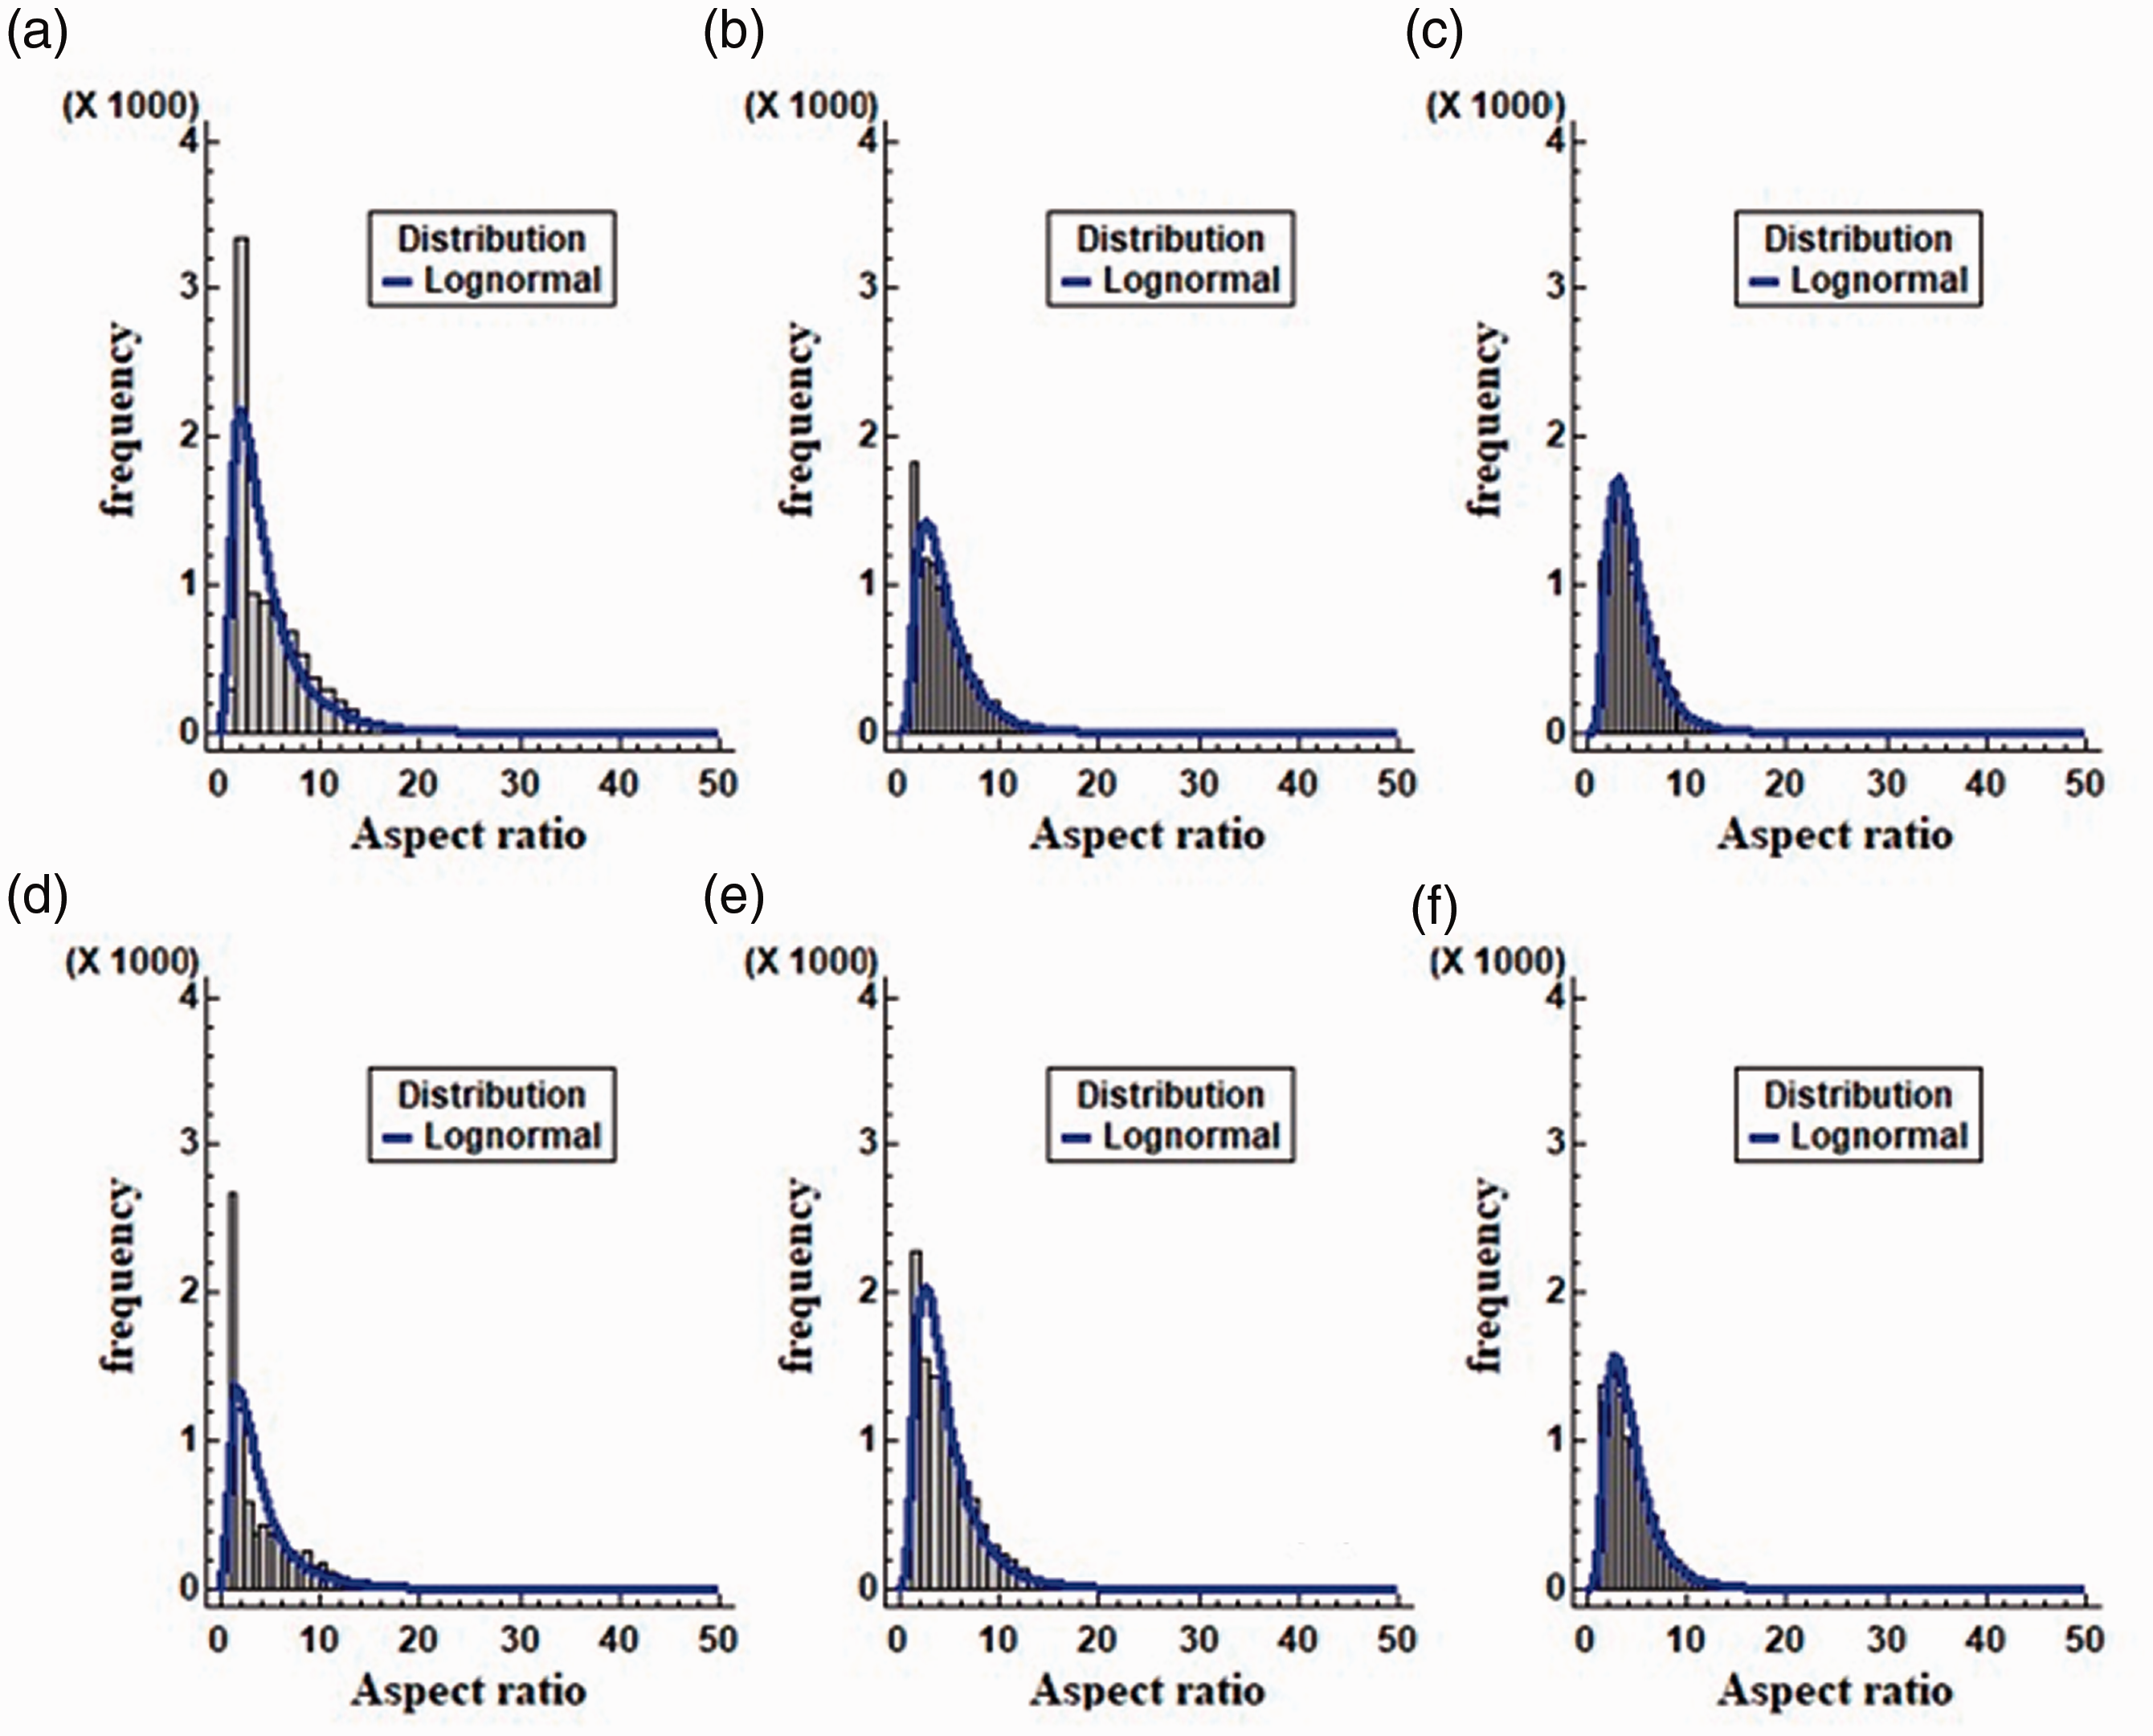
Aspect ratio histogram graph and fitted lognormal distribution (blue line). NBR composites filled with (a) 10 phr of F1, (b) 25 phr of F1, (c) 40 phr of F1, (d) 10 phr of F2, (e) 25 phr of F2, and (f) 40 phr of F2.
Rockwool fibers are added to the rubber matrix to contribute to the reinforcement of the material improving its final properties. The presence of solid particles in the rubber matrix can alter the final properties of the product, mostly the mechanical behavior. 19 However, the degree of reinforcement generated by that solid particle is dependent on some important parameters, such as: aspect ratio, volume fraction, distribution, orientation, and interfacial interaction with rubber matrix. 20 Thus, data of morphometric parameters quantified from micro-CT (Table 3) are useful to support the rheological investigation described in the next section.
Rheological behavior investigation
The storage modulus (G’) evolution as function of frequency for the NBR composites with F1 (Figure 7(a)) and F2 (Figure 7(b)) are shown in Figure 7. The unfilled NBR data is also included in Figure 7, which helps to investigate the effect of the fibers content and type on the composite’s rheological behavior.
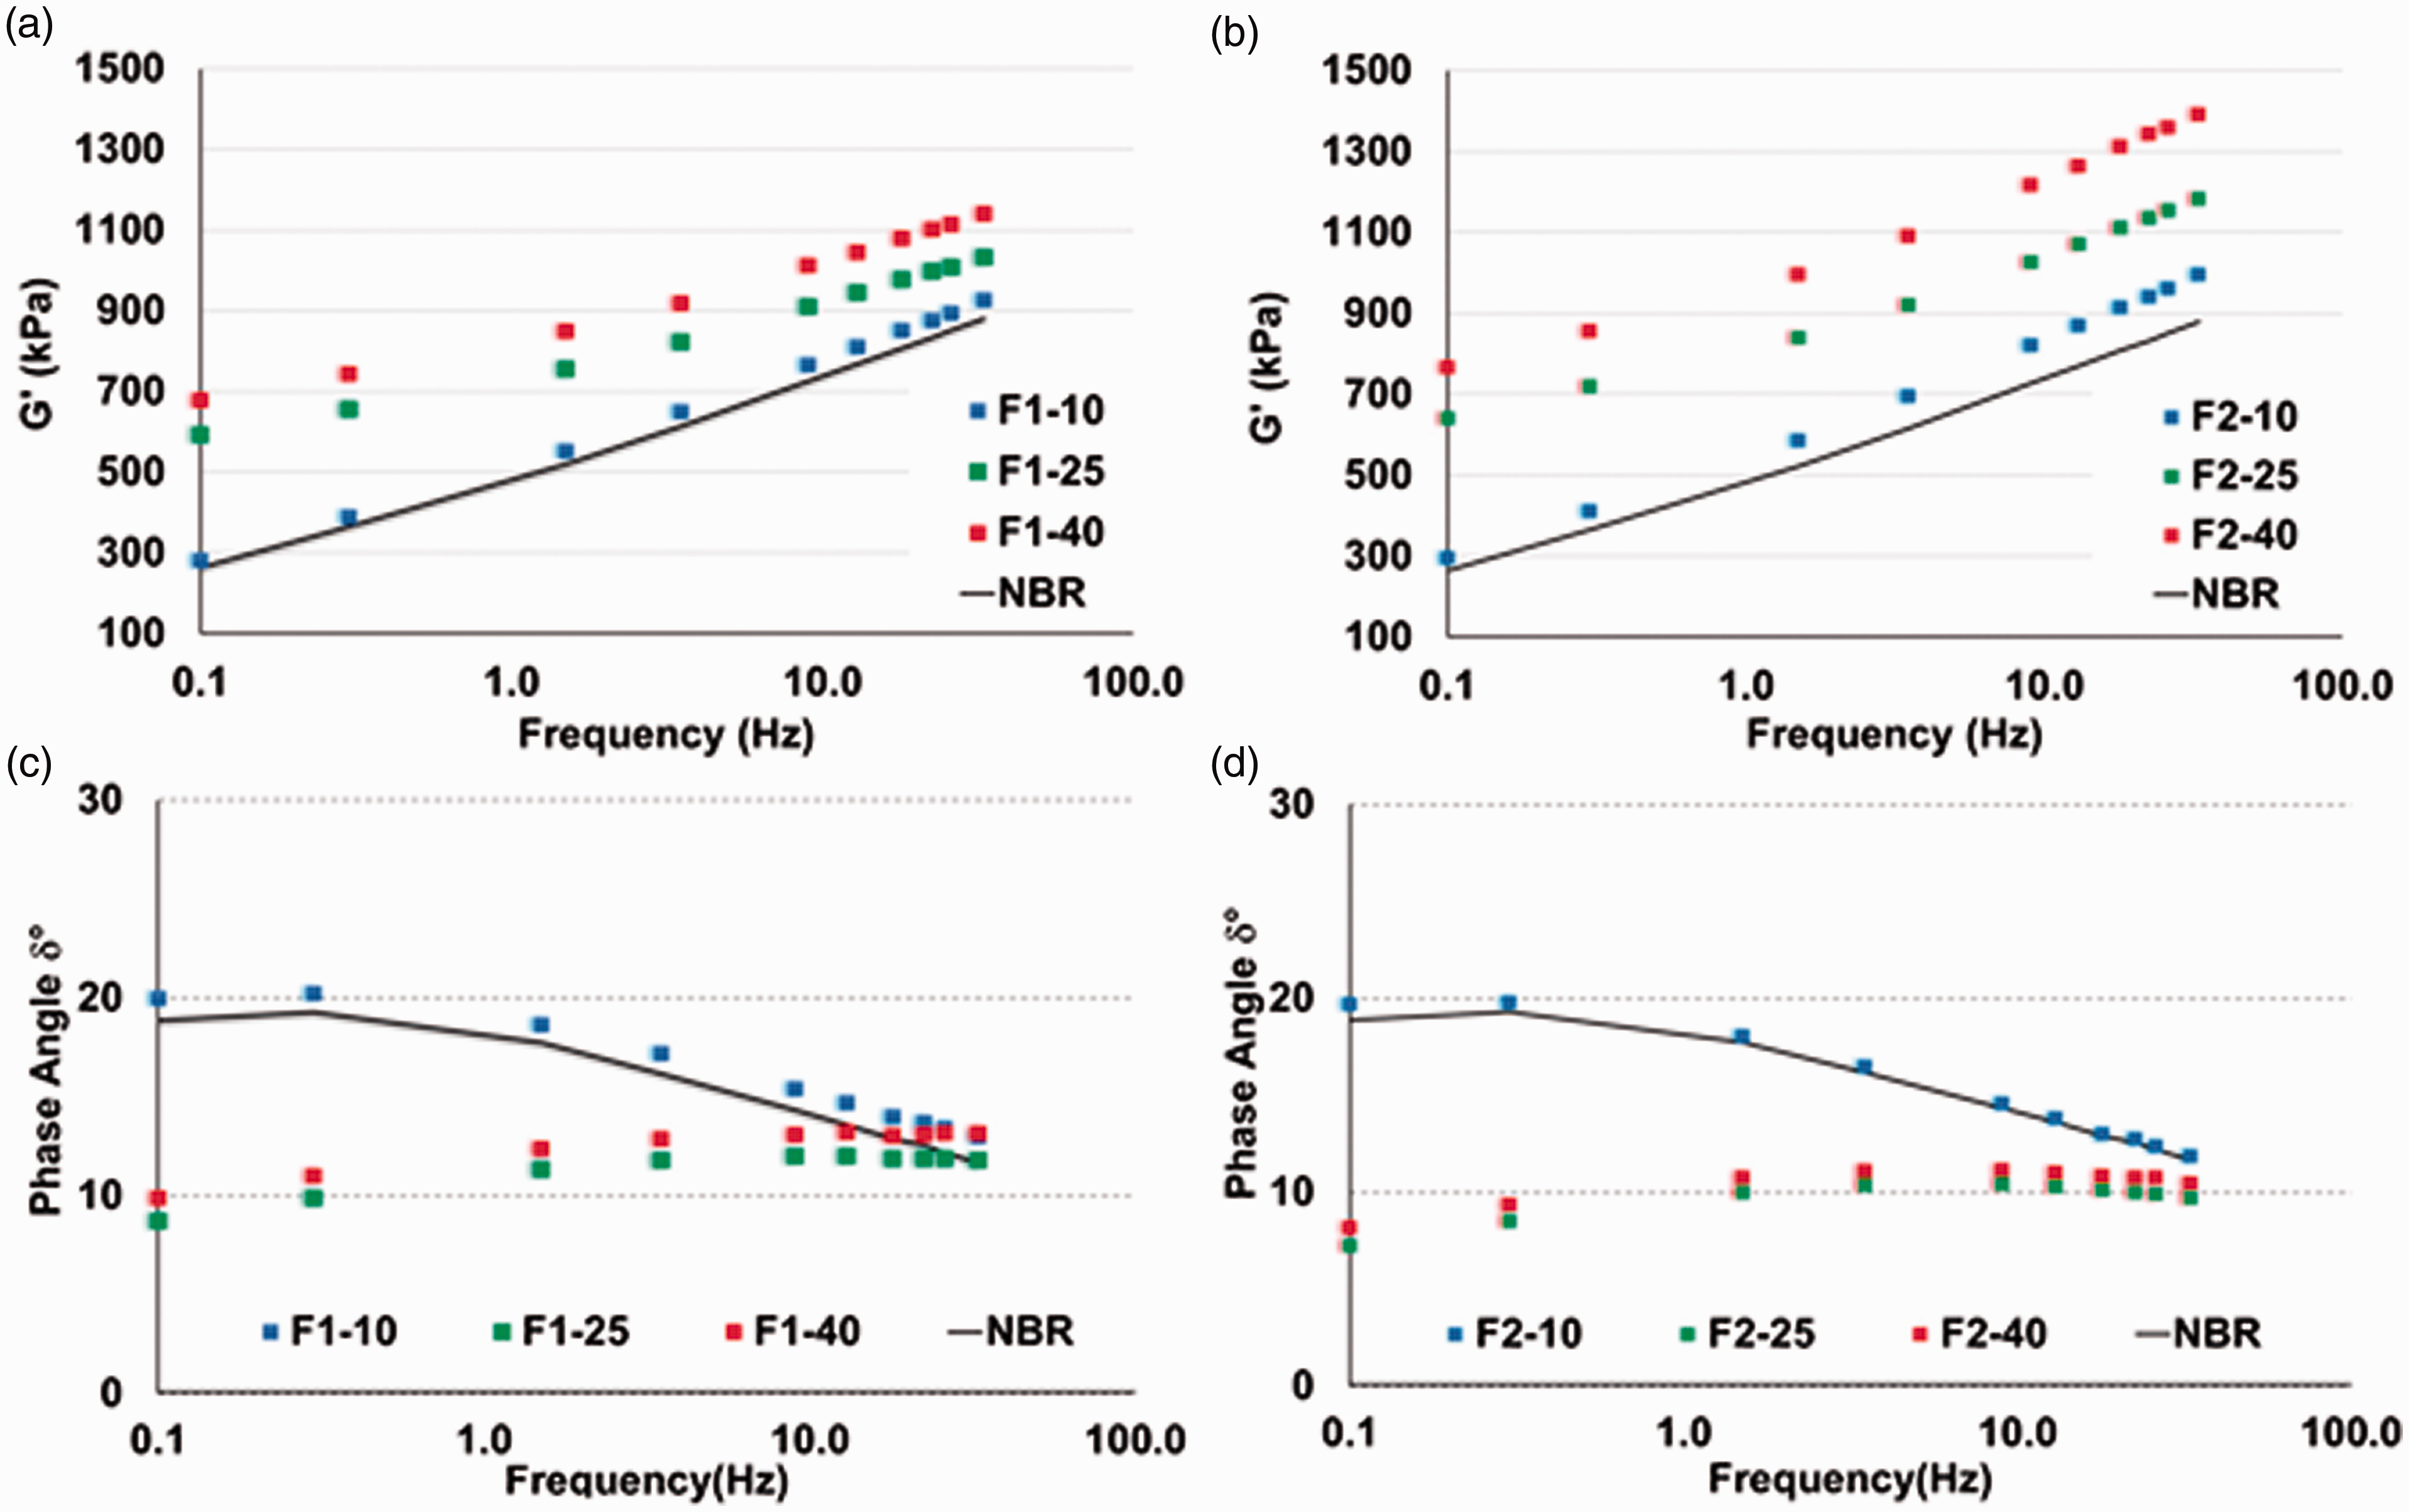
Storage modulus (a, b) and phase angle (c, d) versus frequency for unfilled NBR (— black line) and NBR composites filled with F1 (a, c) and F2 (b, d) rockwool fibers (strain amplitude: 7%, temperature: 60 °C).
The comparison between the curves on Figure 7(a) and (b) reveals that all samples presented a weak G’ increase as the frequency is raised, which is a typical rubber composite behavior. When rubber materials are stressed at high frequency, the time for its chains to relax from alignment decreases, resulting in a more pronounced elastic behavior. However, the small increase in G’ as the frequency is raised happens due to the restriction caused mainly by crosslinks present in the vulcanized rubber chains.21,22
Although the composites with 40 phr (F1-40 and F2-40, Figure 7(a) and (b)) showed the highest values of G’, the most significant moduli increment was observed when the fiber content was risen from 10 to 25 phr, regardless of the type. This effect of fiber content on the rheological behavior can also be verified through the comparison among the phase angle δ values shown in Figure 7(c) and (d). It is possible to observe a reduction around 10° in the phase angle δ values at frequencies lower than 1.0 Hz when the fiber content was risen from 10 to 25 phr. The elastic behavior of the composite is more pronounced when the phase angle δ is closest to zero. 23 It is worth mentioning that the rheological behavior and the inter-fiber distance values (Table 3) followed a similar trend regarding the fiber content (as a consequence to the volume fraction). According to Staniewicz et al., 24 there is a volume fraction limit, and so an inter-particle spacing limit, at which a percolating network of fillers can be formed causing a significant change in the mechanical properties of rubber composites. Therefore, one can suppose that when the rockwool fiber volume fraction is near to 6% (around 25 phr), or inter-particle spacing close to 40 µm (see Table 3), a percolating network of fibers inside the rubber matrix may be formed.
In relation to the fiber type, the comparison between the graphs in Figure 7(a) and (b) indicates that the F2 samples have higher G’ values than the F1 samples in the entire frequency range applied. Aiming to compare the reinforcement effect of those fibers, the experimental data of the elastic modulus at the frequency of 1 Hz were compared to the respective values predicted by the modified Guth-Gold equation (equation (1)). This model was developed considering rod-like filler particles embedded in a continuous matrix
25

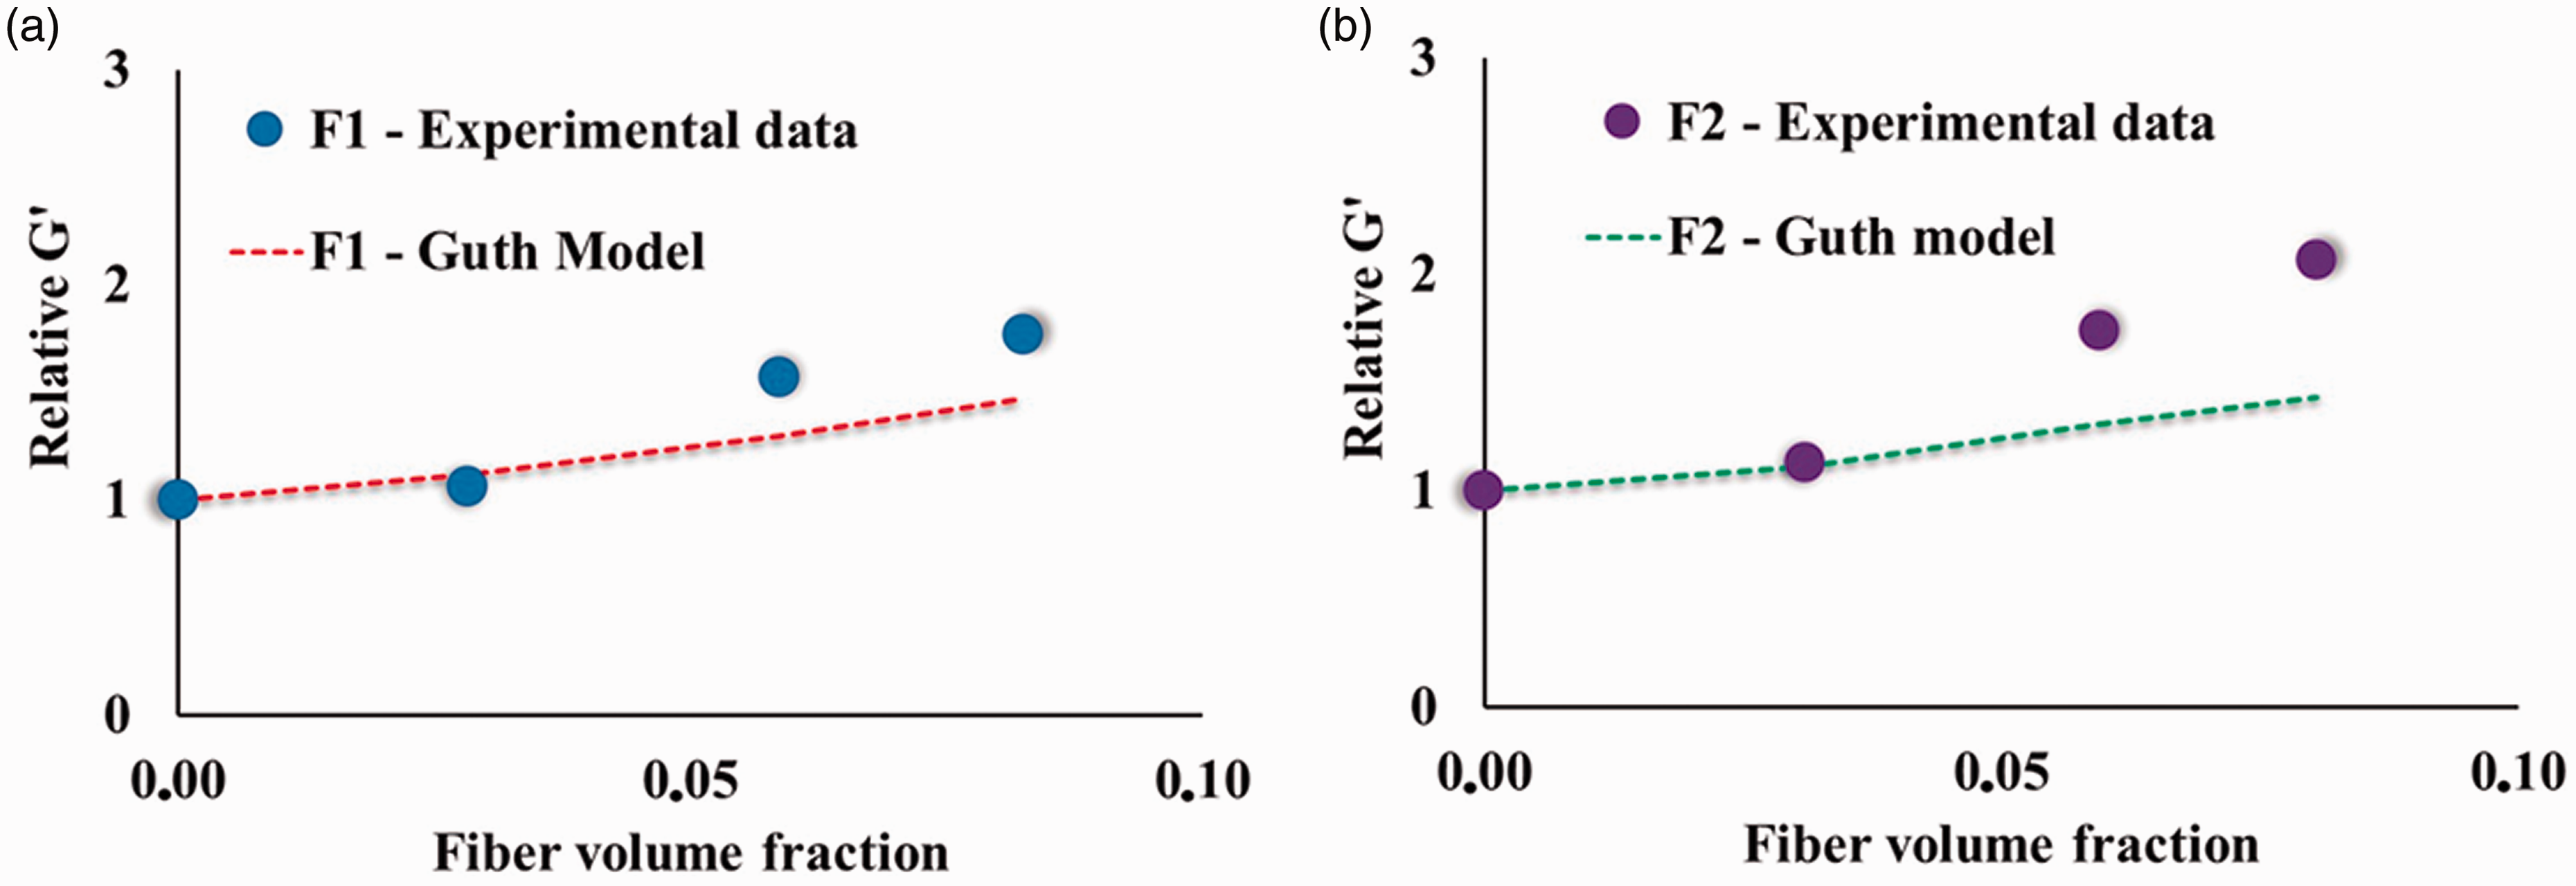
Relative storage modulus (G′) versus fiber volume fraction dependence: Experimental data and theoretical values calculated by Guth model of NBR composites with F1 (a) and F2 (b).
Significant agreement between the experimental data and the respective predicted values were observed for the volume fraction related to 10 phr for both F1 and F2 fibers (Figure 8(a) and (b)). Above this level, the experimental data deviated positively from the theoretical ones, being the most pronounced difference observed for the rubber composites with F2. This result corroborates that F2 has higher reinforcement effectiveness than F1, producing a rubber composite stiffer than the theoretical prediction.
A non-agreement of experimental data and the theoretical Guth-Gold model for carbon black at high volume fraction was also reported by Fukahori et al. 26 The Authors stated that Guth-Gold model is applicable when particles are dispersed from each other in a rubber matrix, behaving almost independently. In this study, the authors proposed a Guth-Gold equation modification that considers the carbon black interaction with the rubber chains, forming a layer of immobilized rubber chains surrounded by filler aggregates, which contributes to increase the actual filler volume fraction (effective volume fraction), and also that the aggregates of carbon black are connected to each other, behaving as a continuous network structure.
The rockwool F2 fiber type is modified with a silane coating, which promotes a better interaction between fibers and rubber. Indeed, this NBR-F2 chemical interaction was evidenced by scanning electron microscopy in our previous paper, as shown in Figure 9 for the composites with 25phr. 12
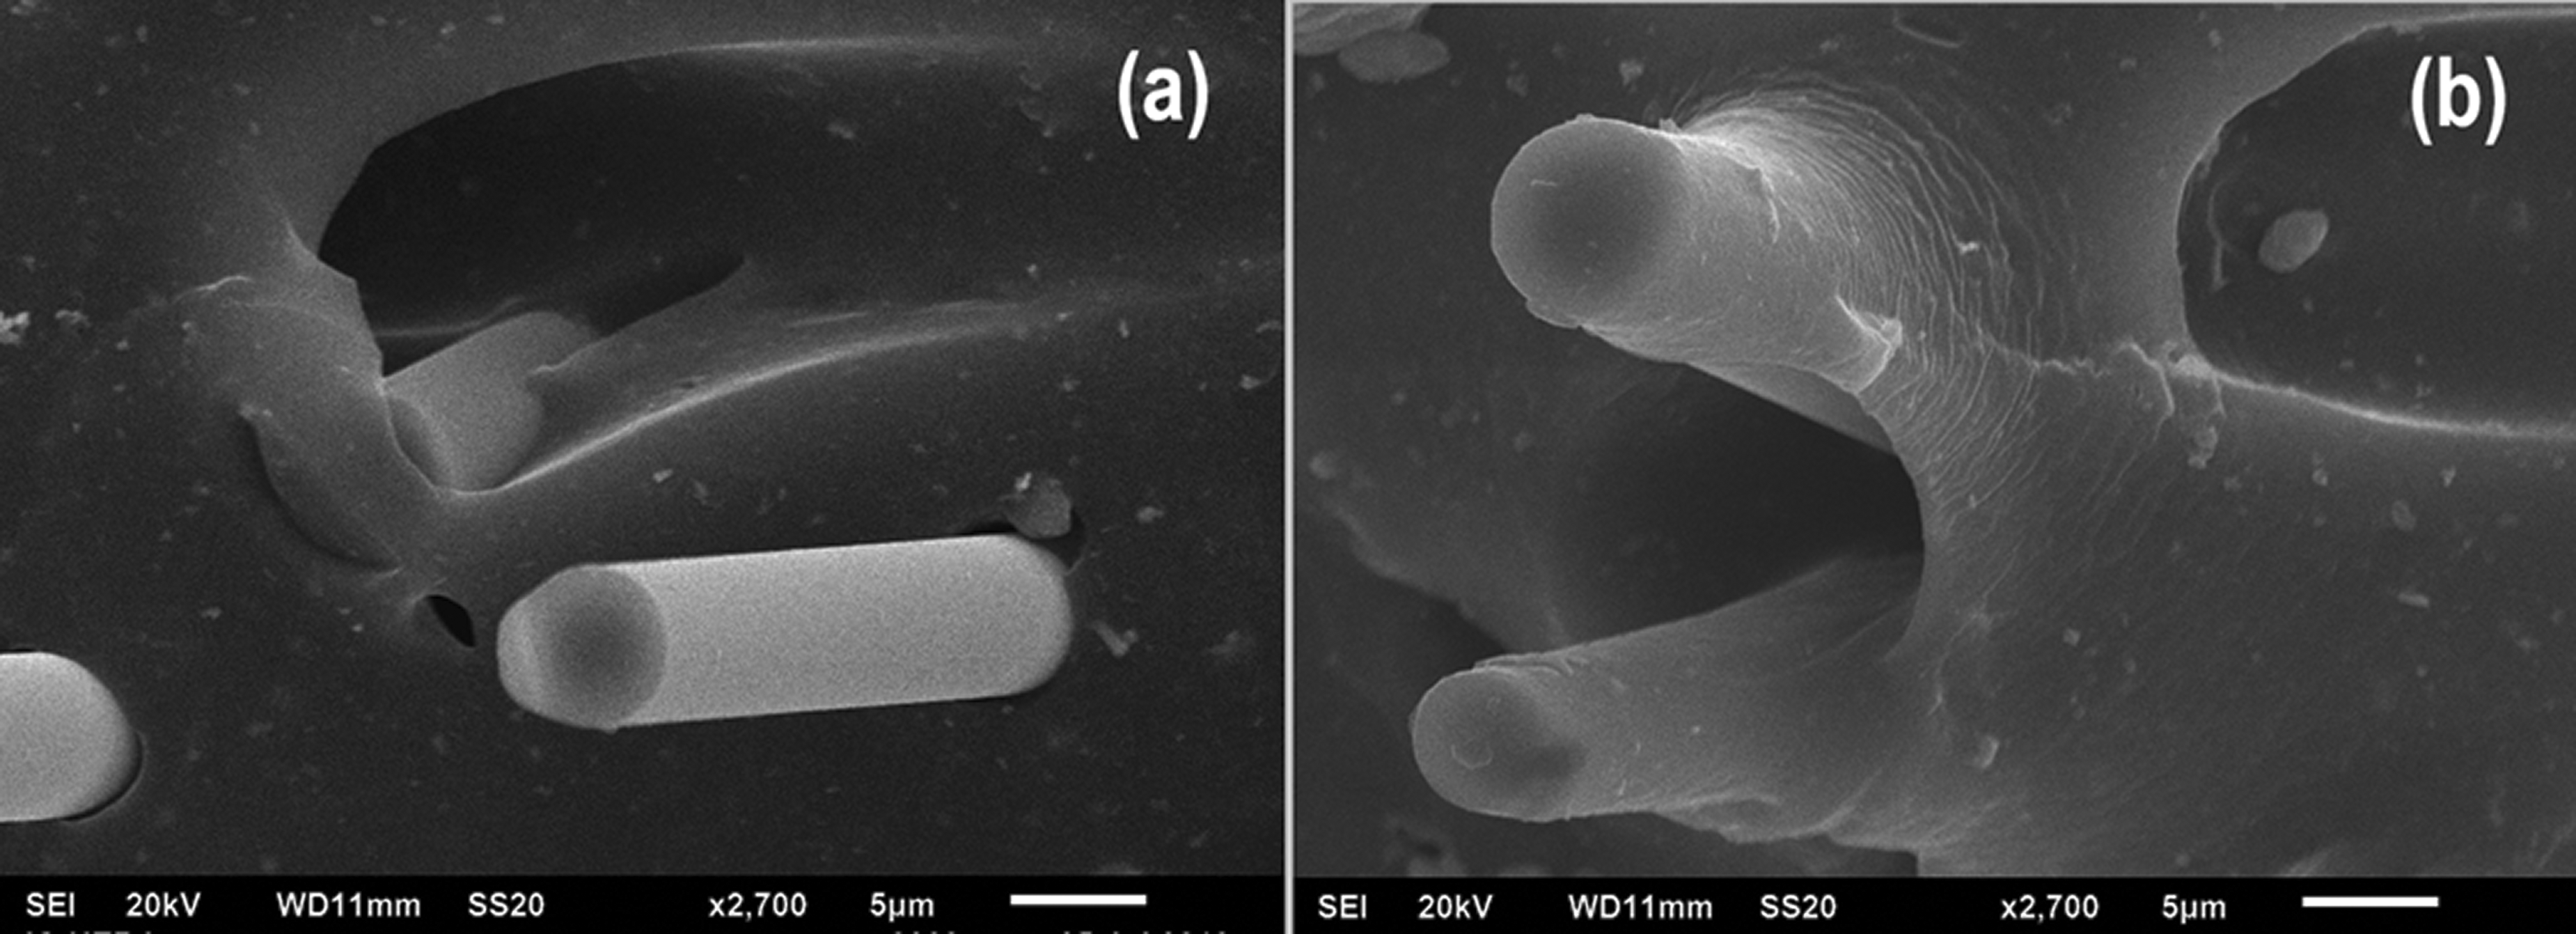
Fractured surface morphology observed via SEM (5 µm) of F1-25 (a) and F2-25 (b). (Reproduced and adapted with permission from da Rocha et al. 12 ).
Furthermore, as previous discussed, the assessment of the fiber content indicated that a percolating network occurred (fiber volume fraction about 6%, 25 phr), causing a restriction of the rubber chains around F1 and F2 fibers. Therefore, based on the Fukahori et al.
26
paper, the equation (1) was rewritten replacing the volume fraction (φ) by the effective volume fraction (φeff), and introducing a third power of φ, as shown in equation (2)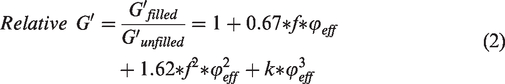
The immobilized rubber portion in contact with the rockwool fibers causes this increase in volume fraction, thus the effective volume fraction (φeff) is higher when the interface between fiber and rubber matrix is stronger. Since the F1 does not contain a silane-treated surface, no chemical interaction between F1 and NBR are formed, as shown in Figure 9(a), therefore, it is assumed that R = 1 (φeff = φ) for NBR/F1 composites. On the other hand, as shown in Figure 9(b), a chemical interaction of F2 and NBR exists creating a layer of immobilized rubber around the fibers, therefore it is expected that R value >1 for NBR/F2 composites. Regarding the k value, this study postulates that it is associated to the reinforcement produced by the continuous-network structure of the fibers into the rubber matrix. Considering the similarity of the 3-dimensional network-structure of F1 and F2 fibers (Figure 4), as well as their aspect ratios and inter-fiber distances (Table 3) obtained from Micro-CT analysis, and similar mechanical properties (Table 1), it is assumed that the k value for NBR/F1 and NBR/F2 should be the same. Thus, based on the two above premises, k and R values were calculated in order to adjust the experimental data to the equation (2). As shown in Figure 10, the agreement of experimental data (○ symbol) to the predicted (dashed line) was achieved to the values of R values of 1 and 1.25 for F1 and F2, respectively, and K of 554 for both fibers.
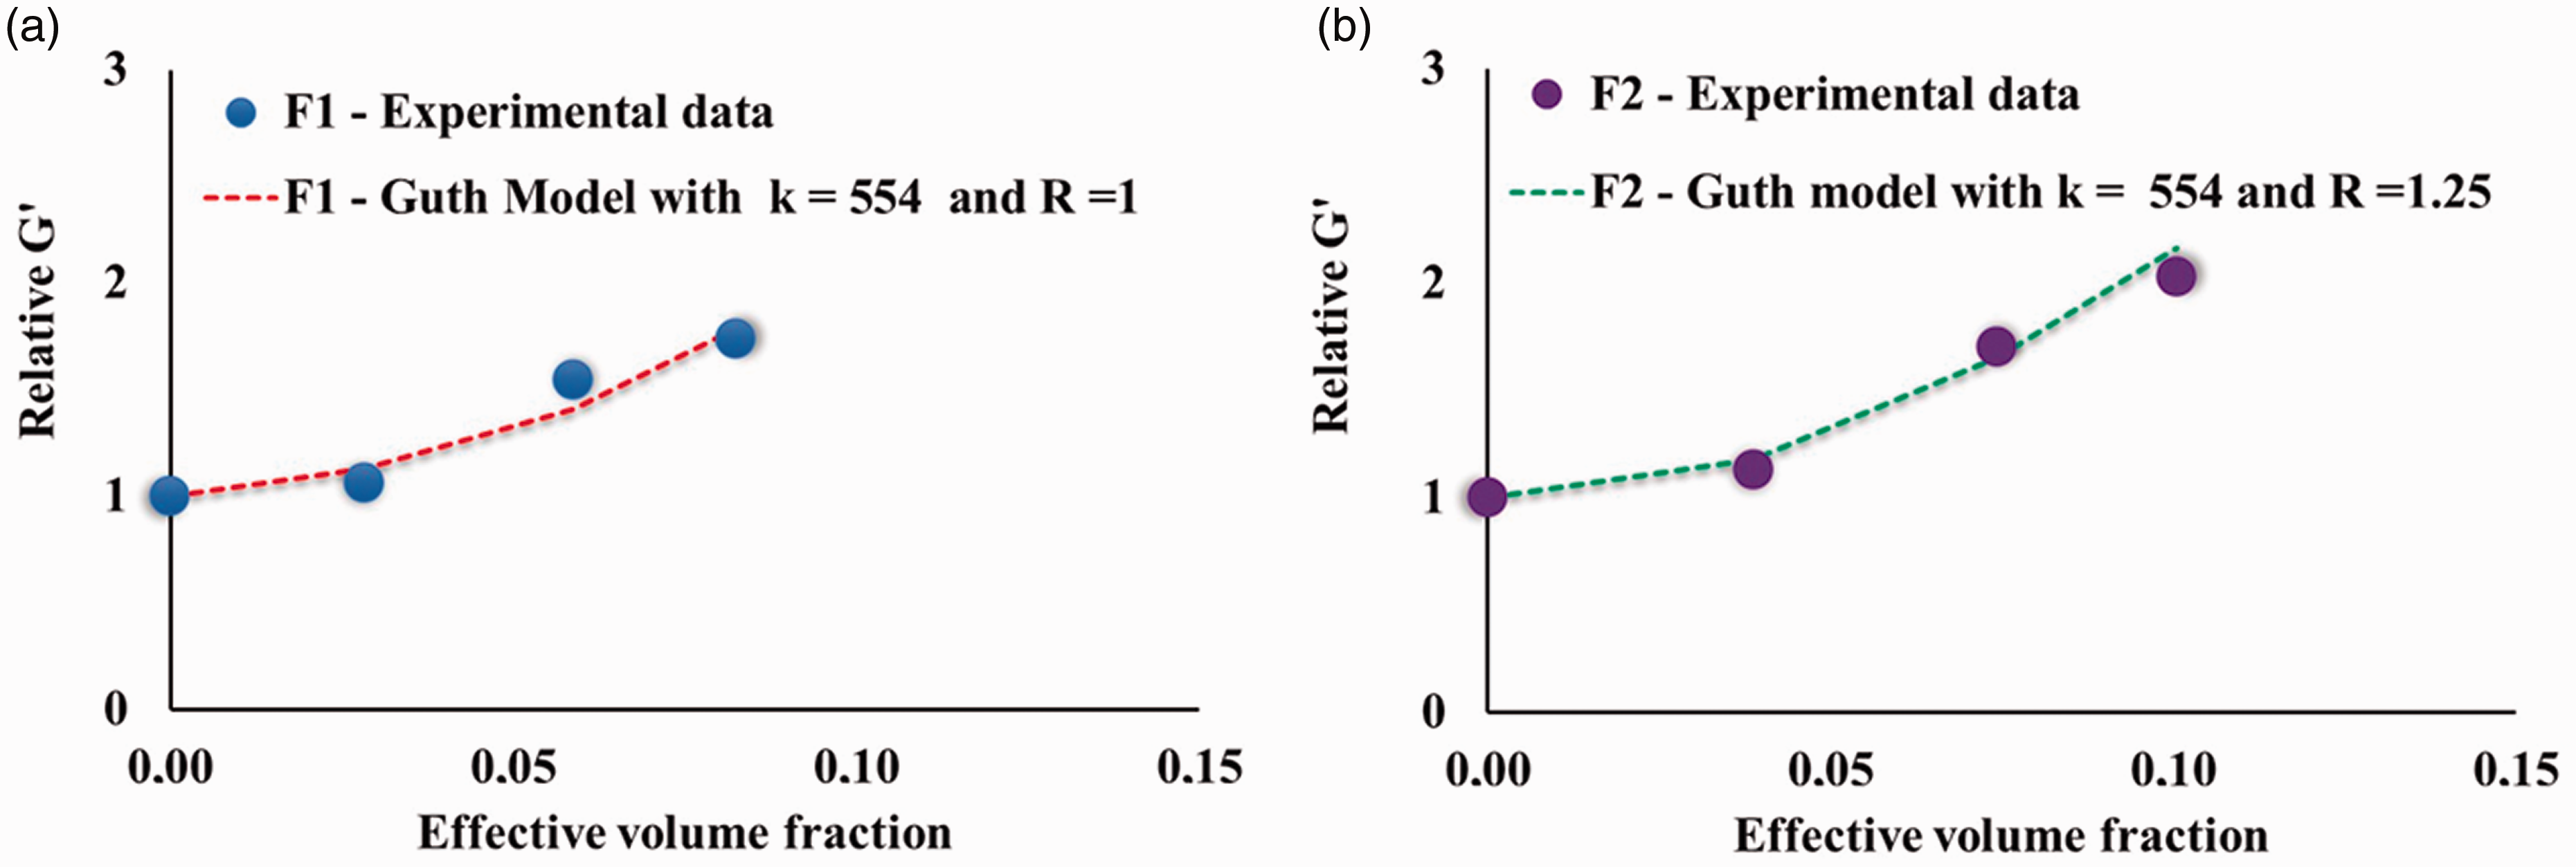
Relative storage modulus versus effective volume fraction dependence: Experimental data and theoretical values calculated by equation (2) of NBR composites with F1 (a) and F2 (b).
Conclusions
Nitrile rubber/Rockwool fibers composites were successfully analyzed by micro-computed tomography. The 3D images allowed visualizing that both F1 and F2 fibers were well-distributed in the NBR matrix, however without a preferential orientation. The morphometric parameters of the fibers were quantified from the data generated from micro-CT. The results showed that both F1 and F2 had the same trend of values for volume fraction, inter-fiber distance, and aspect ratio values. On the other hand, both volume fraction and inter-fiber distance showed a fiber content dependence. Furthermore, an increase of fiber content from 10 to 25 phr produced a substantial reduction of the inter-fiber distance values. Similar behaviors were also observed for elastic modulus and phase angle δ in the rheological behavior analysis. These results supported the idea that a percolation network of rockwool fibers occurred when fiber volume fraction was near 6% (around 25 phr), or the inter-particle spacing close to 40 µm. The experimental elastic modulus data of the NBR/F1 and NBR/F2 composites were compared with the theoretical values of the Guth-Gold and modified-Guth-Gold equations using the volume fraction and the aspect ratio data obtained from the micro-computed tomography. This analysis allowed a better understanding of the reinforcement effects of F1 and F2 fibers, showing that both fibers have reinforcing capabilities, although this character is more pronounced for the F2 due to its chemical interaction with rubber, as shown in SEM micrograph.
Supplemental Material
sj-pdf-1-jcm-10.1177_00219983211033886 - Supplemental material for Quantitative micro-computed tomography analysis and rheological investigation of Nitrile rubber/Rockwool composites
Supplemental material, sj-pdf-1-jcm-10.1177_00219983211033886 for Quantitative micro-computed tomography analysis and rheological investigation of Nitrile rubber/Rockwool composites by Elisson BD da Rocha, Ana Maria F de Sousa, Ana Lúcia N da Silva, Cristina RG Furtado, Marcos V Colaço and Liebert P Nogueira in Journal of Composite Materials
Footnotes
Authors’ contributions
E. B. D. da Rocha performed in the conceptualization, investigation, formal analysis of rheological data, and original draft writing. A. M. F. de Sousa involved in the conceptualization, rheological data analysis, review writing and editing. A. L. N. da Silva involved in rheological data validation, review writing and editing. C. R. G. Furtado involved in conceptualization, review writing and editing. M. V. Colaço performed in conceptualization, formal analysis of micro-tomography, review writing and editing. L. P. Nogueira performed in conceptualization, methodology, and formal analysis of micro-tomography, review writing and editing. All authors have read and approved the final version of the manuscript.
Acknowledgment
The authors thank Nitriflex and Lapinus for donating the raw materials.
Declaration of Conflicting Interests
The author(s) declared no potential conflicts of interest with respect to the research, authorship, and/or publication of this article.
Funding
The author(s) disclosed receipt of the following financial support for the research, authorship, and/or publication of this article: Conselho Nacional de Desenvolvimento Científico e Tecnológico (CNPQ, 306171/2018-0, 305007/2018-1) and Fundação de Amparo à Pesquisa do Estado do Rio de Janeiro (FAPERJ, E-26/010.001927/2019).
References
Supplementary Material
Please find the following supplemental material available below.
For Open Access articles published under a Creative Commons License, all supplemental material carries the same license as the article it is associated with.
For non-Open Access articles published, all supplemental material carries a non-exclusive license, and permission requests for re-use of supplemental material or any part of supplemental material shall be sent directly to the copyright owner as specified in the copyright notice associated with the article.