
Abstract
This paper investigates the mechanical properties and microstructure of additively manufactured, continuous fiber reinforced composites made by the Continuous Fiber 3D Printing (CF3D®) process. We specifically investigate composites of GF-2, a high temperature thermosetting acrylic polymer, and T-1100, a high strength carbon fiber, with a 41.5% fiber volume fraction. The resulting composites have a longitudinal tensile modulus of 122 GPa and a strength of 1599 MPa, which is 89% and 55% of the theoretical value by rule of mixtures, respectively. This appears to be the highest strength additively manufactured composites to date, largely due to the high mechanical properties of the T-1100 fiber, low defects, and substantial fiber volume fraction. Comparable results are obtained for a cationic cure resin, CATPRO14. We optically measured the fiber–fiber contact surface area fraction of GF-2 and employing the unidirectional strength model of Karam to predict a strength efficiency of 0.6, which is in good agreement with mechanical estimate of 0.55. Comparing results with the efficiency factors of high fiber volume prepreg laminates, we determine the printing process yields composites with 88%–95% of the anticipated longitudinal modulus and 65%–70% of the anticipated longitudinal tensile strength of those processed by traditional methods. To extend the printing to multifunctional microvascular composites, we consider the mechanical implications of including sacrificial filaments of 100–300 μm within each tow. A modest decrease in longitudinal strength in proportion to the microchannel volume fraction is predicted, where the decrease is mainly attributed to the increased fiber-to-fiber interactions in more tightly packed tows.
Keywords
(1) Using an emerging additive manufacturing process called CF3D®, dry fibers tows are impregnated in situ with low viscosity resin, deposited onto a surface, UV-cured, and then thermally post-cured to create unidirectional composite panels. (2) The mechanical properties of the additively printed composites panels have the highest longitudinal strength to date and are approaching that of traditional manufactured composites. (3) The panel microstructure is analyzed and the mechanical property implications of incorporating sacrificial filaments into tows to create multifunctional microvascular composite was calculated to be proportional to the microchannel volume fraction.
Introduction
Additive manufactured of continuous fiber composites
Additive Manufacturing (AM) has grown substantially for metals and polymers. However, additive printing of structural, continuous fiber reinforced polymer composites is just emerging. Structural composites are attractive for many aerospace, automotive, and sporting good applications due to their high specific stiffness and strength, as well as their fatigue and corrosion resistance. AM of these materials would enable substantial increases in design and manufacturing complexity, flexibility, and speed. It would also enable accelerated prototyping of advanced structures with improved structurally efficiency, multifunctionality, and adaptivity. Several existing automated composite manufacturing methods like automated fiber placement (AFP), filament winding, and other processes can be considered “additive” because they rely upon sequentially adding layers of fiber and resin and then consolidating to produce laminates. For the purposes of this paper, we define additive manufactured (AM) composites as specifically referring to the automated and computer-controlled deposition of resin impregnated tows containing continuous fibers to produce net-shape polymer composites.
The polymer matrix of an additively printed continuous fiber composites are typically either melt-processible thermoplastics or a reactive resin that are thermal or radiation cured. Additive printing of thermoplastic composites has been explored to a larger extent than reactive polymer matrices. Thermoplastic composite processing involves the extrusion of impregnated tows through a heated nozzle and adhesion to subsequent layers to form three-dimension structures. 1 The amount of flow of the thermoplastic can often be limited and result in voids at the interstices of the filaments which decreases mechanical properties. 2 Some researchers have reduced the voids and achieved high mechanical properties by hot isostatic pressing after printing. 3 For semi-crystalline thermoplastic polymers, the complex time–temperature history of deposition and consolidation can lead to differences in the degree of crystallinity and variation in mechanical properties and residual stress. In contrast with thermosetting resins like epoxies, thermoplastics matrices typically do not form strong interfacial bonds between the carbon fiber and matrix which can compromise mechanical properties. The result is that continuous fiber thermoplastic composites have much lower properties than theoretically predicted. Authors of a recent review speculate that these lower values are due to non-optimal processing conditions, fiber damage occurring during processing, and void formation from poor fiber-matrix interfacial strength. 1
In contrast to thermoplastic matrices, cross-linked polymer matrices typically have higher temperature stability and higher resistance to environmental degradation, thermoxidation, and creep. Due to the lower viscosity of the unreacted materials, resin can be easily impregnation into tows of dry fiber – often assisted by capillary forces. 4 A highly compliant impregnated tow can be formed and deposited. The compliant tow molds to previously deposited tows to form a well-nested microstructure with low void fraction. Subsequent curing of the resin fixes the final shape to create a composite with complex shape and desirable mechanical properties.
Deposition of filaments of continuous carbon fiber and unreactive polymer
The mechanical properties of the impregnated tow will dictate how the filament must be handled during deposition and the final geometry that the deposited filament achieves. A rigid impregnated tow is easily transported through a deposition head by mechanical means. However, a compliant tow allows for flexibility in the deposited shape including tight radii, high in-fill, and interdiffusion of adjacent filaments. In Fused Filament Fabrication (FFF), a rigid polymer filament is mechanically fed into a heated nozzle and then made compliant by taking the polymer matrix well above its glass transition temperature (and melt temperature, if semicrystalline). For printing continuous fiber composites, a rigid filament of continuous fiber and polymer below its glass transition can be fed into a heated nozzle for both thermoplastic 1 and pre-impregnated thermosetting tows.5,6 While pre-impregnation of dry tows to form a rigid filament is one of the most common polymer additive approaches, it does require a separate processing step, control over the filament diameter, and added material cost and time.
In contrast to pre-manufacturing filaments, in situ impregnation of polymer into dry tows just before deposition eliminates this separate step and the related cost. In a process called Continuous Tow Steering (CTS), it was shown that by using compliant dry tows one can expand the range of achievable fiber orientations. In CTS, the dry tows were sheared to varying degrees just prior to consolidation with a heated resin film to achieve variable angle tows without wrinkling7,8 and to improve laminate mechanical properties. 9 AFP, which is more widely accepted, deposits wide tapes of pre-impregnated materials but easily wrinkles when the angle of deposition is changed. CTS is considered an alternative to AFP that can change tow angles without wrinkling. Both AFP and CTS laminates required final consolidation and curing via autoclave curing for several hours after deposition. An alternative additive manufacture method for continuous fiber composites that avoids both the pre-manufacturing of pre-impregnated tows and post-printing consolidation by autoclave curing is needed. 10
One promising alternative to pre-manufacturing filaments is to impregnate dry tows in situ with a low viscosity polymer just before deposition of the filament. Then, a high fiber volume fraction, yet compliant, impregnated tow can be deposited and locally cured to achieve the desired printed shape. Assuming a low void microstructure is achieved, autoclave use can be avoided, and full cure can be accomplished via radiation or oven post-curing. If the process is scalable, relevant coupon tests could be directly linked to mechanics of full-scale structures.
Mechanical property prediction of AM composites
For comparison of continuous fiber composites with theoretical values, we use the Rule of Mixtures (RoM). The longitudinal (along the fiber direction) modulus is given by:

The subscripts c, f, and m refer to the modulus (E) and volume fraction (V) of the composite, fiber, and matrix, respectively. The longitudinal RoM provides an upper bound for predicting the tensile properties of unidirectional composites along the fiber direction. While the RoM is a good approximation for the longitudinal tensile modulus of continuous fiber unidirectional lamina, it has been found to significantly overestimate the longitudinal tensile strength. The measured tensile strength is often less than that predicted by the RoM due to several factors, including variability in fiber strength, manufacturing defects such as high void content, poor fiber-matrix interfaces, stress concentration, and microstructural inhomogeneity. As a result, empirical models have been developed that include a knockdown or efficiency factor to correct this overestimation. The general form of these models is:

Karam
11
developed a model in which the knock-down was related to the decrease in fiber-matrix surface area. His efficiency factor (
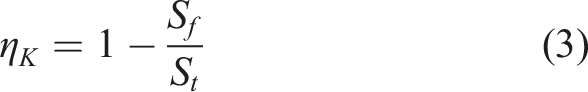
Given that the additive processes are based on the layer-by-layer deposition of resin impregnated tows, microstructural heterogeneity is likely. It is anticipated from other AM processing attempts 12 that the microstructure will consist of three distinct regions: (1) impregnated tows consisting of both fiber and resin, (2) intertow resin regions between layers of stacked tows, and (3) large intertow resin pockets which can occur between adjacent tows in the same deposition layer. This is elaborated in Figures 2 and 12. In this instance, the axial mechanical strength is expected to be dominated by the fiber volume fraction within the deposited impregnated tow.
Because it can be difficult to assign intertow resin regions as belonging to the stacking of tows within (intra) or between (inter) printed layers, we use the relative fiber-to-fiber distance to identify the three previously mentioned regions and then quantify their relative contribution to the longitudinal tensile strength. The matrix and fiber volume fraction are broken into components that include (1) the impregnated fiber tow (V f,tow , V m,intratow ) which has a small fiber-to-fiber distance, (2) the thin intertow pure resin region that surrounds the impregnated fiber tow and has moderate fiber spacing, and (3) the larger intertow resin pockets, which can form between non-overlapping tows in the plane of deposition and has a large fiber–fiber distance.
We then apply this information to the modified RoM calculations. The volume fraction of impregnated tows in the composite is then defined as:


In fiber reinforced polymer composites for which the fiber strength greatly exceeds the matrix strength, the matrix term in equation (5) may be dropped without significantly impacting the predicted strength, as will be shown later in this manuscript:

Materials and methods
Additively manufactured materials and processing
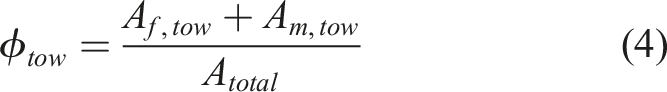
As shown schematically in Figure 1, the CF3D® process involves in situ resin impregnation of dry fiber tows with a low viscosity polymer resin followed by extrusion from a nozzle, deposition onto a build surface, light compression, and then snap-curing to fix the printed shape.
13
The compression roller is used primarily to place the filament. It uses a light compression to reduce distortion of the compliant tow. Resin does not build up on the compression roller. Multiple options and approaches exist for fiber type, polymer resin, snap-curing approach, and post-print processing. For the purposes of this papers, we will focus on the use of carbon fiber reinforcement, UV snap curing, and oven post-curing.
14
CF3D® technology utilizing (a) a Comau robotic arm with (b) the “2019 CF3D V0.6” end effector, (c) a schematic of the process, and (d) tow deposition, wheel compaction, and UV curing. Dry fiber is impregnated with resin inside the end effector, the impregnated tow is deposited onto a part surface via robotic arm, lightly compacted, and then UV cured to form a partially cured composite with fixed shape. The composite is then oven post-cured.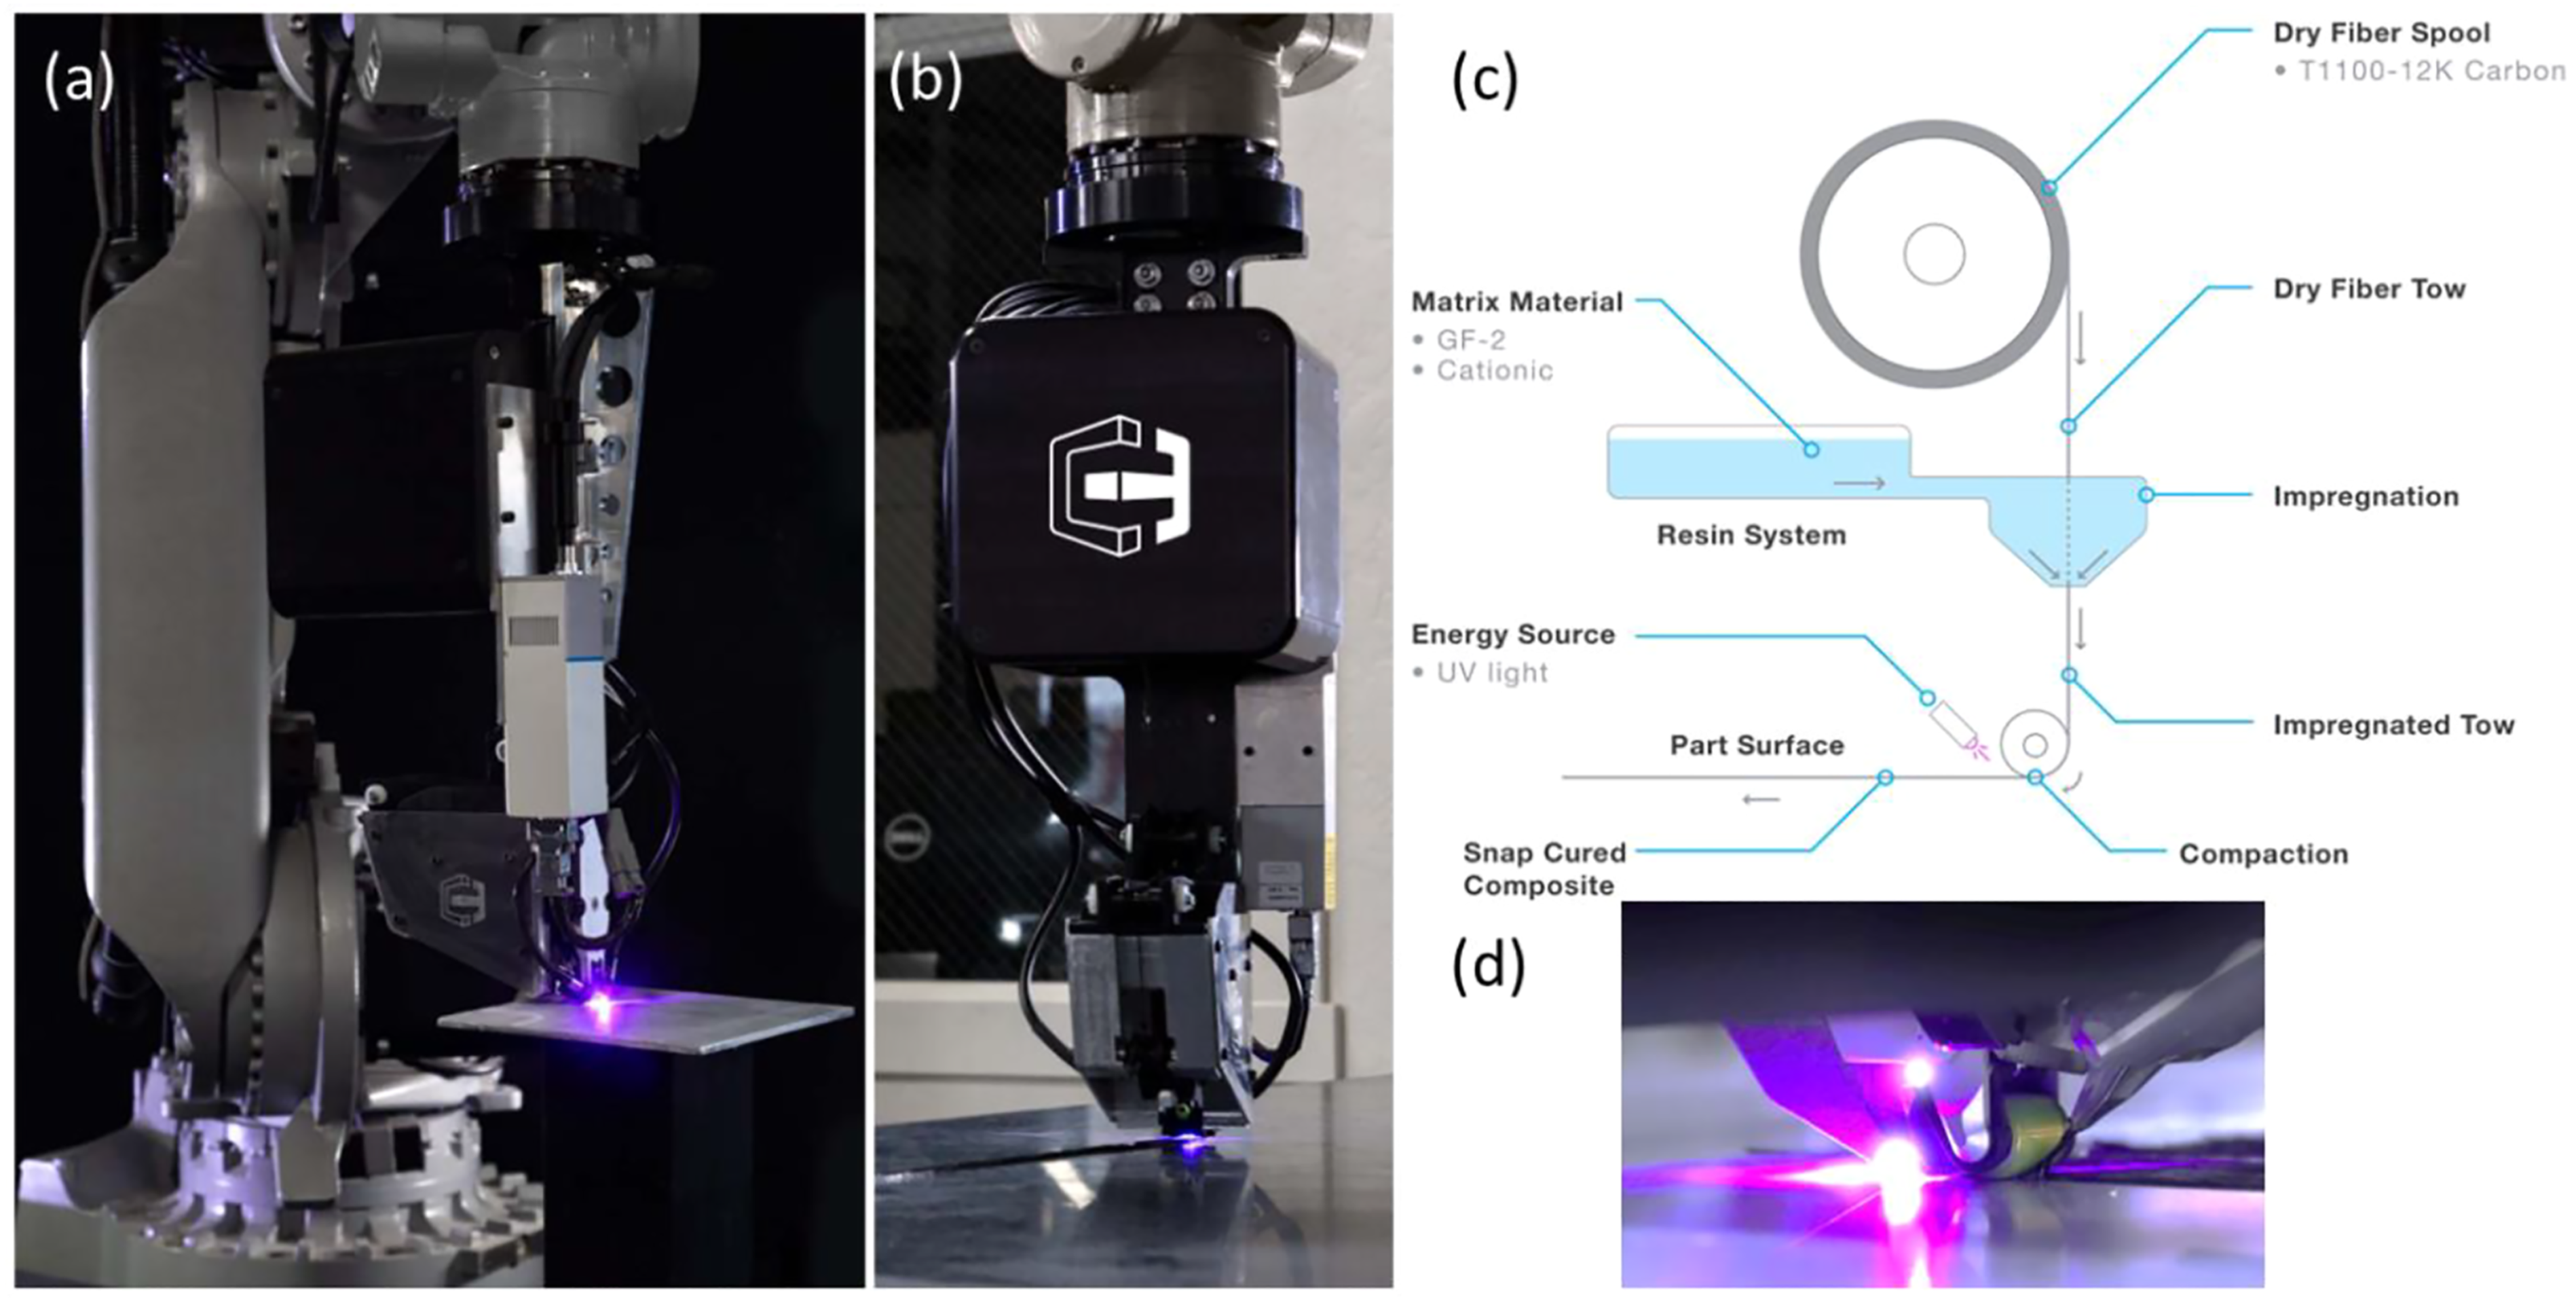
Two photocurable resins were selected for printing with high-strength Toray T-1100 12K carbon fiber tow (T-1100SC-12K-50C). Toray reports the fiber has a tensile modulus of 324 GPa, a tensile strength of 7 GPa, and a strain to failure of 2%. 15 The first resin, GF-2, is a UV-curable acrylic thermoset having a room-temperature viscosity of 500 cP. GF-2 was designed to snap-cure, hold shape during printing and then complete cross-linking during a post-bake at 160°C for two hours. GF-2 was based on a formulation previously shown to yield high-quality glass fiber composites. The GF-2 neat resin had a tensile modulus of 3.7 GPa and a tensile strength of 37 MPa. The second formulation is UV-curable epoxy thermoset that has a cationic cross-linking mechanism. While photo-cationic mechanisms are typically slower than radical cross-linking mechanisms, they have the benefit of forming a “living polymerization,” in which cross-linking can occur indefinitely. If needed, this could possibly negate the need for a post-cure operation in the future. In this instance, we post-cured the CATPRO14 resin using the same method as was used with GF-2, to ensure complete cross-linking. Due to limitations in the availability of uncured resin, neat resin properties of CATPRO14 were not measured. They are assumed to be approximately comparable to GF-2. GF-2 will be the primary focus of the current investigation.
Both resins were processed using an end effector mounted on a Comau robotic arm (Figure 1). The “2019 CF3D V0.6” end effector unit consisted of a spool of dry fiber, a reservoir of resin, the fiber impregnation unit, and mechanisms for the transport and deposition of the impregnated tow. A feed rate of 70 mm/s was used for GF-2 and 60 mm/s for the CATPRO14 resin. Several unidirectional panels with a dimension of roughly 300 mm × 300 mm × 2 mm were fabricated for each resin system. While fiber volume fractions of 60% have been previously achieved with CF3D®, a fiber volume fraction of 40% was targeted for this study.
Physical and thermomechanical measurements
Warpage measurements in the form of a point data cloud were obtained with a Creaform HandySCAN 700 and compared to a reference plane from an STL file. Surface roughness was measured with a Veeco white light interferometer in several small (6 × 6 mm) scanned regions on both top and bottom surfaces. Fiber volume fraction was measured optically by cross-sectional image analysis and confirmed via acid digestion. For acid digestion, three samples from each panel were submerged in heated sulfuric acid for six hours and dried overnight at 100°C under vacuum. The residual fiber mass, fiber density, and original sample density were used to calculate fiber volume fraction.
Thermogravimetric analysis (TGA) was performed in N2 at a heating rate of 10°C/min up to 800°C to measure degradation temperature and calculate the mass fraction of carbon fiber in each panel. Two replicates were run for each panel. Dynamic mechanical analysis (DMA) was performed to measure the glass transition temperature (T g ) using a three-point bending fixture. Three samples were run from each panel. The strain amplitude was 0.007%, with a preload force of 7 N. Temperature was ramped from 25°C to 250°C at a rate of 3°C/min. T g was taken as the onset of reduction in storage modulus (G′) and tan δ peak.
Mechanical property measurement
Mechanical testing coupons for uniaxial tension and transverse tension test specimens were cut from each panel using a wet saw. Uniaxial tensile tests were performed in accordance with ASTM D3039 using a screw-driven Instron load frame equipped with a 220 kN load cell for testing longitudinal (0°) coupons. Samples were cut to dimensions of 25.4 cm × 1.27 cm (10 × 0.5 in.). Beveled tabs measuring 5.08 cm × 1.27 cm (2 × 0.5 inches) were cut and bonded to the samples using Loctite EA 9394 adhesive and cured for 1 h at 93°C (200°F). Strain gauges were bonded to the samples. Some samples received axial gauges only, while others received biaxial gauges for Poisson’s ratio measurement. Transverse tension coupons were cut to dimensions of 17.78 cm × 2.54 cm (7 × 1 in.). Tabs measuring 3.81 cm × 2.54 cm (1.5 × 1 in.) were bonded to these coupons. Transverse (90°) coupons were tested on a screw-driven MTS load frame outfitted with a 30 kN load cell. For these coupons, strain was measured using digital image correlation (DIC). Both longitudinal and transverse loading was applied at 1 mm/min. In-plane shear strength and modulus were acquired for GF2 matrix composites. Test coupons were prepared from ±45 laminates comprised of 16 layers with an average thickness of 3.88 mm. Coupons were machined to dimensions of 2.54 cm wide and 17.78 cm long (1 × 7 in.). Tabbed surfaces were first prepared by sanding with 180 grit silicon carbide sandpaper and wiped clean with isopropyl alcohol. G-10 FR-4 fiberglass laminate tabs were machined to dimensions 2.54 cm wide and 3.81 cm long (1 × 1.5 in.) with a 10° bevel. Tabs were bonded to machined composite bars using EPON 828 and Jeffamine D230 cured overnight at 50°C. Digital image correlation was used to measure surface strain. In-plane shear tests were performed according to ASTM D3518. Coupons were loaded in tension at a rate of 1 mm/min to a maximum strain of 10% or until failure, whichever occurred first.
Optical microstructure measurements
Optical micrographs of the printed GF-2, Panel 2 composites were acquired transverse to the fiber direction from polished samples at 200 × resolution. The imaging region was approximately 10 mm × 2 mm to ensure that several impregnated tows were captured. A total of four regions of the unidirectional panel were imaged three times, with additional polishing steps between each image. Each polishing step removed a minimum of 1.0 mm depth of material. The successive images of increasing depth were used to evaluate the homogeneity of the microstructure along the print axis.
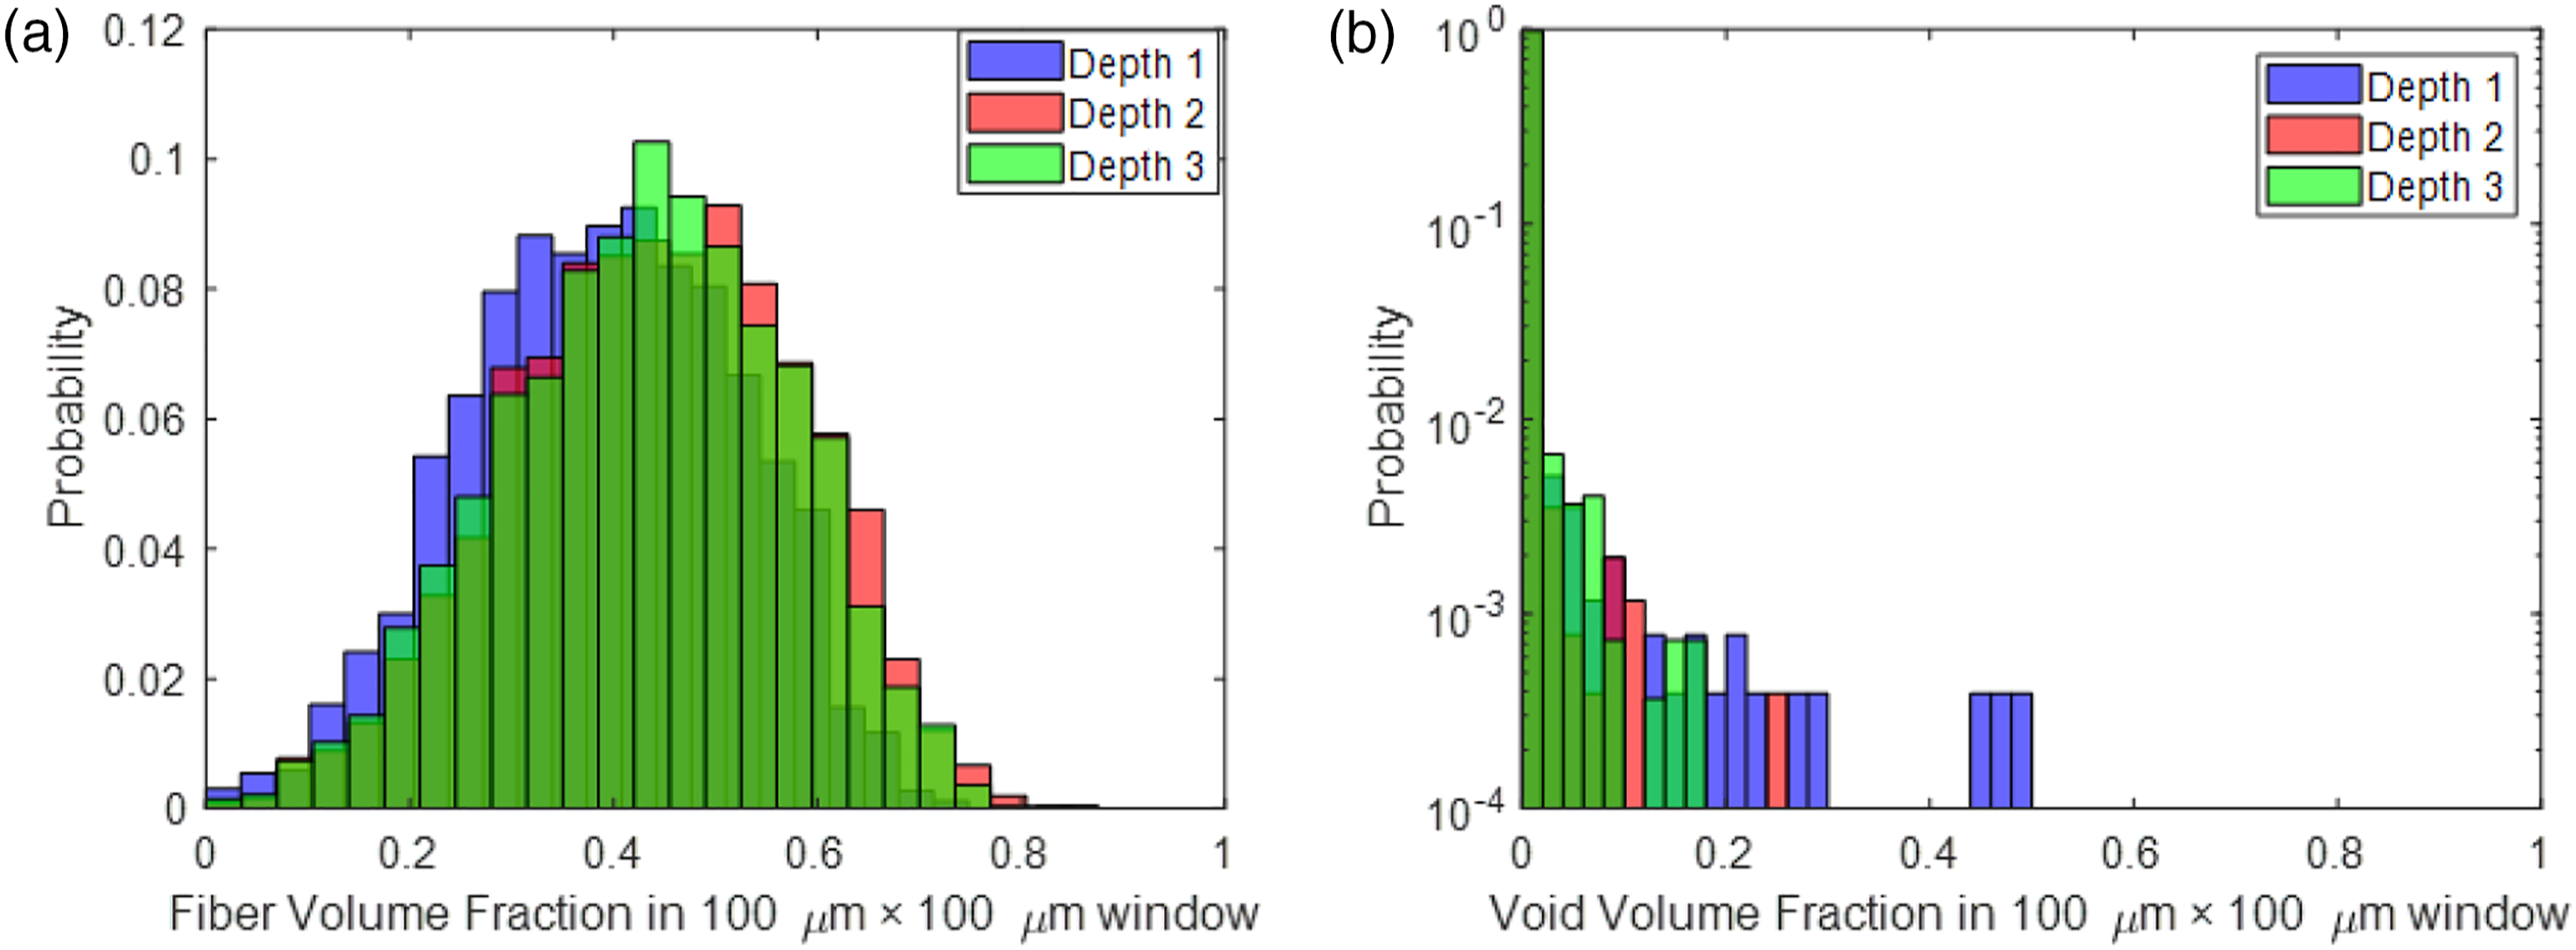
Following the work of Barnett et al. 16 the global (entire sample) and local (100 μm × 100 μm subregions) fiber volume fraction and void volume fraction were identified using a pixel counting method. The global fiber (V f ) and void (V v ) volume fractions were evaluated across the entire image. To confirm that enough optical micrographs were measured to capture the global fiber content of the composites, the cumulative mean of the measured fiber volume fraction was calculated as a function of the number of cross-sections analyzed. To evaluate the inhomogeneity of the composites, the local fiber and void content were identified for the images over 100 μm × 100 μm subregions. The subregion size was chosen to be larger than the size of the interlaminar regions, but small enough that it did not exceed the height of a tow. More details can be found in SI. The variability in local fiber volume fraction along the print path was evaluated by comparing the measured local fiber and void volume fraction.
Knowledge of the nearest neighboring fibers was used to segment the impregnated tows from the intertow resin pockets to describe the macrostructure of the composites. The fiber-to-fiber distance of thresholded images was measured using the volume thickness functionality built into Dragonfly (Object Research Systems, version 2021.3 Build 1087). This operation places circles whose centroids are located on each individual pixel in an image and determines the diameter that yields a circumference touching at least two fiber pixels. The resulting distribution of circle diameters represents the fiber-to-fiber spacing in the composite. Then, regions of fiber-to-fiber spacing corresponding to intratow regions (close packing, fiber-to-fiber distance <20 μm), intertow resin regions (moderate spacing, fiber distance >20 μm, <90 μm), and intertow resin pockets (large spacing, fiber distance >90 μm) were used to segment the micrographs as described below. Following segmentation, the local fiber volume fraction in the impregnated tows of the composite was evaluated using the same 100 μm × 100 μm subregions described earlier to provide an estimate of microstructural intratow inhomogeneity relative to the macrostructure composite inhomogeneity identified through regional segmentation.
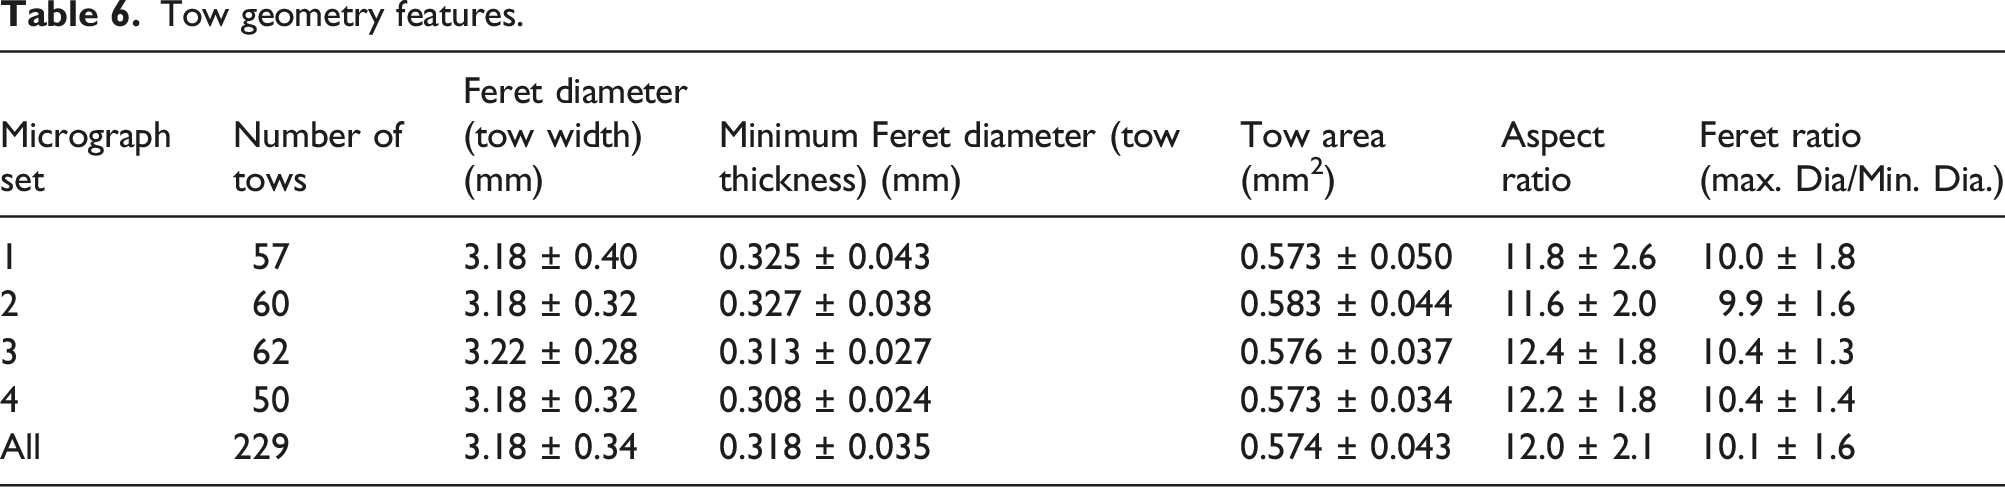
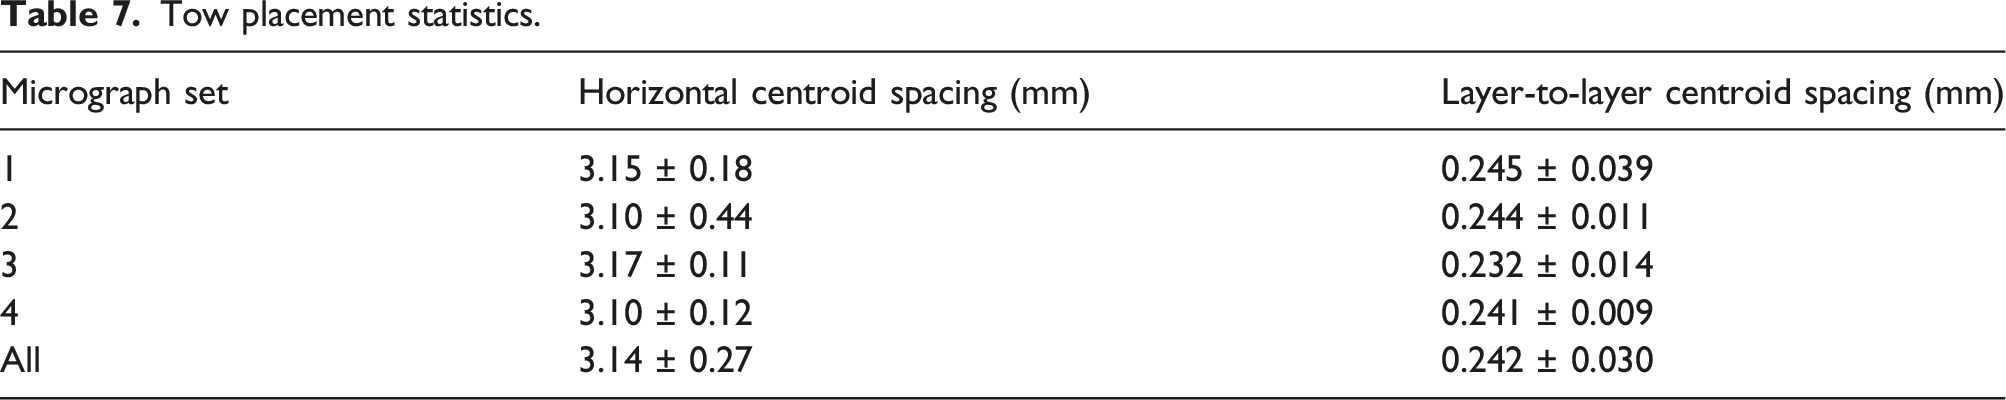
In addition to using the fiber–fiber spacing to identify the impregnated tow, intertow resin regions and intertow resin pockets (Figure 2(b)), image analysis was also used to quantify the dimensions of individual tows and their out-of-plane and in-plane spacing relative to each other. As can be seen in Figure 2 for a microstructure that showed the largest variation in tow shape, individual tows can have complex shapes, but nest well with one another. The individual tows were identified using ImageJ’s Analyze Particles tool on binarized microstructure images. The tow boundaries in the image were discontinuous and thus were manually closed to aid in segmentation of individual tows. Tows which intersected the edge of the image where not analyzed. After the individual tows were identified, their dimensions were characterized in three different ways. As can be seen in Figure 2(a), the Feret Diameter, or the larger projected dimension, was measured and is most directly related to the width of the tow. The Minimum Feret Diameter, or smallest projected dimension, was measured and is most directly related to the thickness, or height, of the tow. The aspect ratio of the individual tow was calculated assuming an ellipse with a major and minor axis roughly corresponding to tow width and height, respectively, and having an area that most closely matches the tow shape. The area was also calculated by summing the pixels in the enclosed complex shape. The difference between the aspect ratio that assumed an elliptical shape and one based on the ratio of the Feret diameter to minimum Feret diameter offers a convenient measure of the relative shape deviation from being ellipsoidal. The centroid of each tow was calculated using pixel counting. The average distance and standard deviation of the spacing between tow centroid within a layer and between layers was measured. As can be seen in Figure 2(c), the relative variation in vertical and horizontal registry between and within layers was also measured. Optical microstructure quantification of (a) individual impregnated tows using the Feret diameter for the maximum dimension, the Feret minimum diameter for the minimum projected area, and aspect ratio assuming an ellipse shape, (b) identification of impregnated tow, intertow resin region, intertow resin pockets from fiber-to-fiber spacing, and (c) calculated position of the centroid spacing and its consistency within and between layers.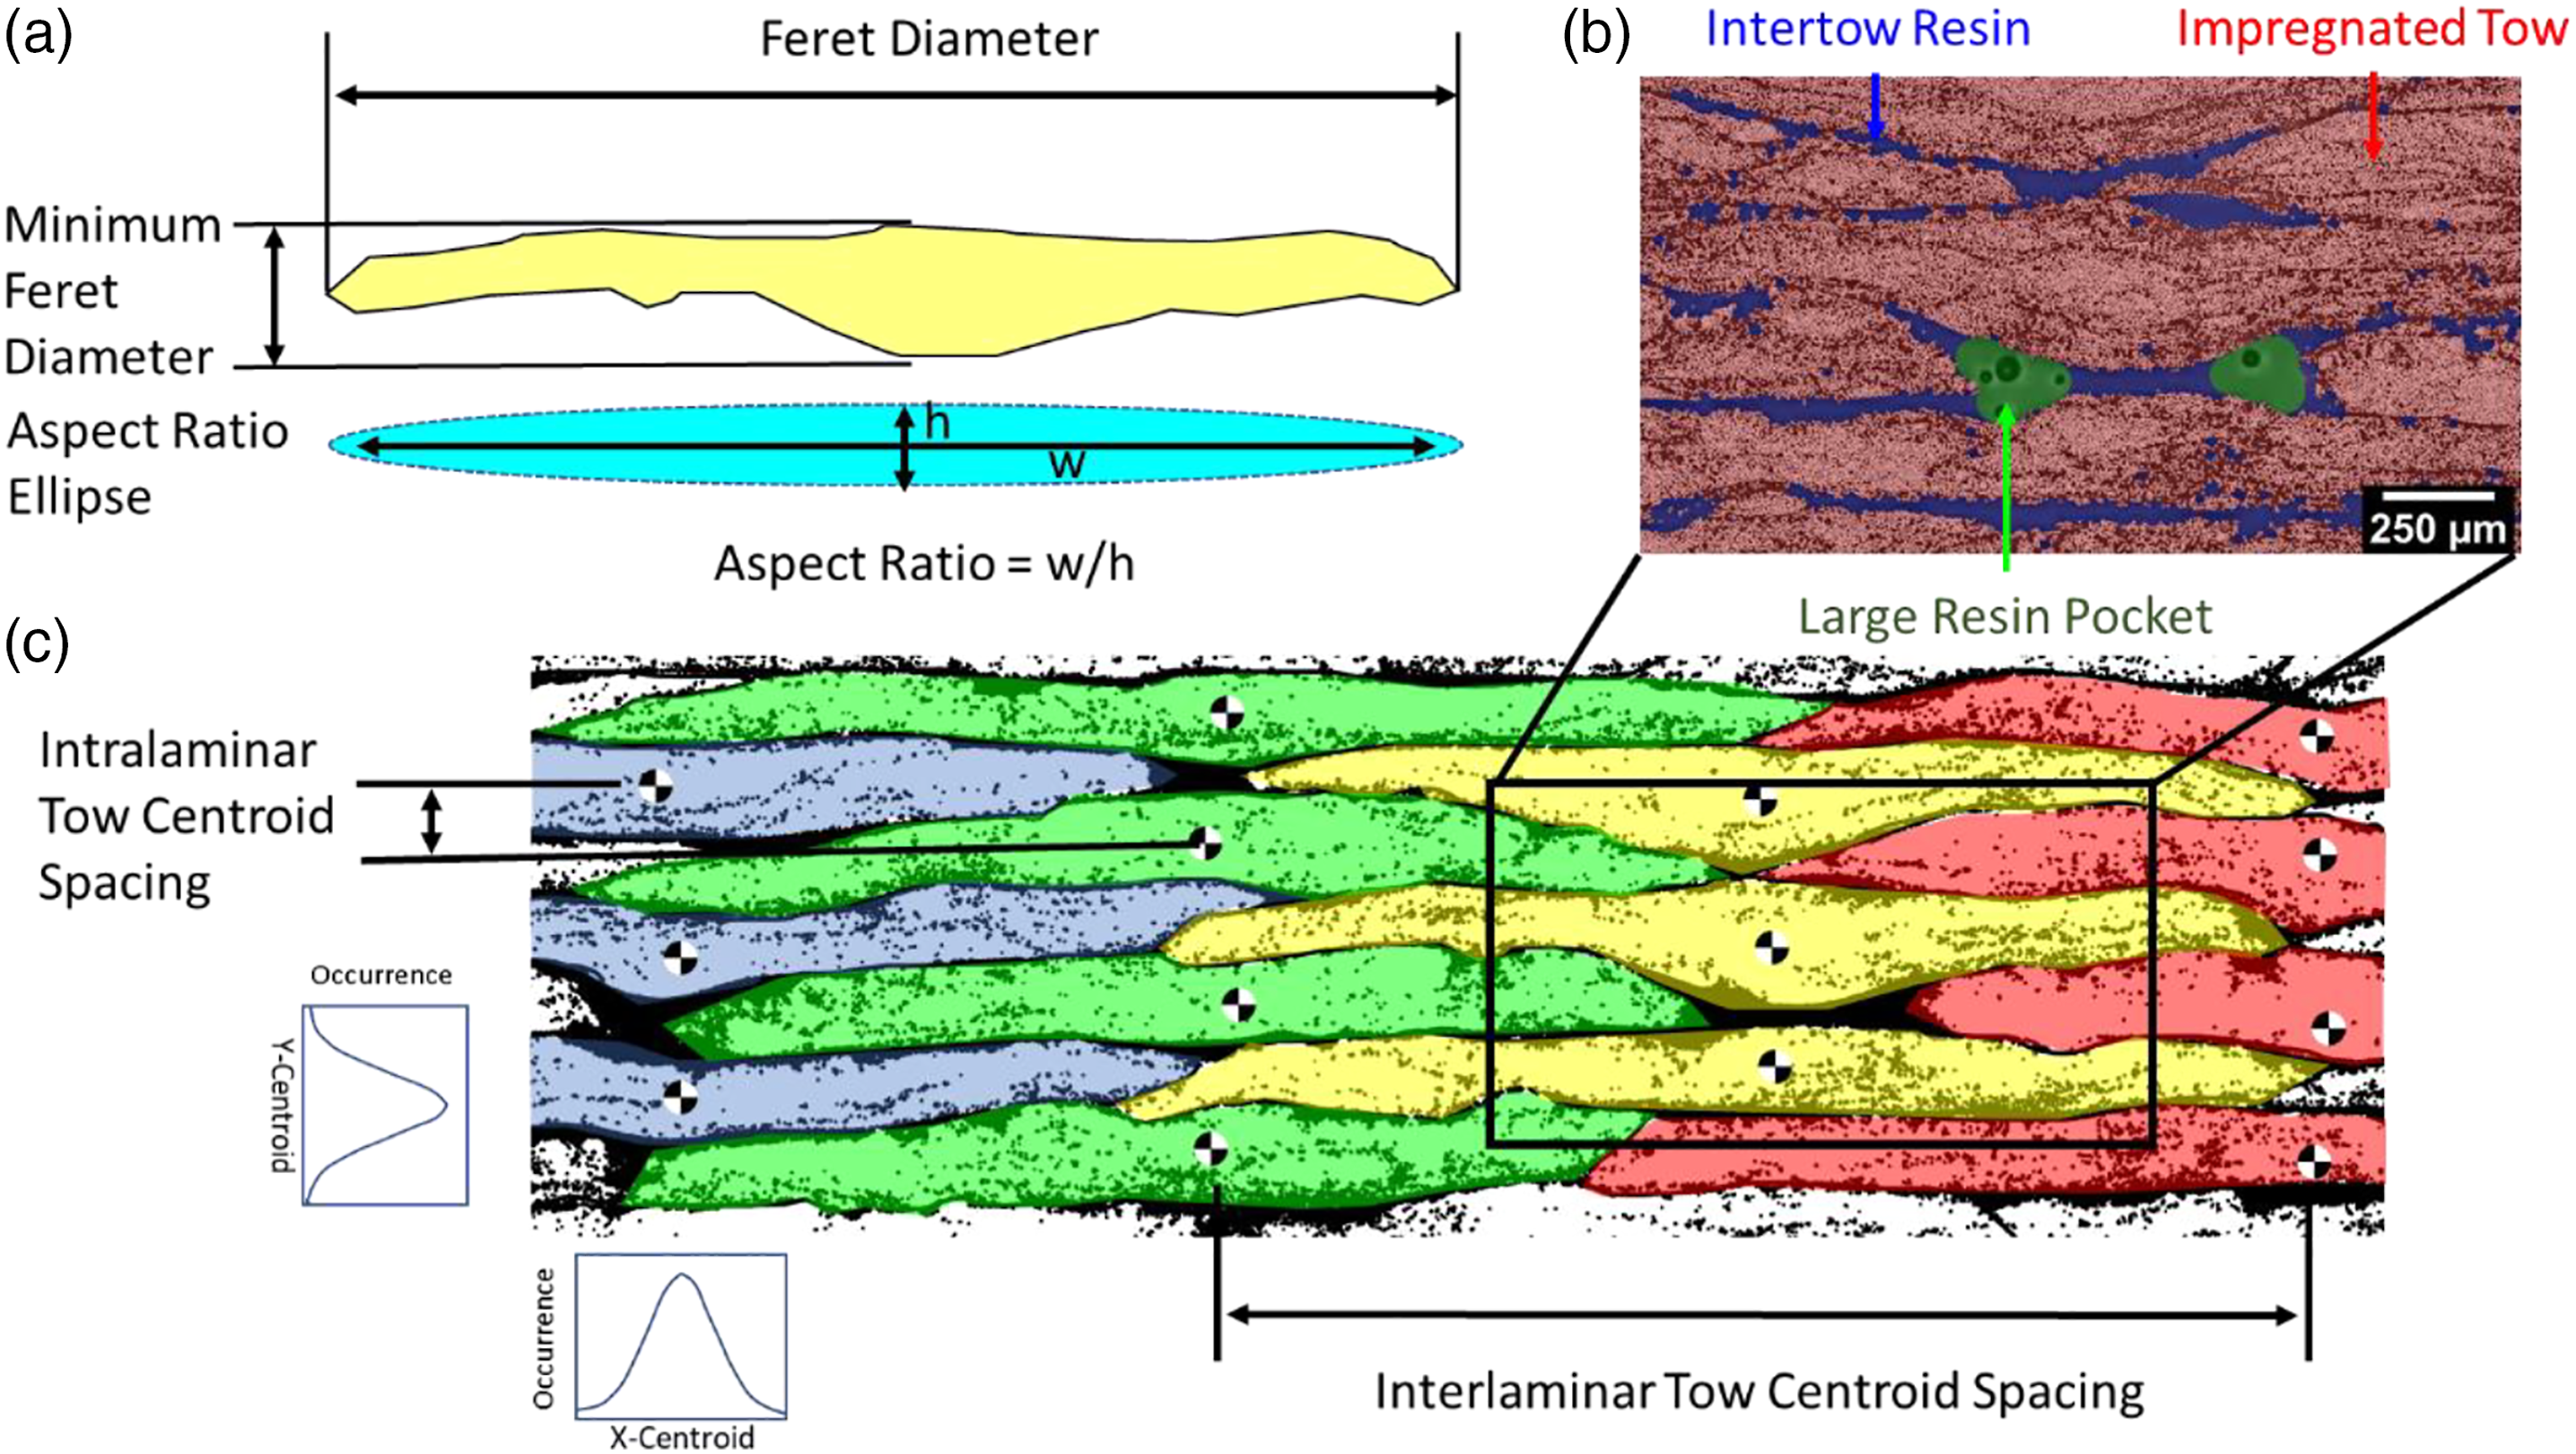
Experimental results and discussion
Physical and thermomechanical measurements
After deposition and post-cure, GF-2 was observed to have a maximum warpage of 0.9 mm for a panel that roughly measures 300 mm × 300 mm × 2 mm. Since the panels are flat before thermal post-curing and the warpage occurs in the direction transverse to the fiber direction, warpage is attributed to a difference in through thickness residual cure stress from some combination of variation in extent of UV cure, thermal history, cure shrinkage, heat transport, physically boundary condition, and, perhaps, asymmetry in composition - all acting in a direction that is less constrained by fiber reinforcement. It had a top surface root mean square (RMS) roughness (Rq) of 39–44 micrometers, and a bottom (print bed) roughness (Rq) of 0.8–1.7 micrometers. The CATPRO14 panels had no detectable warpage, a top RMS roughness of 26–46 μm, and a bottom roughness of 0.4–2.8 μm. Lower roughness was achieved on the bottom surface due to the glass plate print bed. The top surface was open to the environment both during panel fabrication and freestanding thermal post-bake. Optical images of the panels can be seen in Figure 3. Acid digestion confirmed that the fiber volume fraction was 41.5% for GF-2 and 38% for the CATPRO14 resin. Optical images of unidirectional AM mechanical test panels of GF-2 top (a) and bottom (b) surface and CATPRO14 resin top (c) and bottom (d) surface, (e) top face of GF-2 and (f) section of the ±45 laminates used for shear testing.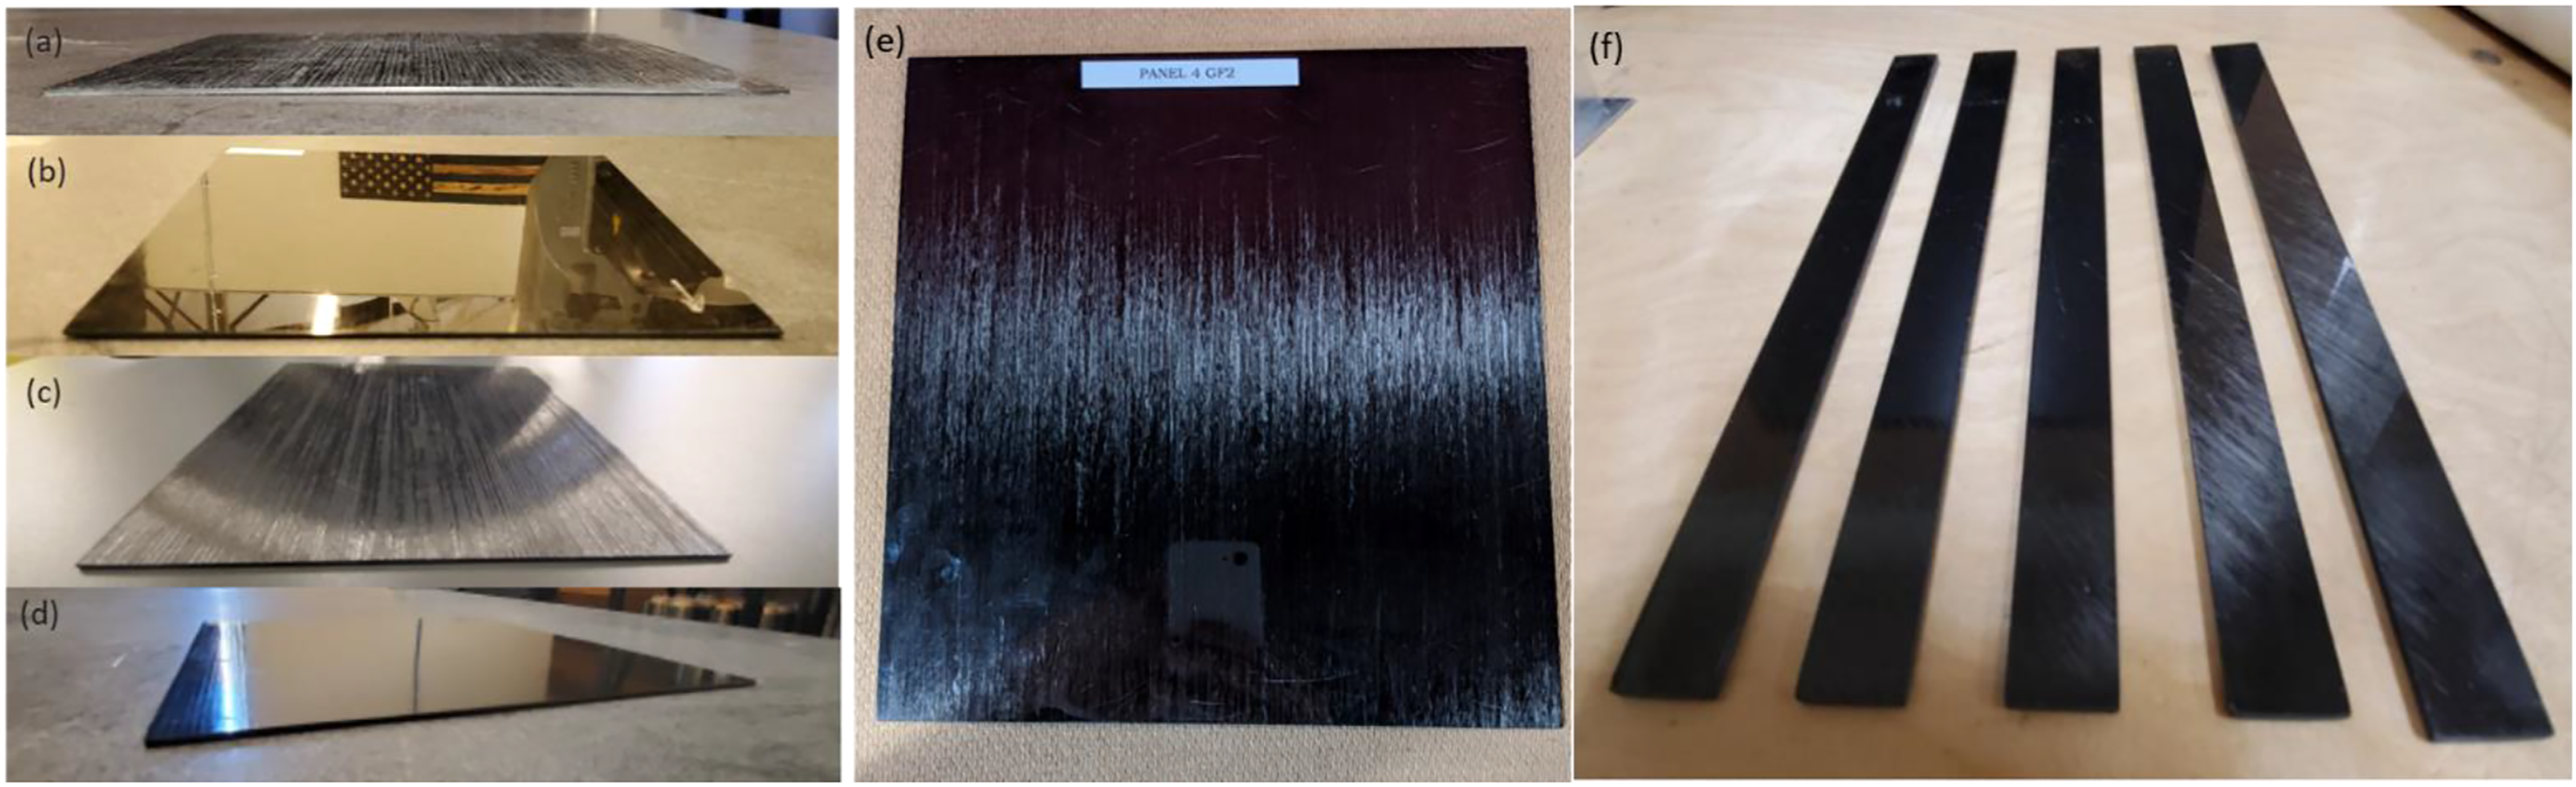
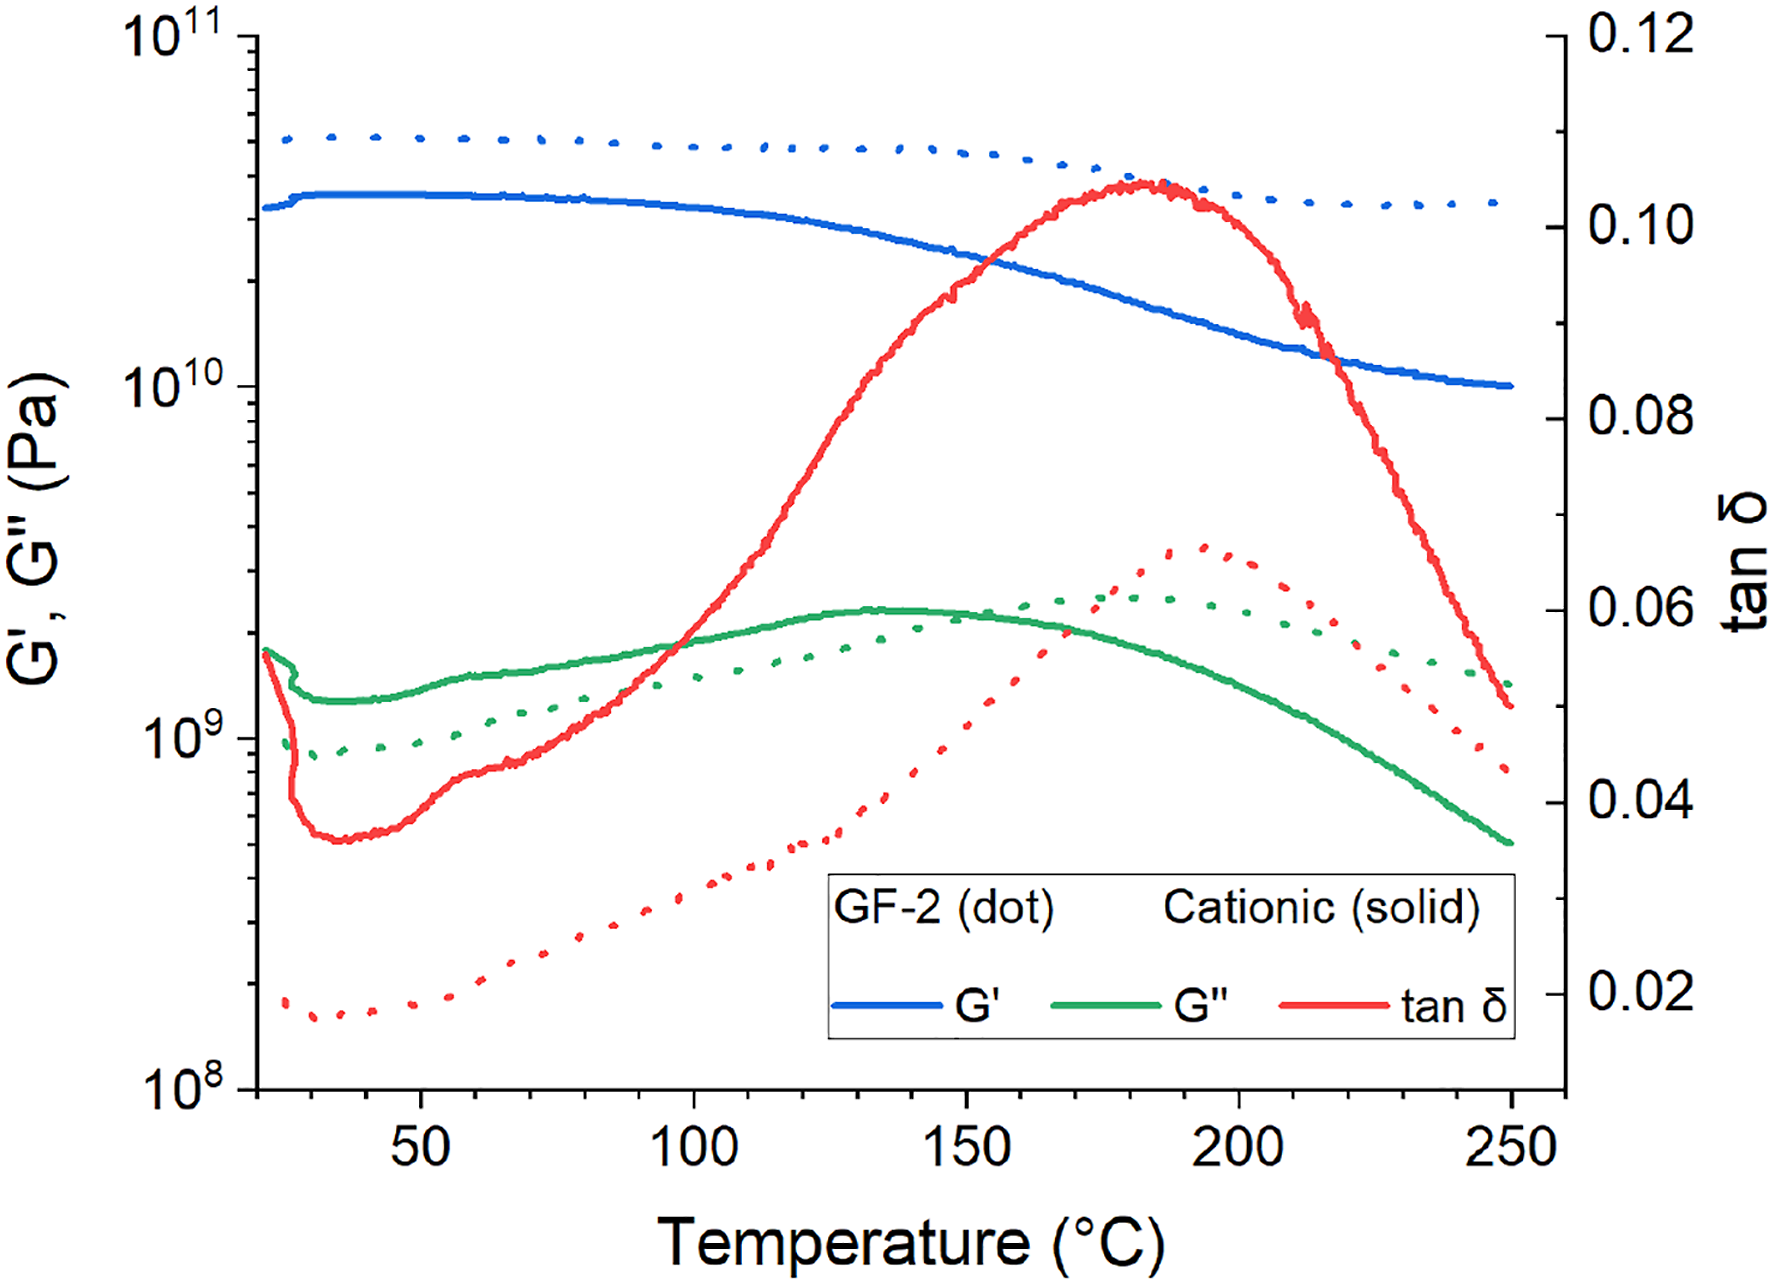
The TGA data in nitrogen (Figure 4) revealed a 5% weight loss at approximately 350°C for each panel. At 650°C, GF-2 and CATPRO14 panels had 41–44 wt% and 45–52 wt% residue, respectively, representing the fiber mass fraction and some residual char. Acid digestion results were a more accurate measure of fiber volume fraction. DMA in Figure 5 showed a glass transition temperature ranging from 189–194°C by tan δ and 162–178°C by G′ onset for the GF-2 and 182–193°C by tan δ and 120–125°C by G′ onset for the CATPRO14 composite system. If one uses the onset value for T
g
and assumes a use temperature of at least 20°C above that temperature, then the estimated use temperature for GF-2 and CATPRO14 is approximately 140°C and 100°C, respectively. Thermogravimetric analysis data collected in nitrogen of GF-2 (dashed) and CATPRO14, designated as “Cationic”, (solid) composite panels. Dynamic mechanical analysis 3-point bending of GF-2 (dotted) and CATPRO14, designated as “Cationic” (solid) composite panels.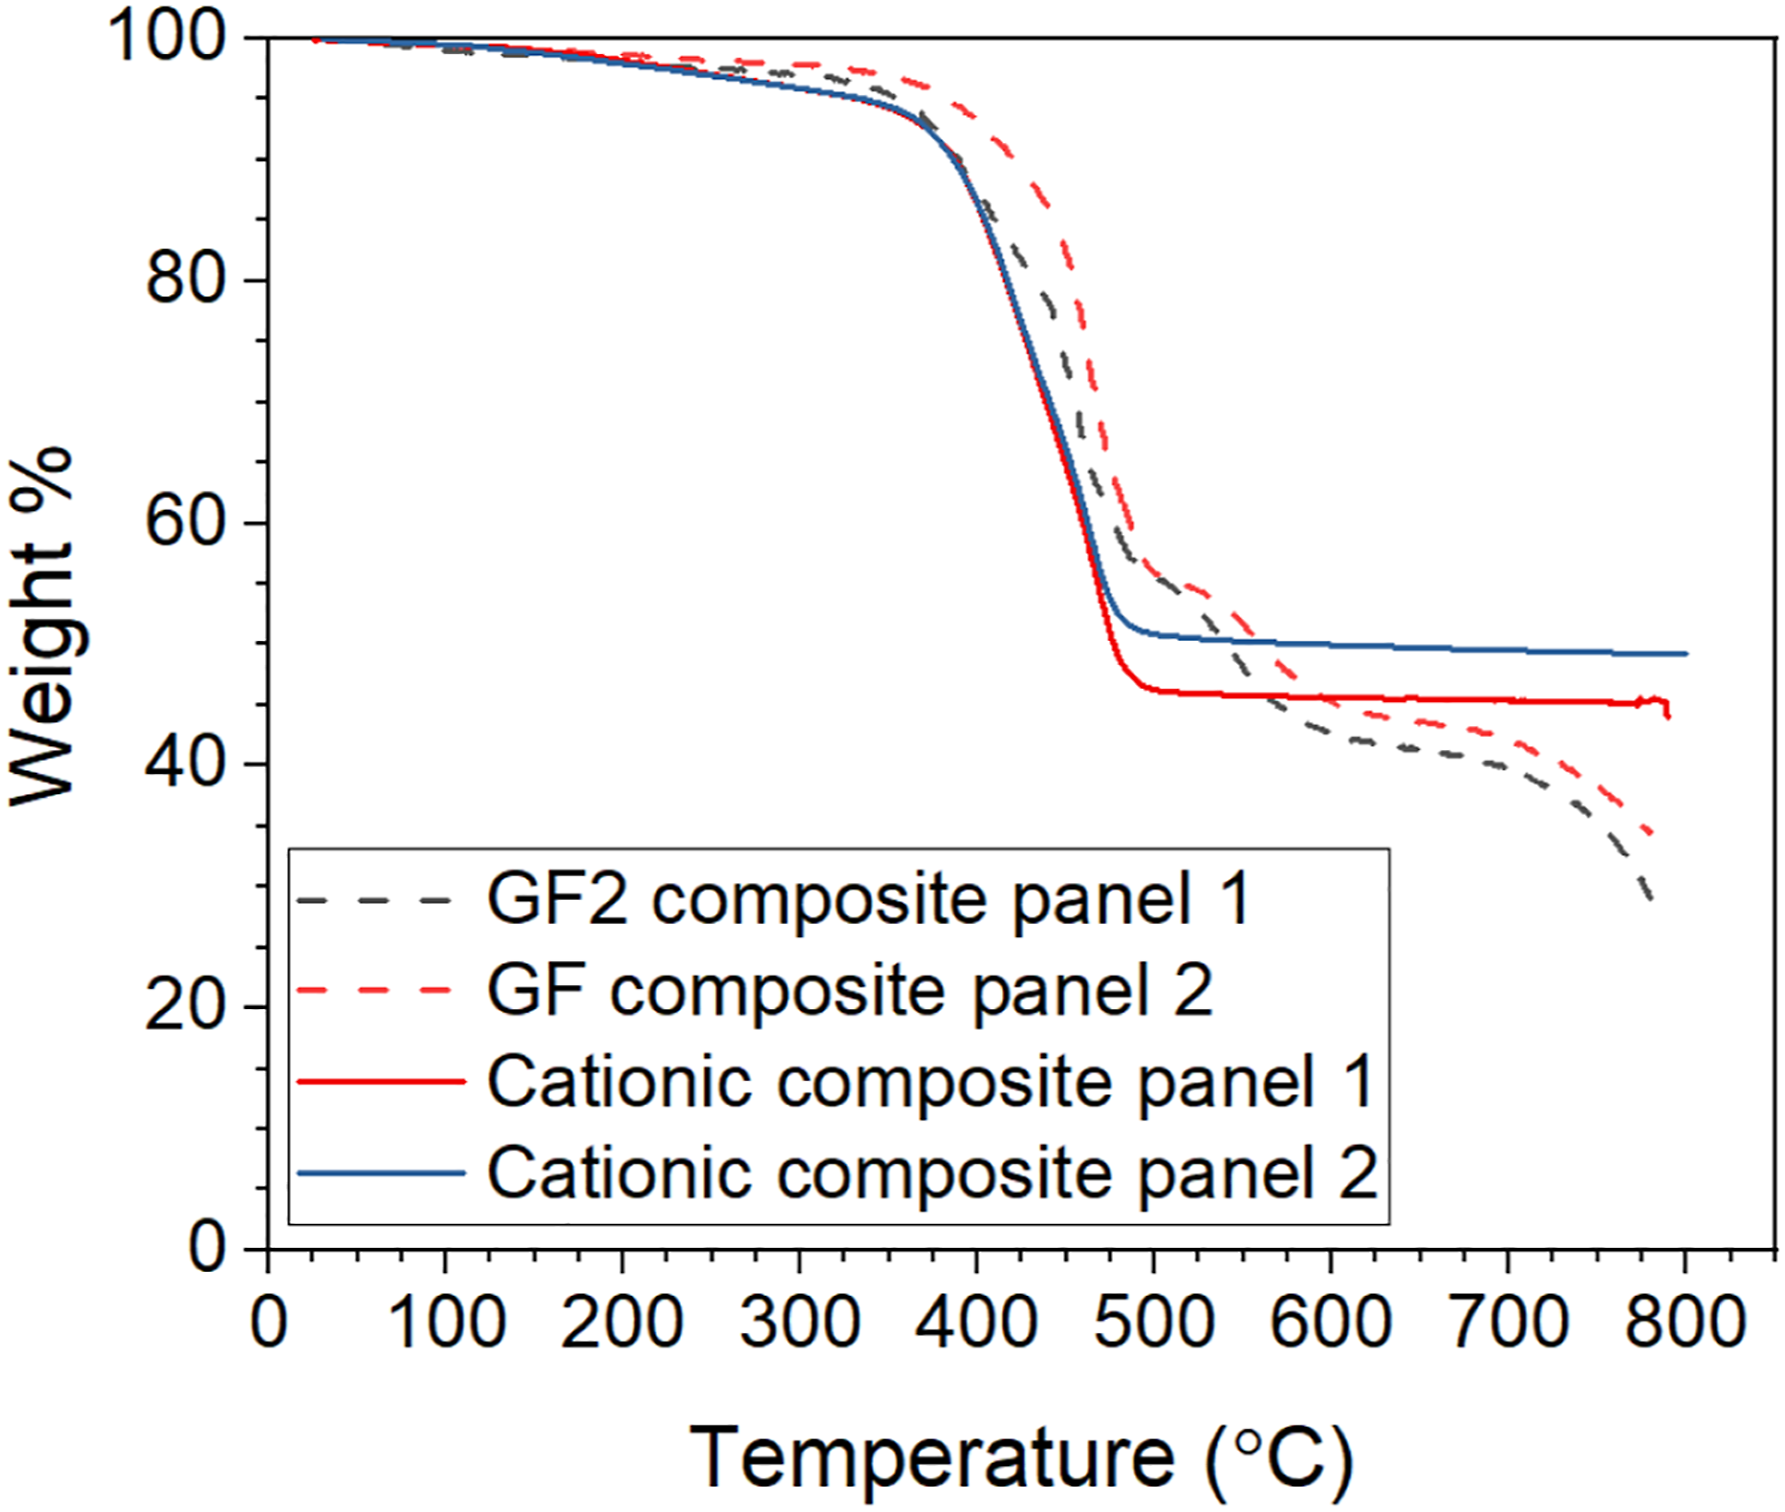
Longitudinal and transverse tensile properties
The longitudinal and transverse stress strain curves for GF-2 are given in Figure 6. GF-2 and CATPRO14 (a) longitudinal and (b) transverse tensile stress–strain curves. An example of (c) GF-2 longitudinal test specimen to failure (filaments are taped).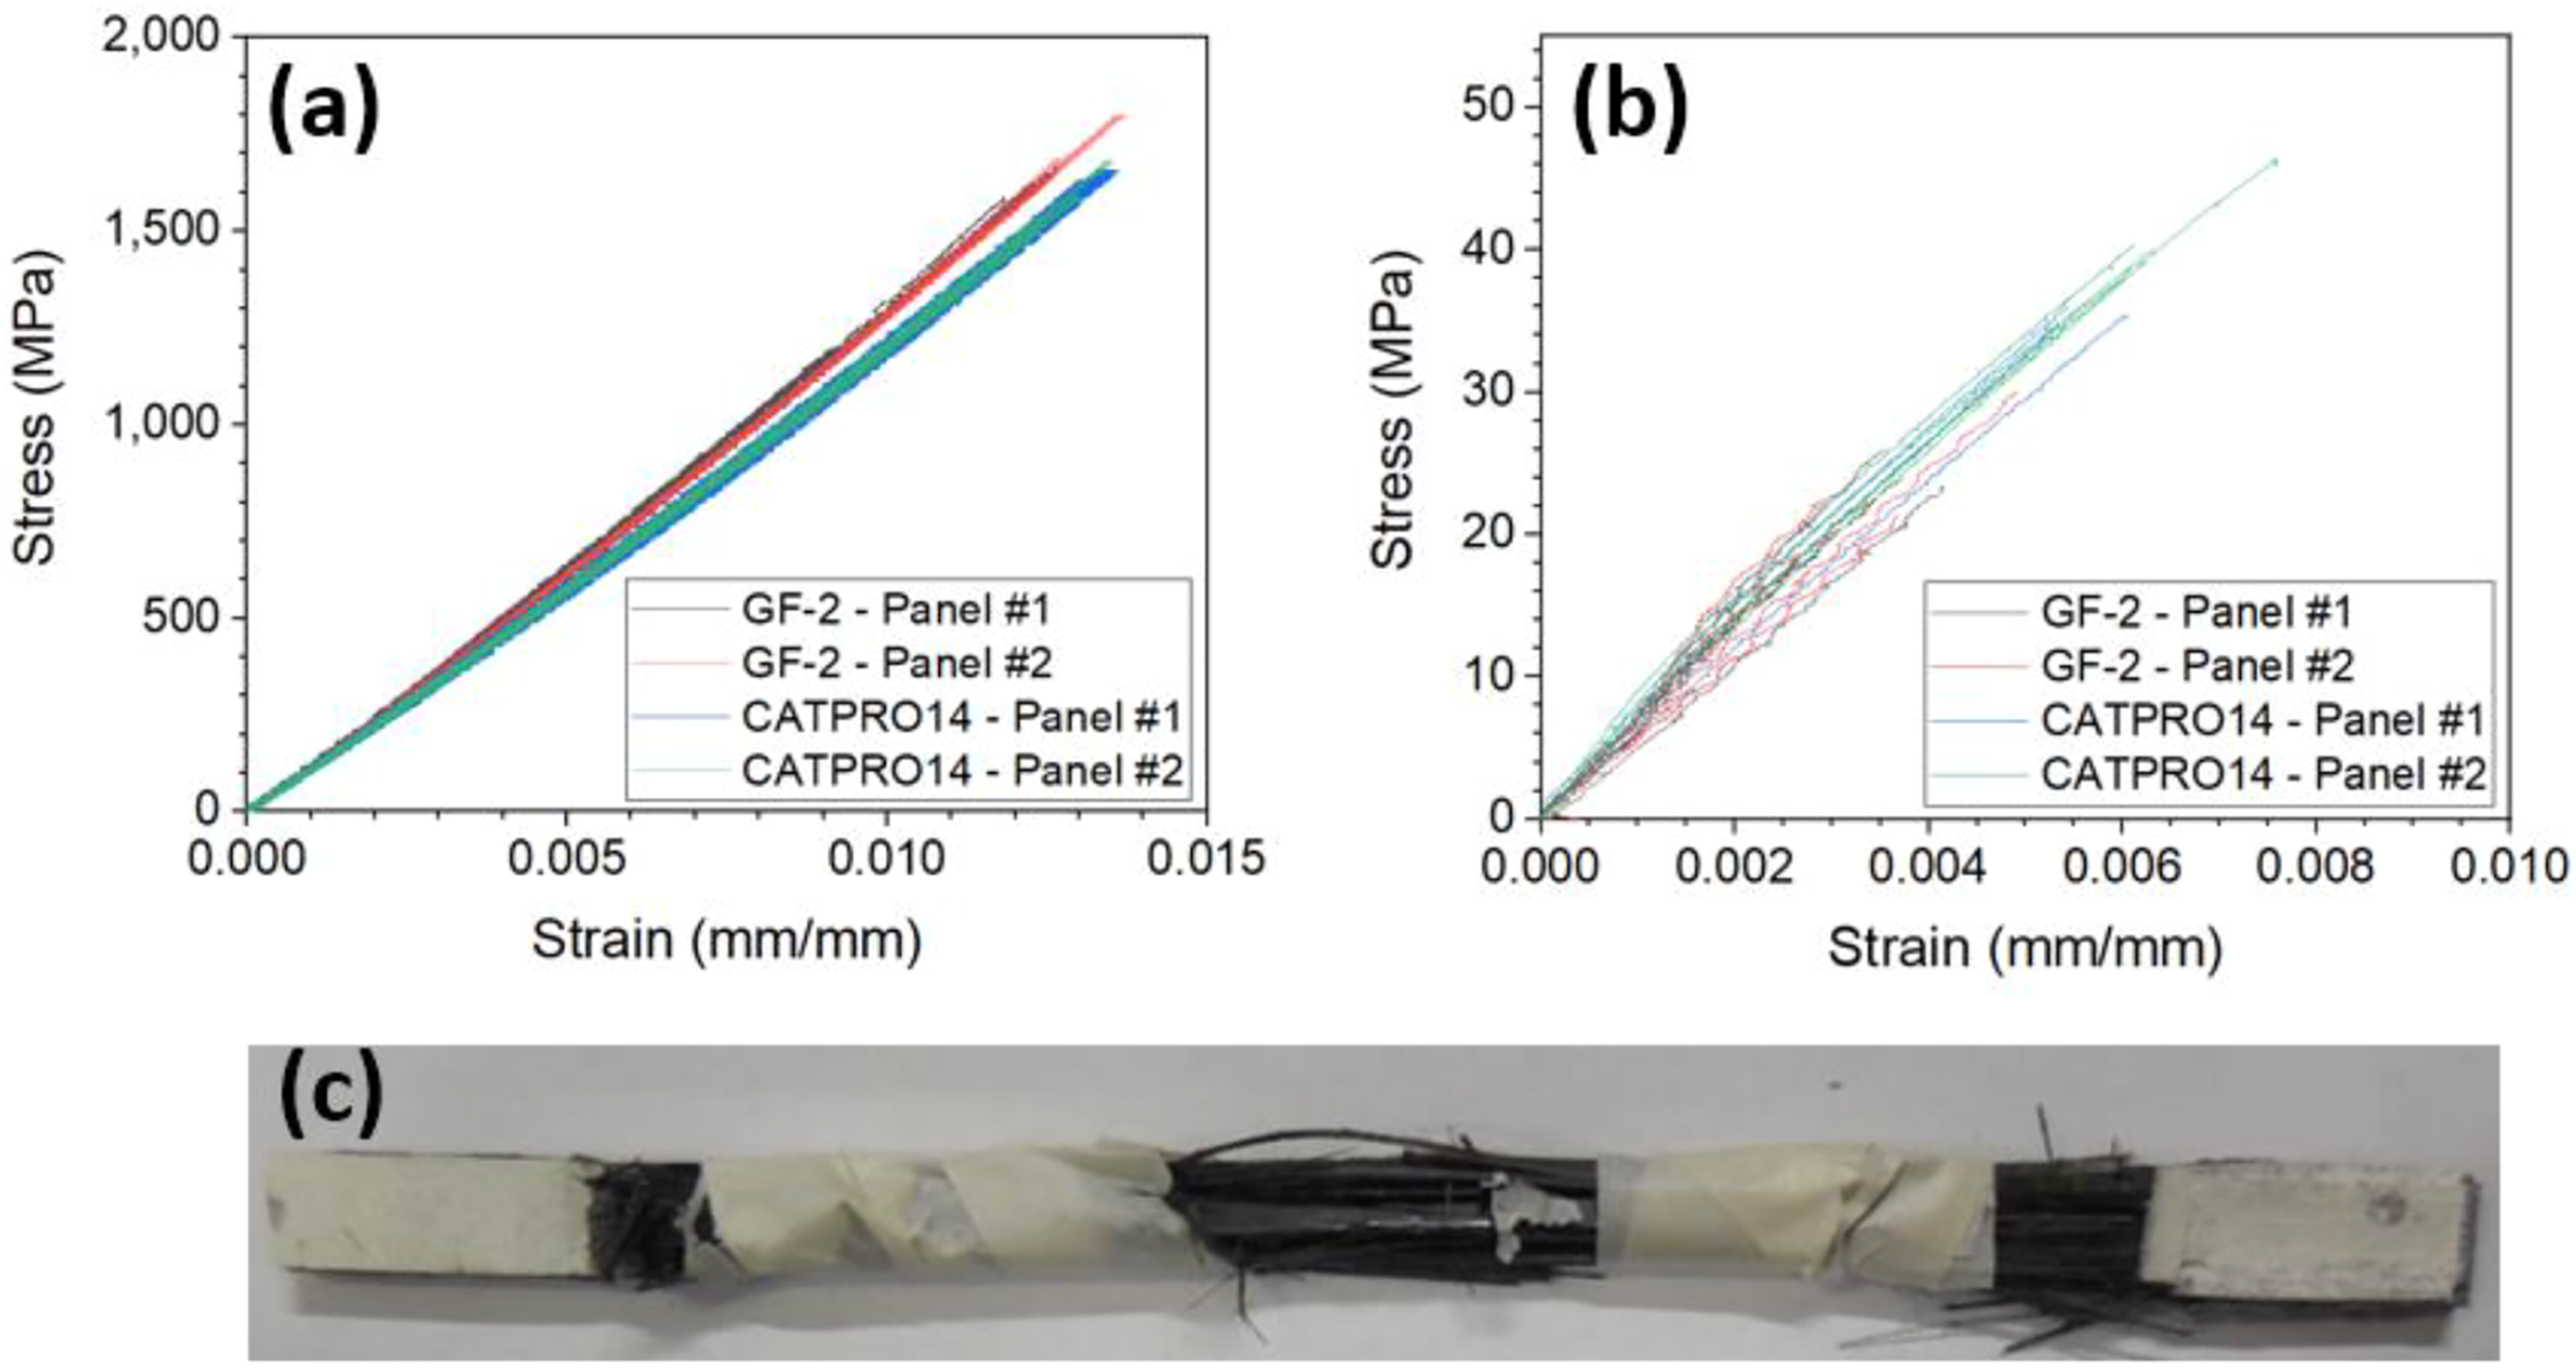
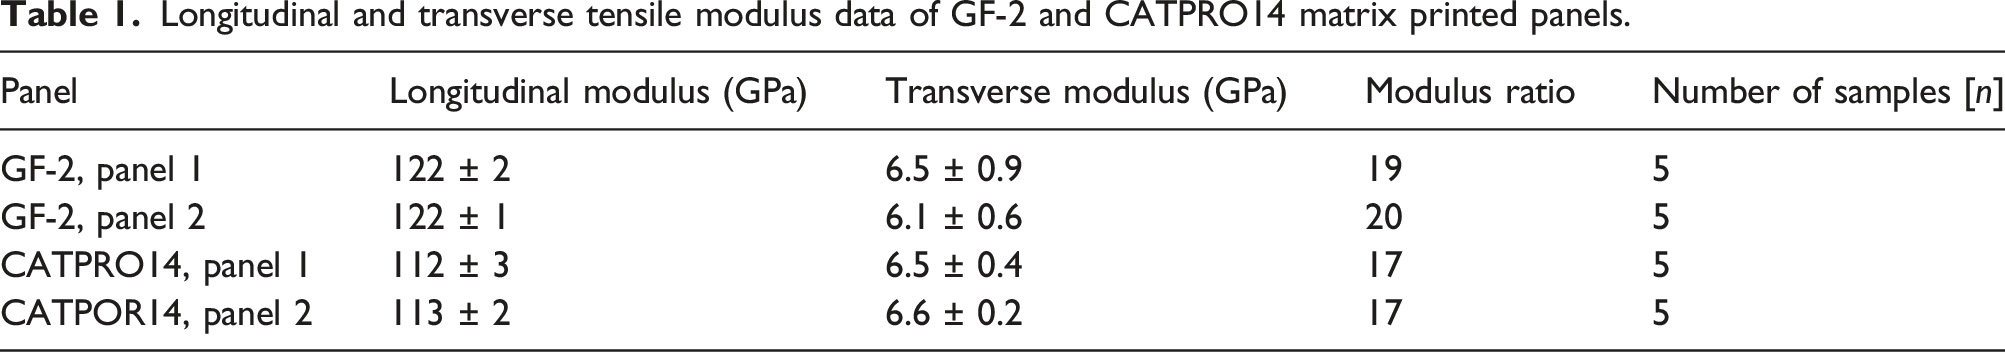
Longitudinal and transverse tensile modulus data of GF-2 and CATPRO14 matrix printed panels.
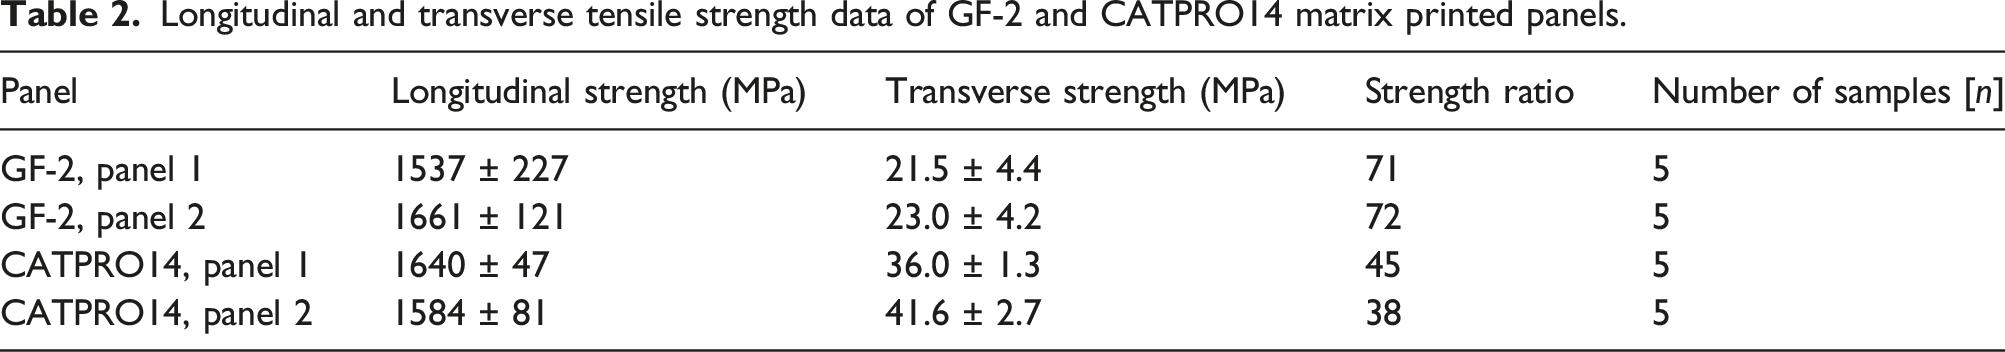
Longitudinal and transverse tensile strength data of GF-2 and CATPRO14 matrix printed panels.
Tensile strain at break of longitudinal and transverse GF-2 and CATPRO14 matrix printed panels.
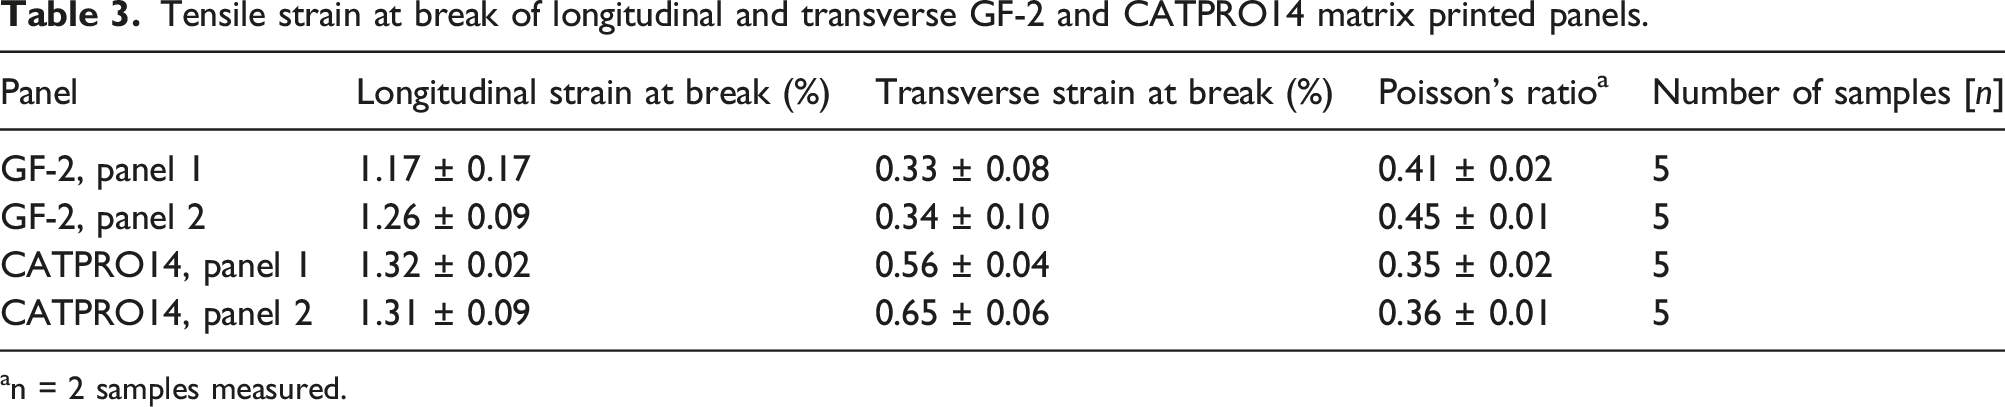
an = 2 samples measured.
Based on the properties of the GF-2 resin and the T-1100 fiber,
15
we calculated an upper bound longitudinal composite modulus of 137 GPa for a composite with 41.5% fiber volume fraction from acid digestion using the RoM equation (1). Assuming no knockdown, or 100% strength efficiency (η = 1), in equation (2), we calculate an upper bound for longitudinal tensile strength of 2927 MPa. The measured values for GF-2 of 122 GPa and 1599 MPa for longitudinal tensile modulus and strength are 89% and 55% of the theoretical RoM upper bound (η = 1), respectively. Because resin properties for the CATPRO14 resin were not available, comparisons with theoretical values were not made. In comparison to the GF-2 composite, the CATPRO14 composite had 4% lower fiber volume fraction as measured by acid digestion, 8% lower longitudinal composite modulus, 4% higher transverse modulus, similar longitudinal strength, and a 74% increase in transverse strength.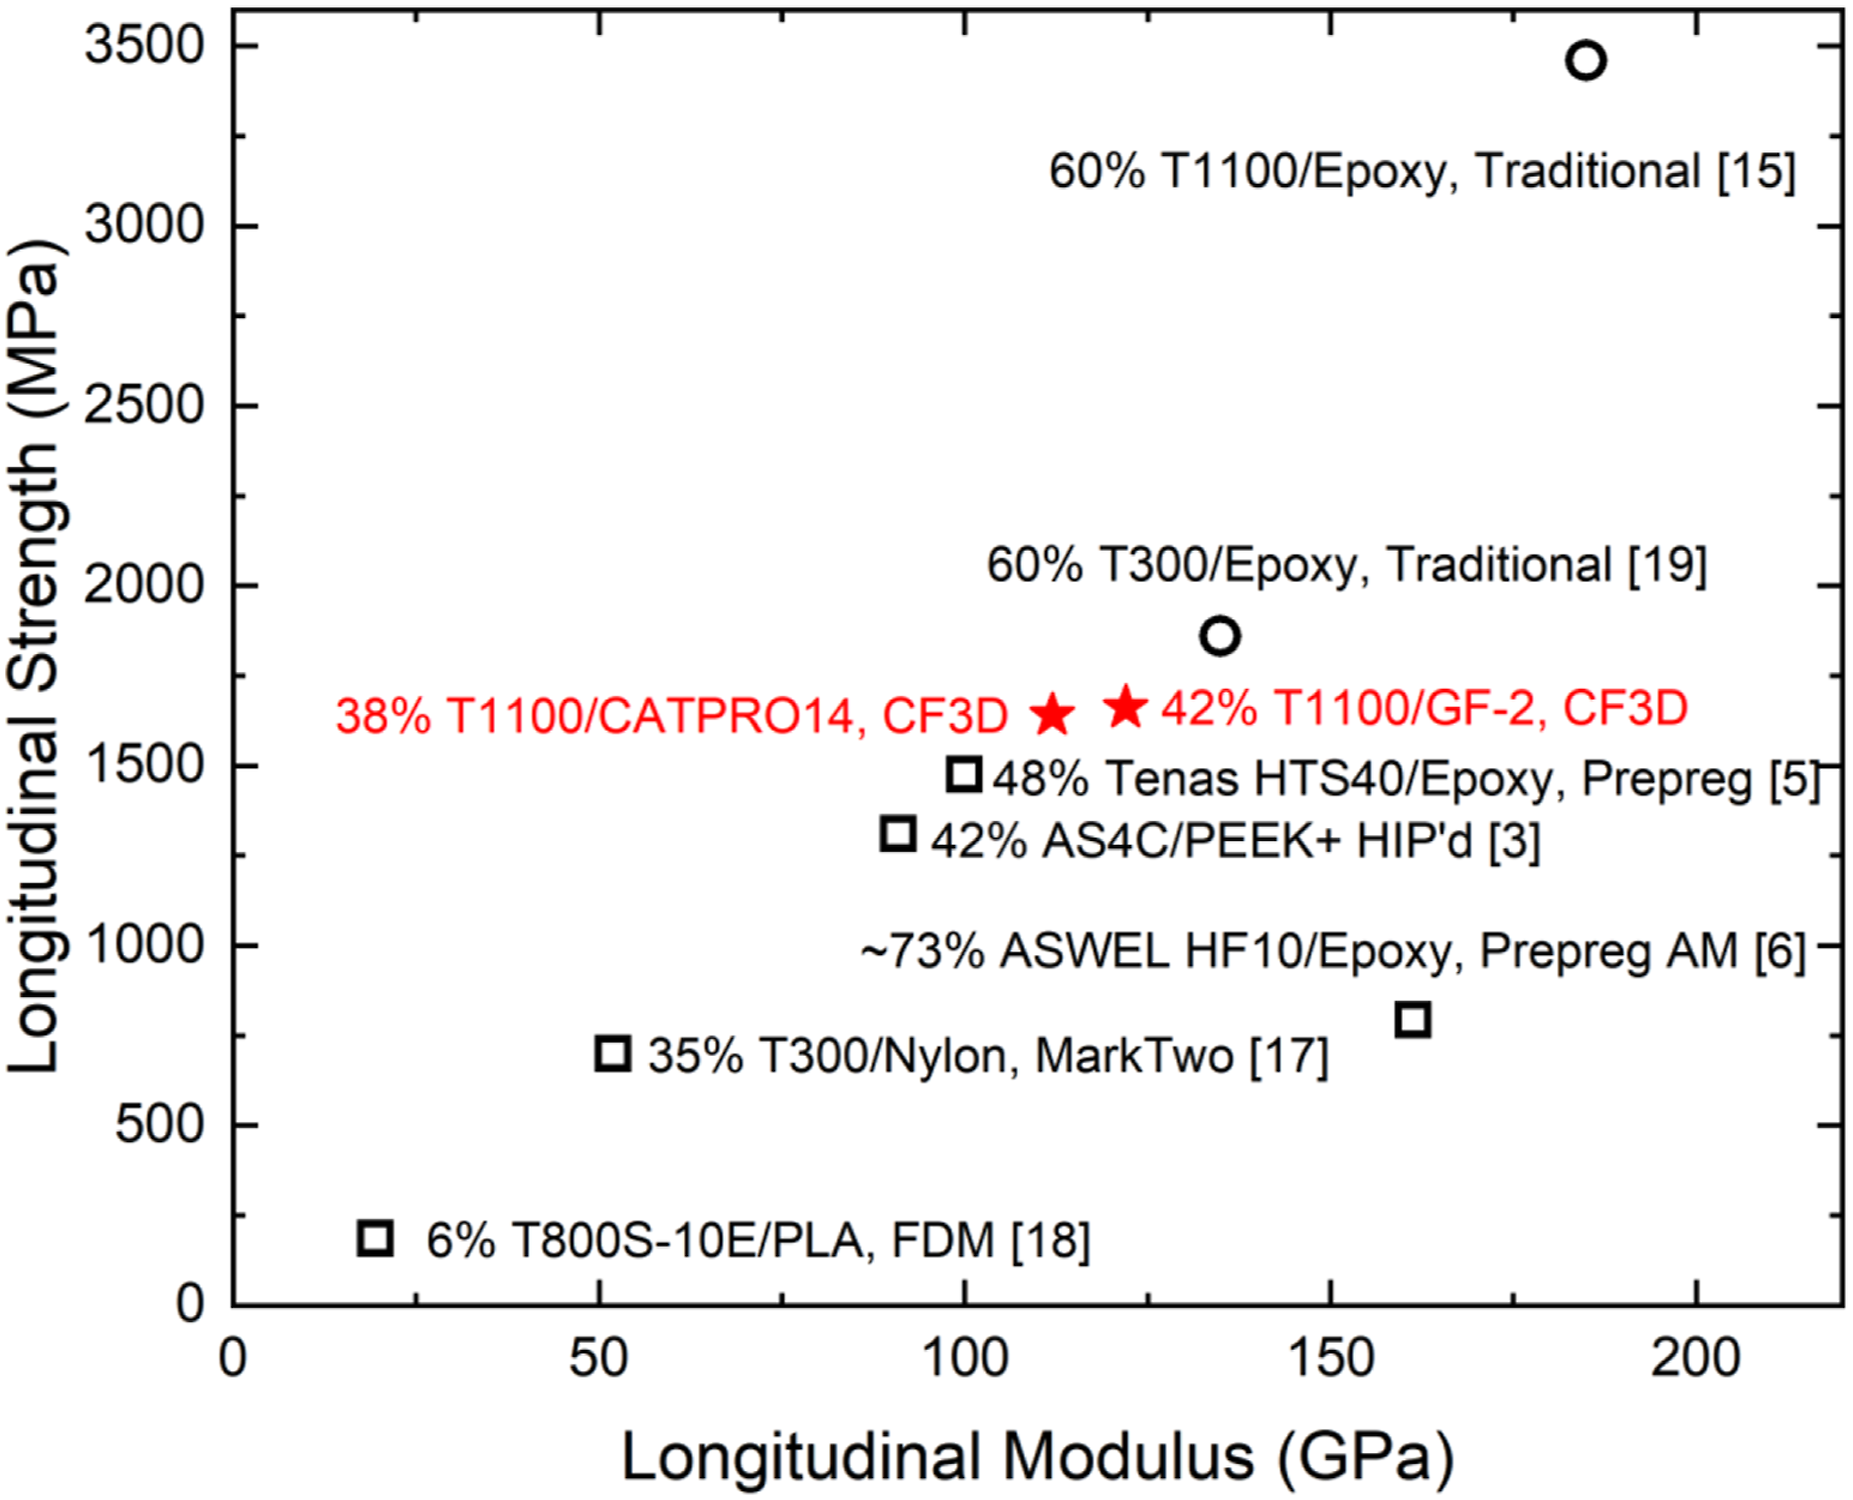
These results are a substantial improvement over the additively manufactured continuous fiber reinforced thermoplastic composites which typically have longitudinal modulus and strength values that range from up to 2–36 GPa and 30–470 MPa, respectively. 1 Previous thermoset continuous fiber reinforced AM composites which used thermal heating of pre-impregnated fiber tows reached longitudinal modulus and strength values of 100 GPa and 1476 MPa. Based on the given fiber properties (240 GPa tensile modulus, 4400 MPa tensile strength) and fiber volume fraction (48%), they calculate 83% and 67% of their theoretical longitudinal modulus and strength. 5 Resin properties were not given. Other researchers used fibers with similar properties (221 GPa modulus, 3530 MPa strength) to develop high volume fraction printed composites with lower tensile strength (793 MPa), but higher modulus (161 GPa). 6 While the fiber volume fraction was not given, it is calculated from the composite modulus and RoM to be extremely high, larger than 73%, and due in part to the filament winding nature of the process used. The low tensile strength (22% of theoretical) is likely linked to defects and stress concentration related to this high fiber volume fraction. The longitudinal composite strength of the panels examined here appear to be the highest of additively manufactured composites to date (Figure 7). This is largely due to the high mechanical properties of the T-1100 fiber, low void content, scarcity of defects, and substantial fiber volume fraction. These composites were able to achieve most (89%) of their theoretical longitudinal modulus and the majority (55%) of the longitudinal strength. Since most fibers have sizing that are functionalized for bonding with epoxies, we anticipate further improvements in strength with improvements in fiber–resin interface, as well as fiber volume fraction.
Based on the manufacturer’s datasheet for T-1100G carbon fibers,
15
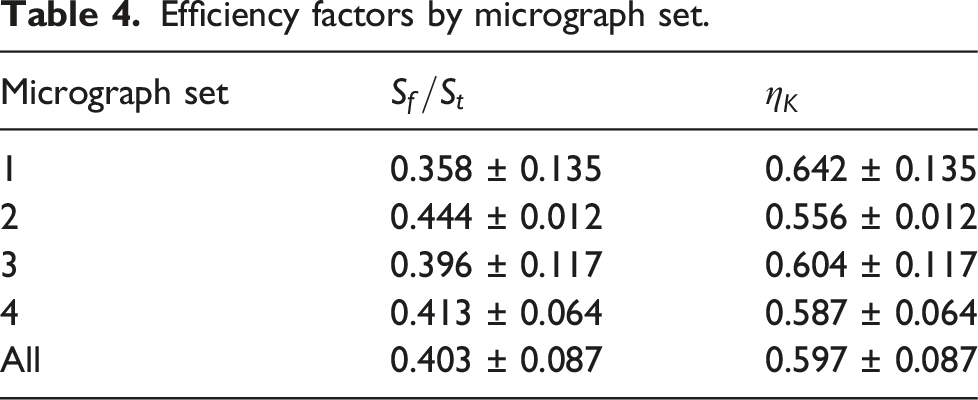
typical unidirectional epoxy laminates (made by stacking prepregs and autoclave curing) have a 185 GPa longitudinal tensile modulus and 3460 MPa tensile strength at 60% fiber volume fraction. The resulting modulus is about 95% of the RoM calculation and the strength efficiency (η) is about 82%. T-300 fibers composites had lower modulus and strength, but higher agreement with RoM (98%) and strength efficiency (88%). These are in good agreement with the strength efficiency measured for the Kevlar/epoxy composites in Karam’s studies, as shown in Figure 8. Assuming the same efficiencies as a prepreg, the expected properties for a 41.5% fiber volume fraction T-1100G composite are 128 GPa for longitudinal tensile modulus and 2393 MPa for longitudinal tensile strength. In actuality, the printed composites do not achieve the same efficiency as a prepreg. As a result, the printing process examined here yields composites with 88%–95% of the anticipated longitudinal modulus and 65%–70% of the anticipated longitudinal tensile strength of those processed by traditional methods. Future improvements in the tow packing should seek to increase the strength efficiency to be more aligned with traditional prepregs. Experimental strength efficiency factors for Kevlar/epoxy composites in Karam’s studies and a comparable T-1100 prepreg exceeds that of the composites in this study.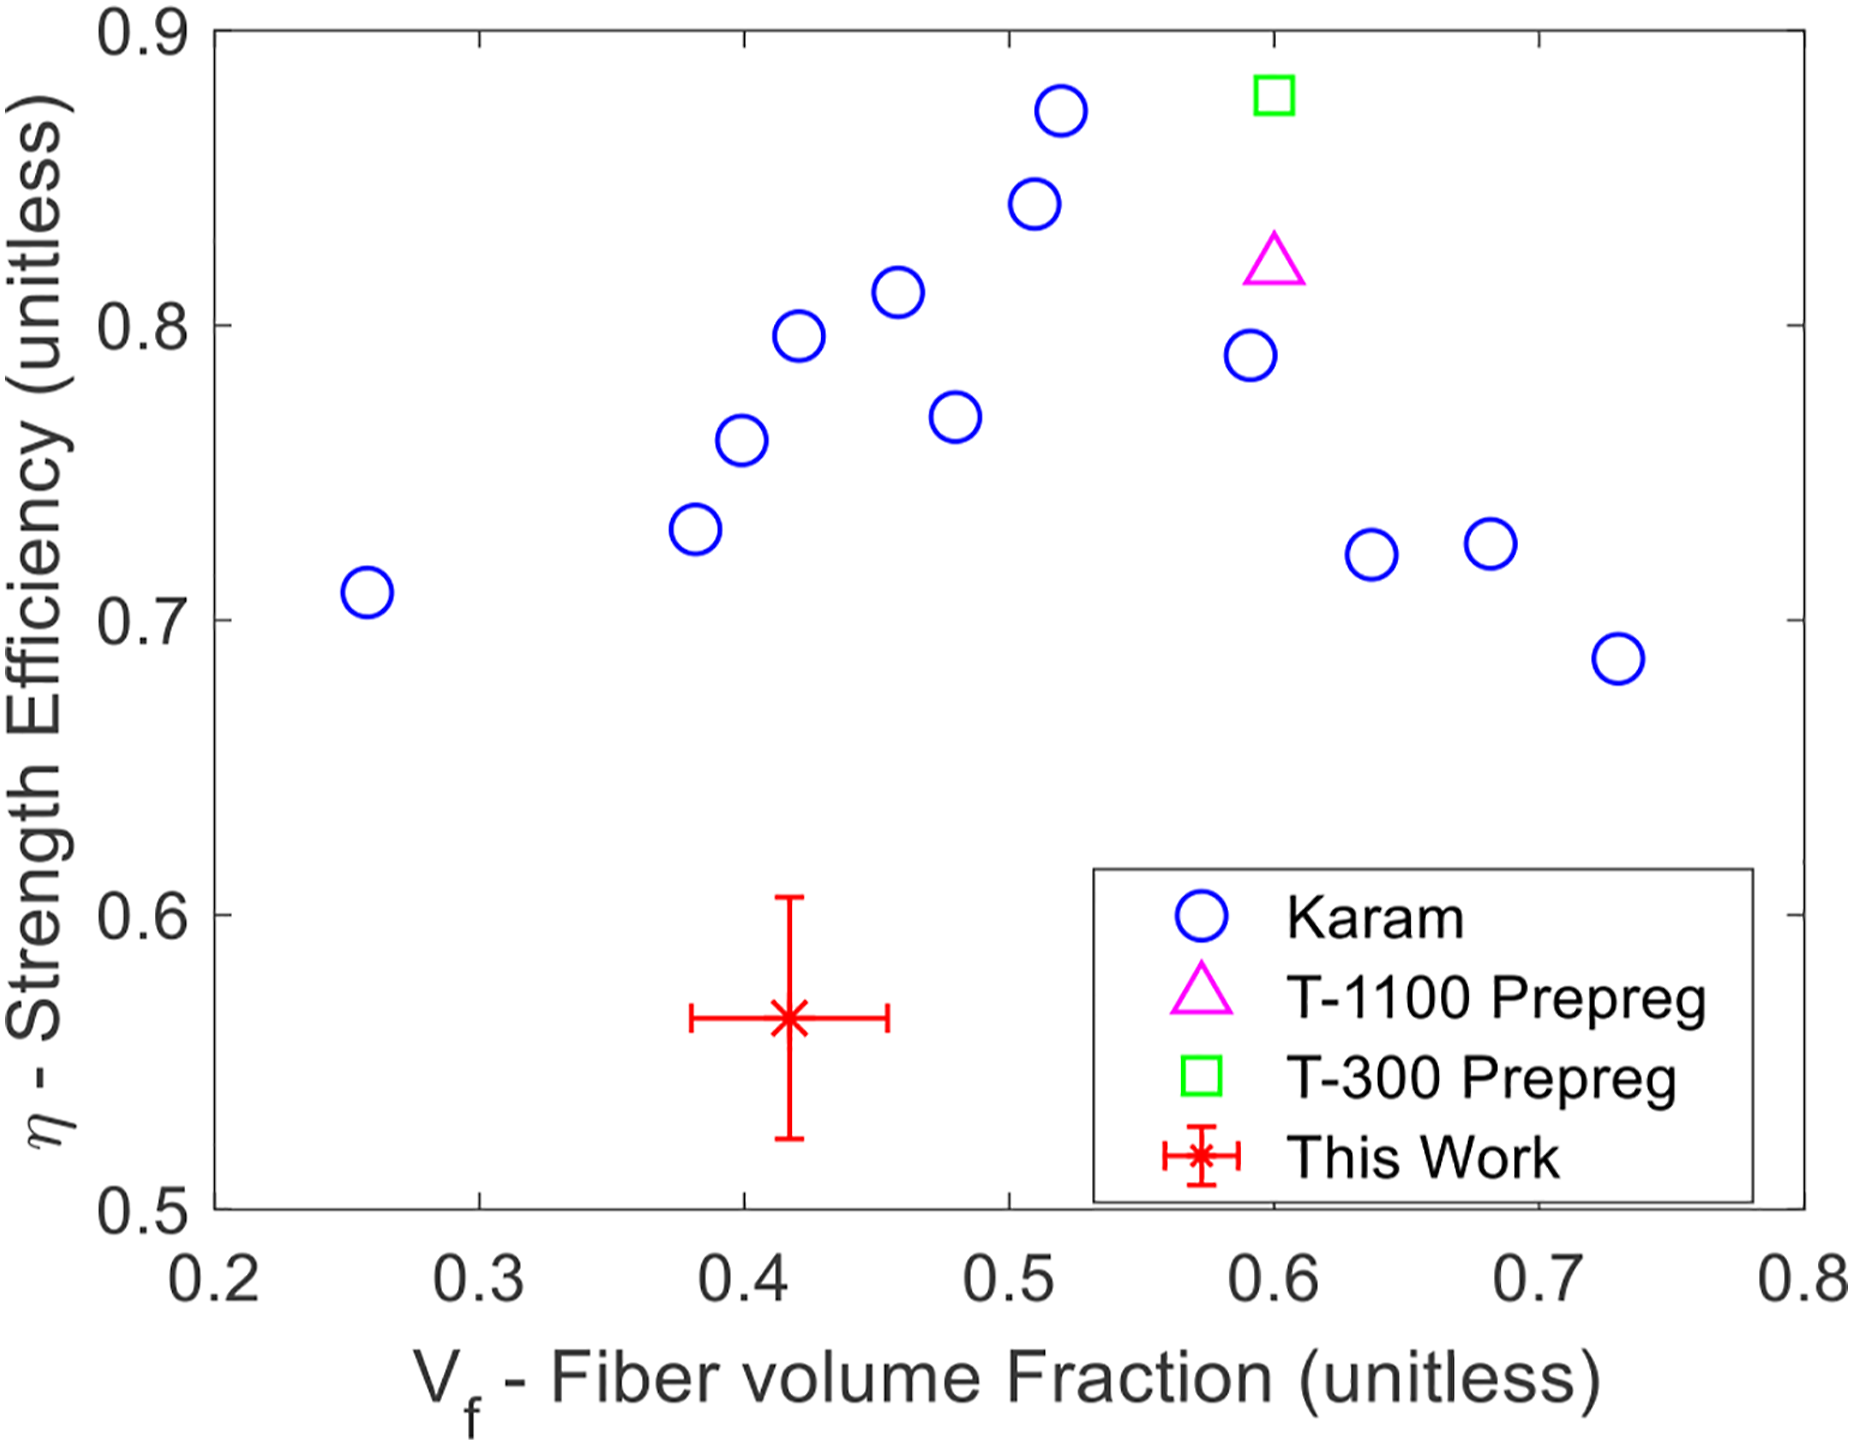
Transverse tensile properties
Transverse properties of both traditionally processed and additively printed unidirectional composites are typically much lower than longitudinal properties due to the anisotropy of reinforcing fibers and the tendency of defects to form during the stacking of multiple layers. For example, the previously mentioned T-1100/epoxy unidirectional composite has a strength of only 80 MPa in the transverse direction (90° from fiber direction) in comparison to a strength of 3460 MPa in the fiber direction – a ratio of ∼43. For the GF-2, this ratio is 71–72. The ratio is 38–42 for CATPRO14 which is closer to that of the tradition manufactured composites. Several factors influence the transverse tensile strength of composites, among which are the matrix strength, stress concentrations, fiber volume fraction, and the fiber-matrix interface. The matrix strength of the CATPRO14 resin has not been characterized. Therefore, this possible influence of matrix strength cannot be ruled out. The fiber volume fraction of the composites was similar, indicating that the stress concentration caused by fibers was likely similar. Although not directly measured, there is circumstantial evidence in Figure 9 to suggest a stronger fiber-matrix interface in the CATPRO14 composites. Scanning electron microscope (SEM) images were collected on transverse tensile fracture surfaces. A GF-2 fracture surface in Figure 9(a) shows individual carbon fibers that have separated from the matrix. Conversely, the CATPRO14 fracture surface in Figure 9(b) reveals a fiber bundle held together by the matrix. Improved fiber-matrix adhesion with the CATPRO14 resin relative to the GF-2 resin is supported by increased transverse tensile strength. Scanning electron microscope fracture surfaces of (a) GF-2 and (b) CATPRO14 transverse tensile coupons.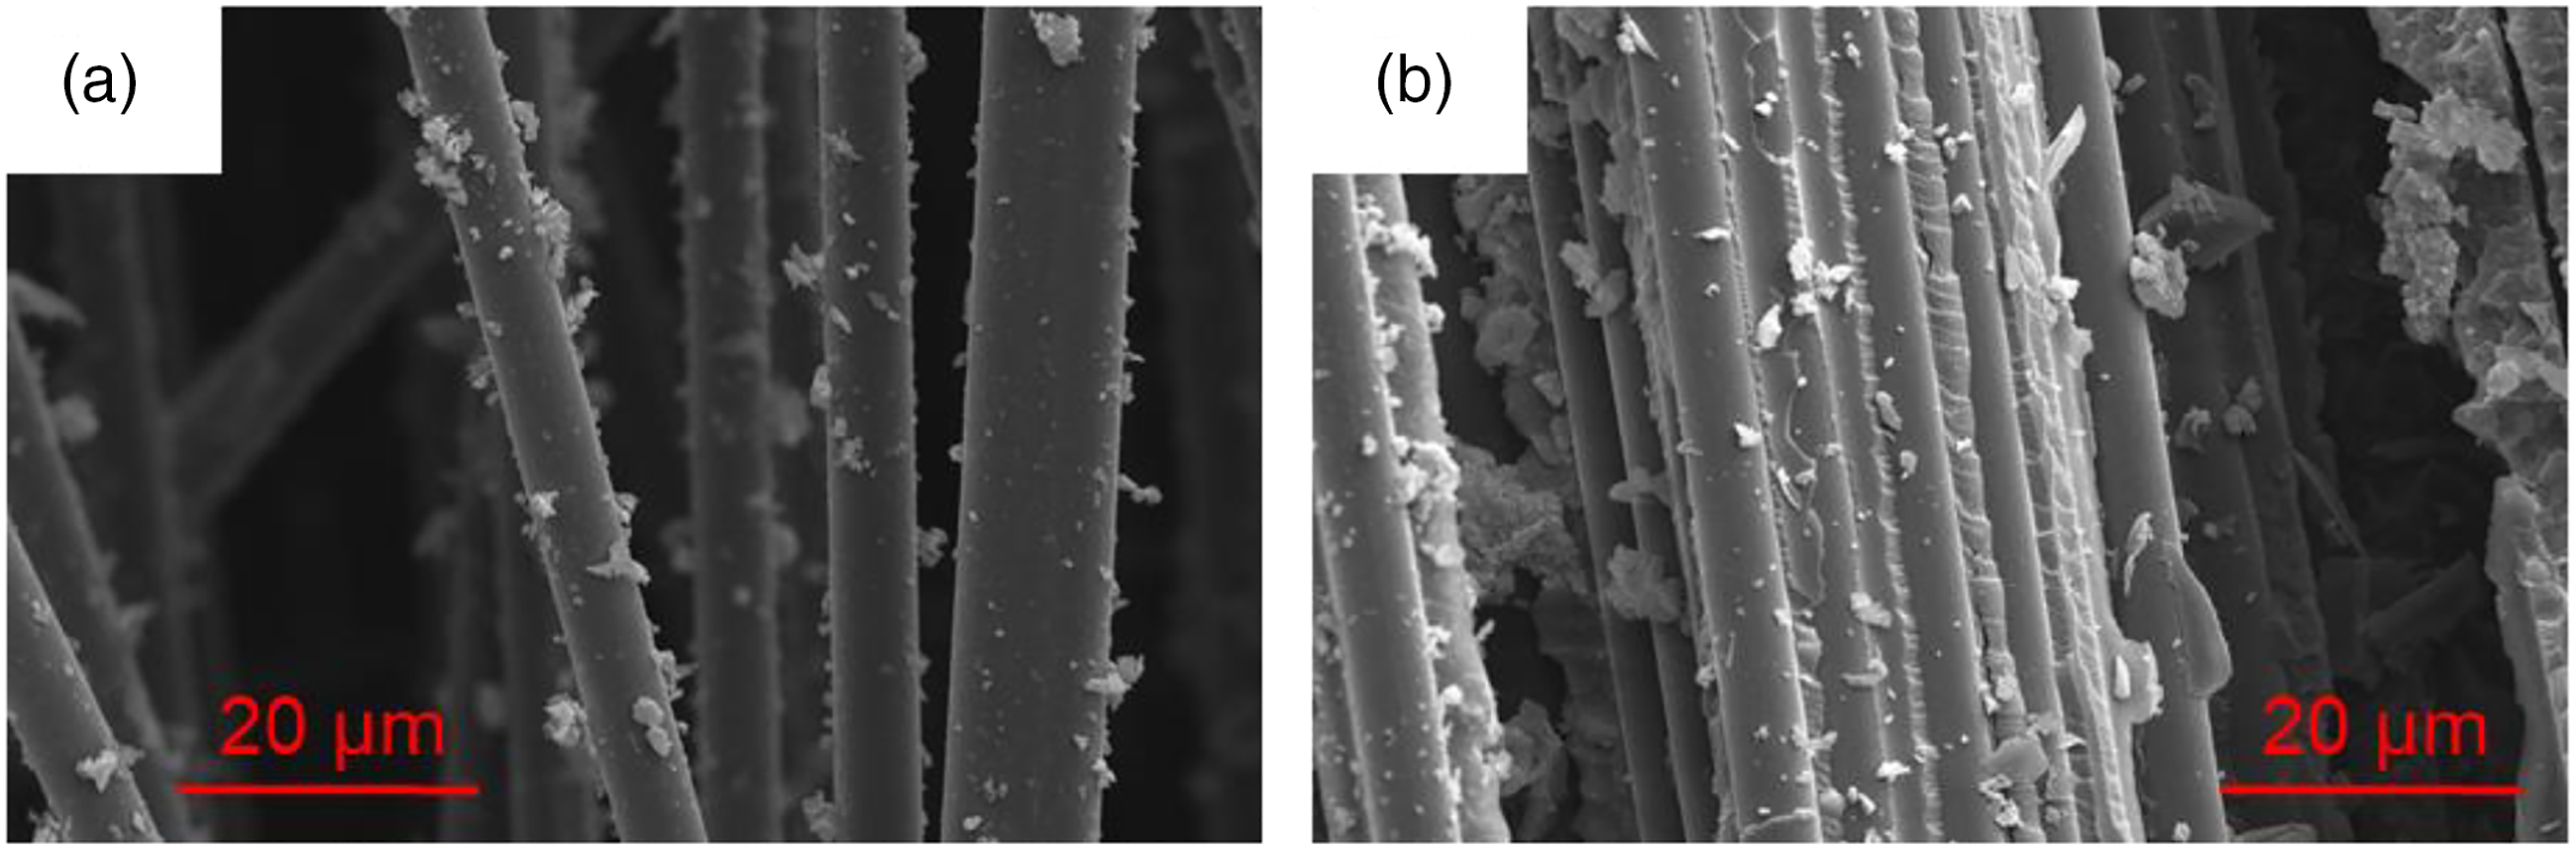
Shear properties
The shear strength was taken at 5% strain or the peak load prior to a load drop in the 16 layered ± 45 laminates. Stress–strain curves are given in Figure 10, where the average in-plane Strain strength was 54.9 ± 1.7 MPa and the average shear modulus, G12, was 2.8 ± 0.1 GPa. Two of the coupons saw load drops at strains less than 5% occurring at 2.8% and 1.7% strain. The remaining three coupons did not experience load drops prior to 5% strain. Stress–strain curves of ±45 in-plane shear tests.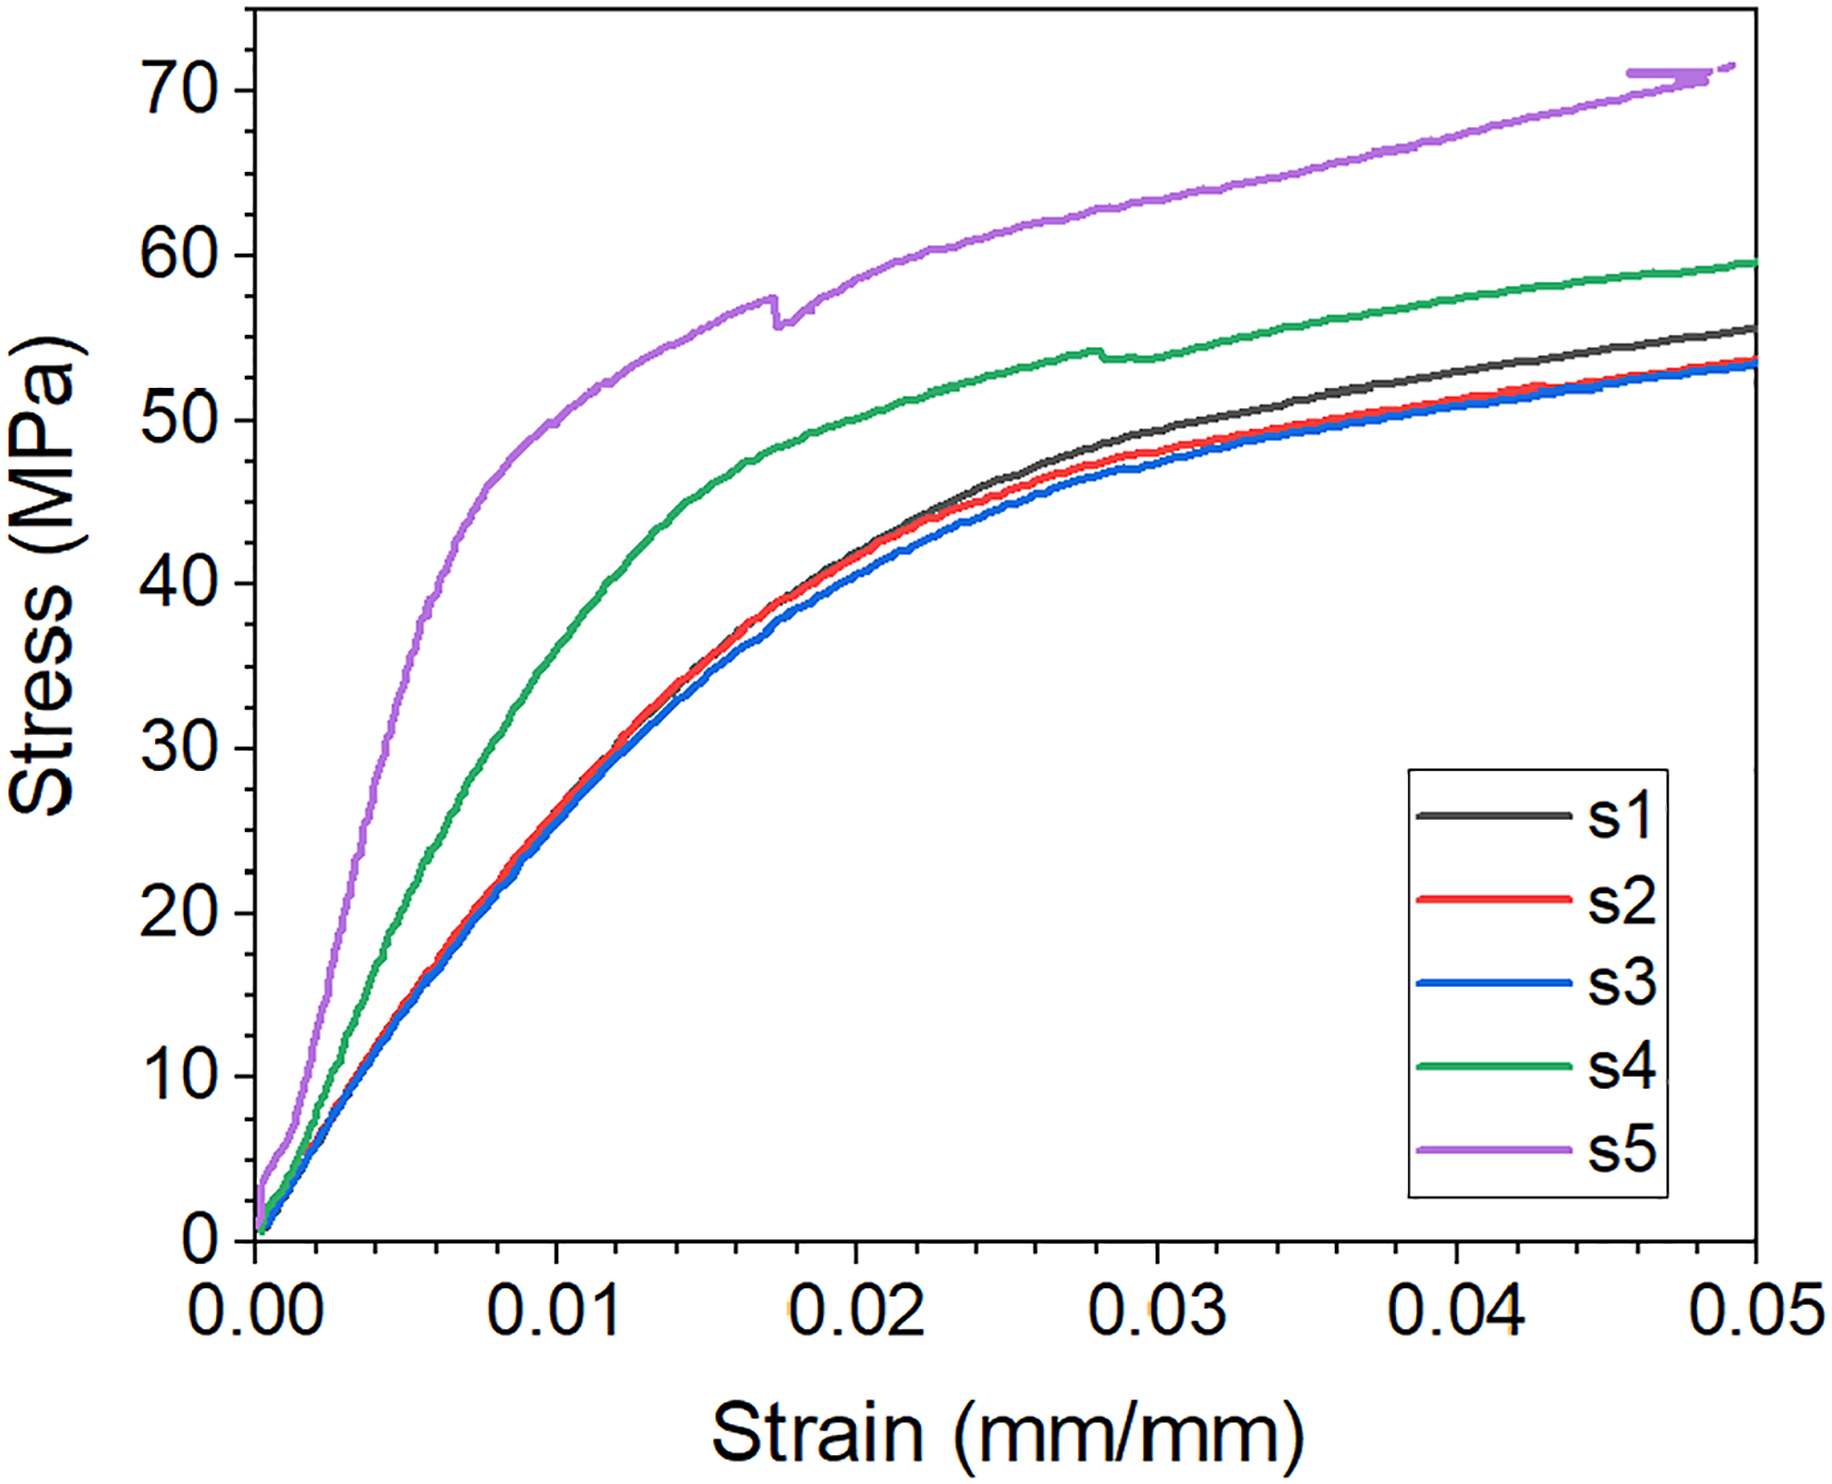
Optical microstructure measurements – composite fiber and void content
As shown in Figure 11, the fiber volume fraction from successively polished samples converges to the experimentally measured global fiber volume fraction of 41.5%. For comparison to the global properties, the local fiber and void content were identified for the images over 100 μm × 100 μm subregions. The variability in local fiber volume fraction along the print path was evaluated and an example is shown in the histograms shown in Figure 12. The large overlapping regions in Figure 11(a) indicate that there is not a significant difference in fiber volume fraction between samples polished to different depths, indicating that three micrographs per sample sufficiently describes the microstructure. The void content of the composites was also identified through the depth. For a representative sample shown in Figure 11(b), the void content is shown to be low and largely consistent from sample-to-sample. This indicates that voids, while infrequent, are largely homogeneously distributed throughout the depth of the sample in the print path. Note the logarithmic scale used for the y-axis in Figure 11(b). The high void content regions are few compared to the extremely low void content regions. Additionally, the void content in such regions may be an anomaly resulting from the windowing technique used to determine the subregion properties. For example, a relatively small circular void of 80 μm diameter centered in the 100 μm × 100 μm window will return 50% void volume fraction. Conversely, if that void were centered between two windows, each will return 25% void volume fraction. Similar arguments can be made regarding the right-hand tail of the fiber volume fraction histograms given in the supplemental information. Cumulative mean of fiber volume fraction from several micrographs converging to the acid digestion results. Histograms of (a) local fiber and (b) void volume fraction along the print path for micrograph set 2.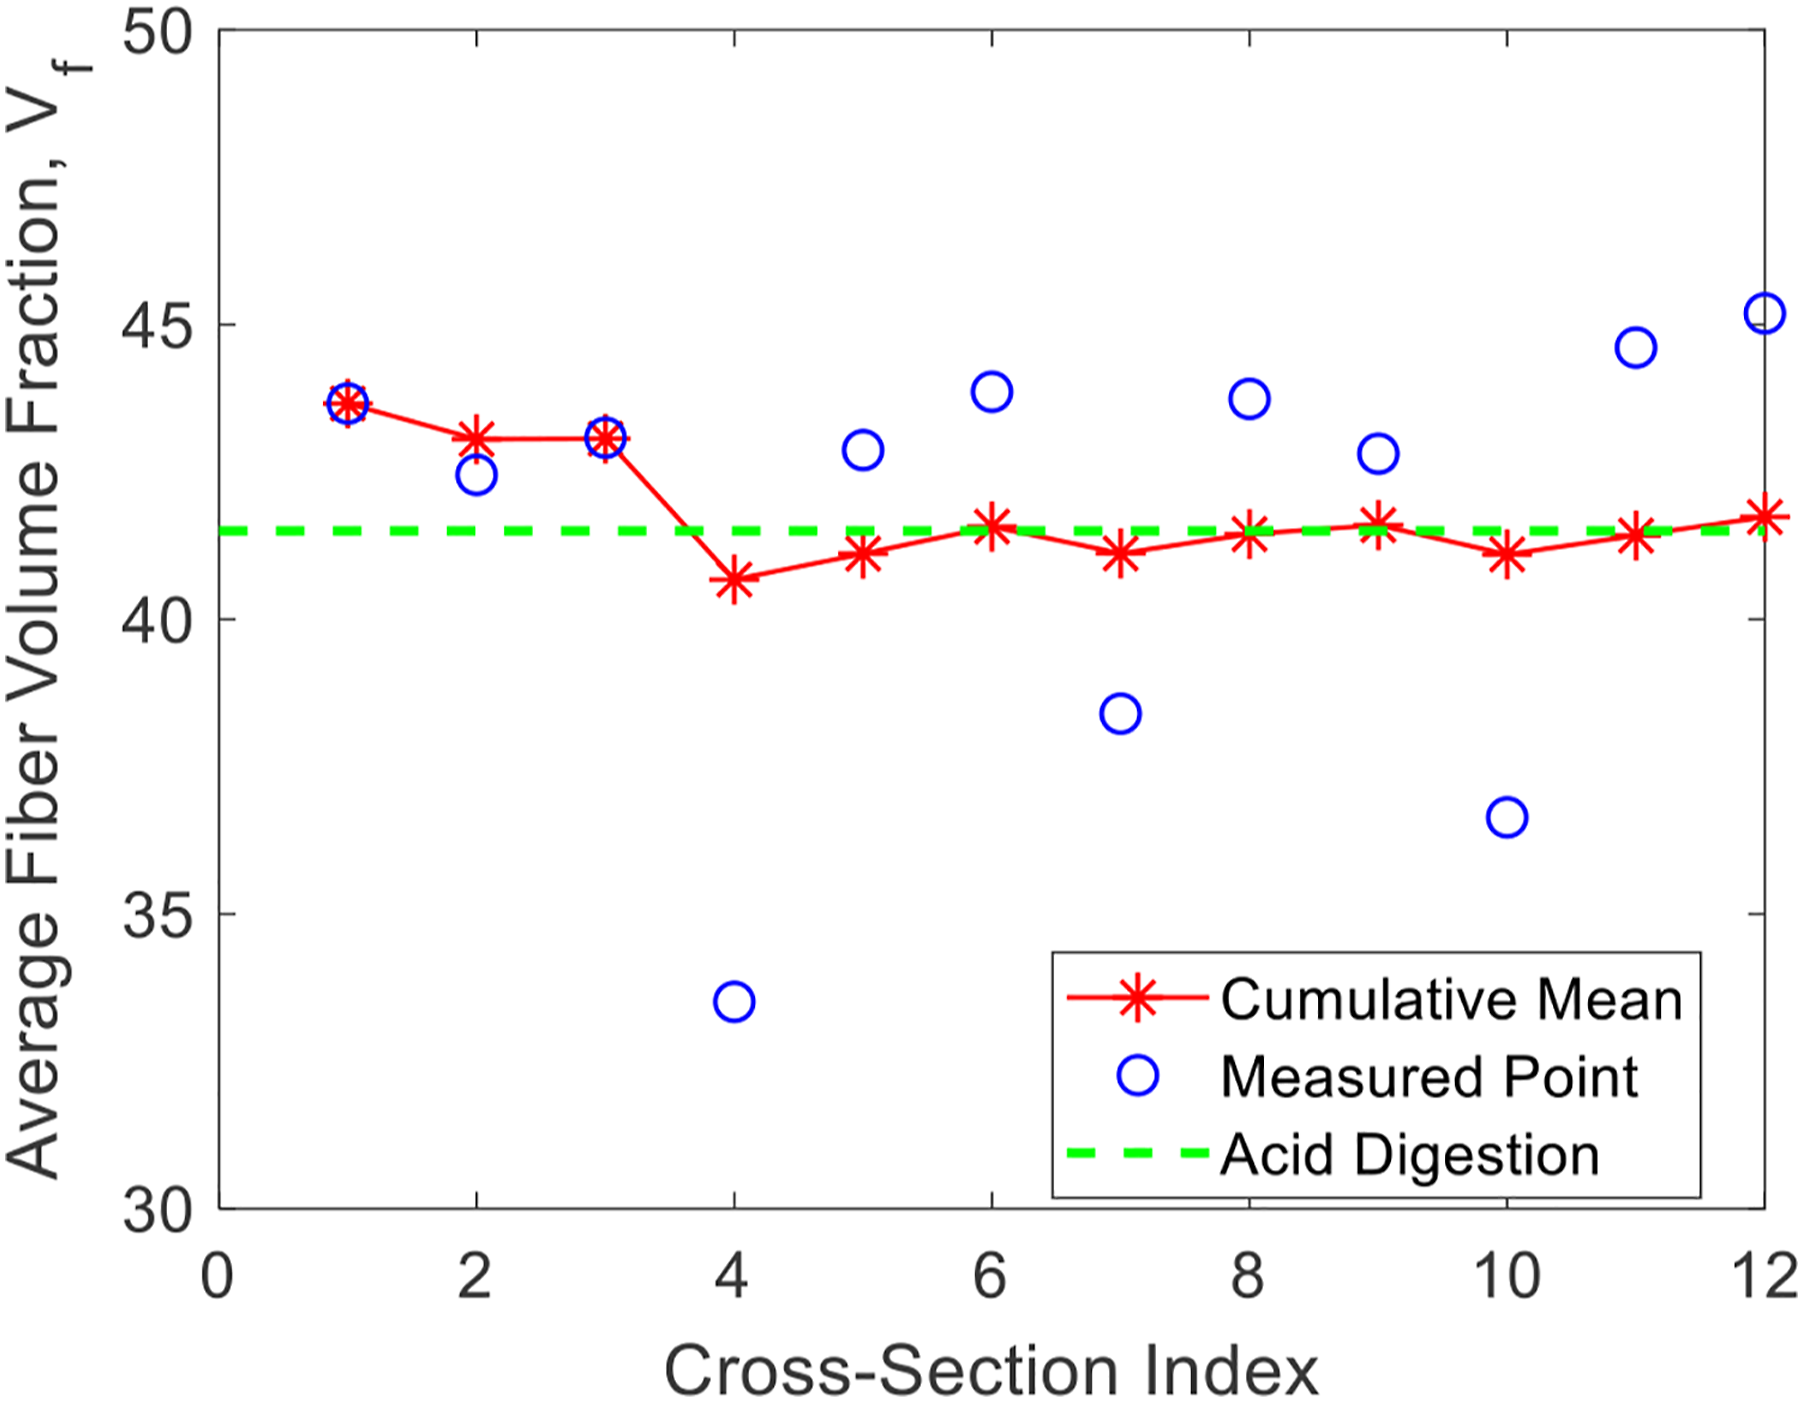
Optical microstructure measurements – determination of efficiency factors
Efficiency factors by micrograph set.
Optical microstructure measurements – macrostructure segmentation
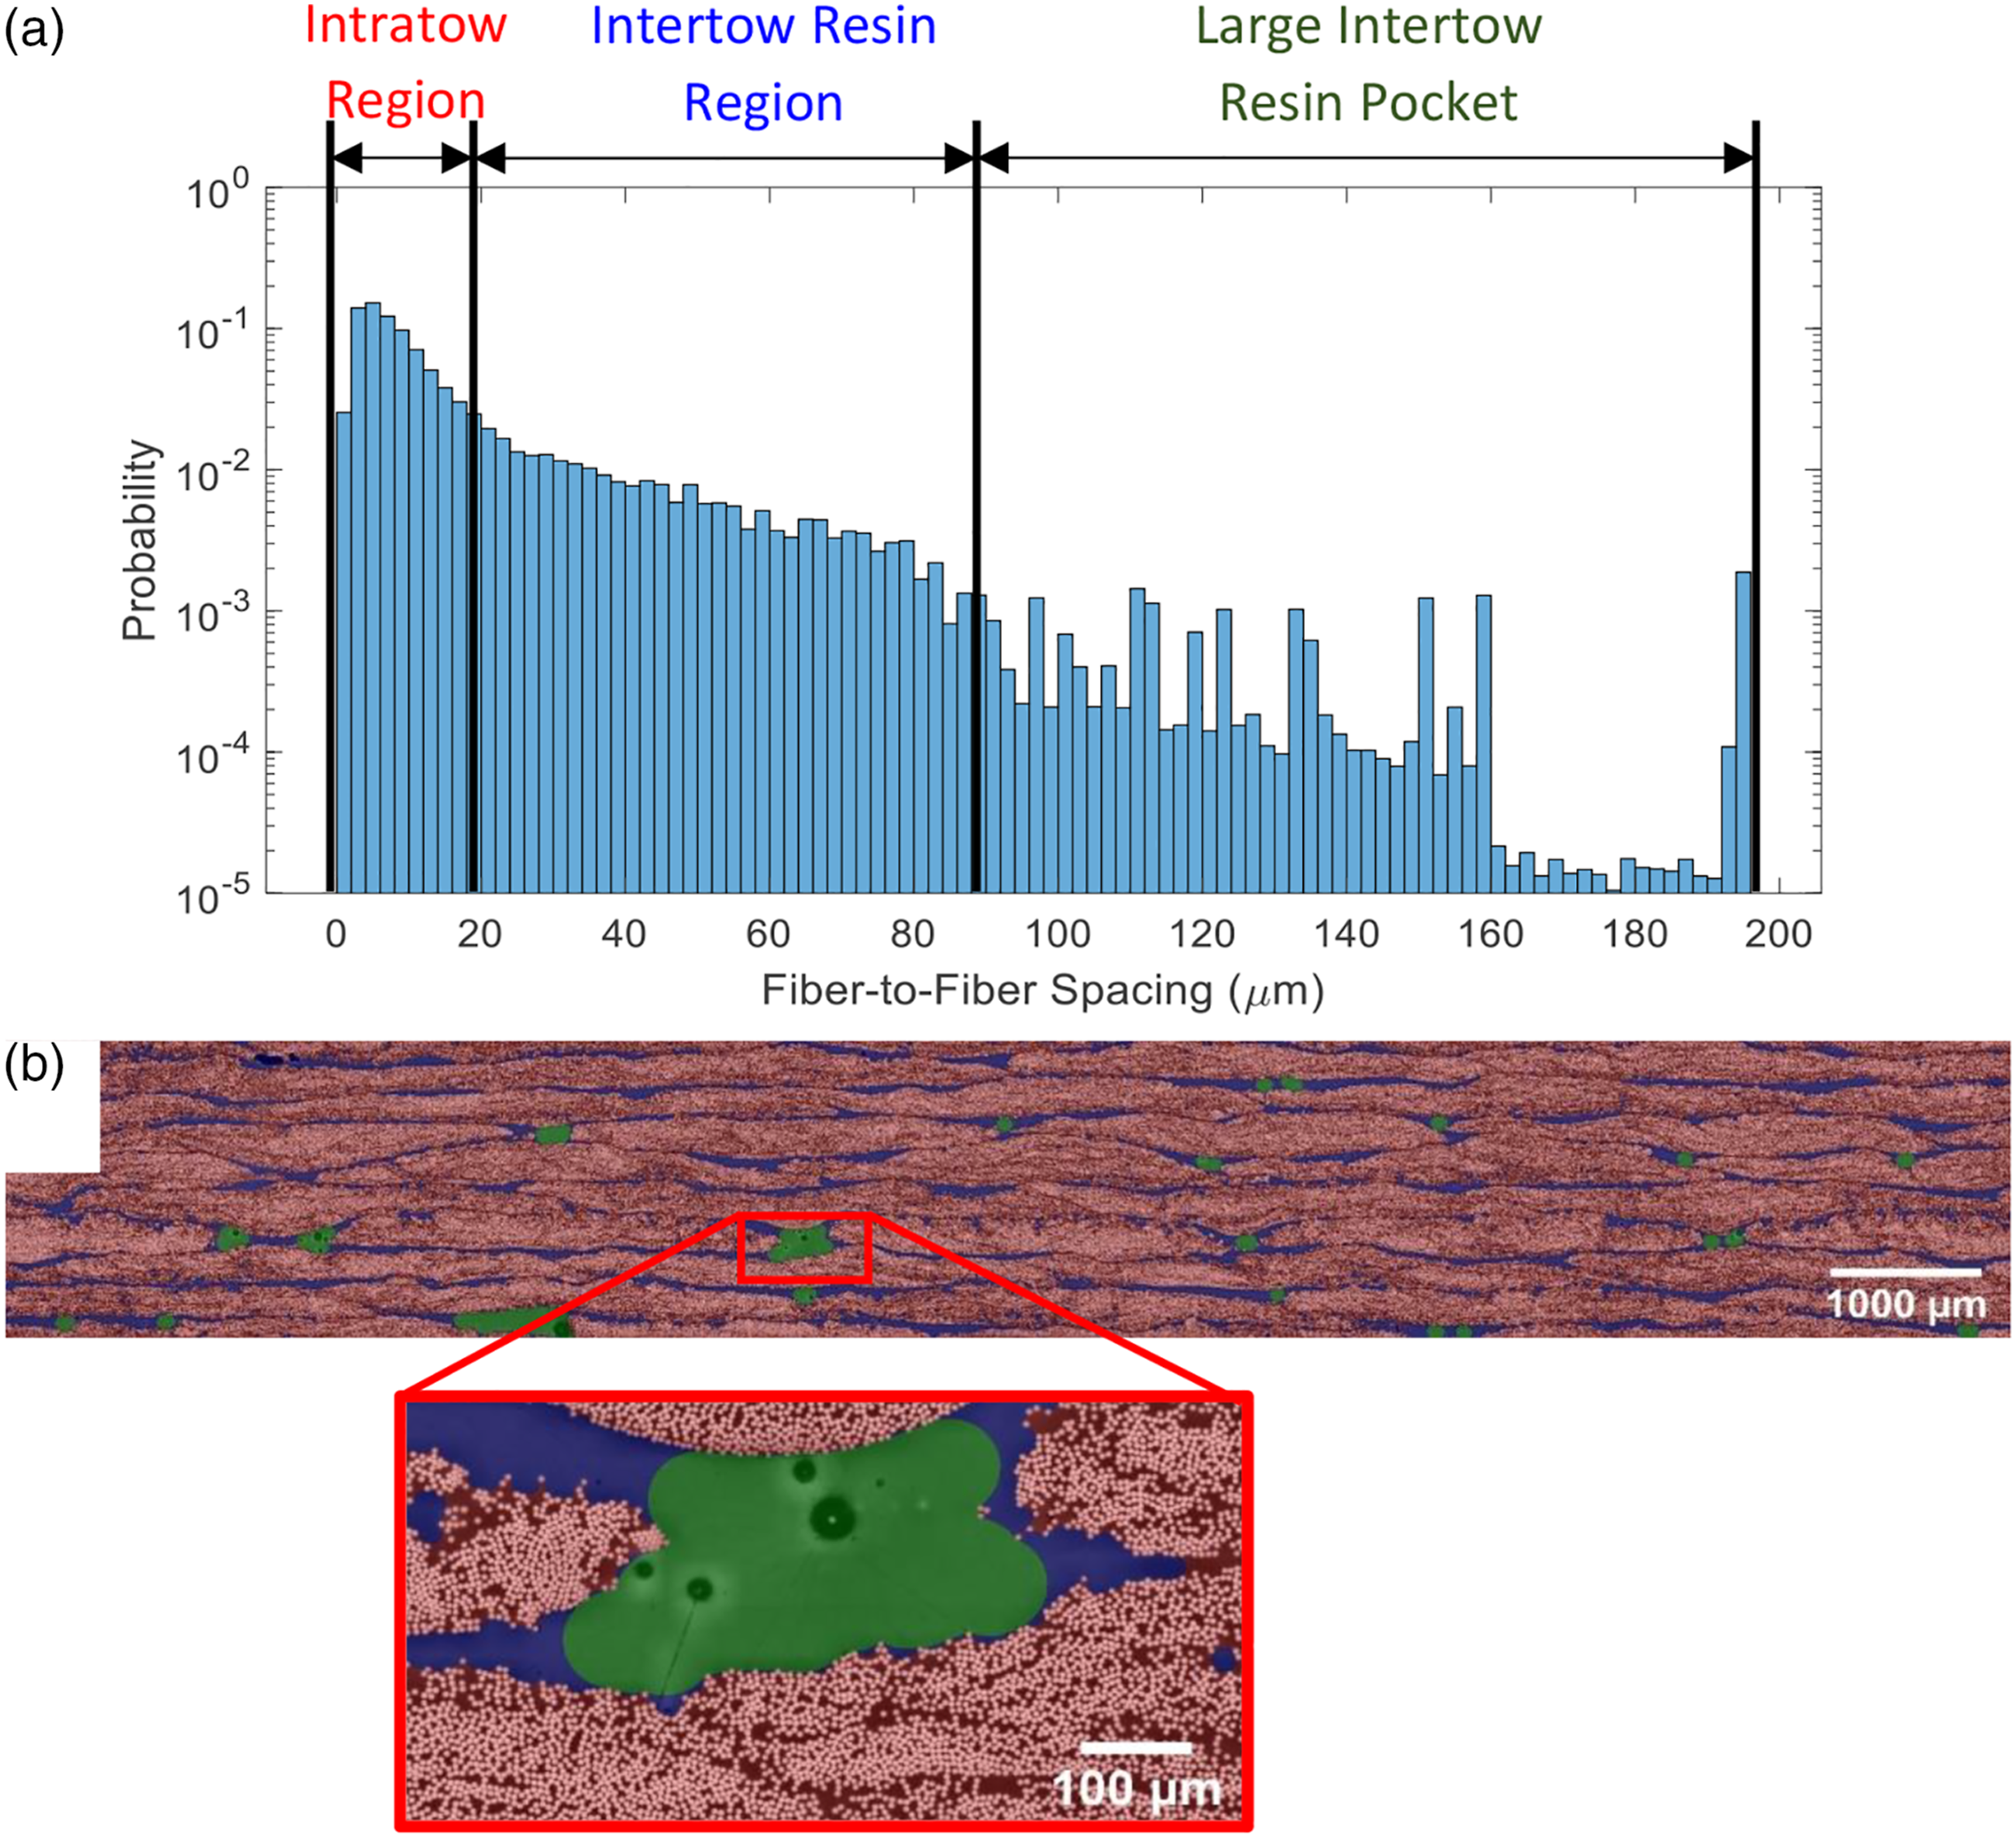
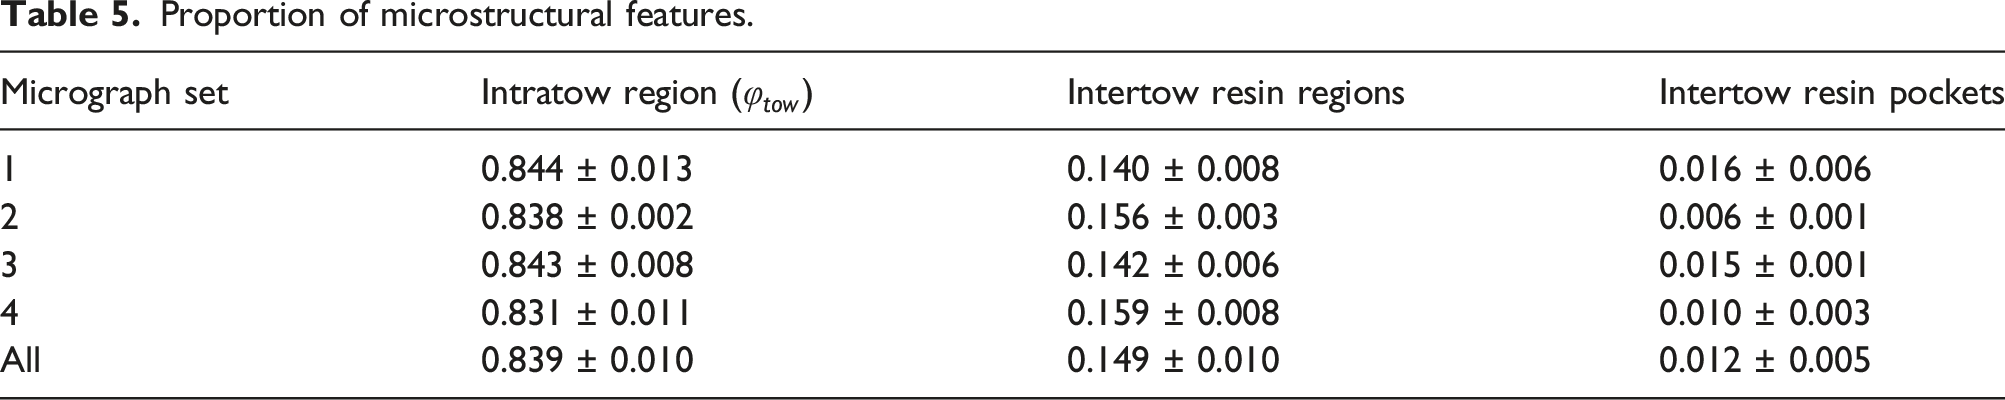
The histograms of the fiber-to-fiber distance of the optical micrographs exhibit three distinct phases: impregnated tows, intertow resin regions, and intertow resin pockets. These regions are captured in the volume thickness mapping. As shown in Figure 13(a), there is a change in the distribution trends near 20 μm, corresponding to the transitions from intratow to intertow regions. Another change is apparent near 90 μm, corresponding to the transition from intertow resin regions to intertow resin pockets. Beyond 100 μm spacing, the histogram is dominated by spikes corresponding to individual resin pockets, shown in Figure 14(b). The area percentage of each feature can be found in Table 5. Tows account for about 84% of the area in a cross-section, intertow resin regions account for about 15%, and intertow resin pockets account for about 1%. Illustration of fiber-to-fiber distance phases in a representative histogram (a) and overlaid on a real microstructure (b) and composed of the impregnated tow (red), the intertow resin region (blue), and the large intertow resin pocket (green). Process of fiber/matrix interface surface area calculations: the initial image (a) is thresholded to achieve image (b), the total number of fibers (N
f
) is estimated from the pixel area of white (Awhite) divided by the area of a single fiber, and the fiber outlines (S
f
) in image (c) are compared to the total circumference of the estimated total number of fibers (S
t
). Proportion of microstructural features.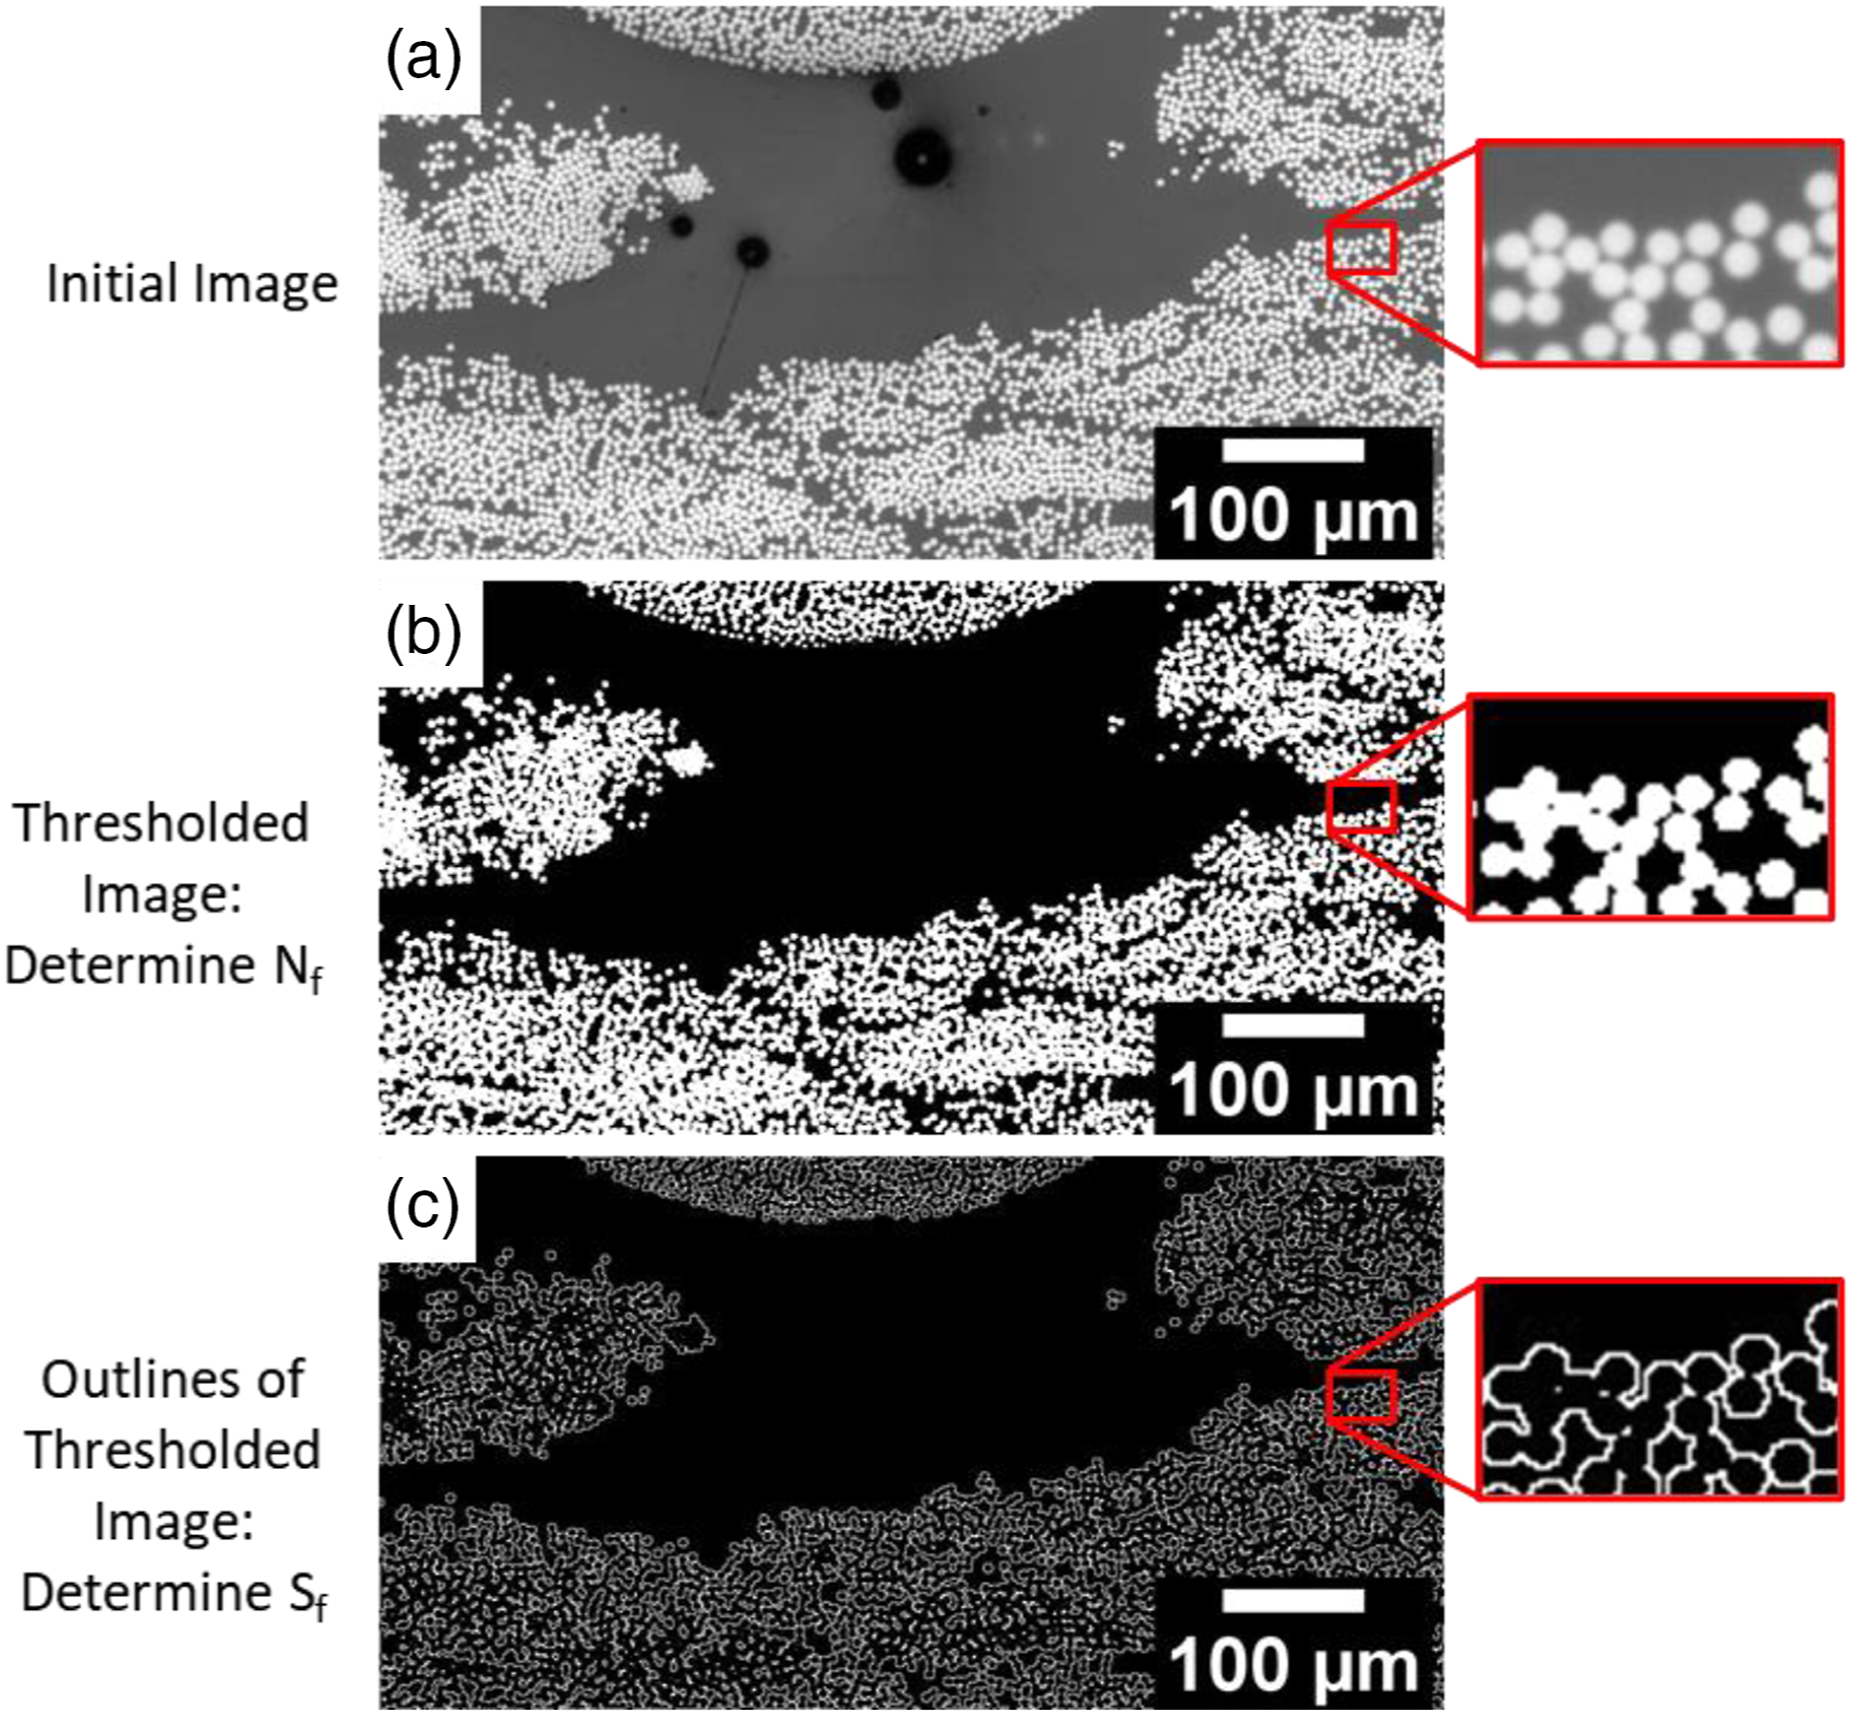
Tow geometry features.
Tow placement statistics.
Optical microstructure measurements – tow fiber content
As described earlier, all the fibers are found within the intratow region. As a result, the fiber volume fraction in our modified RoM in equations (5) and (7) refers to the fiber volume fraction within the segmented tows. Regional analysis revealed that the tow fiber volume fraction was significantly higher than the composite (48.9% vs. 41.5%), with reduced variability, as shown in Figure 15. That is to say that the packing of filaments within the tows, while still irregular, is more homogeneous than the packing of the same filaments within the whole composite due to the variation in tow packing from which the intertow resin regions and pockets arise. Variation in local fiber volume fraction for composites (a) and within tows (b).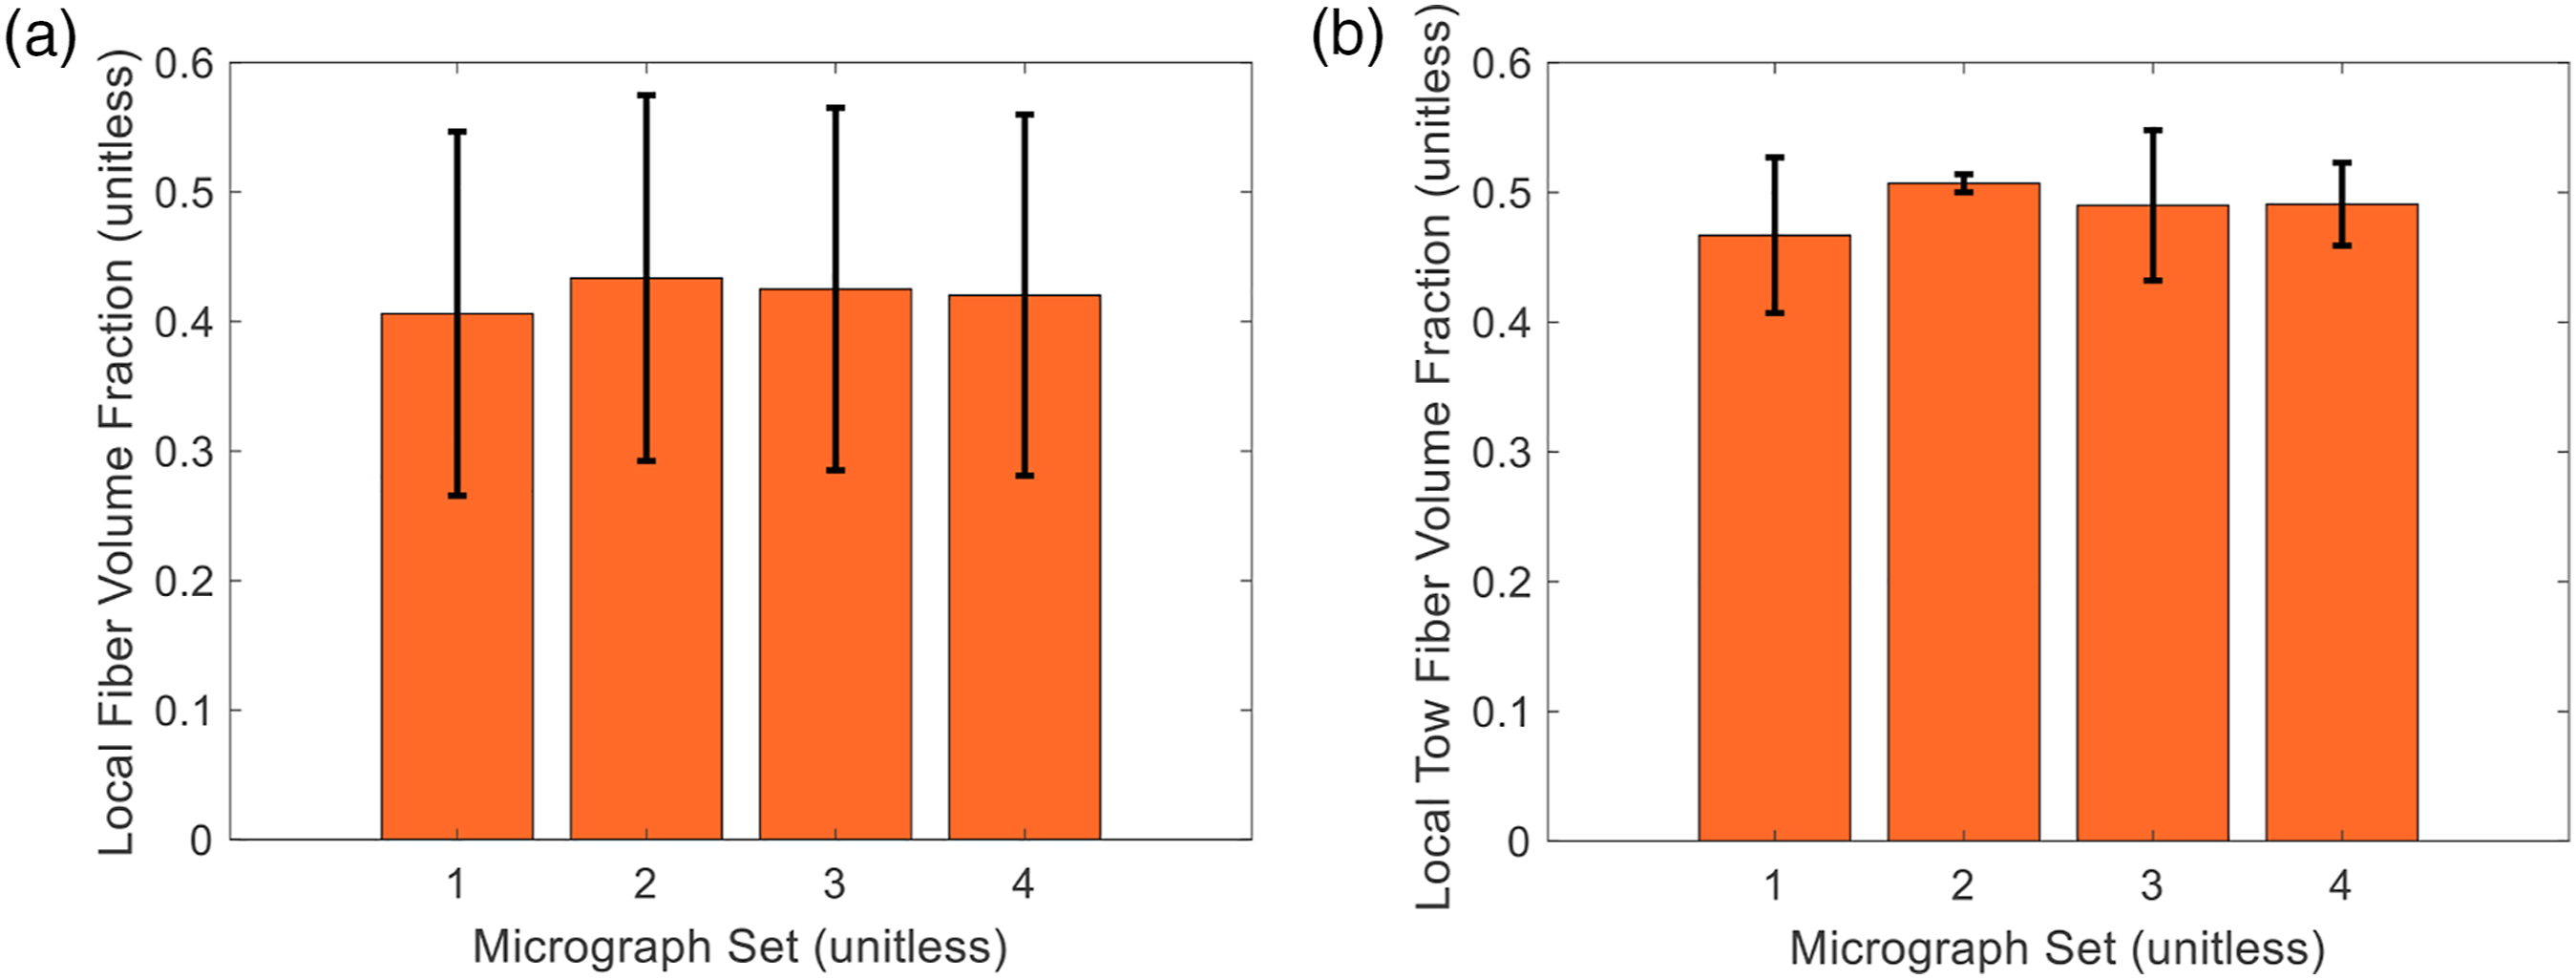
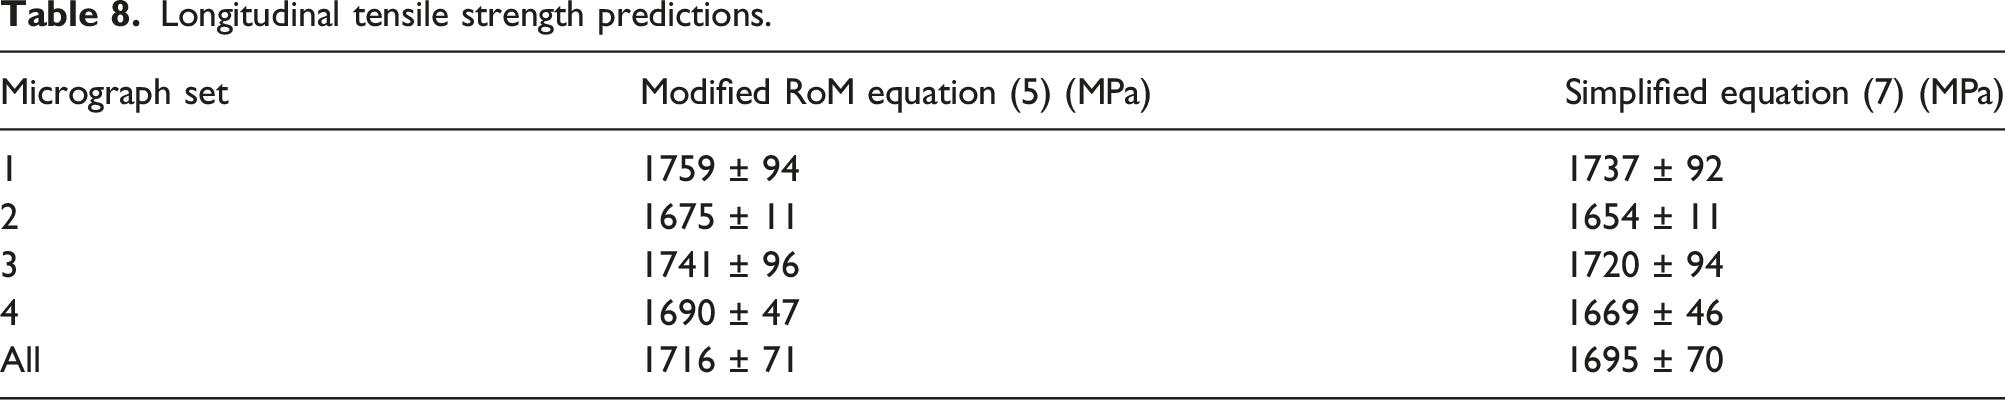
Prediction of longitudinal tensile strength
Longitudinal tensile strength predictions.
To better understand the factors contributing to the longitudinal tensile failure of printed composites, one must consider the implications of the Karam model that has been modified for this work. The model is predicated on the concept of fiber interactions leading to premature failure when benchmarked against the Rule of Mixtures. In this way, Karam’s model accounts for intratow inhomogeneity, where tightly packed filaments are more likely to yield more surface area that is not in contact with the matrix. Indeed, they showed that the predicted strength of Kevlar/epoxy composites produced via prepregs with varying fiber volume fraction was well-predicted, as shown in Figure 16. However, the fiber interactions in this work exceeded those in their experiments. While their model was reasonably close, these tightly packed tows represented larger fiber–fiber interactions than any of the experiments they used for comparison to their model. This yields two key implications for printed composites: (1) the tow-based macrostructure negatively influences the longitudinal tensile strength and (2) the inhomogeneity at both the micro and macro scales appears to have a strong influence on the longitudinal tensile strength. Comparison of experiments and theory show that Karam’s modified RoM does not completely capture the printed composite longitudinal strength efficiency estimated from mechanical testing.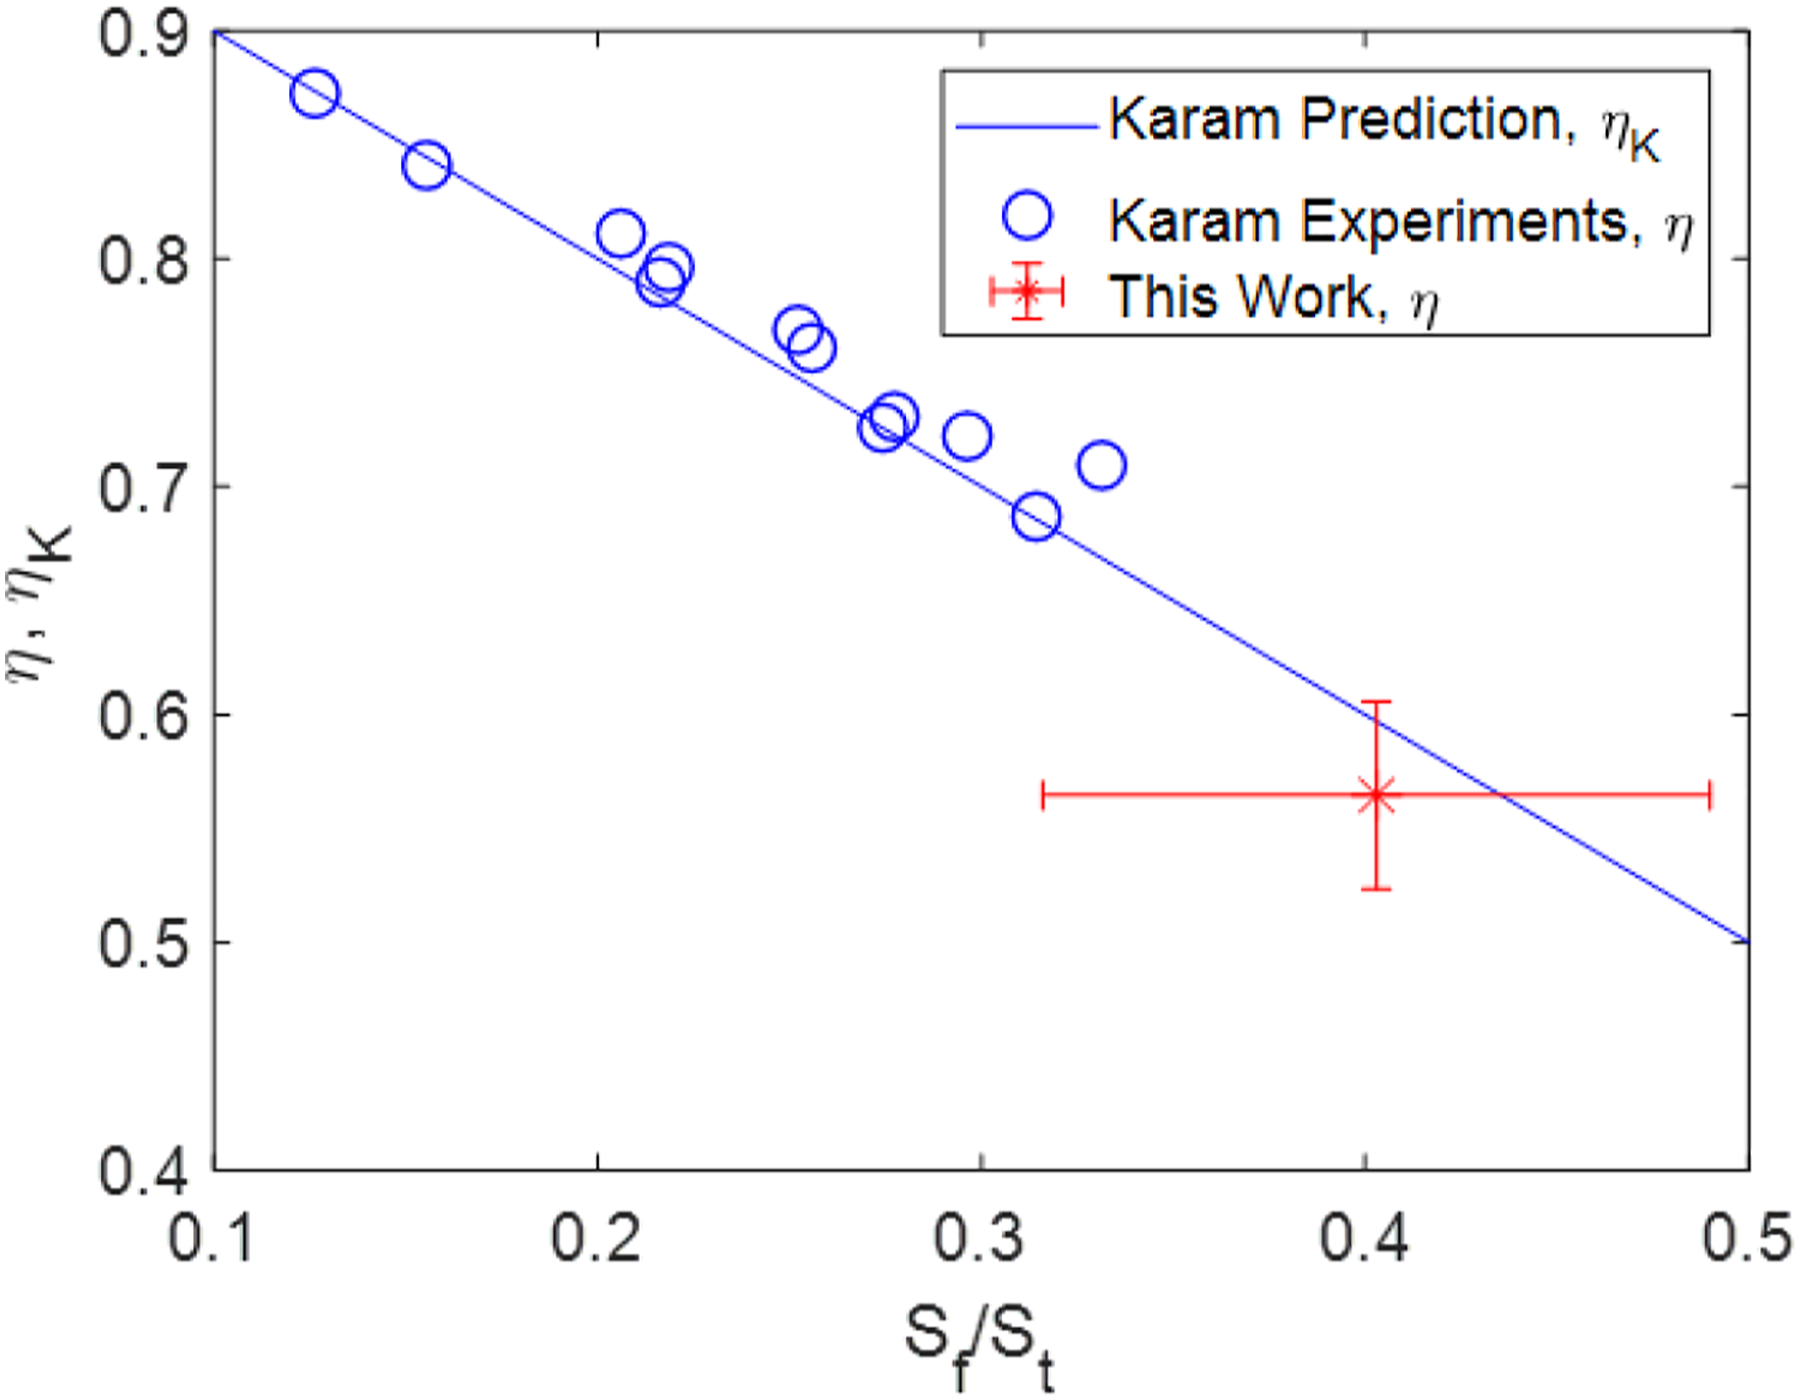
Overall, the quantification of the real microstructure allows for the development of physically relevant models. If coupled with machine learning and validation through experiments, as has been done for predicting the transverse tensile strength of ceramic matrix composites with inhomogeneous microstructures, 20 a powerful tool for predicting the longitudinal properties of the uniquely inhomogeneous microstructure of printed composites could be realized.
Microvascular assessment
The design flexibility of printed composites lends itself to the future inclusion of microvascular channels with minimal impact on the mechanical properties. Several authors have shown small reductions in the tensile,21,22 flexural 23 and energy absorption 24 properties of microvascular laminates. Mode I fracture toughness has even been shown to exhibit a slight increase due to crack blunting.25,26 Channel diameter plays a significant role in the resulting mechanical properties, as well as functional properties such as active cooling. In the case of active cooling, the pumping pressure required to move fluid through the microchannel network scales linearly with channel length, fluid dynamic viscosity, and flow rate, but to the fourth power with channel diameter, based on the Hagen-Poiseuille equation. 23 As a result, channel diameter should be sufficiently large to limit pumping pressure and power requirements for a given fluid in a channel of a given length flowing at a given flow rate.
Microchannels can be located in the large intertow resin pockets, for a total channel volume near 1%. The maximum channel diameter for inclusion in all available resin pockets is roughly 90 μm, which translates to a pumping pressure of 10.4 KPa per 1.0 mm of length for a fluid with 1 cP dynamic viscosity flowing at 1 mL/min. Channels located in the resin pockets are not expected to degrade the longitudinal tensile strength of printed composites significantly, due to the small proportion of intratow resin pocket regions, the small contribution of the intratow region strength (relative to the tows) to the properties of the composite, and the assumed constant tow shape and fiber packing. It should be noted, however, that the current formation of intertow resin pockets appear to be random rather than highly controlled. As such, it may not be possible to replace resin pockets with microchannels in a predictable manner.
Instead, microvasculature can be more readily integrated into printing through the inclusion of sacrificial catalyzed polylactic acid (cPLA) filaments
27
placed within the fiber tow and co-printed. Following cure, the cPLA is removed by heating above 200°C for several hours in a vacuum oven. The sacrificial cPLA template undergoes depolymerization and vaporization during thermal treatment, leaving behind the microchannels. The impact on the longitudinal tensile strength of printed composites containing microchannels was predicted for channels located at the centroid of the tow identified earlier. Channels were assumed to be circular, with a maximum diameter ranging from 100 μm to 300 μm to fit within the measured tow structure. For microchannels of 100 μm, 200 μm, and 300 μm diameter, the pumping pressure required to move a fluid with 1 cP dynamic viscosity a length of 1.0 mm at a flow rate of 1 mL min−1 is 6791 Pa, 424 Pa, and 84 Pa, respectively. The microchannels were assumed to rearrange the fibers within the tow without changing the tow shape, thereby increasing fiber-to-fiber interactions and increasing tow fiber volume fraction, as detailed in SI Section 4. The resulting longitudinal tensile strength predictions are shown in Figure 17. The inclusion of microchannels is expected to lead to a slight decrease in longitudinal tensile strength of the composites, mainly due to the decreased strength efficiency resulting from an increase in fiber-to-fiber interactions and the introduction of cylindrical voids aligned in the fiber direction. Microchannels of 100 μm, 200 μm, and 300 μm are expected to yield channel volumes of 1.1%, 4.3%, and 9.1%, respectively. The resulting reduction in longitudinal tensile strength is calculated to be 1.0%, 4.0%, and 9.7%, respectively. This decrease is proportional to the channel volume and is in reasonable agreement with previously measured reductions in longitudinal tensile strength in microvascular composites.
22
Such volumes of channels would be more than sufficient to enable multifunctional concepts (active thermal management, self-healing, adaptive RF, etc.) that rely upon the movement of fluids within a structural composite. Predicted longitudinal tensile strength as a function of microchannel diameter showing small strength reductions due to embedded vasculature.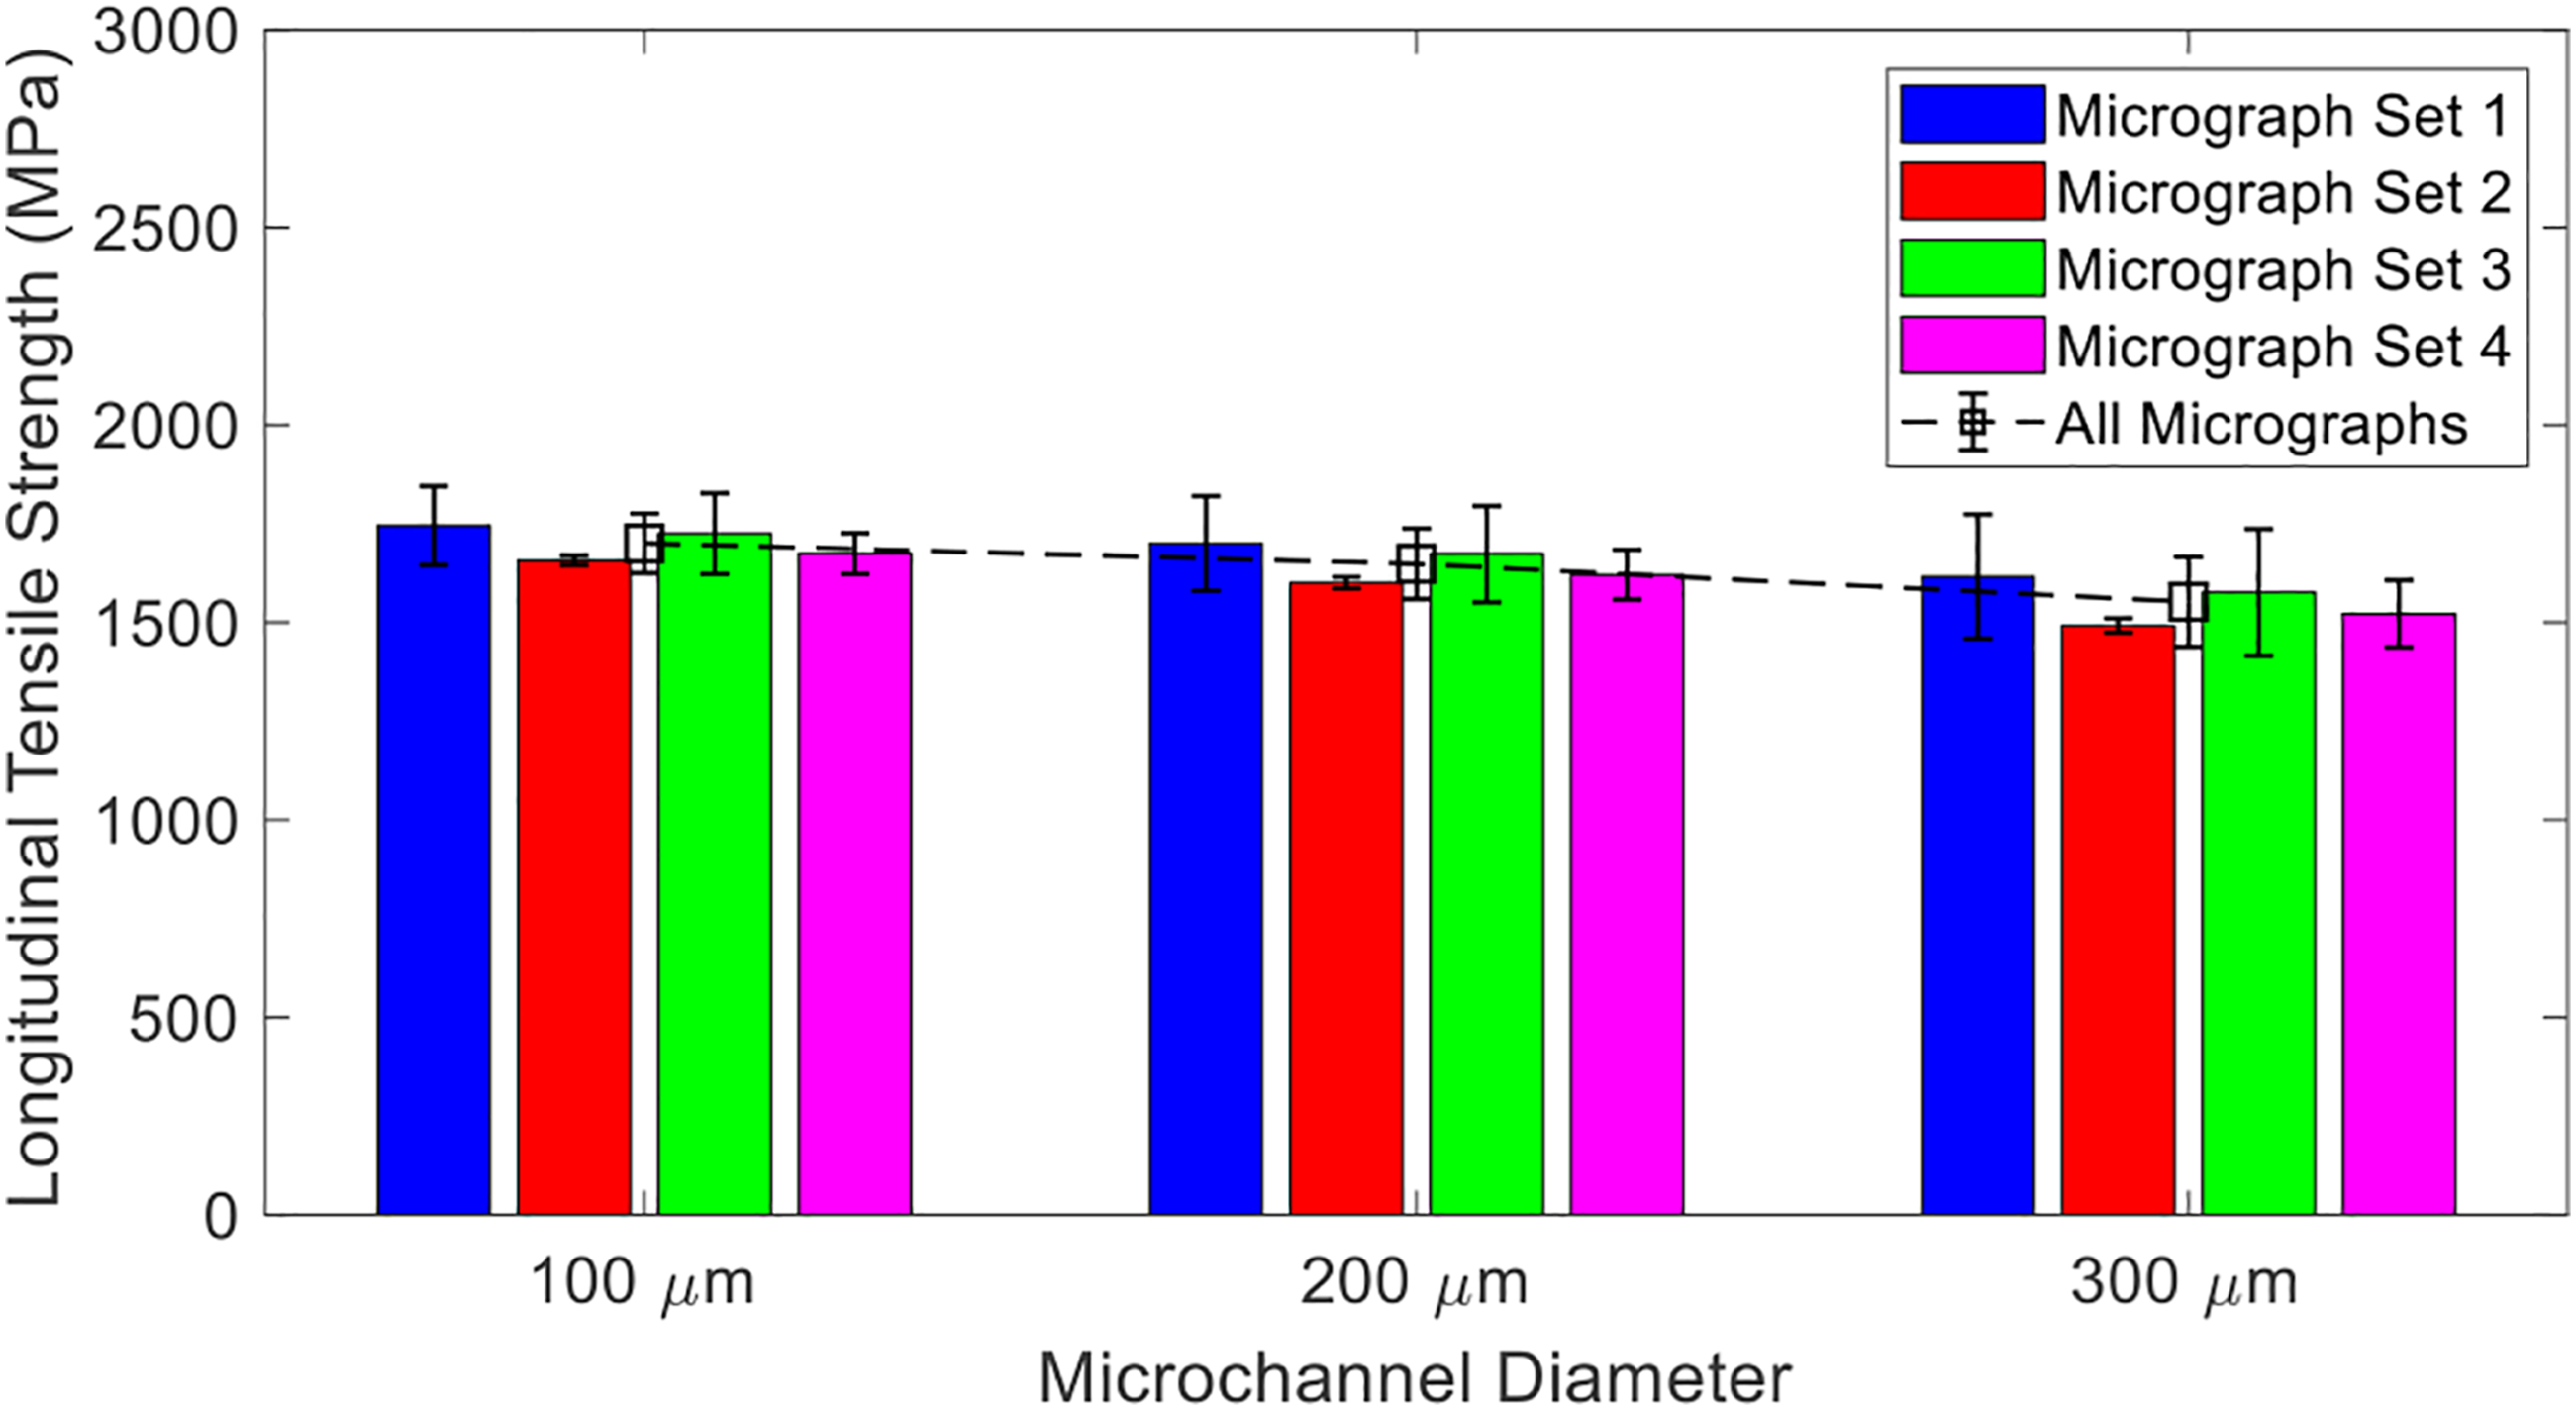
Overall, we see that CF3D® is an additive process that is producing composites close to traditionally manufactured aerospace-grade T300/epoxy composites. However, the Karam strength efficiency (0.6) is significantly lower than traditionally manufactured composites for the same fiber (0.82). This is attributed to a higher fiber–fiber contact that results from the tow-based deposition in CF3D® (Figure 18). Demonstration of structures created by the CF3D® process including overhanging cylinders in (a) and truss-like features (b) for overwrapped airfoils (c) approximately 300 mm long.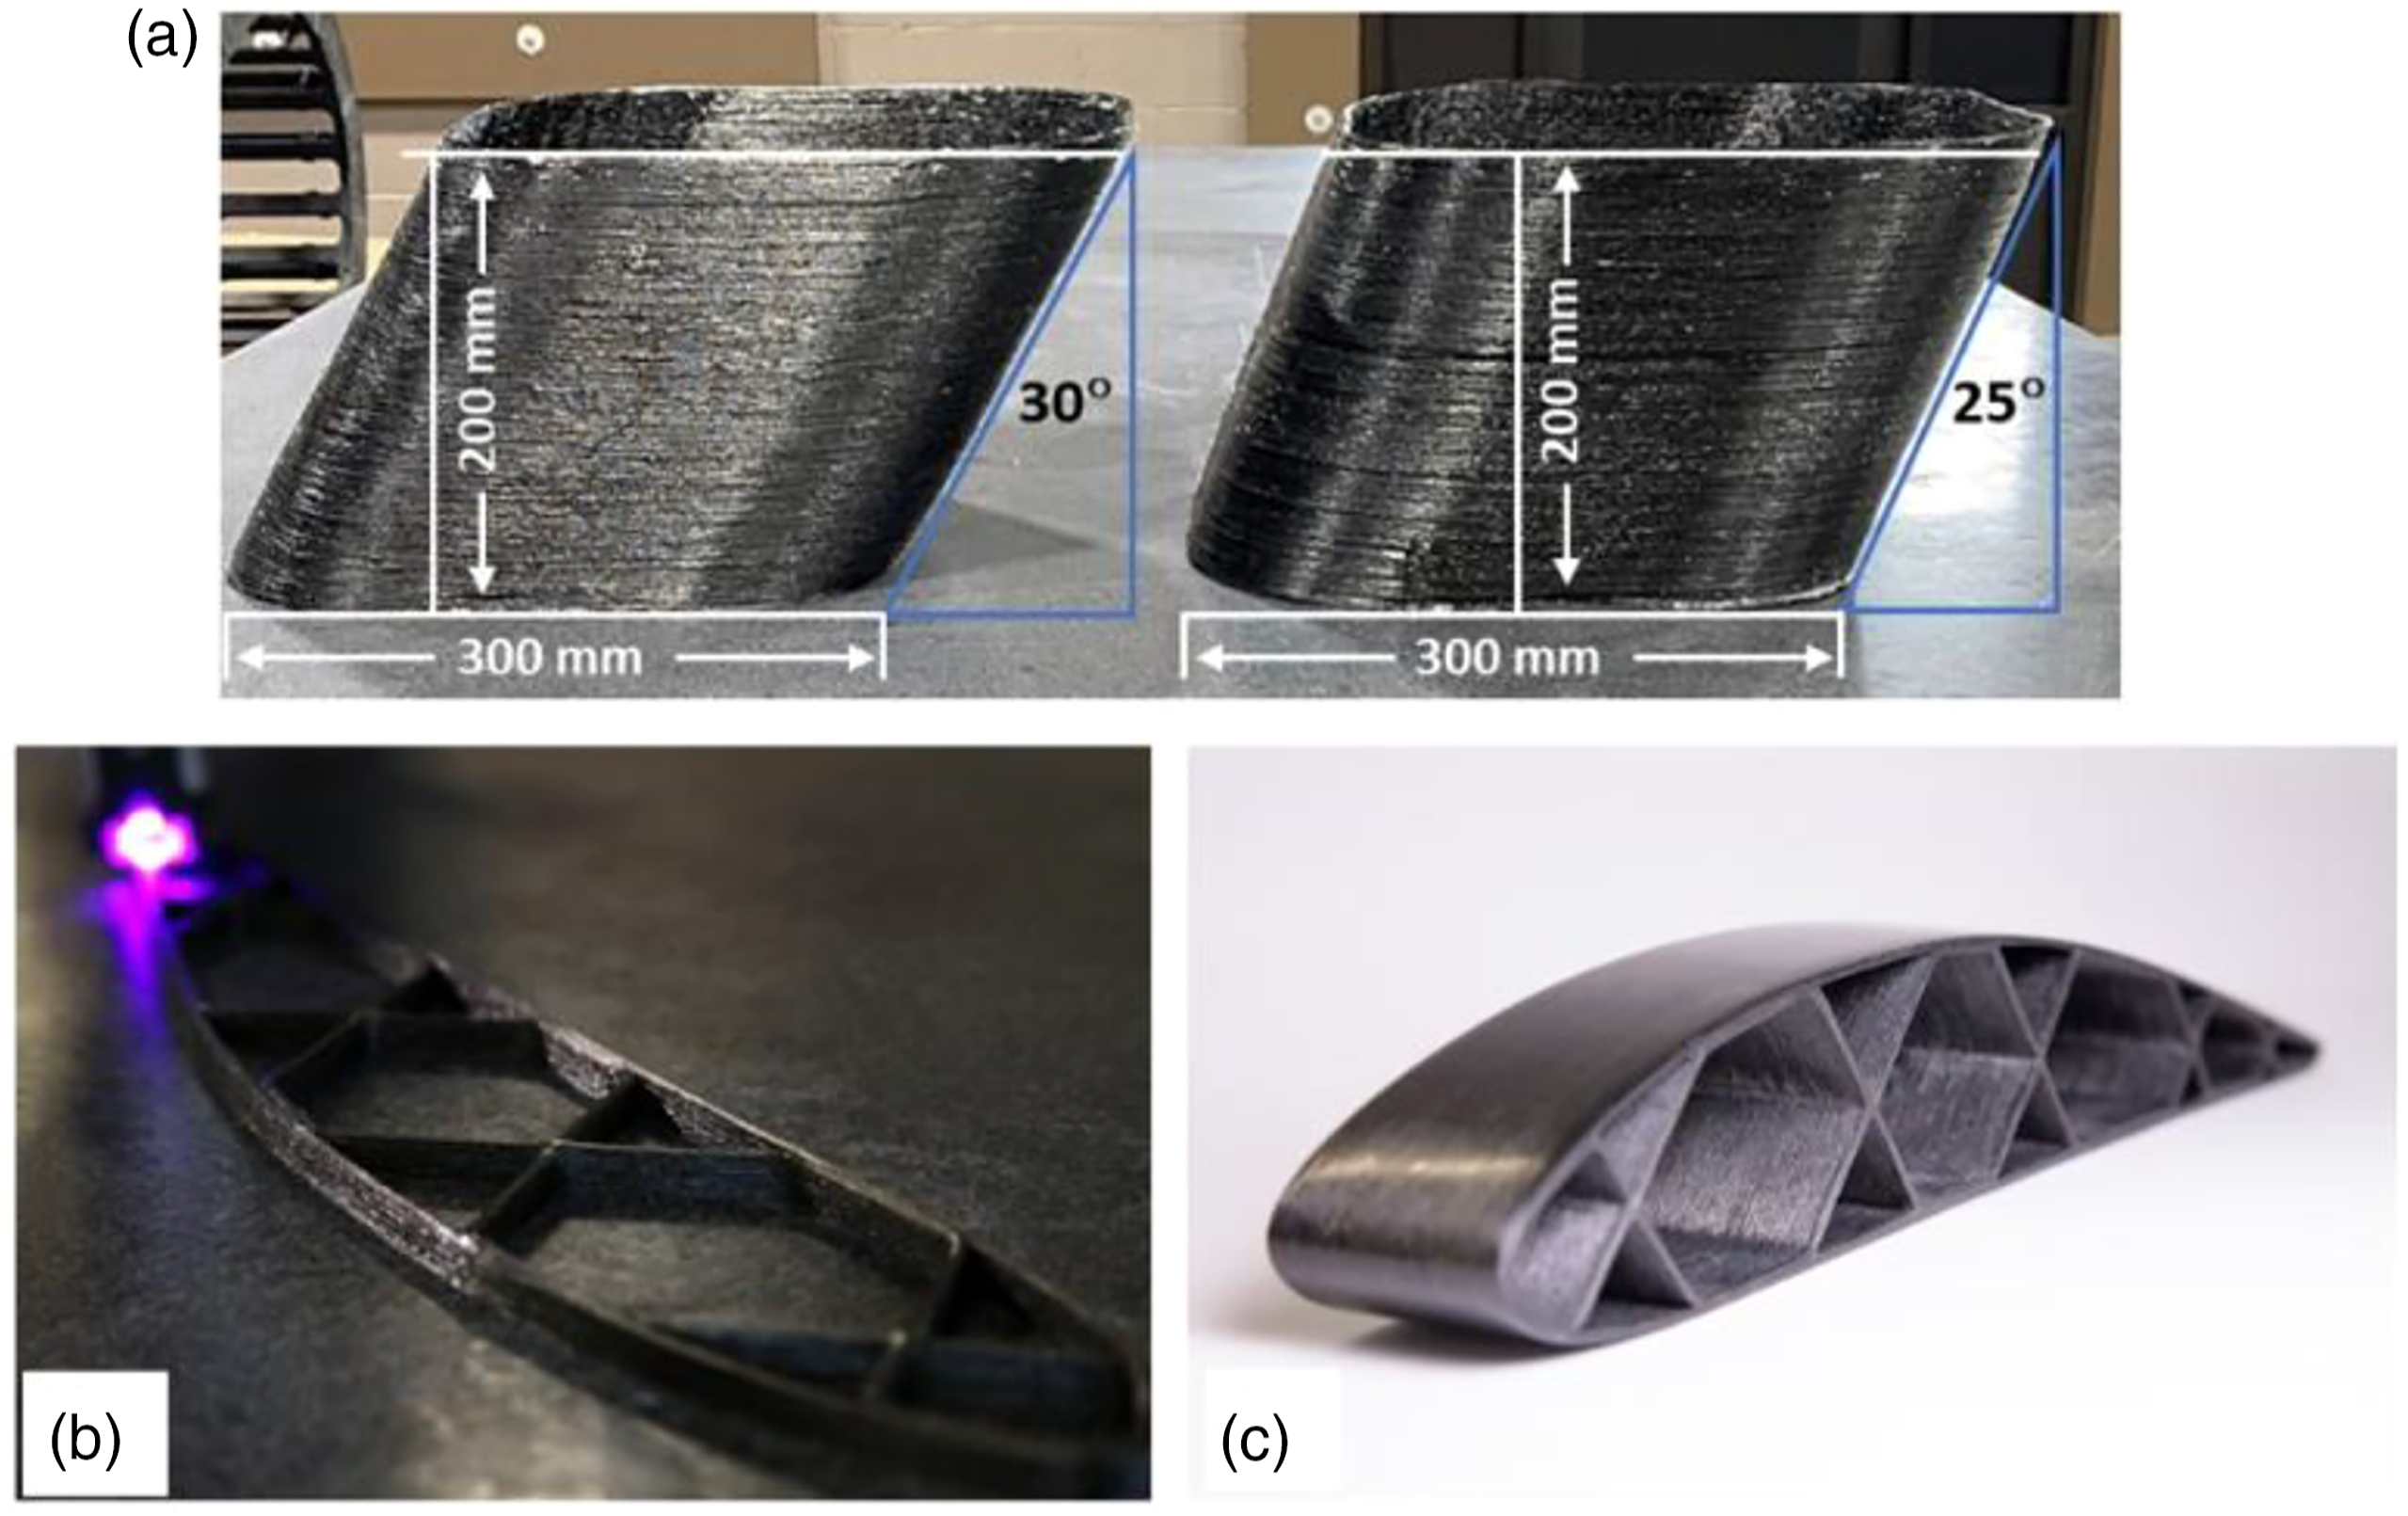
Conclusion
Overall, the in situ impregnation method known as Continuous Fiber 3D Printing (CF3D®) produced well consolidated (40 + vol% fiber) structural composites. The GF-2 panels had low-porosity, good stability (5% loss at 350°C), a high use temperature (∼100°C), and mechanical properties that reached 89% of their theoretical longitudinal modulus (122 GPa of 137 GPa) and 55% of the longitudinal strength (1599 GPa average of 2926 GPa) by Rule of Mixtures. In comparison, epoxy/T-1100 fiber composites made by traditional methods (60% fiber volume) have 95% of their theoretical modulus and 85% percent of their theoretical strength. We believe these additively printed composites to have the highest longitudinal tensile strength (1599 GPa) to date. The transverse tensile strength is ∼ 70 times smaller than the longitudinal strength for the GF-2 resin, but only ∼40 times smaller for the CATPRO14 resin due likely to either improved fiber–resin interface properties or resin properties.
We observed that the microstructure of printed composites exhibits three distinct regions - the impregnated resin tow (84 vol%), an intertow region of resin surrounding the tow (15%), and intertow resin pockets (1%). We provide a framework for analysis of these three regions using fiber-to-fiber distance to identify the regions and quantify their relative volume fraction. Individual impregnated tows were quantified in terms of shape, area, and location relative to other tows. The individual tows were found to vary widely in shape but to be consistent in volume and location of their centroid relative to one another. The vertical registry (stacked centroids) was ±0.102 mm and the horizontal registration (tow in same layer) ± 0.023 mm. The relative fiber volume fraction and fiber-to-fiber contact within the tows was also quantified.
We showed that a modified Rule of Mixtures approach can be used to predict the longitudinal tensile strength of printed composites using the method presented by Karam, which accounts for the degradation of the fiber–resin interface from packing-induced, fiber-to-fiber interactions and estimated to be 0.6 for these composites. A good prediction of longitudinal tensile strength for these tow-based printed composites was found. This model was extended to understanding the mechanical implications of inserting microchannels with varying diameter sizes at the centroid of the printed tows to form a multifunctional microvascular composite. Assuming tow shape was maintained, and the fibers were displaced by the inserted channels, we predict a small reduction in longitudinal tensile strength in proportion to the total volume fraction of the embedded microchannels, which is in good agreement with previous literature for microvascular composites. Thus, printed composites containing microvascular channels for enhanced multifunctionality will retain most of the unidirectional longitudinal tensile performance while imparting multifunctional properties.
With the demonstrated ability to print structural composites with mechanical properties close to traditional aerospace-grade composites, future research directions will focus on further improving the process to achieve even higher mechanical properties and efficiencies, as well as evaluating composite environmental durability. We also intend to use this processing approach for the construction of multifunctional and adaptive composite concepts that include topology optimized structures, engineered joints, bi-stable laminates made with non-traditional fiber lay-up, damage arresting features, alternative curing (including frontal polymerization), and other multifunctional structural composites with integrated microsystems by either including them within the deposited tow or as part of the complex additive assembly.
Supplemental Material
Supplemental Material - Mechanical properties of additively printed, UV cured, continuous fiber unidirectional composites for multifunctional applications
Supplemental Material for Mechanical properties of additively printed, UV cured, continuous fiber unidirectional composites for multifunctional applications by Jeffery W Baur, Andrew C Abbott, Philip Barnett, Gyaneshwar P Tandon, Jevan Furmanski, Nathan A Stranberg and Tyler B Alvarado in Journal of Composite Materials
Footnotes
Acknowledgements
The authors would like to acknowledge support from the Mr Shawn Clinger of the Rapid Response Technology Office (RRTO), as well as helpful discussion from Dr Hilmar Koerner and Dr Mark Flores of AFRL/RXCC.
Declaration of conflicting interests
The author(s) declared no potential conflicts of interest with respect to the research, authorship, and/or publication of this article.
Funding
The author(s) disclosed receipt of the following financial support for the research, authorship, and/or publication of this article: This work was supported by Mr. Shawn Clinger by Rapid Response Technology Office (RRTO).
Supplemental Material
Supplemental material for this article is available online.
References
Supplementary Material
Please find the following supplemental material available below.
For Open Access articles published under a Creative Commons License, all supplemental material carries the same license as the article it is associated with.
For non-Open Access articles published, all supplemental material carries a non-exclusive license, and permission requests for re-use of supplemental material or any part of supplemental material shall be sent directly to the copyright owner as specified in the copyright notice associated with the article.