
Abstract
Metal Amorphous Nanocomposite (MANC) materials offer low losses at high magnetic switching frequency, enabling high power density motors with increased rotational speed. While MANCs have high strength, they are brittle. The use of motor components such as a rotor consisting of brittle material presents a reliability concern. Here, a promising MANC alloy is subjected to tensile tests and failure is observed with high-speed photography. A method is developed to prepare tensile specimens of laminated MANC and epoxy layers, simulating the stacking of an epoxy-impregnated tape-wound core. Tensile tests are conducted for single layer ribbon and for five- and ten-layer stacks of laminated material with thin layers of thermosetting epoxy. Failure distributions are shown to have increasing Weibull modulus with increasing layer count. The composite MANC material system is modeled using chain-of-bundles models. Using a k-failure model, we show that single ribbon strength distribution data can be used to predict well the failure distribution of laminated stacks. The agreement occurs when the assumed ineffective length, over which load is recovered in a failed layer, is comparable to the observed interlaminar separation length.
Keywords
Introduction
An increase in power density of electric motors is beneficial in many applications.1,2 This can be achieved by increasing the rotational speed, but higher operating frequency induces higher eddy current loss in the soft magnetic portion of the motor. Conventional motors are typically made using stamped Fe-Si laminates as the soft magnetic material. The laminates limit the magnetic frequency because they are relatively thick at ∼500 μm and eddy current losses cause significant temperature rise. A solution to the high-frequency loss problem in motors is introduced by Metal Amorphous Nanocomposite (MANC) soft magnetic materials,3–6 which exhibit high saturation magnetization while having much smaller thickness (∼20 μm) and ∼5 times higher electrical resistivity than Fe-Si competitors. 7 Eddy current losses decrease with increased resistivity and with the thickness squared. Hence these losses are ∼1000 times lower in MANCs than in Fe-Si.
With lower magnetic switching losses, mechanical limits have an increased significance in motor design, as stress increases with the square of rotational frequency. 8 MANCs have been successfully employed in power magnetic devices such as inductors and transformers, which are relatively insensitive to stress. However, commercial MANCs like FINEMET are excessively brittle, 9 making them less attractive for stress-sensitive applications like high-speed motors (HSMs). New high saturation induction MANCs are designed to exhibit even lower energy loss at high magnetic switching frequency,7,10 and qualitative bend tests have indicated higher bending strain to failure. Given the limited documentation on the mechanical properties of these new alloys, a deeper understanding of MANC mechanical performance and failure behavior is required to better predict their limitations as soft magnets in motor applications. If the limitations arising from their brittleness can be managed, MANCs present significant opportunities in increasing motor power density.
MANCs are produced by annealing a precursor amorphous magnetic ribbon (AMR) between a primary (
Crystallization kinetics are quantified by Johnson Mehl Avrami Kolmogorov (JMAK) kinetics12–17 in conjunction with the Kissenger equation and differential scanning calorimetry experiments.10,18 Successful casting and processing of these alloys requires careful stoichiometry selection to provide adequate glass-forming ability and amorphous phase stability. 19 The nanocrystallization step improves magnetic properties by minimizing coercivity and maximizing saturation magnetization, 12 but eliminates mechanical ductility that is characteristic of some AMRs. 20 AMRs become brittle at room temperature after a critical volume fraction, ranging from 20% to 50%,21–23 has been crystallized, which is associated with a material’s Poisson’s ratio (ν) being less than 0.31–0.32. 24
The failure strength of brittle materials is typically dictated by flaw size. Weibull analysis is a commonly used method for measuring the failure distribution of a brittle material sample population25–27 and has been used to measure the strength of brittle amorphous and nanocrystalline ribbons.28–30 Two-parameter Weibull analysis reports a characteristic strength (
Measuring the statistical likelihood of ribbon failure is important to understand the strength limitations of MANCs for HSMs. However, this metric alone does not fully inform the tensile behavior of materials to be used in these applications. MANCs are typically used in epoxy impregnated tape wound cores (TWCs), where the ribbon is wound to manufacture a toroid with hundreds of ribbon layers. The epoxy impregnation process used in this work is described in the Methods section. Given the composite nature of an impregnated TWC, it is expected that the tensile behavior will be different from that of a MANC ribbon alone. This composite structure can be expected to perform mechanically similar to other composites, where progressive irreversible damage occurs during tensile tests prior to failure. In this paradigm, load sharing enables specimen survival after some localized “damage” such as fiber or layer failure or layer debonding.32,33 While laminated composites are known to mechanically survive some local cracking, it must be noted that cracked magnetic material is associated with localized gaps, which will alter magnetic properties such as effective coercivity and permeability.34,35
While MANCs in composite form have not been studied in the literature, the tensile response of AMR in composite form has been investigated by Leng and Courtney36,37 and Li et al. 38 Both studies found an increase in ductility and strength by plating an AMR in another ductile metal. However, these benefits were achieved at the expense of volume fraction of AMR with a substantial increase in the amount of high strength ductile material. In these studies, the AMR volume fraction was 20% and 23% respectively, with the balance being ductile brass and Ni, respectively. For magnetic device applications, high packing factors are required to achieve power density requirements. TWCs are routinely wound with at least 80% AMR or MANC packing factor, with the remaining being filled by the electrically insulating but mechanically soft epoxy. This structure is substantially different from those created by Leng36,37 and Li et al. 38 The study here is conducted to characterize the tensile response of the TWC/epoxy composite with ∼80% fill factor, and to evaluate methods to model their failure distributions. Weibull distributions of single ribbons and stacks of five and ten layers are measured. Chain of bundles models of increasing complexity39–48 are used to understand the results in the context of relating single ribbon failure to multi-ribbon failure.
Methods
AMR alloys of composition (Fe70Ni30)80B14Nb4Si2 were fabricated using a METGLAS batch mode planar flow casting process.
49
The ribbon tested exhibited a calculated average thickness of 19.8 μm. Figure 1(a) shows an optical microscope view of ribbon edge. Because the surface roughness (or defect size) of brittle materials limits their strength, it is important to test a material with similar surface characteristics to those present in a motor component. Experiments were conducted using full-width ribbons rather than “dog bone” specimens because cutting the ribbon sides into these shapes alters the edge roughness from that developed by the planar flow casting process. Ribbons were cut across their width with shears to a length of 150 mm and annealed in an air atmosphere at 440°C, between (a) Edge of ribbon in used in tensile tests. (b) Full tensile test specimen attached to grip tabs.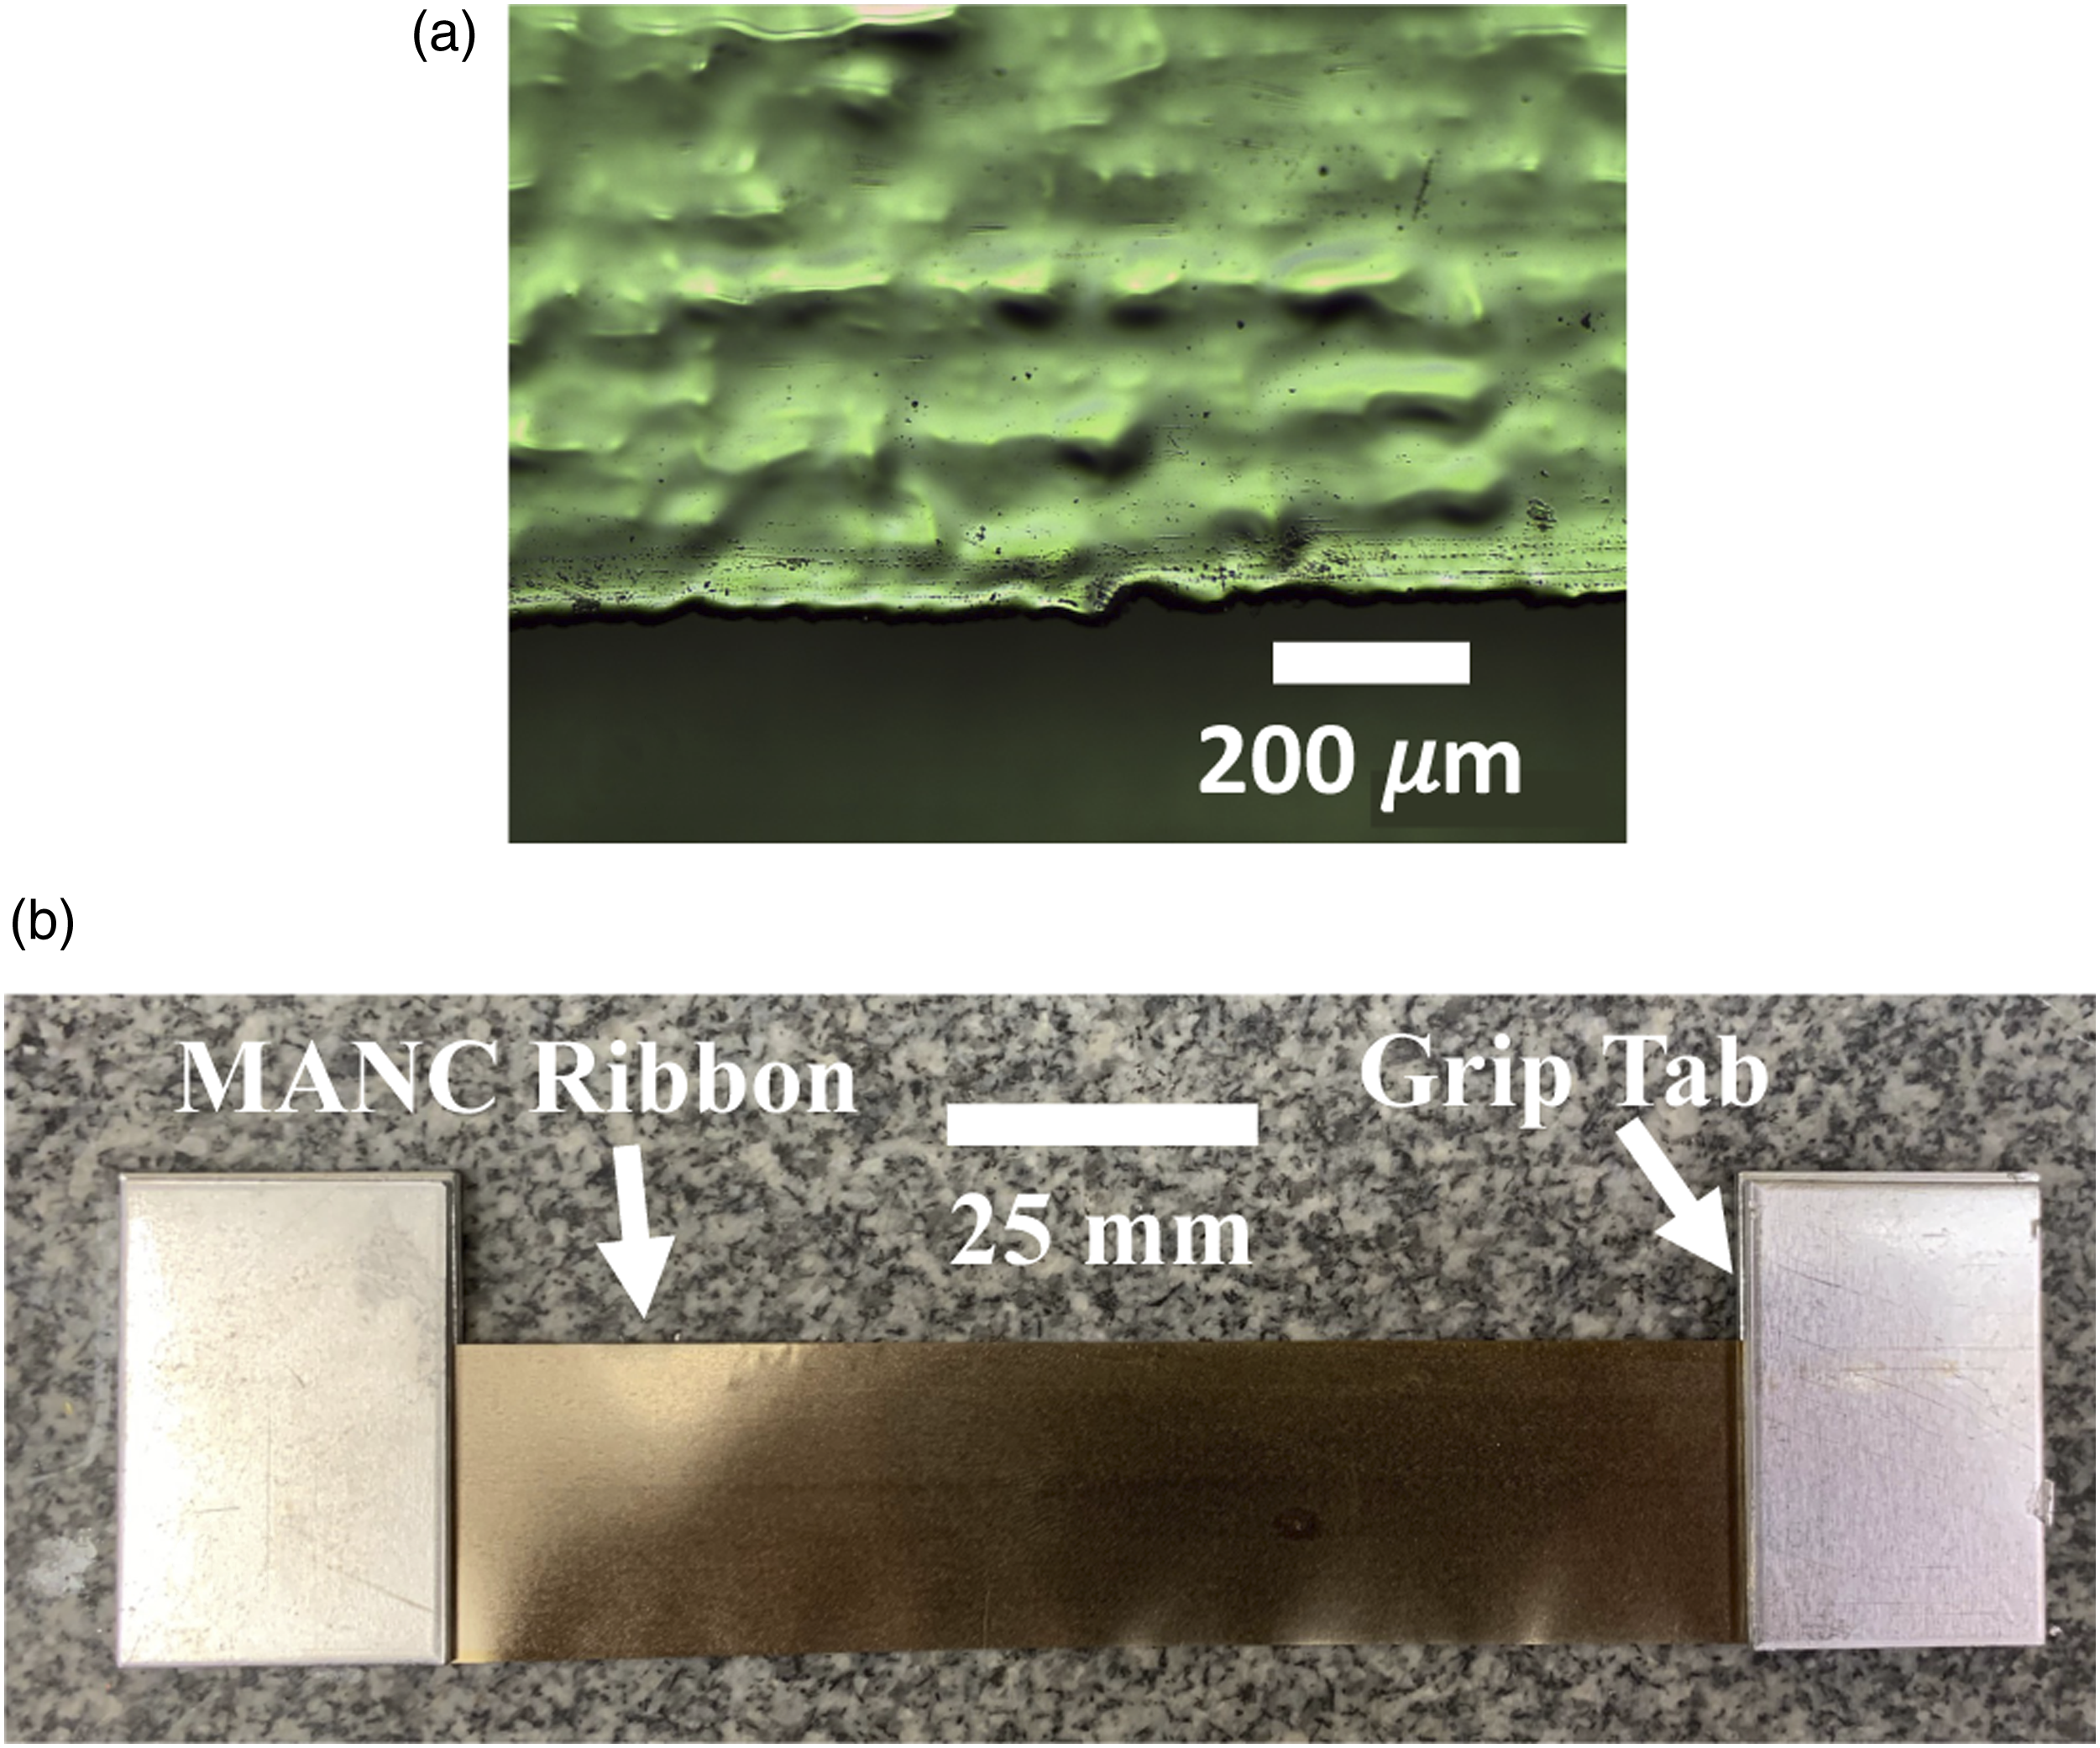
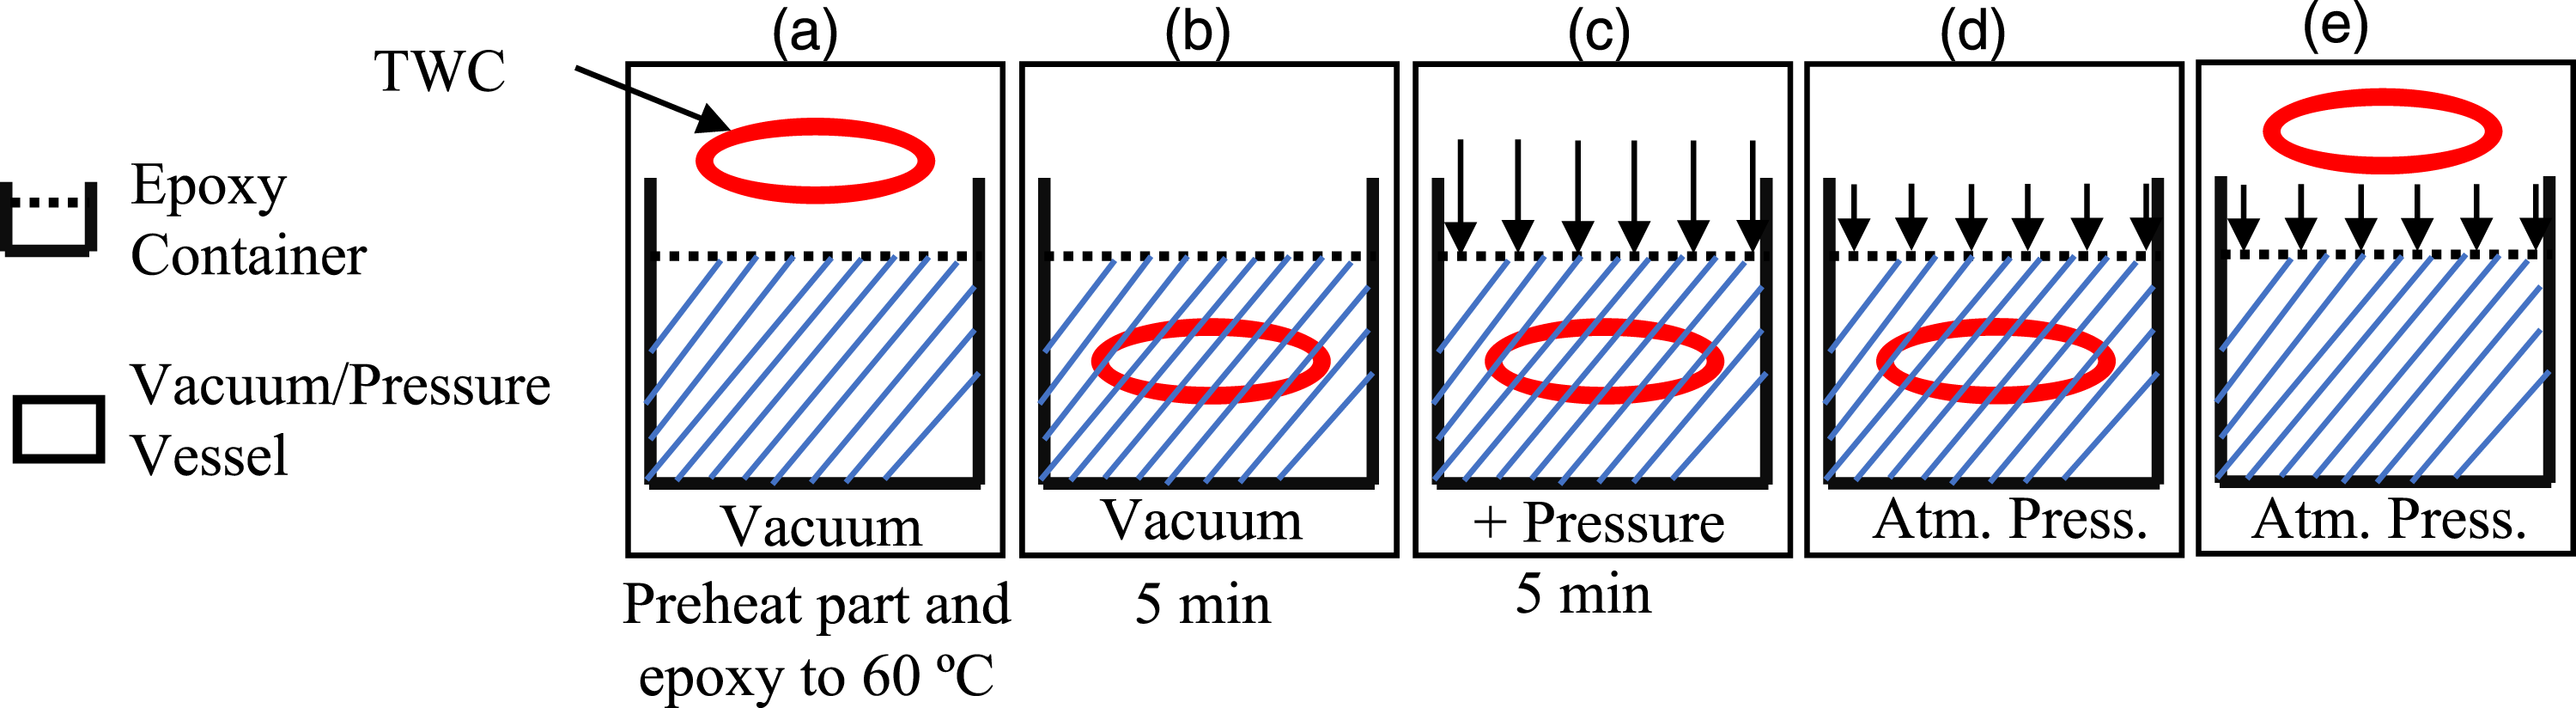
Similar processes of annealing and grip tab adhesion were followed in preparing tensile specimens from laminated ribbon stacks of five or ten layers. To prepare laminated stacks, multiple annealed MANC ribbons were placed between Teflon blocks and the stack was bound with wire (Figure 2(a) and (b)). These ribbon stacks consisted of five or ten annealed ribbons, followed by an as-cast ribbon protruding from the end of the stack. This stacking method allowed for the preparation of many stacks in a single vacuum pressure impregnation (VPI) cycle, equivalent to that used to impregnate TWCs with epoxy, as shown in Figure 3. The TWC is placed in a vacuum to remove air from between the layers (Figure 3(a)). While remaining under vacuum, the TWC is submerged into a liquid epoxy bath (Figure 3(b)). Next, positive pressure is applied (Figure 3(c)), forcing epoxy between ribbon layers. After reducing to atmospheric pressure (Figure 3(d)), the TWC is removed from the bath (Figure 3(e)). The epoxy impregnated TWC is then cured in air at 160°C for 4 h. After curing the laminated stacks in this study, the stack was separated by peeling into smaller stacks, with the number of layers determined by the interspersed as-cast ribbons. The as-cast ribbons shown in Figure 2(a) facilitate peeling, as the epoxy does not bond as well to their surfaces. (a) Schematic and (b) image of stack of ribbons prepared for VPI process. Vacuum pressure impregnation (VPI) process schematic.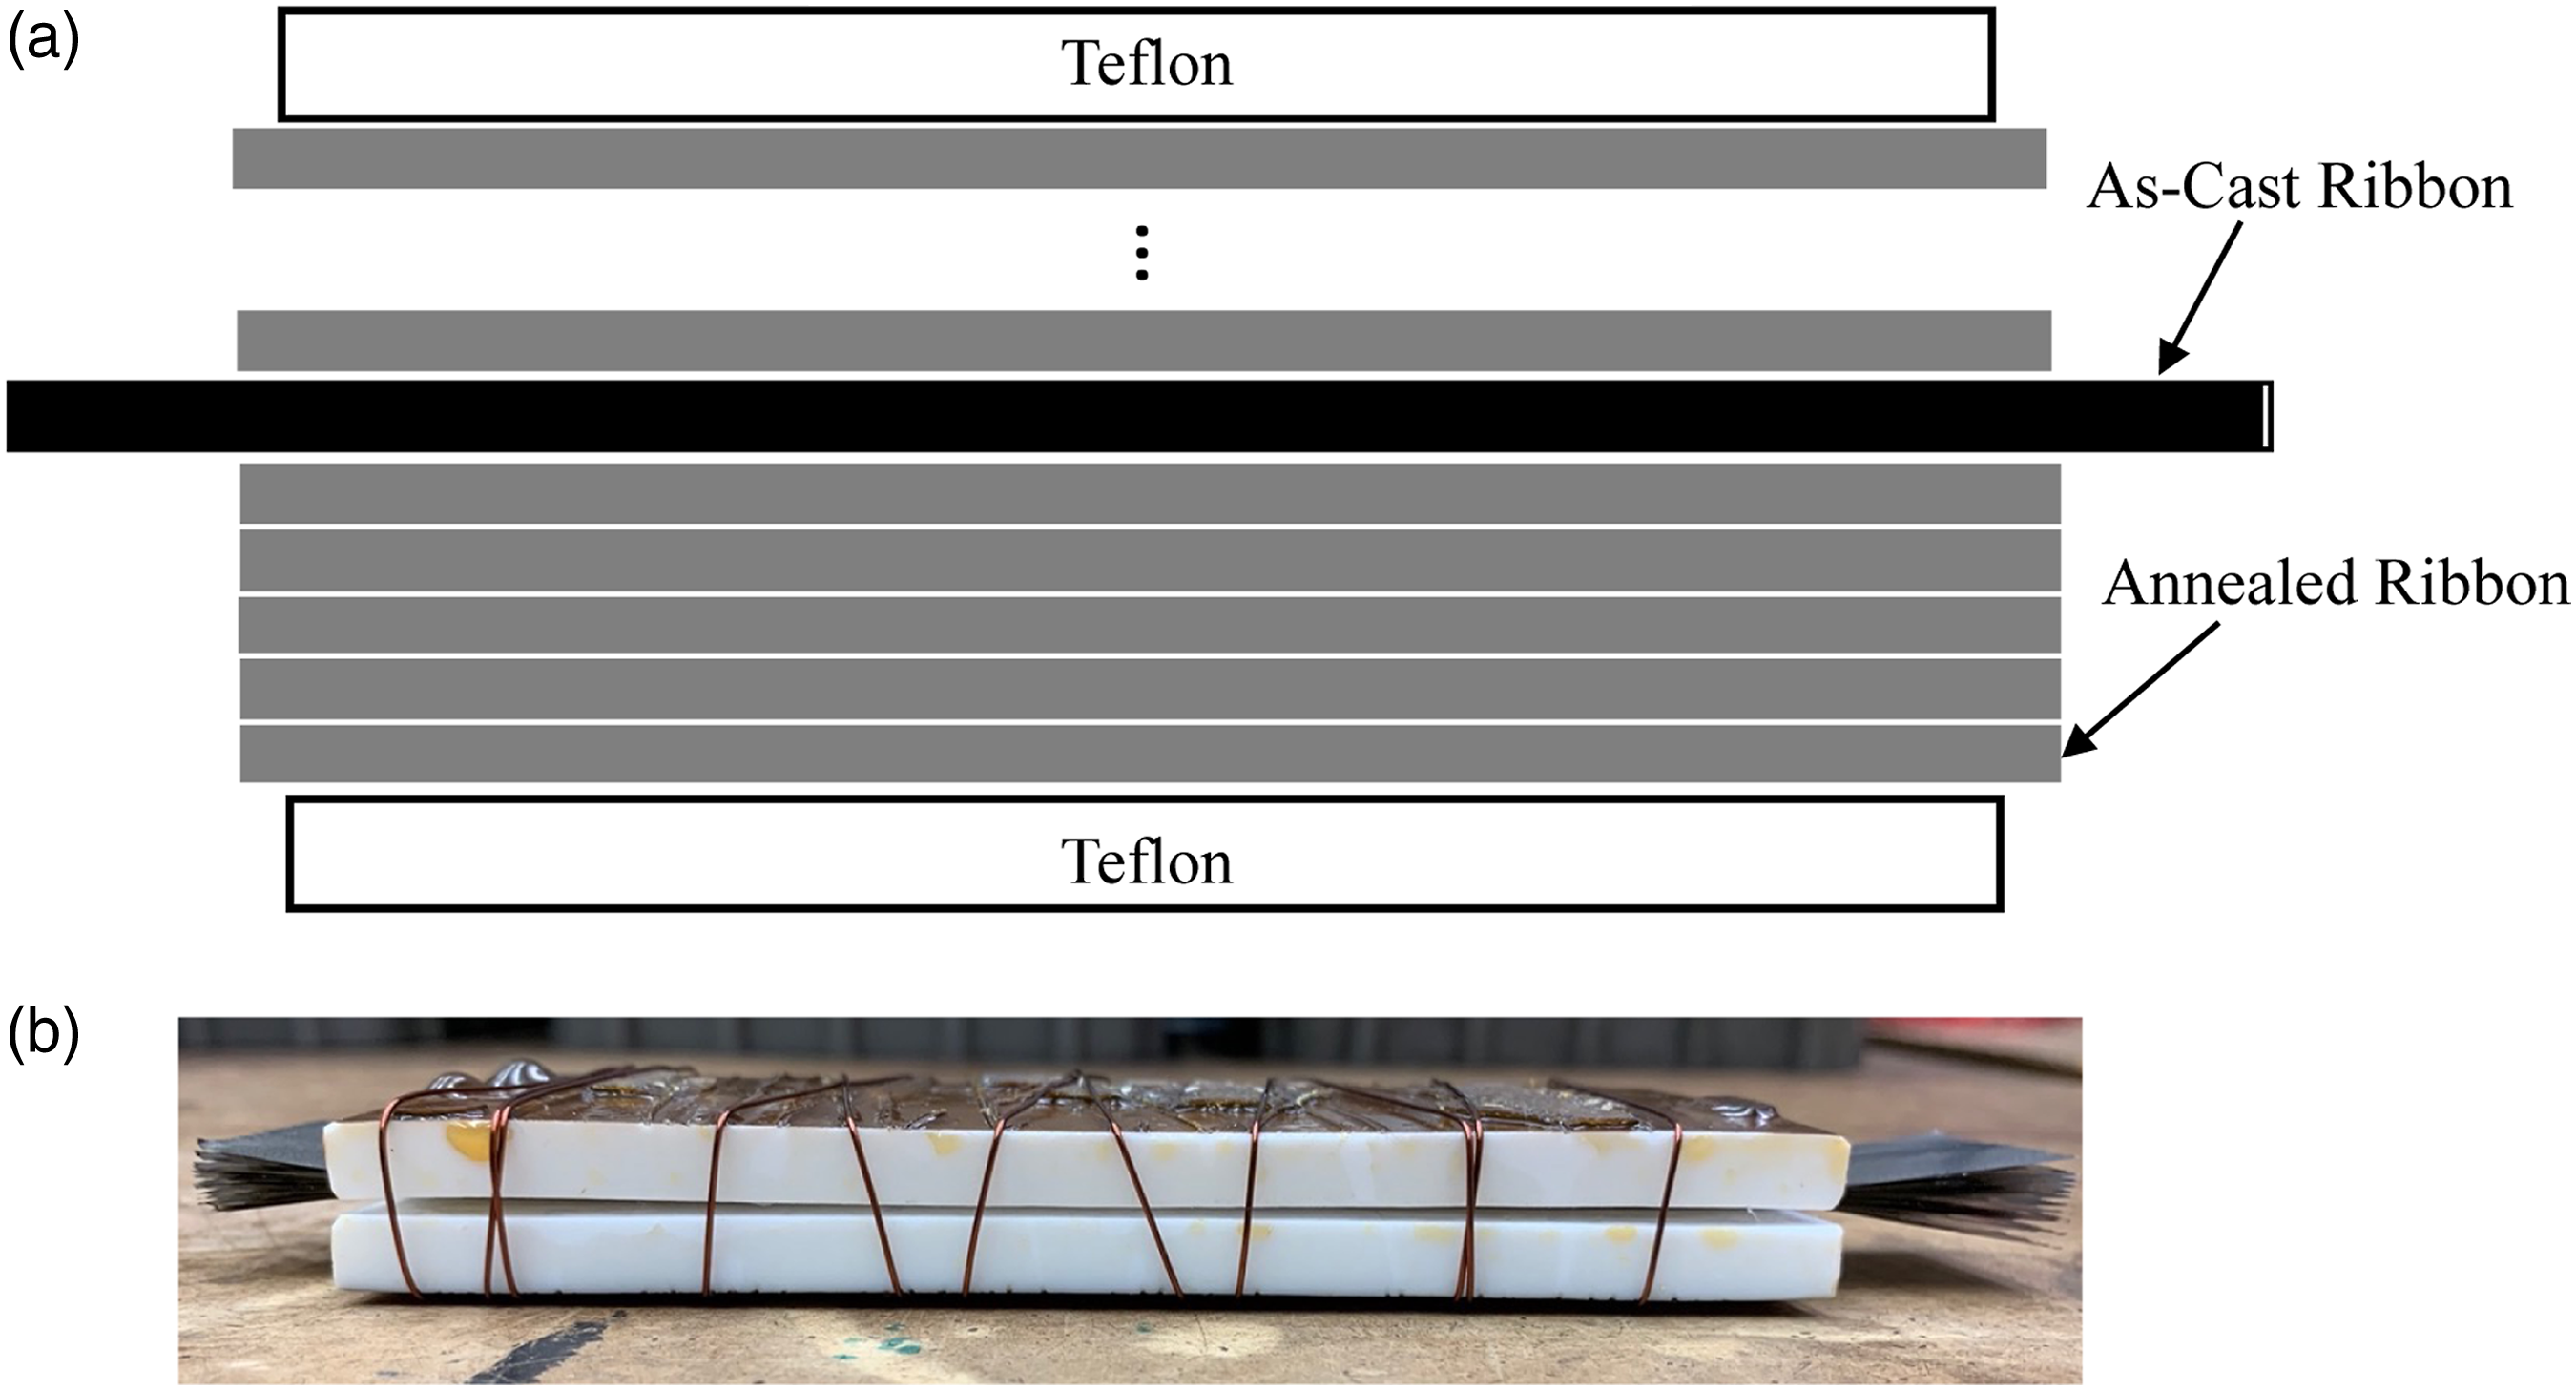
A random sample of laminated ribbon stacks was measured with a micrometer to determine overall stack thickness in ten locations across the stack. The total ribbon thickness in the stack was subtracted from this measurement to find the total epoxy thickness. From these measurements, the average epoxy layer thickness ranged from 3.7 to 6.5 μm, similar to that achieved in an 80% fill factor TWC. Since the epoxy cross-sectional area is ∼20% of the total cross-section and the epoxy has a Young’s Modulus ∼0.8% of the ribbon, the epoxy stiffness contribution to the stack is negligible. Thus, so long as the epoxy adequately wets and bonds the ribbon layers, a change in epoxy thickness should not change the elastic behavior significantly. Accordingly, the area considered for stress calculation from tensile tests is only the cross-sectional area of the ribbon layers. Though this is not a conventional method of documenting composites, it is more appropriate to describe stress in terms of ribbon cross-section because this provides a direct comparison with the single-layer stress calculation.
Annealed ribbons rapidly shatter into multiple fragments and specimens had no reduced test section to ensure fracture away from tensile grips. A high-speed camera was used to determine if the initial ribbon fracture location was sufficiently far from the stress concentrator associated with the grips. Tensile tests were conducted using an Instron model 4469 with a deformation rate of 3.0 mm/min (strain rate of 0.0005/s) while the ribbons were monitored with a Phantom Vision v1211 high-speed camera at 66,000 frames/s (15.2 μs between frames, 7 μs exposure time). If a specimen failed away from the grips (where stress concentrators are located), that specimen was used in the tensile strength (


Results and discussion
Experimental results
For single ribbons, most high-speed camera observations indicate that cracks initiate at the edges far from the grips. In only six of 27 tests did a surface flaw away from the ribbon edge constitute the critical flaw, leading us to conclude that edge flaws generally limit the ribbon strength. Different single ribbon specimens failed with different crack propagation patterns. Figure 4 shows the high-speed camera setup (Figure 4(a)) and images of what we call failure Types I, II, and III. In each, the first image shows the incipient propagation, and the second is 75 μs later. Observations of crack branching help to verify the origin of the critical flaws. In failure Type I (Figure 4(b)), the crack branches into many cracks which form a fanlike pattern. In Type II (Figure 4(c)), the primary crack is more dominant, with fewer, smaller branches. In Type III (Figure 4(d)), the crack originates in the middle of the strip, away from an edge, implying that the critical flaw is a surface rather than edge defect. These types of propagation events have been widely studied,
53
and are further discussed below only briefly. (a) High-speed camera setup. Ribbon failure Types (b) I, (c) II, and (d) III near initiation and after 75 μs.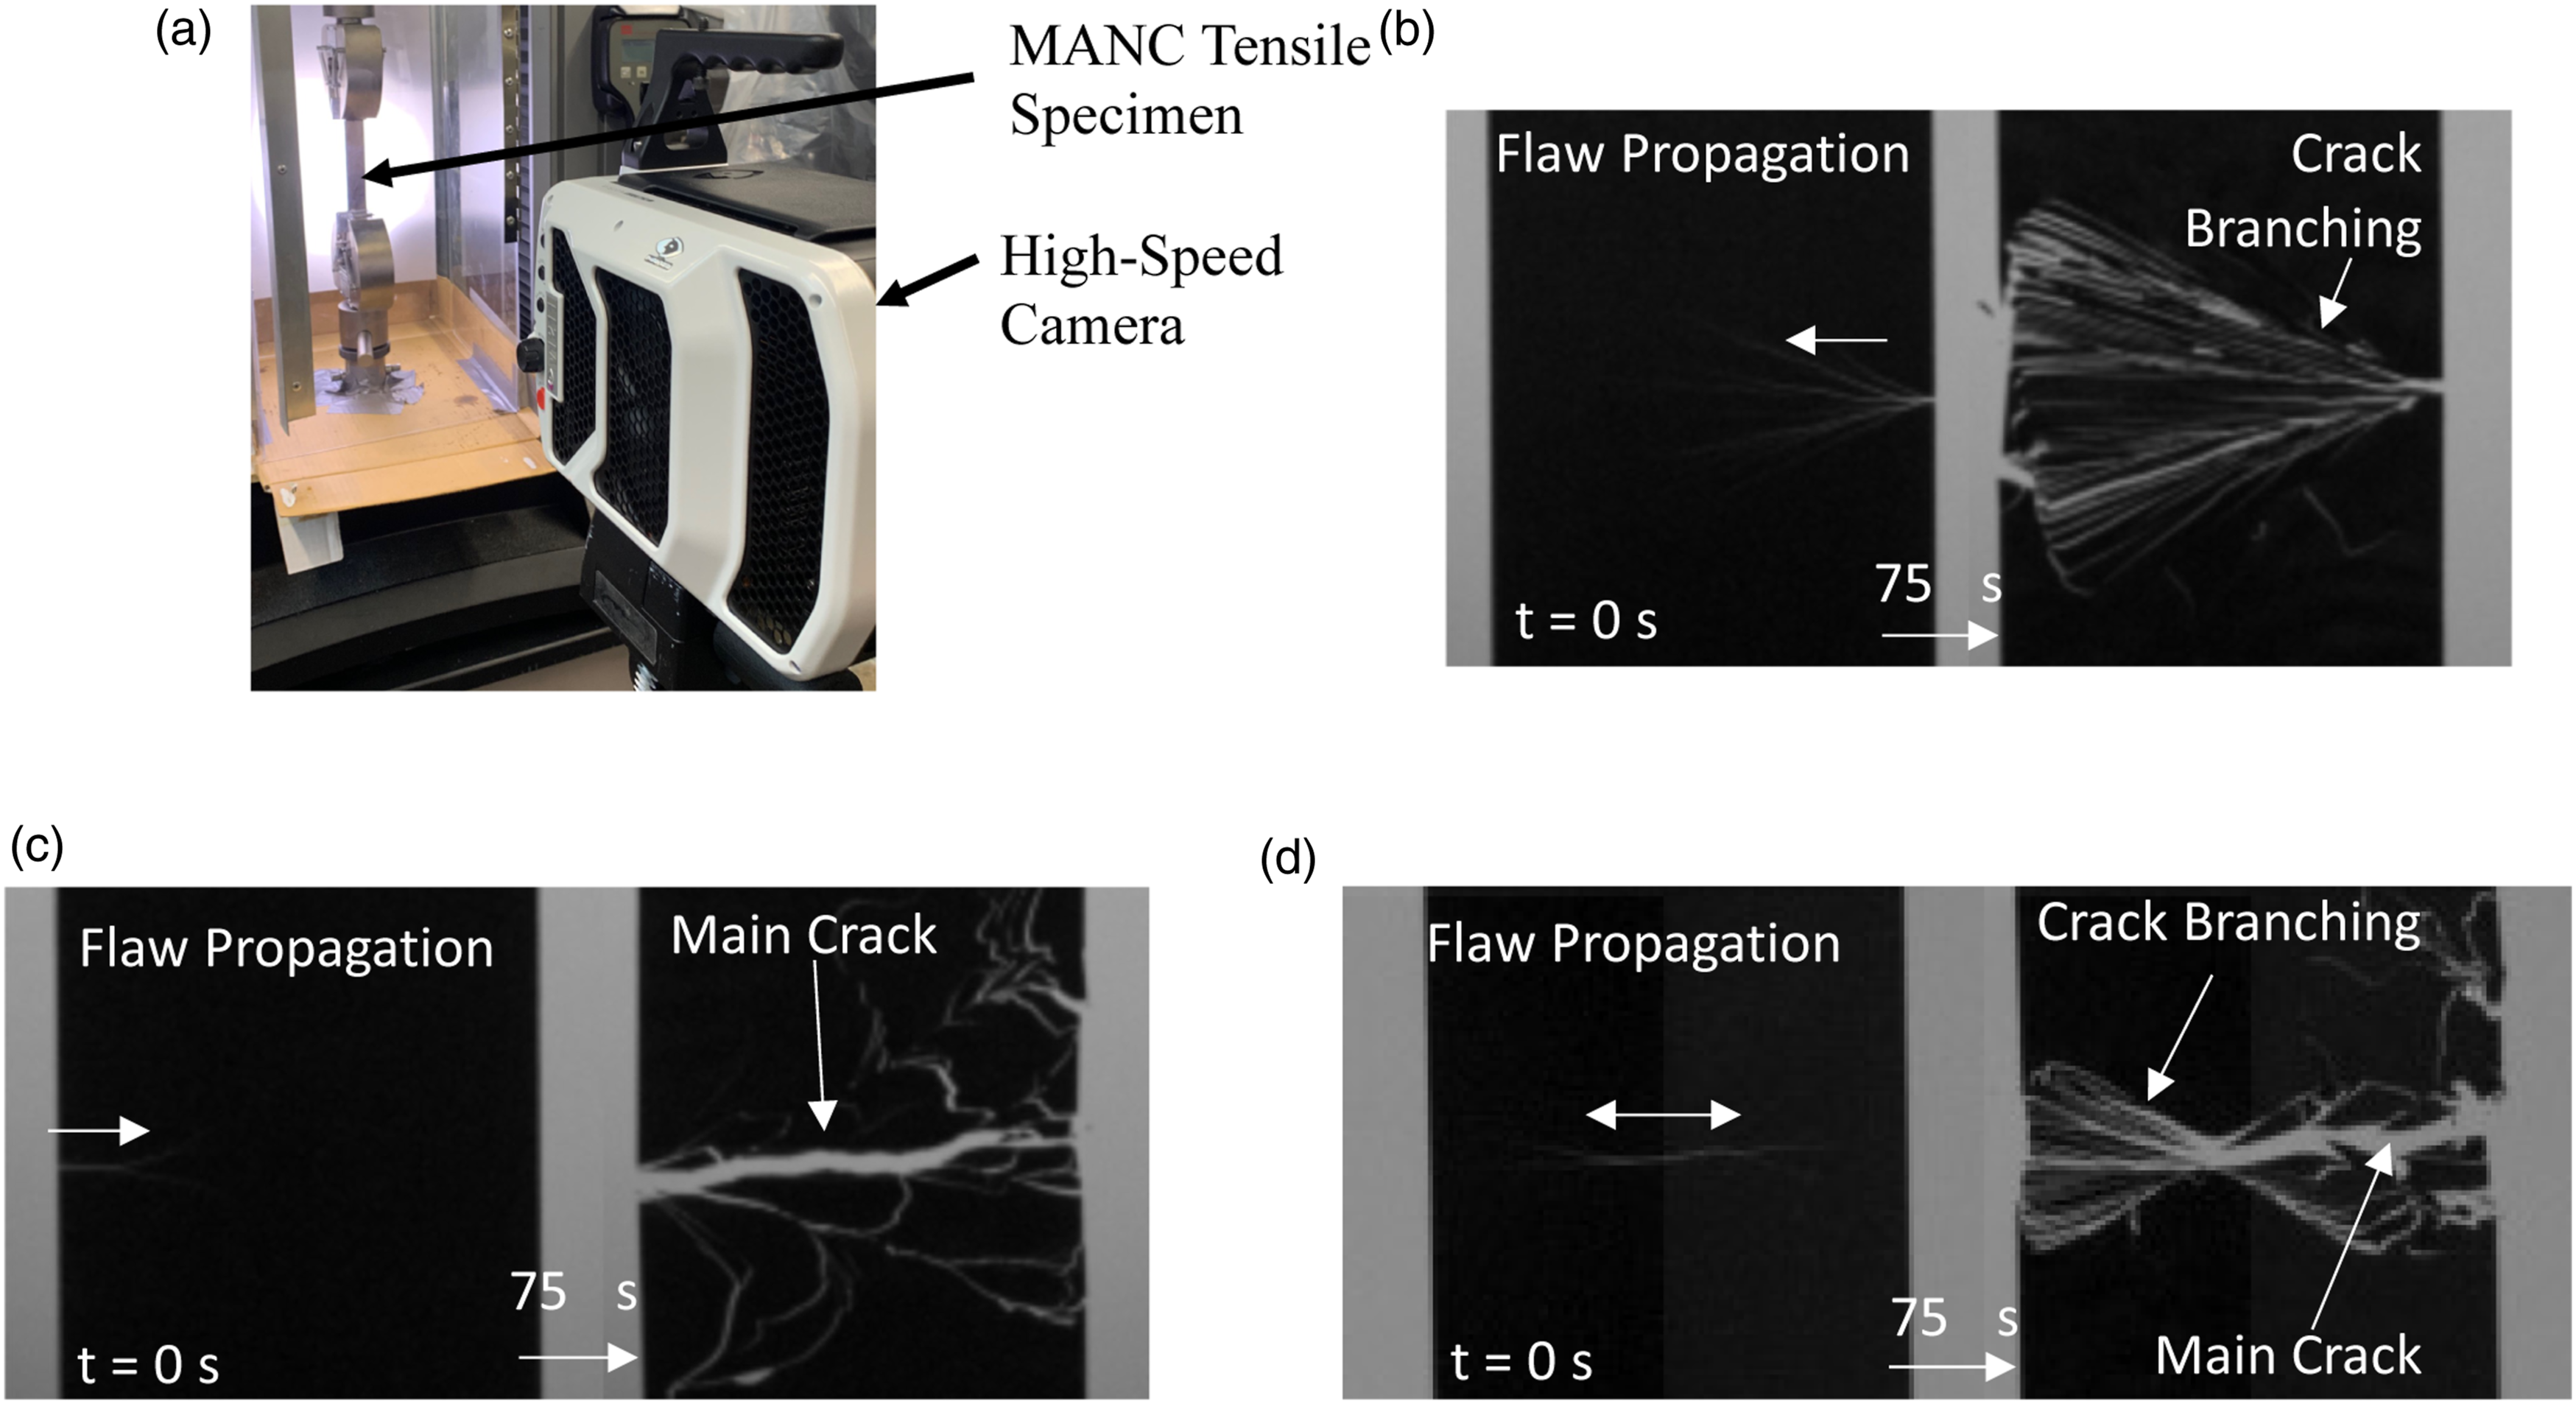
Young’s Modulus was determined using Instron software from single-layer tensile tests, with a 27-specimen average of 144 GPa and 8.5 GPa standard deviation. Stress–strain curves from two selected samples (Figure 5(a)) are shifted on the strain axis for clarity. These exhibit elastic behavior until brittle failure, with no plastic deformation. A stress–strain curve of the epoxy is shown in Figure 5(b). The epoxy has much lower failure stress than the ribbon, but its failure strain is more than 15 times larger. (a) MANC ribbon tensile test stress versus strain results from two selected tests. Curves are shifted by 0.001 strain for clarity. (b) Epoxy tensile test.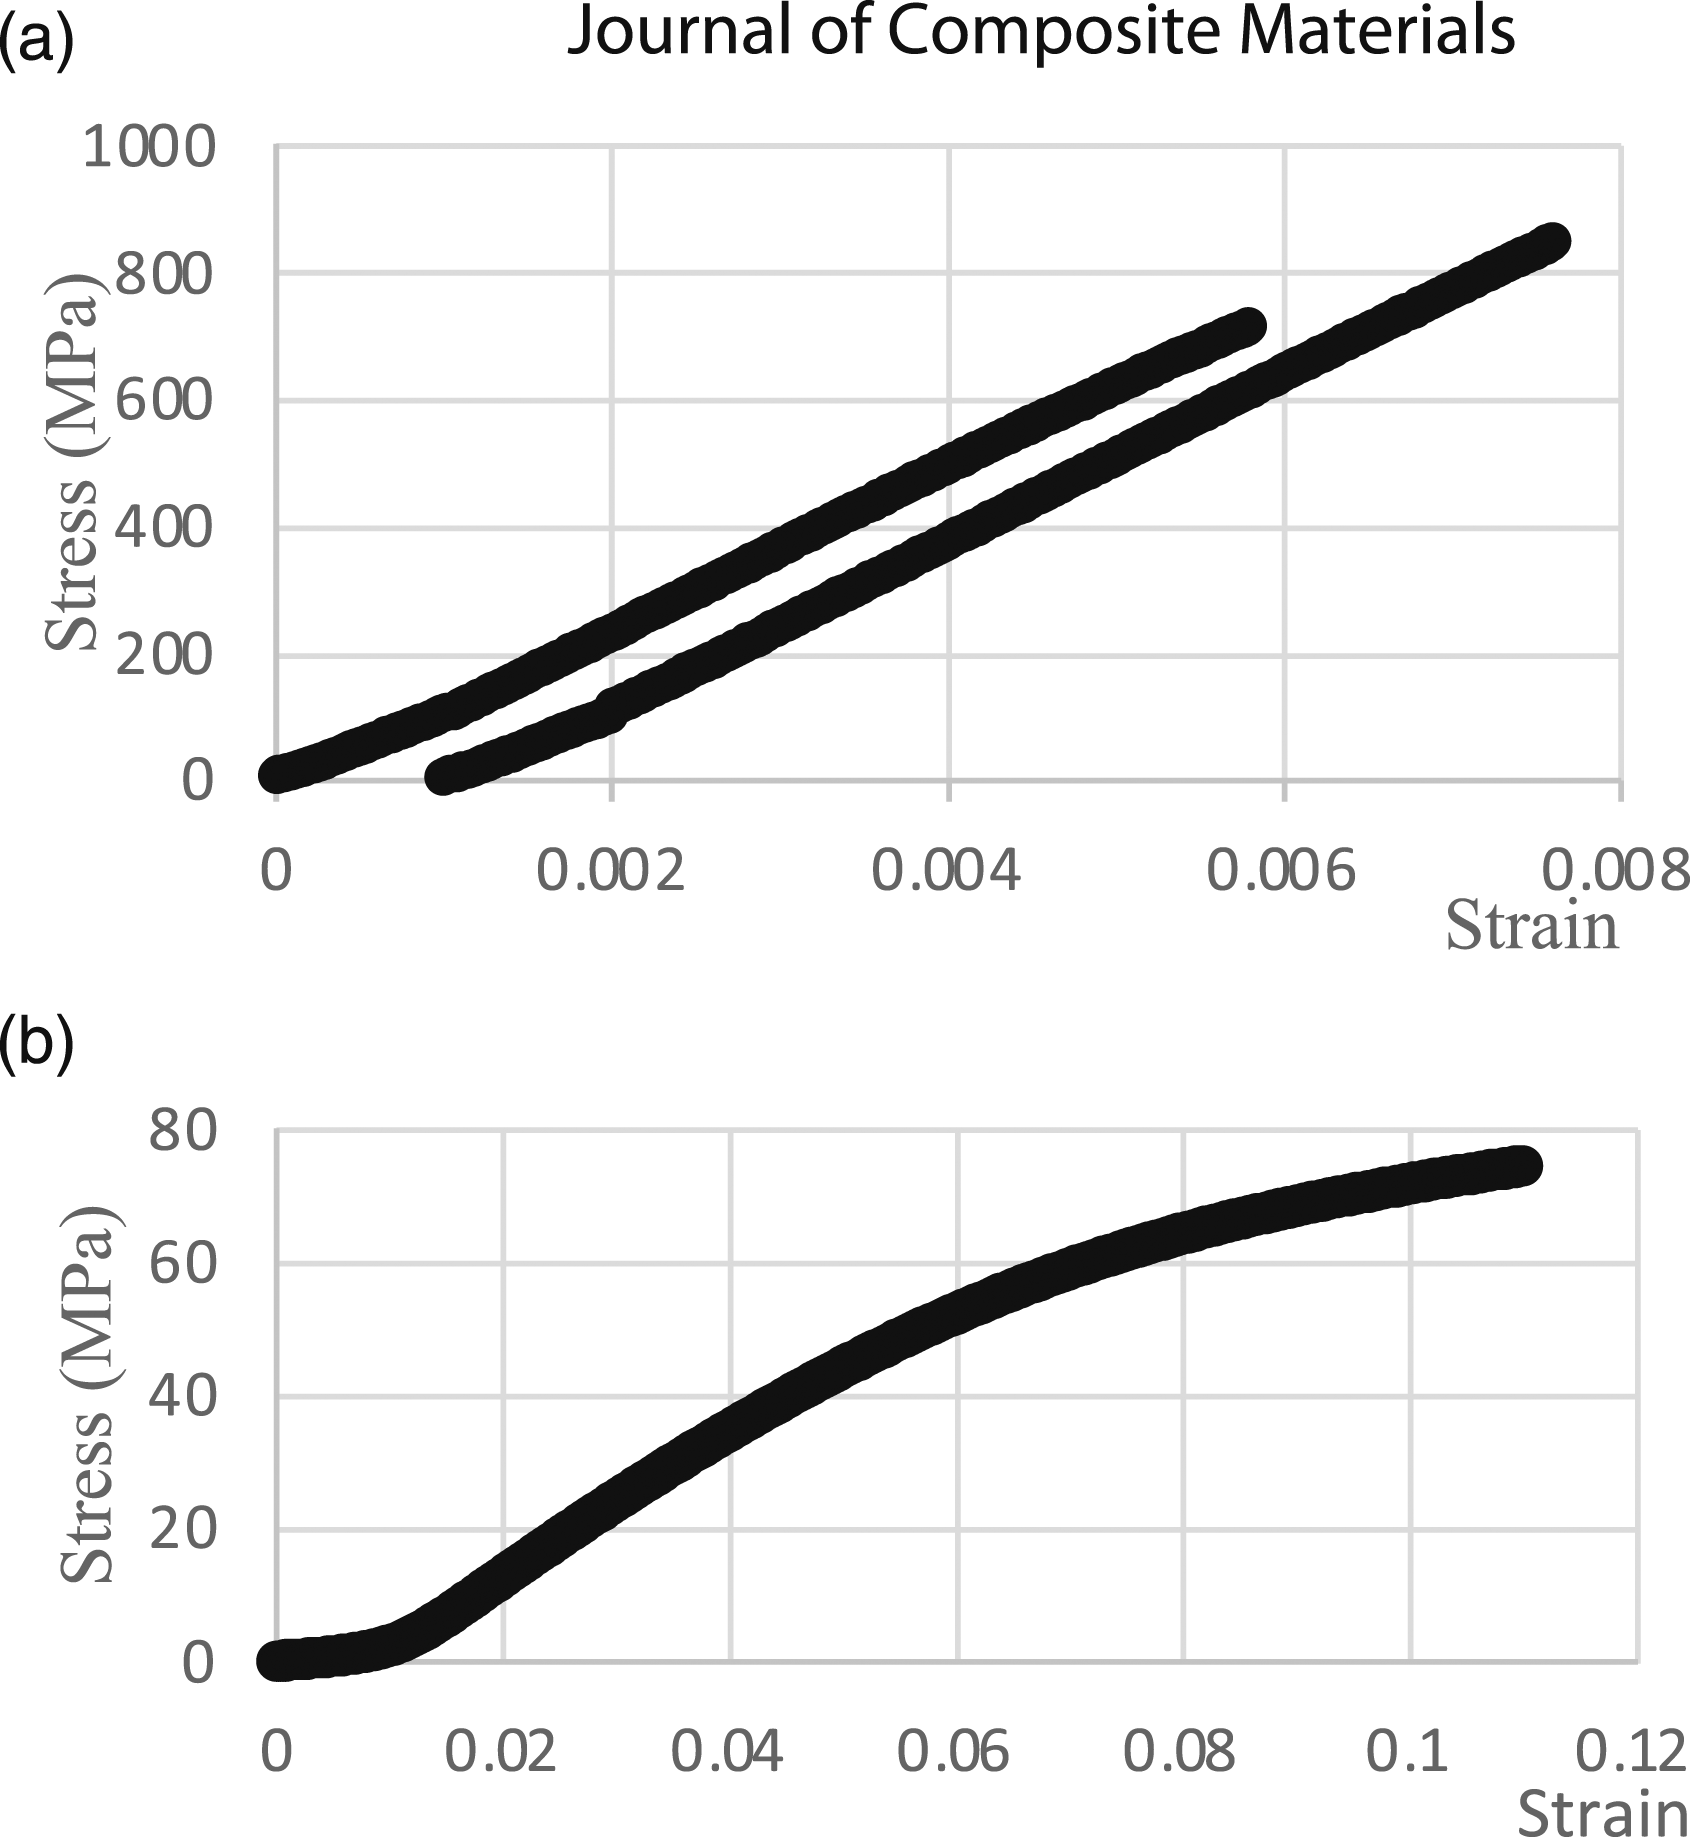
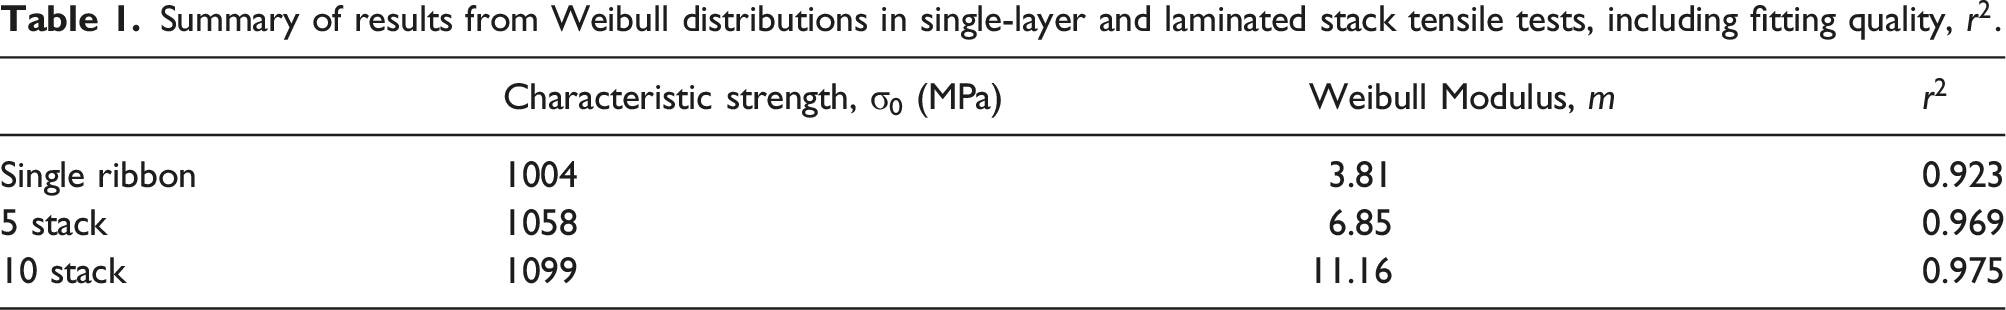
Weibull results from single-, five- and ten-layer tests are shown in Figure 6 and are summarized in Table 1. The number of specimens used for the single-, five- and ten-layer tests are 27, 24, and 16, respectively. The Weibull distribution single layer ribbons (gray), five-layer laminated stack (black), and ten-layer laminated stack (blue). Summary of results from Weibull distributions in single-layer and laminated stack tensile tests, including fitting quality, Comparison of Figure 10 k-failure model with data for δ values which lead to 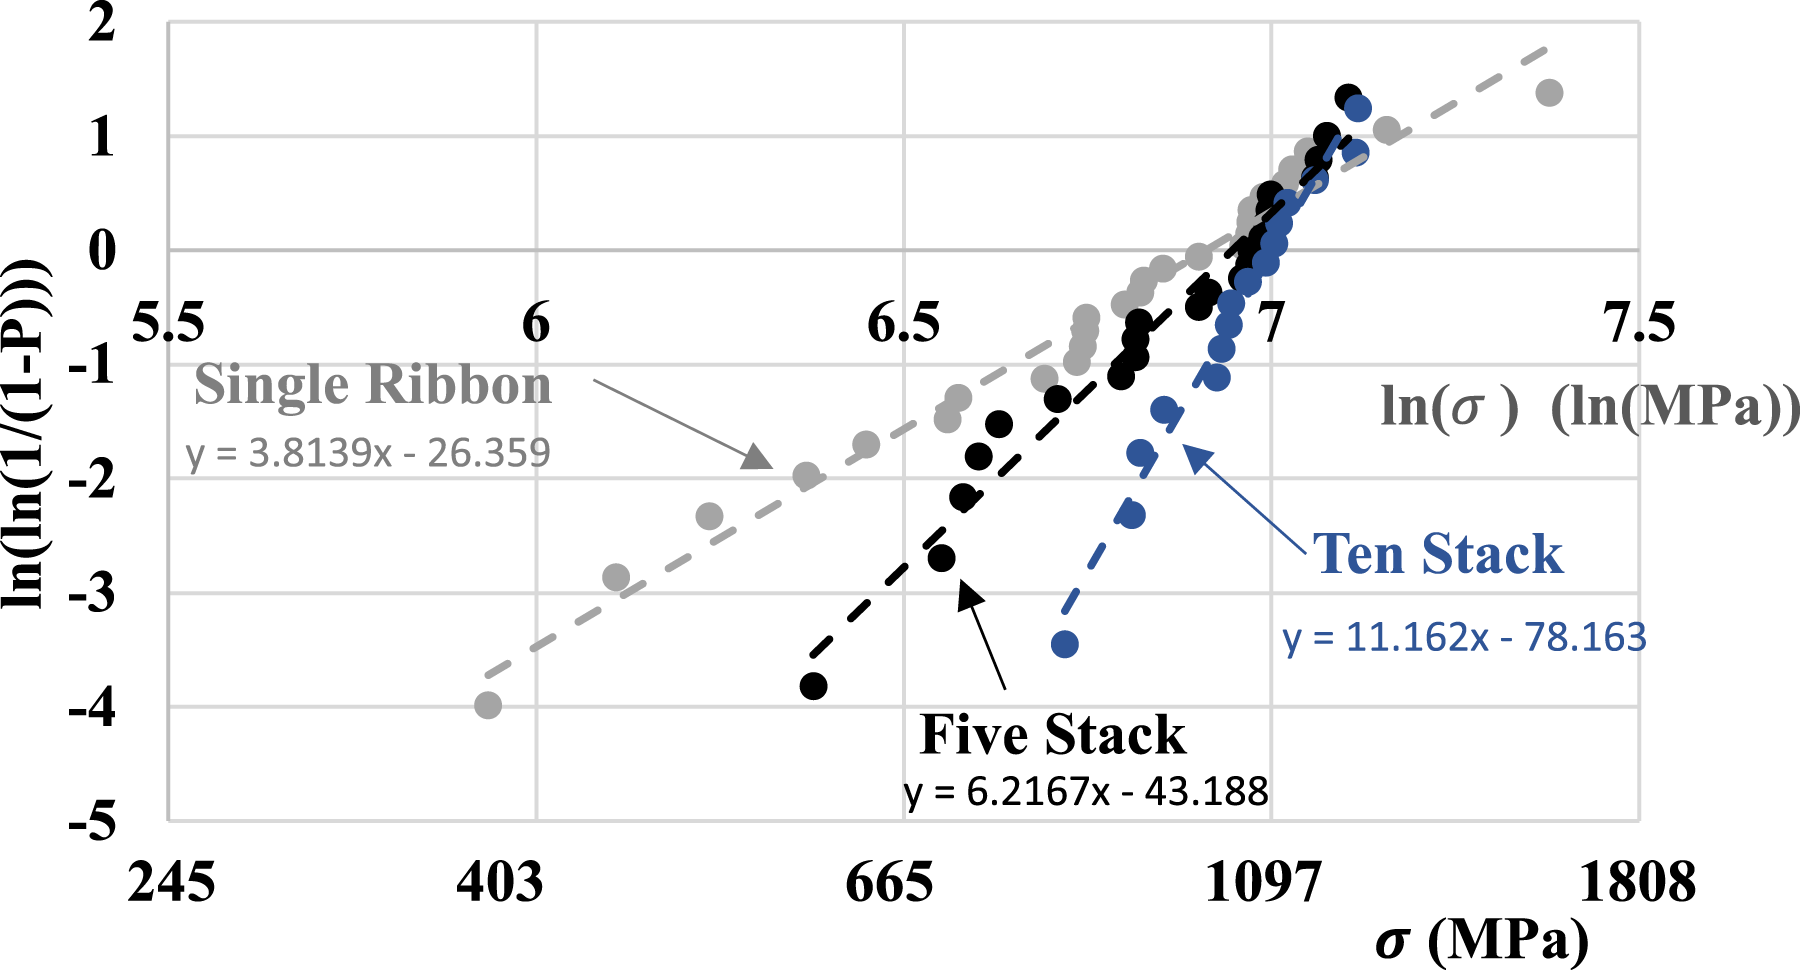
Experiment discussion
The tighter failure distribution with increasing layers is qualitatively understood from observations of stacks during testing. Figure 7(a) shows a five-layer laminated ribbon stack strained to failure, as captured with 33.3 μs time resolution over a 6 s span, at illustrative times of (a) High speed camera front view images of laminated ribbon stacks near failure point after sustaining multiple individual ribbon fractures, shown progressively from left to right with increasing 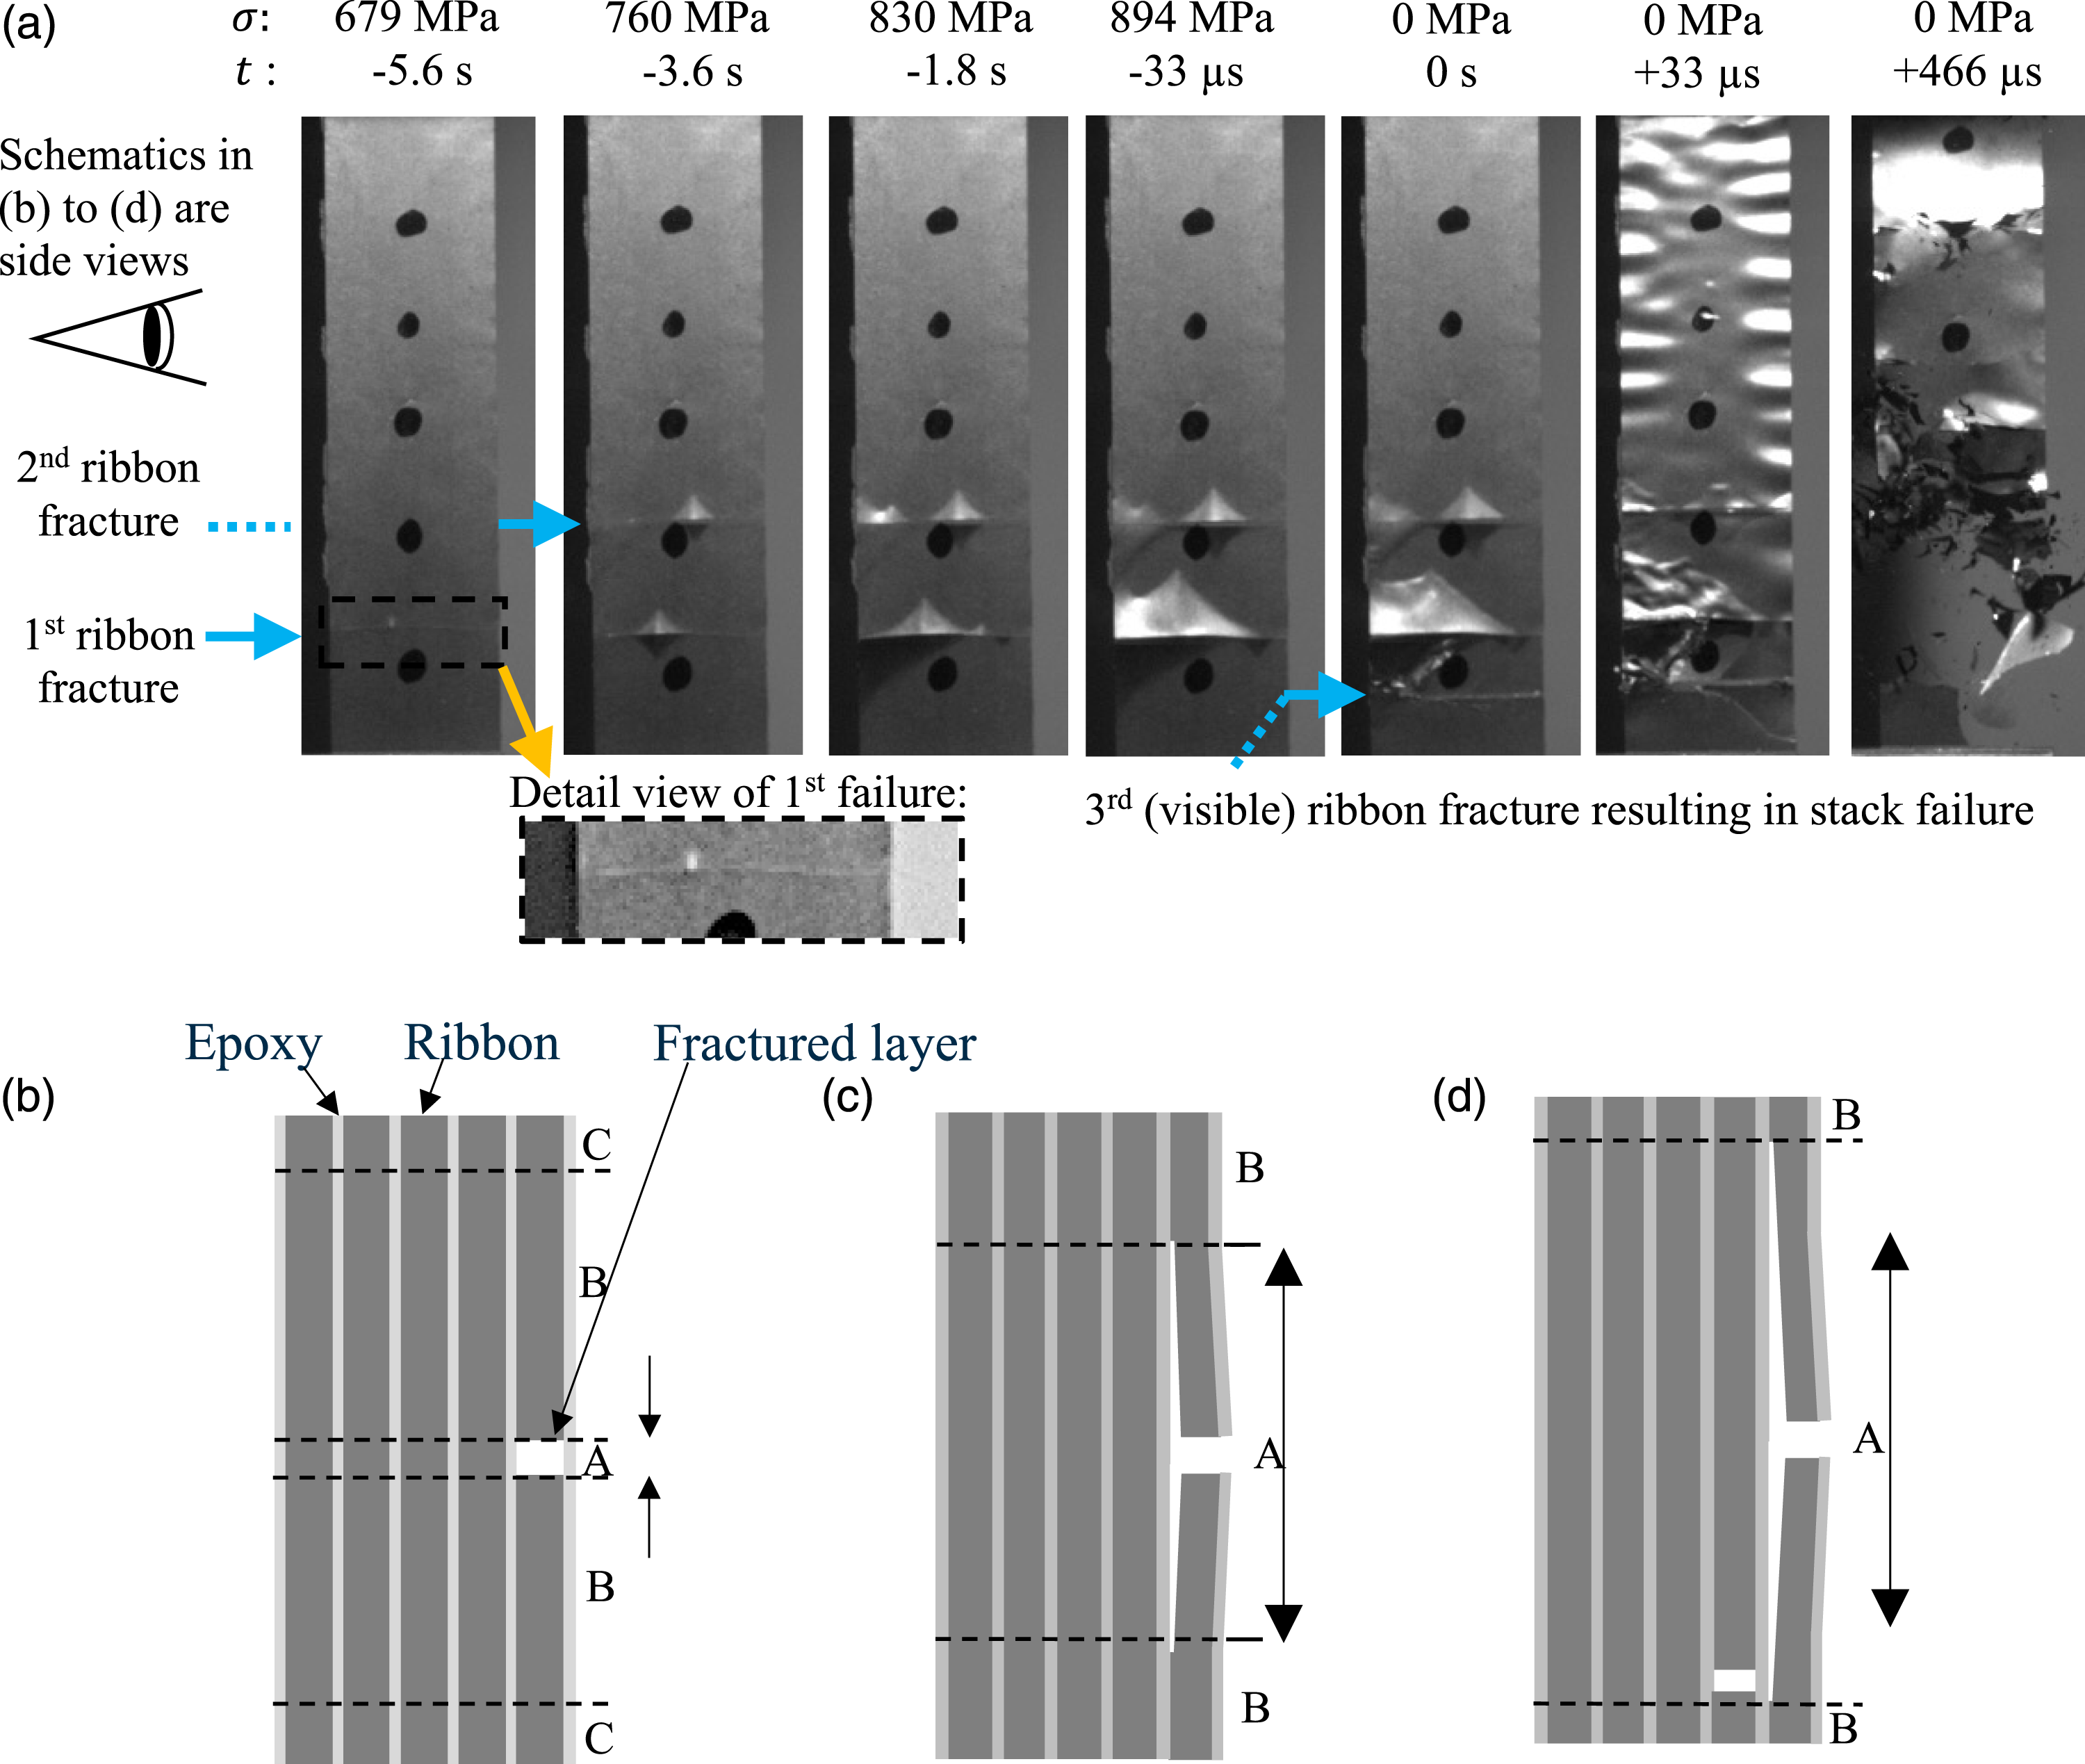
This sequence is represented schematically in Figure 7(b), (c) and (d), where a dominant flaw causes the outside ribbon layer to fracture in Figure 7(b). The total tensile load is then borne by only four layers in Region A. Because the epoxy bond sustains shear stress, a portion of the tensile load is transferred into the fractured ribbon layer at a sufficient distance away from Region A. Region B is a transition region, where the tensile stress in the failed ribbon gradually increases with distance from the flaw. The total length, 
After a ribbon layer fractures, it begins to peel away from the adjacent ribbon layer, shown pictorially in Figure 7(a),
Region A will eventually grow to encompass another incipient edge flaw of sufficient size to induce an additional layer fracture (Figure 7(d)), though this flaw is necessarily smaller than that which caused the first layer to fail. Upon failure of a second layer due to the local load concentration from the first failure, the probability of system failure increases again. System failure is finally shown in Figure 7(a), t = 0, after sufficient peel extension. Importantly, the first fracture of any given layer would be the point of failure in a single-layer test. This means that, due to good layer adhesion, the laminated stack can prevent specimen failure at the low-stress end of the distribution, as shown by the five- and ten-layer distributions in Figure 6. We note that Figure 7(b)–(d) assume peeling occurs across the full ribbon width, and as such do not account for peel length variation along ribbon width, which we assume to have little impact on overall behavior. We observe a similar sequence of events for internal ribbon failures in other specimens.
Modeling MANC-epoxy composite failure
Statistical models describing phenomena similar to the sequence described in the experiment discussion section have been developed in the context of impregnated fiber bundle failure. In these models, the matrix has negligible contribution to strength, in contrast with fiber-reinforced composites that have the matrix constituting a significant volume fraction. We apply fiber bundle models in the following treatment, and consider whether single layer ribbon failure data can be used to model five- and ten-layer stack strength data. The first model adapted to the present dataset is the chain-of-bundles model using Global Load Sharing (GLS). Early work by Weibull 25 in failure statistics and Daniels 39 in weakest link theory contributed to the chain-of-bundles model. It was later applied to carbon fiber composites by Zweben,40,58 Rosen, 41 and Harlow and Phoenix.42,43
The GLS model assumes that there is an ineffective length,
The GLS model analysis begins with a Weibull distribution for ribbon specimen failure, 
While the details of load sharing between bonded layers can be explained using solid mechanics arguments, these effects are simplified in chain-of-bundles models. Load sharing is typically considered using a stress concentration factor, 


Under these assumptions, GLS model prediction (dashed blue lines) for five-layer composite failure, compared with experimental data (solid red line). Here 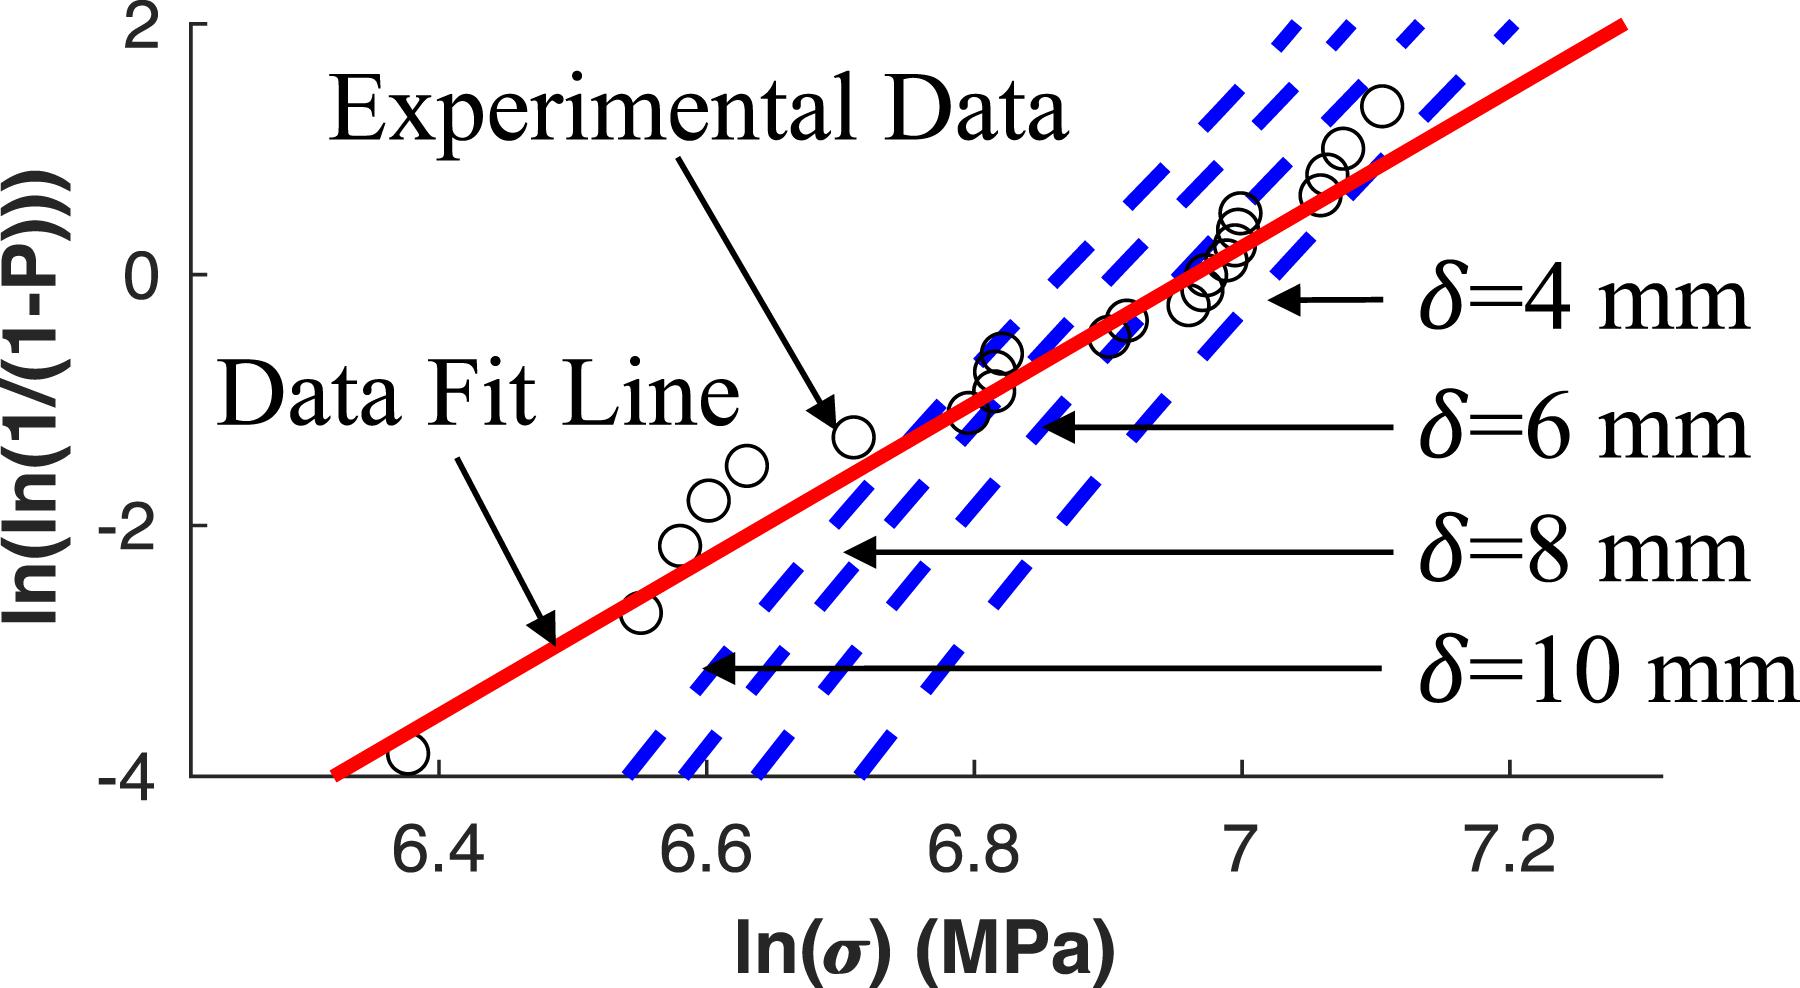
The next model we attempt is the chain-of-bundles model with Local Load Sharing (LLS), which requires the following steps to calculate a predicted failure distribution. First, ribbon data is used to write 

The failure distribution predicted by equation (7) with LLS for the five-layer data is shown in Figure 9 for various δ values, chosen to predict a failure distribution in a range close to LLS model prediction (dashed blue lines) for five-layer composite failure, compared with experimental data (solid red line). Here 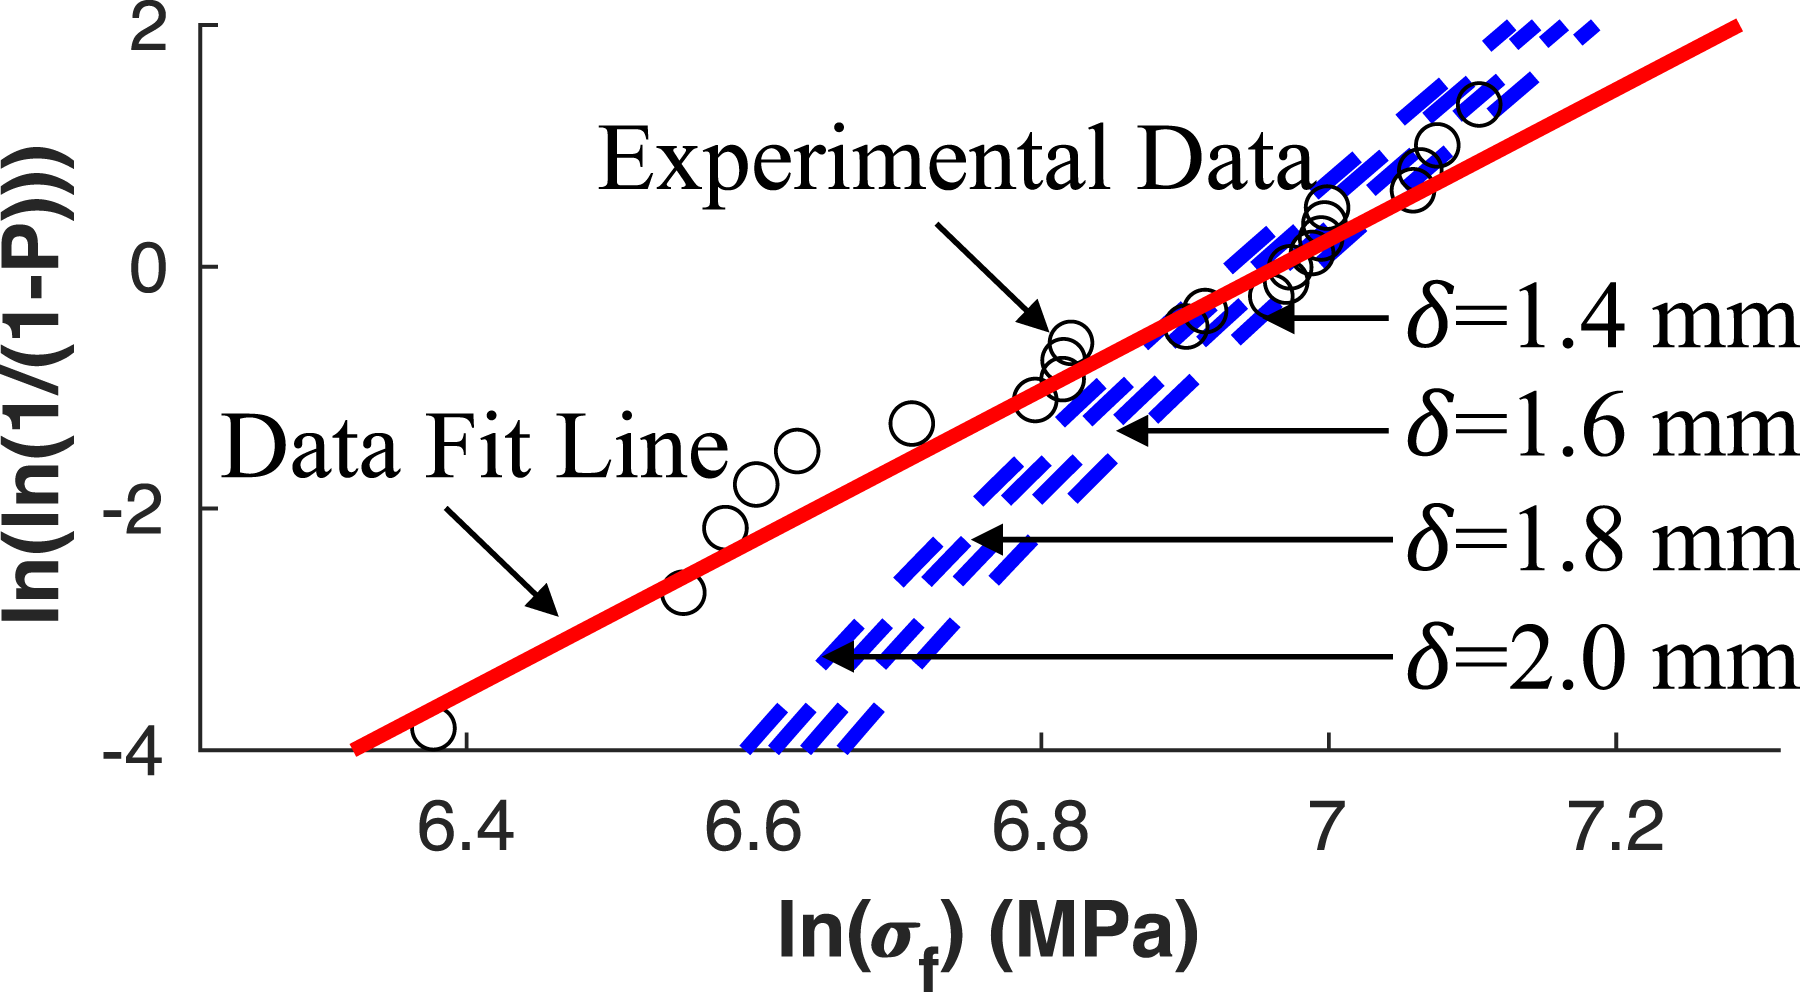
As a remedy to this limitation, some researchers45–48 have used LLS principles with simplified failure conditions in a model for bundle failure called k-failure. This model assumes bundle failure to occur when a critical number of immediately adjacent fibers, 

There are various forms of the k-failure model, but the two methods used in the present treatment are based on work by Smith and will be referred to as Method 1
45
and Method 2.47,48 Method 1 is an explicit calculation of P
f
, similar to the LLS model but only considering adjacent failures up to 


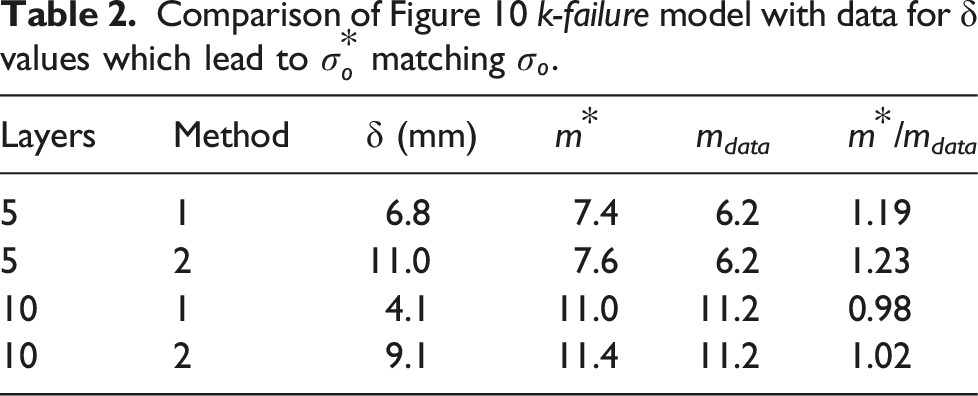
To evaluate whether Methods 1 and 2 match the data, Results from k-failure model Method Method 1 (dashed cyan) and Method 2 (dashed blue) for (a) 5 and (b) 10 layers, compared with data fit line (solid red). The associated 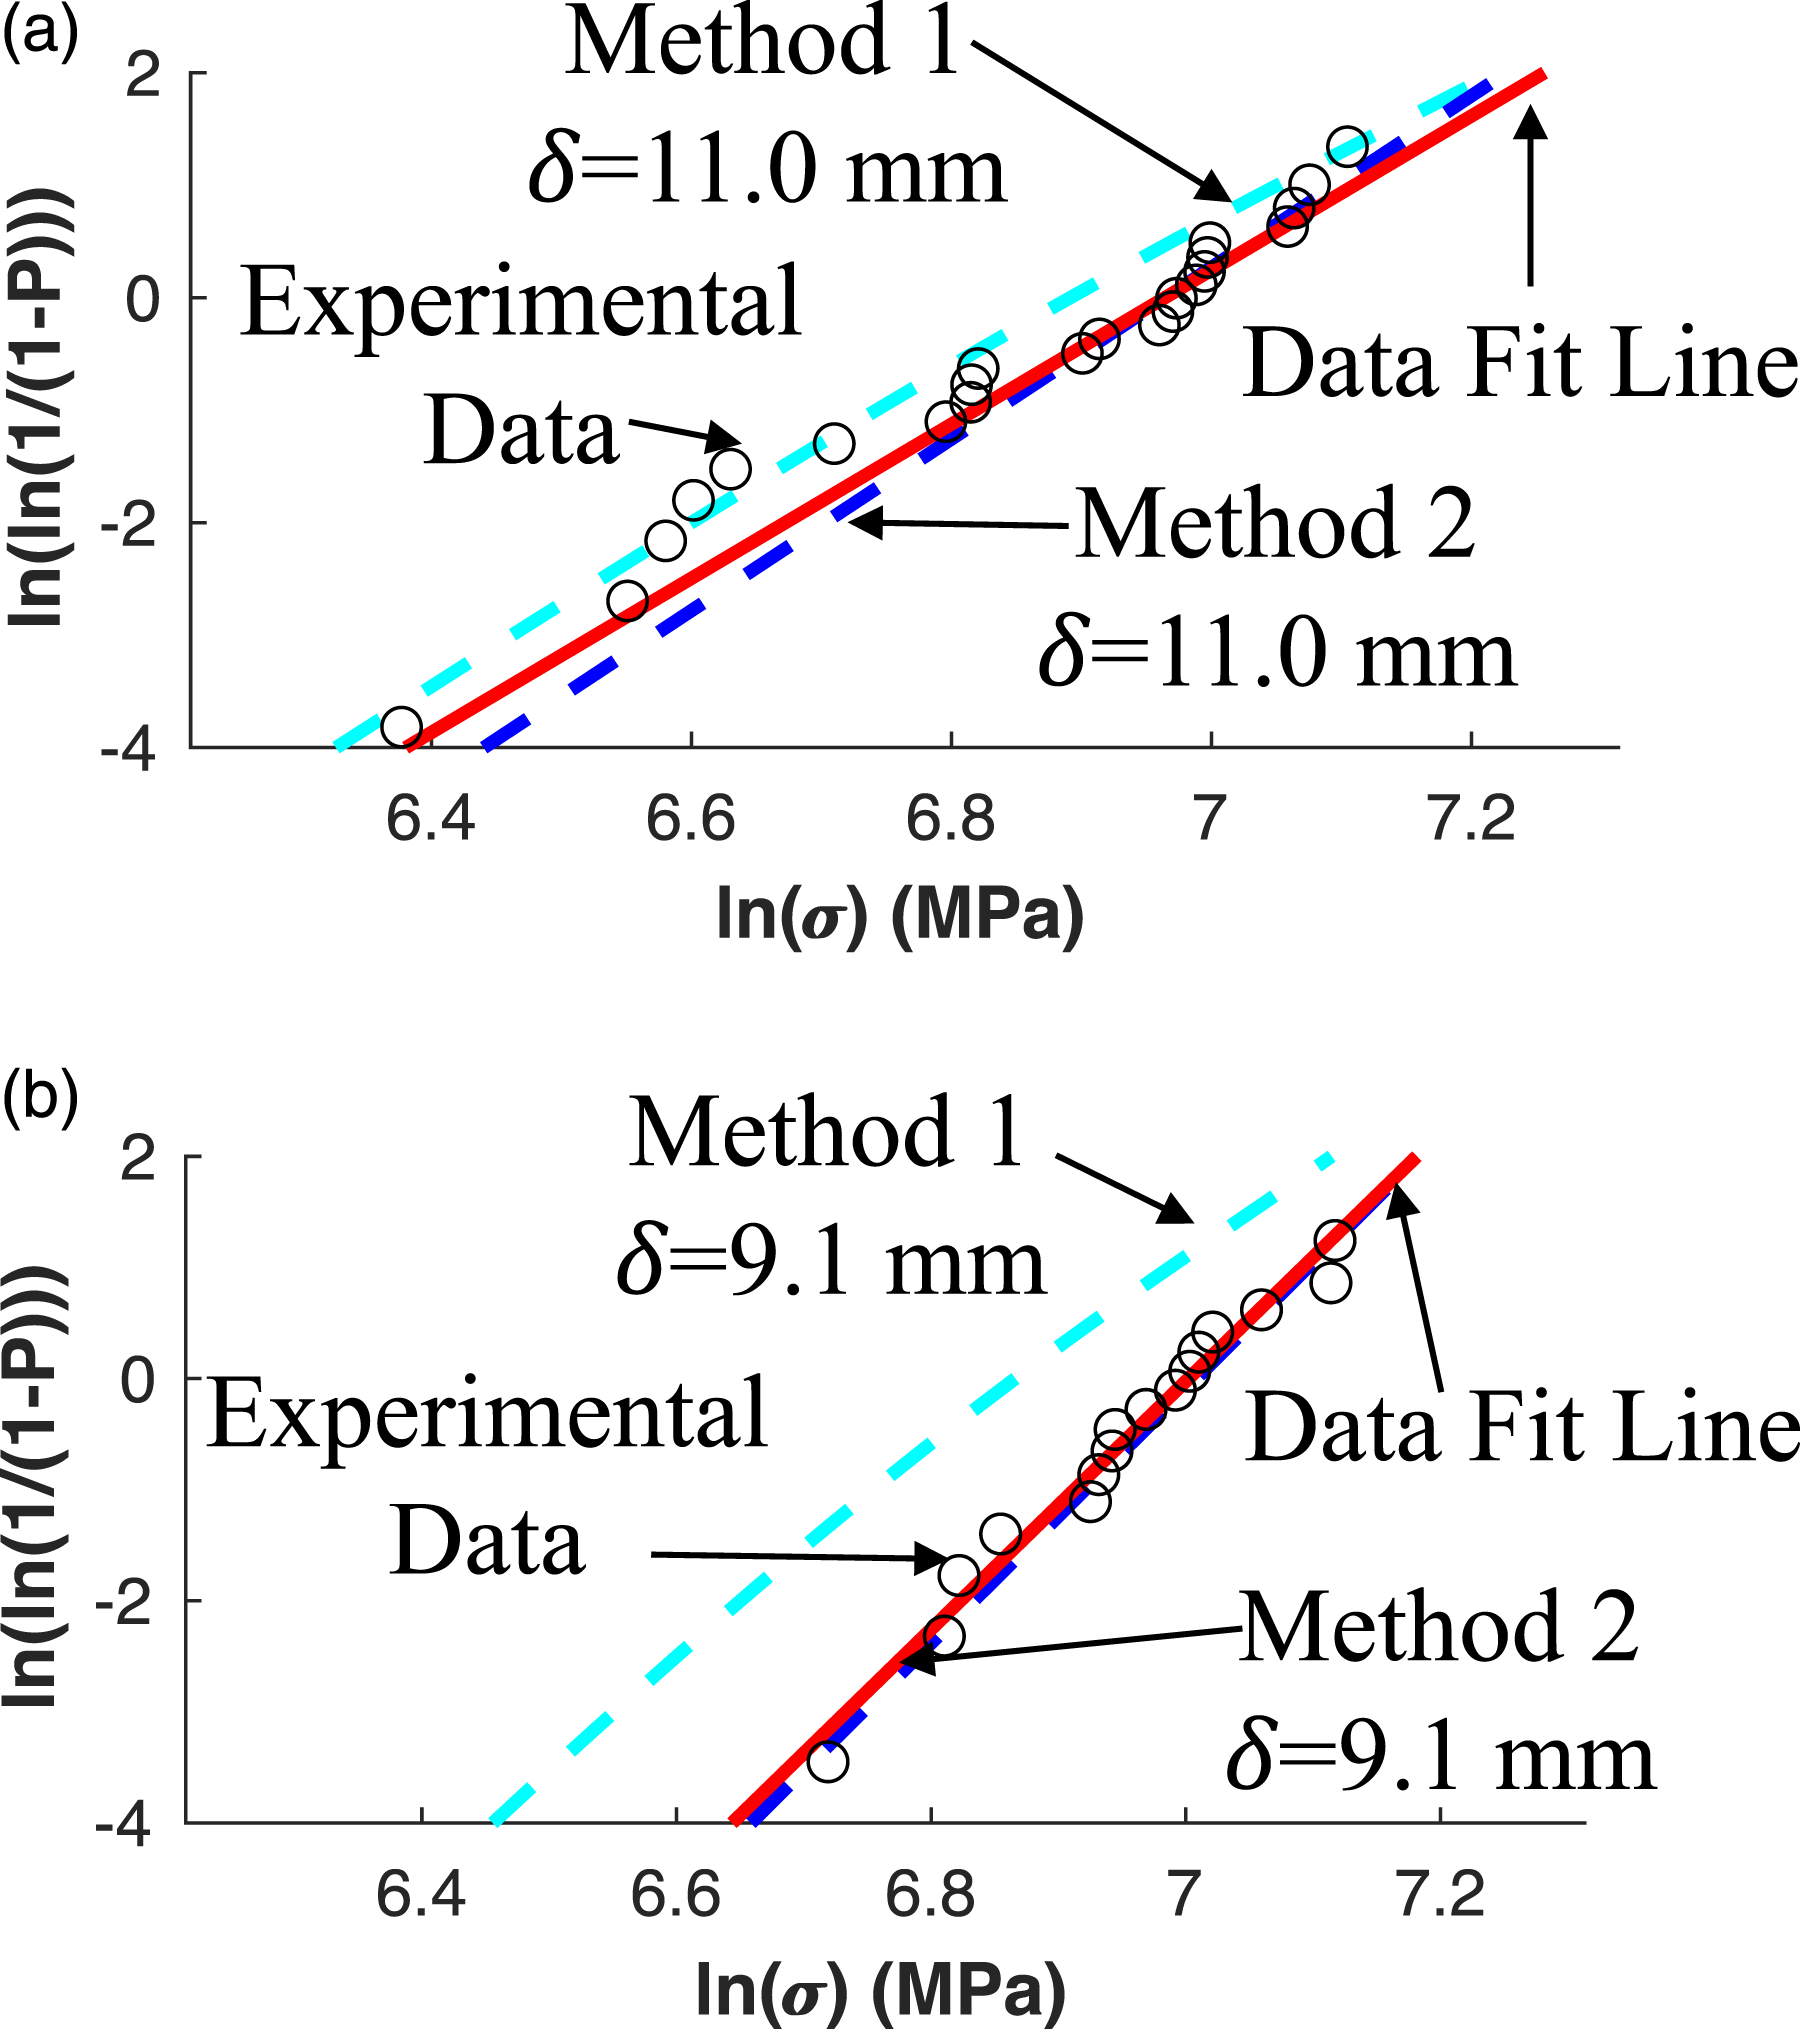
Given that the k-failure models describe the failure data well for the five-layer case, the models were then applied to the ten-layer case, with
Composite failure modeling discussion
The existing literature concerning fiber composite failure data comparison with chain-of-bundles failure models contains mixed results. 47 Multiple researchers have found GLS assumptions to perform poorly in modeling fiber systems, especially when compared with Local Load Sharing.46,59,60 LLS assumptions align better with theory of load distribution, but direct calculations using this method become computationally expensive at large bundle sizes, 27 making this approach unreasonable for modeling real systems. Watson and Smith 47 obtain good agreement between data and k-failure theory for impregnated fiber bundles. Other researchers have used Monte Carlo methods using LLS or k-failure models to accurately model failure distributions from experiments.59–61 Despite being developed ∼40 years ago, these models continue to be cited recently62–64 as the main modeling approaches for fiber bundles, or are used as the basis for models of different material systems. 65 Ongoing efforts to understand related phenomena such as the size effect 66 utilize the same weakest link and load sharing principles referenced in this work. In fiber reinforced composite systems, fiber packing is more random than simplified bundle geometries, meaning the models being used to predict the performance of such materials need to account for these load-sharing irregularities. Because laminated MANCs have a simpler arrangement of layers stacked linearly, the present material system is perhaps better suited to these simple models than the fiber systems for which they were developed.
As explored in the modeling MANC-epoxy composite failure section, k-failure models can be adapted to MANC laminations to have good agreement with experiment. Two such methods produce similar results while assuming different values of
Motors constructed from MANC epoxy-impregnated TWCs will have hundreds of layers, and it is of interest to consider what the k-failure model predicts as
The predicted increase in
Conclusions
The results presented here show that TWCs laminated with relatively thin layers of thermosetting epoxy show a substantial increase in Weibull Modulus,
Although localized cracking may not lead to catastrophic mechanical failure, it is important to note that this cracking is expected to alter the magnetic performance of the component. While more work is needed to study the effects of the types of cracks observed on magnetic performance, existing literature suggests that these cracks would increase coercivity and decrease permeability.34,35 Thus, a TWC subjected to a small stress which develops few distributed cracks may exhibit a minimal change in magnetic performance, but many cracks may significantly influence magnetic properties.
Other future work should investigate the impact of different cutting methods on ribbon edge roughness and the subsequent impact on the failure strength of laminated MANC ribbon stacks. Further work is also needed to determine the optimal processing steps to improve bond strength between layers to minimize interlaminar separation, as this should improve mechanical strength of the stack. Work should also examine the change in failure distribution of ribbon produced using a continuous casting process, as this ribbon is known to be of different quality than batch casting processes. More testing is required to quantify the
Footnotes
Acknowledgements
The authors graciously acknowledge the contributions of Eric Theisen, James Egbu, and William Pingitore to the experiments conducted in this work.
Declaration of conflicting interests
The authors declare the following financial interests/personal relationships which may be considered as potential competing interests: Michael McHenry reports a relationship with CorePower Magnetics that includes equity. Michael McHenry has patent #US2019/0368013 A1 issued to Carnegie Mellon University.”
Funding
The authors disclosed receipt of the following financial support for the research, authorship, and/or publication of this article: This work was supported by the Department of Energy (DOE) Advanced Manufacturing Office (AMO) [DE-EE0007867] and the DOE Vehicle Technology Office (VTO) [DE-EE0008870].
Data availability statement
CRediT statement
Kyle Schneider: Conceptualization, Methodology, Formal analysis, Investigation, Data Curation, Writing – Original Draft, Visualization Michael McHenry: Conceptualization, Supervision, Writing - Review and Editing, Funding Acquisition Maarten de Boer: Conceptualization, Supervision, Writing – Review and Editing.