
Abstract
In this study, tests were carried out on repaired 300 × 250 mm composite stiffened panels. The initial damage was assumed to be extended in a depth of the first six plies and a repair with scarf ratio of 1:50 was employed. A circular repair took place, utilizing laser-assisted ablation and the wet patches approach. The panels were tested in compression and Digital Image Correlation (DIC) and Acoustic Emission (AE) were used in order to monitor the damage initiation and propagation of the panels. In addition, Phased Array (PA) was used in order to monitor the patch failure. Detailed Finite Elements (FE) models were validated against the test findings and their performance as a prediction tool for the performance of repairs on composite aeronautical structures was assessed.
Introduction
The establishment and certification of adhesive joints in primary aircraft components and the optimization of the bonding procedure in order to reduce the weight and achieve more durable joints are an important objective for the aeronautics research and development worldwide. 1 In addition, automated repair procedures of composite structures are regarded as the future of the airplane maintenance in terms of cost reduction, repeatability and accuracy. Bonded scarf repair is a repair process that can be automated. The cost of replacing a damaged composite airplane component is huge and thus repairing it is cost-efficient. In this regard, the aeronautical industry stimulates the need to develop novel techniques that address the technological challenges associated with the repair of aeronautical CFRP structures that secure the airworthiness of the airplane. Structural repairs aim to recover as much as possible of the initial strength and stiffness of a component and restore the original geometry.
At present, external patches are usually connected to the original structure with mechanical fasteners (i.e., rivets, screws and bolts). However, mechanical fasteners usually cause fiber discontinuity in composite materials, which leads to great degradation of their mechanical properties/performance. Moreover, corrosion is a common phenomenon occurring after mechanical fastening. In this regard, adhesive bonding is a promising method to connect the repair patch to the original structure. Adhesive bonding provides lighter joints, reduces the stress concentration and is highly resistant to fatigue and corrosion. 2 Studies towards the optimization of the process parameters of adhesive bonding are being carried out, as adhesive bonding poses a new, efficient way of joining two parts together.3–7
According to 8 the adhesive’s mechanical behavior and more specifically the ultimate strain at failure is a primary factor regarding the strength of a bonded joint if the peel stresses can be neglected. Ductile adhesives have a higher strain to failure and as a result they can provide higher durability in a well-designed joint. Epoxy adhesives such as FM-300 have been widely used in previous research.9,10 The bondline thickness influence on the efficiency of the joint has been investigated in refs. 10,11. It was determined that an adhesive to ply thickness ratio of 2/3 reduces stress concentration on the joint. Furthermore, in ref. 12, it was observed that a 1% increase in void content in the adhesive film can reduce the recovered strength by 5%.
Even though adhesive bonding offers great advantages, it is only permitted in secondary structures of an airplane. The inability to completely detect flaws such as kissing bonds in the adhesive bondline with non-destructive testing is a major issue that hinders the utilization of adhesive bonding in primary structures. This type of flaw occurs when the two joined parts are in perfect contact but there is no mechanical connection between them. Researchers have tried to address the problem by proposing various configurations such as the impedance method or non-linear ultrasonics.13,14 Many studies have been carried out to optimize the scarf repair technique. In ref. 15, the effect of repair geometry, patch type and surface treatment is studied for eight plies repair. Yoo et al. 16 conducted a parametric study on the effect of different scarf ratios. They observed that for scarf ratios of 1:5–1:10, the recovered properties are low (below 20%) and by increasing the ratio (1:30) the recover percentage increased. However, in their research they used overplies at the repair. In ref. 17, they studied the effect of fiber oriented repairs, both experimentally and numerically. Despite the reduction in repair length, no significant improvement on the recovered strength was observed, compared to stepped scarf repair. Whittingham et al. 9 conducted an extensive study on the effects of the type of repair patch used on the bondline’ s quality.
In previous studies form the authors,18,19 validated FE models were capable to predict the behavior of bonded patches and the optimized shape of patch could be beneficial for the performance of the composite structure. If this evaluation has to be linked with existing practices that are used by the MROs, the circular patches had to be investigated. In this study repaired composite stiffened panels were manufactured and tested. The scenario indicates that the panels had to be repaired after an impact damage to the first six plies. The aim was the assessment of the bonded patch repair to element level and if the repair can withstand the loads that the panel can carry; the panel should fail before the repair. In order to perform the repairs, the repair manipulator equipped with a laser head that developed by the authors was used. This manipulator is an innovative manipulator that uses a laser head not only for material removal but also for surface activation for enhanced bonding. 18 The findings of the test campaign were used to validate the performance of FE models as a predictive tool for the performance of repaired structures.
Manufacturing and repairing the single stiffener panels
For this set of experiments, it was decided to add a stiffener to the repaired plates. An omega-shaped stiffener common in fuselage subcomponents was used. It consists of seven layers of CFRP material, same as the plate. The layup is 45/-45/0/90/0/-45/45. Figure 1 shows a view of the manufactured stiffener. Its length is 300 mm same as the length of the plates. The stiffener was laid on a premade tool with the desired arcs top and side lengths, while the width of the tool was larger. Any excess in the width would be removed later. A releasing agent was sprayed on the tool before laying the prepregs, in order to be easier to remove the stiffener from the mold after the curing process. Furthermore, the tool was heated at 60°C in order for the prepreg layers to be softer and be shaped to the required arcs. Unlike a regular plate layup, this stiffener layup was harder to achieve, since a lot of attention was necessary to follow the tool’s geometry. Once the layup was finished, the required expendable was prepared (peel ply, breather ply, blanket, vacuum bag) and the stiffener was place inside an autoclave to cure. The curing profile was the same with the plate. Stiffener before entering autoclave (left) and stiffener after exiting autoclave (right).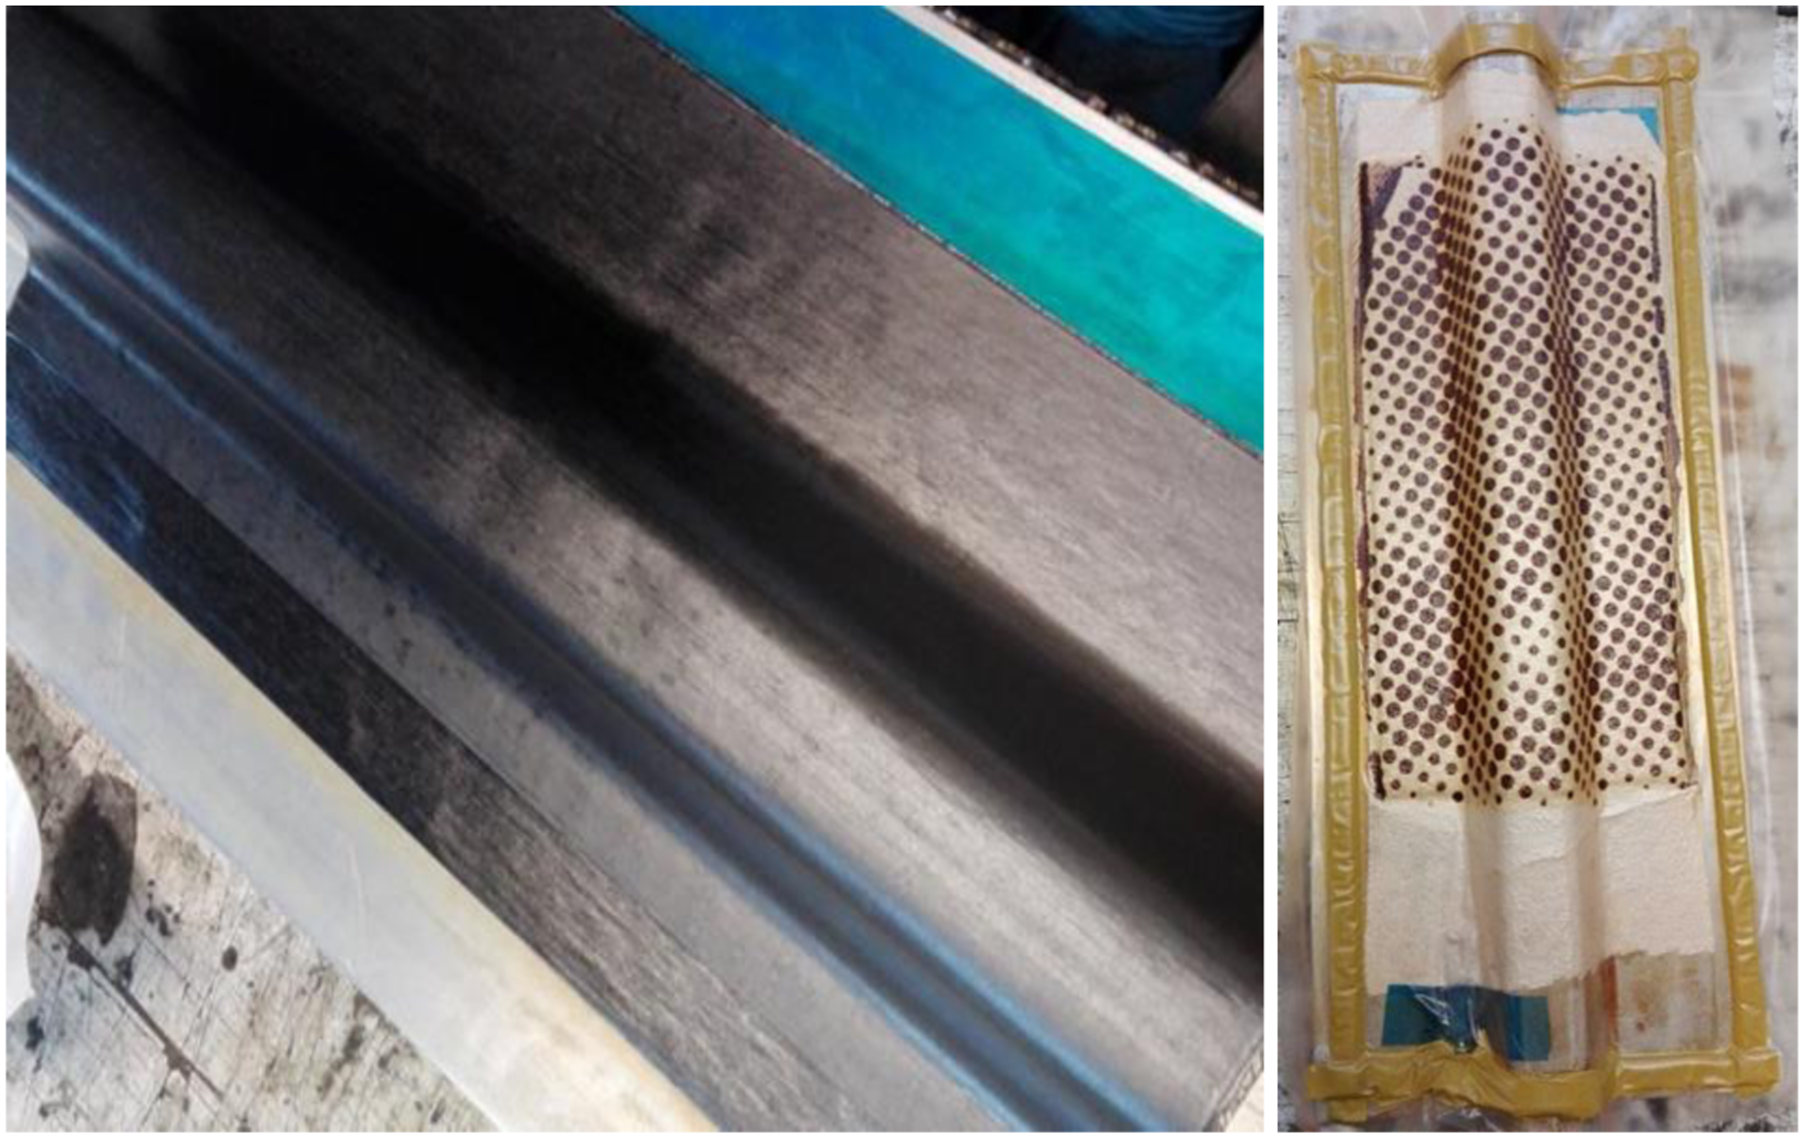
Figure 1 shows the stiffener after exiting the autoclave. It is easily observed that the excess resin is absorbed by the blanket. Furthermore, the lack of resin at the arcs indicates a good arc quality. The C-scans confirm what we observed from on the heat blanket. The quality of the stiffeners is good, having uniform thickness at the sides and top.
The higher scarf ratio is supposed to achieve higher recovered strength and the circular pattern avoids stress concentrations since the complete stiffened panel will be tested. Instead of the common 1:20 scarf ratio. Here the 1:50 scarf ratio will be used as it was proved to be more efficient with the least scarfed material.
19
Prior of the application of the Stepped Scarf Repair, the material removal was done by using laser source. A slight difference in the laser parameters was made compared to the previous relative work.
18
Instead of 456 kHz the frequency was 600 kHz and the speed was elevated to 3600 mm/min. These parameters were the result of a new statistical investigation about the laser parameters and provide comparable results as the previously used parameters. The quality after the treatment is visible in, Figure 2. Plate after laser treatment (left) and wet patch application (right).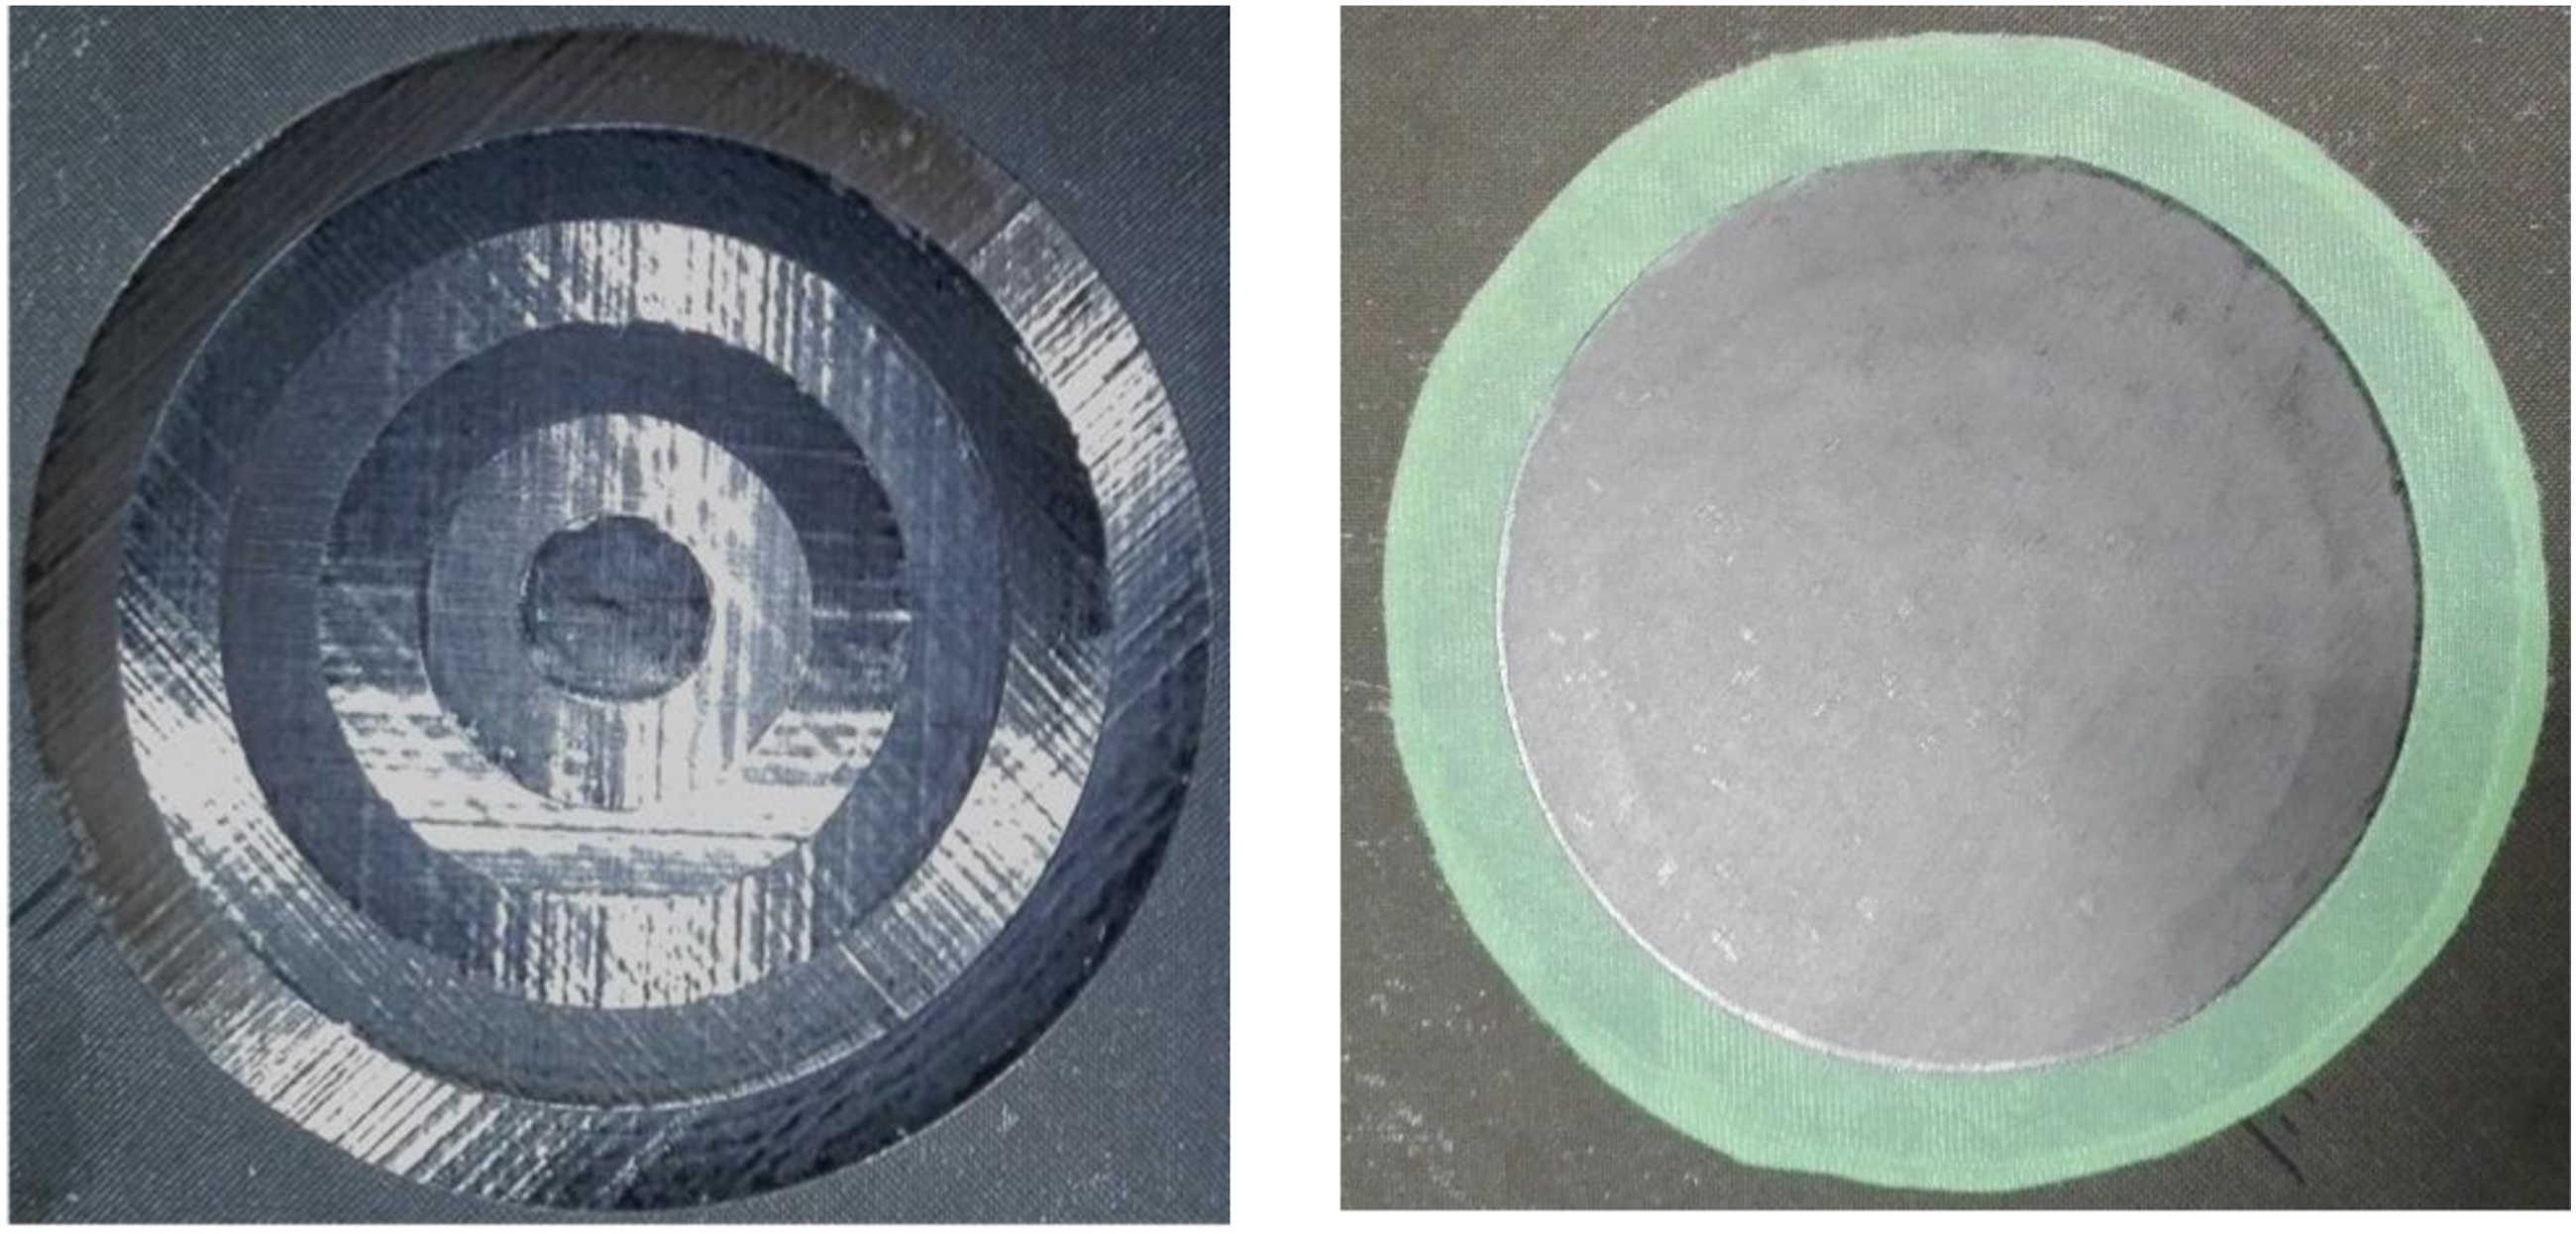
A wet repair method is employed. The prepreg layers for the repair were cut in a turning machine to the desired diameters The adhesive film was laid in the cavity and the prepreg plies were put one by one. Ultrasound (C-scan) was used to evaluate the uniformity of the repair.
Thus, the plate’s surface was grinded with sandpaper to roughen the surface and provide better adhesion. The stiffeners were also cleaned from the release agent used on the mould and also grinded. The same FM-300 film was used to bond the stiffeners with the plate. The film was laid on the feet of the stiffener and then place in the middle of the plate. A frame of 200 × 290 mm2 was placed under the stiffened panel to prevent it from bending by the vacuum pressure (Top Figure 3). The plate with the stiffener was placed in autoclave, for the film to cure for 2 h at 177°C and 2.8 bar pressure. Top; Stiffener bonding preparations and Bottom; potting setup and test article before testing.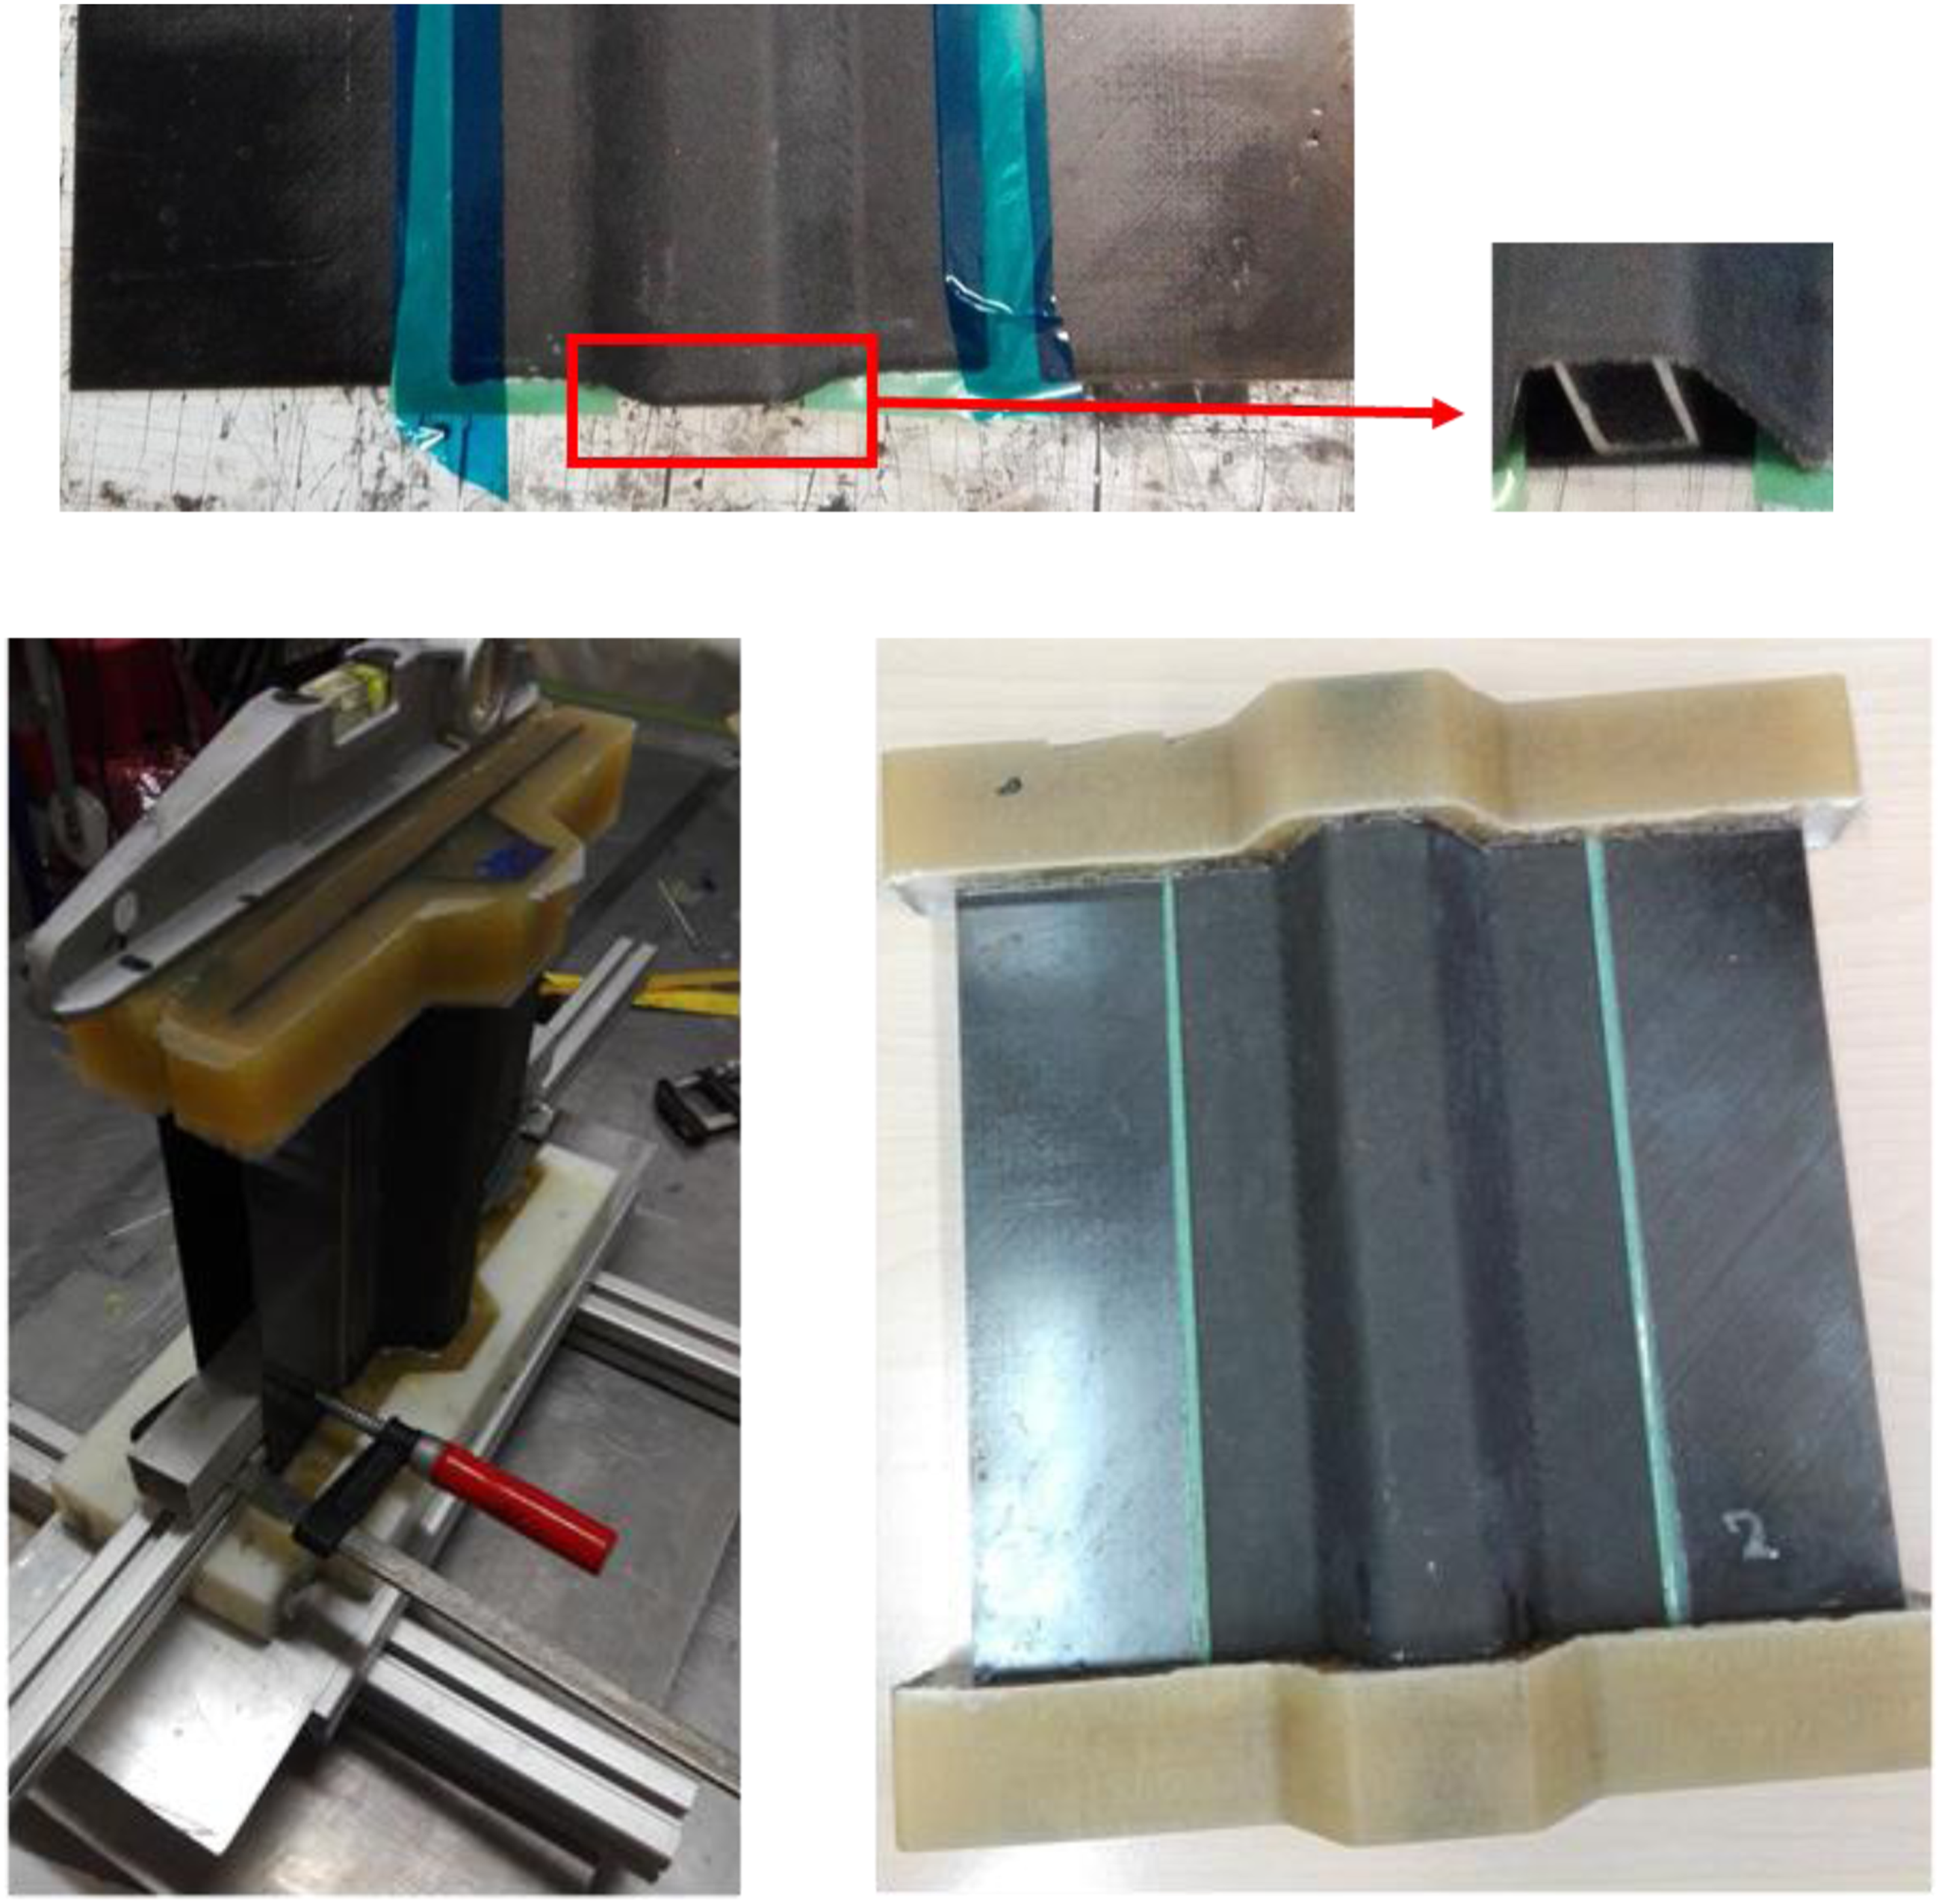
In order to be able to test the panels, a resin pot was required in order to ensure the uniform load introduction to the test article. A two component epoxy resin was used, which was cured at room temperature for aproximately 24 h. The panels were placed at a pre-constructed mould one side at a time. In order to fit in the mould the panels were cut to 250 mm width. Figure 3 shows a snapshot from the potting process as well as the final test article.
Testing in compression the repaired panels
The compression tests took place in a 250 kN INSTRON hydraulic universal testing machine with two flat steel blocks that were used for the compression (top block detailed in Figure 4). As it was shown earlier the panels’ loading edges were potted in resin in order to achieve uniform loading transfer conditions.
20
The ends of the resin pots/stiffened panel were machined to achieve excellent parallelism between the two sides of the panel. Additionally, a white paint coating was sprayed in the front side of the panel, and then back dots were made using an airbrush (Figure 5). This is a necessary process to implement the Digital Image Correlation (DIC) system and create reference points (RP) to measure displacements. Digital Image Correlation was used as a full-field optical method to measure displacements and strains as well as observe the post-buckling eigen-modes. Two panels were also equipped with a LVTD to measure the actual displacement of the panel edges in order to avoid error in measurements by the testing machine. The movement of the needle corresponds to voltage which is then calibrated to displacement. Then the panel was placed in the test machine where two. test setup. Test articles after being painted for DIC.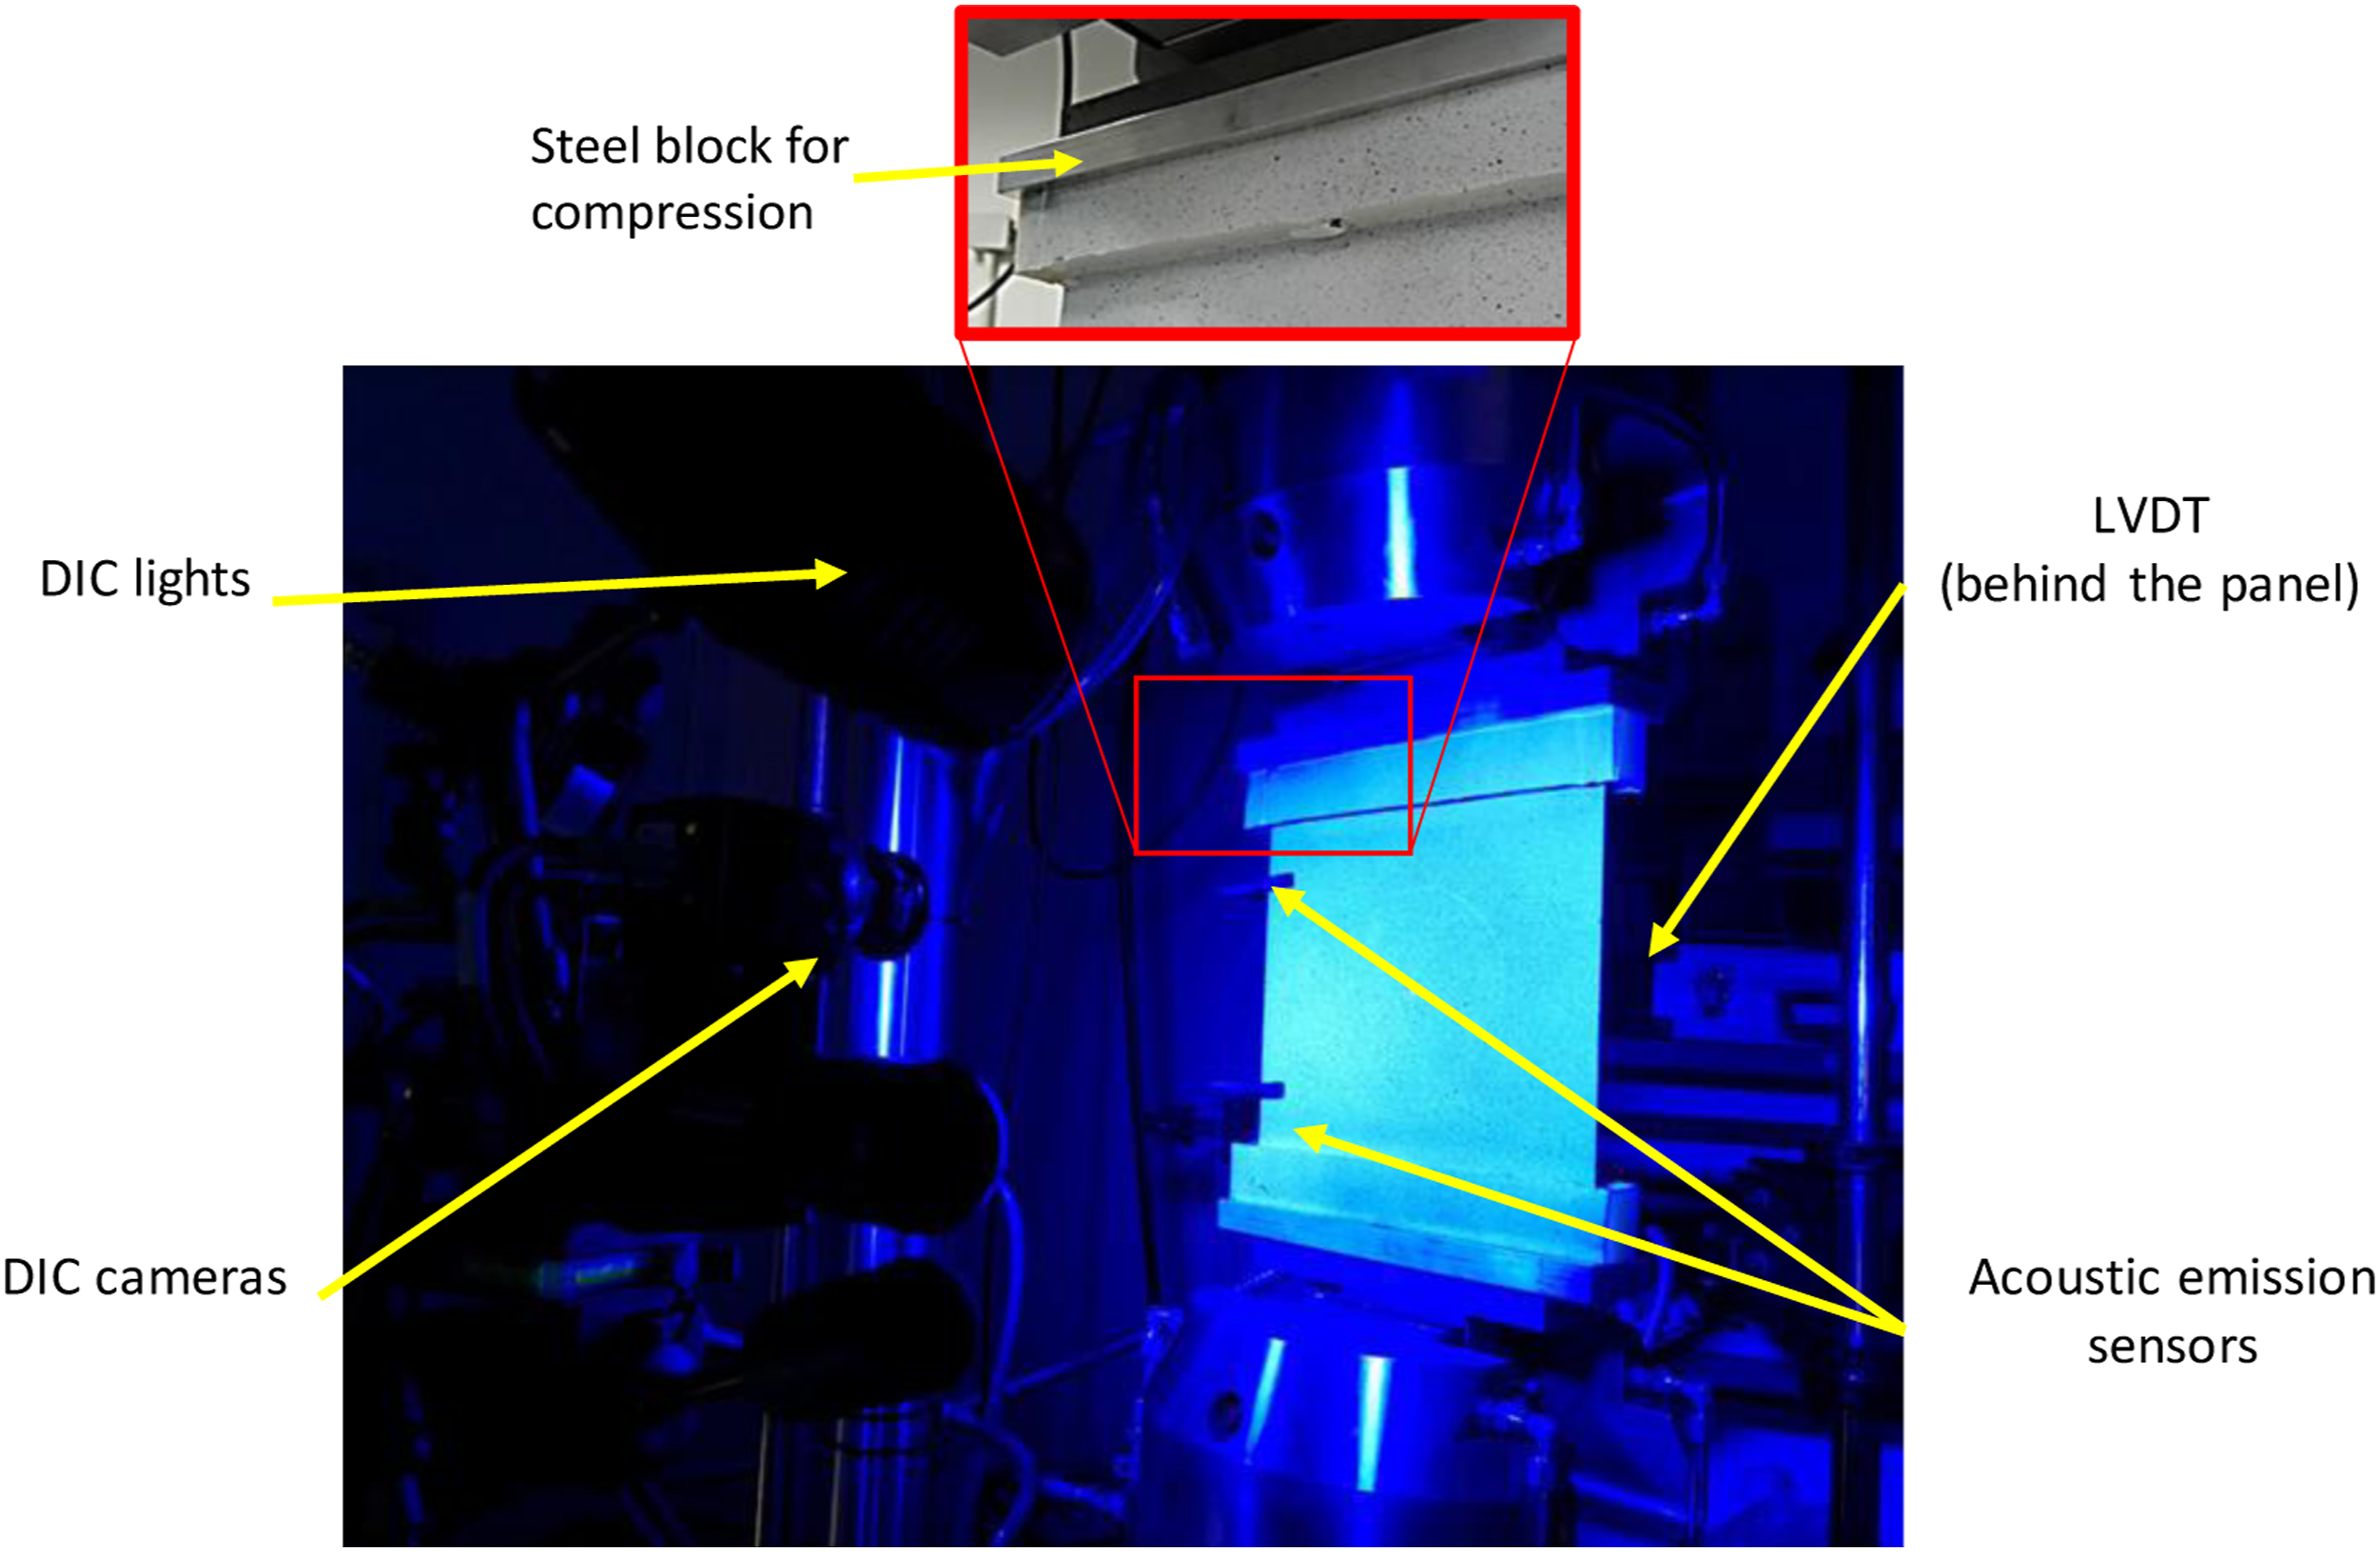
Panel 2 was the first specimen that was tested. The panel was placed on the machine and the setup of all measuring systems began. First the camera focus, distance and parallelism were set. Then, the calibration of DIC took place. Aramis professional 2017 was used as the DIC software and all associated hardware was provided by GOM. Two Acoustic Emission (ΑΕ) sensors were placed on the back of the panel, between the edge and the stiffener. Both sensors were on the same side. The distance between them was 140 mm. The AE sensors were of wideband piezoelectric sensor type WD 100–900 kHz manufactured by PAC, USA. The acquisition AE signals were performed using a PCI-2 A/D acquisition board system. The pre-amplification level used was of 40 dB and band-bass filtering of 100–1200 kHz was applied using general purpose voltage pre-amplifiers. A threshold of 40 dB was adequate and the choice of the timing parameters was PDT = 50 μsec, HDT = 100μsec and HLT = 300 μsec. Pencil break calibration tests were used for the calibration of the AE set up. The compression rate was set constant at 0.5 mm/min.
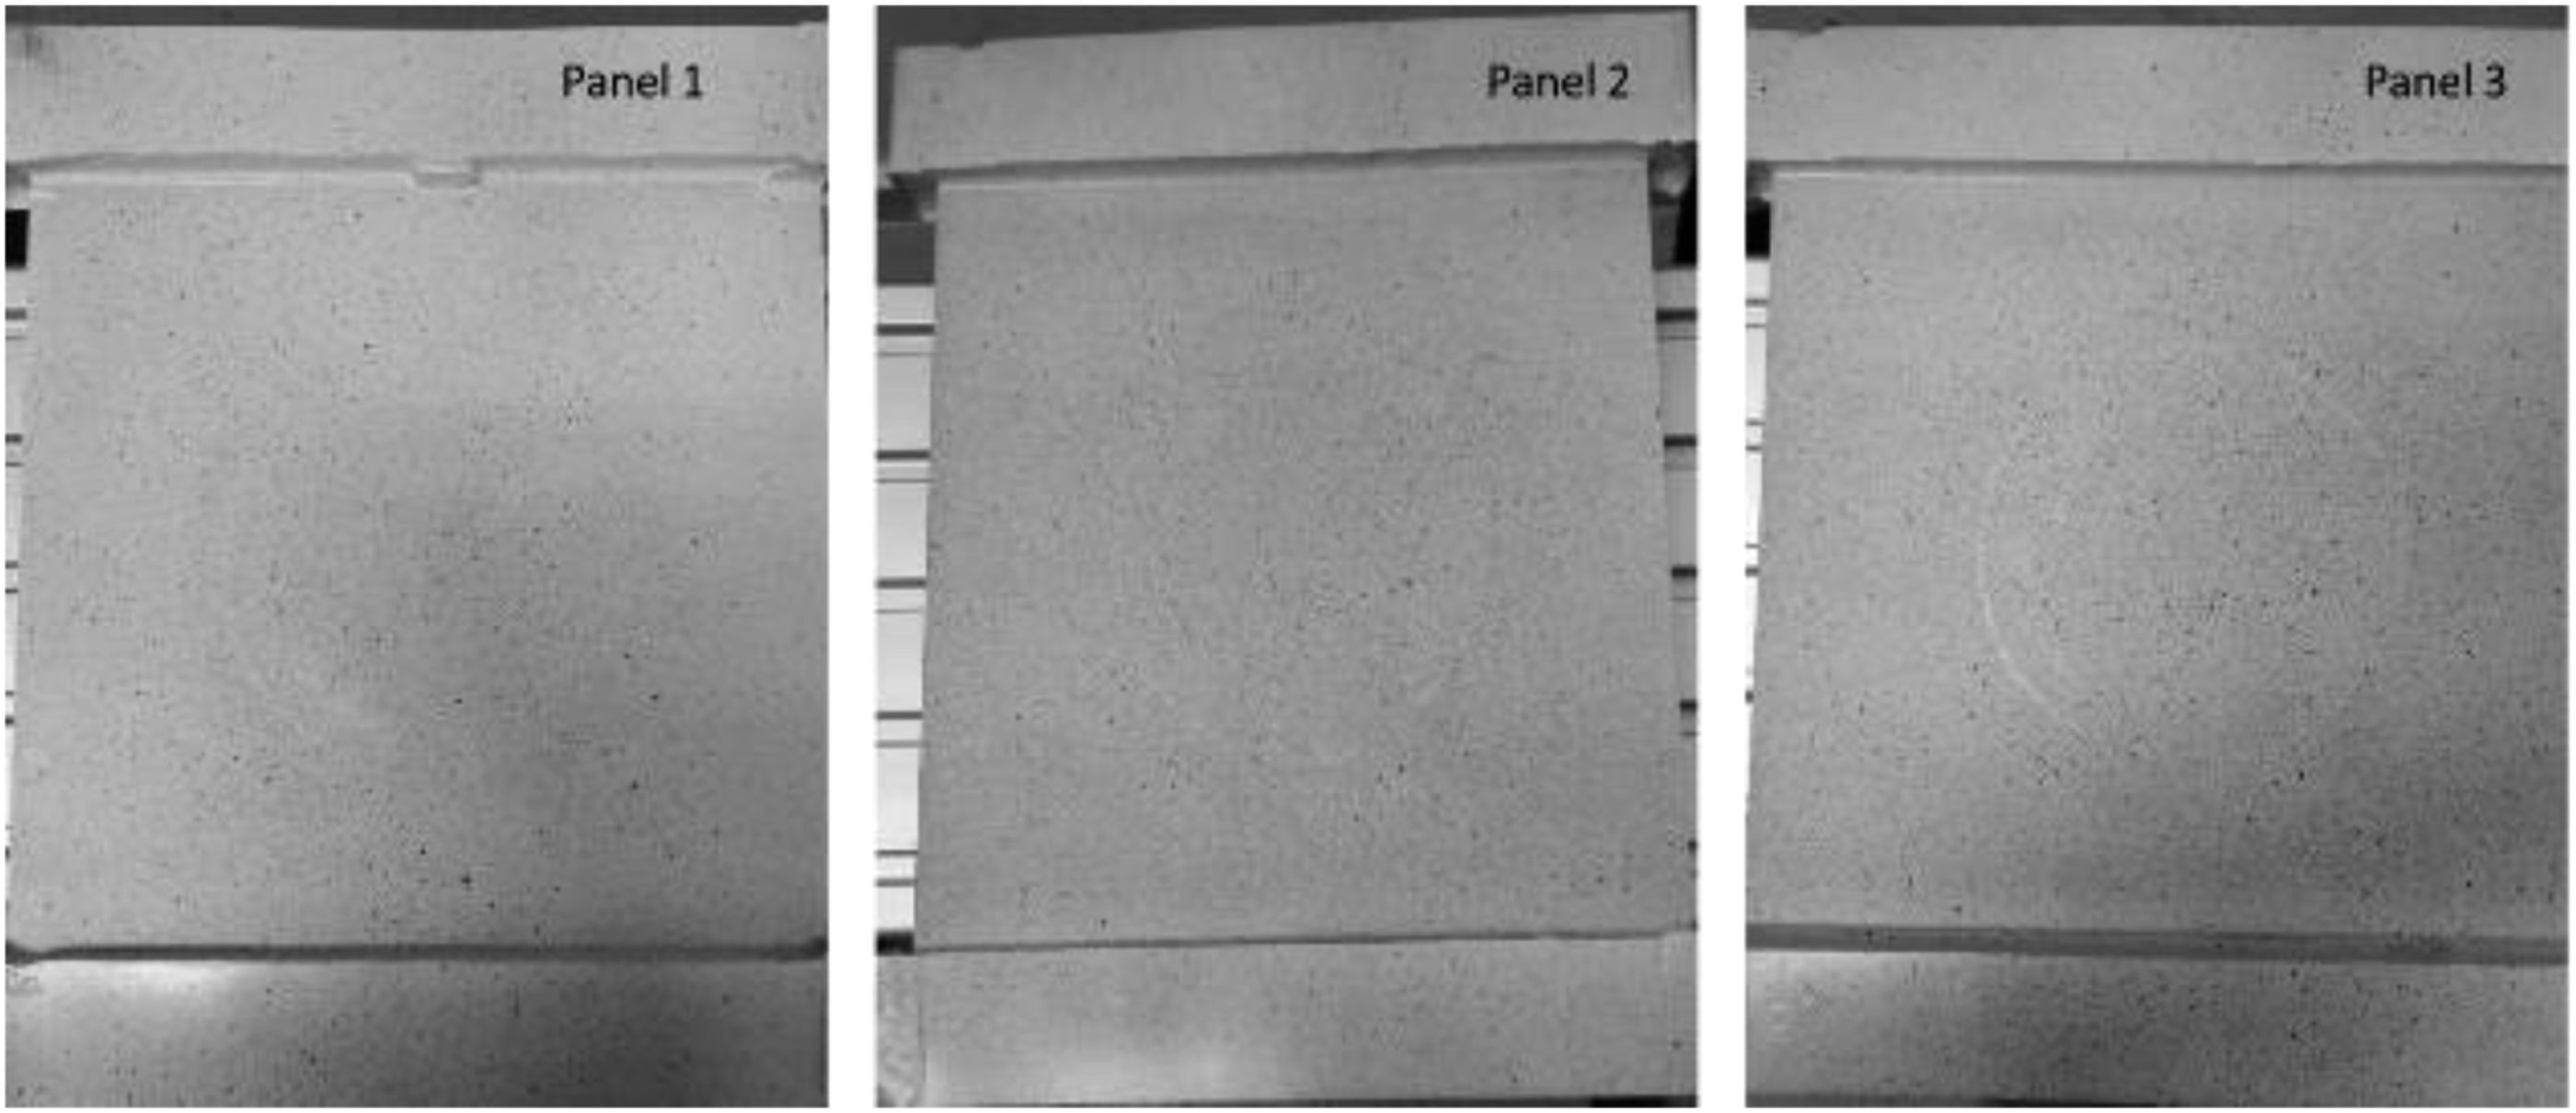
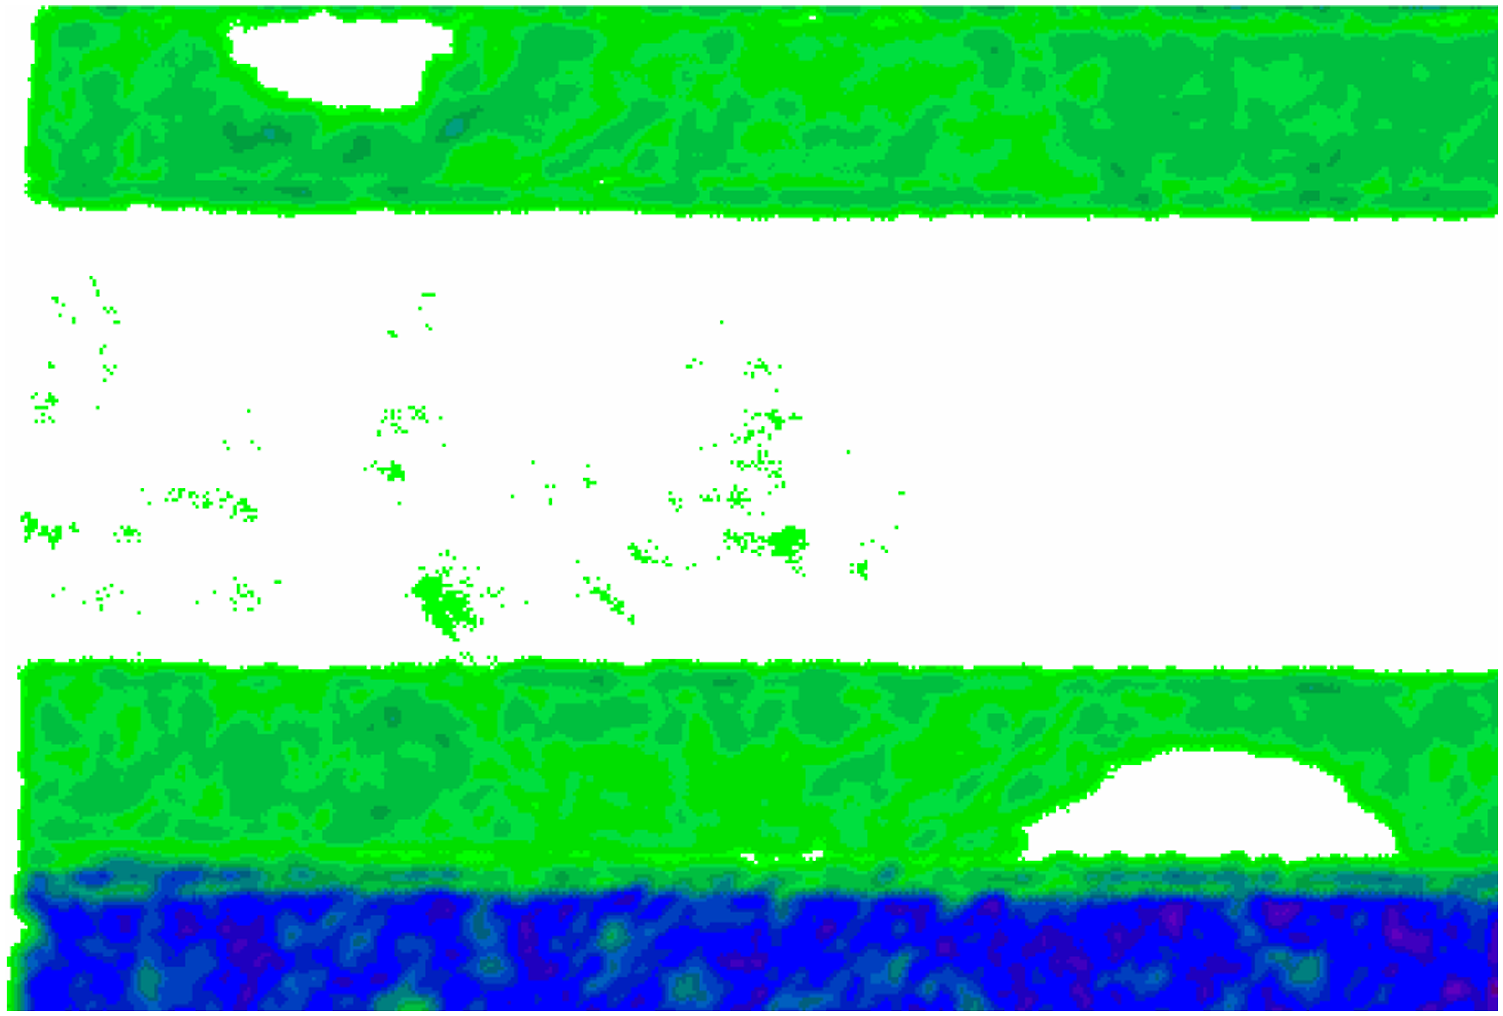
The first buckling was observed at around 35 kN. A cracking sound was recorded at 76 kN, and a second one at 96 kN, however no visible damage was seen, on either side of the panel. No adhesive debonding was observed at the patch, or the visible sides of the stiffeners. The experiment was cut short at around 100 kN, and the collapse load was not reached, however significant post-buckling was observed. The maximum displacement recorded by the machine was approximately 2.0 mm. From the DIC images, Figure 6, buckling modes are observable at the free edges. Around 90kN the buckling pattern shifted a little, with the left buckling mode moving higher, and the right one lower, possibly because of some internal failure somewhere in the panel. The AE hits also seem to have peaked during the same period, possibly marking an impending panel failure. The patch area had not yet been affected by the buckling waves, and no patch failure was observed. The next stage was to use a C-scan to check for internal failures and continue the experiment until panel collapse. The C-scan showed two adhesive debonds on the feet of the stiffener, one at each side (Figure 7). This could explain the shift in the buckling waves. Due to the resin potting the water could not pass through the stiffener to inspect the patch area, so holes were drilled in order to allow the water to flow in, under the repaired panel area. However, no other damage was observed. DIC results for three load levels; 50kN, 80kN and 100kN (top to bottom). C-Scan (double through) for panel 2 failure (prior collapse).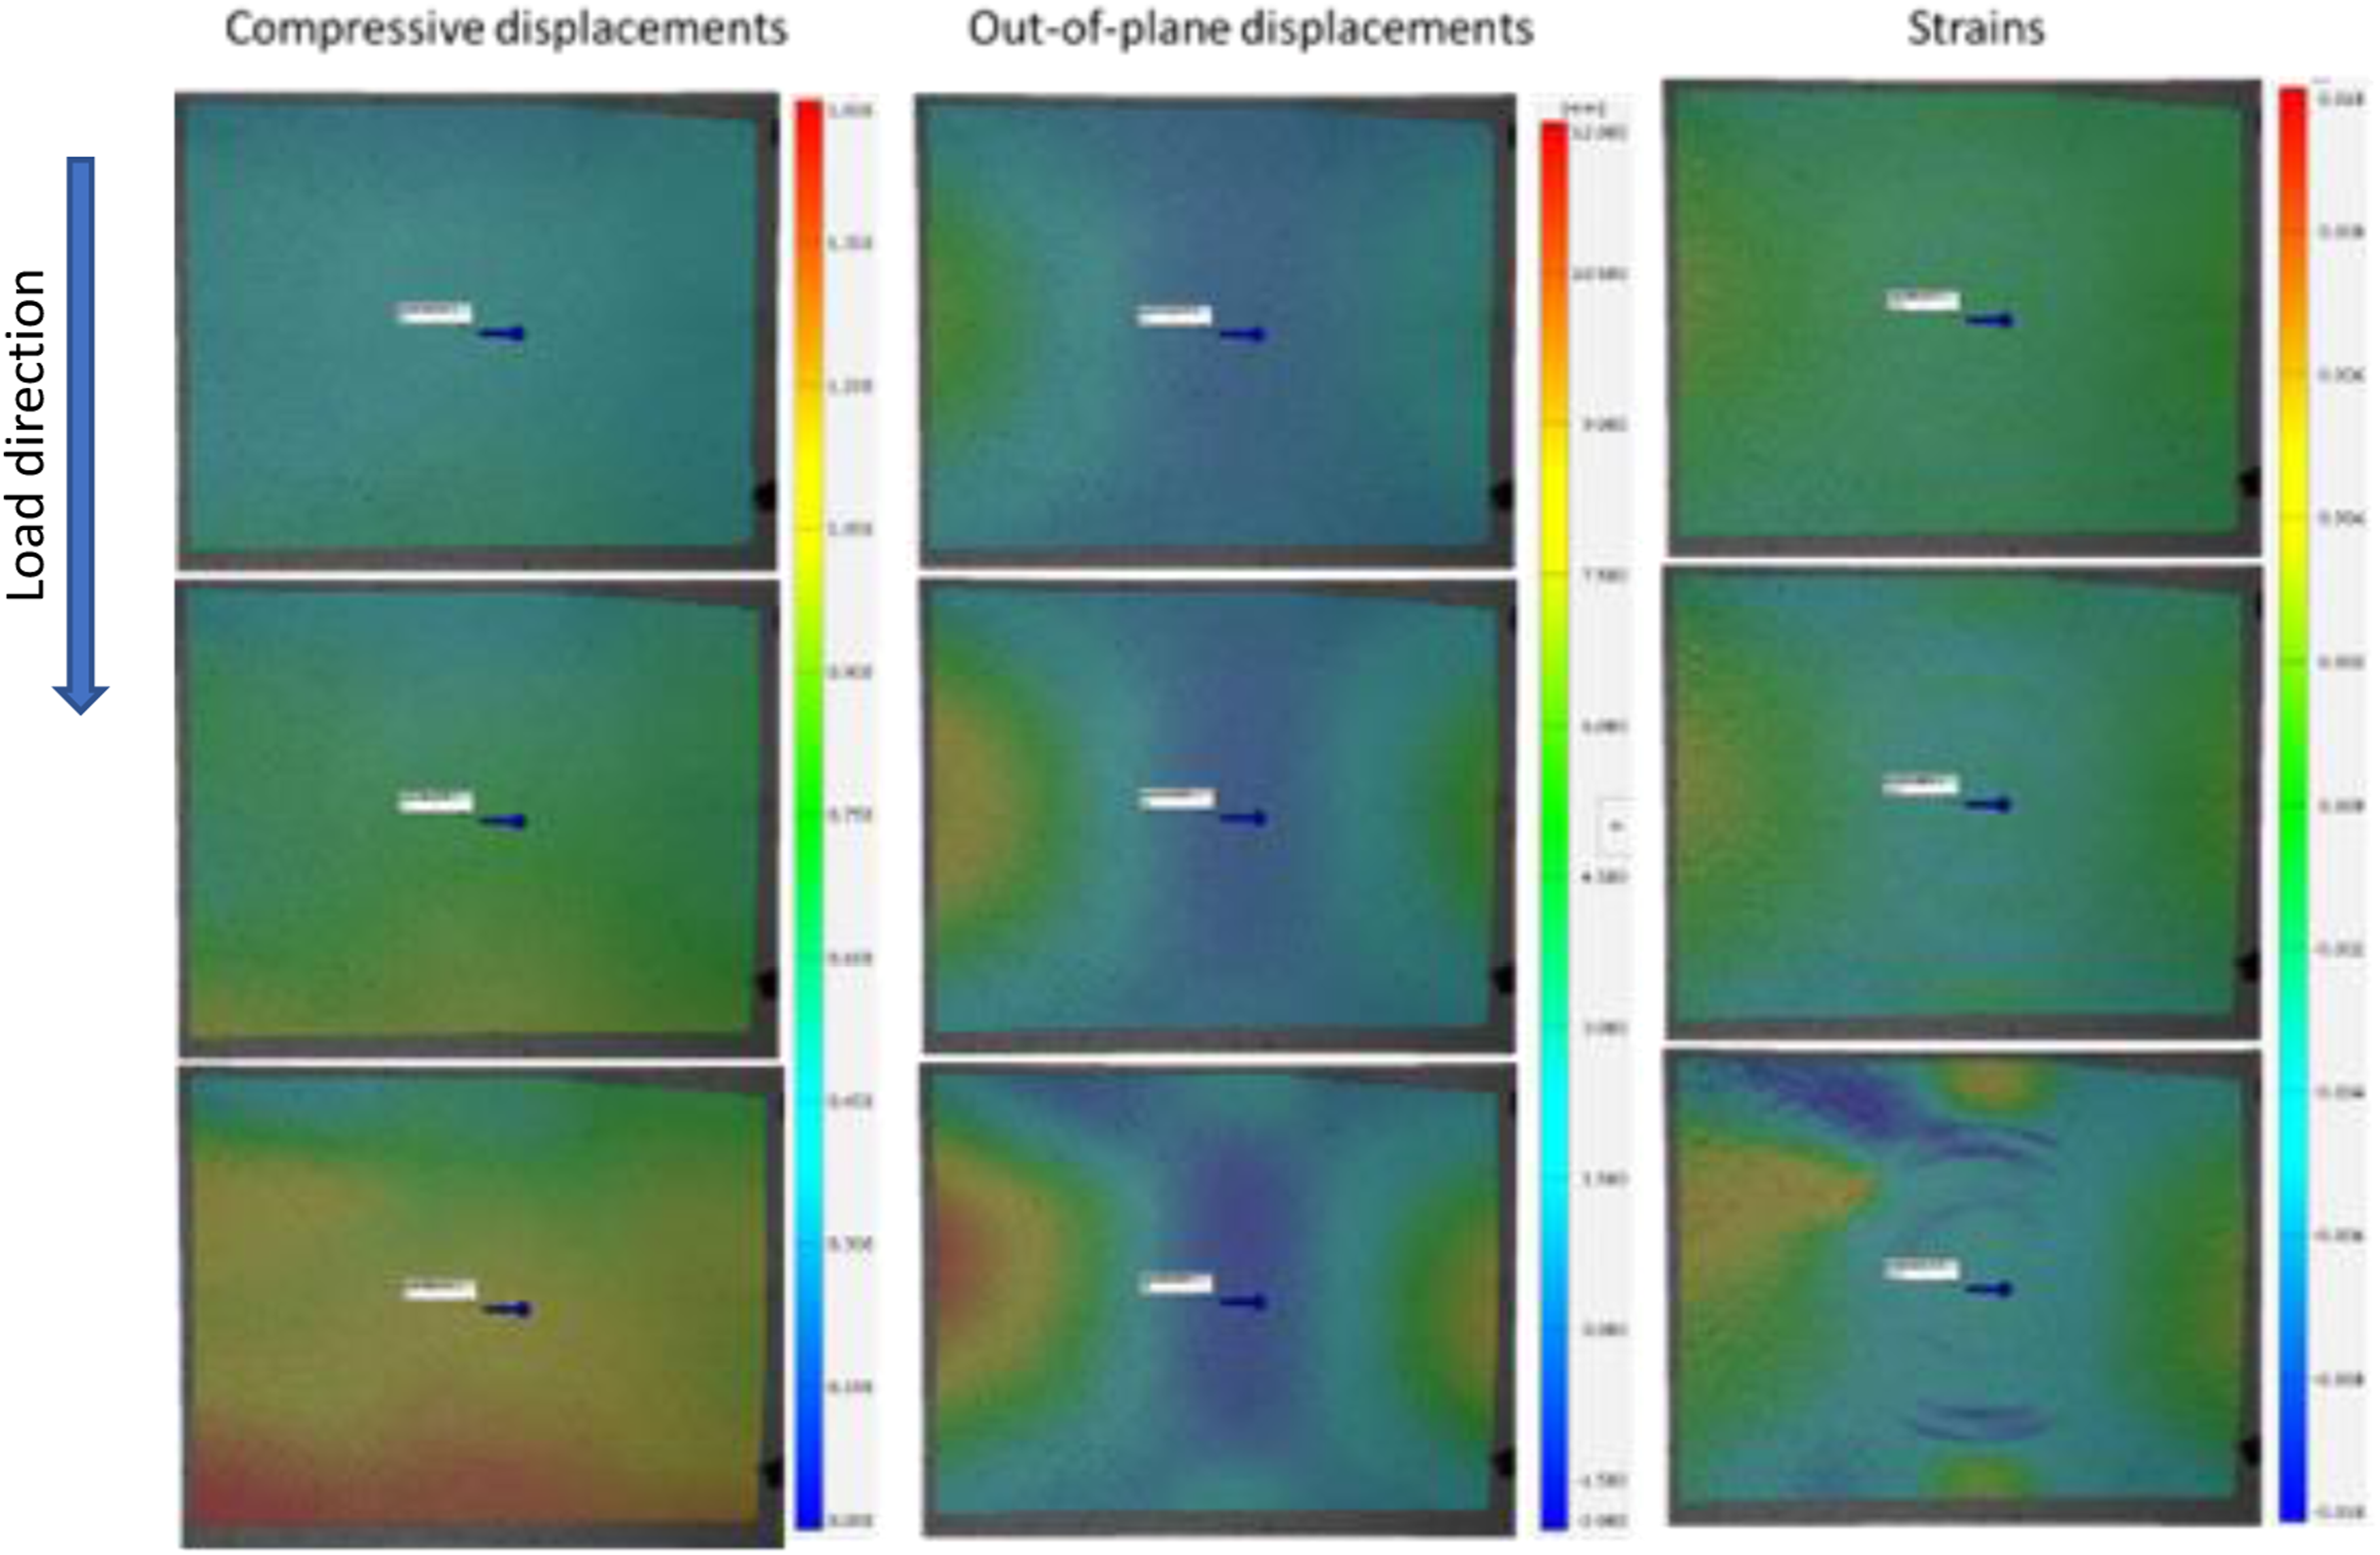
A DolphiCam (by Dolphitec) ultrasound phased array (PA) camera was used to inspect the patch for debonds. As illustrated in Figure 8, it can be observed that debonds have occurred in the patch. More specifically, plies 1, 2 and 4 (counting from the outer step) have separated from the mother plate. It is more easily observable in the time-of-flight (right) image where these plies are orange, while the amplitude image is more subtle and observed through different shades of blue (light blue). Furthermore, a yellow area can be observed in the third ply which most probably implies the creation of a new debond. DolphiCam patch evaluation (prior collapse). amplitude (left), time of flight (right).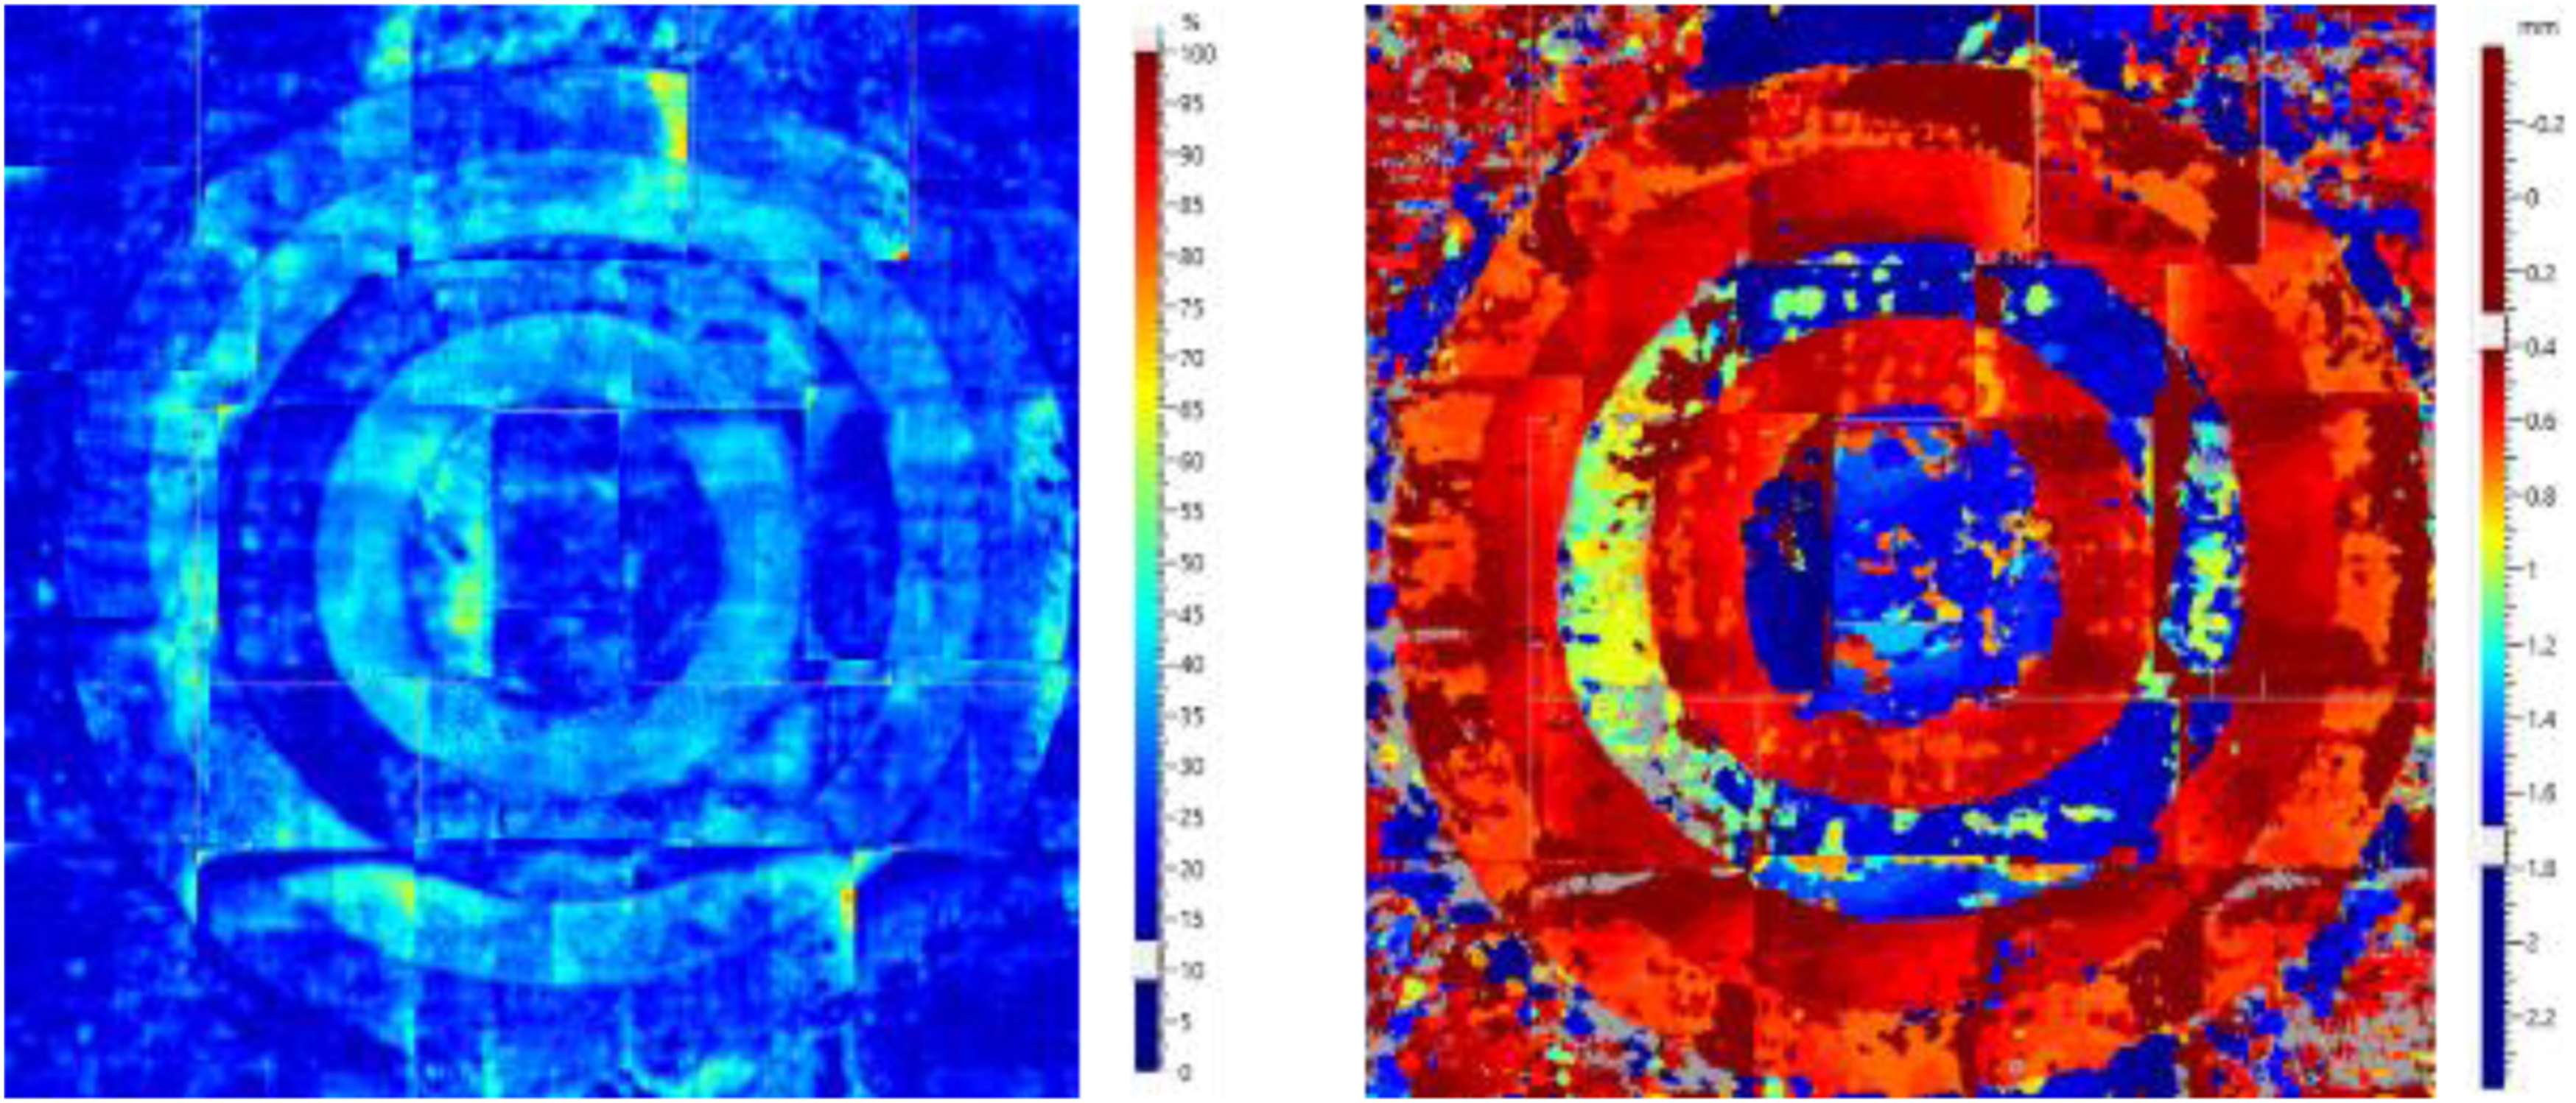
Panel 1 was next in line to be tested. This time an LVDT was mounted to measure the actual displacement. The AE sensors were placed at a 145 mm distance from each other, at the back side of the panel, opposite the LVDT sensor. The compression rate was again 0.5 mm/min. The first audible AE was recorded at 88 kN followed by a second at 89 kN, with a crack appearing at the bottom right side of the panel right above the resin potting. From that point on the AE sensors started recording many hits indicating an imminent failure. The last audible sound was at 95 kN and shortly after the panel collapsed.
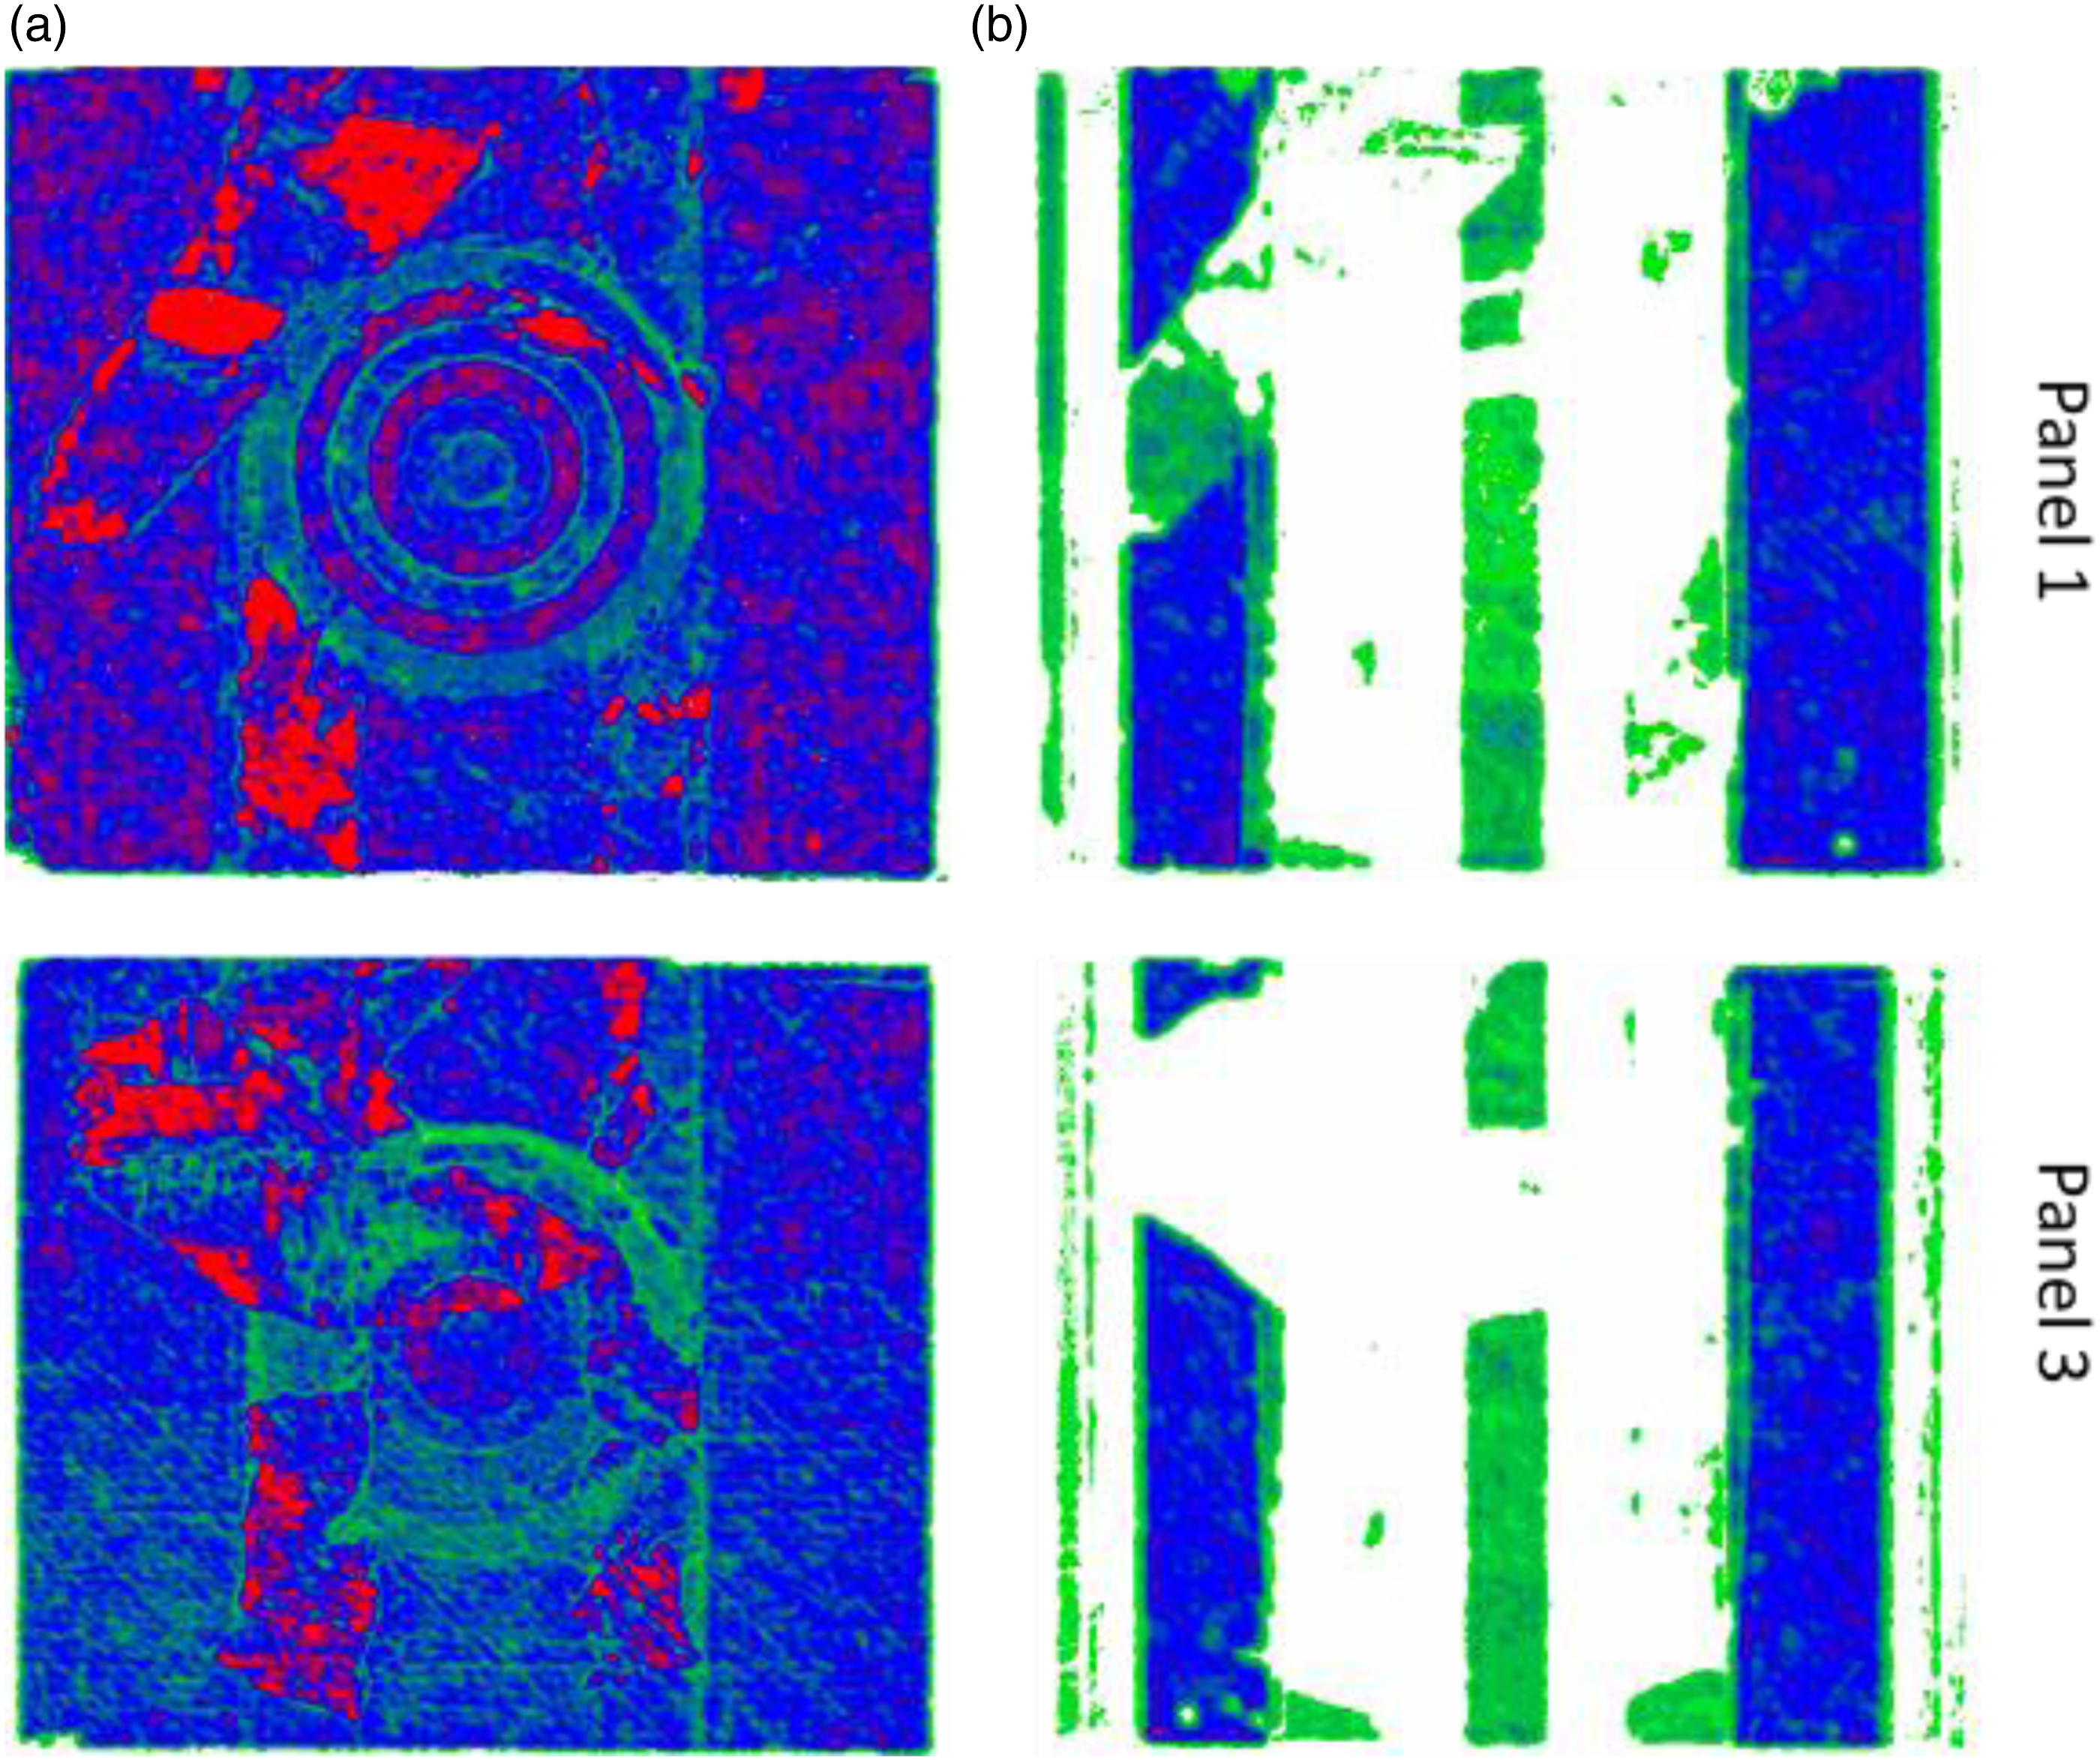
After collapse, the failure modes were observed. The mode of failures is shown in Figure 9. The expected debond of skin/stiffener was evident,21–25 as well as the failure of the stiffener (crippling) at the 45° ply.24,25 Similar failure at the 45° ply, and delamination was observed at the skin as well. The panel failed due to the crash of the stiffener.23,26,27 As mentioned before a crack is present at the bottom of the panel from the free edge spreading for a few millimeters. Some cracks also appear at the area of the patch; however, a closer look is required to see if this is a patch failure or a crack in the color. After the experiments were concluded, the panels were examined using C-scan. Figure 10(a) depicts the pulse echo technique results, while Figure 10(b) depicts a double through transmission result for panels 1 and 3, respectively. In both panels, a large delamination area near the top left corner is easily observable as well as stiffener debonds (red and white color in Figures 10(a) and (b) respectively). Moreover, in panel 1, a debond can be seen in the patch’s second and third step (red color). These images confirm the damage observed by the visual inspection of the collapsed panels. Other than that, the only extra information acquired is the patch debond in panel 1. panel 1 collapse failures. C-scan images for panel 1 and 3. (a) is pulse echo and (b) is double through.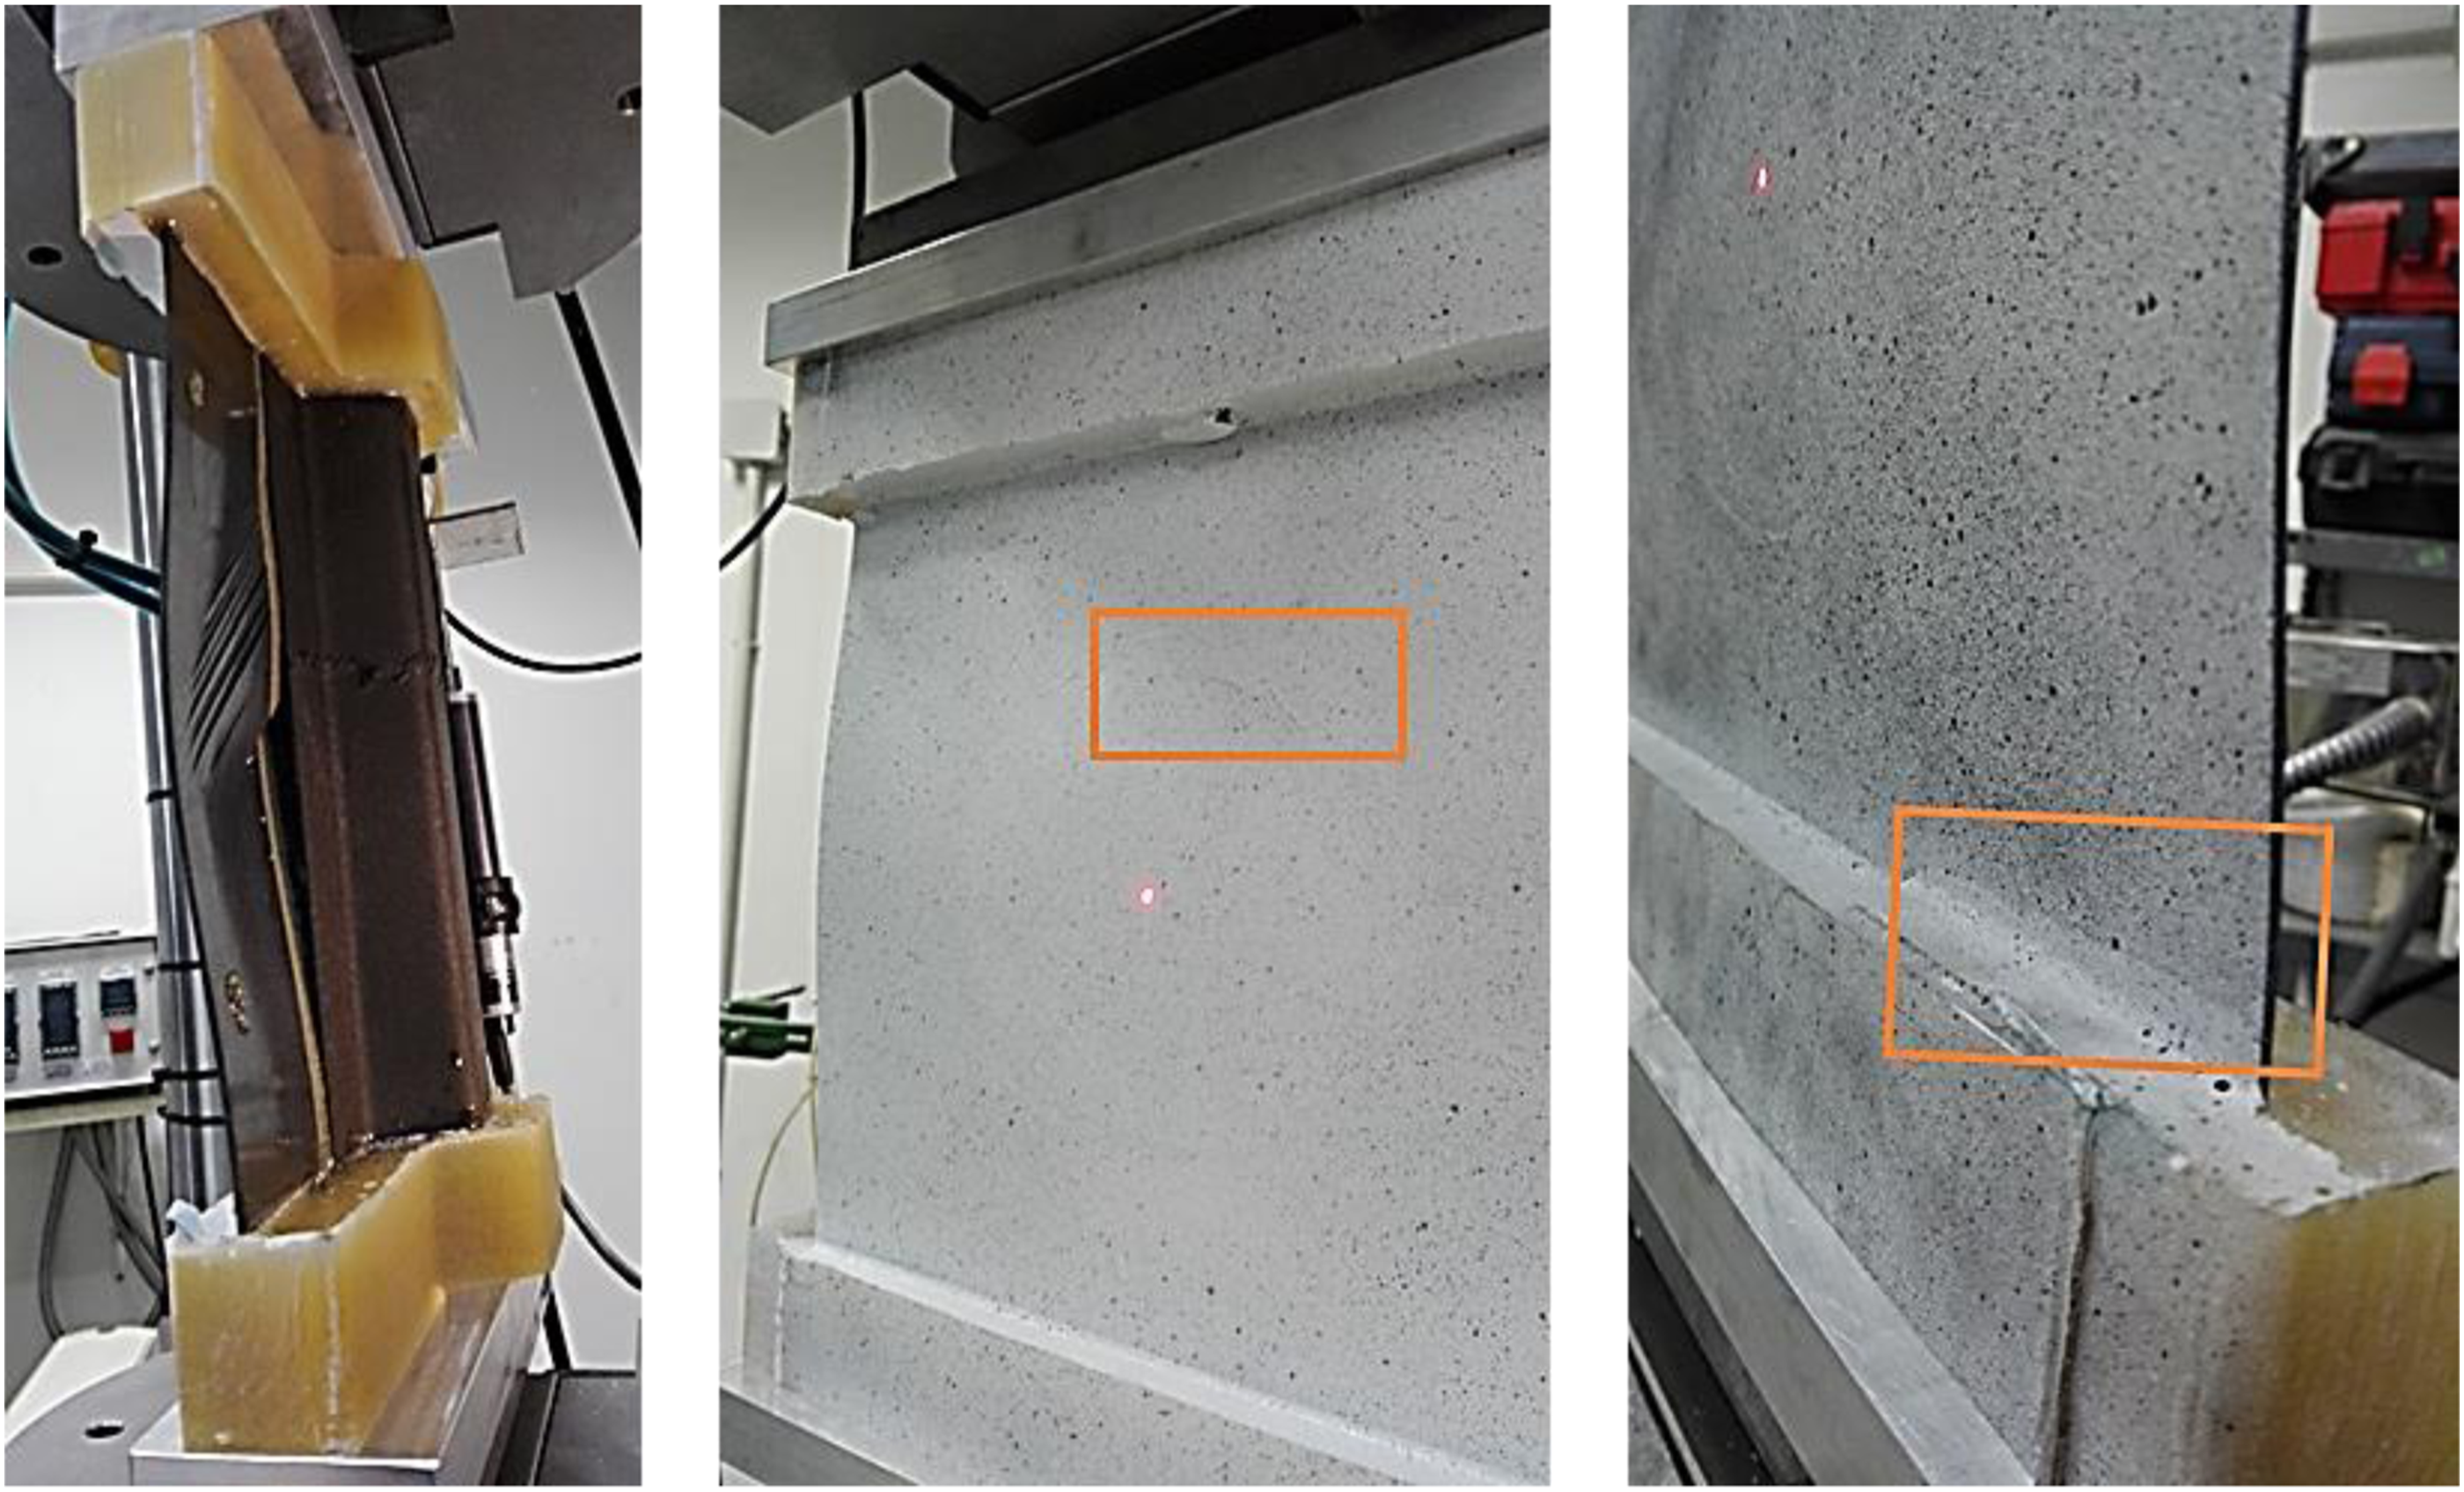
Panel 3 was the last test article to be tested. Same preparation as panel 1 was followed as well as the same test parameters and sensors. The AE sensor distance was ∼150 mm. No audible sounds were heard until the load reached 94 kN where the crack at the bottom of the panel was observed. A second audible sound was heard at 95 kN, followed by the harsh collapse sound a few moments later. The panel failed due to the collapse of the stiffener. This time the stiffener was crushed full width, followed by debond between skin/stiffener. No cracks were observed at the patch area, yet further examination is required.
The collected load-displacement curves are presented in Figure 11. The compliance factor as extracted from the LVDT and compared with the machine’s displacement readings was 0.64. We can observe that all three panels have an almost similar behavior in the linear region and the curves are pretty close. The curves separate at around 0.5 mm. The collapse load is also close for all three panels at around 97 kN. The most obvious difference is shortly before collapse. It is observed that panel 1 suffers from a load drop at 90 kN and then continues to collapse. A similar behavior is observed at panel 2 with the load drop occurring at around 96 kN. Panel 3 has no significant load drop area. Load-peak frequency-displacement diagram.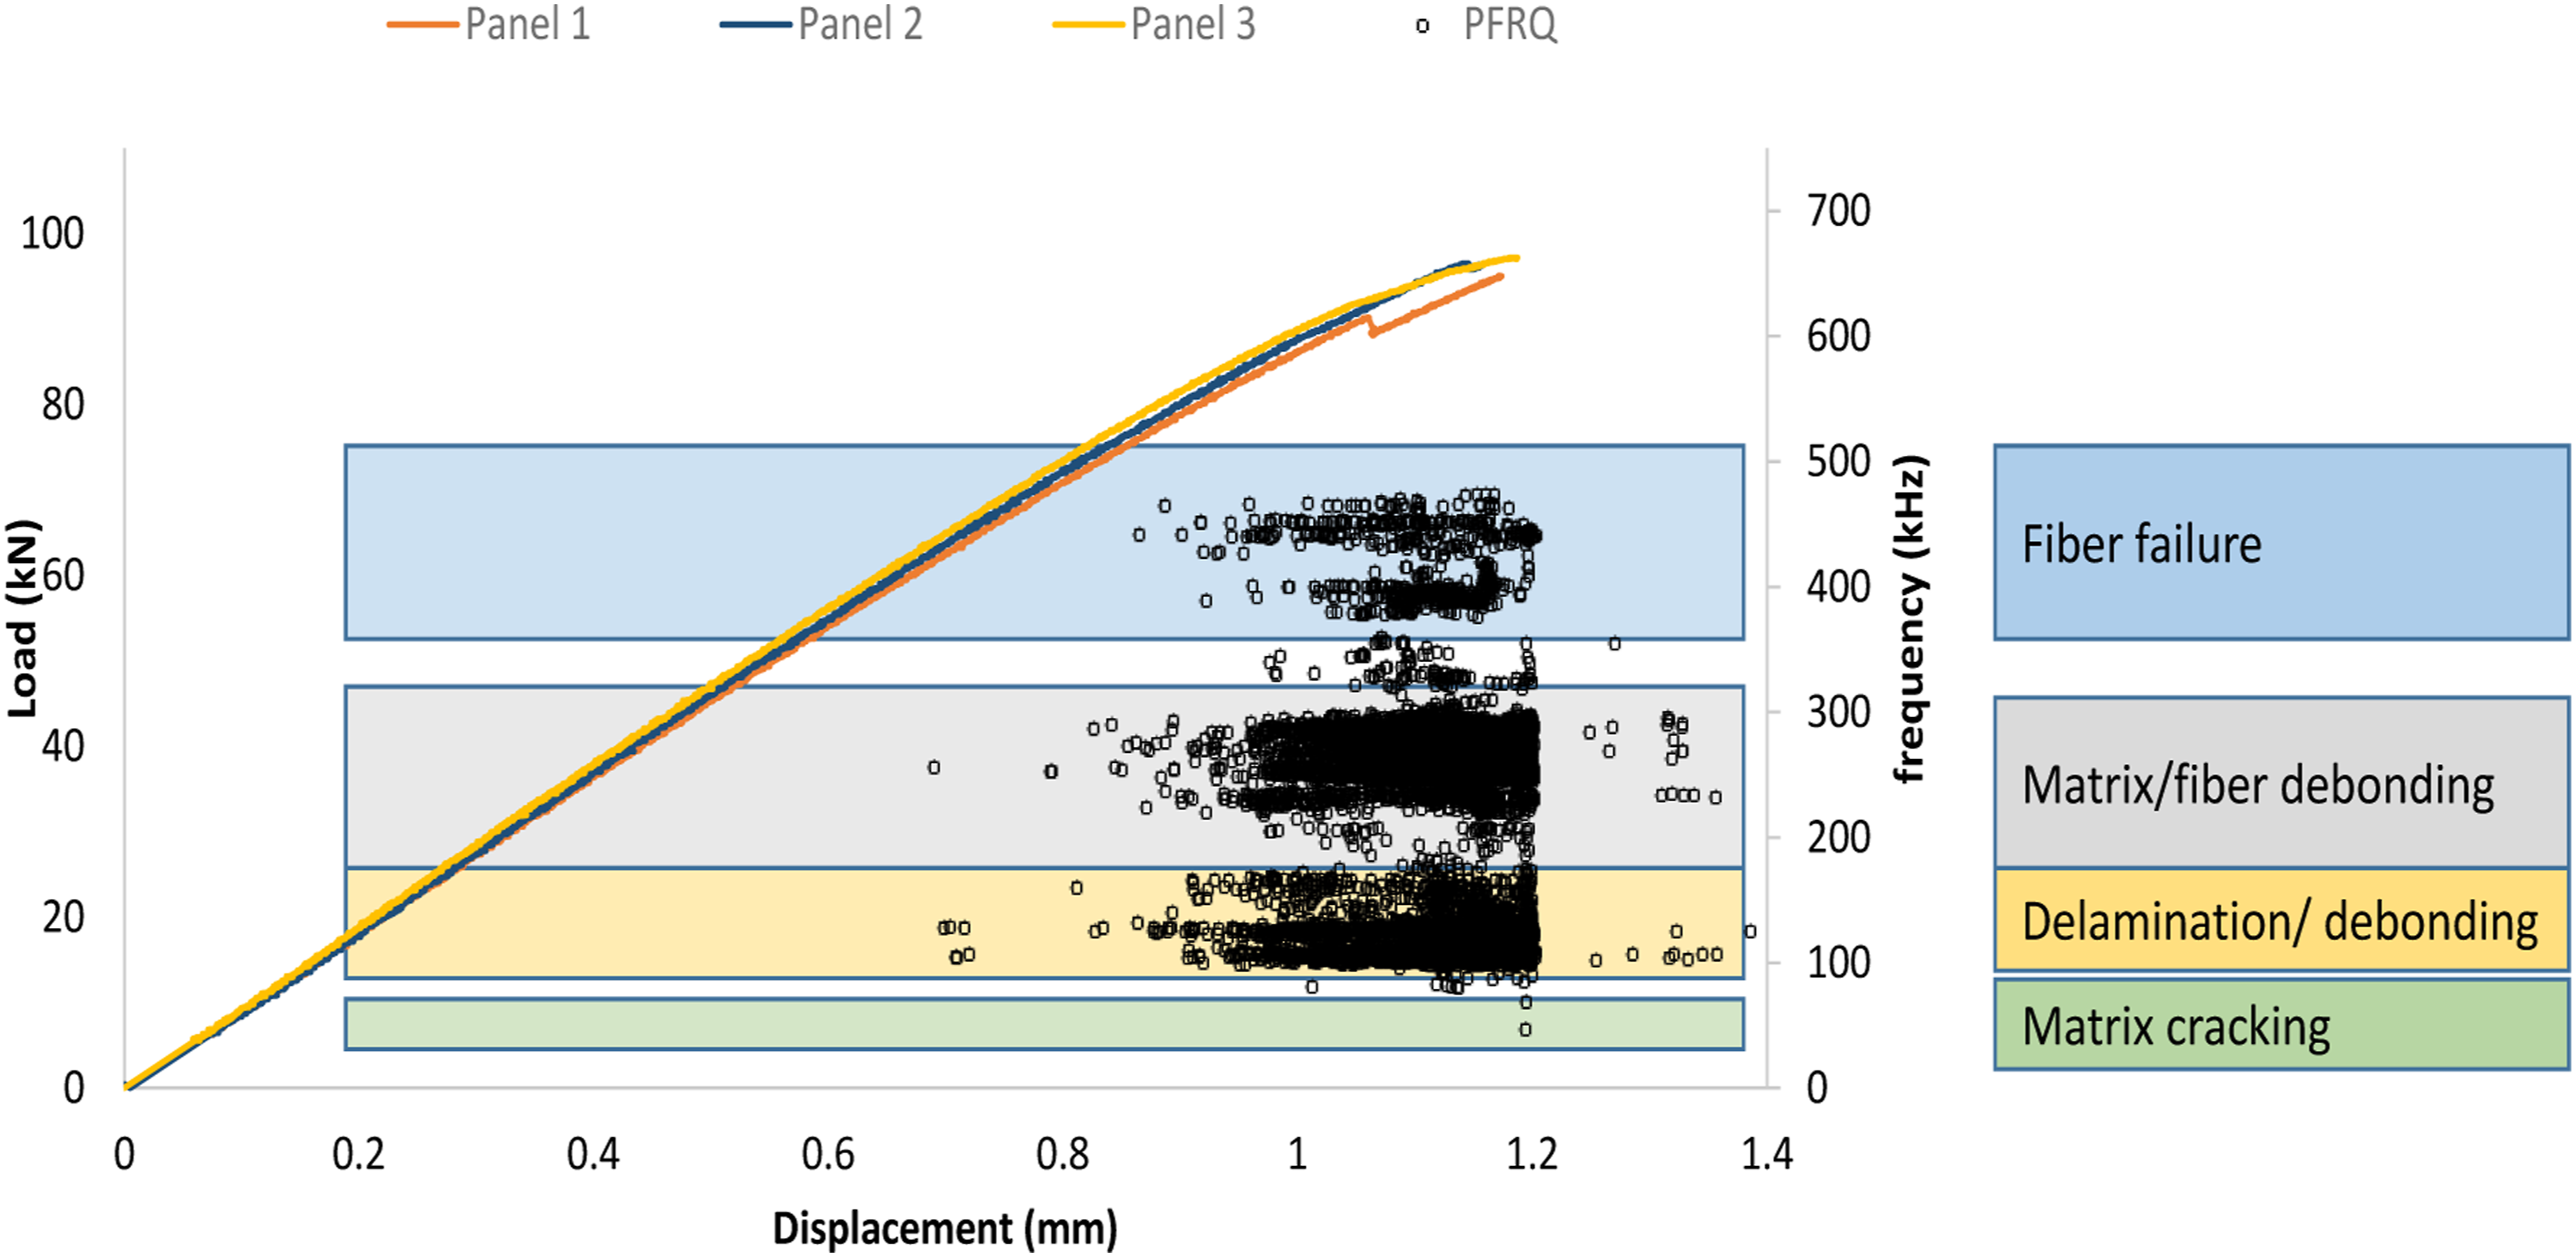
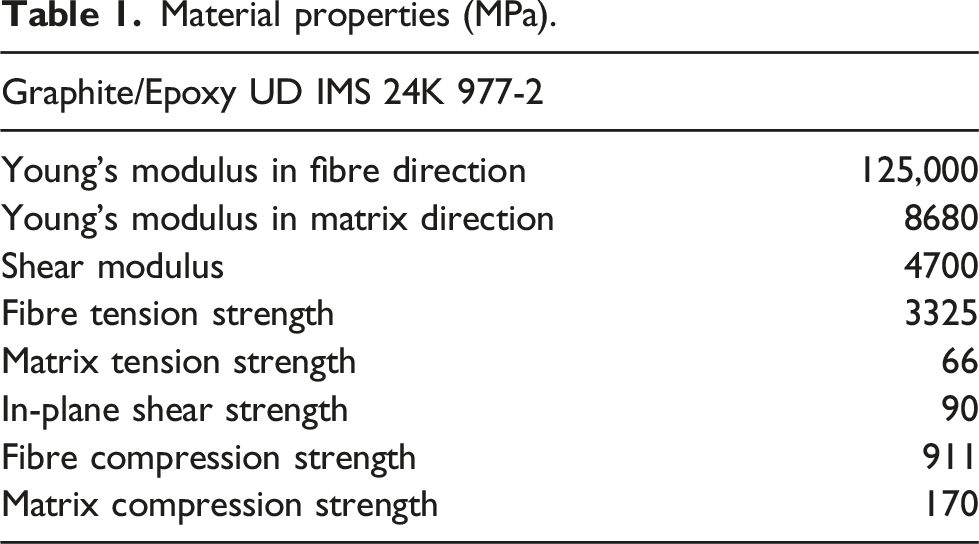
As mentioned earlier, during the compression tests, the panels were mounted with two AE sensors. Data from the panel 3 test are shown. Two sensors were mounted on the panel, one at the bottom and one at the top of the panel, corresponding to channel 1 and 2 recording, respectively. A total of 76,000 hits were recorded on both channels. However, knowing that the nature of the AE hits must be of burst type, all channel 1 data were considered noise, since the signal was rather continuous. This may be a result of the sensor being closer to the moving grip of the machine and recording the load transferring from the machine to the panel and not the damage initiation. That is why only data of channel 2 were kept. More filtering took place, since for hits lower than 44 db amplitude had the same continuous behavior as the channel 1 data. Psarras et al. and Gutkin et al.,28,29 studied the correlation between peak frequency and failure modes on prepreg composite material IM7/8552, mechanical properties of IM7 and IMS 977-2 are close, and their results were used to classify the failure modes occurred during compression to peak frequency. For more accurate classification though, data specifically for IMS 977-2 are required.
From the peak frequency-displacement diagram four regions are observed with high concentration of AE hits. The lower frequency hits correlate to matrix cracking followed by delamination and adhesive debonding. The higher frequency hits correlate to fiber/matrix debonding and fiber cracking. The AE study verifies (to an extent) the failure modes observed by visual inspection.
Figure 11 presents the peak frequency alongside the load-displacement curves. This provides with information of when each type of failure occurred. Failure initiated at around 0.9 mm displacement, correlating to approximately 70 kN load.
Finite Element models of single stiffened panels with repair
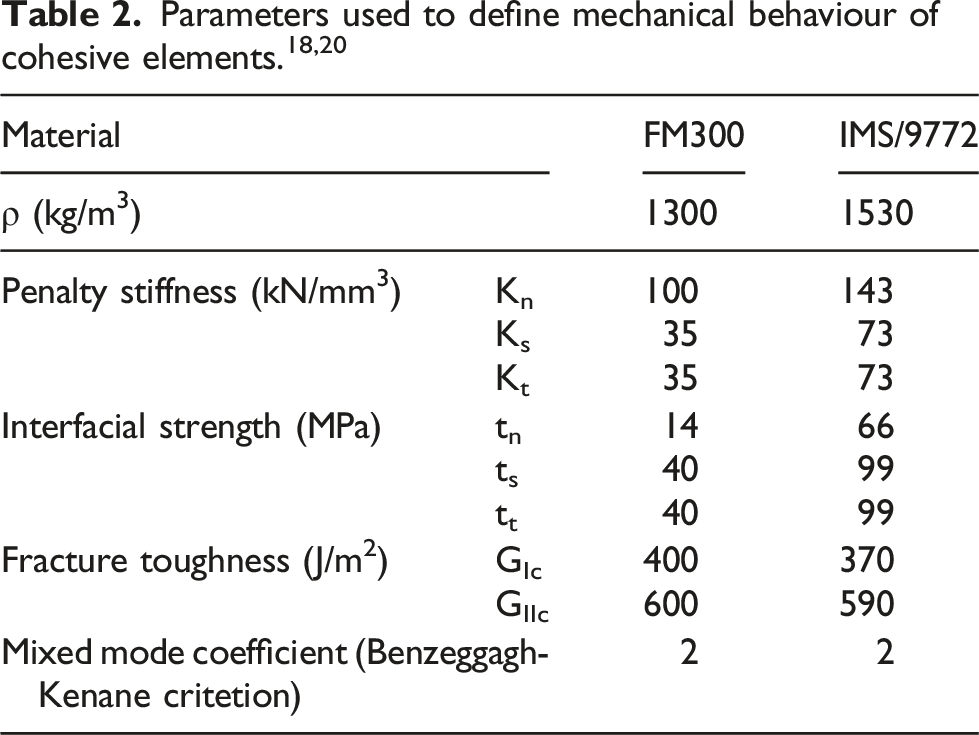
Material properties (MPa).
The two sides of the stiffened panel FE model. Different parts are illustrated with different colours.
Surfaces of stiffener and patch were tied to the surface of the skin. The end regions of the panel, which were inserted in the resin, were tied to the skin and stiffener. Contact was defined between all surfaces.
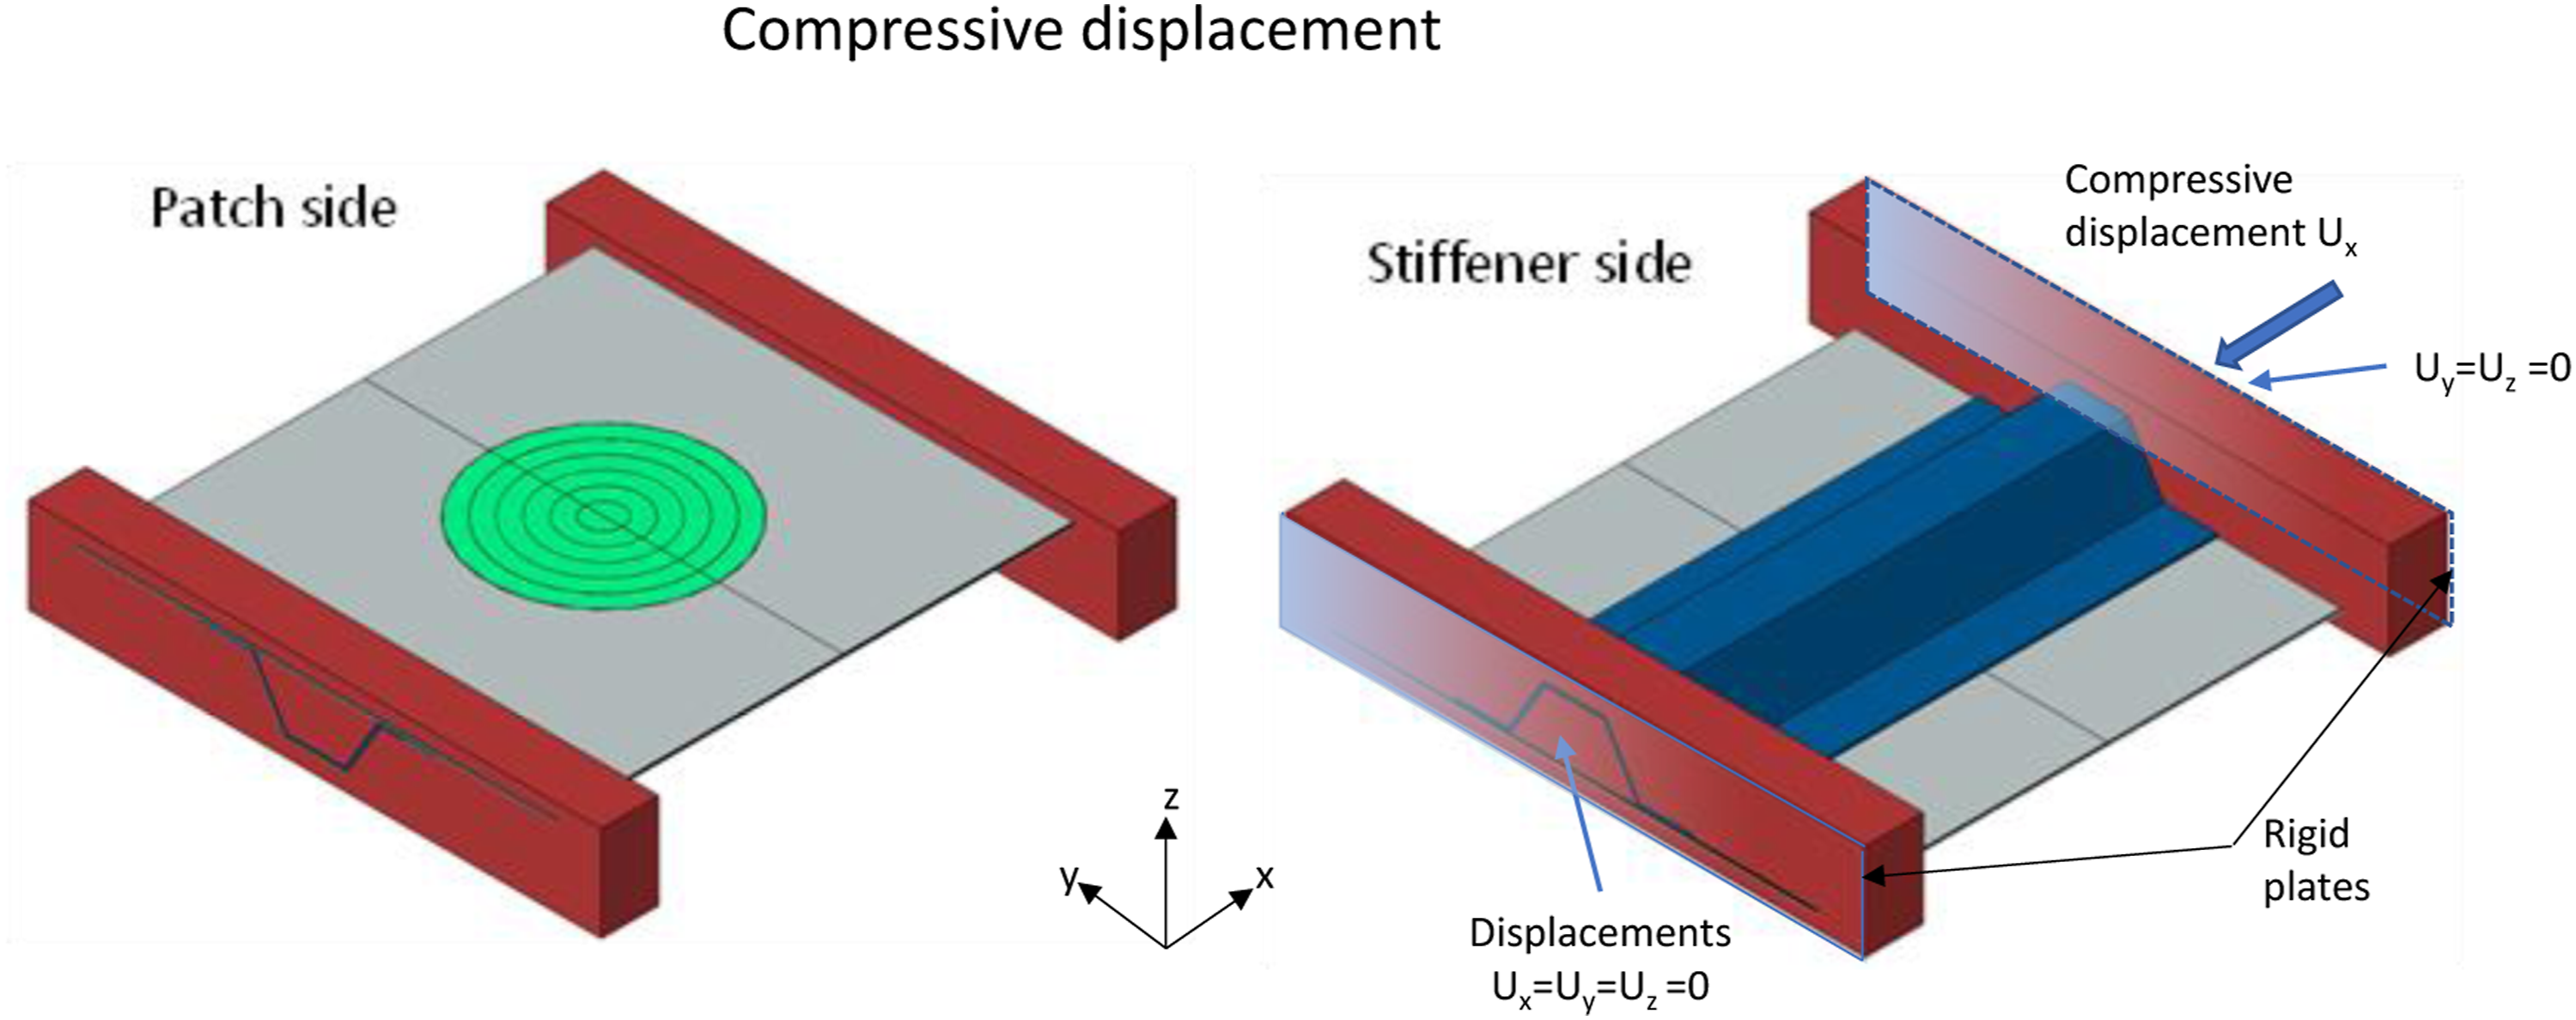
For the compression tests, the ends of the panel were potted in resin, as in Figure 3, and the channel encasing the resin loaded by the steel block platens of the test machine. All degrees of freedom of the ends were therefore consisted to the constraints of the panel except displacement in longitudinal direction. To replicate this boundary condition, rigid shell plates sized as the resin pot bottoms were tied to the potting and their RPs were constrained so that they can only move in longitudinal direction, as in Figure 12. The panel was loaded by defining a ramp displacement in longitudinal direction.
The numerical problem was solved using explicit solver, available in ABAQUS, as nonlinear geometric effects were considered. The explicit solver takes into account these terms. However, the structure should be loaded very slowly so that the influence of these terms becomes negligible before buckling (the explicit solver is also suitable when initiation and growth of interlaminar and translaminar damages need to be modelled). The first predictions of the failure load were made and were compared with the test results as can be seen in Figure 13. From the FE curve the buckling starts at the load level of 50kN and the waviness of the curve is the result of the change in buckling shapes. It seems that the FE models are slightly stiffer than the tested panels, but this has to do with the actual thicknesses of the tested panels against the perfection of the FE models. Load-displacement curves of repaired stiffened panels; tested panels and FE model predictions.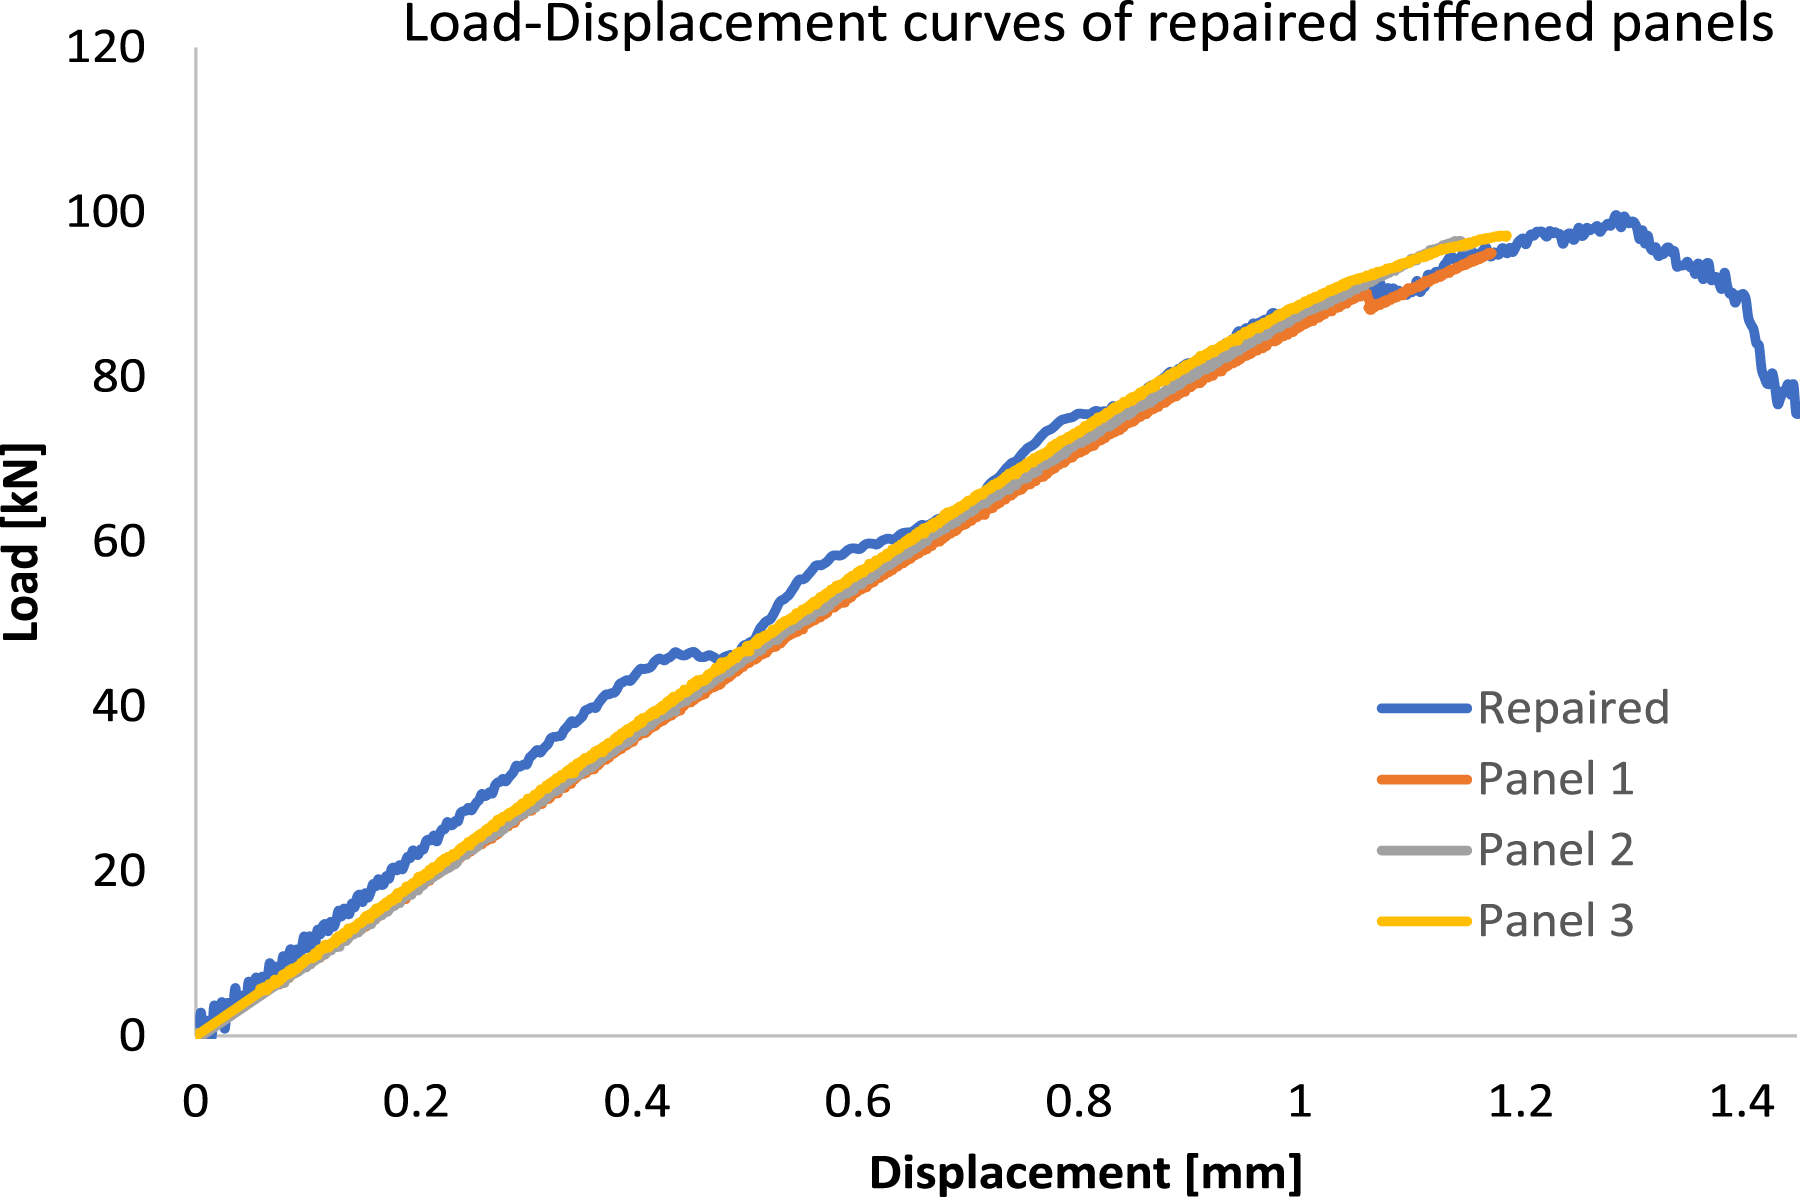
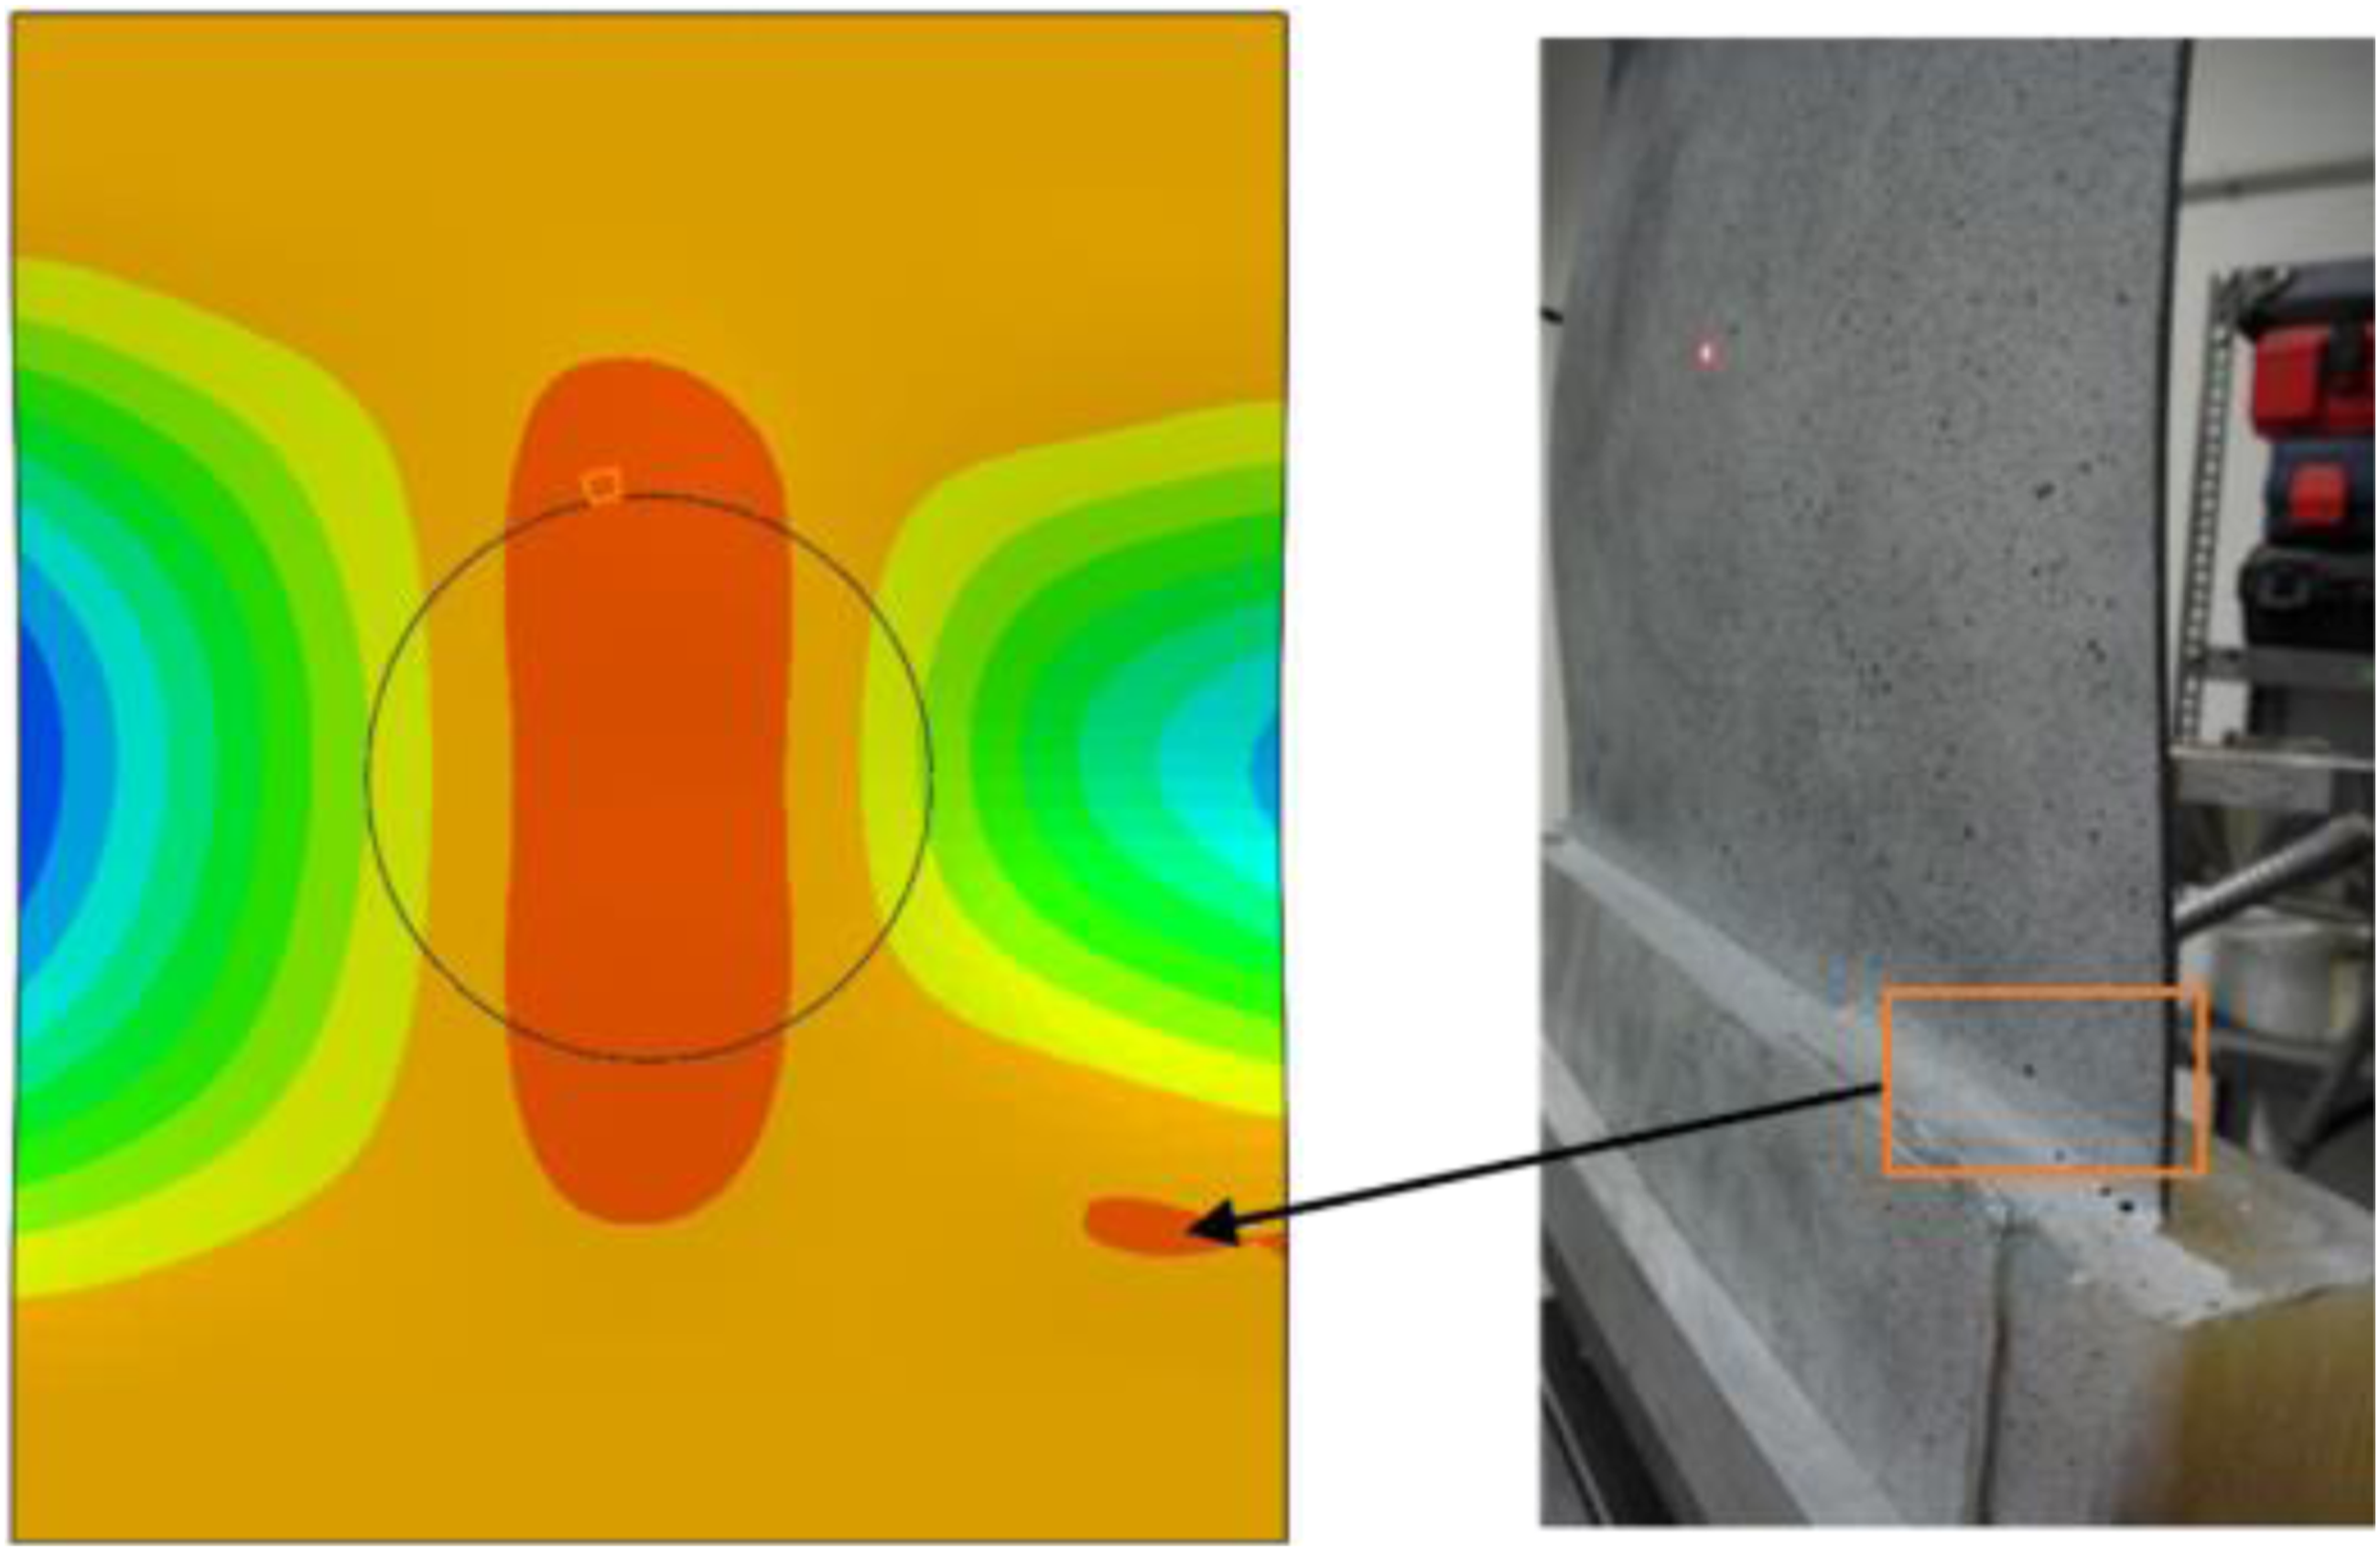
Figure 14 presents the displacement and strain fields for three different load levels: 50kN, 80kN and 100kN. It seems from the compressive displacements that the load was transferred uniformly to the panel, while there is a small mismatch to the free edges. Moving to the out-of-plane displacements it is clear that there is buckling to the free edges. Because of the presence of the stiffener the buckling deformation is not affecting the patch as it only reaches the patch edges. Also, the failure of the patch starts from the outer end where a peak of the strains is observed. These predictions are comparable with the DIC results in Figure 6 in all cases. What cannot be seen from the DIC results, because of the limitation of the view field, but is predicted by the FE model is the damage on the bottom right of the failed panels, Figure 15, that seems to be caused from a local buckling. FE predictions for three load levels; 50kN, 80kN and ∼100kN (top to bottom). The corner failure that the model predicts.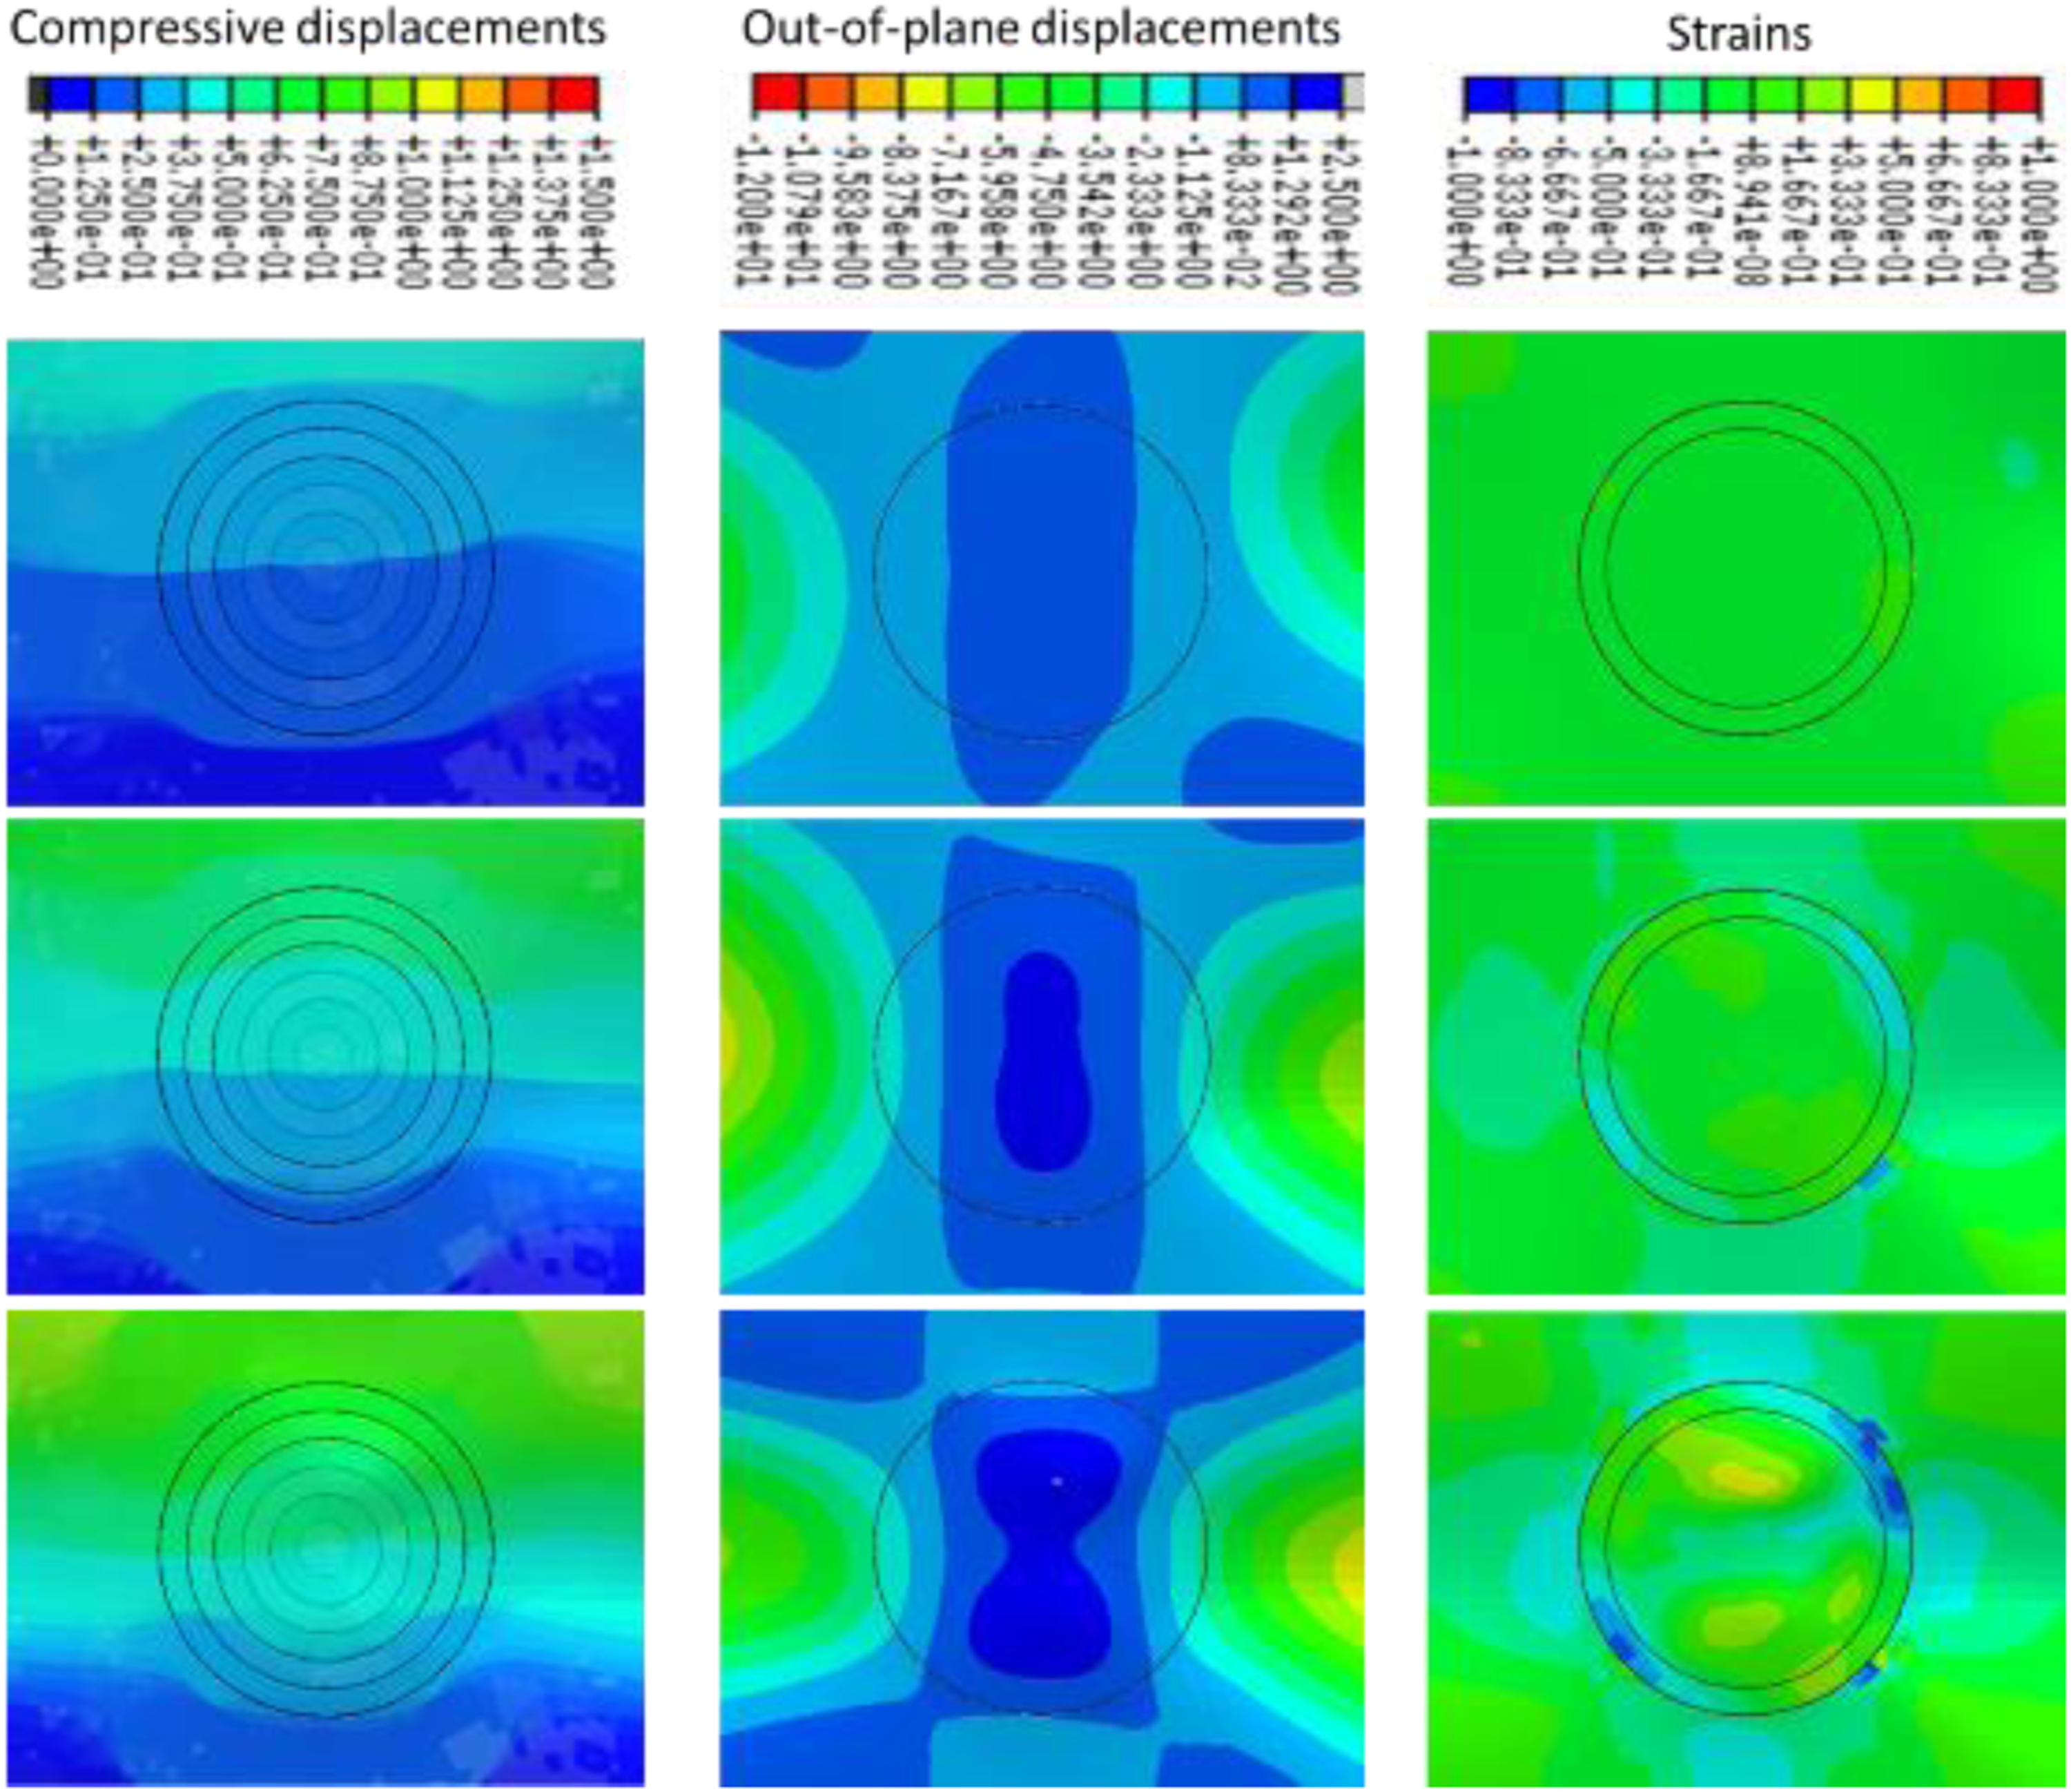
An indication of the debond grade of the patch before failure was seen also in Figure 8. These results of the tested panel can be compared with the results of the FE analysis and are presented in Figure 16. The model predicts that the debond of the patch will start from the outer step and as the panel is compressed is moving to the inner section. But this is not happening step by step as the second step seems to be bonded while in the actual test the third step remains bonded. The trend seems to be the same and if considering the possible manufacturing imperfections and the overall complexity and random nature of damage accumulation then the predictions of the FE model are in a very good level. Damage propagation of the patch bonding through the analysis of the FE model.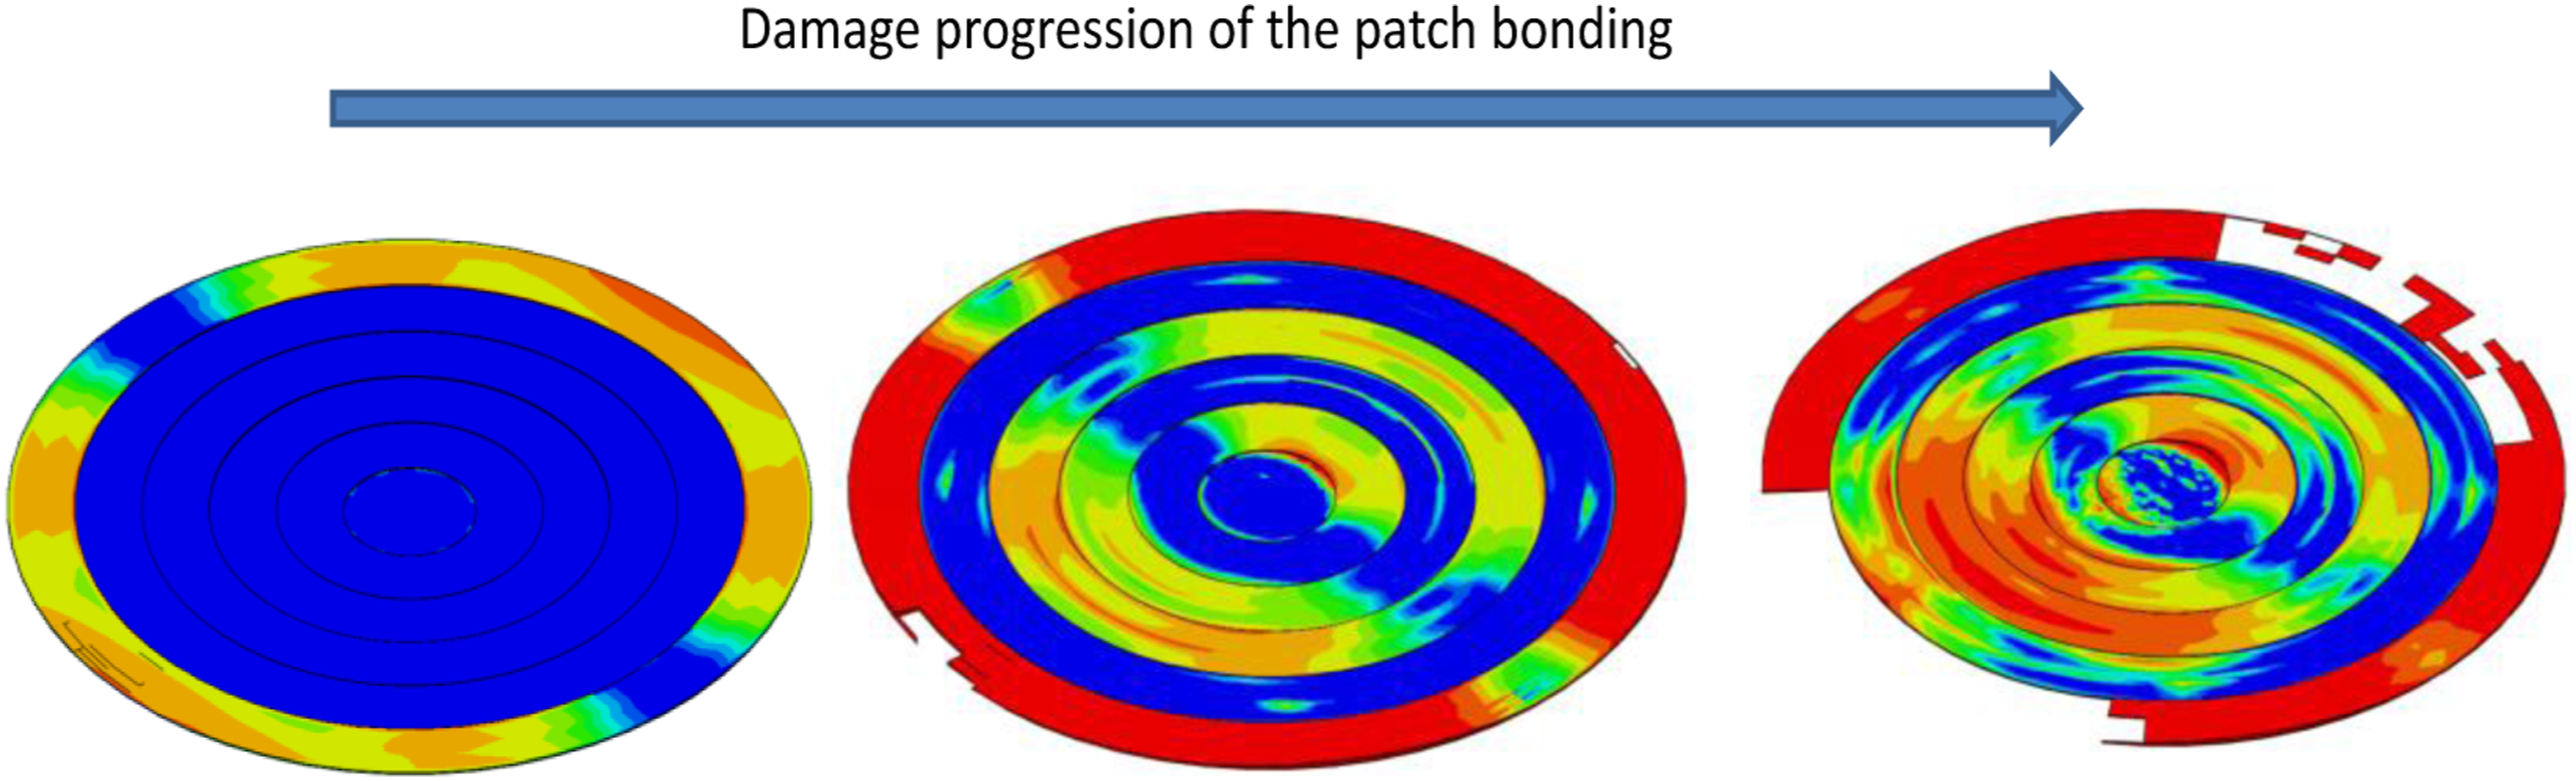
Conclusions
In this work the effectiveness of stepped repair to damaged fibre reinforced composite materials was investigated by using extensive testing accompanied by validated FE numerical modelling.
In the experimental part the effect of scarf bonded repair on CFRP materials on compressive strength was studied. The basic steps required to implement a scarf bonded repair on a damaged component were described. The high quality of the scarfed area was the result of the laser equipped manipulator. During the compression tests, DIC and AE sensors were placed to monitor the failure mechanisms progression. In all cases the panels were failed in the same way, the panels were failed after structural damage and not after patch failure. This failure started by all types of failure as the AE results indicate when the panels were carrying 70% of the critical load. Also, the patch failure initiation-propagation were captured and reviled that the patch didn’t fail but only some of the steps were debonded.
These tests were the benchmarks for the FE models and the capabilities of the FE models were evaluated. Attention was given at the actual failure modes of composites including delamination. The FE models were capable to predict the failure load of the panel in compression as well as the way it failed. Also, the comparison of the AE data and the PA images with the FE models gave a clear insight of the loads and the way the patch debonds during compression. Also, attention should be given to the capability of the model to predict local failures, as the panel edge failure, and the way that the patch behaved during loading in every scarf step. Clearly these models can be used for further repair studies.
Footnotes
Declaration of conflicting interests
The author(s) declared no potential conflicts of interest with respect to the research, authorship, and/or publication of this article.
Funding
The author(s) disclosed receipt of the following financial support for the research, authorship, and/or publication of this article: The authors wish to acknowledge the contribution from the European Union’s H2020 Framework Programme, call FET-OPEN under grant agreement No 665238 CompInnova.