
Abstract
Honeycomb core sandwich may suffer from face/core debonding. Candidate debond fracture test specimens such as End-Notch Flexure (ENF) and Mixed Mode Bending (MMB) contain unbonded regions of the sandwich where the core is required to carry in-plane com-pressive load. In-plane modulus and compressive strength of honeycomb core are not pro-vided by core producers and must be estimated from unit cell models assuming perfect hexagonal cells. In this study it is shown that geometrical imperfections, such as deviations in the angle between cell walls and curved cell walls have a strong influence on modulus and strength because of deviations from transverse isotropy. A range of Nomex honeycomb cores were tested under in-plane compression. Modulus and strength ratios (L/W) were found to vary from 0.3 to 3.24 and 0.96 to 1.8, respectively. Analysis based on unit cell models verified that deviations of the inclined cell wall angle, θ, from 30 ◦ is a major cause for orthotropy. Rounded corners and curved walls were analyzed using finite element analysis. Both principal elastic moduli of the core (E L and E W ) were reduced by the curvature while the Poisson’s ratios remained largely unaffected. Implications of the results for design of MMB and ENF fracture test specimens are discussed.
Introduction
Sandwich structures provide several structural benefits over monolithic alloys such as high stiffness and strength at very low weight. The selection of core material is guided by its ability to keep the face sheets separated under a host of loading situations, without adding much weight to the structure. Core materials are typically foam and cellular. Cellular cores such as Nomex honeycomb have cell walls normal to the plane of the panel. The cells are hexagonal in shape and are made from chopped Kevlar fibers impregnated by phenolic resin. Such cores perform very favorably because of their high out-of-plane compressive and shear stiffnesses.
The most important function of the core in a sandwich structure is to support out-of- plane tensile, compressive and shear forces. A very important damage mode of aerospace honeycomb core sandwich structures is face/core debonding which will cause substantial loss of stiffness, stability and strength of the structure.1,2 For this purpose, several face/core debonding test methods have been proposed
3
among them the Mixed Mode Bending (MMB) and End-Notched Flexure (ENF) tests shown in Figure 1. ENF and MMB sandwich debonding tests. (a) MMB test, loading configuration. (b) ENF test, loading configuration. (c) ENF Free-body diagram of the debonded region.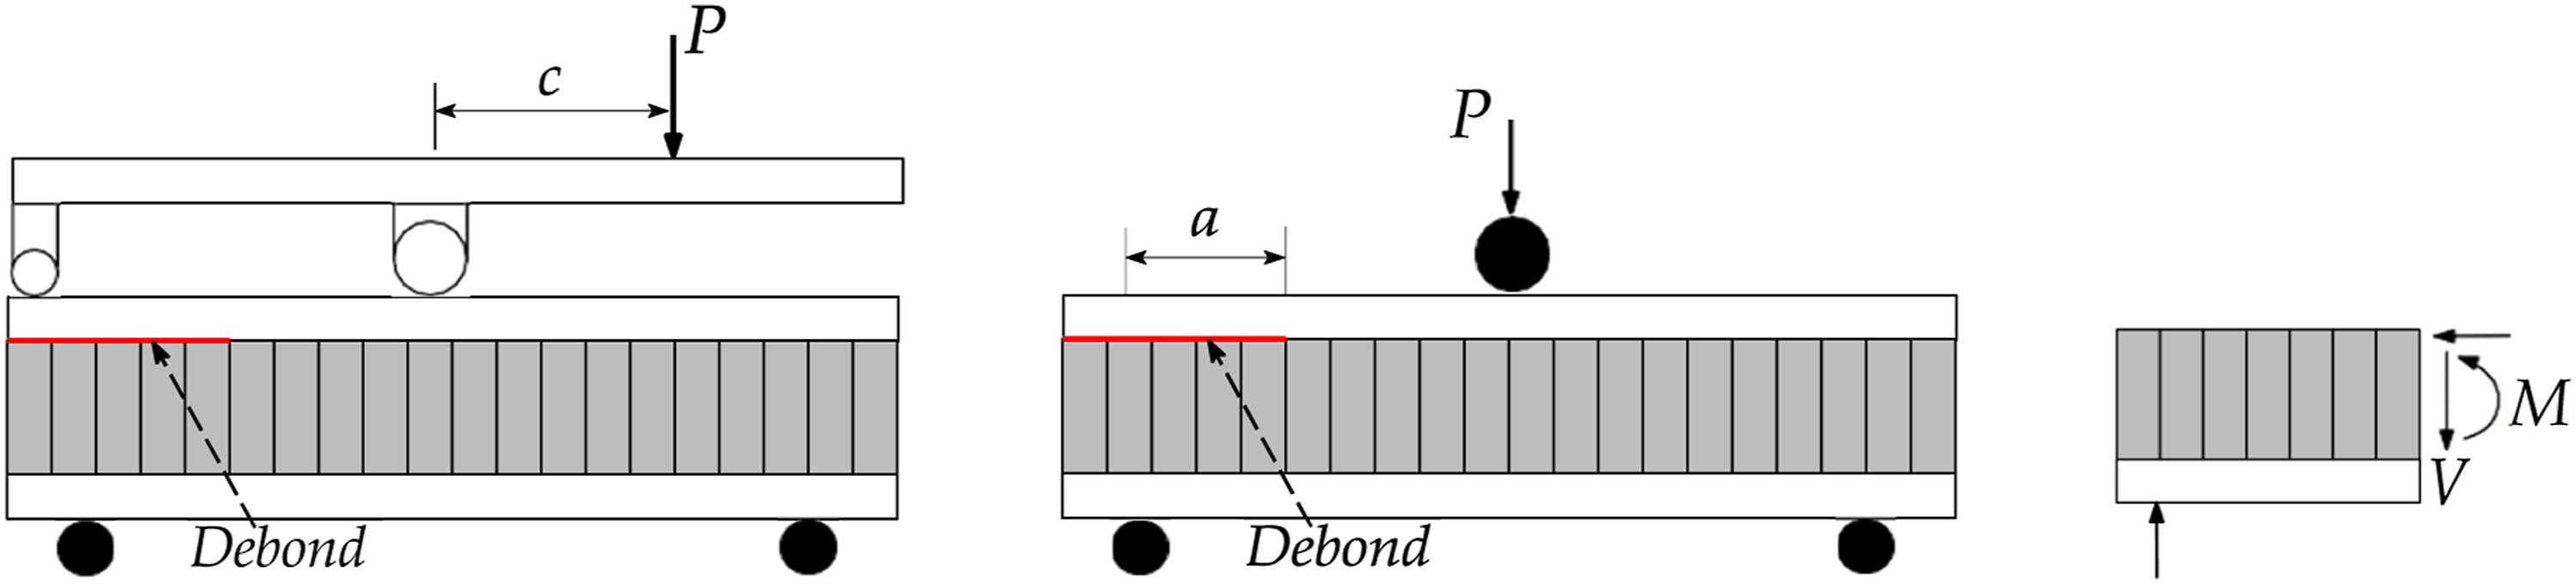
Figure 1 shows schematic illustrations of the MMB and ENF sandwich fracture tests. The MMB test was originally proposed by Reeder and Crews 4 as a mixed mode delamination fracture test of unidirectional composites and has been extended to sandwich specimens.5–7 Mixed-mode loading refers to situations where a combination of a tension and shear is applied simultaneously. In this test, a vertical load, P, is applied to a horizontal loading lever supported at the left cracked end and at the mid-span of the specimen, see Figure 1(a). The applied load, P, will cause an upward force (P I ) at the left support, and a downward force (P II ) at the center contact point of the lever. By varying the distance, c, it is possible to change the ratio of mode II to mode I crack tip loading at the crack front. The ENF specimen, Figure 1(b), has the same geometry as the MMB specimen and was originally proposed for pure mode II testing of unidirectional composites by Russell and Street. 8 It was later configured to a mode II sandwich debond test.9,10
It is noted that the unsupported upper region of the core behind the crack tip in these specimens is loaded in in-plane compression, Figure 1(c). In both of these tests applied to honeycomb core sandwich6,11 failure of the unsupported core near the crack tip have been observed, see Figure 2. Such a failure will invalidate the fracture test. Compression failure of honeycomb core in an ENF sandwich fracture test.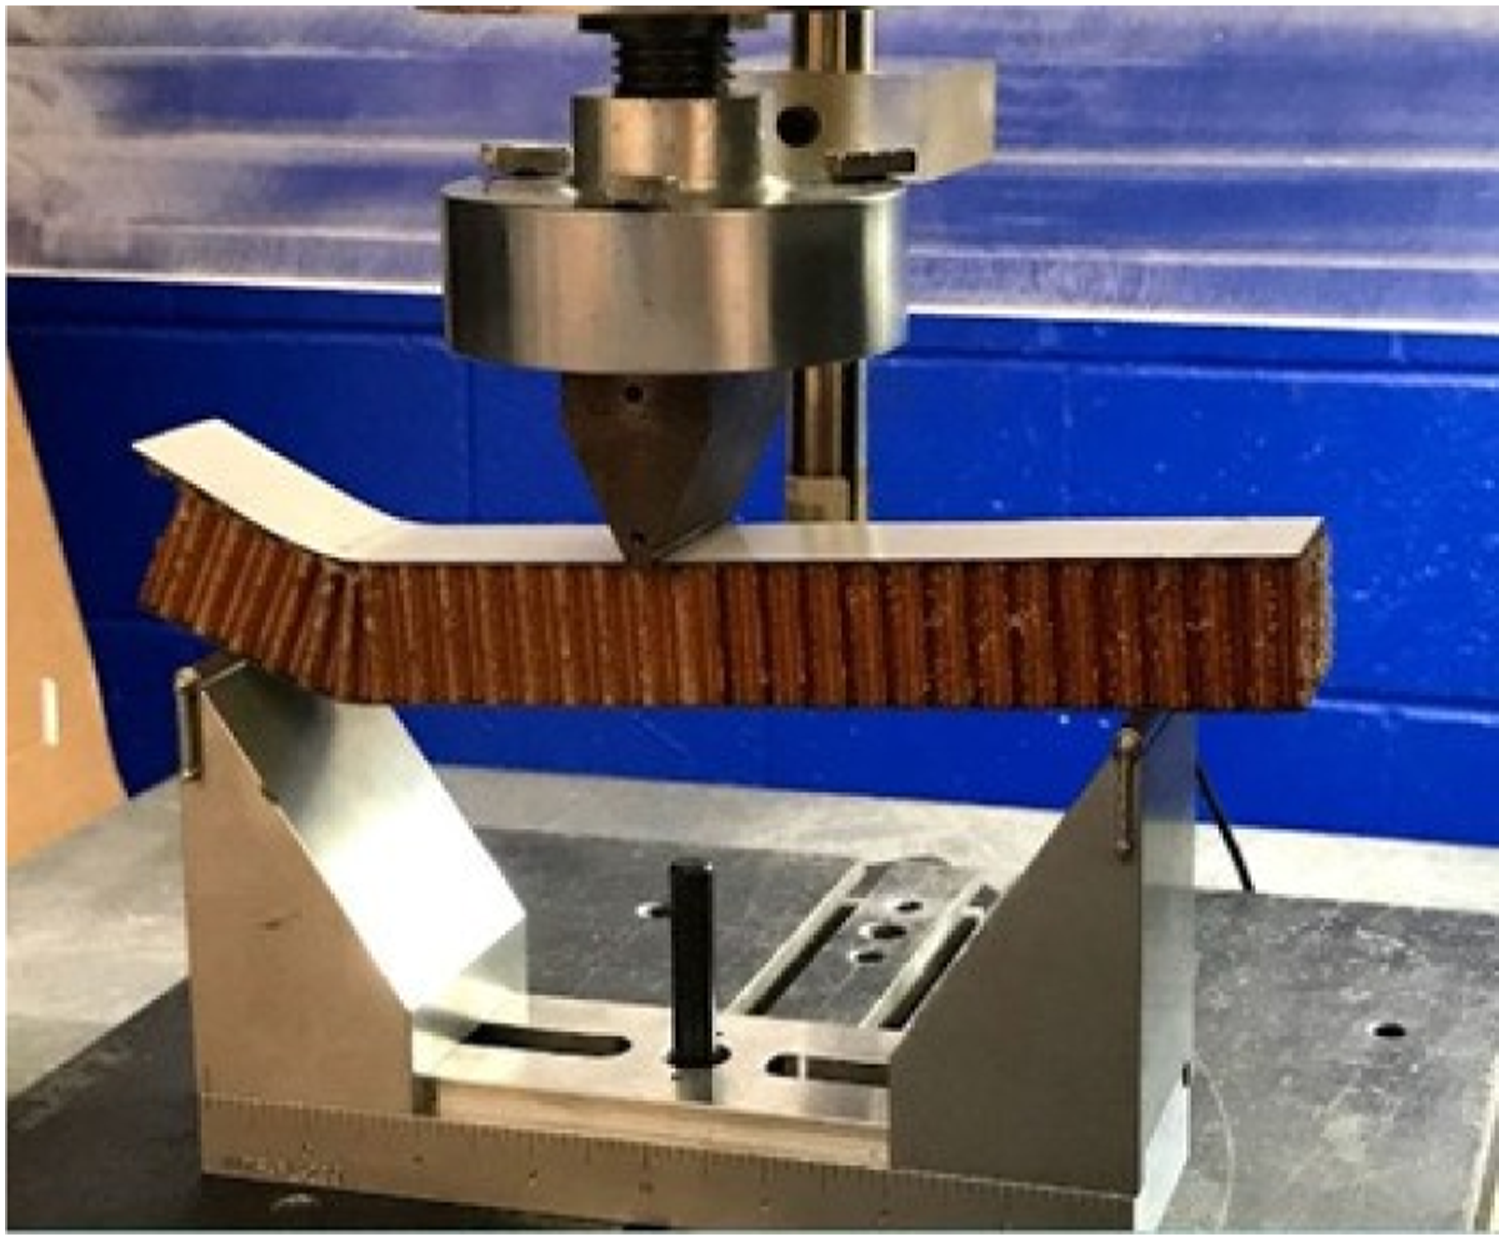
In modeling and design of the MMB and ENF fracture tests5,9 the in-plane extensional modulus and compressive strength of the core are important components. It is recognized that honeycomb core manufacturers do not provide in-plane mechanical properties of the core. The honeycomb core is with few exceptions considered a transversely isotropic materials with effective elastic stiffnesses strength calculated from unit cell models.12–14 Such models are based on assumption of perfect honeycombs consisting of flat cell walls joined at sharp corners.
Papka and Kyriakides,15,16 however, found that the cell wall corners in aluminum honeycomb cores are somewhat rounded and that the cores could be somewhat over or under-expanded causing distortion of angles between cell walls. They also found that cell lengths and cell size may differ from the ideal configuration. Zhao et al. 17 considered misaligned cell walls that ideally should be aligned with the L-direction of the core. Such imperfections, however, do not have a strong influence on the in-plane mechanical stiffnesses because of the dominance of bending of the inclined cell walls.
The influence of imperfections in the hexagonal cell structure of Nomex honeycomb cores on modulus and compressive strength will be examined by unit cell modeling and experimental tests. A major factor to be examined is the angle, θ, of the inclined cell walls, see the unit cell in Figure 3. A perfect hexagonal honeycomb cell has θ = 30
◦
, which corresponds to transverse isotropy in-plane.12,13 During manufacturing of honeycomb core, however, the core may be compressed or extended in the L direction causing deviations in the angle θ from the ideal 30°. In one extreme case it was demonstrated that extensive compression in the L-direction of the initially hexagonal core leads to θ = 0
◦
, which results in an extreme case of over-expanded core.18,19 Unit cell for Nomex honeycomb core, c is the cell size and h is the wall thickness (single wall). W and L refer to the in-plane principal directions of the core.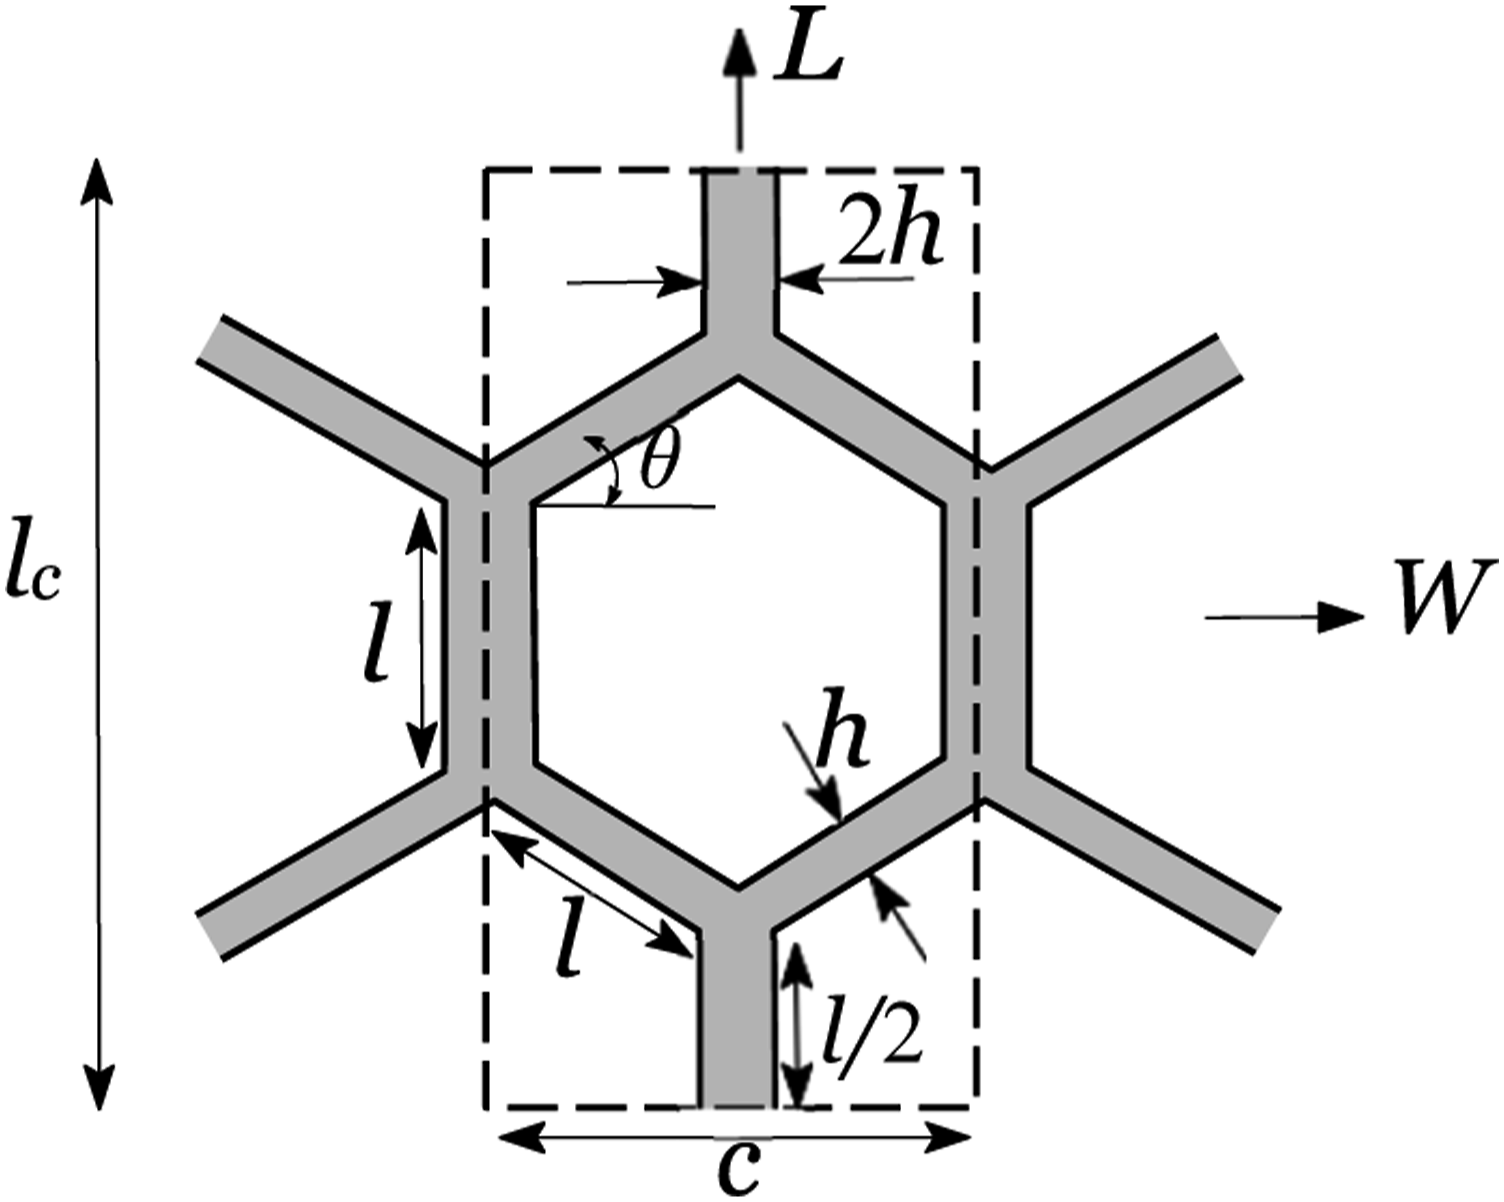
Cell wall material properties are required for modeling of the modulus and strength. The cell walls are made from Nomex paper impregnated with a phenolic resin. This material is orthotropic with the in-plane principal directions called machine direction (MD) and cross direction (CD). 20 For the Nomex honeycomb core structure, the MD will be in-plane, and the CD out-of-plane.
To quantify the influence of imperfections of the cell geometry of honeycomb cores, cell wall angles will be measured for a set of honeycomb cores, and in-plane compression tests will be conducted. The measured modulus and strength results will be compared to predictions from the until cell models of Gibson and Ashby12,13 and finite element analysis conducted here. The implications of the test results for design of MMB and ENF fracture tests will be discussed.
Materials and methods
Unit cell model for modulus and strength
Gibson and Ashby
12
modeled the in-plane extensional loading of a hexagonal honey-comb core and recognized that the response of the core is dominated by the bending of the inclined cell walls oriented at an angle θ with respect to the horizontal, Figure 3. For perfect hexagonal honeycomb core, θ = 30
◦
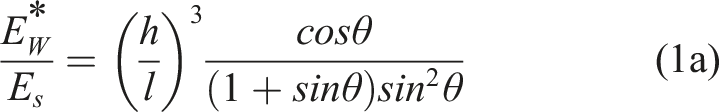
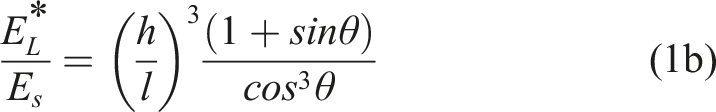
. The effective elastic moduli in the principal in-plane W and L directions of a hexagonal honeycomb core with flat cell walls are given by,
Failure of in-plane loaded honeycomb core loaded in tension or compression is assumed to be due to bending failure of the inclined cell walls.
21
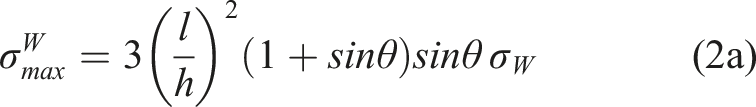
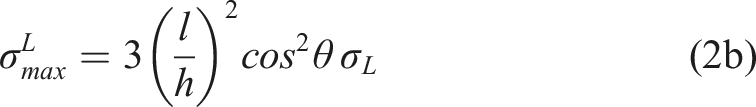
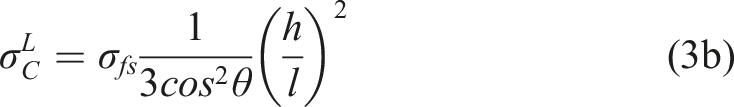
The maximum bending stress in the inclined cell walls may be calculated from beam theory by considering a unit cell under a given far-field stress:
12
Experimental
Materials and test specimens
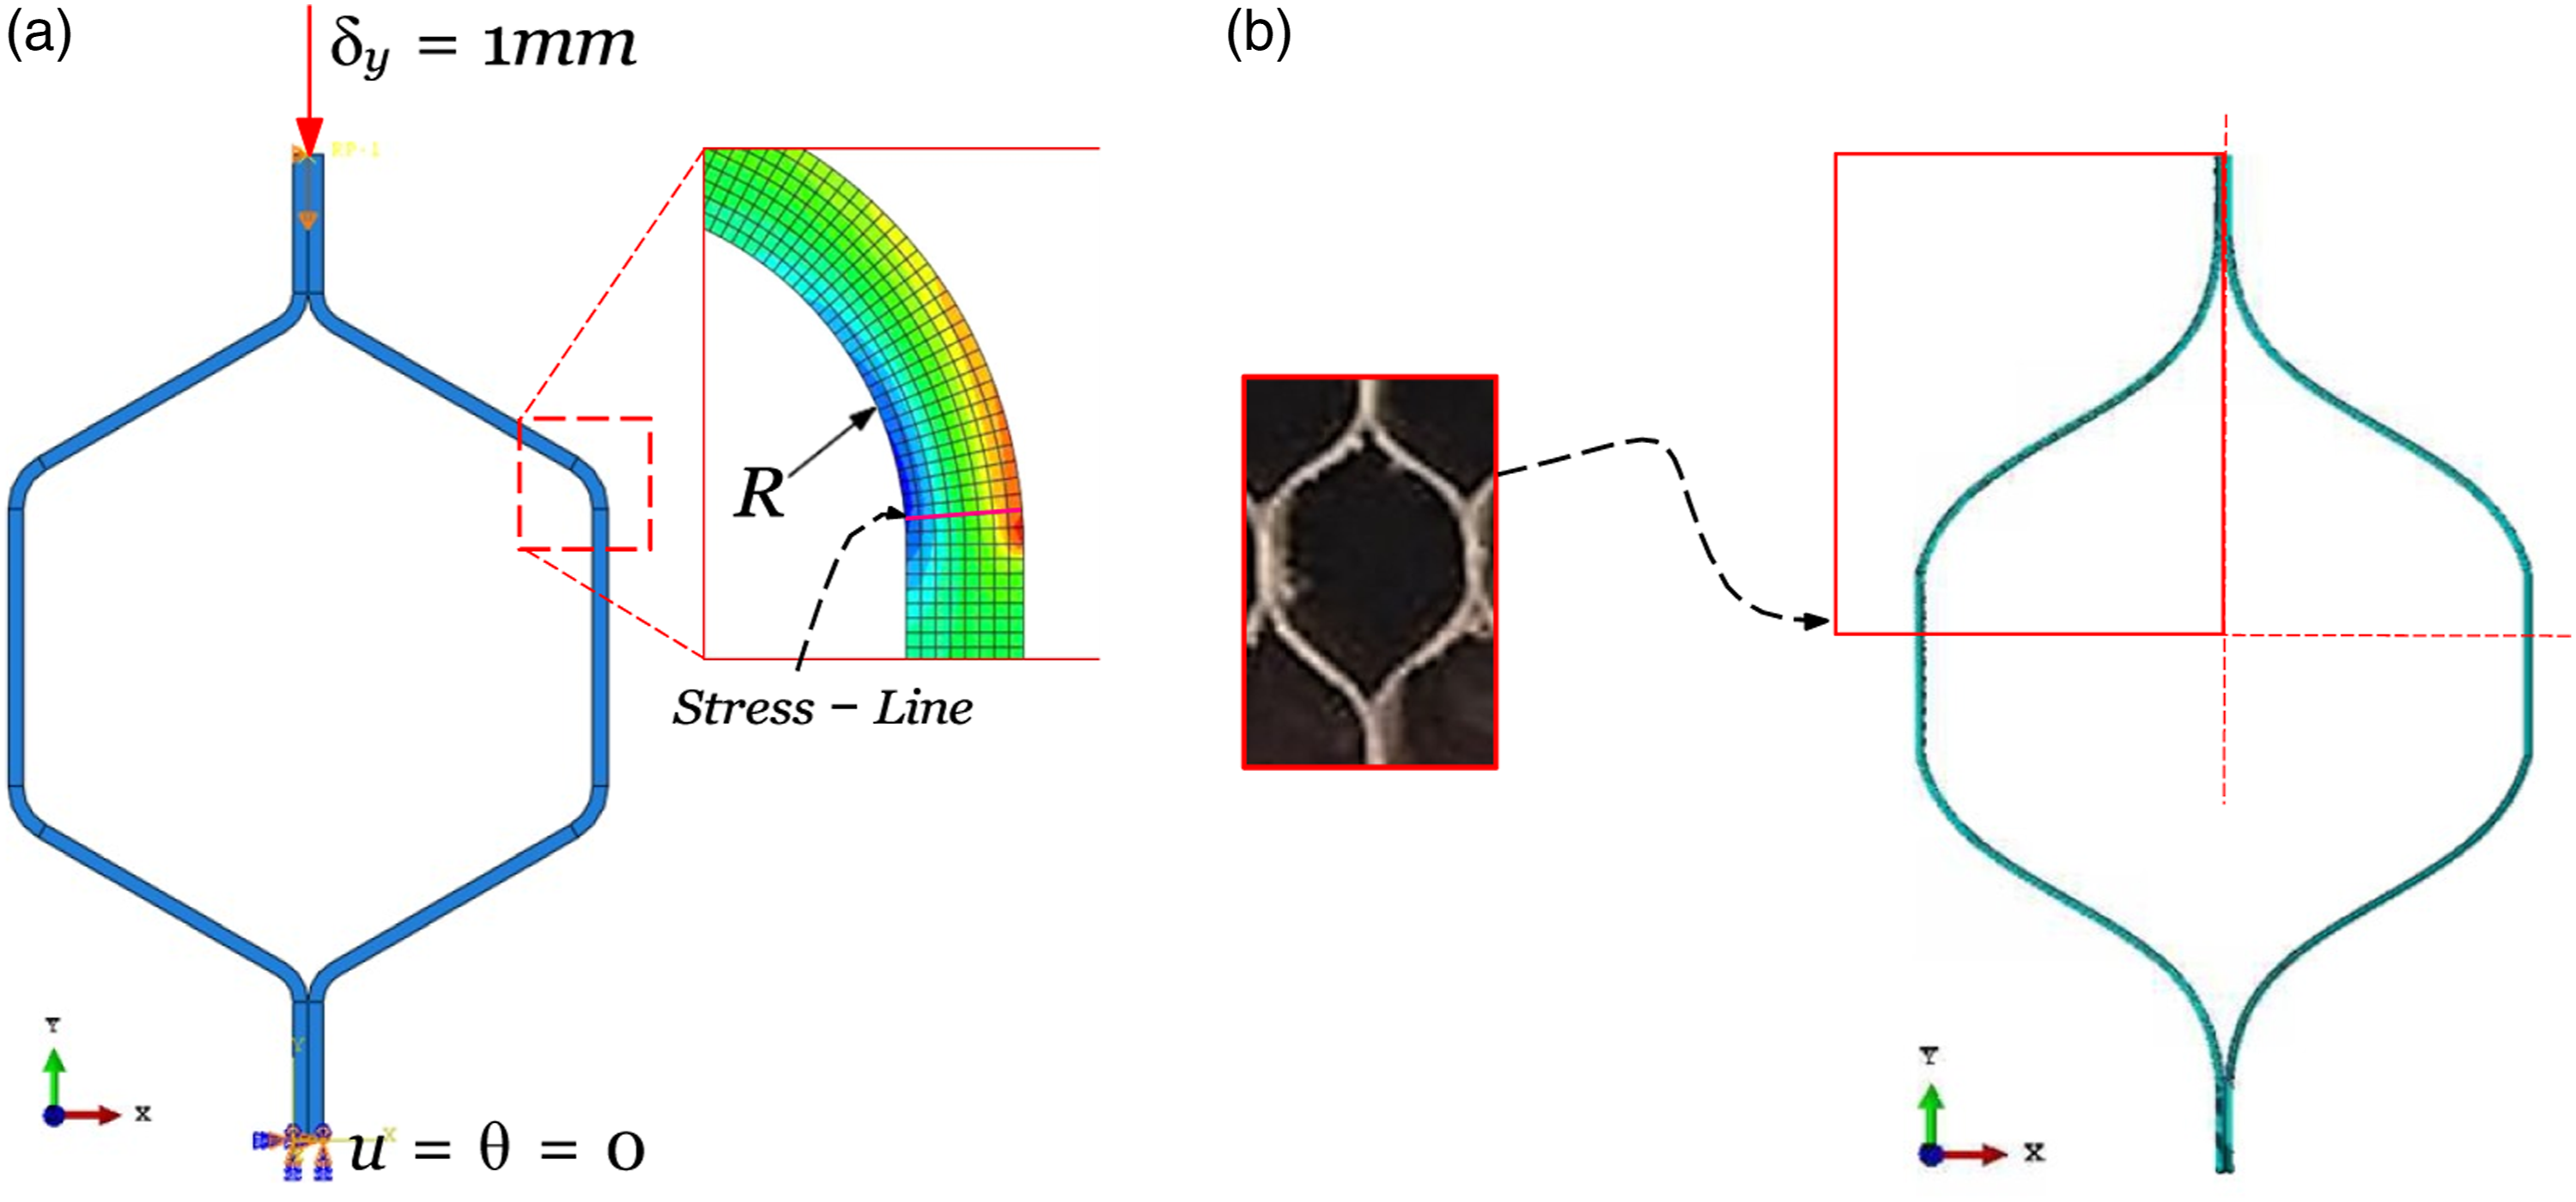
Core panels were provided by Eurocomposites and the University of Utah. Their commercial designations are ECA-4.8-32, ECA- 4.8-48, ECA-6.4-50, and ECA-3.2-96. The 1st number refers to nominal cell size, c (mm) and the 2nd number refers to density ρ (kg/m3). Photos of the Nomex honeycomb cores examined in this study are shown in Figure 4. Honeycomb cores examined in this study. L direction is vertical.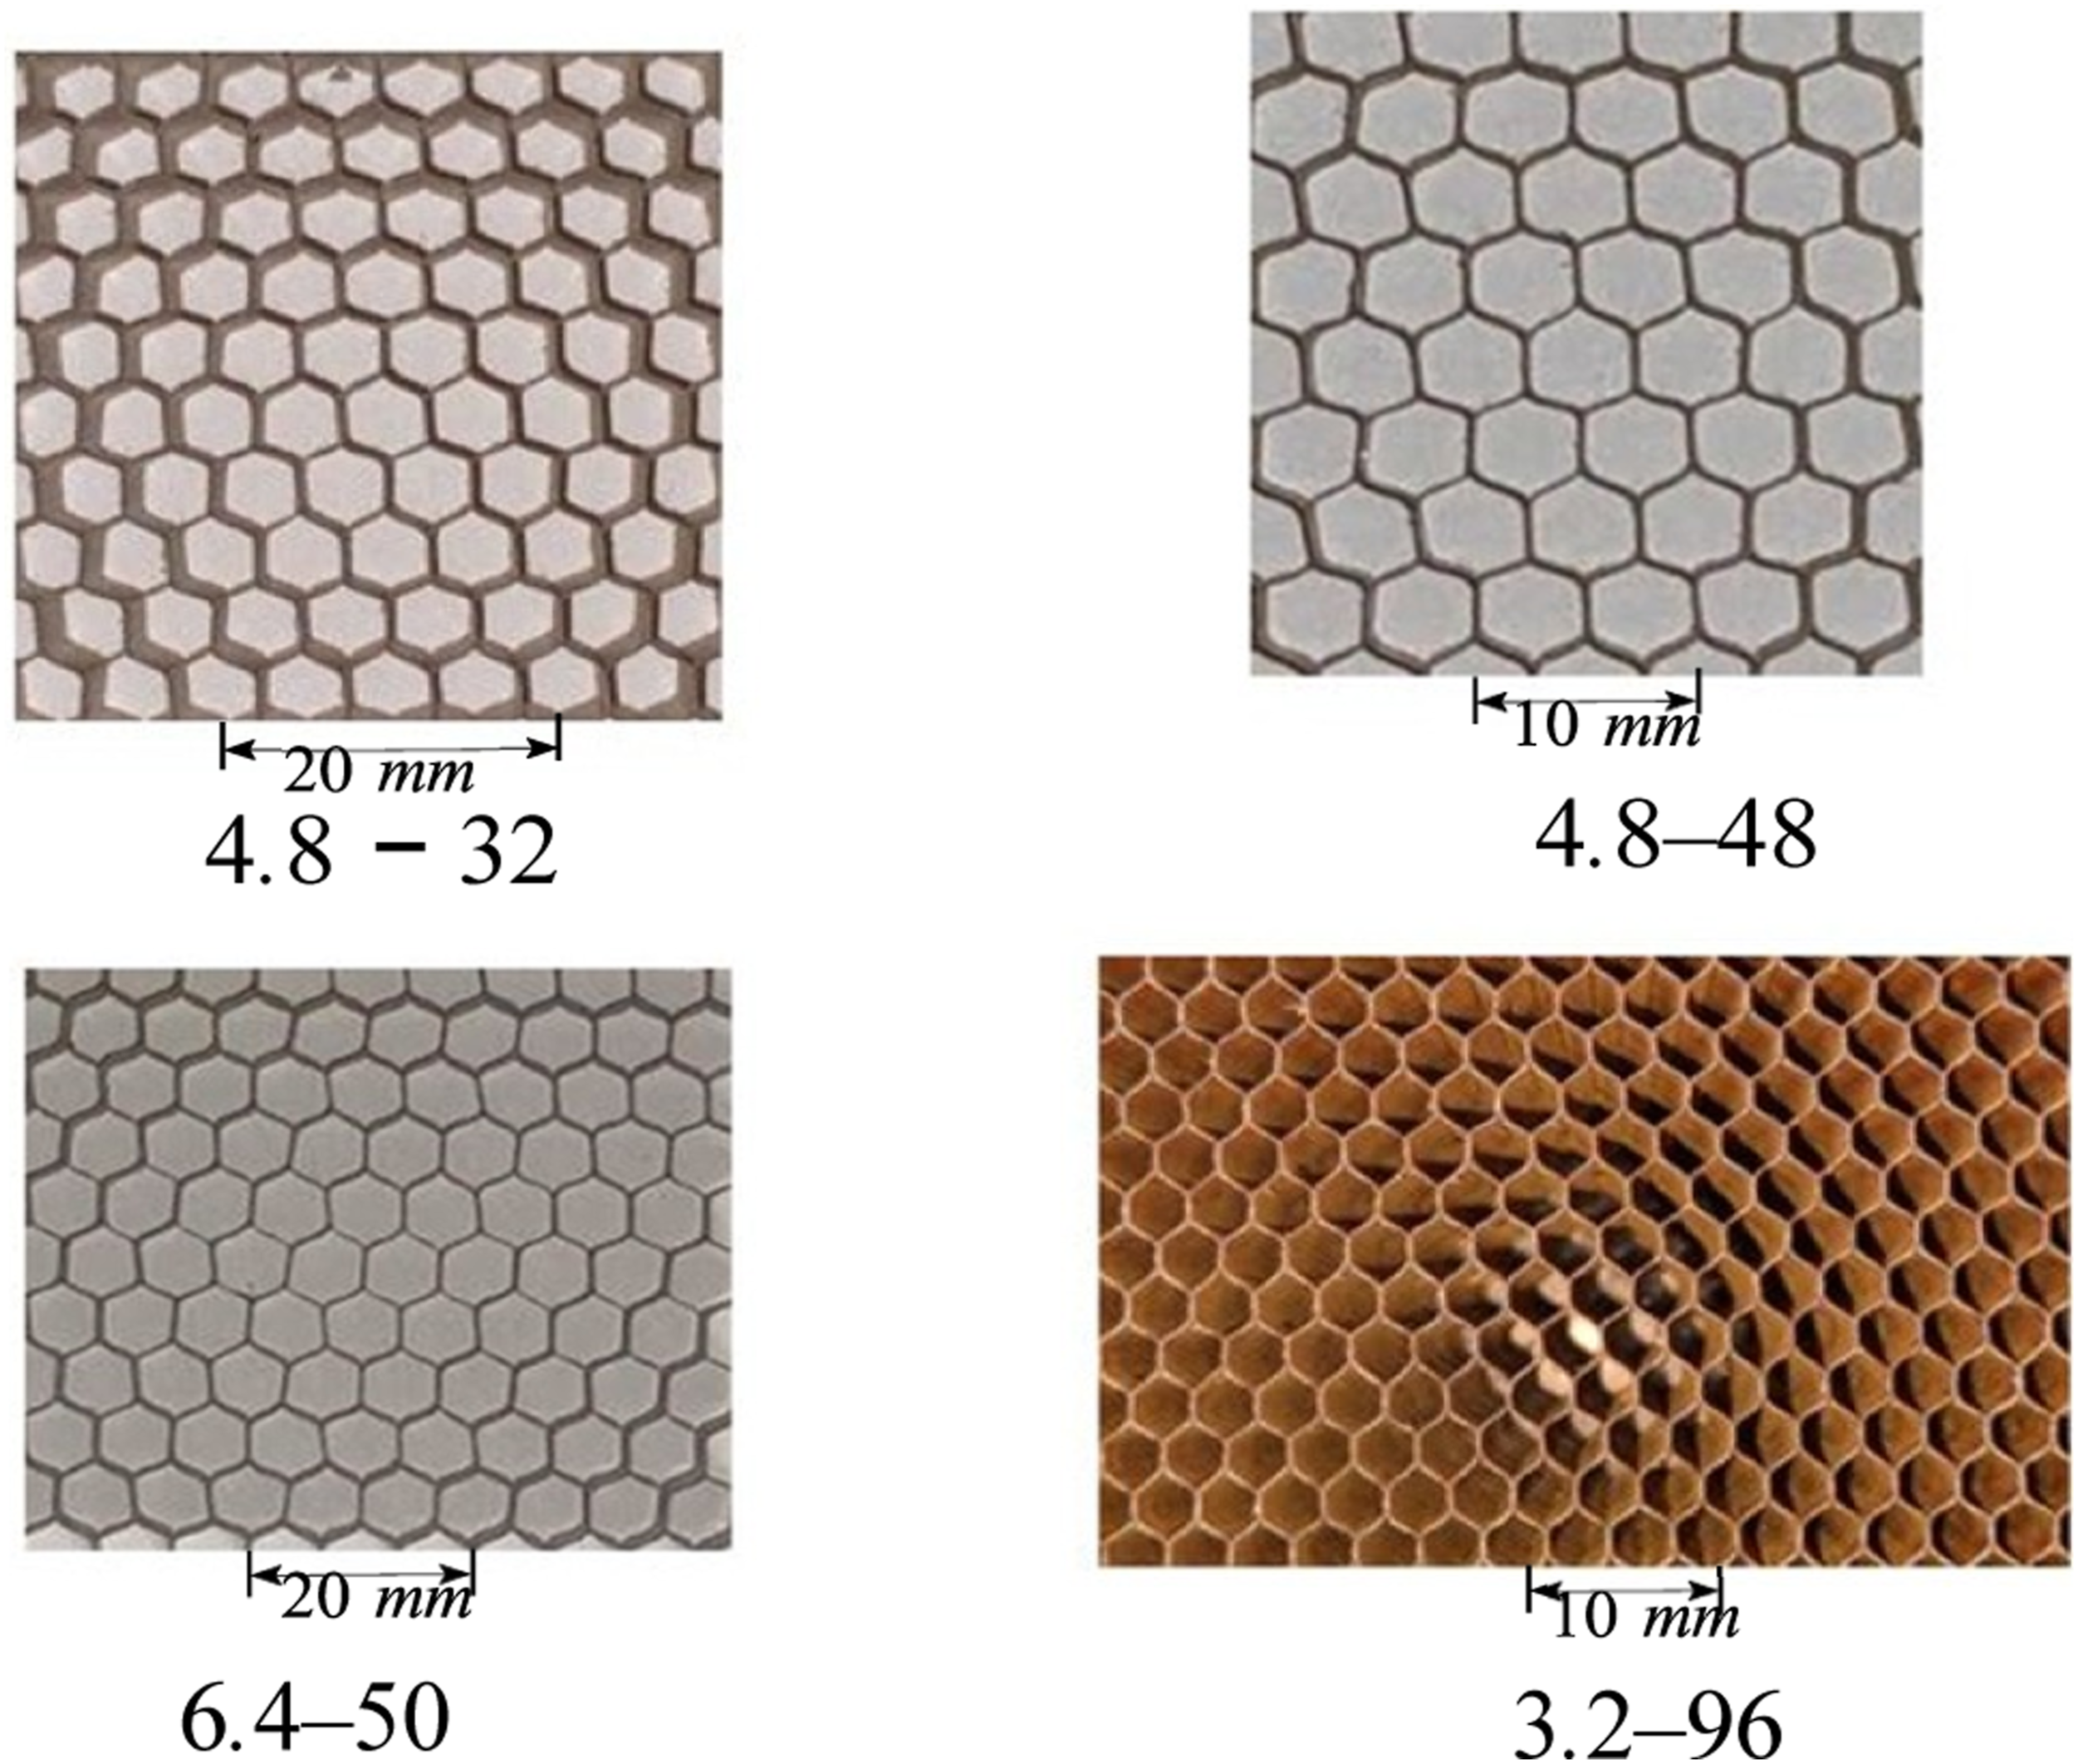
The cell wall thickness (h) was measured with a dial gage. The cell wall angle, θ, was measured using magnified photographs of the cores. As shown in the schematic, Figure 5, a line was drawn along the central straight portion of the cell wall with a ruler. By construction of a straight-sided triangle, with the vertical along the L-direction and horizontal along the W -direction, the angle θ was calculated from the side lengths a1 and b1 [θ = tan
−1
(a1/b1)]. Schematic illustration of angle (θ) determination.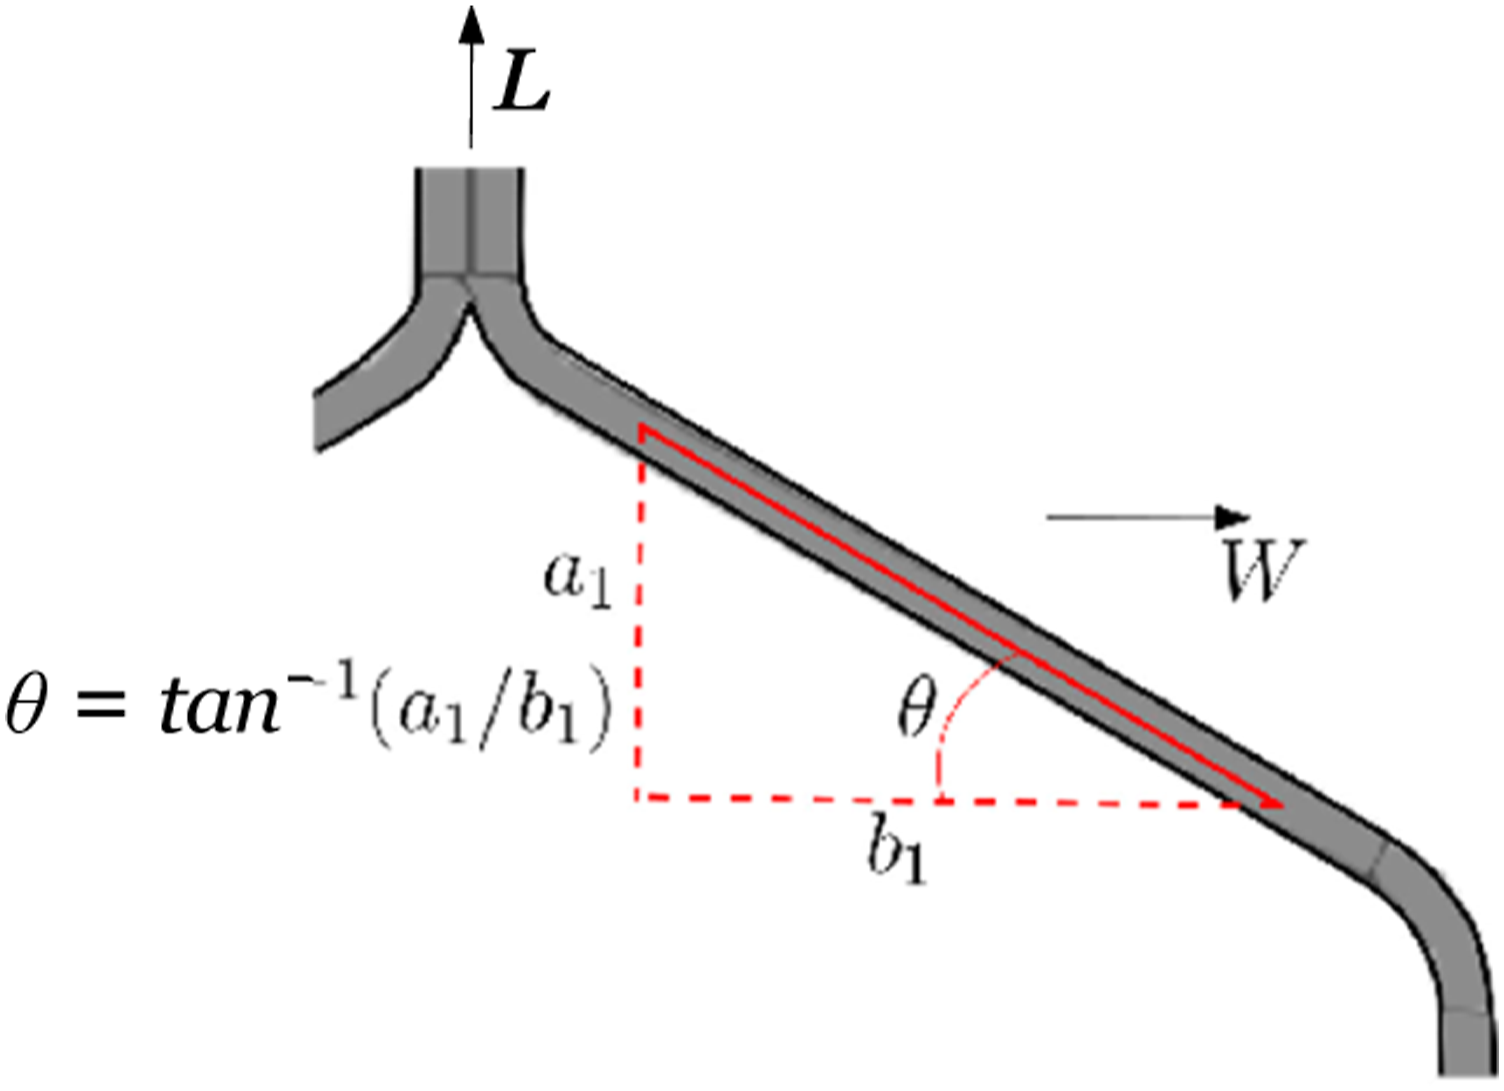
A total of 6 cell walls in different regions were examined.
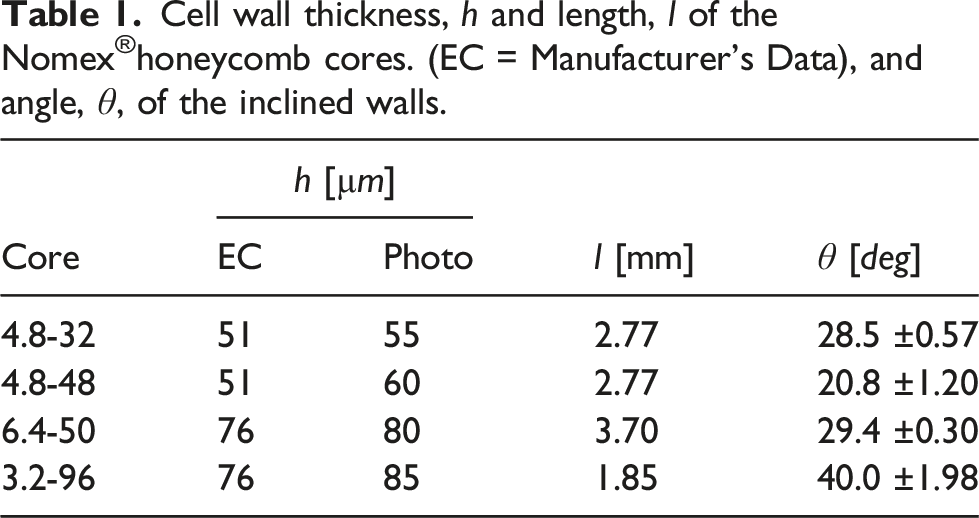
Cell wall thickness, h and length, l of the Nomex®honeycomb cores. (EC = Manufacturer’s Data), and angle, θ, of the inclined walls.
Test procedure
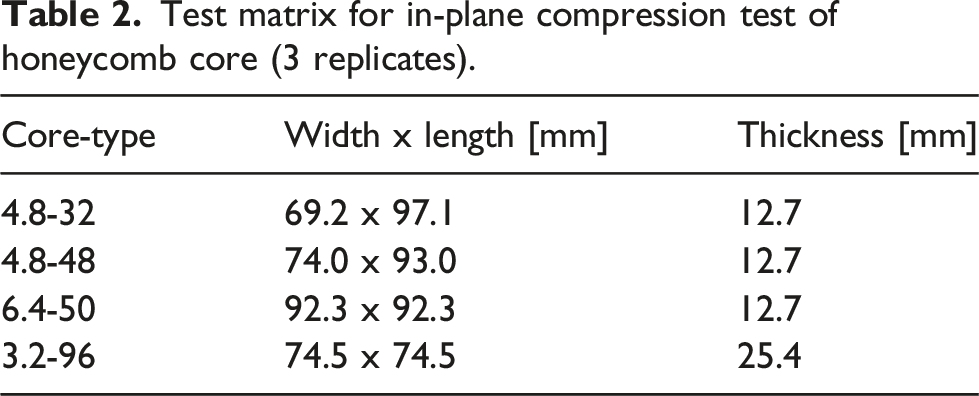
Test matrix for in-plane compression test of honeycomb core (3 replicates).
Honeycomb cores examined in this study. L direction is vertical.
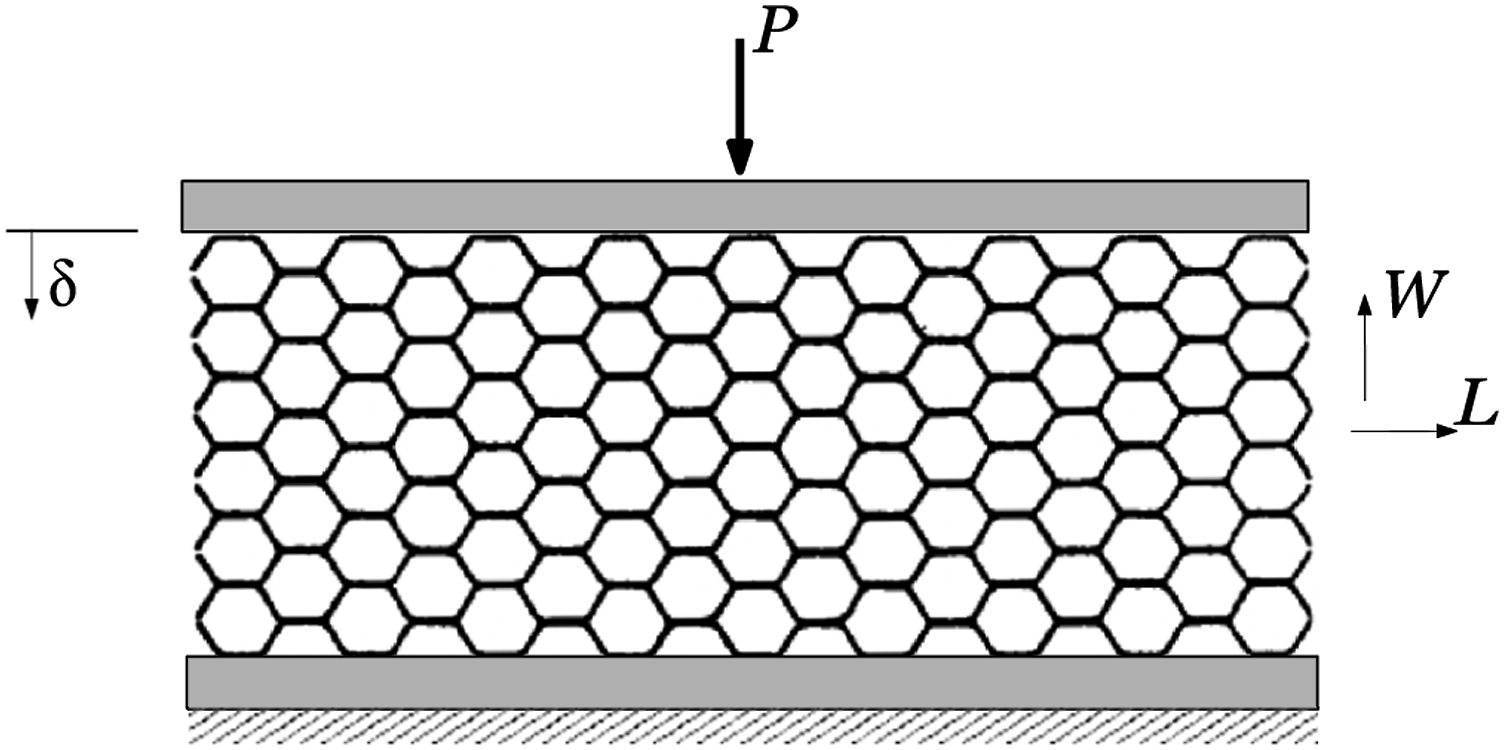
A Tinius Olsen general-purpose mechanical test machine of 133 kN load capacity was used to conduct the compressive testing. Due to the compliant and weak core material, a small capacity (1.34 kN) load cell was used. The load (P) and displacement data is converted to effective stress and effective strain data, equations (4),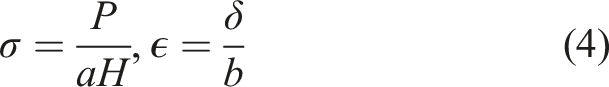
where P is the load, and a, b, and H are the width, length, and thickness of the test specimen. Load and displacement data was collected by a LabView data acquisition system. During the compression testing, photos of the deformed specimens were taken. The effective modulus, E, was determined from the slope of the initial linear stress-strain curve (E = σ/ϵ). The compressive strength, σ c , was determined from the maximum magnitude of stress. Three replicate specimens were tested under in-plane compression (Table 2).
Finite element model description
To examine the influence of rounded corners and curved cell walls, Finite Element Analysis (FEA) was carried out. Primarily, the in-plane elastic properties (E, µ) were calculated. In addition, the bending stress in the inclined cell wall was examined. The cell wall angle, θ, was 30 ◦ in all FE-models. For this study, the ECA-6.4-50 core, was selected for analysis. The cell wall thickness and length (h and l) are listed in Table 1. The measured values of the cell wall dimensions were used in the FEA.
First, to benchmark the analysis, a unit cell with flat walls was modeled. In-plane modului (E
L
and E
W
), Poisson’s ratios (
Unit cells of the core are modeled in the finite element code ABAQUS using 4-node CPS4R elements (bilinear elements with reduced integration and hourglass control). Unit cell models with straight and curved walls were considered (Figure 7). Note that in the FE-model, the ribbon direction (L) is aligned with the y−axis, Figure 7. The 2D unit cell was discretized into 26,053 nodes and 23,440 elements, with an element length of 0.001 mm. Regular honeycomb unit cell with flat cell walls.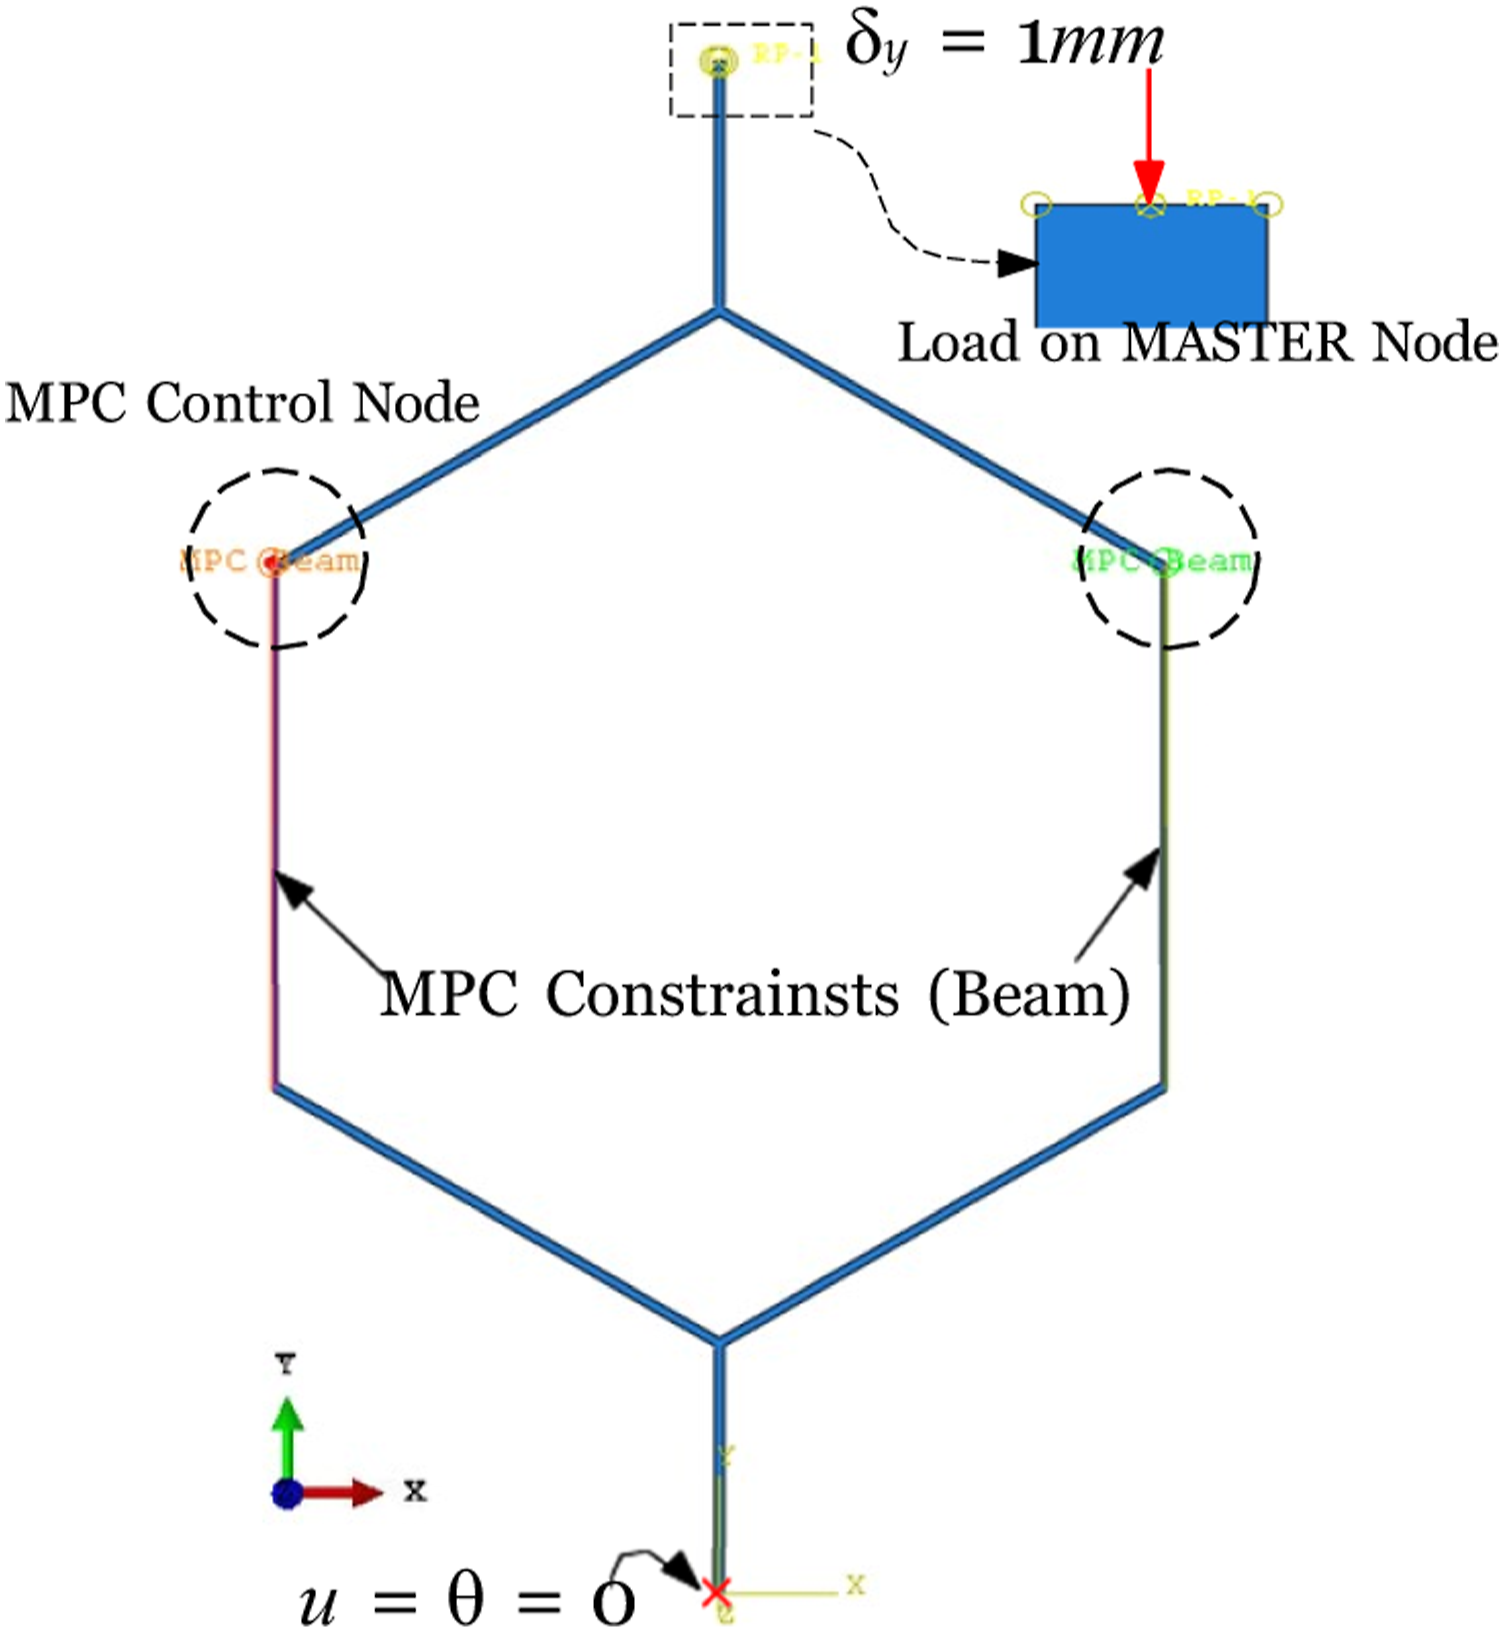
To simulate uniaxial in-plane loading of the core in the L-direction, a unit displacement δ
y
=1 mm was applied to the master node at the top (see Figure 7). The bottom nodes were fixed. To ensure periodicity, while applying loading along the L-direction, the vertical cell walls were constrained to remain straight using the Multi-nodal Point Constraint (MPC) beam element [see Figure 7]. The reaction forces were summed (
Similarly, to simulate uniaxial loading of the core in the W -direction, a unit displacement was applied in the x−direction on the vertical wall with the opposite wall constrained. To obtain effective stiffness, the reaction force (
Deviations from flatness of the cell walls were considered using two modeling approaches: i) A unit cell with a fillet radius, R (R = 0.1, 0.25, 0.5 mm), see Figure 8(a), and ii) a unit cell with curved walls described with the aid of an analytical function, see Figure 8(b). The geometry of curved inclined walls was assumed to follow a hyperbolic tangent function, (a) Honeycomb unit cell with curved cell wall depicted using fillet radius. (b) Curved cell wall modeled using a hyperbolic tangent function [Equation (7)].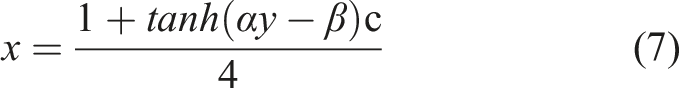
The fitting parameters α and β were ascertained iteratively to get the desired description of the curved cell wall. With the aid of tangent hyperbolic function, the entire cell geometry can be generated. The curved geometry representing the top left quadrant, Figure 8(b), is mirrored along x and y - axes to complete the description of the entire cell. A short Python-based script was used to translate the hyperbolic function to the cell geometry in Abaqus.
Results and discussions
Stress versus strain behavior of honeycomb cores
Figure 9 shows representative compressive stress-strain curves for Nomex core specimens loaded in the W direction. The stress-strain curves are initially linear followed by a nonlinear softening region and a plateau region. The stress-strain curves for all cores are qualitatively similar and similar to compressive stress-strain curves for specimens loaded in the L-direction see.
23
Modulus, E, was evaluated from slope of the linear region of the stress-strain curve. Strength (σ
c
) was evaluated from the maximum of the stress-strain curve. Compressive stress versus strain curves for honeycomb cores considered in this study loaded in W direction.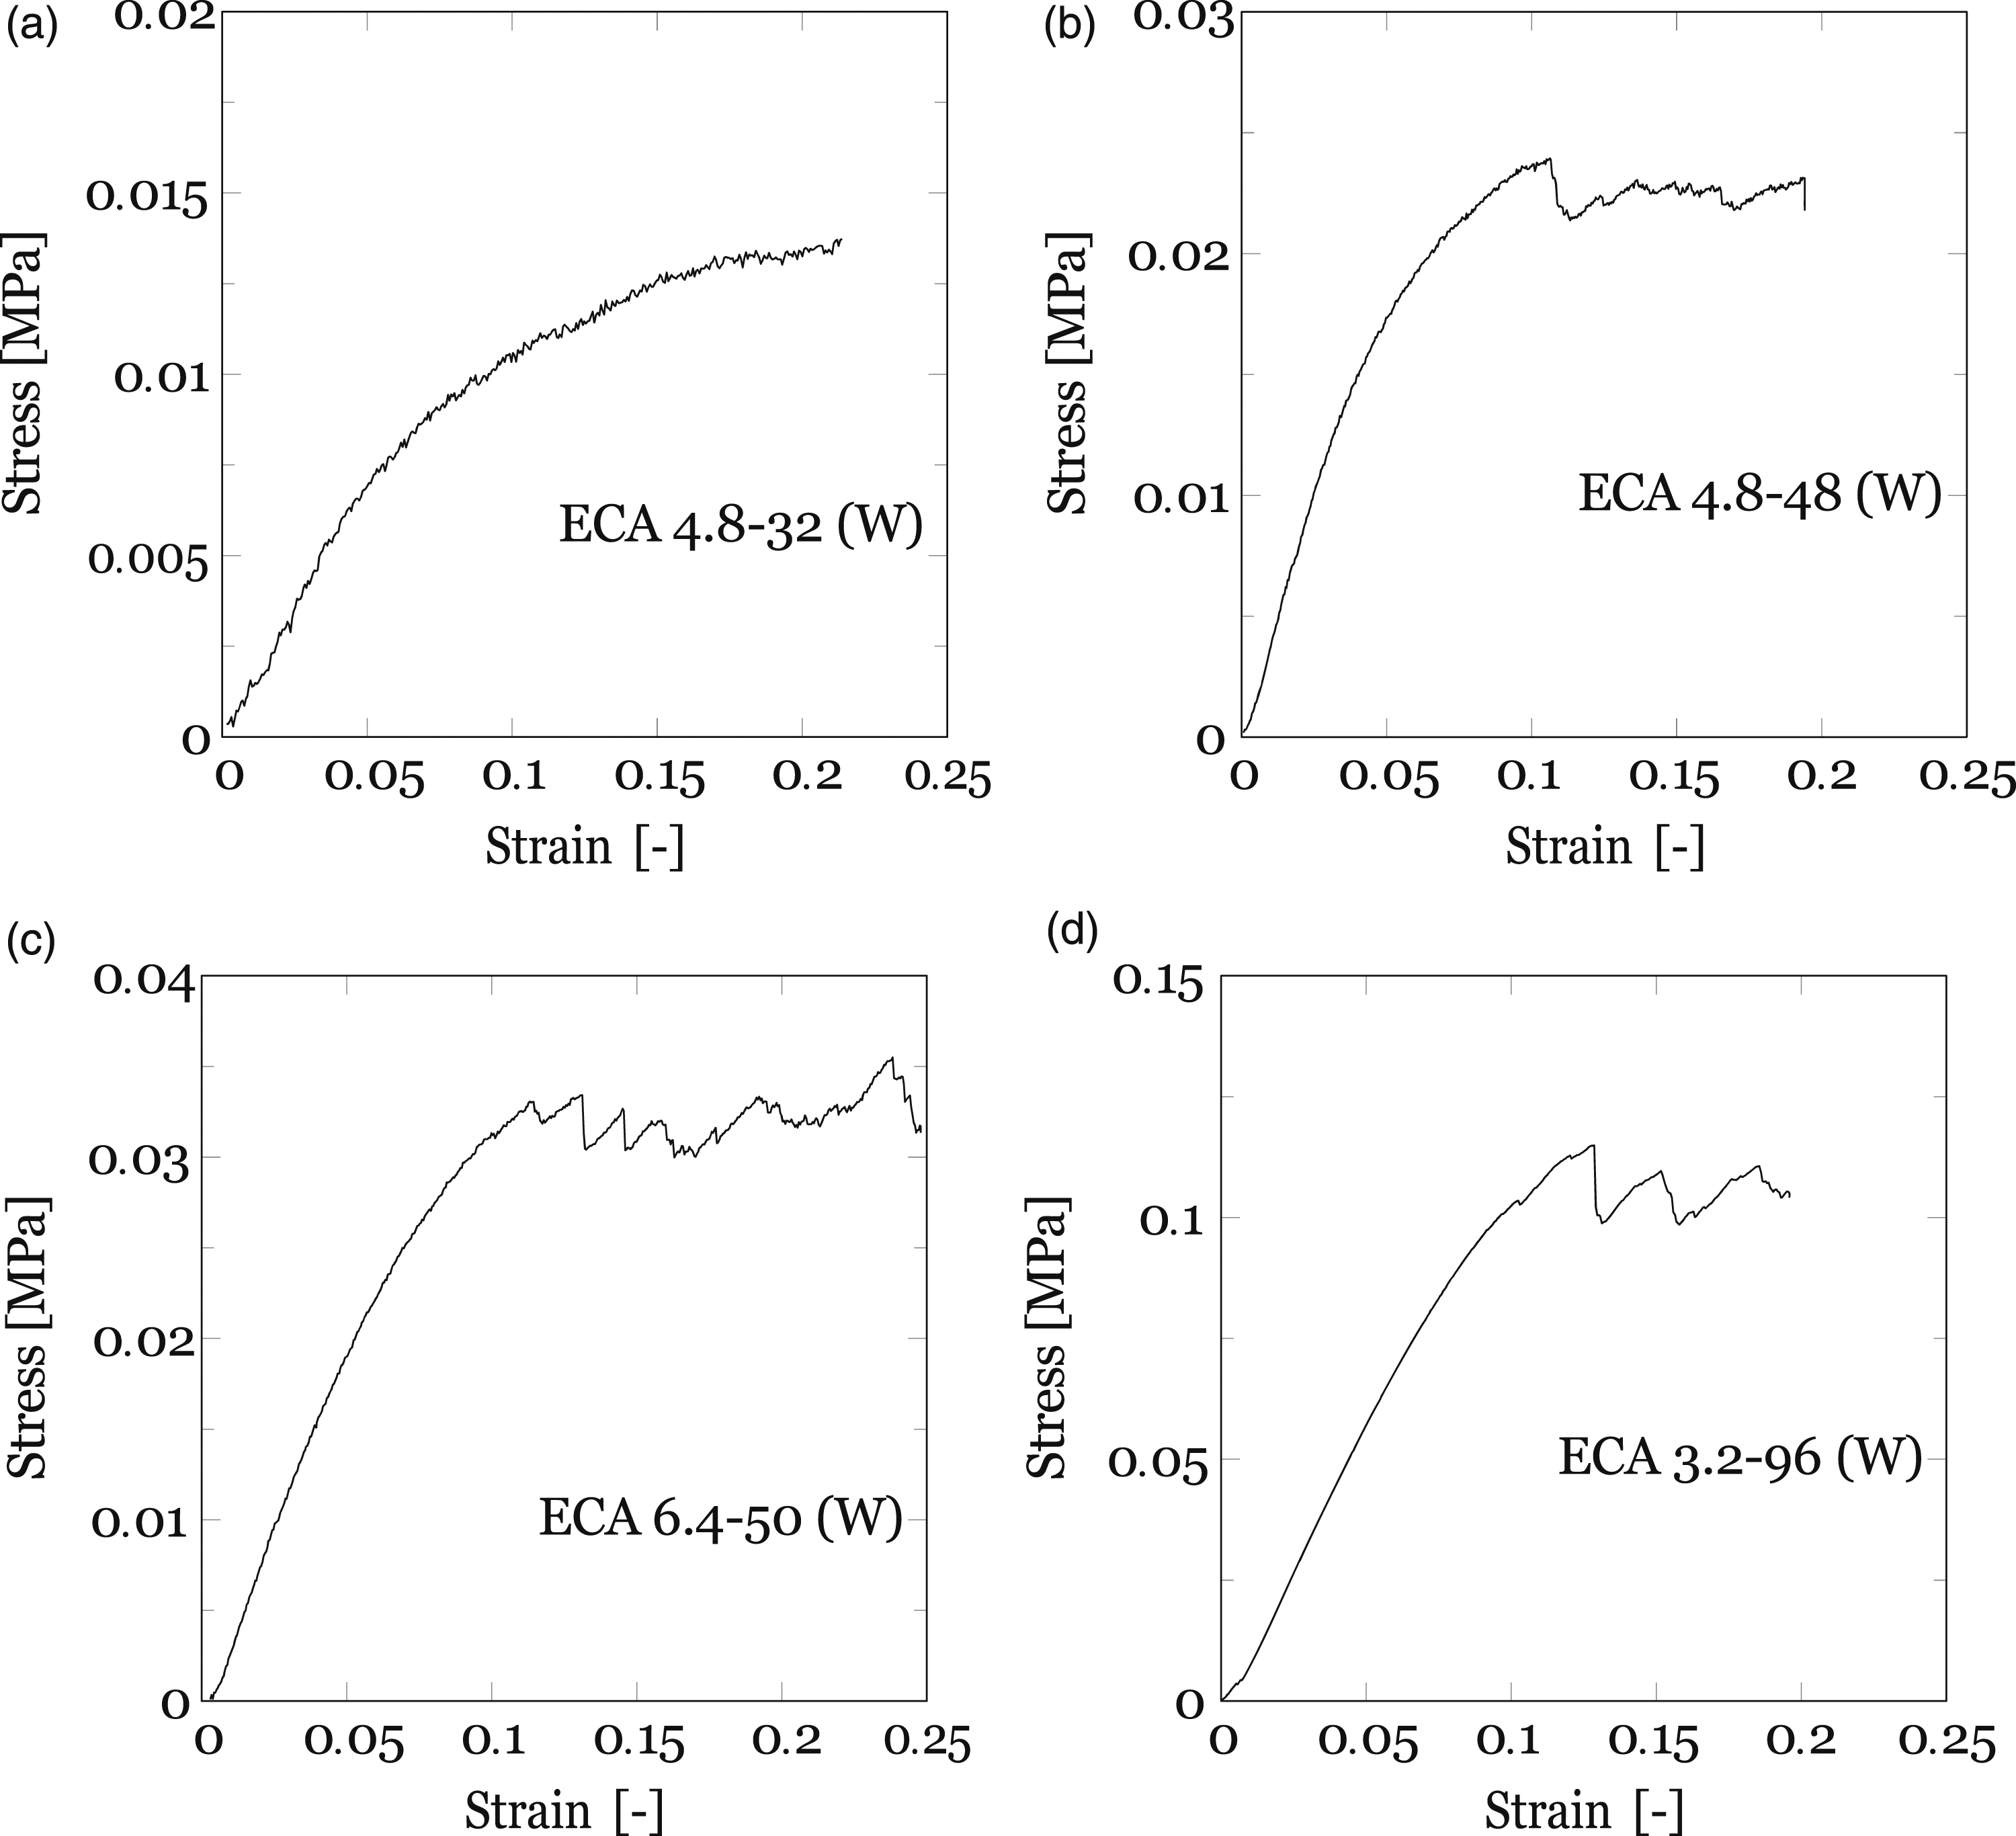
Failure mechanisms
The deformation of core specimens loaded in the W-direction to different levels was exam-ined using photos of core specimens. Figure 10 shows a sequence of photos for a 4.8-32 core loaded in the linear region, nonlinear region, and close to failure. In the linear region, Figure 10(a), the core cells appear to deform uniformly. Figure 10(b) shows the specimen loaded in the nonlinear region. Localized deformation by inclined cell wall bending is observed in the center of the specimen. Figure 10(c) shows a partially collapsed specimens where inclined cell walls have failed in bending and flattened across the width of the specimen. A sequence of photos of core 4.8-32 loaded in a compression in the W direction (vertical). (a) linear region, (b) nonlinear region, and (c) close to failure (plateau).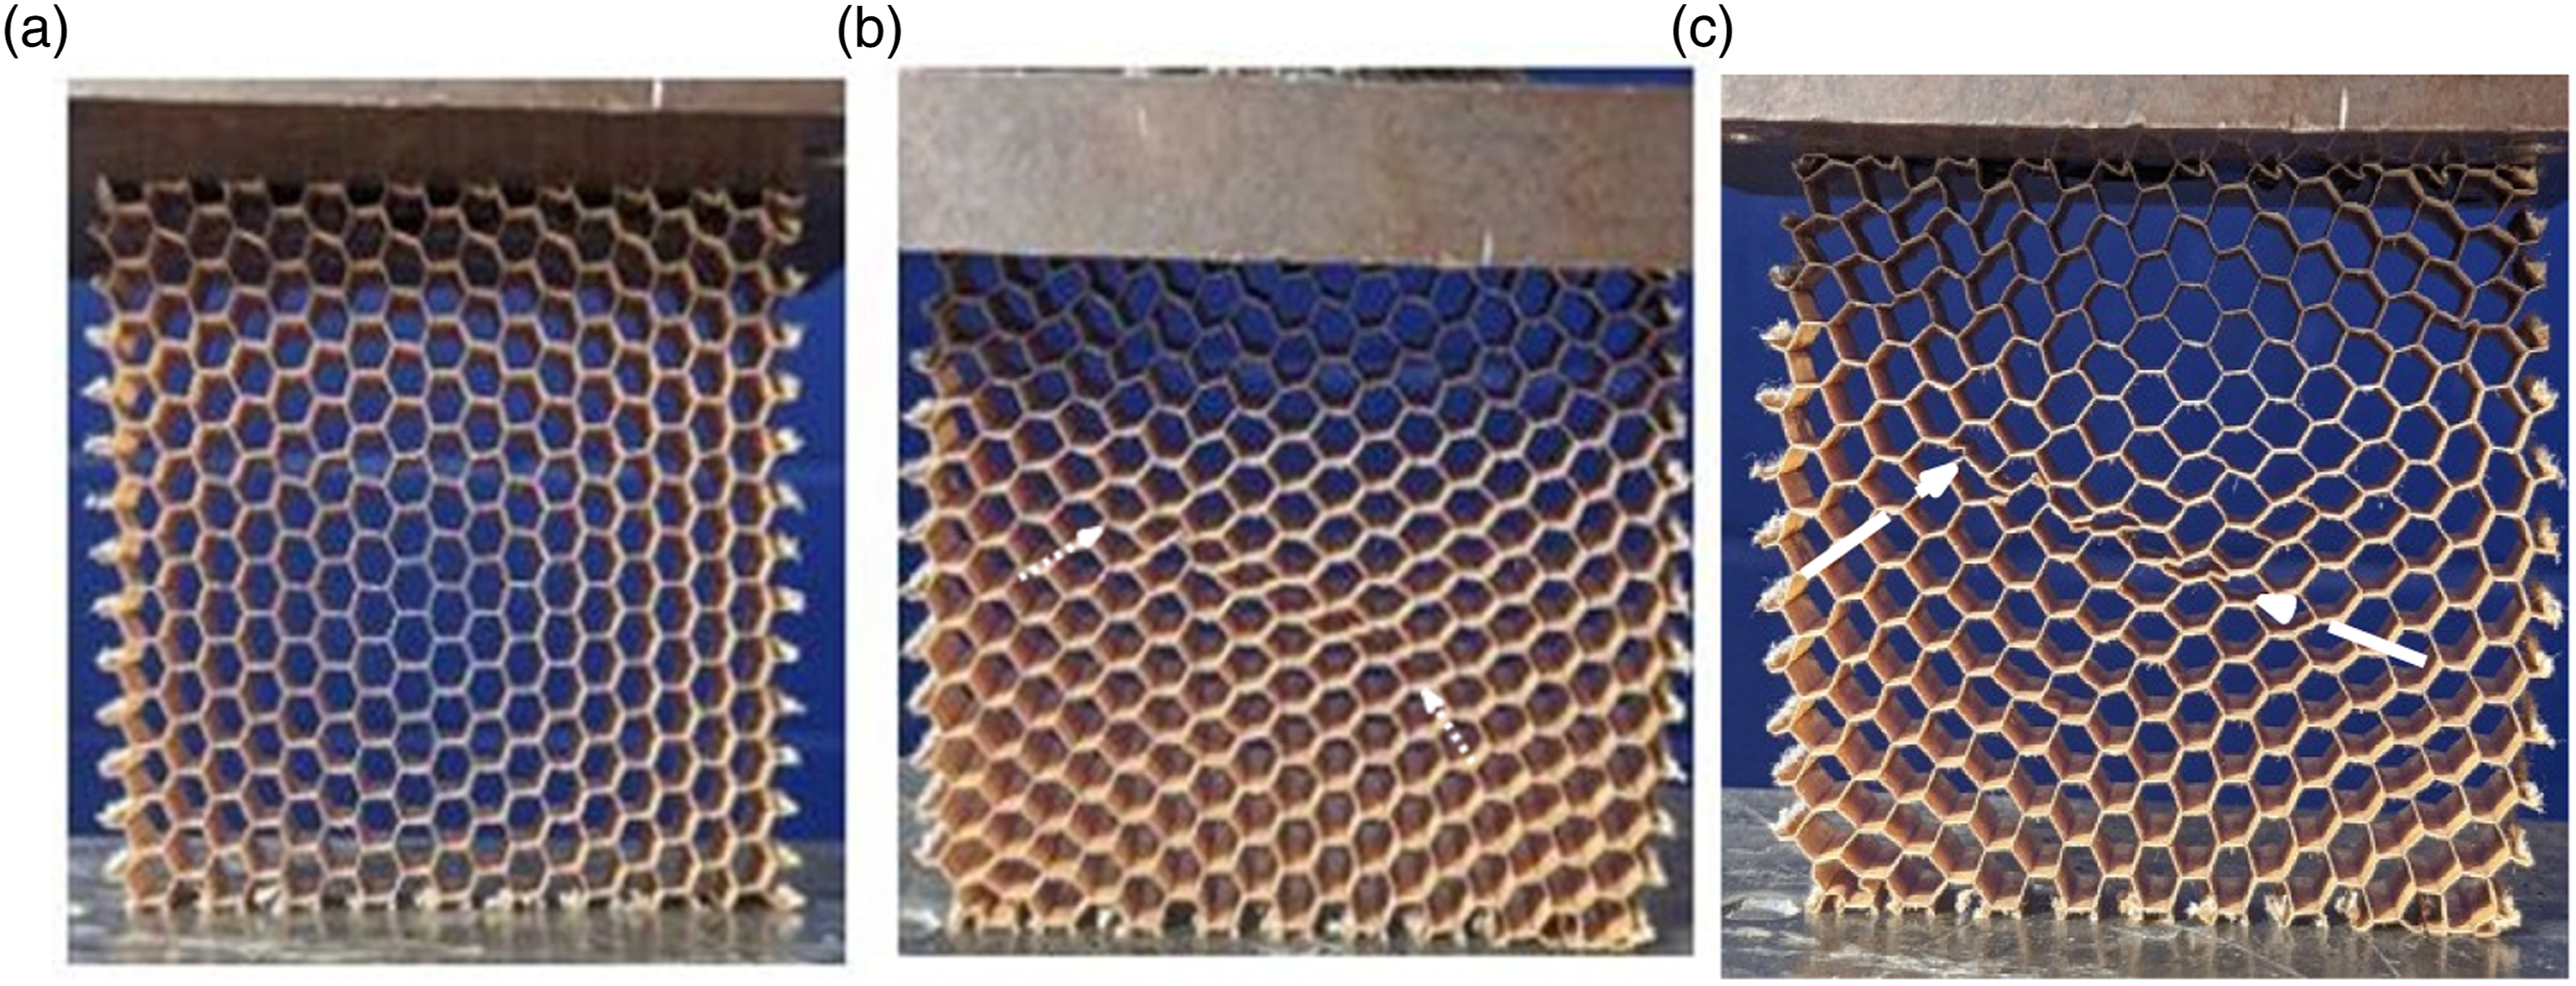
Photos of deformed 4.8-48, 6.4-50 and 3.2-96 core specimens are shown in Figure 11. Only the nonlinear and collapse regions are shown. Similar to the mechanisms observed for the 4.8-32 core, Figure 10, deformation in the nonlinear region occurs by bending of inclined cell walls. Failure and collapse occurs by flattening of the inclined cell walls. Deformation of Nomex®cores 4.8–48 (a) and (b), 6.4–50 (c) and ((d) and 3.2–96 (e) and (f) loaded in compression (vertical) in the W-direction. (a) nonlinear region (4.8–48), (b) close to failure (4.8–48), (c) nonlinear region (6.4–50), (d) close to failure (6.4–50), (e) nonlinear region (3.2–96), and (f) close to failure (3.2–96).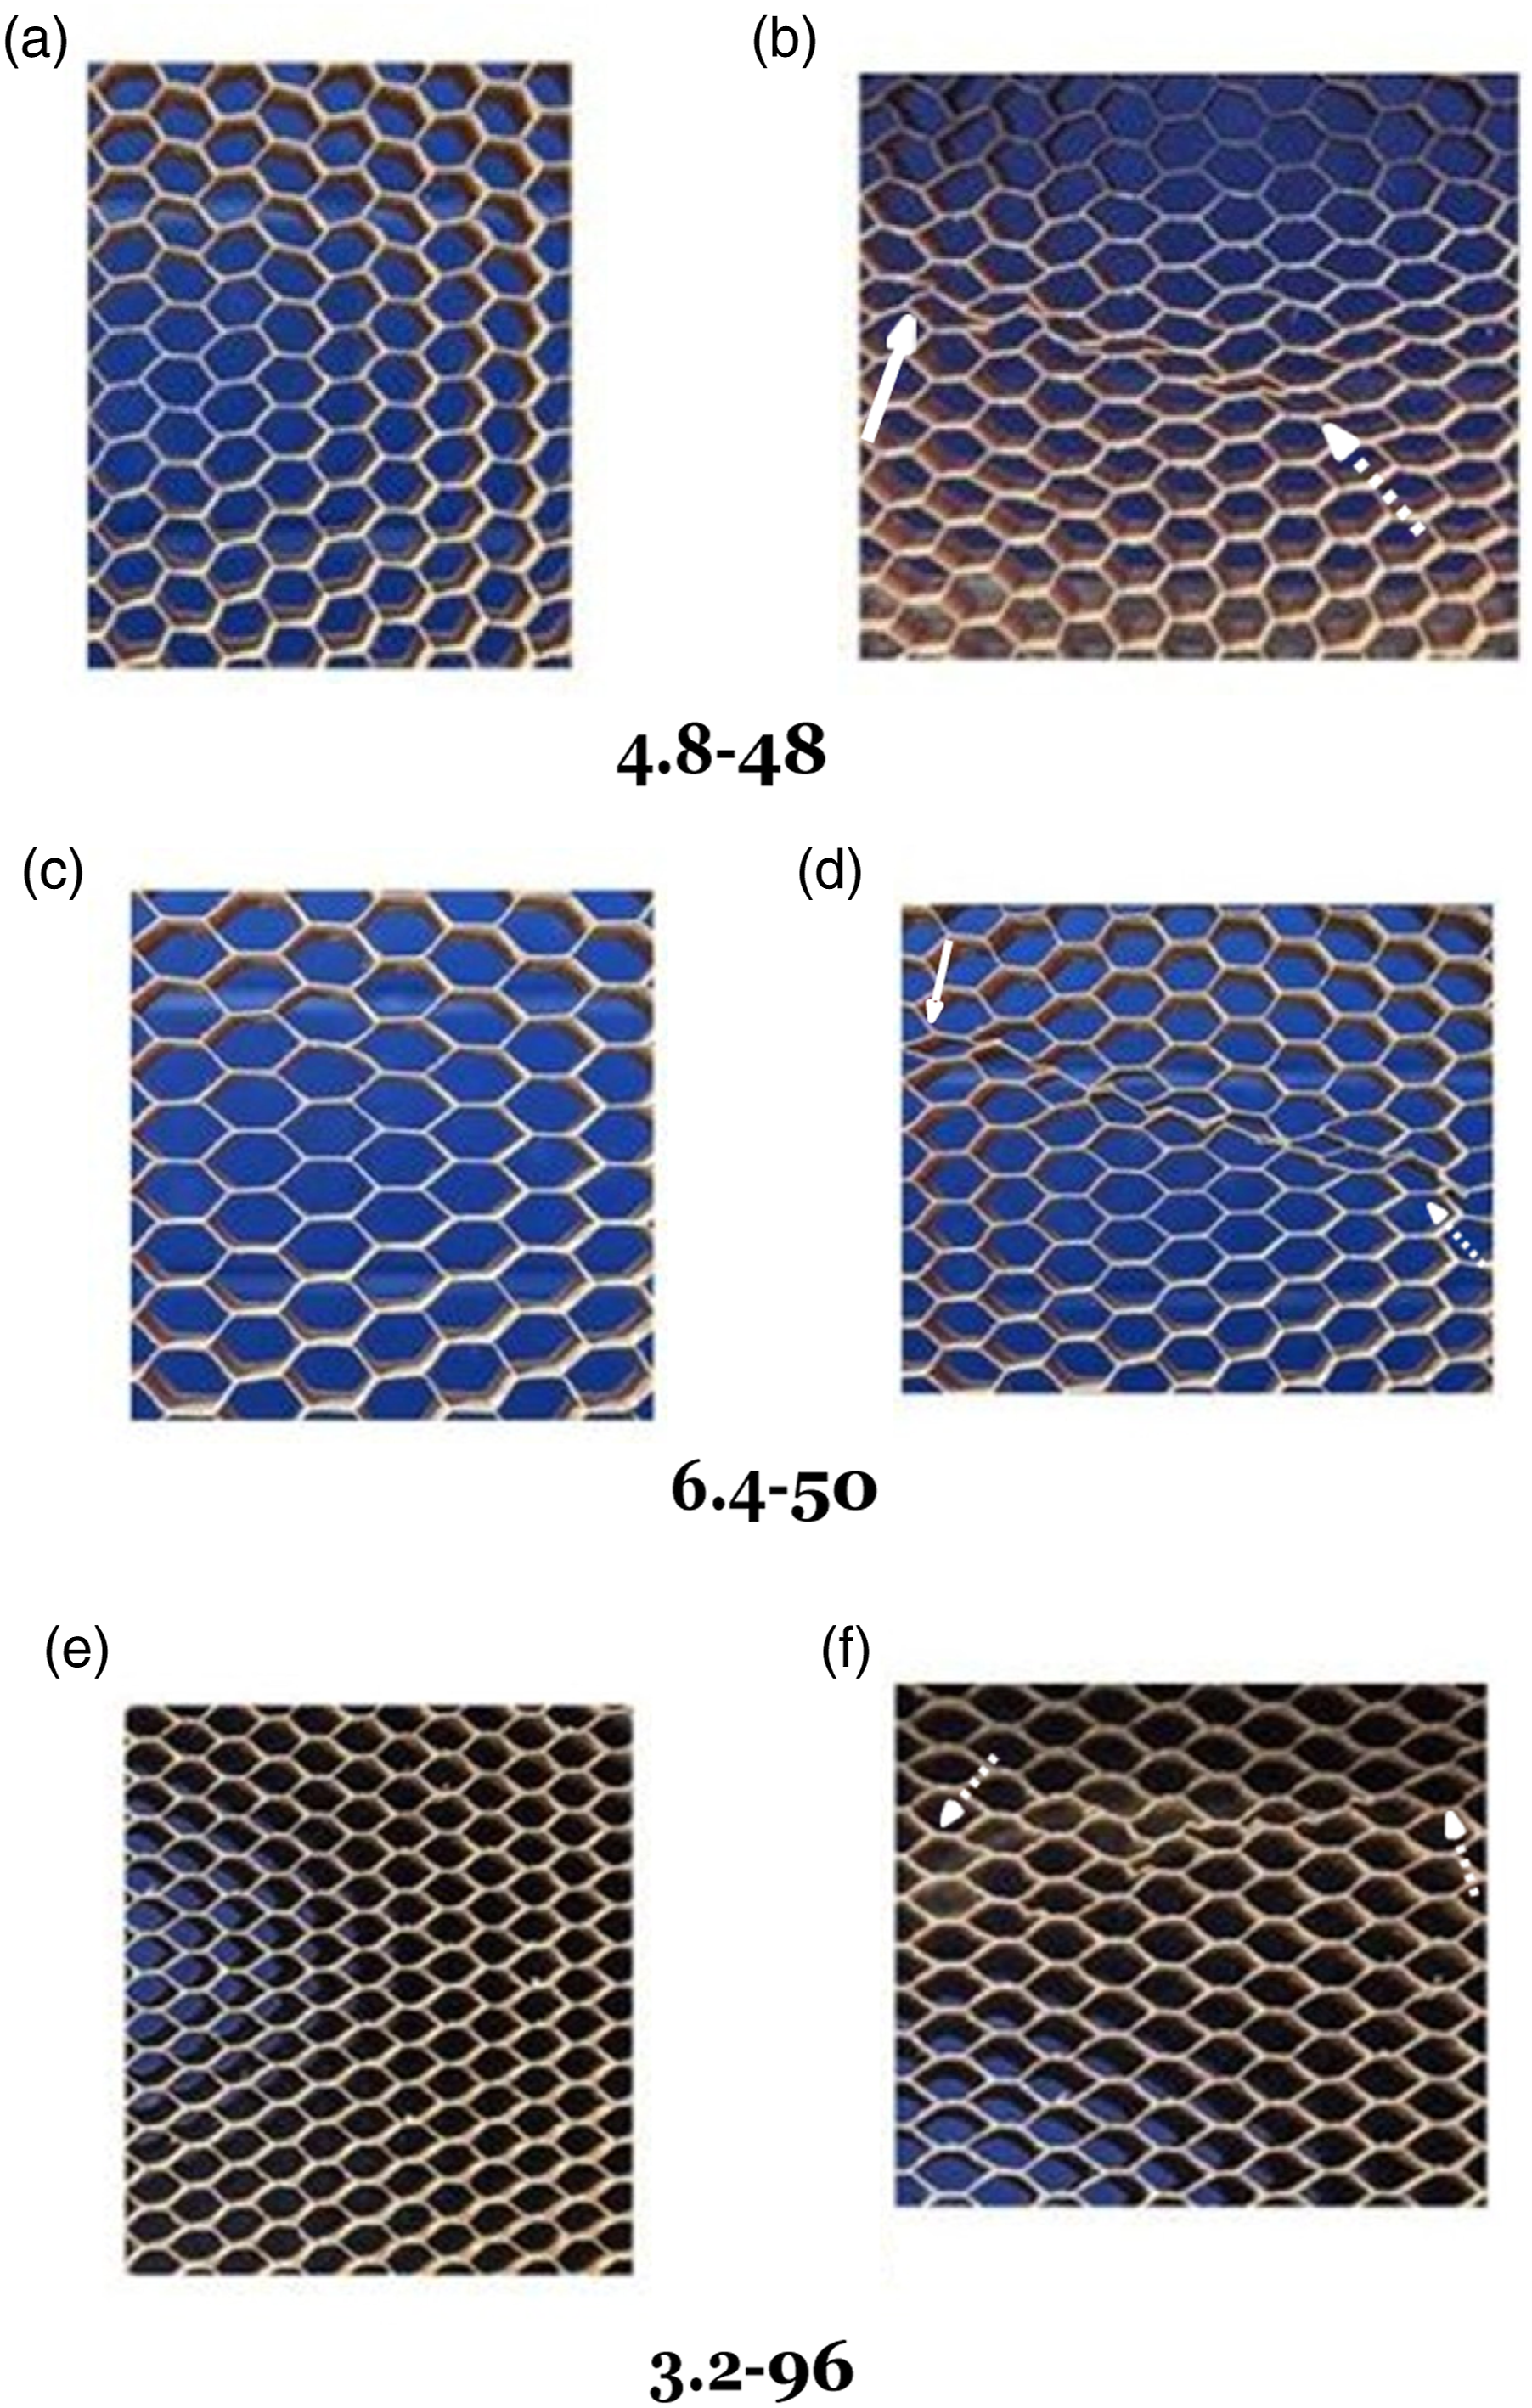
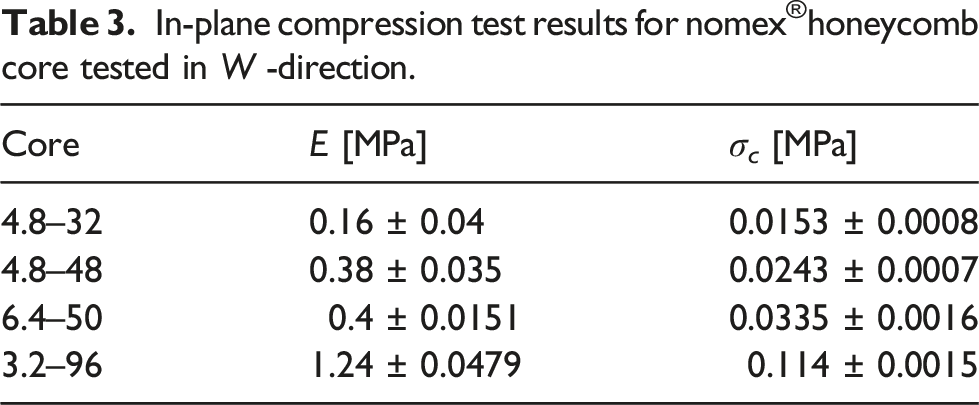
Compression test results
In-plane compression test results for nomex®honeycomb core tested in W -direction.
Unit cell analysis
Modulus and strength ratios (L/W) for the various core types examined. E L and σ c (L) data are from. 23
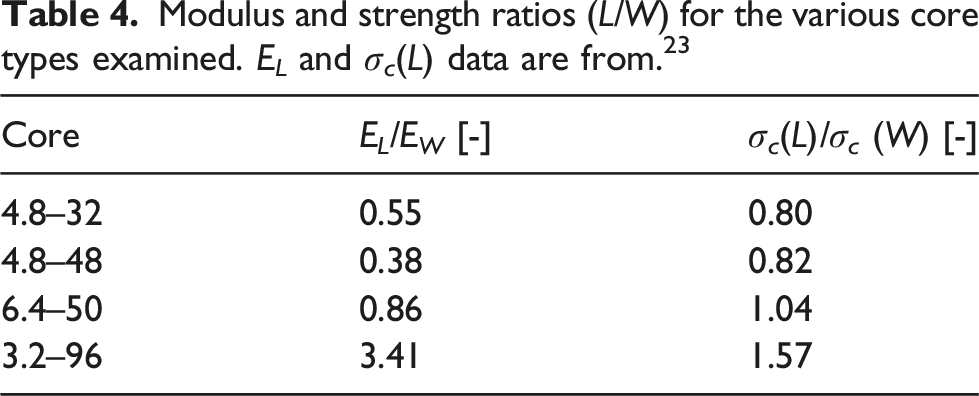
It is noted that the ratios deviate from the isotropic value (1.0) for all cores, although the ratios for the 6.4-50 core are relatively close to 1. Most cores have ratios below 1, except 3.2-96 which has much greater modulus and strength in the L−direction than in the W -direction.
Predicted modulus and strength ratios for the honeycomb cores examined.
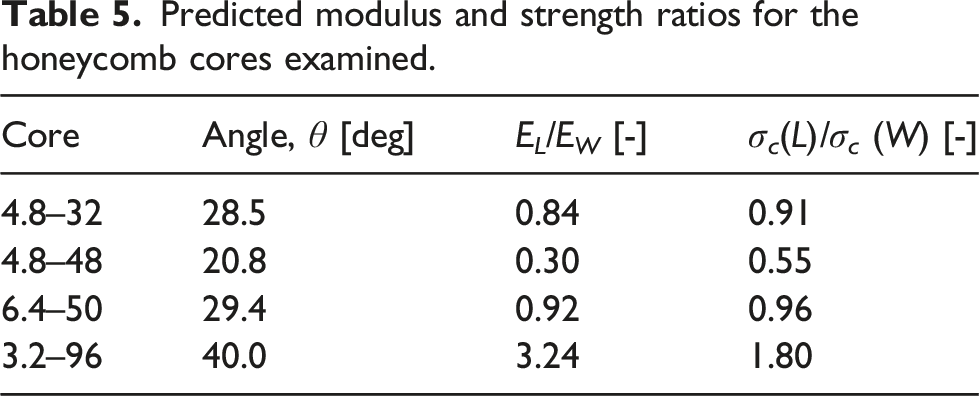
Comparison to the experimental modulus and strength ratios listed in Table 4 reveals that the predicted ratios are in reasonable agreement with measured values. The results support the identification of angle, θ, deviating from 30 ◦ , as the major reason for the lack of isotropy of the core. The modulus and strength will also be influenced by curved walls as will be discussed later.
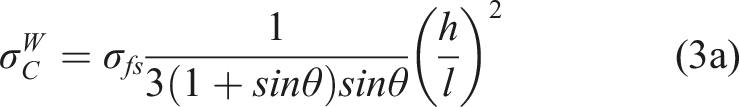
Cell wall modulus and strength
The cell wall modulus E s and compression strength σ fs are required in order to predict the in-plane modulus and compressive strength of honeycomb cores. In addition, use of Equations (1) and (3) require cell wall thickness, h, and length, l, and the angle, θ, of the inclined cell walls. With such information available, and the assumption that the cell walls are flat, it is a straightforward task to determine E s and σ fs from the measured data. In our previous study. 23 , the angle θ was (wrongly) assumed to be θ = 30 ◦ , and the E s and σ fs results may not be accurate. We will therefore revisit our previously reported modulus and strength results for loading in the L-direction. 23
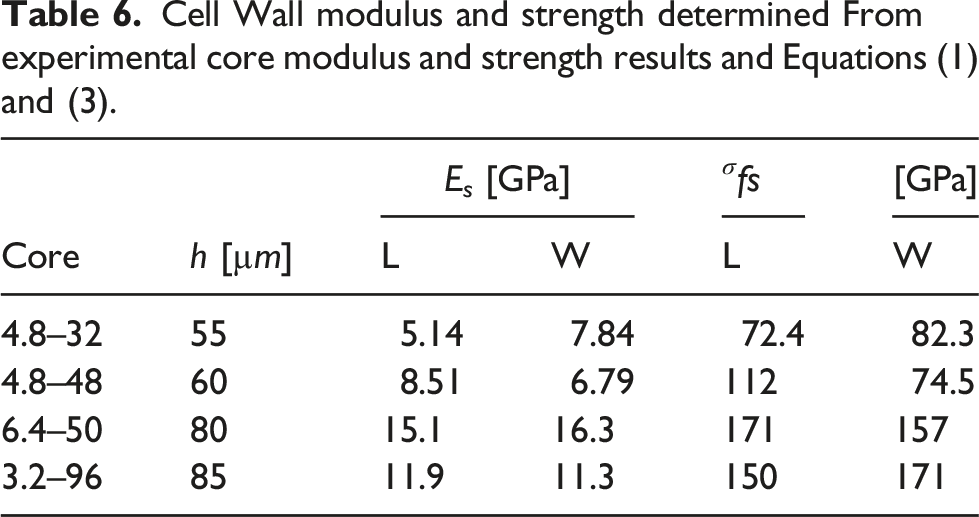
Based on tensile test of Nomex paper, Foo et al. 20 found E MD = 3.4 GPa and E CD = 2.46–GPa. Roy et al. 24 found E MD = 5.20 and E CD = 3.22 GPa, and σ fs is 42.9 and 20.7 MPa in the MD and CD, respectively. Heimbs et al. 25 found E MD = 32.5 and E CD = 30.9 GPa, and σ fs = 578 and 498 MPa in the MD and CD, respectively. Hence, the modulus and strength results in Table 6 (referring to MD) are within the (wide) range of published paper data.
FEA parametric study–influence of rounded cell wall corners and curved cell walls
As described earlier, the effect of curvature of the inclined cell wall is explored using two different models – rounded corner and curved cell wall. For this analysis, core 6.4-50 was considered. The modulus determined from the FEA was normalized with that obtained from Gibson-Ashby approach (θ = 30 ◦ ), 12 E L = E W = 0.28MPa.
Figure 12 shows moduli (E
L
and E
W
) obtained from the FEA. For flat wall, both E
L
and E
W
are in close agreement with the Gibson-Ashby predictions. With increasing corner radius, both E
L
and E
W
decrease. For a corner radius of 0.5 mm, the moduli, E
L
and E
W
decrease by 23 and 35%, respectively, from that of the core with flat walls. For the cell with curved walls, R = 0.83 mm, the moduli decrease even further, especially E
W
. It is noted that curved walls influence stiffness more in the transverse direction (W) than in the L-direction. Hence, curvature of the walls may also cause deviations from isotropy. Influence of cell wall radius (mm) on extensional stiffness in ribbon (L) and transverse (W) directions for the core 6.4-50.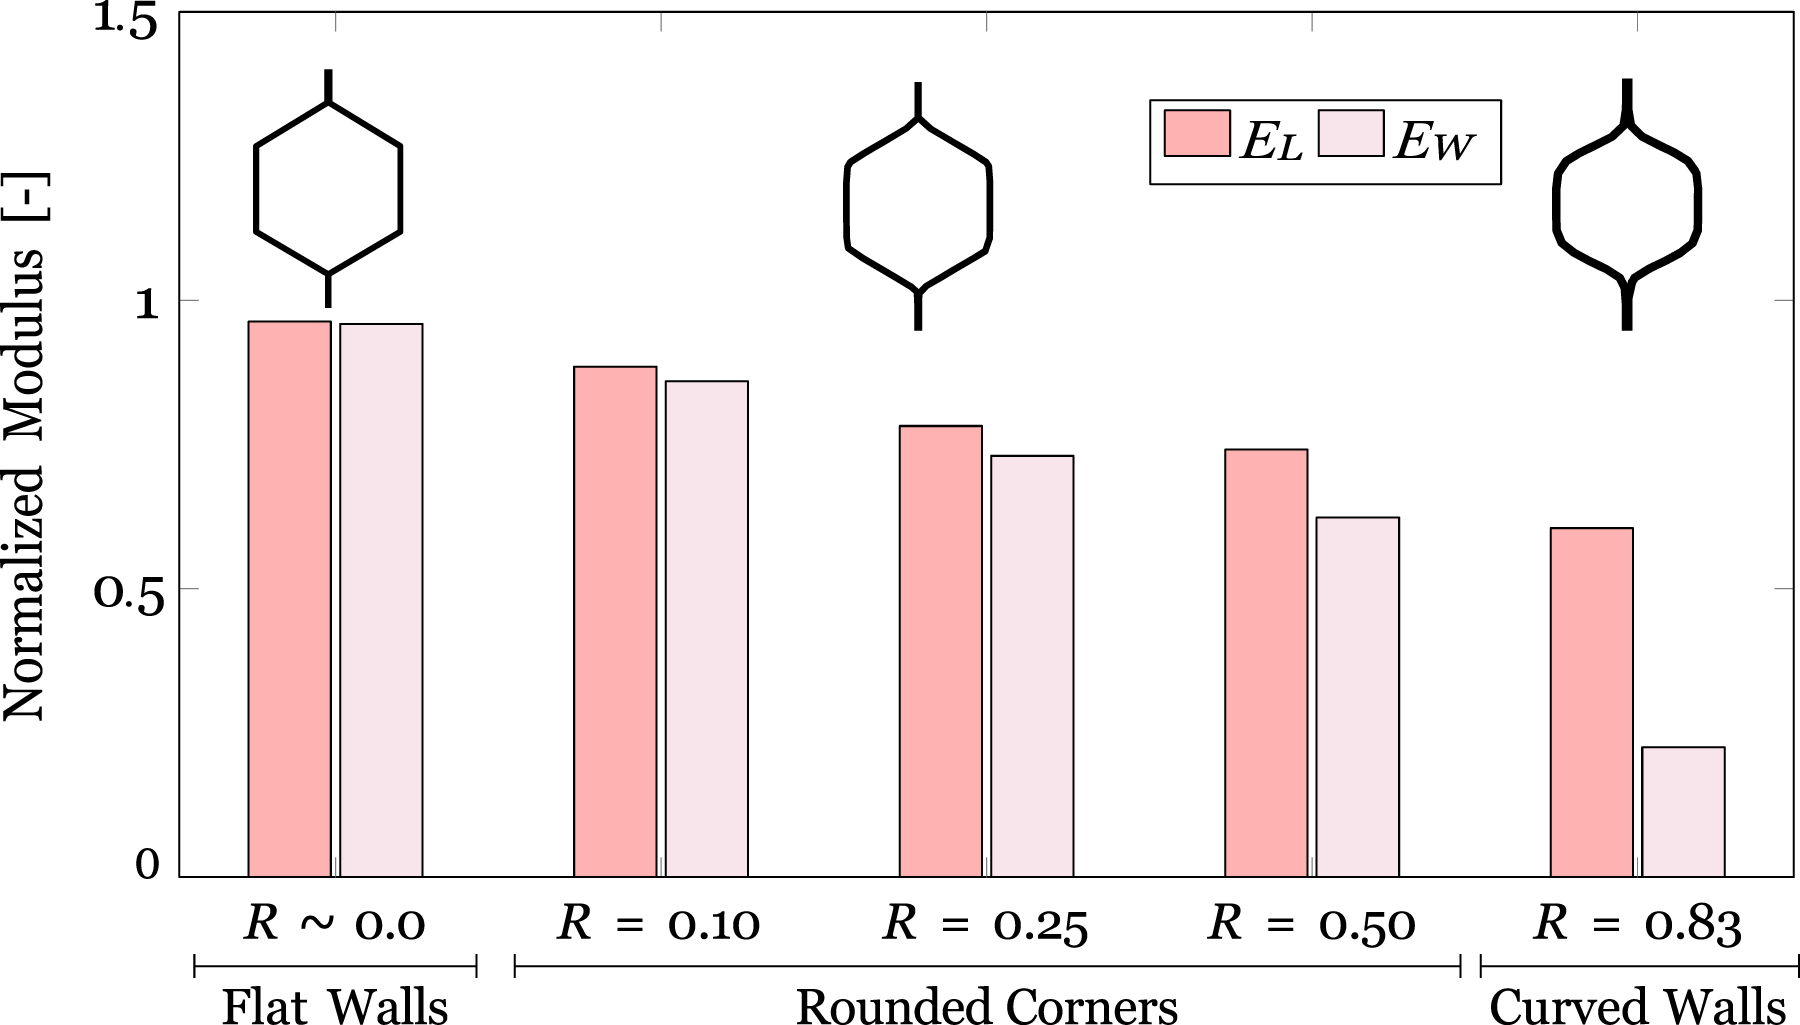
Figure 13 shows Poisson’s ratios (ν
W
L
and ν
LW
) for unit cells with flat walls, rounded corners and curved walls. ν
W
L
and ν
LW
are not strongly influenced by rounded corners but the cell with curved walls (R = 0.83 mm) has reduced Poisson’s ratios. Notice that νWL ≃ νLW for all cases. Influence of cell wall radius (mm) on Poisson’s ratios, ν
WL
and ν
LW
, for the core 6.4-50.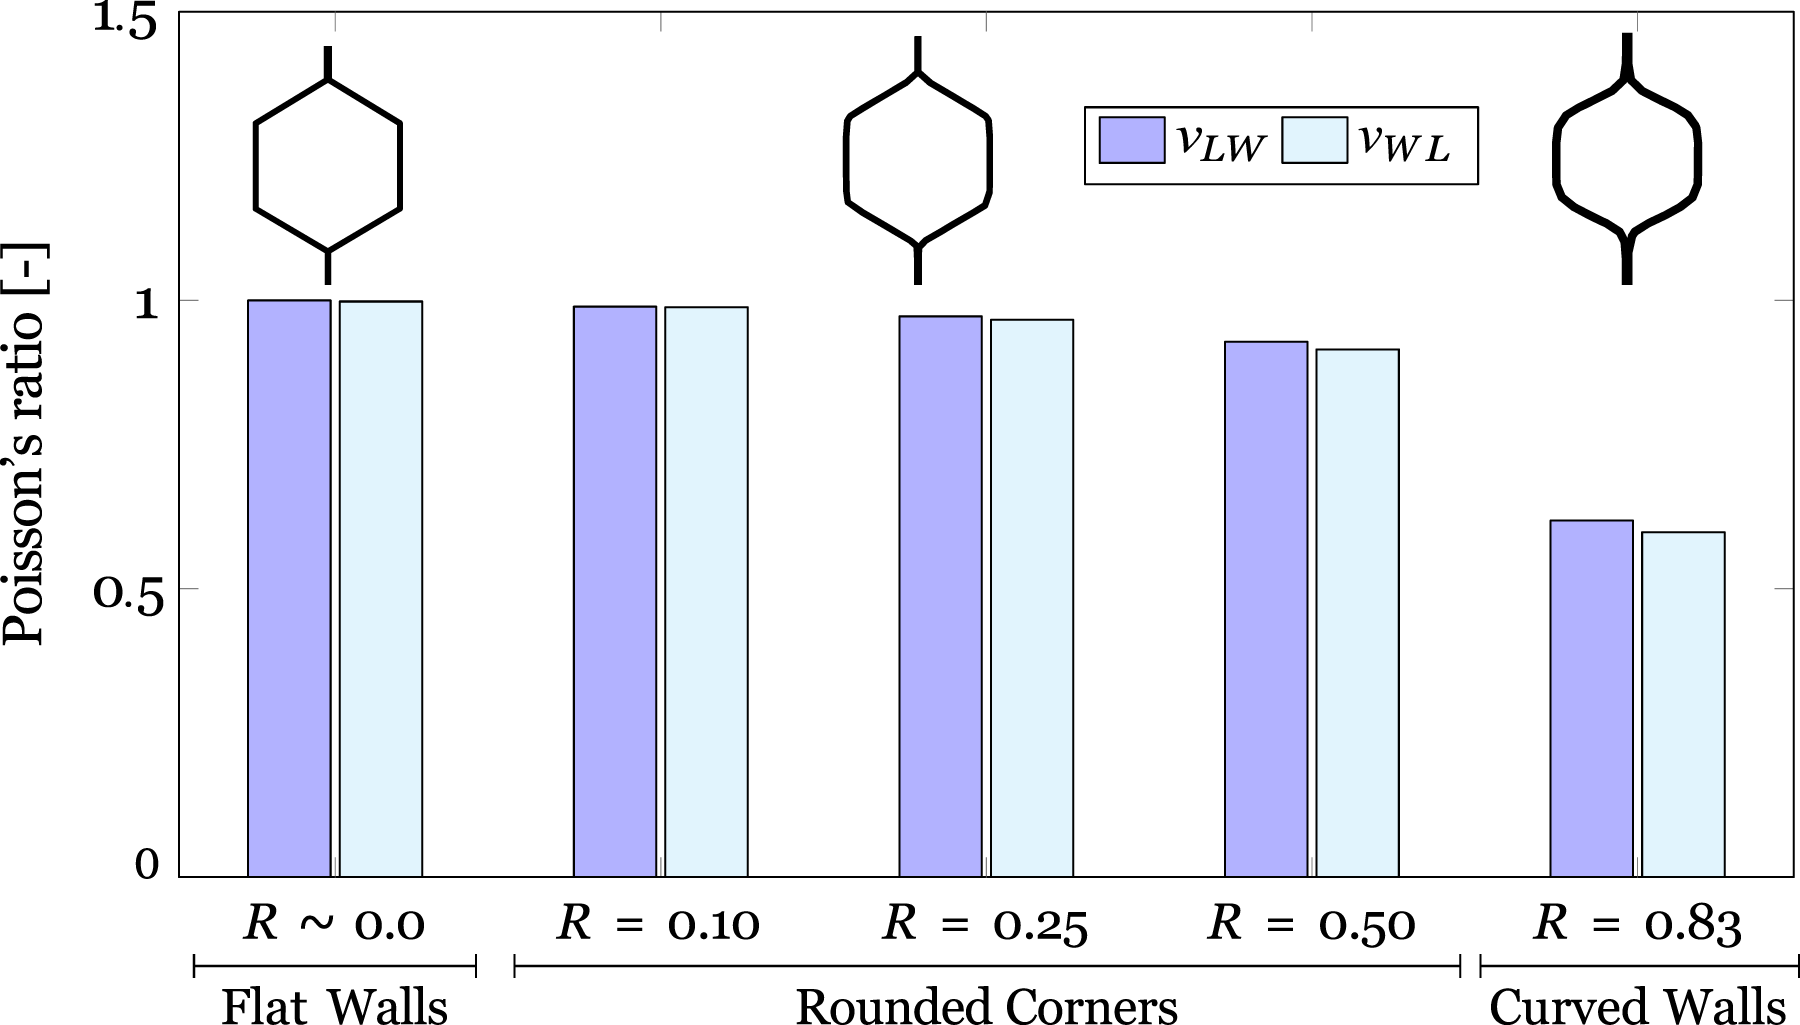
Influence of cell wall curvature on bending stress
The unit cell FE-models were also used to examine the influence of cell wall curvature on bending stress. The bending stress was calculated using FEA through stress linearization, where the stress distribution along a line was considered [see inset in Figure 8(a)]. In the Gibson-Ashby formulation, 12 the bending stress in the inclined cell wall is computed from ordinary straight beam theory, equation (2). The stress path was chosen across the cross-section of maximum stress. The stress calculated from FEA at a given far-field stress (σ L or σ W ) is normalized with the maximum stress obtained from the Gibson-Ashby relations provided by equation (2).
Figure 14 shows the bending stress, σ
FEA
/σ
G−A
, plotted against cell wall radius. The FEA stress results for the cells with flat walls (R ∼ 0) agree closely with Gibson-Ashby analysis results in both direction (L and W). For cells loaded in the L-direction, the stress is not much influenced by the radius of curvature. For cells loaded in the W-direction, the stress increases with radius. The highest stress for W-direction loading occurs for R = 0.83 mm. The maximum stress is ∼ 60% higher than that for flat walls. Thus, the cell wall curvature has larger influence on the bending stress in the W-direction loading than in the L-direction. For the core with angle, θ ≃ 30
◦
, 6.4-50, the experimental strength ratio is close to 1.0 (see Table 5) which may be due to relatively small curvature for this core. Bending stress (normalized) in ribbon (L) and transverse (W) direction for the core 6.4-50.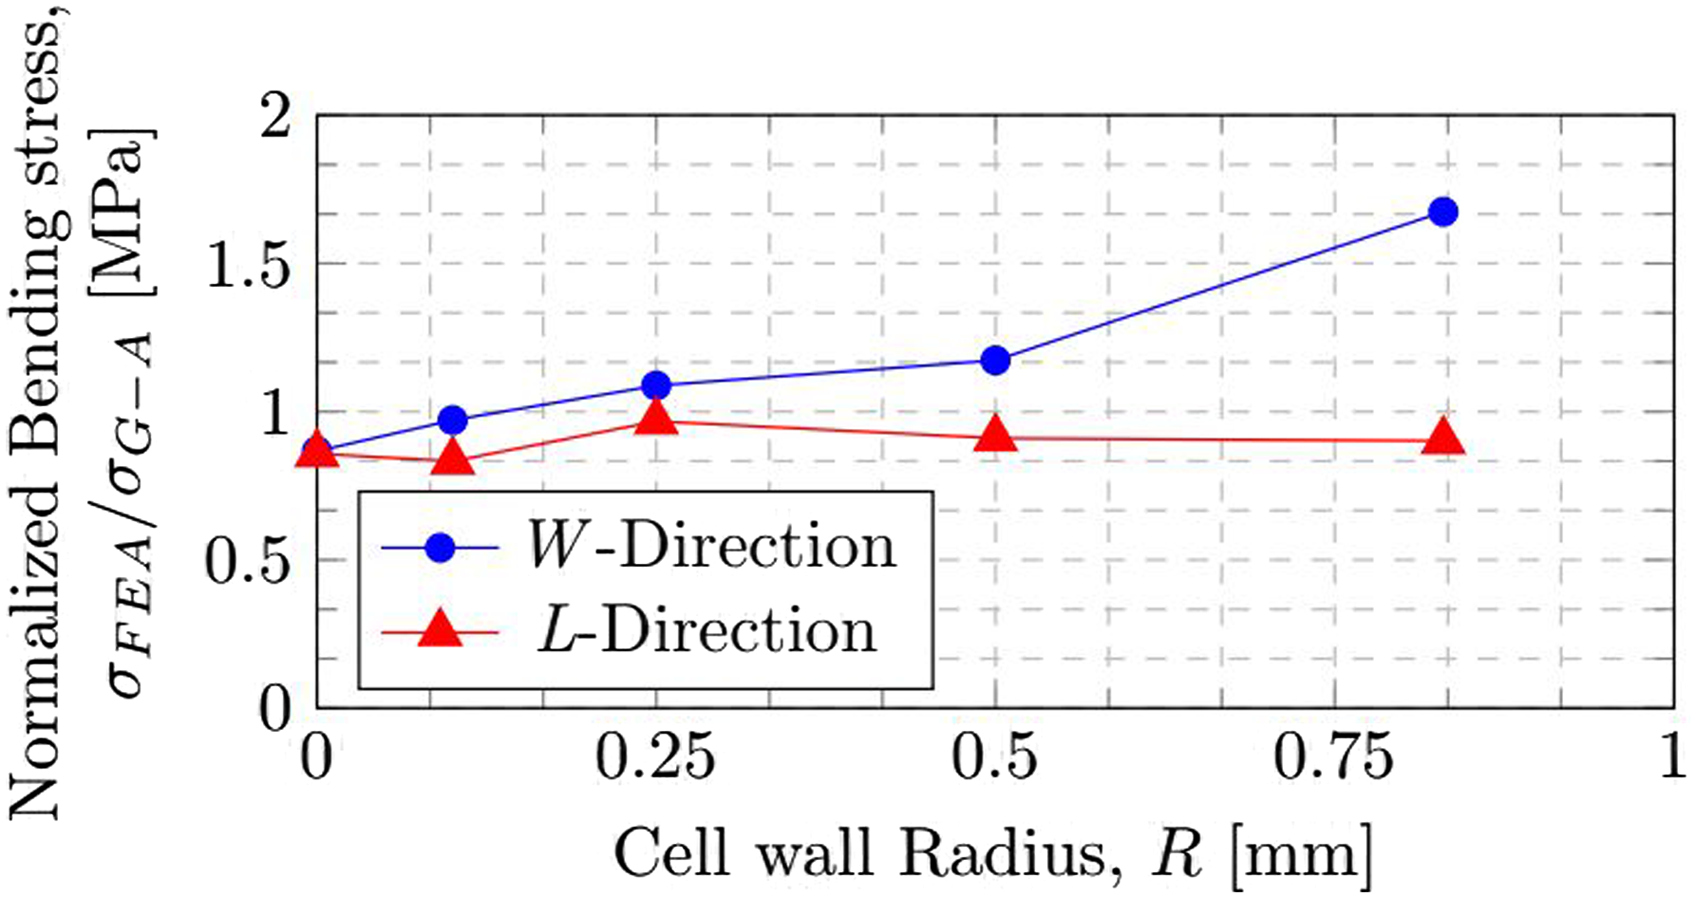
Implications for MMB and ENF test specimen design
The results found in this study show that relatively small imperfections of the honeycomb core structure, especially deviations in the angle θ, of the inclined cell walls from 30 ◦ , have a strong influence on the effective stiffnesses and strengths of the core material. Rounded corners and curved cell walls cause additional deviations in the properties of the core, but the effect is less than those caused by the cell wall angle deviations.
For angles, θ, less than 30 ◦ , the results in Table 5 reveals that the modulus and strength ratios (L/W) fall below 1.0, while the ratios exceed 1.0 for angles greater than 30 ◦ . For MMB and ENF testing, a stiff and strong core is beneficial for a successful fracture test. Hence, if possible, the cell wall angle, θ, should be checked, and based on the results, the stiffer and stronger direction of the core should be aligned with the axis of the beam specimen, that is W direction if θ < 30 ◦ and L direction of θ > 30 ◦ . For the purpose of specimen design, the effective core modulus and strength may be estimated from the Gibson-Ashby unit cell models and the average cell wall material properties listed in Table 6. A parametric study on influence of deviations of cell wall angle is provided in Appendix A.
Conclusions
Imperfections of the hexagonal cell structure such as the angle of the inclined cell walls being different from the ideal 30 ◦ , and rounded corners and curved cell walls have been examined. Deviations of the angle from 30 ◦ were found to be the major cause of deviations from isotropy. The modulus and strength of a range of Nomex®core specimens were experimentally determined. Predicted modulus and compressive strength ratios (L/W) from the unit cell model were in reasonable agreement with measured ratios. Rounded corners and curved walls were found to reduce moduli in both L- and W-directions, more so in the W-direction. The Poisson’s ratios remained largely unaffected by curvature, except for a core with highly curved walls. The cell wall curvature was found not to have a very strong influence on modulus and maximum bending stress in the L-direction, but cell wall curvature reduced modulus and increased bending stress for cores loaded in the W -direction. The modulus and strength of the solid cell wall material were backed out from the unit cell model with a flat wall, and were found to be higher for cores with thick cell walls, and within the range of published values. Implication of the results for design of MMB and ENF test specimens are discussed.
Footnotes
Acknowledgements
Drs. Ronald Krueger and Zhi-Ming Chen were the project managers. Thanks go to Mr Barry Milward of Eurocomposites and Prof. Dan Adams, University of Utah, for the supply of core material. Dr Falk Hähnel of Technical University of Dresden provided useful information on the cell wall structure.
Declaration of conflicting interests
The author(s) declared no potential conflicts of interest with respect to the research, authorship, and/or publication of this article.
Funding
The author(s) disclosed receipt of the following financial support for the research, authorship, and/or publication of this article: This work was supported by the Initial support for this research to MOA and LAC was provided by a grant from FAA, administered by NIA (Grant Number 16-G-006).