
Abstract
Copper (Cu)-based hybrid composites were fabricated by powder metallurgy, incorporating Graphite (Gr) and Carbon nanotube (CNT) reinforcements at various fractions. The composites were formed using a cold pressing technique and subsequently sintered at various temperatures. The structural properties of the hybrid composites were evaluated using Scanning Electron Microscopy (SEM), Energy Dispersion Spectrum (EDX) and X-ray diffraction (XRD). Hardness, compression, wear and corrosion tests were performed to show the effect of the reinforcements. It was shown that the hardness of Gr and CNT reinforcements have significantly improved the properties of pure Cu. The Cu-Gr-2CNT hybrid composite, which was subjected to sintering at a temperature of 850°C, exhibited the highest level of hardness, showing a significant increase of 51.4% in comparison to the pure Cu sample. While the compressive stresses increased in the Cu matrix with the addition of Cu-Gr, it increased to 350 MPa with the addition of 2 wt% CNT. The hardness value exhibited a similar increase and was measured to be 122 HV in Cu-Gr-2CNT. During the wear tests, the coefficient of friction values fell by 9.2% for Cu-2CNT, by 3.88% for Cu-CNT, by 3.92% for Cu-Gr-2CNT, and by 5.27% for Cu-Gr-CNT, as compared to pure Cu. The comprehensive findings demonstrated that the tests and analyses yielded consistent results, and the utilization of various combinations of Gr and CNT reinforcements enhanced the mechanical, tribological, and corrosion resistance properties of the fabricated hybrid composites. Nevertheless, the combination of Cu-Gr-2CNT yielded the most advantageous outcomes.
Introduction
Today, composite materials are continually being researched and developed, and as new technologies and material compositions improve the qualities of composite materials, new applications emerge and their use expands. Cu and its alloys are widely used in essential industries such as transportation, aircraft, microelectronics, and energy. The demand for Cu and its alloys always requires better mechanical properties as well as additional functional properties such as thermal and electrical conductivity and wear resistance. For these reasons, Cu matrix composites are expected to obtain functional properties by adding reinforcing elements (MMC) with high mechanical and physical properties. 1 Metal matrix materials are usually produced by casting or powder metallurgy,2,3 but after casting, composite materials can be reinforced with dispersion particles, pletelets, non-continuous fibers and continuous fibers. 4 Besides the use of carbon fibre structures, carbon nanotubes (CNTs) and graphite (Gr) are considered as the important reinforcements for metal matrix composites (MMCs) due to their superior thermal conductivity (3000–6000 W m−1 K−1), strength and elastic modulus. 5 Although nano-carbon materials have made continuous progress in the field of reinforced MMCs, unfortunately, the reinforcement efficiency is still not satisfactory. 6 To overcome homogeneity, besides single Gr or CNTs as reinforcement, some researchers have used hybrid reinforcements such as CNTs-SiC/Cu, GNPs-diamonds/Cu and Gr-Al2O3/Al.7,8 In another study, the mechanical and tribological properties of the composite material were improved by SiC reinforcement of Cu matrix at different ratios. 9 In this context, new composite materials are continuously being developed by combining various reinforcing elements, but none of them have been able to replace copper and its alloys, which are widely used in engineering applications due to their high thermal, electrical and chemical stability.9–13 Although Cu is generally a good conductor, it has been emphasized that its electrical conductivity decreases as a result of the fact that each layer added in composite materials acts as a kind of barrier and carbon forms an amorphous structure.14,15 Cu and its alloys are in high demand in machinery, electronics, electrical and other industries due to their good conductivity and mechanical properties. Due to the variety of applications, intensive studies have been carried out to improve Cu alloys and their performance. 16 In particular, GO + CNT hybrid was used as reinforcement in MMCs to improve their electrical properties. 17 Compared to single nanocarbon material as reinforcement, it was found that the reinforcement of GO + CNTs can improve its homogeneity by forming a good network structure, thus increasing its efficiency. 18
To investigate the effect of crystal size and improve the electrical conductivity of composites, it was shown that mechanical properties were improved by increasing the GO content and reducing the grain size through ultrasonically assisted electrodeposition, 19 Furthermore, the effect of Gr orientation on the friction and wear performance of Gr/Cu composite has been investigated by finite element simulation and experimentally. 20 It has been reported that the Gr structure has a significant influence on the tribological properties, resulting in a significant wear resistance. In preferential structures, for example, large-area single-crystalline Cu foil with Gr/Cu (111) orientation was prepared by varying the oxidation temperature, 21 and a large-sized and high-quality Gr film layer was synthesized on single-crystalline Cu (111) foil, exhibiting very good thermal conductivity and ductility when compared to polycrystalline counterparts. 21 Composite products can be obtained not only through Gr doping, but also by reinforcing using hybrid short and long fibers.22–24
In addition to investigating how the addition of carbon nanotubes (CNTs) affects the corrosion resistance of Cu and Al base matrices, which previously had low mechanical and tribological advantages, 25 PANI/CNT nanocomposite was produced by considering that CNTs collected on the surface would increase corrosion resistance. 26 In a research to minimize surface tension energy by adding CNT, the goal was to increase the strength of Cu-CNT, reduce interface scattering, and improve electrical conductivity. 27 As the reinforcing material, Graphite (Gr), has exceptional mechanical properties due to its single monatomic thickness.28,29 It has been observed that it can be utilized to decrease surface wear by enhancing the wear resistance of the material to which it is subjected to distribute frictional forces.30,31 Several approaches have been developed to investigate the internal structure and mechanical properties of Cu/Gr composites. One of the most important requirements of copper-based composites is wear resistance, which mostly depends on hardness and composition. It has been reported that increasing the amount of Al2O3 reinforcement of the composite material produced by powder metallurgy from 5% to 10% increases the hardness and therefore the wear resistance of the material. 10 Powder metallurgy (P/M) is one of the methods utilized for producing Cu matrix composites.32–36 In addition, composite materials were created by hot pressing 20–50 wt% Cr reinforcement into a Cu matrix, and the mechanical and wear resistance of these composites enhanced significantly when compared to pure Cu. 11
Research on Cu-based composites consisting of graphite-reinforced metal matrices has been very limited except for those mentioned above.37–39 Furthermore, the clusters of graphite poses a challenge in achieving homogeneous distribution within the metal matrix. In the field of reinforcement, carbon nanotubes (CNTs) have attracted attention due to their superior mechanical properties, light weight and geometrical properties.40,41 It has been reported that due to the uniform distribution and interaction of GO and CNTs in the Cu matrix, the composite can have high thermal conductivity, mechanical properties, good wear and corrosion resistance. 42
In the literature, it was observed that the studies on Cu-based hybrid composites are insufficient. Therefore, the effect of Gr and CNT reinforcements on copper matrix composites has been systematically investigated. It has been found that the weight ratios of the additives employed, as well as the effect of Gr and CNT and how they affect the tribological and corrosion properties on the primary matrix when used together, have not been adequately examined. In this study, Cu based hybrid composites were produced by cold pressing and sintering at 750°C and 850°C temperatures. Hybrid composites containing 1 and 2 wt% Gr and CNT were fabricated by P/M method and the effects of additive ratios and sintering temperature on the structural, mechanical, tribological and corrosion properties of the fabricated hybrid composites were investigated. 43
Materials and method
Material
In this study, composite materials were produced using different combinations of Graphit (Gr) and Carbon Nanotube (CNT) reinforcement. The flow chart illustrating the processes performed in the experimental study is shown in Figure 1. Flow chart of the hybrid composite production process by P/M, testing, analysis and methods.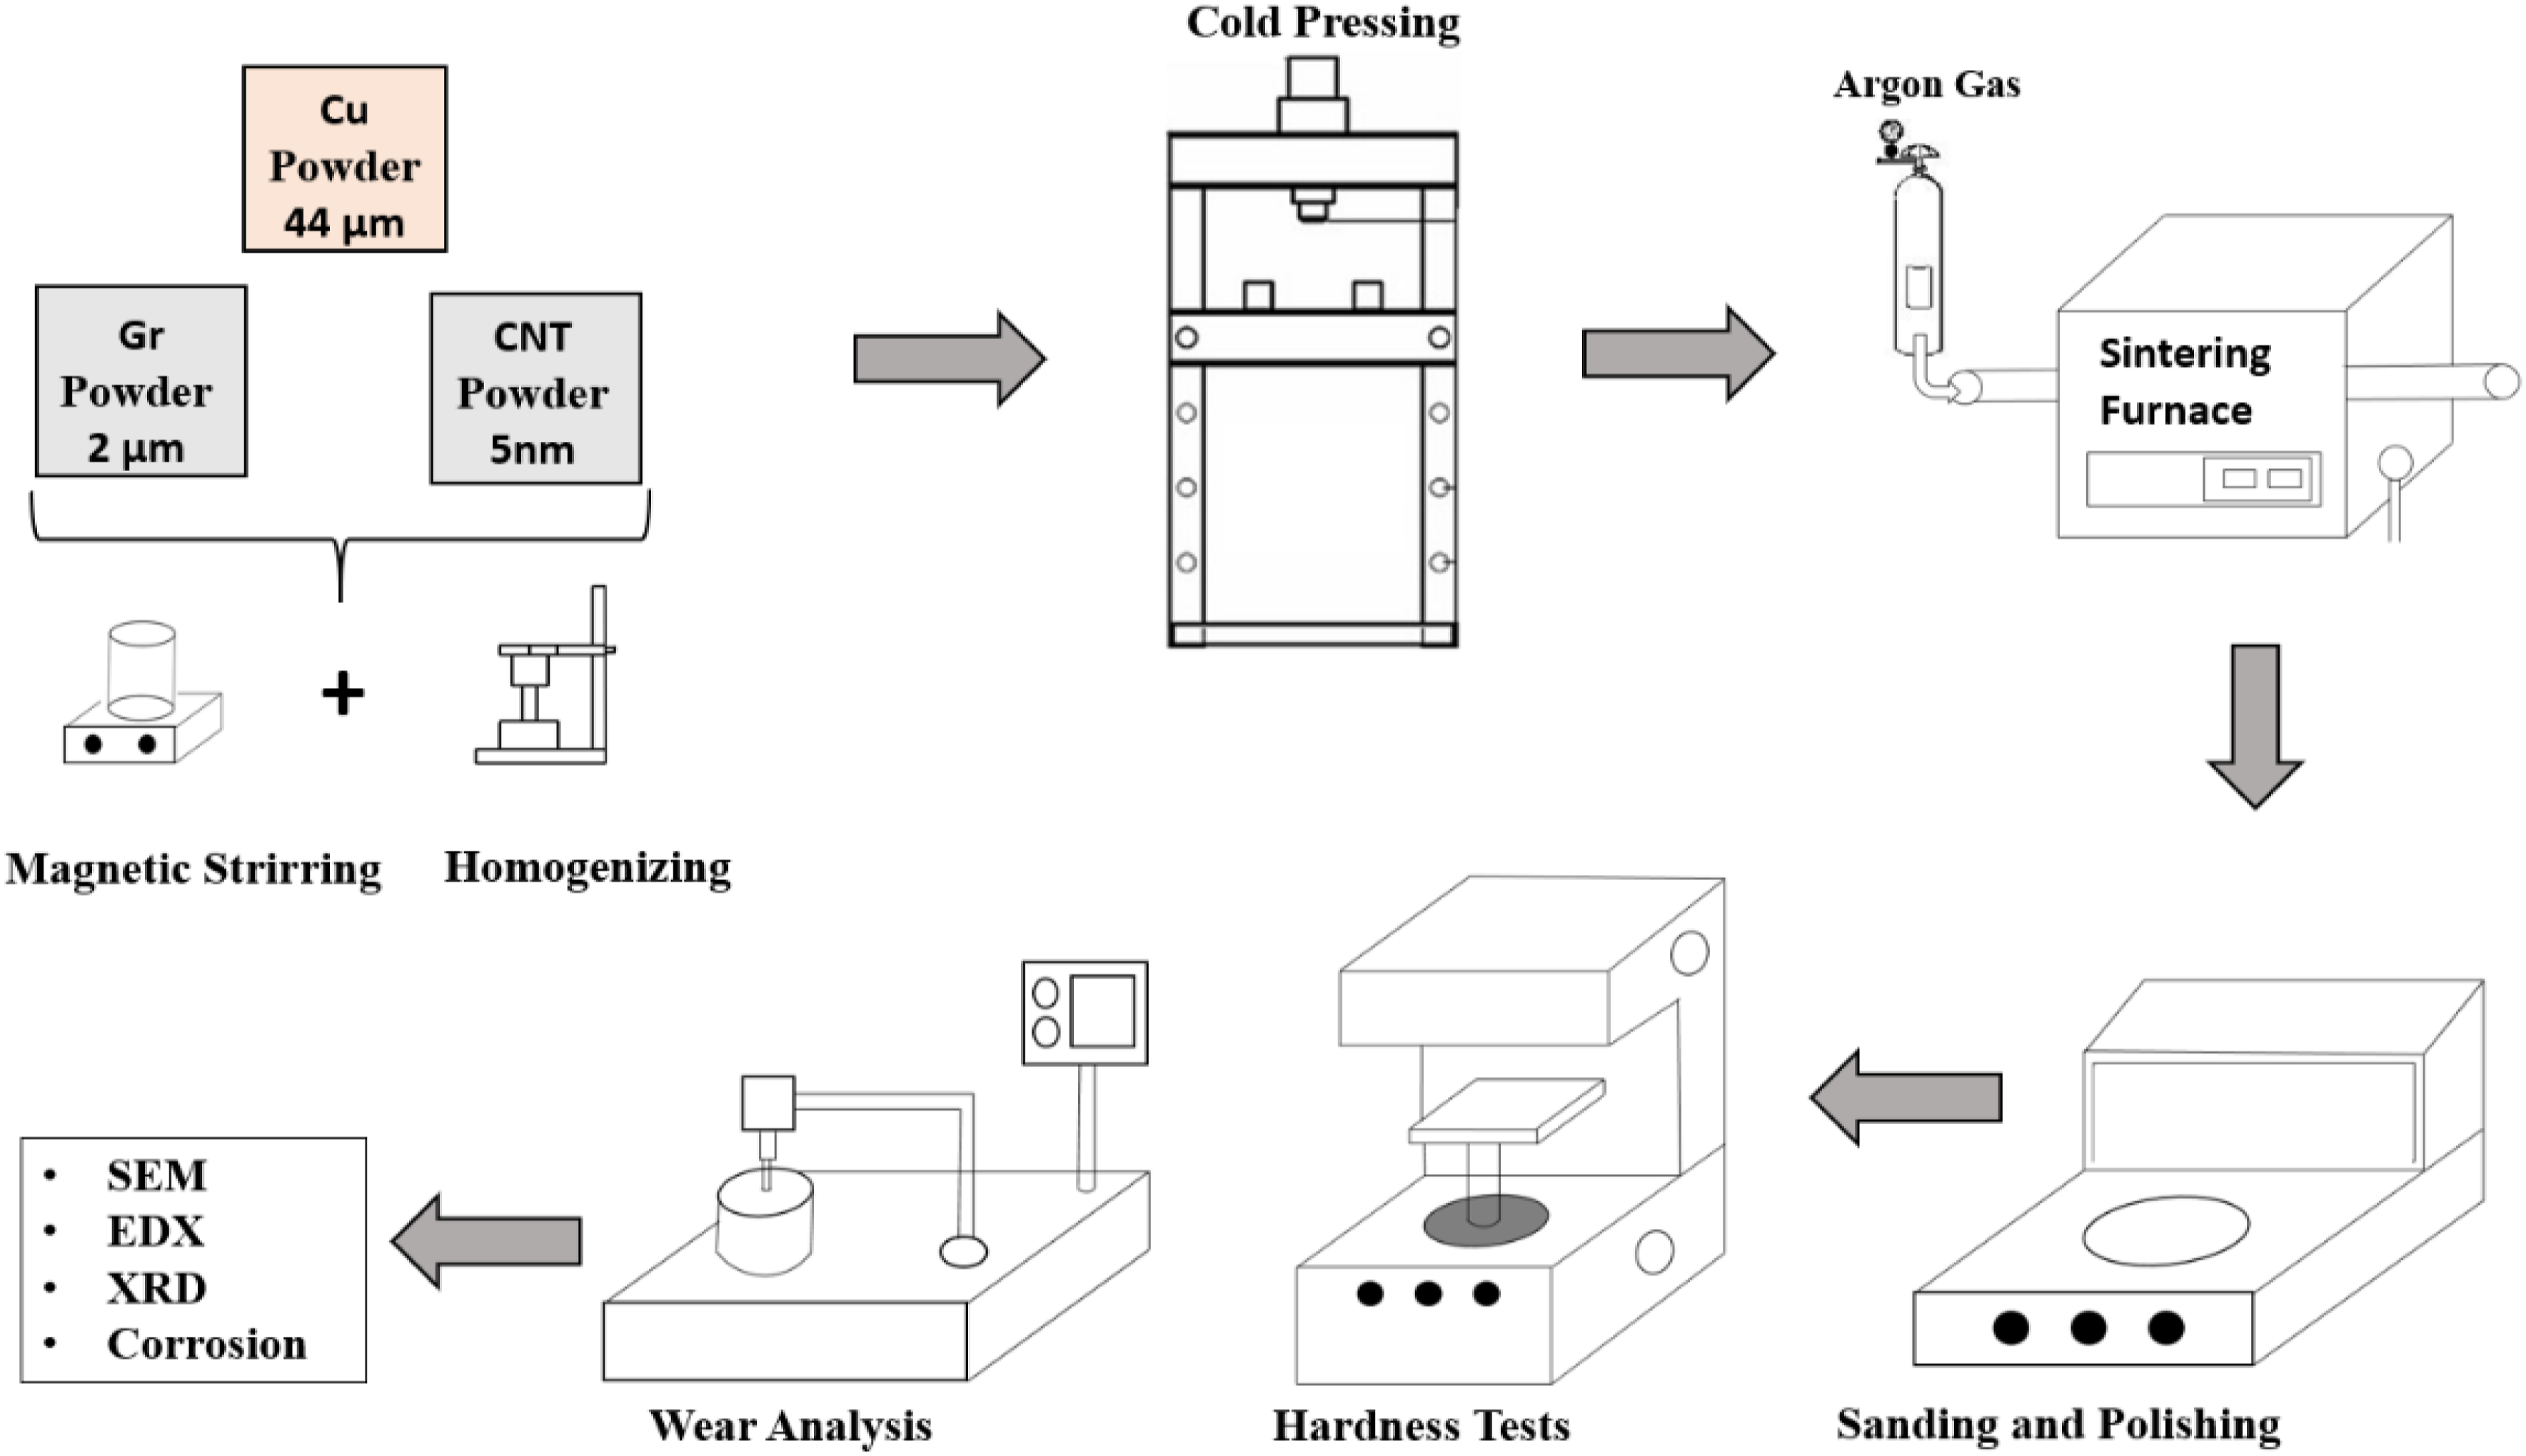
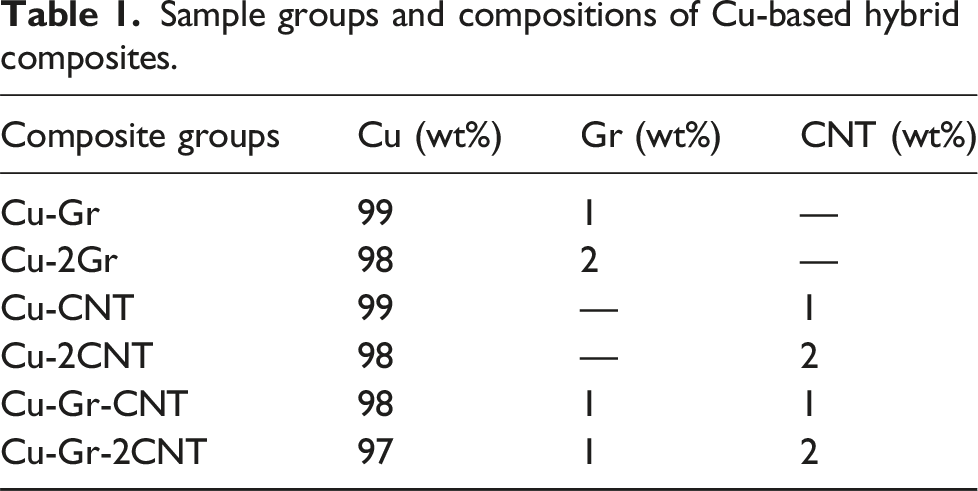
Sample groups and compositions of Cu-based hybrid composites.
Preparation of powders
After their mixing operations were completed, The hybrid composite mixtures were pressed using cold pressing in a pneumatic press (Surkon Int, 20 t, Fırat Univ-SHYO-Research Lab).
The inner surfaces of the mold were lubricated with Zinc Stearate (Zn (C18H35O2)2, Nanografi, Turkey) to remove the powders more easily from the mold after pressing. All the composite samples were prepared and compacted at a pressing pressure of 35 MPa. The compacted samples were sintered at 850°C temperature in an argon (99.99% purity) atmosphere for minutes and then allowed to cool to room temperature.
Preparation of composite samples
After their mixing operations were completed, The hybrid composite mixtures were pressed using cold pressing in a pneumatic press (Surkon Int, 20 t, Fırat Univ-SHYO-Research Lab). The inner surfaces of the mold were lubricated with Zinc Stearate (Zn(C18H35O2)2, Nanografi, Turkey) to remove the powders more easily from the mold after pressing. The composite samples were produced and compacted at a pressing pressure of 35 MPa. The compacted samples were sintered at 850°C temperature in an argon (99.99% purity) atmosphere for 90 min and then allowed to cool to room temperature.
Microstructure and characterization of hybrid composites
After the sintering process, the samples were moulded and exposed to sanding and polishing to examine the microstructure. SEM and EDX (Zeiss EVO MA10- Atatürk Uni-DAYTAM) analyses were performed to show the effects of adding the reinforcing elements. The phase analyses of all groups were conducted using an X-ray diffractometer (XRD) equipped with Cu-Kα radiation (Malvern PANalytical Empyean, Atatürk Univ-DAYTAM).
Hardness, compression and wear tests
Hardness was determined by a microhardness tester (Onalkon- Fırat University- SHYO- Research Lab, Elazig). The values measured from 7 different points were averaged under a 3 kg load for 15 s (ASTM E92-17). The compression tests were based on the ASTM D3410/D3410M-03 testing standard utilizing a universal testing machine. (Besmak, SHYO-Fırat Univ, Elazig) at a 0.5 mm/min crosshead speed at room temperature.
Wear tests were carried out according to ASTM G113-05 standard with a pin-on-disc wear tester (F.Ü-SHYO- Elkimak, Turkey) under dry wear conditions using a steel wear pin under 10 N load, 50 mm/sec sliding speed, and 1000 m sliding distance. The weight losses of the samples were measured every 100 m using a weight lab instrument balance with a sensitivity setting of 10−4. The measured values were recorded, and weight loss graphs were constructed for each sample based on the distance. Over the other process in wear tests, friction coefficients were determined by abrading each sample over a sliding distance of 1000 m and recording the friction coefficient values of the hybrid composites in the wear test device. The recorded coefficient of friction values were transferred to a computer, and coefficient of friction graphs were compared.
Corrosion tests
Based on the mechanical test findings for Gr and CNT doped Cu-based hybrid composites, a corrosion study was conducted on the samples that were sintered at a temperature of 850°C, which resulted in the highest mechanical performance. In corrosion analysis, open circuit potentials for all experimental conditions were scanned in the ±2 V scan range by using Tafel curves. The hybrid composite material was kept in 3.5% NaCl solution for 4000 s under open circuit potential (OCP) conditions and potentiodynamic polarization scans were performed. Figures 10 and 11 (a) and (b) show the potential of corrosion (Ecorr) and density of current (Icorr) values after creating a general Tafel extrapolation (Figures 10 and 11). The determined Icorr values and the corrosion rates were calculated by Faraday’s law (ASTM G-102) are given in Figures 10 and 11. OCP curves stabilized after 1500 s. When the results are examined, it is seen that Pure Cu shows a very inert behavior compared to the other samples. The open circuit potential of the Cu-Gr-CNT sample remained at the bottom of the negative region (−285.1 mV) while the open circuit potential value of Cu-CNT was (−223.06 mV). The stabilized value of Cu-Gr-2CNT was measured as −213.28 mV.
Results and discussion
Microstructure
XRD diffraction patterns of Graphite (Gr) and Carbon nanotube (CNT) doped hybrid composites are shown in Figure 2. XRD analysis showed the formation of C and Cu2O in the Cu matrix structure. XRD analyses showed that the matrix material and reinforcing elements retained their characteristic peaks. Three important peaks of Cu are determined to be in {1 1 1}, {2 0 0}, {2 2 0} crystal planes. XRD analysis shows that the 2ϴ angles of the peaks are at 43°, 51° and 74° for Cu, while the diffraction angle of Cu2O is located is the same as that of lattice structure of the {1 1 1} crystal plane. After the addition of wt. 1–2% Gr and CNT, the diffraction angles of the peaks remained constant, as did the matrix orientation. XRD diffraction patterns of (a) graphite (Gr) and (b) carbon nanotube (CNT) doped hybrid composites produced.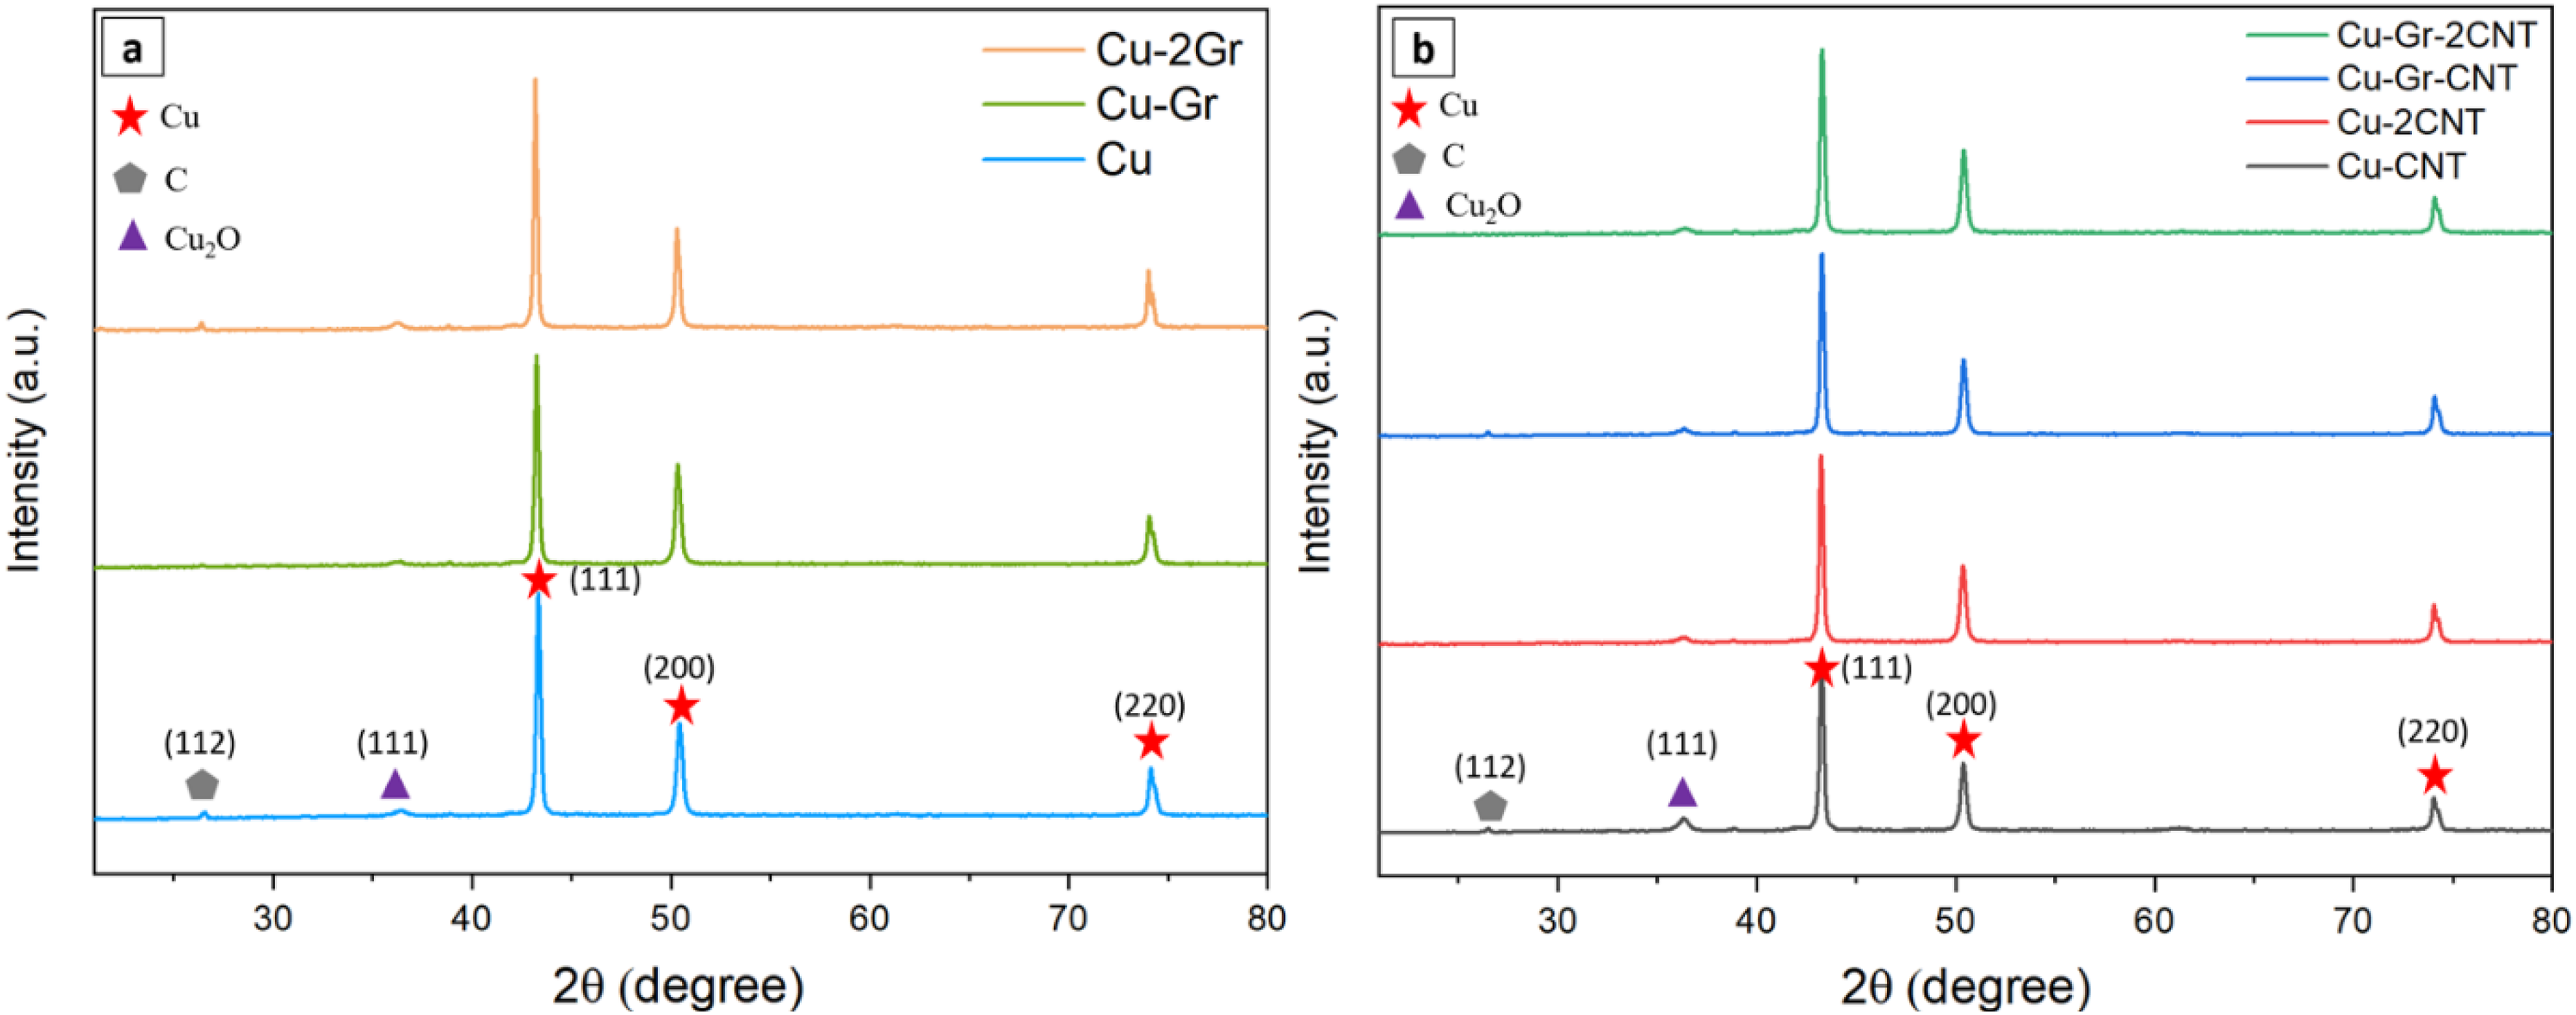
It was seen that the Cu peaks formed by the addition of Gr were not different from the peaks and 2ϴ angles formed after the addition of CNT (Figures 2 and 3). As can be seen from the SEM images given in Figure 3, it is possible to say that the powders are weakly bonded to each other after the sintering process. SEM images of hybrid composites sintered at 850°C (a) Cu-Gr, (b) Cu-2Gr, (c) Cu-CNT, (d) Cu-2CNT, (e) Cu-Gr-CNT, (f) Cu-Gr-2CNT.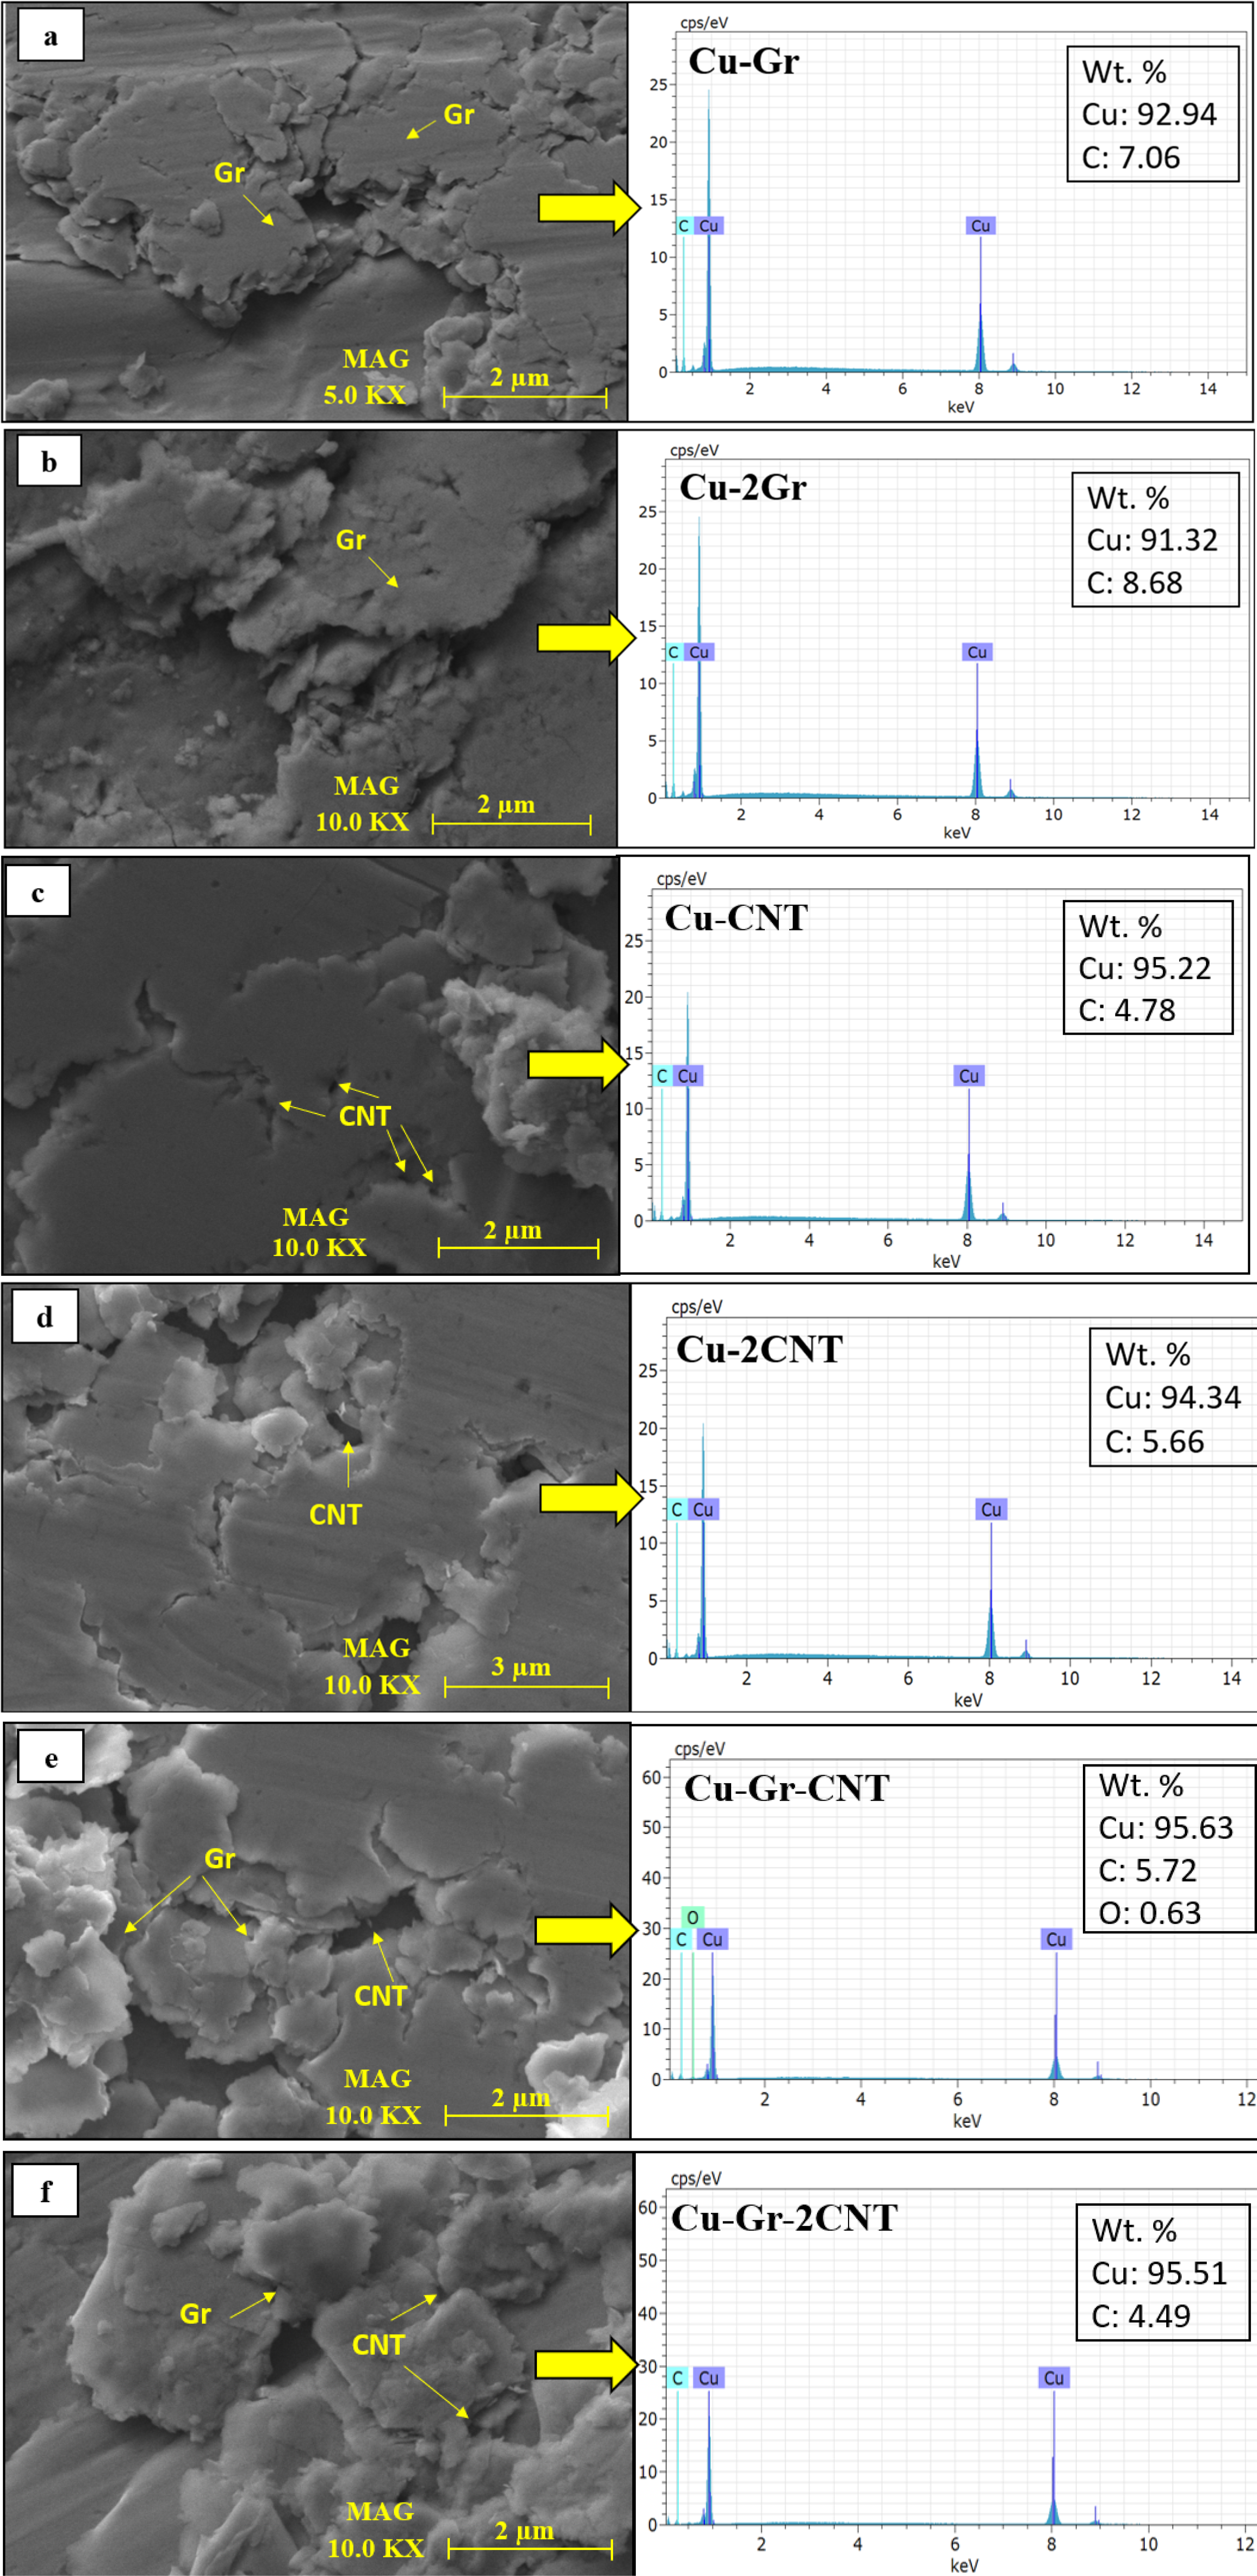
SEM images and EDX analysis of the fabricated and sintered (850°C) Cu-Gr (Figure 3(a) and (b)) and Cu-CNT composite sample microstructure are shown in Figure 3(c)–(f). In these images, for all composite samples, most of the CNTs are clustered at and near the grain boundaries. In addition, Gr was observed to be localized in the pores and grain boundaries in the samples. This can be attributed to the potential problem of dissolution of CNTs in Cu, forcing the CNTs to settle at the grain boundaries of copper while solidifying.28,29 From Figure 3(a) and (b), it can be seen that the graphite particles are homogeneously dispersed in the copper matrix, but the reinforcement phase is poorly dispersed in the matrix phase due to the clusters of graphite. In the SEM image taken at higher magnification (Figure 3(b) and (c)), it is observed that the graphite particles are incorrectly bonded with the copper matrix.
Agglomeration of graphite particles was also observed in these views. It is also thought that low bond formation between copper and graphite and clustering of graphite affect the mechanical properties of composite materials. 30 Energy dispersive spectroscopic (EDS) analysis for the elemental composition of pure Cu and Cu-Gr composites is given in Figure 3(c). It was found that the clustered Gr structures were observed in the copper matrix and CNT showed a more pronounced distribution on the surface and filled the intermediate gaps, strengthening the bond between Cu and Gr after sintering (Figure 3(d)).
In addition, by increasing the CNT content (2 wt %), it was observed that Cu and Gr were freely dispersed in the structure (Figure 3(e) and (f)). The EDS results show that as the graphite reinforcement in the copper matrix increases, the carbon content also increases and the reinforcement phase is well dispersed in copper matrix composites. CNTs, on the other hand, increased the surface area of the powder mixture to which they were added, which is expected to aid in the creation of layered structures between Gr and copper, as well as their ability to connect better. CNTs deposited in the voids also contributed to the formation of a homogeneous structure while causing the structure to have fewer voids. Figure 3(a)–(c) demonstrate increased clustering in the structures generated by Gr added to Cu. The addition of carbon nanotubes (CNT) and graphene (Gr) resulted in the formation of clusters, which reduced the size of the 20 grains. The clustering was more pronounced in the Cu-Gr-2CNT composite (Figure 3).
Compression tests
The concentration of the metal matrix composite (MMC) changed the composite composition with the addition of Gr to Cu making weak bonds. The copper graphite composite, sintered at 750 and 850°C, demonstrated greater compressive strength at all graphite reinforcement concentrations, with the best particle bonding occurring at 850°C. The compressive strength of the composite increased with CNT reinforcement and Cu-Gr-2CNT hybrid composite showed the best strength.
44
The improvement in compressive strength of low concentration graphite reinforced composite specimen is due to the better interfacial bonding between the copper matrix and the reinforcement particles.37,45,46 Single-walled CNT and sheet-forming graphite are actually quite similar in structure. Two standard varieties of SCWNTs (Single Walled Carbon NanoTubes) are most likely found in the sheet generated by graphite coming together (Figure 3). This has a great influence on the electrical and mechanical properties of CNT. The yield stress value of pure copper is 33 MPa, the maximum stress value is 210 MPa.46,47 A significant increase in yield stress was achieved (178 MPa) in Cu-CNT and a maximum stress value of 280 MPa was obtained in the Cu-2CNT composite. On the other hand, with Gr reinforcement, the maximum stress value of the Cu-Gr-CNT composite decreased a little down to 275 MPa. While Gr increased the maximum compressive stress of copper, the addition of CNT resulted in a minor drop of 5 MPa in the maximum stress. If Gr is not mixed homogeneously, the resulting structure is similar to CNT in that it creates a layer-shaped structure; nevertheless, when Gr and CNT are combined, they form a helix and the bond with Gr-CNT will be strengthened. As a result, in Cu-Gr-2CNT hybrid composites increased the maximum stress value to 350 MPa. CNTs having a high modulus of elasticity enhanced the maximum stress in the composite material. An approximately 27% increase in stress was detected when comparing Cu-Gr-1CNT to Cu-Gr-2CNT are compared. According to Figure 4(b), the % elongation value of Cu-CNT composite produced at 750°C sintering temperature is around 25%, while Cu-2CNT is 29% at 850°C sintering temperature.
47
In the literature, Cu-Gr % elongation value is 52%, Cu-Gr-CNT % elongation is 34% at 750°C sintering temperature and 39% at 850°C sintering temperature. In the hybrid Cu-Gr-2CNT composites, the % elongation was found to be 36% at 750°C and 40% at 850°C sintering temperature. The Cu-Gr-CNT composite, when sintered at 850°C, exhibits a substantial improvement in yield, elongation (%), and hardness values, hence enhancing its overall performance. Compression stresses and strains (a) and maximum stresses versus strain values (b) for Gr and CNT reinforced Cu-based hybrid composites with different reinforcement ratios.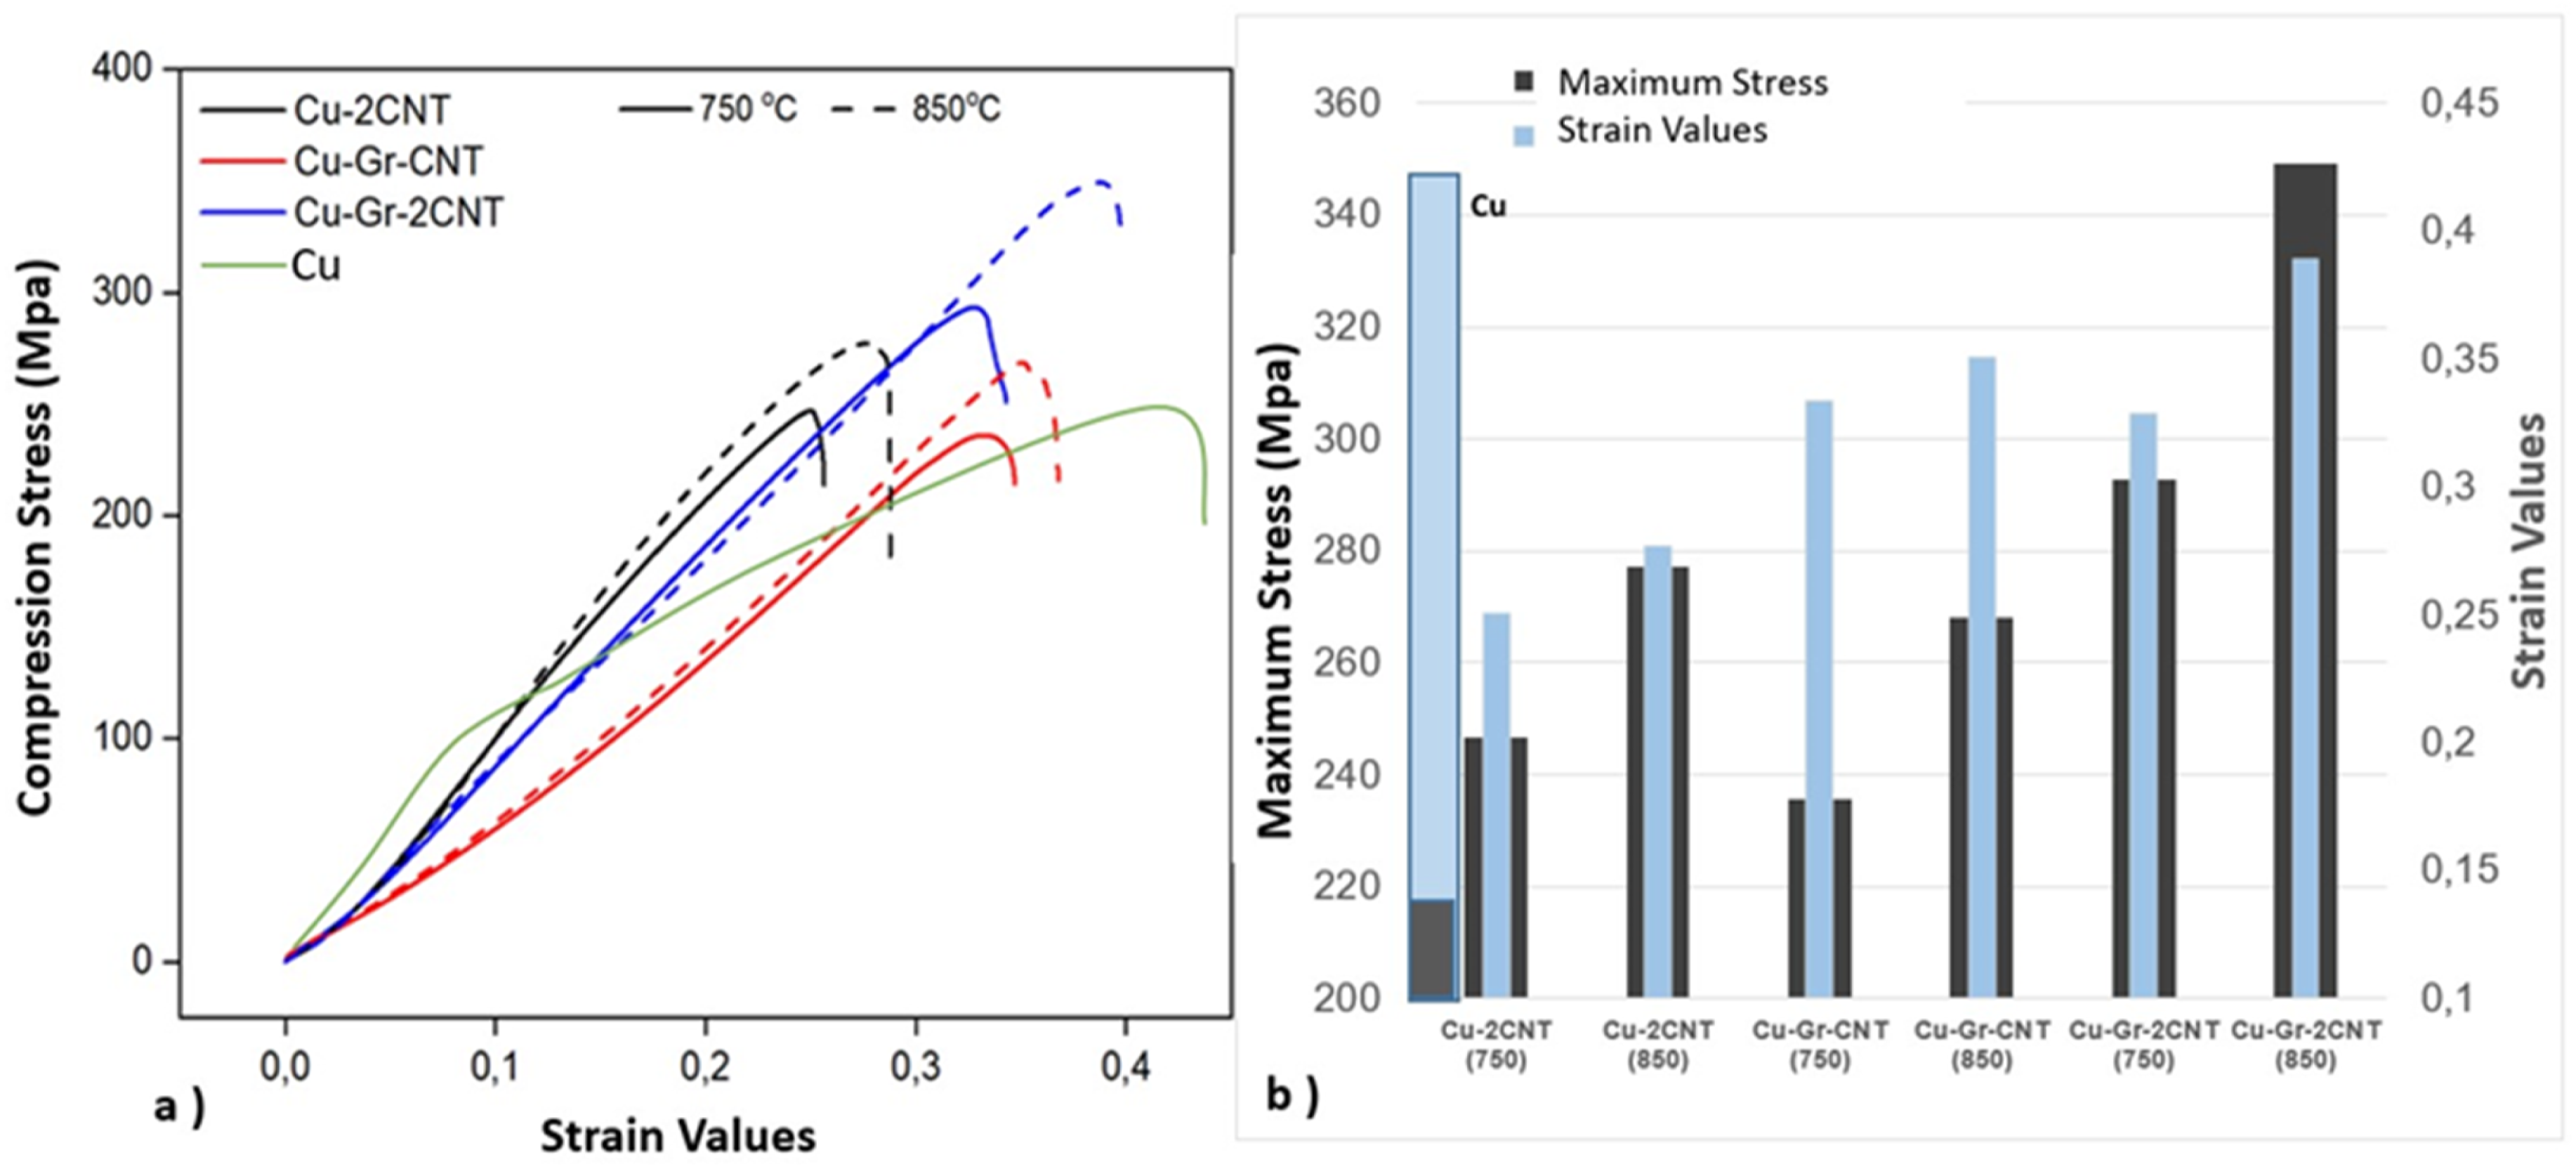
Figure 4 shows that the maximum stress of the composites gradually increases with increasing Gr concentration in Cu-Gr g composites. It has been observed that Gr reinforcement in Cu matrix does not provide much improvement in the maximum stress of composite samples due to the soft structure of the reinforcement phase. 48 Improved compressive stress increase of low concentration graphite reinforced composite specimen due to better interfacial bonding between copper matrix and reinforcement particles. 37
The tensile strength of Cu-Gr composite sintered at 850°C is greater than that of composites produced at 750°C for all graphite reinforcement concentrations. This is attributed to improved particle bonding. The addition of carbon nanotubes (CNT) enhances the compressive strength of the composite material. Among the many samples tested, the Cu-Gr-2CNT hybrid composite exhibits the highest strength. The ultimate compressive strength increased with the help of CNT deposited at the grain boundaries and voids and this highest strength was found in 2CNT doped composite. 49
Under compressive stress, Gr has a high potential energy level with CNT deposited at the grain boundaries and voids in the structure, 45 while the deformation mechanism resulting from compressive stress actually occurs in the centres where this CNT is deposited. During compressive deformation, the wall thicknesses of CNT and Gr rise with compressive stress and form folds to withstand pressure in these structures joined at the optimal sintering temperature, as previously anticipated. These folds enhance compressive stress as the aggregated Gr and bonded CNT attempt to slide over each other.
Hardness tests
Measurements were obtained from seven distinct locations during the hardness tests. By employing the Vickers hardness test, it was determined that the measured hardness of pure copper (80 HV) (Figure 5) closely matched the hardness value reported in the literature.
50
Hardness values of the produced Gr and CNT particle-reinforced Cu-based hybrid composites.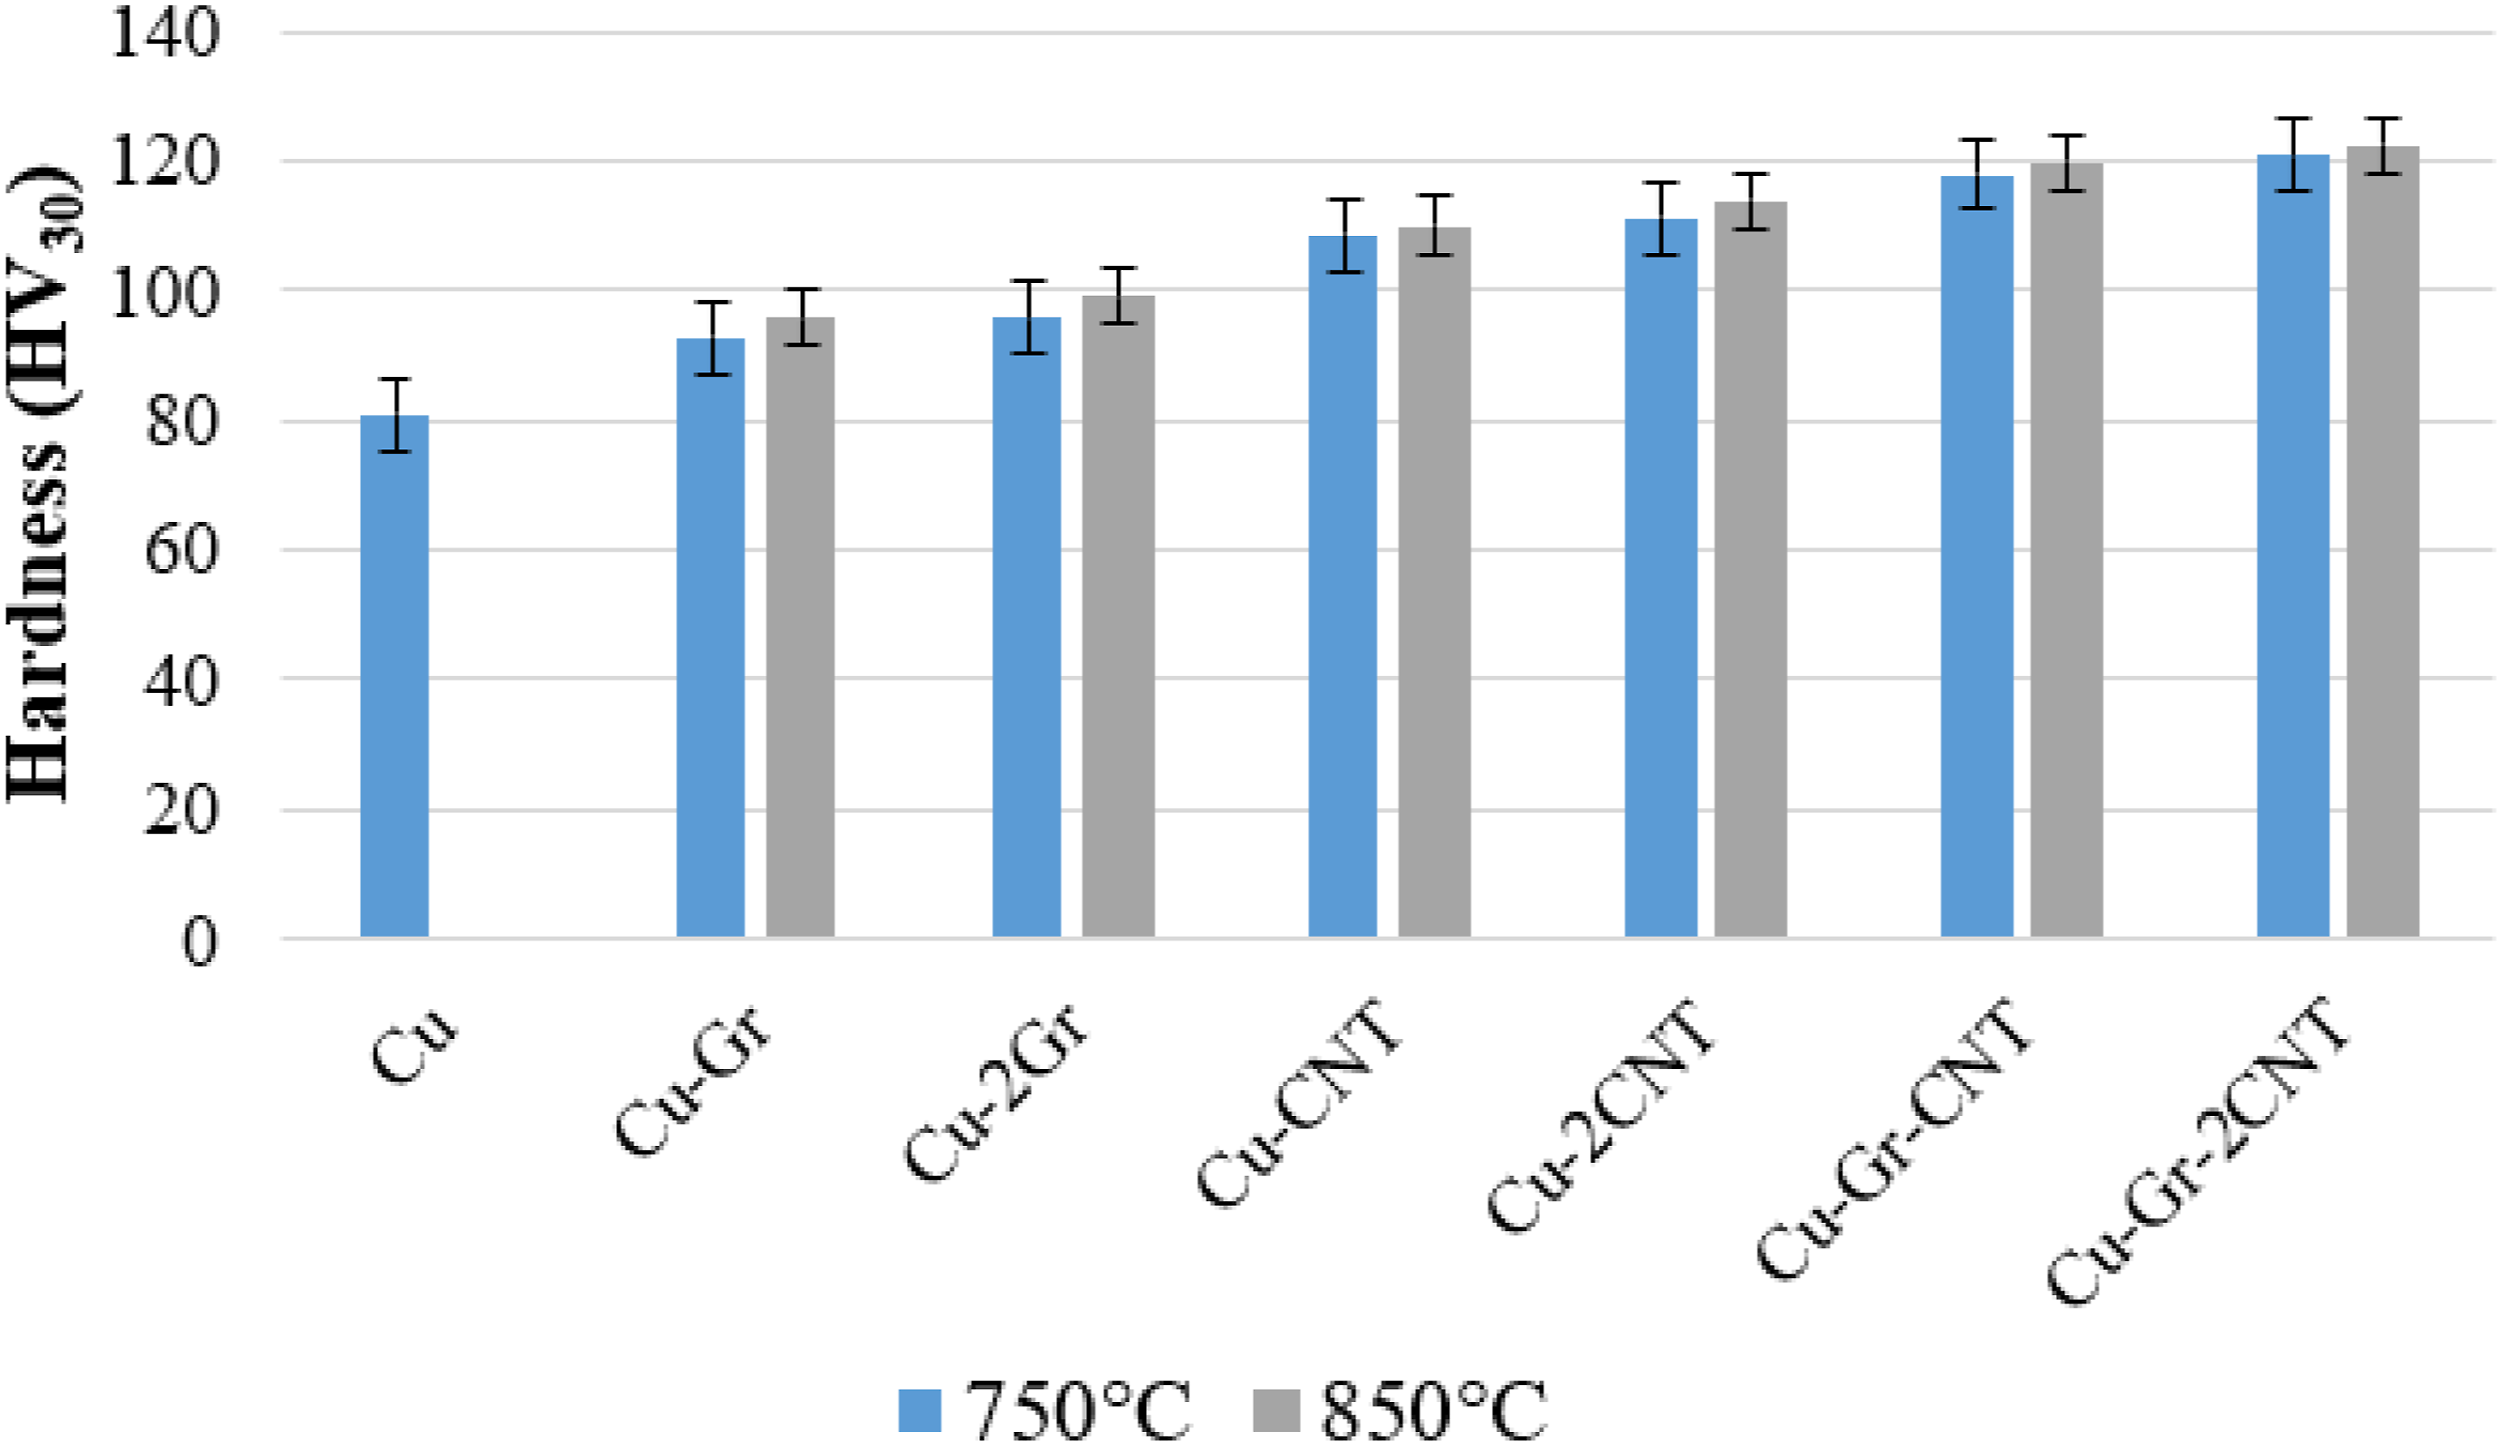
Figure 5 shows the hardness values derived based on the hybrid groups reinforcement ratios. When the sintering temperature and reinforcement ratio parameters are examined, the hardness values of the hybrid composites produced at 750°C show an average hardness variation of 3–3.5% with those produced by sintering at 850°C, while the Cu-Gr-2CNT hybrid composite sintered at 850°C has the highest hardness value. The Cu-Gr-CNT sample yielded a 51.4% higher value than the pure Cu sample. While the hardness of pure Cu is 80 HV, with the addition of Gr, it increased to 92 HV at 750°C sintering temperature and there was no significant change in the hardness value compared to the samples at 850°C sintering temperature (95 HV). The hardness values were found to vary between 95 and 99 HV at 750 and 850°C sintering temperatures in 2 wt% Gr reinforcement. However, it is shown that CNT reinforcement in Cu has increased hardness significantly at two different sintering temperatures from 80 HV to 108 and 110 HV compared to the initial value of Cu. The hardness values increased slightly more and increased to 111 and 113 HV in 2 wt% CNT addition, but did not show a significant change compared to the 1 wt% CNT. It can be inferred that when 1 wt% Gr and CNT were added, the hardness values increased to 117–119 HV at two different sintering temperatures, however when 2 wt% Gr and CNT were added, the hardness values reached to 120–122 HV.
It has been reported that CNT and Gr reinforcements added to the composite structure are not homogeneously distributed in the structure and cause agglomeration.29,42 Hardness values increased in both Gr and CNT reinforced composite samples depending on the increase in reinforcement amounts. Lower hardness values were measured in Gr reinforced composites than CNT reinforced composites at all reinforcement ratios. This is thought to be due to the fact that the planar network structure of Gr nanomaterials in the composite structure is distributed over a larger surface area compared to the hollow cylindrical structure of CNT. 51 The mechanical strength of pure Cu was significantly increased by Gr and CNT reinforcement.52,53 Furthermore, Figure 3 shows that the agglomerations formed during sintering have a tendency to form dendritic grains, 50 and it is understood that the grain structure cannot be fully formed with the addition of Gr and CNT, so the formation of small grains has a significant impact on the composite’s hardness. The results obtained from compressive stress and hardness tests show that the mechanical properties of Cu-Gr-CNT doped composites are improved. As the hardness value increased, the compression strength increased accordingly, and the highest values (120–122 HV) were found in composites with wt.% CNT added. If hardness is interpreted as the resistance to plastic deformation, the high yield stress in Cu-Gr-2CNT composite, which shows resistance to plastic deformation, confirms this information. In the compression test, the increase in the maximum stress increased by 40% in proportion to the bond formed by Gr and CNT and Cu, while this increase in hardness values was 51.4%. In addition, strain values were also found to be maximum in the Cu-Gr-2CNT composite, where the hardness was found to be the highest.
Wear tests
Effect of reinforcements
It was reported that the Gr- and CNT-doped hybrid composite with Cu matrix demonstrated very good wear resistance if the Gr was added to pure copper in nano size before being exposed to wear testing.
54
It has been determined that the wt% ratio of Gr in Cu and Gr composites had an important impact in reducing the coefficient of friction.
31
Based on this, the wear loss values of the fabricated hybrid composites tested by the pin-on-disk method under a single load according to the reinforcement type and reinforcement ratios of the hybrid composite samples are shown in Figure 6. Weight loss of hybrid composites with sliding distance for different composites after wear tests for (a) 750°C and (b) 850°C sintering temperature.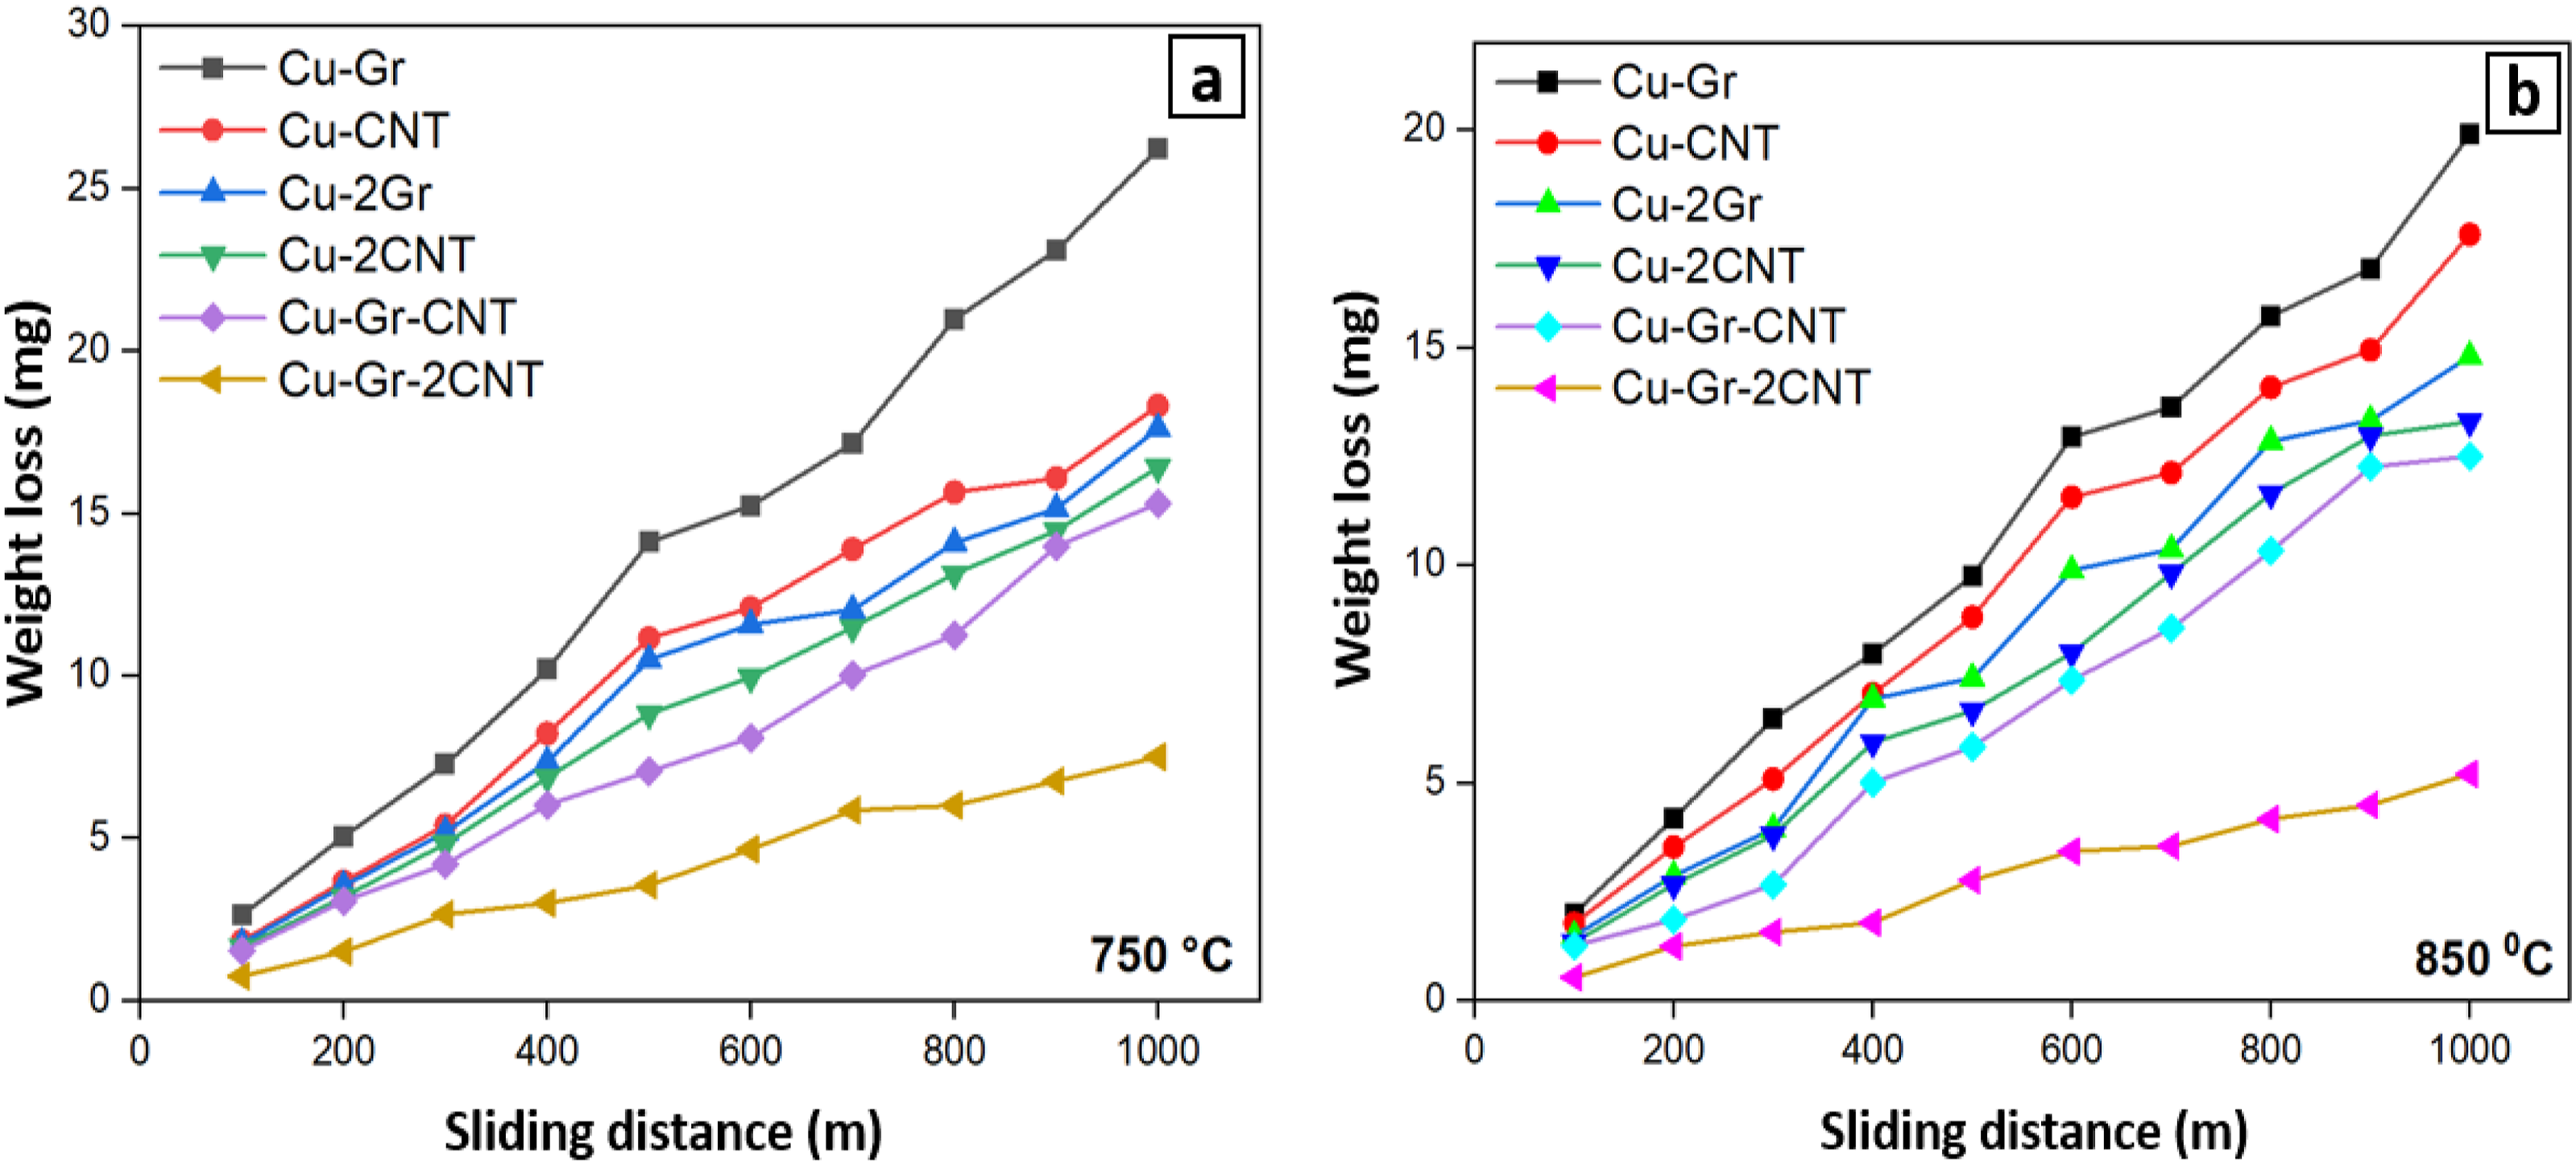
Comparing the sintering temperatures, it can be noted that the composite samples sintered at 750°C exhibited a greater degree of weight loss compared to those sintered at 850°C. When the graphs in Figure 5(a) and (b) are analyzed, it is seen that the wear loss decreases as the Gr and CNT reinforcement ratios increase from 1.0 wt % to 2.0. The wear loss in Gr and CNT composite samples with 1.0 wt% reinforcement was higher than those with 2 wt% reinforcement where such result may indicate lack of homogenization during preparation of the composite samples. Although the reinforcing components may not be evenly distributed in the composite structure, the wear tests showed an uneven distribution throughout the structure.
However, on the wear surface of the 2.0 wt% CNT reinforced composite, a more uniform and stable composite structure was observed. As a result, a lower wear value was measured in these composite samples. The Cu-Cr-2CNT hybrid composite exhibited the least amount of weight loss, while the wear losses of the Gr-reinforced composites were slightly higher but comparable to the CNT-reinforced composites. The wear resistance of Cu-Gr composites increased compared to pure copper. As a result of the decrease in friction force in tested composite samples, the metal-metal surface contact is disrupted due to the self-lubricating, solid lubricating film formed on the wear surface due to the presence of graphite.31,32
During wear testing, as the weight percentage of Cu increases, the coefficient of friction decreases due to the solid lubricating property of Gr reinforcements. The presence of graphite as reinforcement in the copper matrix reduces metal-to-metal contact points, which reduces the coefficient of friction.31,32
The variation of the coefficient of friction as a function of sliding distance for the composite samples are shown in Figures 7 and 8. The coefficient of friction values for all samples exhibited an initial increase up to a sliding distance of 1000 m, followed by a subsequent drop and stabilization at reasonably constant levels. Friction coefficient plots of Gr-CNT reinforced hybrid composites (750°C). Friction coefficient plots of Gr-CNT reinforced hybrid composites (850°C).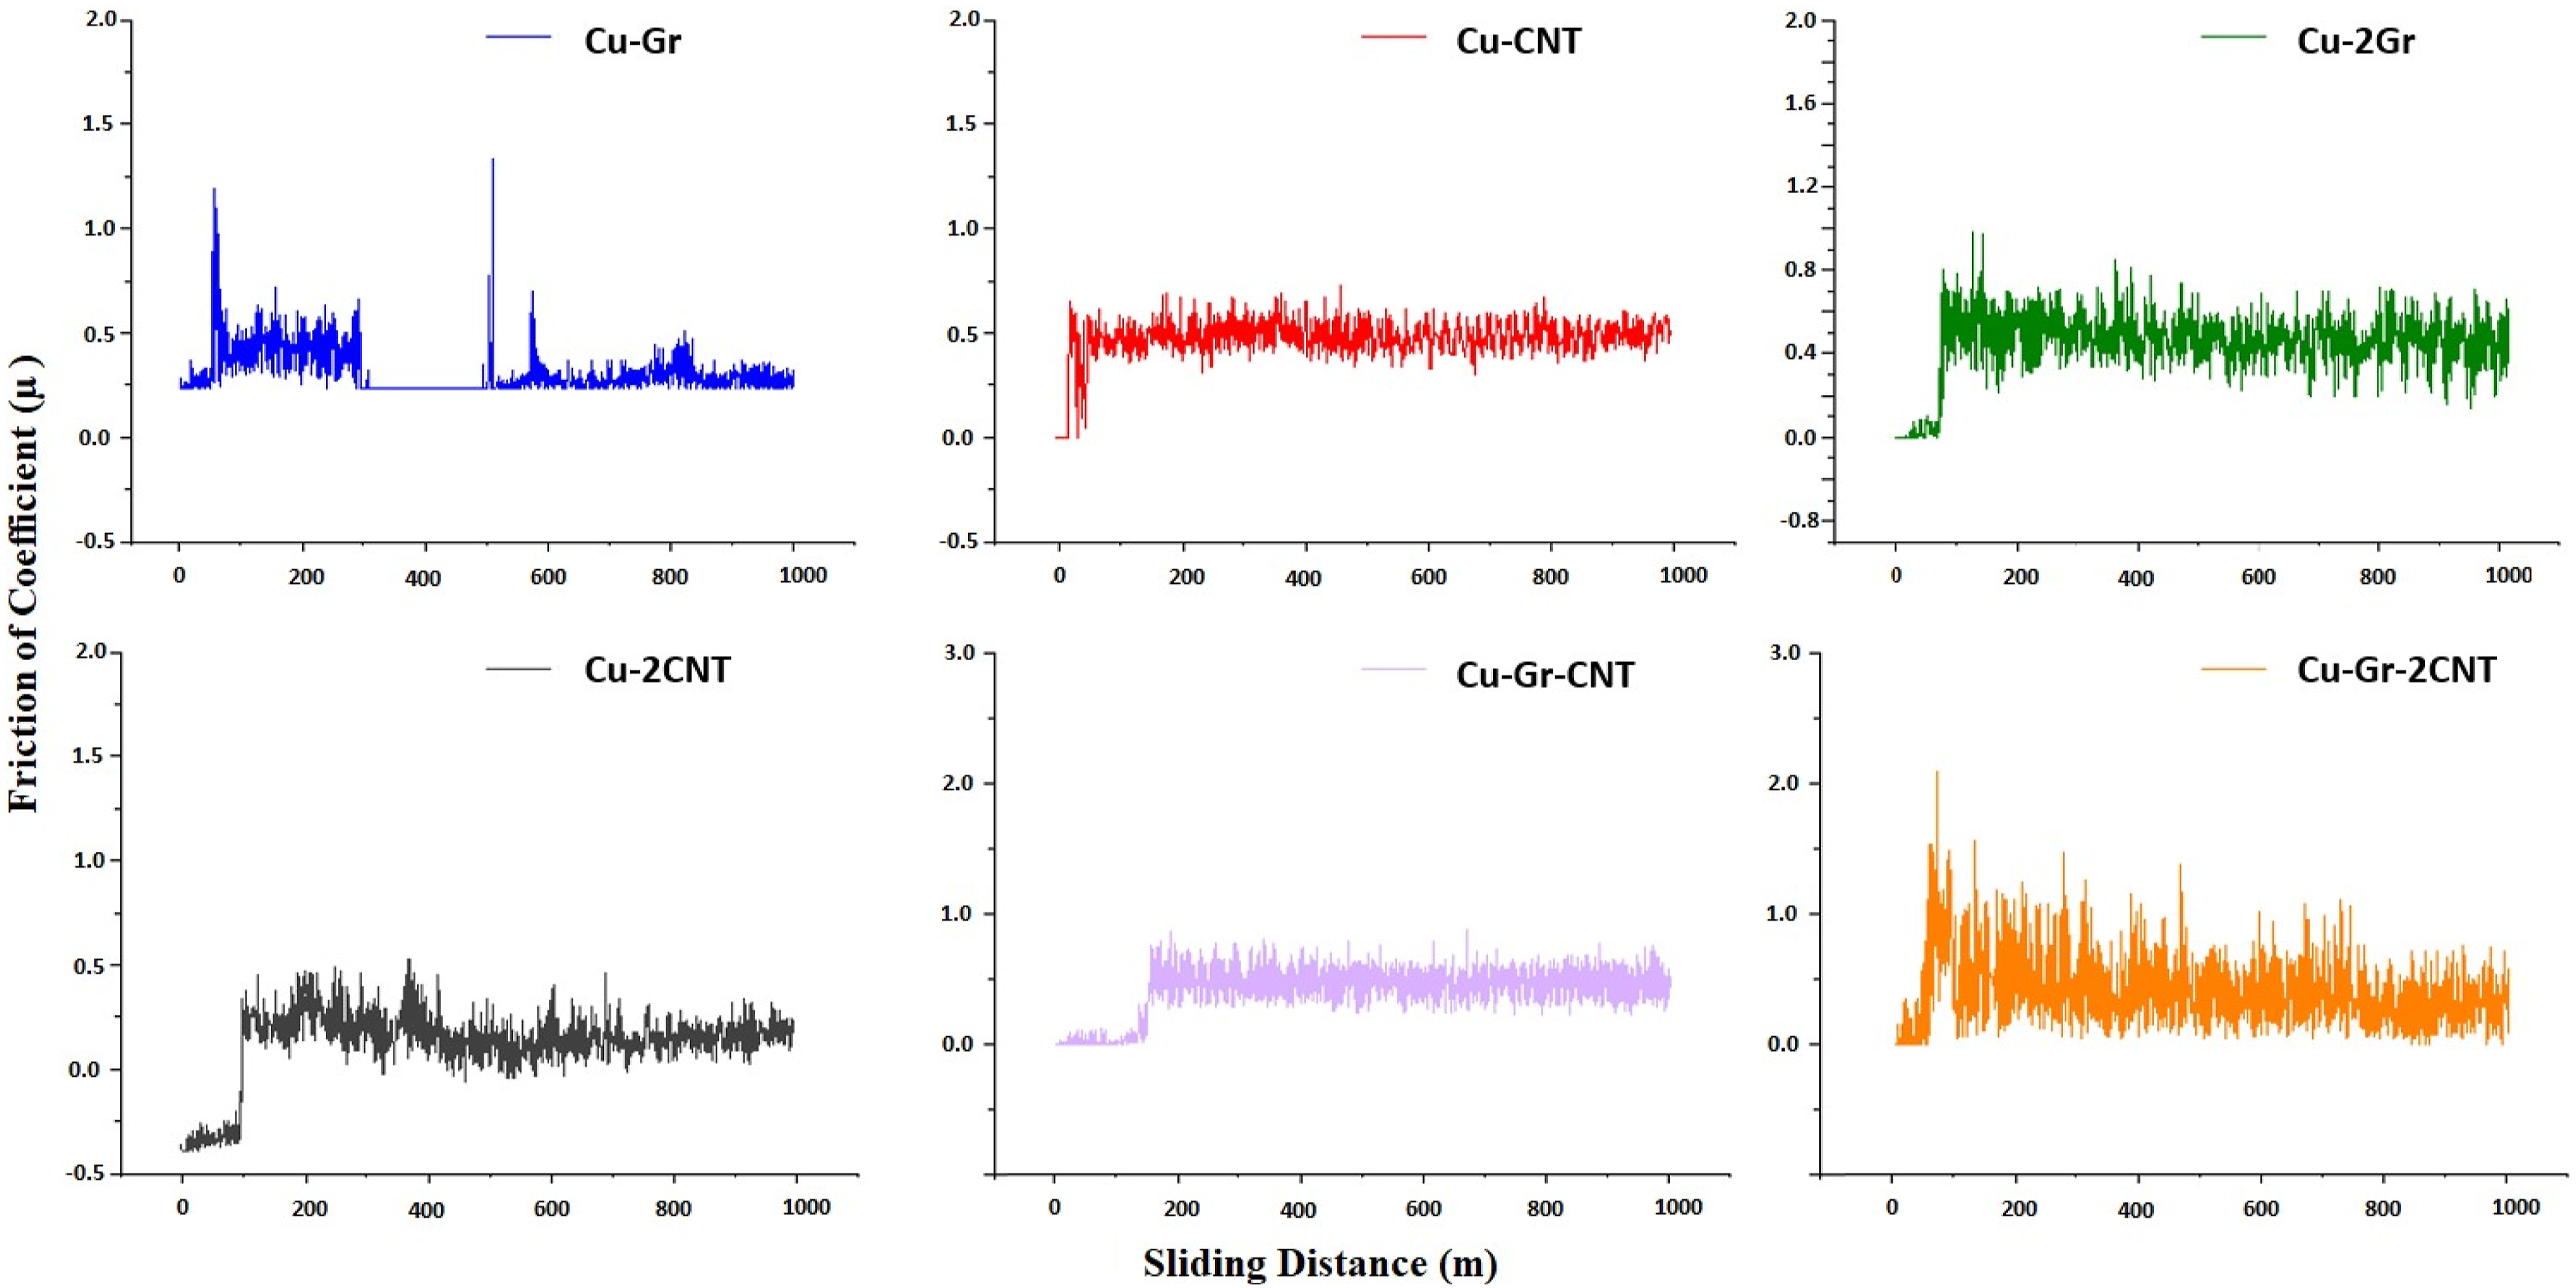
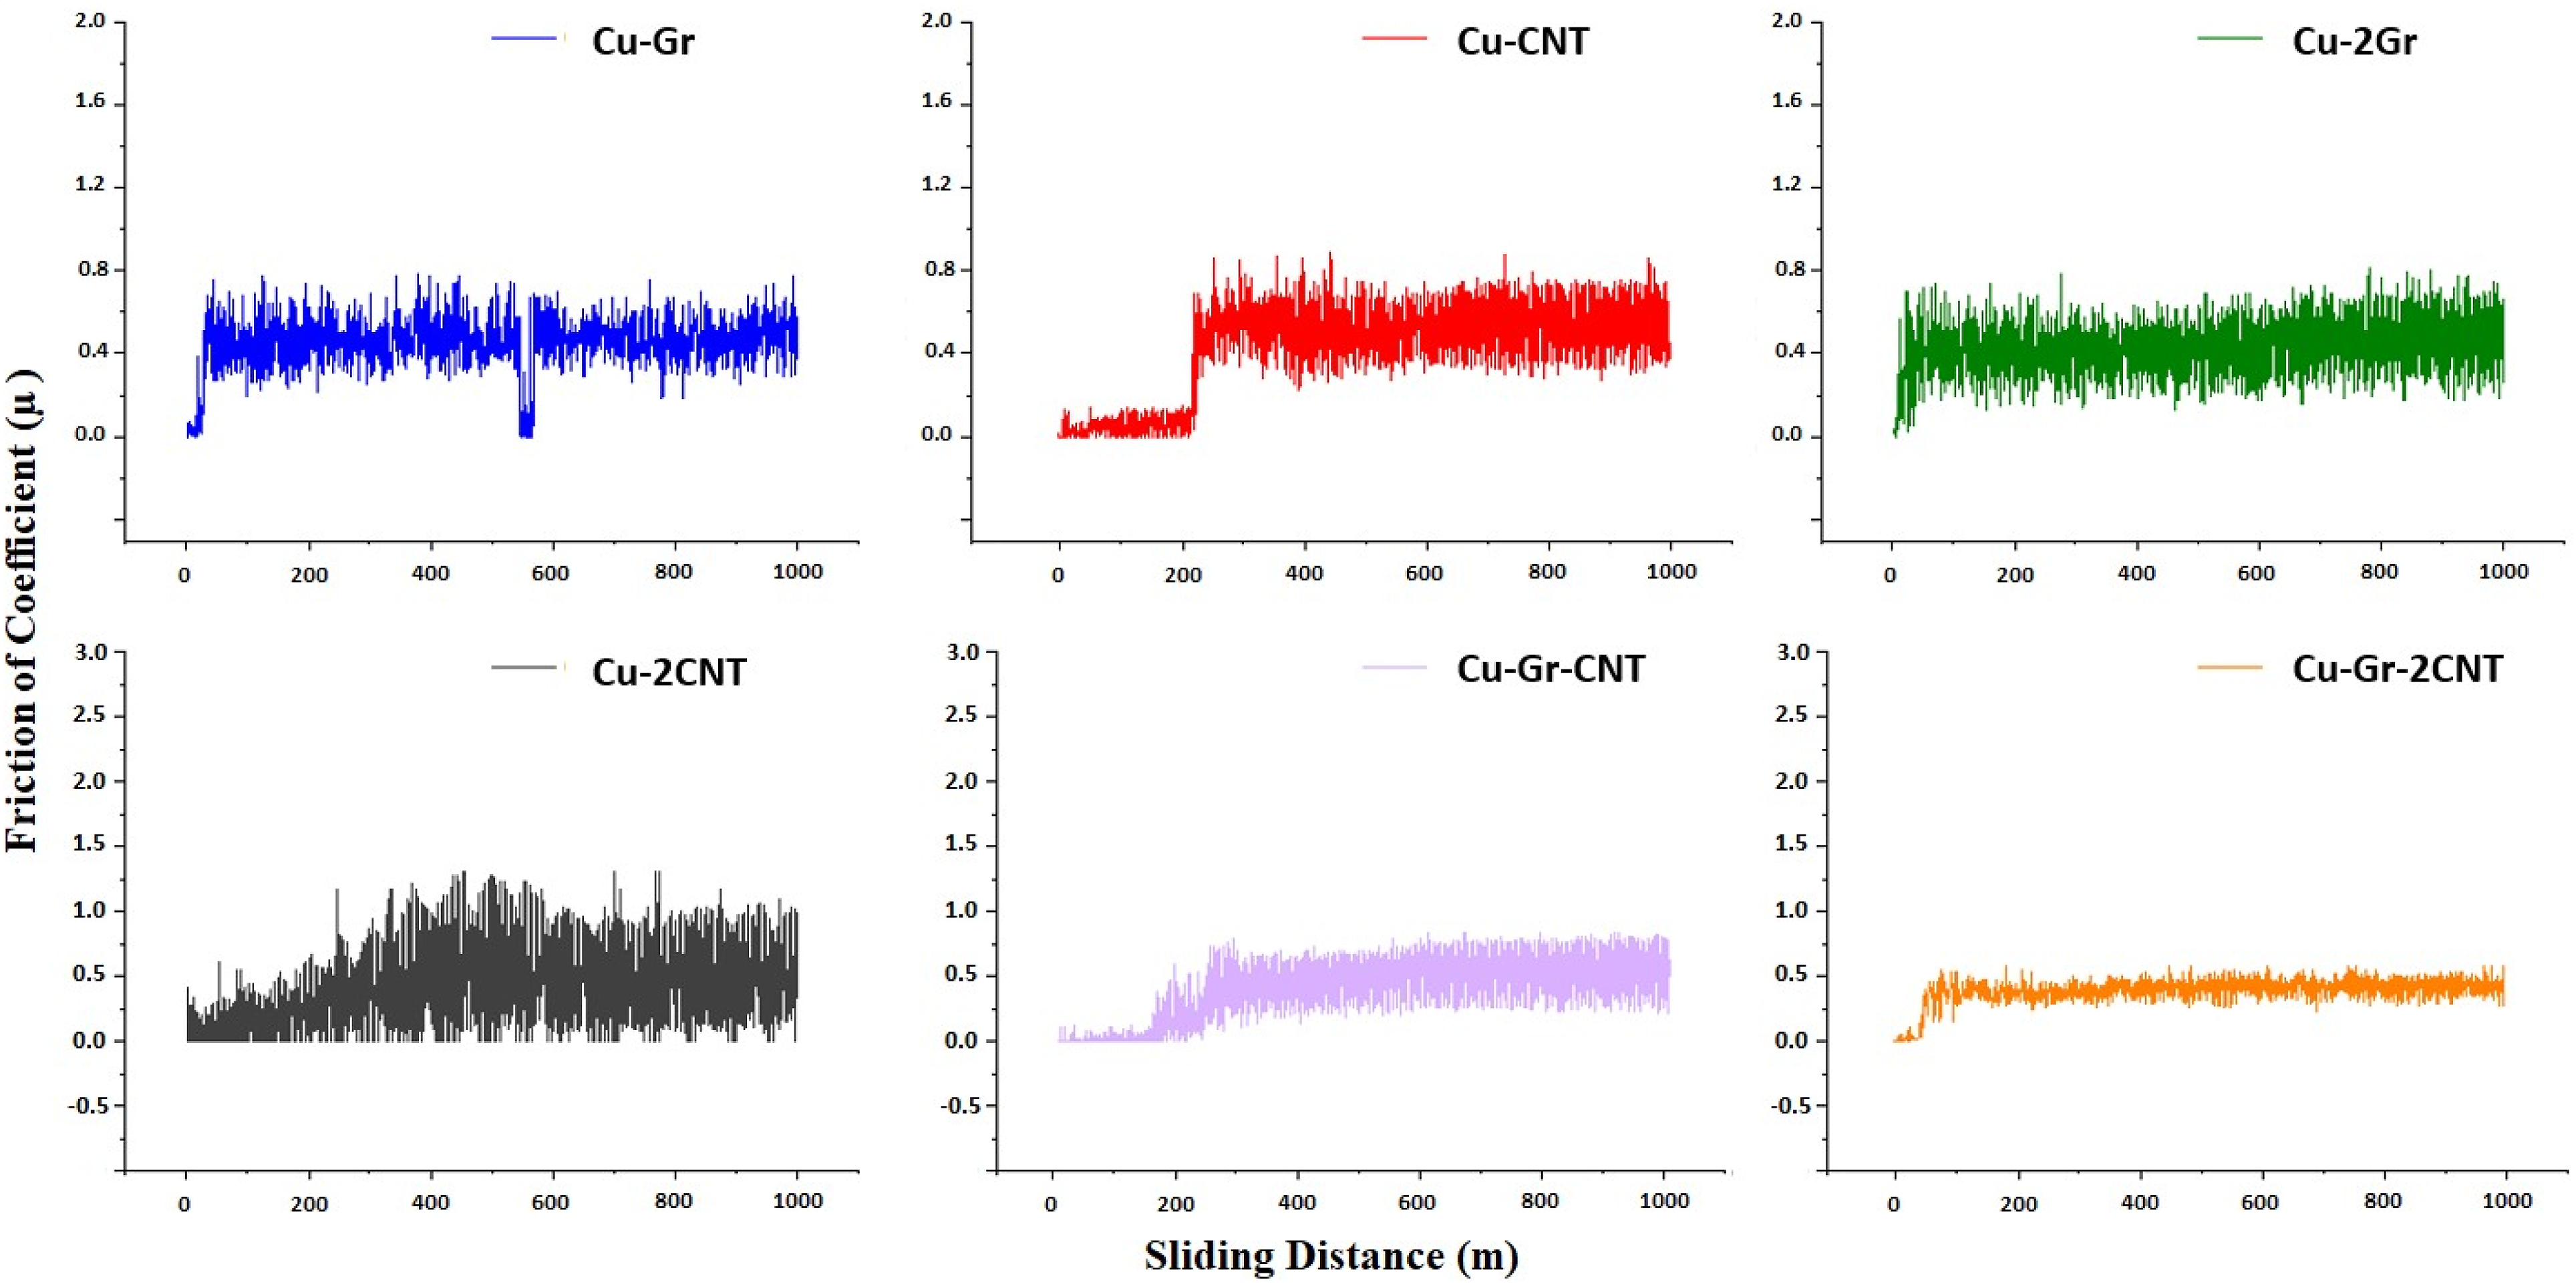
The fluctuations in friction coefficient may be attributed to the production of a mechanically mixed layer on the surface that can be regarded as a solid lubricant layer, as it contains certain oxide compounds.33,34 Thus, the development of this layer on the surface of the composite samples during sliding wear decreases the friction coefficient. The Cu-Gr sample has the lowest coefficient of friction values, however with the increase in the amount of reinforcement, the coefficient of friction of the hybrid composites decreased and therefore the resistance to friction increased. In a study in the literature, it was also shown that the addition of Gr had a significant effect on the reduction of the wear value occurring in Electric Discharge Machining tools by adding Gr. 55 However, it is also thought that Gr clustering, as seen in EDS analysis, causes wear resistance in wear analysis. The coefficient of friction values are also found in line with the hardness results. It was found that the increase in sintering temperature decreased the friction coefficient values of the hybrid composites and increased the resistance to wear.
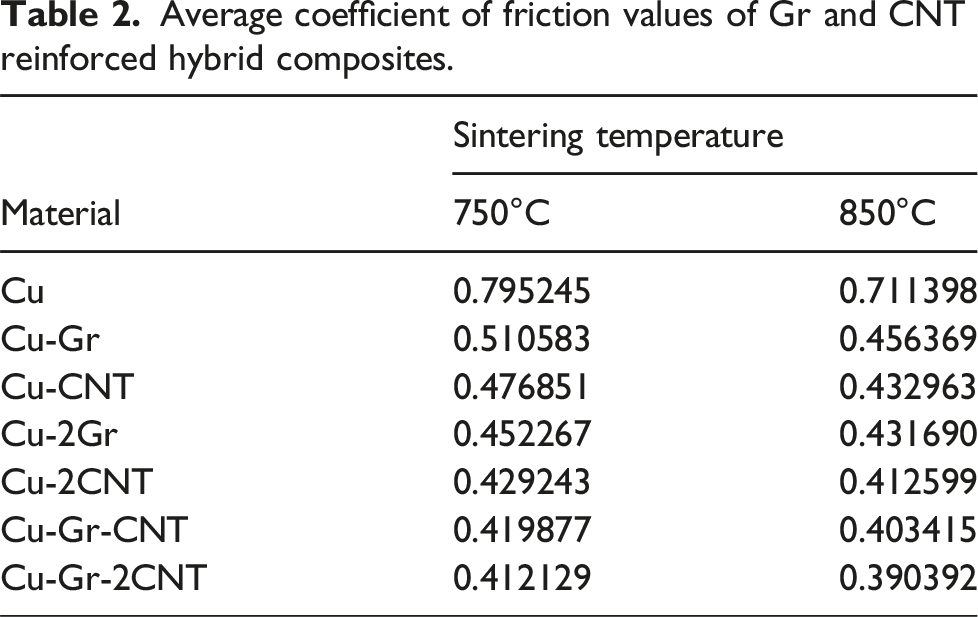
Average coefficient of friction values of Gr and CNT reinforced hybrid composites.
During the wear analysis, CNTs were homogeneously distributed on the metal surface and CNTs on the surface filled the intermediate gaps outside the weak bonds formed by Gr and Cu. It prevented rough contact between the surfaces of the metals forming two weak bonds and significantly reducing the wear rate. Graphite is recognized as a new solid lubricant due to its excellent performance35,36,56,57 and Copper matrix composite with soft reinforcing materials such as graphite helped to reduce the coefficient of friction. 58 Figure 6 also shows that the coefficient of friction decreases slightly with increasing the volume fraction of CNTs in the composites. This suggests that the increase in the surface fraction of CNTs reduces the direct contact between the metallic matrix and the diamond pin and alters the friction due to the self-lubrication of CNTs, thus causing a decrease in the friction coefficient of the composites.
The investigation demonstrated that the presence of graphite and CNT reinforcements had a significant impact on the wear rate. The experimental results showed that graphite reinforcement has a beneficial effect on the wear properties of the metal matrix composite. The favorable effects of these CNTs on the tribological parameters are attributed to their excellent mechanical properties and the unique topological structure of hollow nanotubes. CNTs can be released from the matrix to the metal surfaces during the experiment and act as spacers that prevent roughness from contacting and Gr reinforcement in the copper matrix effectively reduces the size of the wear deformation. Kumar and Mondal obtained similar results for graphite reinforced copper matrix composites containing 5, 10, 15% graphite reinforcement by volume. 59
By the increasing hardness and compressive strength values, the wear resistance also increased. While the compressive strength of the Cu-Gr-2CNT composite with high hardness improved its mechanical properties, it was determined that the wear resistance increased in parallel Since it is known that the wear resistance will not change after a certain increase in hardness, the value obtained for this study can be said to be the maximum and optimum hardness value 122 HV.
SEM views after wear tests
SEM images taken to examine the surface of the hybrid composites after wear are shown in Figure 9. The worn surface of the samples showed no obvious wear pattern at a low load (10 N). The wear rate and frictional property of the fabricated composites decrease with increasing graphite concentration in the copper matrix due to the presence of graphite, which reduces metal-metal surface contact due to the solid self-lubricating film formed on the wear surface.
60
SEM images of hybrid composites after wear tests (sintered at 850°C) (a) Cu-Gr, (b) Cu-2Gr, (c) Cu-CNT, (d) Cu-2CNT, (e) Cu-Gr-CNT and (f) Cu-Gr-2CNT.
Upon examination of the hybrid composites following wear, it was observed that the pure Cu sample exhibited the formation of deep wear marks, cracks, and voids, as previously reported. 60
The presence of Gr and CNT reinforcements resulted in a noticeable decrease in the visibility of these cracks as the amount of reinforcement increased. This is a result of the presence of Gr and CNT content. Upon examination of Figure 9, it becomes evident that the distribution of Gr and CNT on the matrix structure is non-uniform, and these reinforcements effectively enhance the wear resistance. The SEM images clearly demonstrate a substantial reduction in wear scars inside the Cu-Gr-CNT hybrid composite. Additionally, the presence of tribolayers on the worn surface is associated with a notable decrease in both cracks and severe wear scars. The increase in the Gr ratio was found to induce delamination of shear stresses, resulting in crack formation. Additionally, changing the CNT ratio altered the wear behavior from one of simple wear to plastering. In composites containing both Gr and CNT, the wear mechanism involved a combination of flaking and plastering. When CNT and Gr were combined in the composites, it was shown that the occurrence of cracks and pitting in the wear photos was greatly decreased compared to other composites. The reduction in wear was found to be the result of incorporating Gr and 2CNT into the composite, which formed a tribo layer (Figure 9(f)). Figure 9(f) demonstrates that this layer partially mitigates the formation of wear marks. The cracks were mostly caused by Gr aggregation, which was mitigated by the inclusion of CNT.
From the results of the total weight loss and coefficient of friction values, it can be seen that CNT reinforcement exhibited better wear resistance than Gr reinforcement. This is thought to be due to the fact that CNT has a hard structure and Gr exhibits a good lubricating film layer. Upon examining the SEM images prior to wear, it became evident that the carbon nanotube (CNT) reinforcement exhibited higher bonding characteristics compared to the other composites, namely the graphite (Gr) reinforcement composite and the copper (Cu) matrix without any reinforcement. One of the important issues in abrasion resistance is the deformation forces,5,51,53 and in this study, it was found that the wear resistance of cold-pressed Cu-Gr-CNT composite increased.
Corrosion analysis
Copper Cu is not an inherently reactive element, it is cathodic that oxidizes easily by accepting free electrons - – acceptance of electron is a reduction process -, hence its corrosion resistance is expected to be low. Compared to iron matrix composites, reinforced hybrid copper matrix composites have a higher lifetime due to their corrosion resistance. Therefore, in this study, copper was chosen as the base metal for the preparation after reinforcement. The superior performance of copper is associated with several factors that can be associated with the formation of copper oxide (Cu2O) corrosion product film on the surface. In addition, the corrosion inhibiting properties of Gr and CNT improved the corrosion performance.
The pure Cu sample has the lowest corrosion resistance with a corrosion potential of −0.166 V and the current density, which represents corrosion kinetics, is maximum in the pure Cu sample. Accordingly, if we look at the amount of corrosion loss, the rate of corrosion of 53.1 × 10⁻² mm/year shows that the pure Cu sample has a worse corrosion performance compared to the reinforced composites.
The corrosion rate value of the composites reinforced with Gr is 4.8 × 10⁻² mm/year for the Cu-Gr sample and 1.96 × 10⁻² mm/year for the Cu-2Gr sample, respectively (Figure 10). Graphite and copper are mutually insoluble and do not react with each other to form a compound. There is only a mechanical bond between the graphite reinforcement and the copper matrix, so it has been observed that corrosion resistance increases when graphite reinforcement is made
61
(Figure 10(a)–(c)); a similar trend is seen in ref.
60
According to the potentiodynamic polarization curves given in Figure 10(a)–(c), the Ecorr values of the composites with Gr-2Gr added by weight were measured as −0.195 V and −0.182 V, respectively.
62
Corrosion resistance of Cu-Gr composites; (a) potentiodynamic tafel curves (b) open circuit potentials (c) electrochemical corrosion parameters results.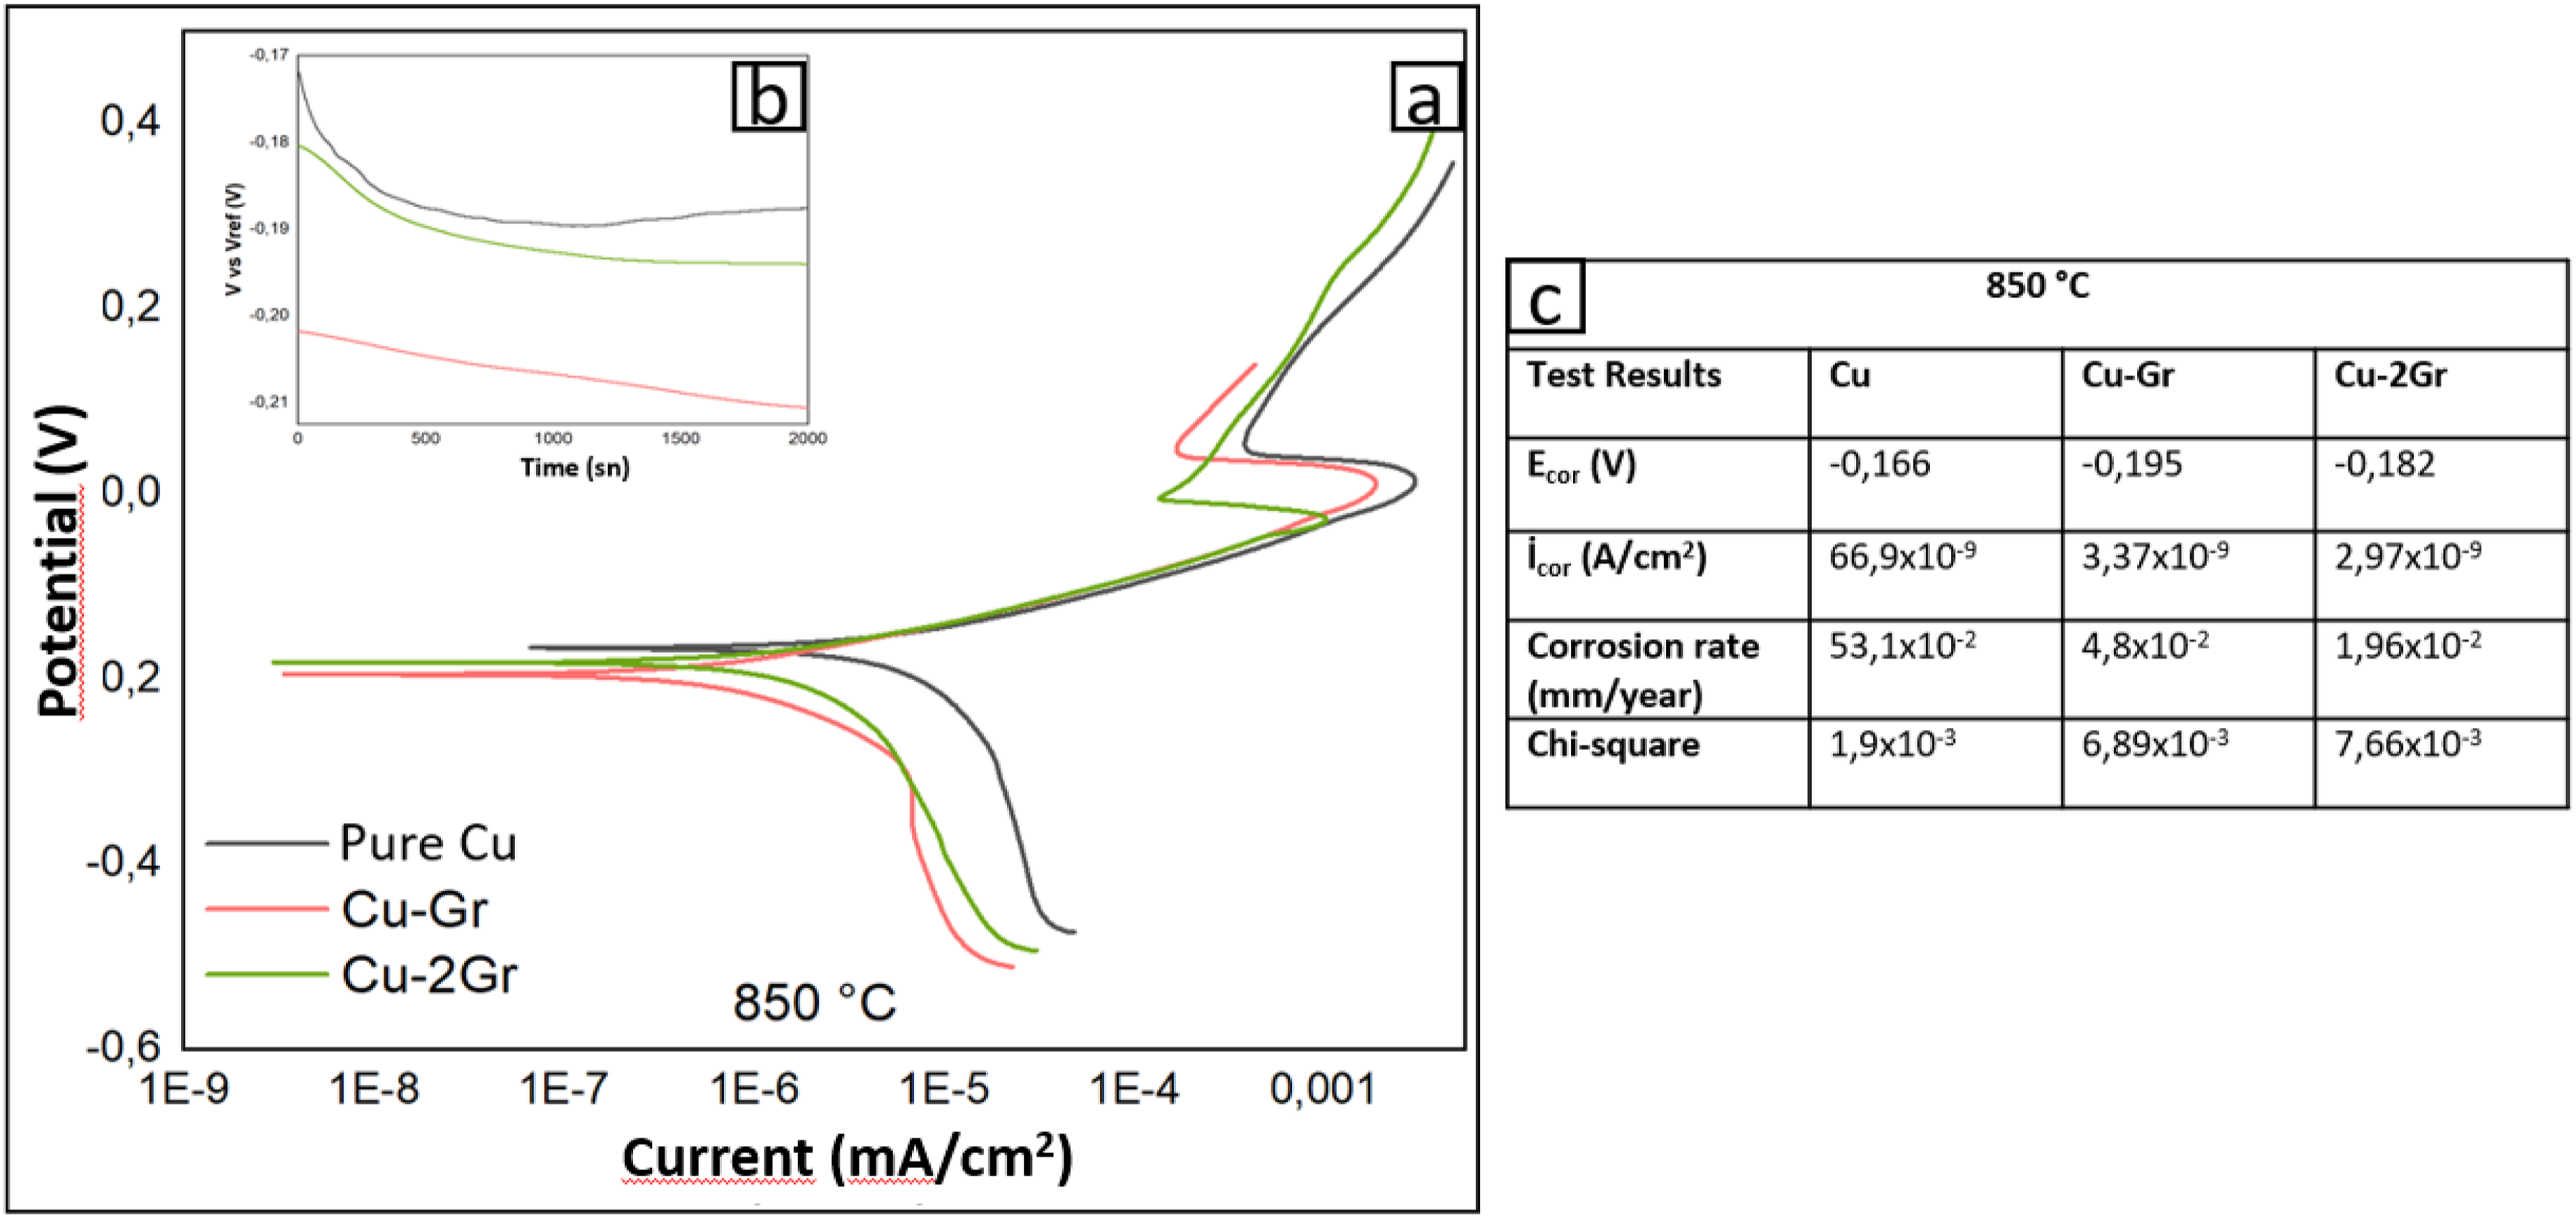
According to the potentiodynamic polarization curves obtained after plotting the open circuit potentials (Figure 11(a)), the Ecorr values of Gr, CNT and Gr-CNT added composites were calculated as −0.166, −0.223, −0.285 and −0.213 V, respectively (Figure 11(b) and (c)). The current density of the composite material produced by CNT reinforcement in pure Cu decreased and the corrosion resistance increased accordingly.45,46 However, the Ecorr value of Cu-Gr-2CNT (−0.213 V) is very close to the Ecorr value of Cu-CNT (−0.223 V). In another study using Cu-GrO from composites obtained by adding Gr and CNTs, it was observed that the corrosion resistance was significantly increased.
62, 63
Corrosion resistance of Cu-CNT composites; (a) potentiodynamic tafel curves (b) open circuit potentials (c) electrochemical corrosion parameters results.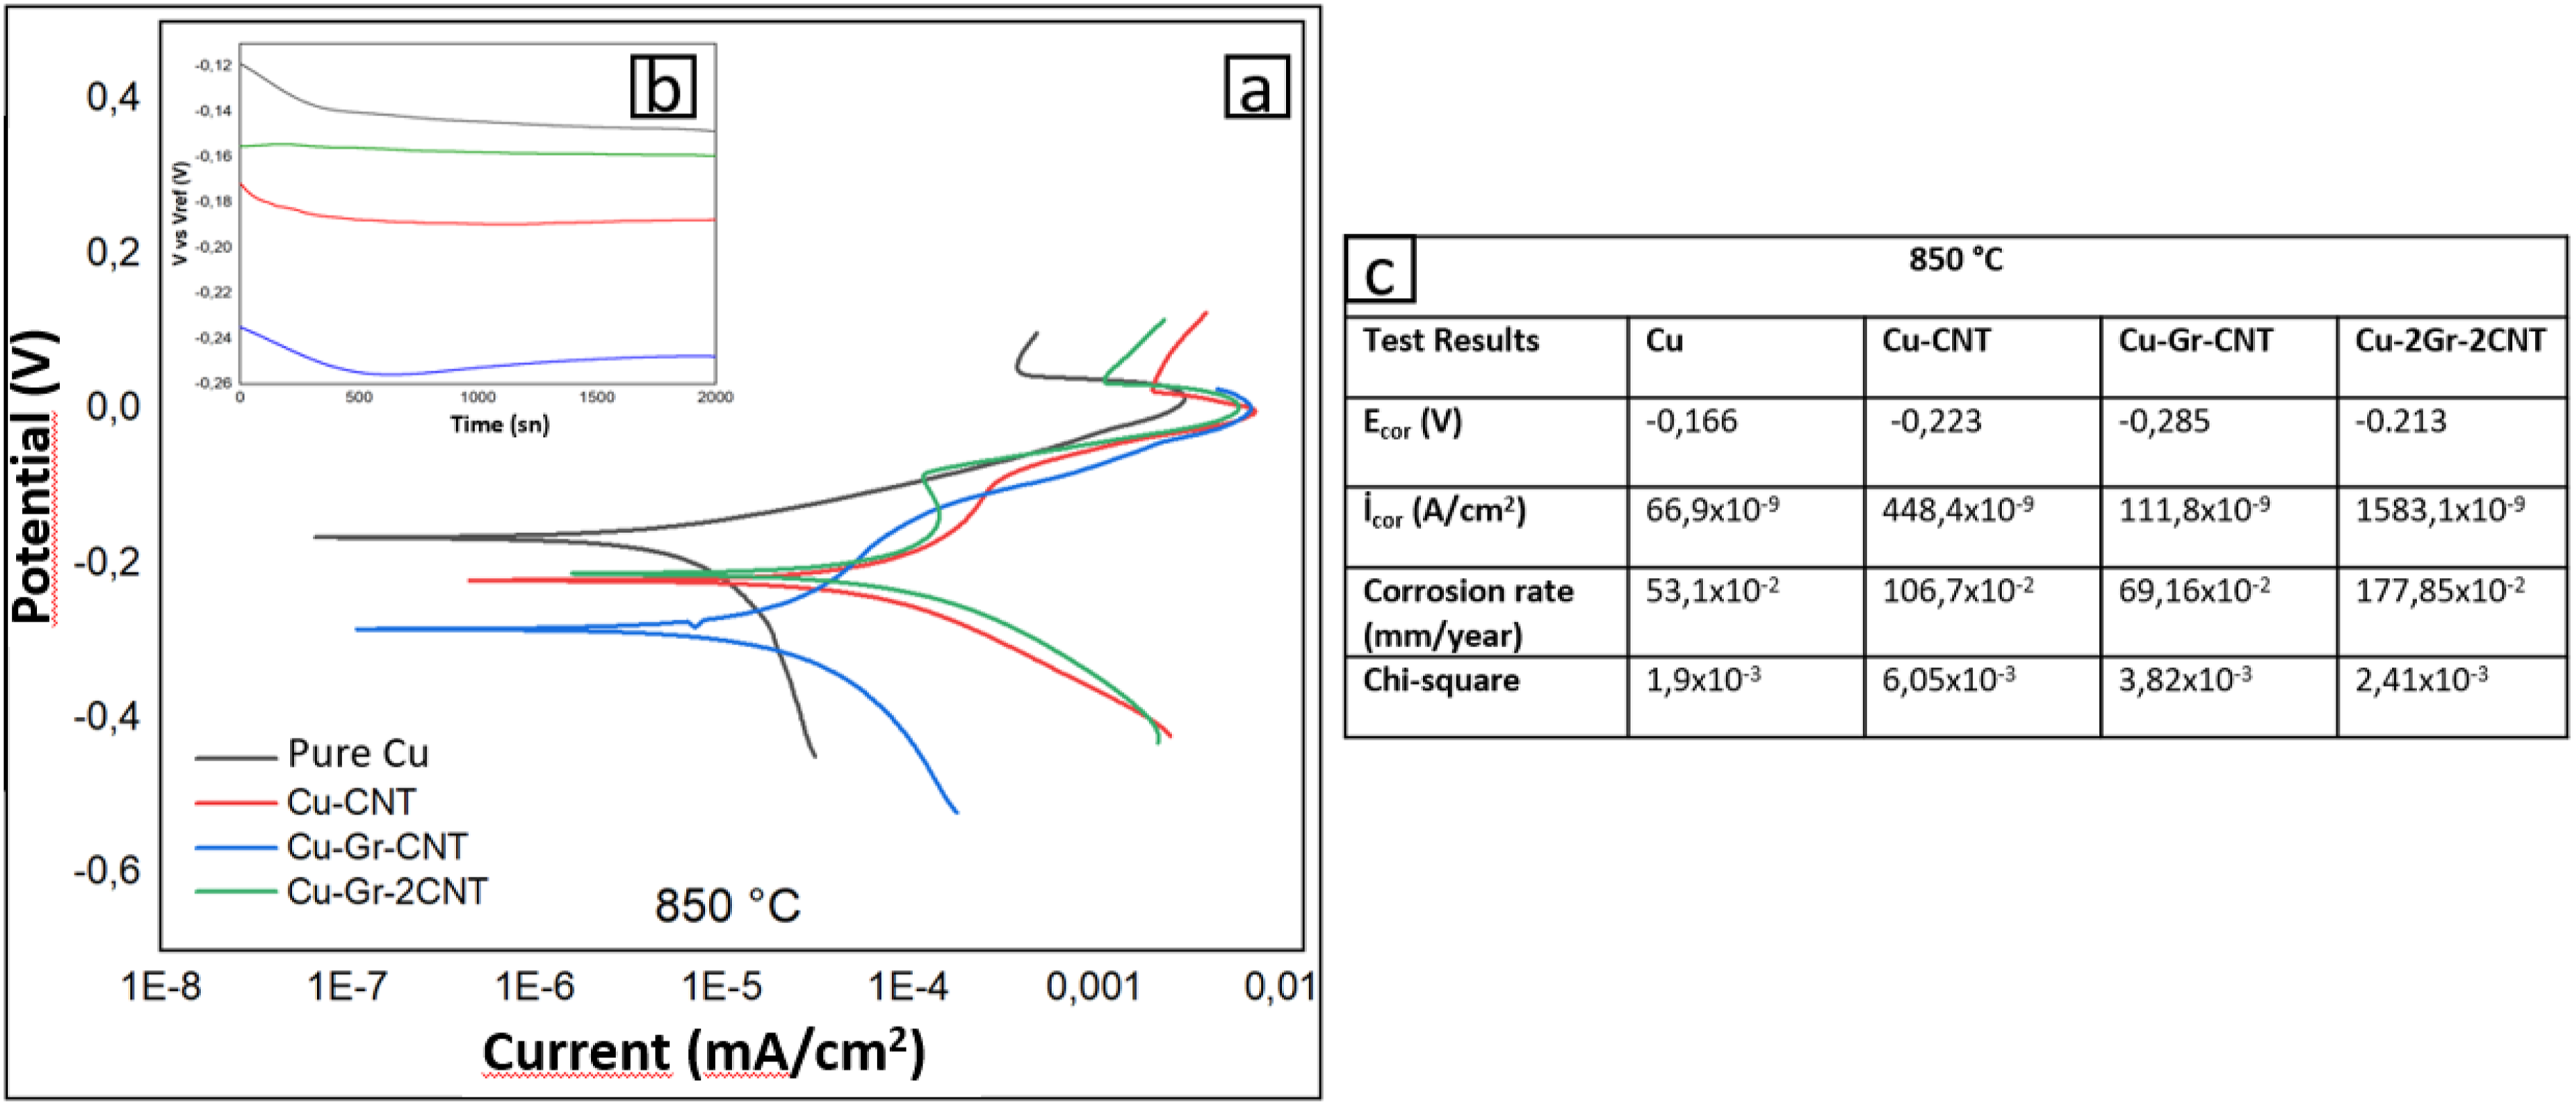
Upon analyzing the corrosion rate figures, it was observed that the corrosion rate reduced by a factor of 2 when compared with Cu and Cu-CNT. Similarly, the corrosion rate decreased by a factor of 1.2 in the case of Cu-Gr-CNT. However, in the case of Cu-Gr-2CNT, the corrosion rate was found to be 3.35 times lower, and Cu-Gr-2CNT composite was found to have the highest corrosion resistance. In general, the factors affecting the corrosion of composite materials are well known. Copper and its alloys are extensively utilized in various environments and applications due to their exceptional resistance to corrosion. Microgalvanic corrosion is known to be a problem for such materials due to the galvanic bonding of dissimilar materials resulting in electrical contact in the composite. 64 This quality is complemented by a combination of other desirable characteristics, including excellent electrical and thermal conductivity, ease of fabrication and joining, a wide range of achievable mechanical properties, and resistance to biofouling. The bonded CNTs, and copper are mechanically insoluble in seawater and do not react with each other to corrode.
Electrochemically synthesized composites of nickel-carbon nanotubes (Ni-CNT) and composites solely composed of carbon nanotubes (CNT) have been documented, with some results indicating enhanced resistance to corrosion in comparison to pure nickel.65–67 Improved corrosion properties have also been demonstrated for graphite and carbon nanotube68,69 reinforced copper structures. The electrochemical properties and corrosion behavior of Cu-CNT micropillars were investigated in chloride media and it was found that the corrosion resistance decreased with increasing reinforcement ratio compared to pure copper. 70 On the other hand, copper-graphene doped metal-ceramic composites (MCCs) exhibited conflicting corrosion characteristics in sodium chloride (NaCl) solution. Some researchers have reported that corrosion actually decreased when a certain weight percentage of graphene (wt% Gr) was added.71,72
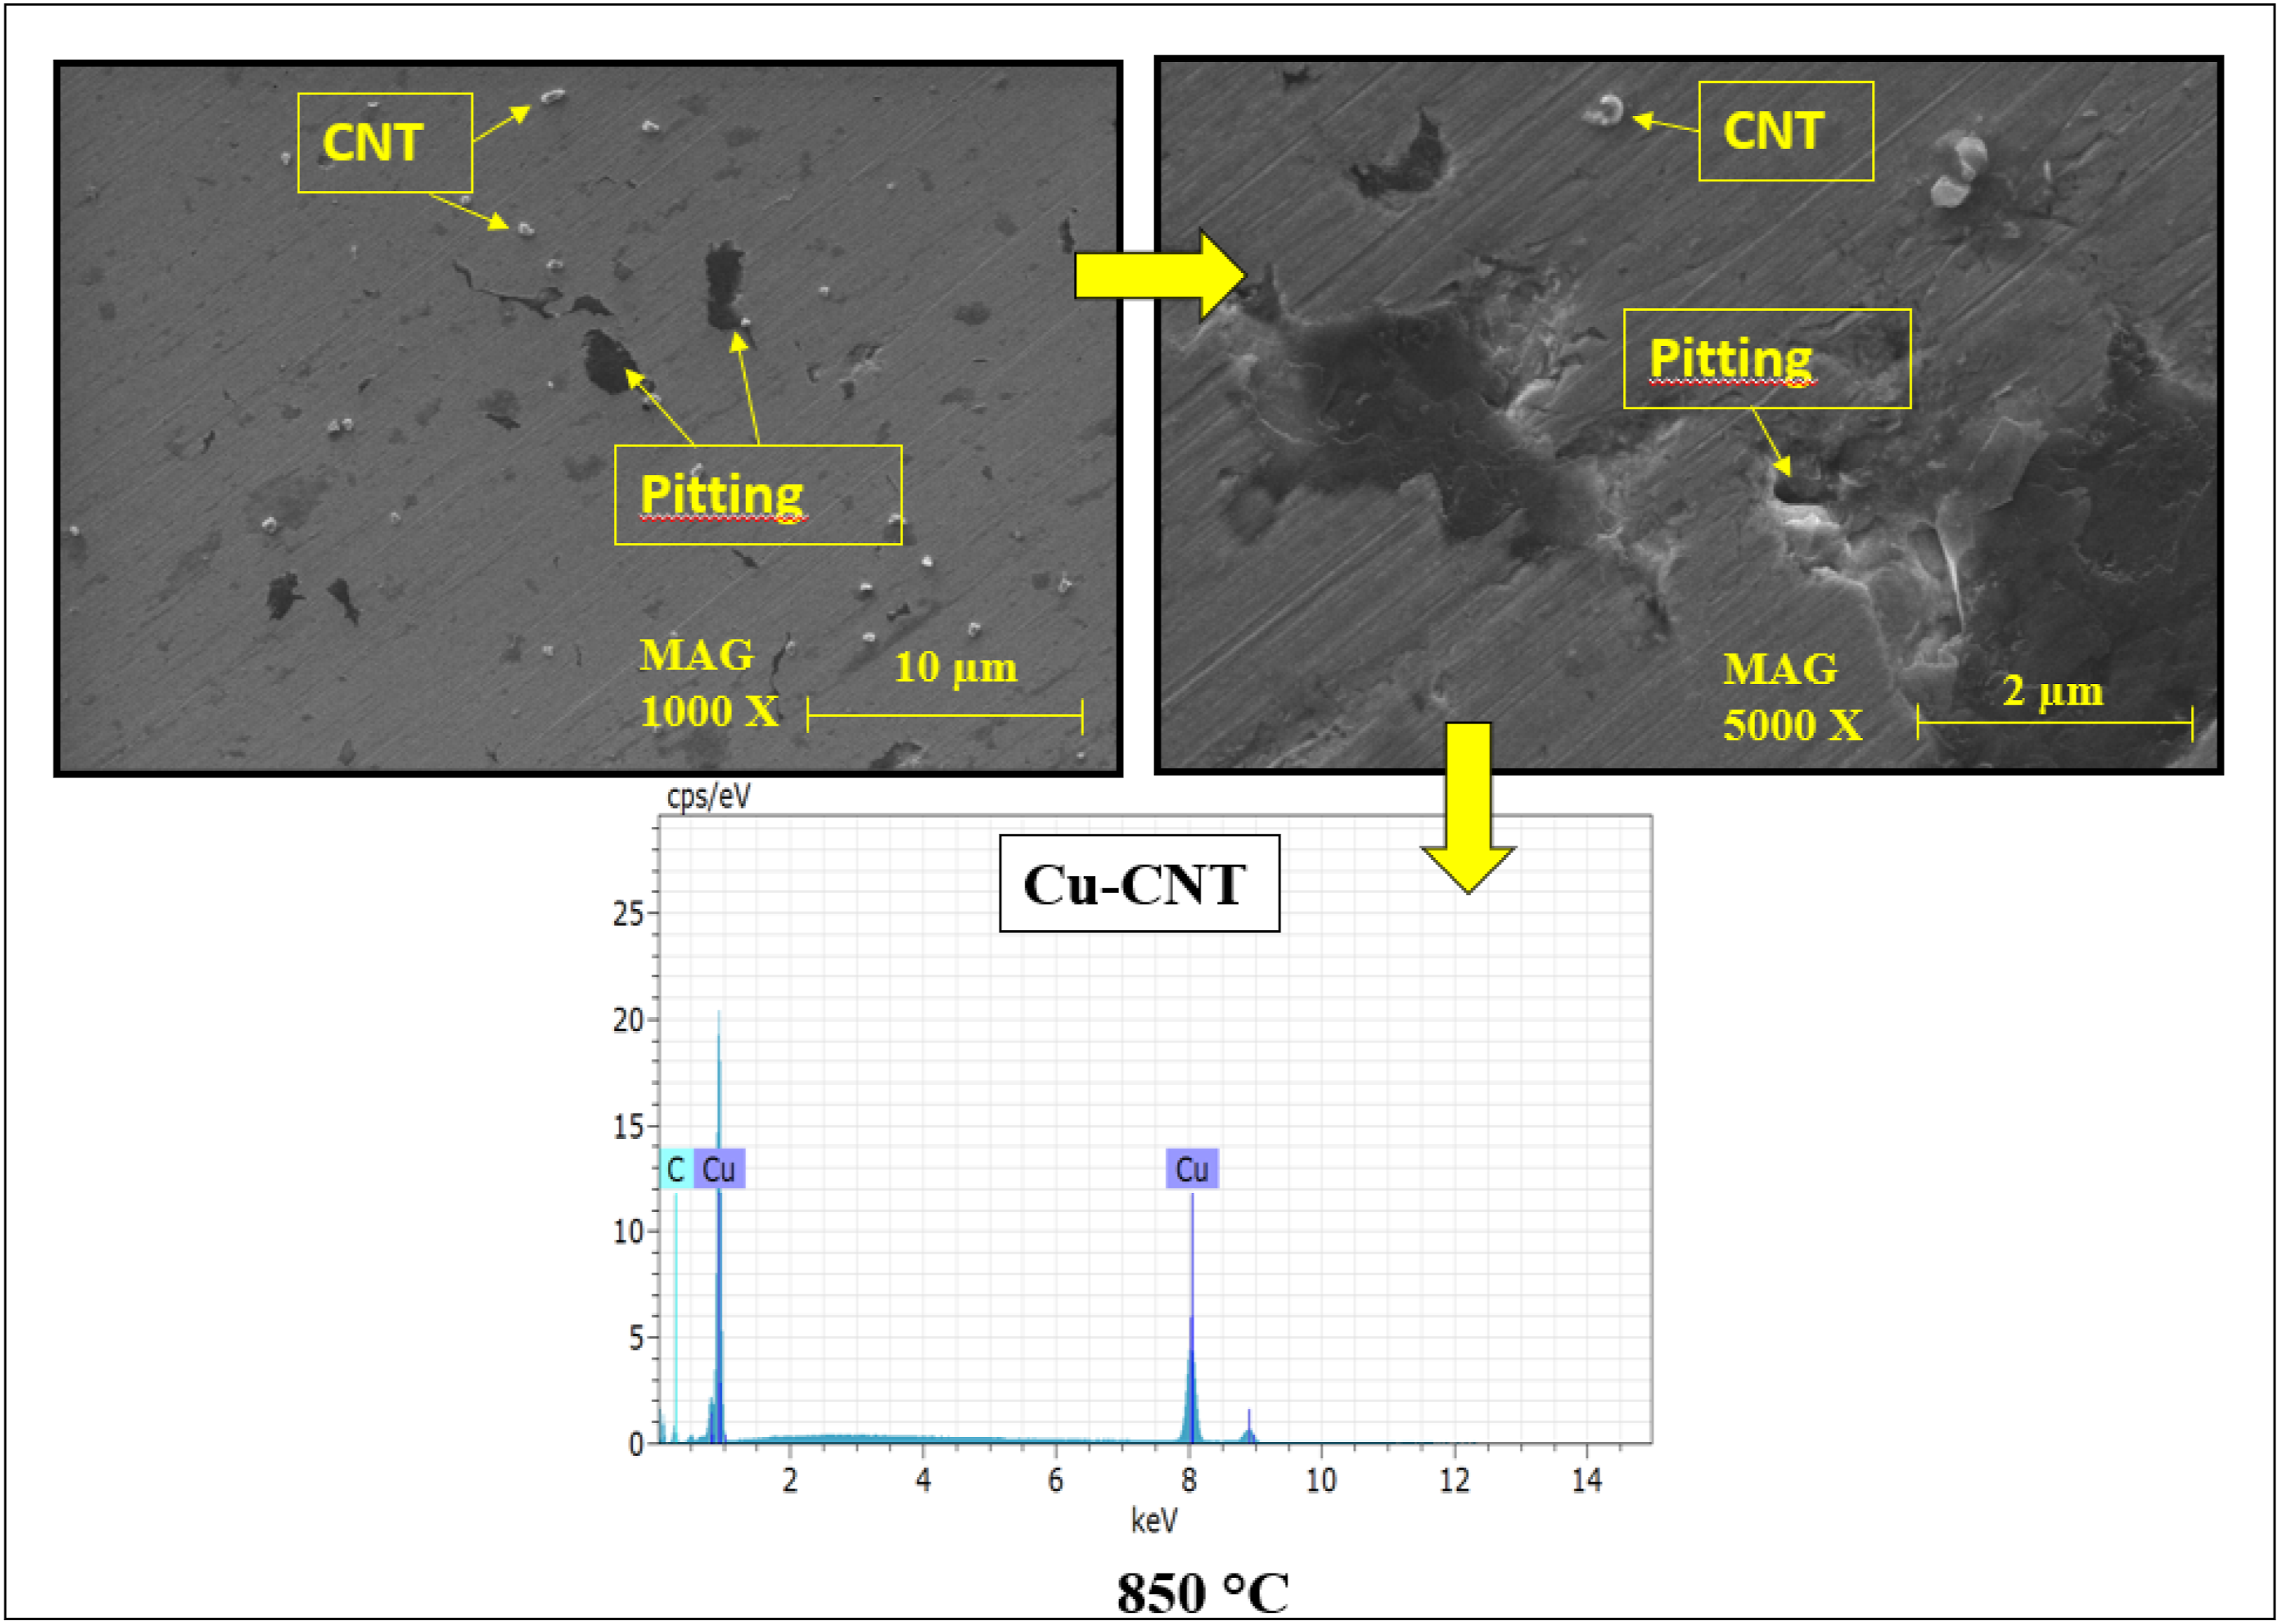
The response of Cu-CNT composite samples in NaCl solution was seen to be contingent upon the microstructure derived from the production technique.71,72 SEM images of the Cu-Gr composite after corrosion show that corrosion mainly occurs in the pitting form. It can be seen on the corrosion surface that Gr appears more prominently in the post-corrosion structure as Cu undergoing corrosion (Figure 12(a) and (b)). Although the corrosion mechanism is unchanged, there are clear differences between the corroded microstructure of CNT and Gr samples (Figures 12 and 13). Within the CNT-doped Cu composite, the majority of the pits exhibits significant depth. Additionally, a smaller number of shallow pits are created at a low frequency (Figure 13). Corrosion in composites doped with Gr resulted in broad scars, whereas composites doped with CNTs exhibited deeper scars. SEM images and EDS spectra after corrosion of composites reinforced with; (a) 1.0 wt % Gr and (b) 2.0 wt% Gr. SEM images and EDS spectra of Cu-CNT reinforced composite after corrosion of composites reinforced with; (a) 1.0 wt% CNT and (b) 2.0 wt% CNT.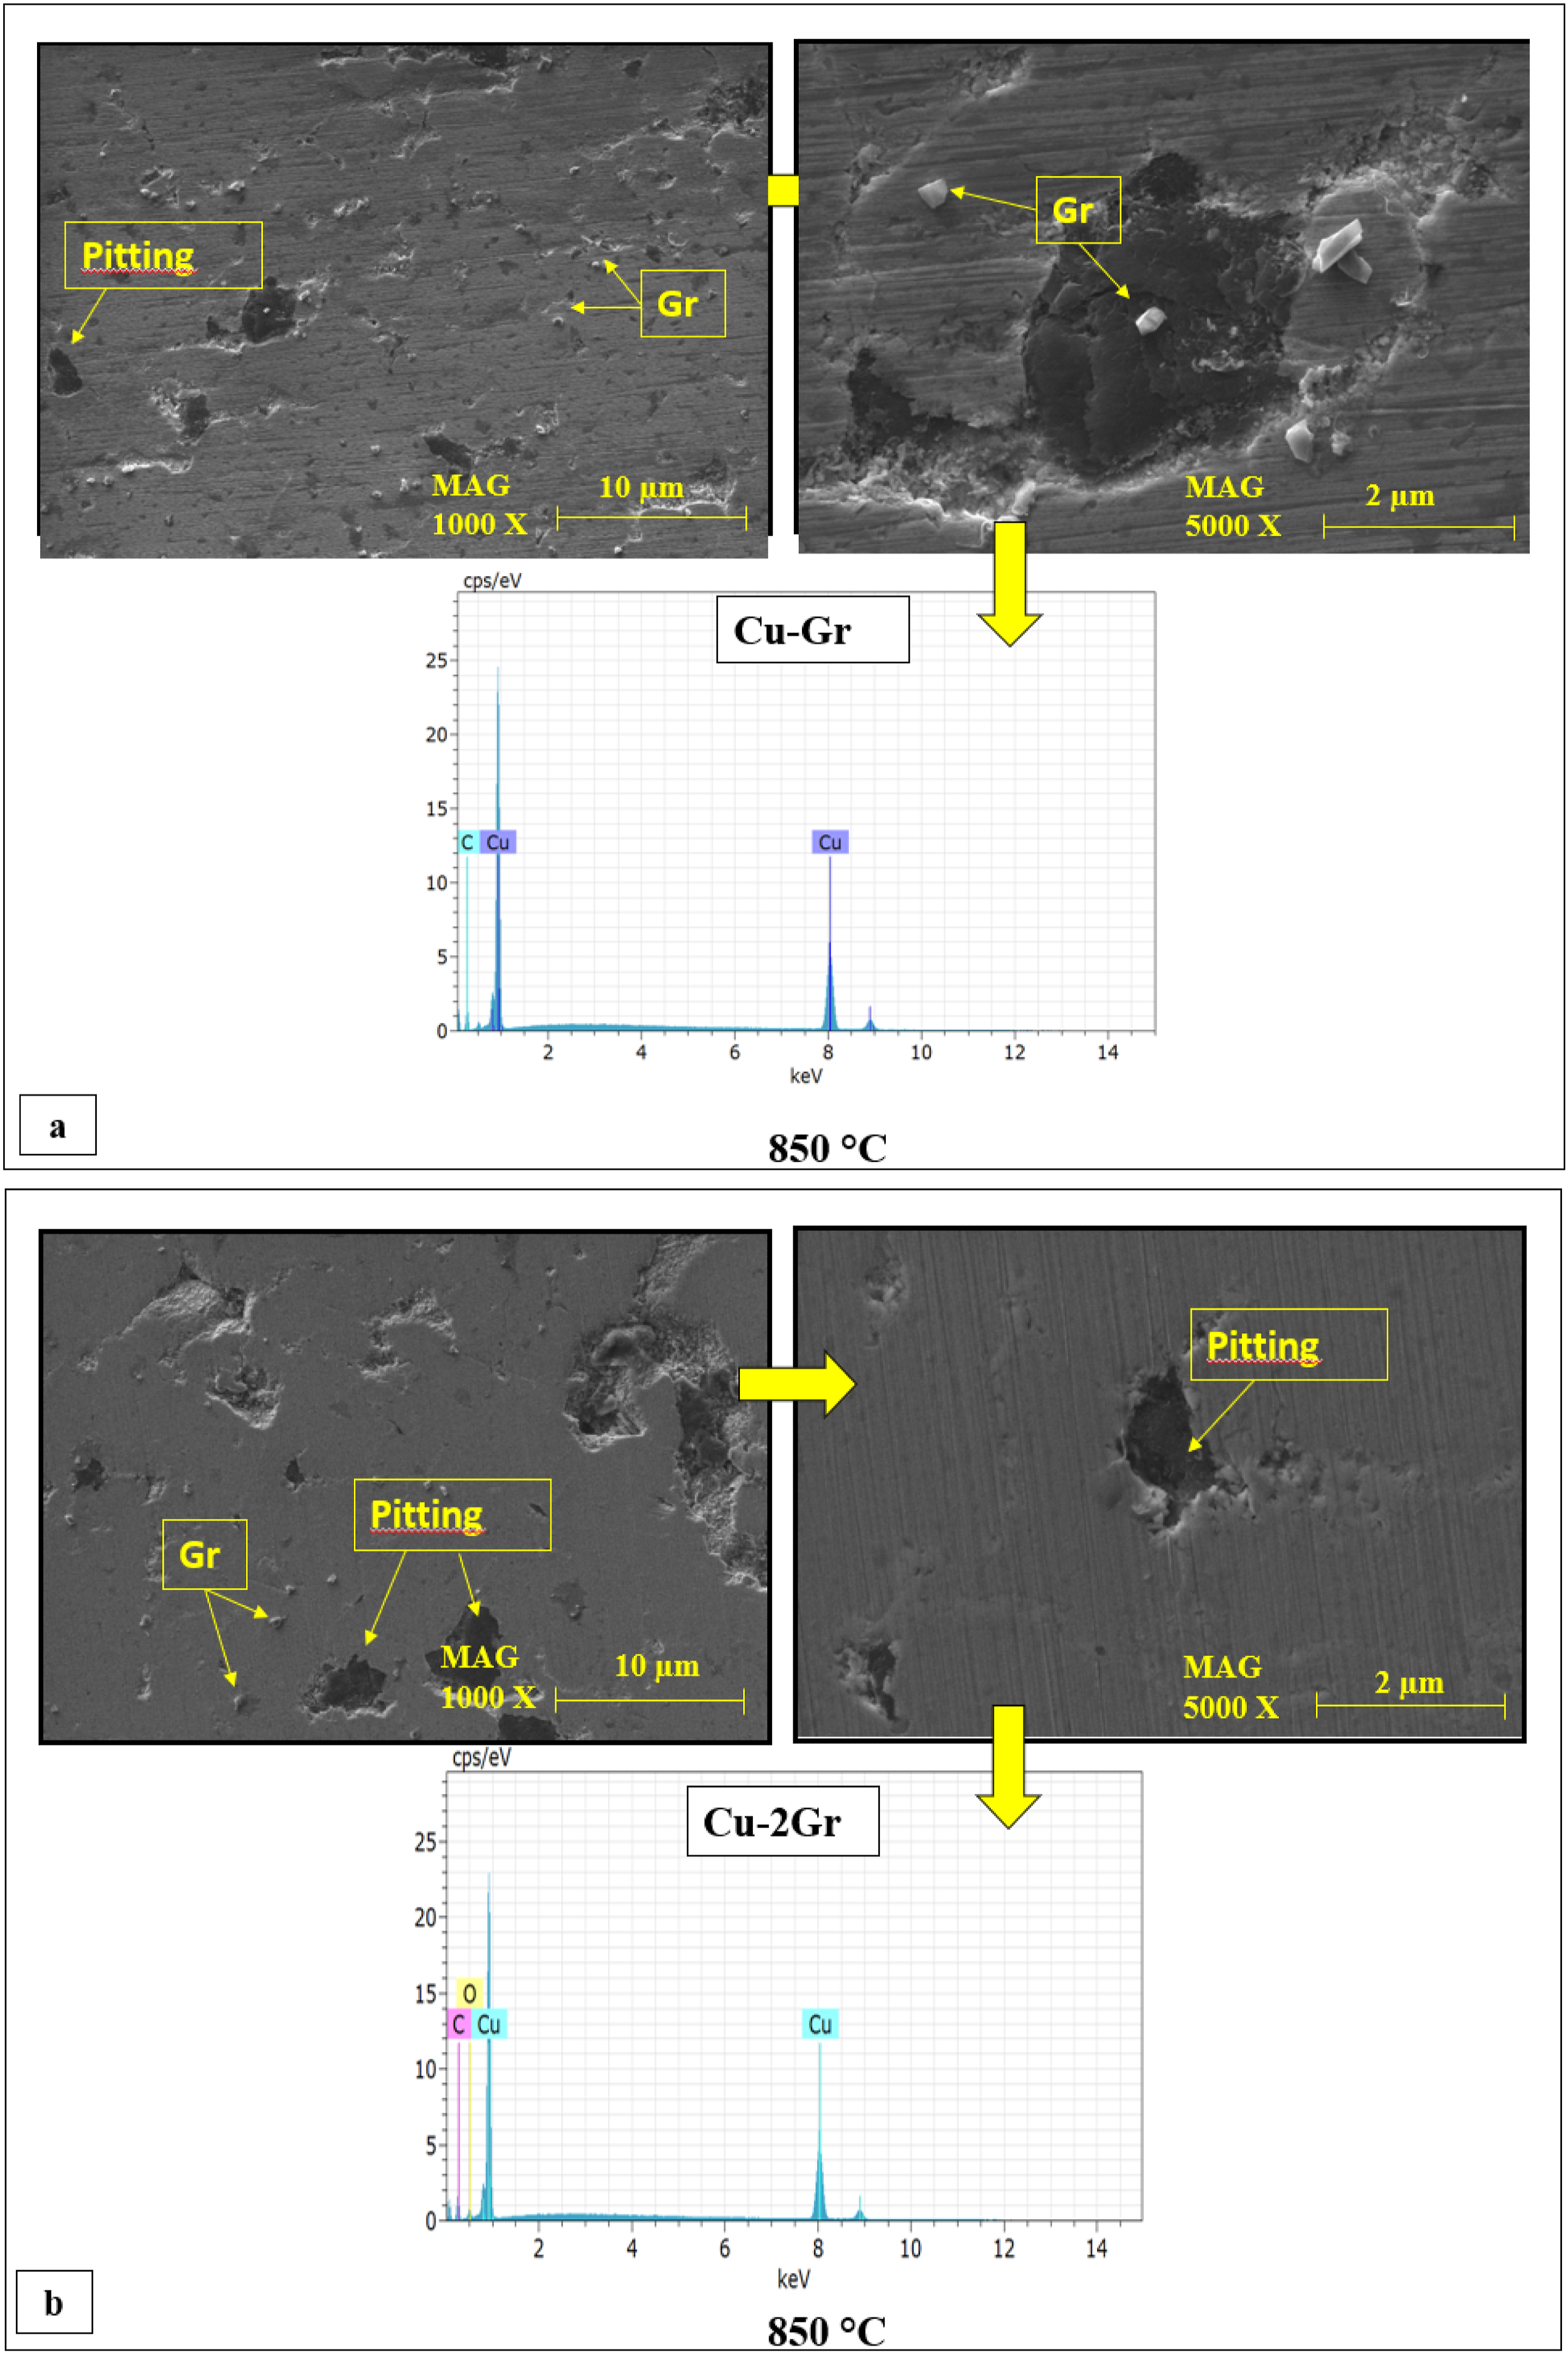
The combination of (Gr) and (CNT) doping resulted in the formation of the most corrosion resistant structure within the copper (Cu) matrix, as shown in Figure 14(a) and (b). Upon the addition of 1 wt% Gr-CNT, the pits exhibited a profound and slender morphology, similar to that of the CNT-doped composite. Nevertheless, when doped with 2 wt% CNT, the pits exhibited a reduction in size and a loss of depth. The addition of 2 wt% CNT resulted in the creation of numerous small indentations on the corroded surface. Based on Figure 11, it can be inferred that the corrosion resistance has improved. Upon examination of all the composite samples, it was found that the corrosion-induced pits were uniformly distributed, with both shallow and deep pits present. The pits detected in all composite samples were of smaller dimensions compared to those observed in samples reinforced with CNTs, suggesting that the addition of Gr (graphite) enhanced the corrosion resistance of the composite samples.
73
While there is a belief that Gr reinforcement might have varying effects on corrosion resistance, the cold pressing process utilized in this study actually enhanced the corrosion resistance of Gr. SEM images and EDS spectra after corrosion of composites reinforced with (a) 1.0 wt % (b) 2.0 wt% Gr-CNT at different ratios.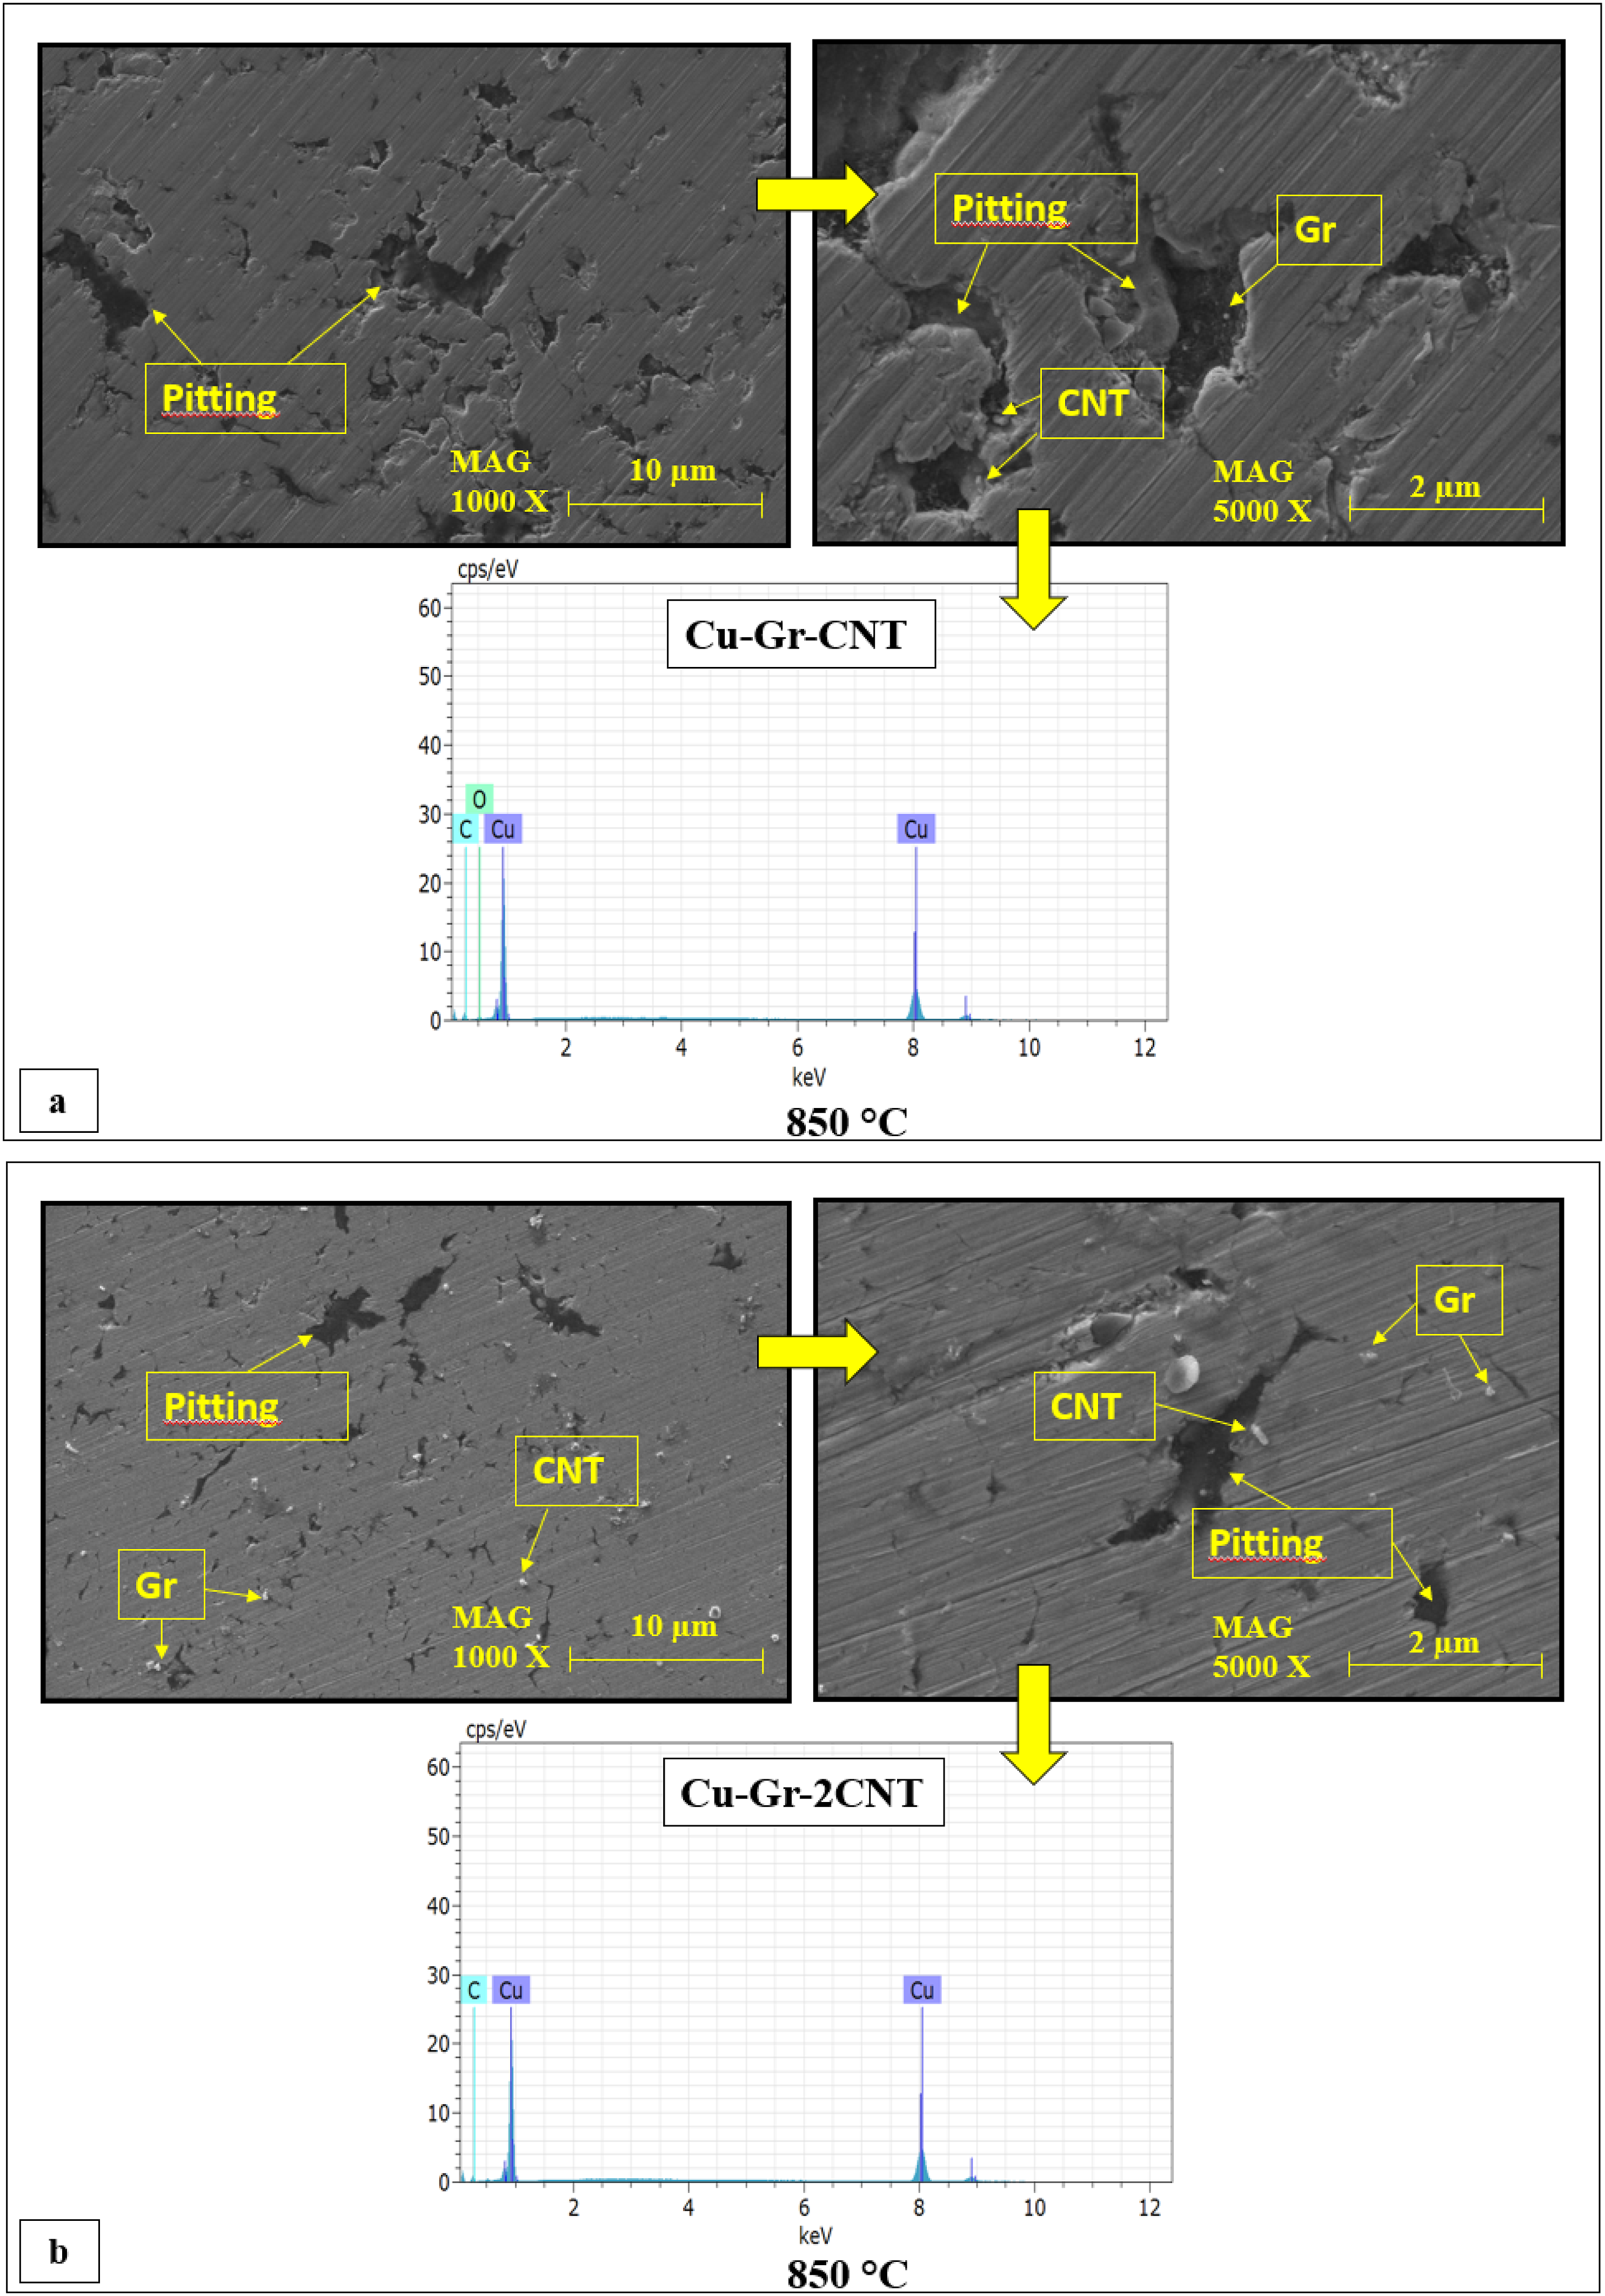
It was determined that the corrosion resistance increased significantly by increasing not only Gr but also CNTs% by weight added to Cu. Among the samples studied, Cu-Gr-2CNT was found to increase the corrosion resistance of Cu-Gr-2CNT by 3.35 times compared to pure copper and by 1.66 to 2.66 times compared to other composites.
Upon examining the SEM views, it was concluded that exfoliation, craters, and cracks were observed after wear testings. Additionally, it was found that pitting, comparable to craters in corrosion, also occurred. The corrosion resistance of Gr-2CNT, which exhibits strong abrasion resistance, was found to be excellent. As it was previously mentioned the presence of Cu2O on Cu reduces the effect of corrosion. However, the formation of Cu2O in the (111) order, as depicted in Figure 2, indicates the existence of a corrosive layer within the structure at a 2ϴ angle of 37°. Such occurrence at the composite interface in the main matrix actually enhances the corrosion resistance.
Conclusions
Copper-based hybrid composites, reinforced with Graphite (Gr) and carbon nanotube (CNT) particles, were produced. The findings from these hybrid composites are outlined as follows: • Gr and CNT reinforcements in Cu - based hybrid composites have significantly improved mechanical, tribological and corrosion properties compared to pure Cu, and gained better results at 850°C sintering temperature particularly in Cu-Gr-2CNT group. • Among the Cu-Gr, Cu-CNT, Cu-Gr-CNT, and Cu-Gr-2CNT composites and for Cu-Gr-2CNT samples achieved a higher value of 51.4% compared to pure Cu sample. • The produced hybrid composites exhibited enhanced tribological properties at 850°C sintering temperature, and a drop in the friction coefficient values of the hybrid composites resulting in an improved resistance to wear. • CNT reinforced composite showed better wear resistance than Gr reinforced composite, and both showed significantly higher resistance compared to pure Cu. • Among all aspects of the outcomes, the addition of Gr to Cu-based composites was found to enhance their wear and corrosion properties in comparison to pure copper. Furthermore, the wear and corrosion resistance of composites containing both Gr and CNT (at a weight ratio of 1% Gr and 2% CNT) showed a significant improvement compared to composites with Gr or CNT added individually.
The current results revealed that the produced Cu-based hybrid composites have good mechanical, wear, and corrosion properties. As a result, it is projected that their use in industrial applications requiring copper-based materials would increase, potentially becoming the preferred option.
Footnotes
Acknowledgements
The authors also express deep appreciation to C. Kursat Macit and M. Horlu for their extremely valuable assistance and help during the research.
Declaration of conflicting interests
The author(s) declared no potential conflicts of interest with respect to the research, authorship, and/or publication of this article.
Funding
The author(s) disclosed receipt of the following financial support for the research, authorship, and/or publication of this article: This work is supported and funded by the Scientific Research Project (FDK-2022-10286 - Atatürk University).
Data availability statement
The datasets generated during and/or analyzed during the current study are available from the corresponding author on reasonable request.