
Abstract
This study focuses on the use of bio-based materials for structural purposes in the packaging field, which requires the identification of their mechanical properties at a representative scale. The mechanical properties of bio-based materials are more variable than those of traditional composite materials. In a standard characterization approach using elemental coupons under uniaxial loading, the variability depends on the chosen representative elementary volume (REV), free edges, boundary conditions, etc. for elastic properties that are not identified for representative working conditions; this could lead to the ineligibility of these bio-based materials as structural materials. This paper contributes to the debate on how to study the response of bio-based materials within a structure, here a packaging structure as a logistic unit (LU) subjected to a compressive load simulating storage and stacking conditions. In the set of tools and methods for the design of packaging materials made of bio-based materials, an elastic nonlinear geometric finite element model (FEM) and an experimental approach are presented. The FEM allows the numerical identification of zones of interest within the LU. Inevitably, the FEM classically requires input data which are elastic properties of the equivalent homogeneous material. The design of the FEM is based on a calculation-test approach using an existing reference LU and it can be summarized in two main steps. The first step concerns the development of a FEM able to restore the experimental conditions of vertical compression imposed by transport standards for packaging. The second step is based on updating the input properties of the FEM by reverse identification, to achieve the representative working condition properties, using experimental results obtained on the existing reference LU. For the reverse identification a multi-scale investigation is mandatory. For this purpose, the linear elastic part of the load/vertical displacement curves (at the LU stiffness scale) and the displacement and strain fields measured (at the local LU scale) by 3D digital image correlation (3D DIC) are evaluated. Then, FEM property updating is carried out by reducing the deviation of displacement/strain fields between FEM and experimentally measured results (3D DIC). Finally, we explain how FEM and 3D DIC help in decision-making by allowing the recognition of zones of interest in a phase of design of new LUs with the concept of Multi-Instrumented Technological Evaluator (MITE).
Keywords
Introduction
Types of packaging
One of the main roles of packaging is to protect the product from mechanical loadings that may occur during distribution and transportation. Three types of industrial packaging are used 1 : (i) primary packaging, which is the container that is in direct contact with the product, (ii) secondary packaging that is used to cover the primary packaging in order to group a number of items together to make a sales unit and (iii) tertiary packaging, which is used to unitize large quantities of products or packages and transport them safely. Industrially this last packaging type is called unitized load or a logistic unit (LU). In this study we will focus on tertiary packaging. According to Jukes, 2 the level of content protection required is determined by the rigidity of the packaging box or the unit used, as well as the severity of the risks to which it may be exposed during transportation.
Interest of bio-based materials for packaging
In an era where ecological impact is one of the major preoccupations in logistics, many companies are beginning to incorporate bio-based materials into their packaging strategy to counter some of the environmental impacts generated by traditional plastic packaging,3–5 and reduce the use of non-renewable raw materials, particularly petroleum. 6 This reduced dependence on hydrocarbons is one of the long-term economic benefits promoting the use of bio-sourced packaging, as it is derived in most cases from abundant renewable resources such as wood, bamboo or flax. 7 These materials have mechanical, thermal and functional properties that make them candidates for bio-based packaging applications.4,5,8–14 To date, bio-based packaging has been widely applied in the food and cosmetic field as primary or secondary packaging.15–19
Bio-based material mechanical properties for structural applications - case of tertiary packaging
No published study was found on the use of bio-based materials for the development of more structural components such as tertiary packaging or logistic units (LUs). For these units, the knowledge of the mechanical characteristics of the materials as a function of their manufacturing process is essential for the dimensioning.
It is well known that composite materials exist as structures. For example, in aeronautics, composite materials for structural applications are developed using a test pyramid approach. 20 This approach involves five levels of mechanical tests at different scales. The first level consists of characterization of numerous standardized test coupons to determine key mechanical properties such as the Young’s Modulus and ultimate strength and failure modes. The second level concerns the evaluation of the load capacity of structural basic elements. The third level is defined as the assembly of two or more basic elements to create structural details. The fourth level is then devoted to gathering several details to assemble a component. The final level considers testing of the whole component or structure. As can be inferred from the description, the test pyramid approach is long and costly, thus, becoming economically prohibitive in the field of packaging that is extremely cost sensitive.
In this paper, the aim is to focus on the response of the material within the structure. The development of tools and methods adapted to the design of structures using composite materials with high variability21,22 such as bio-composites is proposed. The development phase is based on an existing logistics unit, which is called the reference LU, presented in §2. One of the tools is the finite element model (FEM) of the reference LU. To develop the FEM presented in §4, it is proposed to study the response of the bio-based material employed in the reference LU. This study is based on a dialogue between FEM (geometrically nonlinear elastic model) and experimental tests using Digital image correlation for the case of compression loading presented in §3. An approach to update mechanical property values of a REV (from elementary coupons) by reverse identification23–26 is performed until a reasonable correlation is obtained between strain fields measured on the reference logistic unit and those calculated from the FEM presented in §5. Then, the FEM with updated input data is used to enable the numerical localization of zones of interest within the logistic unit under the compressive loading presented in §6. Based on experimental findings, the zones of interest are those where the behavior of the material is assumed to be elastic without damage, according to FEM. These zones of interest have areas and boundary conditions that are more representative of the material within the structure and its working conditions compared to the REV of an elementary coupon under uniaxial loading far away from the working conditions.
To study LUs experimentally, Digital Image Correlation (DIC) is used. Indeed, the DIC technique has been successfully applied to monitor in situ displacement fields of homogeneous27–31 and heterogenous23,32–35 materials under mechanical loadings. DIC has also been used to validate FE models that simulate compressive loadings on cardboard packaging.36–38 Fadiji et al. 36 used 3D DIC to visualize the full-field displacement of corrugated paperboard packaging subjected to compression loading. Also, strain field distributions were derived from displacements, where the technique proved to be efficient in providing reliable information on the displacement and strain fields at the surface panels of this type of package. Viguié et al. 37 used DIC to analyze the out-of-plane displacement behavior of cardboard boxes during their compression. This technique provided relevant information about outer liner displacement and strain fields; therefore, the stress field of the panel could also be estimated. Furthermore, the displacement field was smoothed because it couldn’t be used in its raw form to calculate the strain field given the heterogeneous behavior of the material. However, these latter studies were limited to studying the mechanical behavior of the packages with small dimensions belonging to the secondary packaging category. To date, there are no studies that develop a reverse properties identification approach based on the DIC method on tertiary packaging to identify material properties considering not only its geometrical aspect but also its associated boundary conditions.
This paper presents a set of original tools and methods for the identification of mechanical properties of bio-based materials for structural applications. The proposed work focuses on the mechanical characterization during the compressive loading of the packaging. This choice depends on the loading conditions during storage and stacking during transport. A FEM of a compression test on a reference LU, simulating stacking conditions, is developed. Vertical compression tests on the same unit, instrumented by 3D DIC, are carried out to allow a calculation-test dialogue for material mechanical property updating by reverse identification to reach a reasonable correlation.
Bio-based material of the reference logistic unit
A unit qualified for transporting goods, the plywood box RAJA CB1286,
39
was chosen as “reference LU” cf. Figure 1. It is a container with the following dimensions: 1200 mm length, 800 mm width and 600 mm height. The unit consists of a set of 4 birch plywood lateral panels 6 mm thick. The plywood panel is made of 5 birch plies with a stacking sequence of [90/0/90/0/90], where 90° corresponds to a ply with its fibers in the length direction. The stacking sequence provided by the supplier is not optimal in terms of fiber placement in the panels because the fibers are not predominantly in the direction of stress flow (i.e. vertical compression being height direction). To manufacture these panels, the plies are assembled by gluing and hot pressing. Then they are linked together by angle irons which allow storage or transport of the LU in a space-saving manner by folding them up. The bottom and the cover are also made with the same plywood material and process. Reference Logistic Unit
39
(on left) and plywood panel (on right) with the detail of a homogenized REV.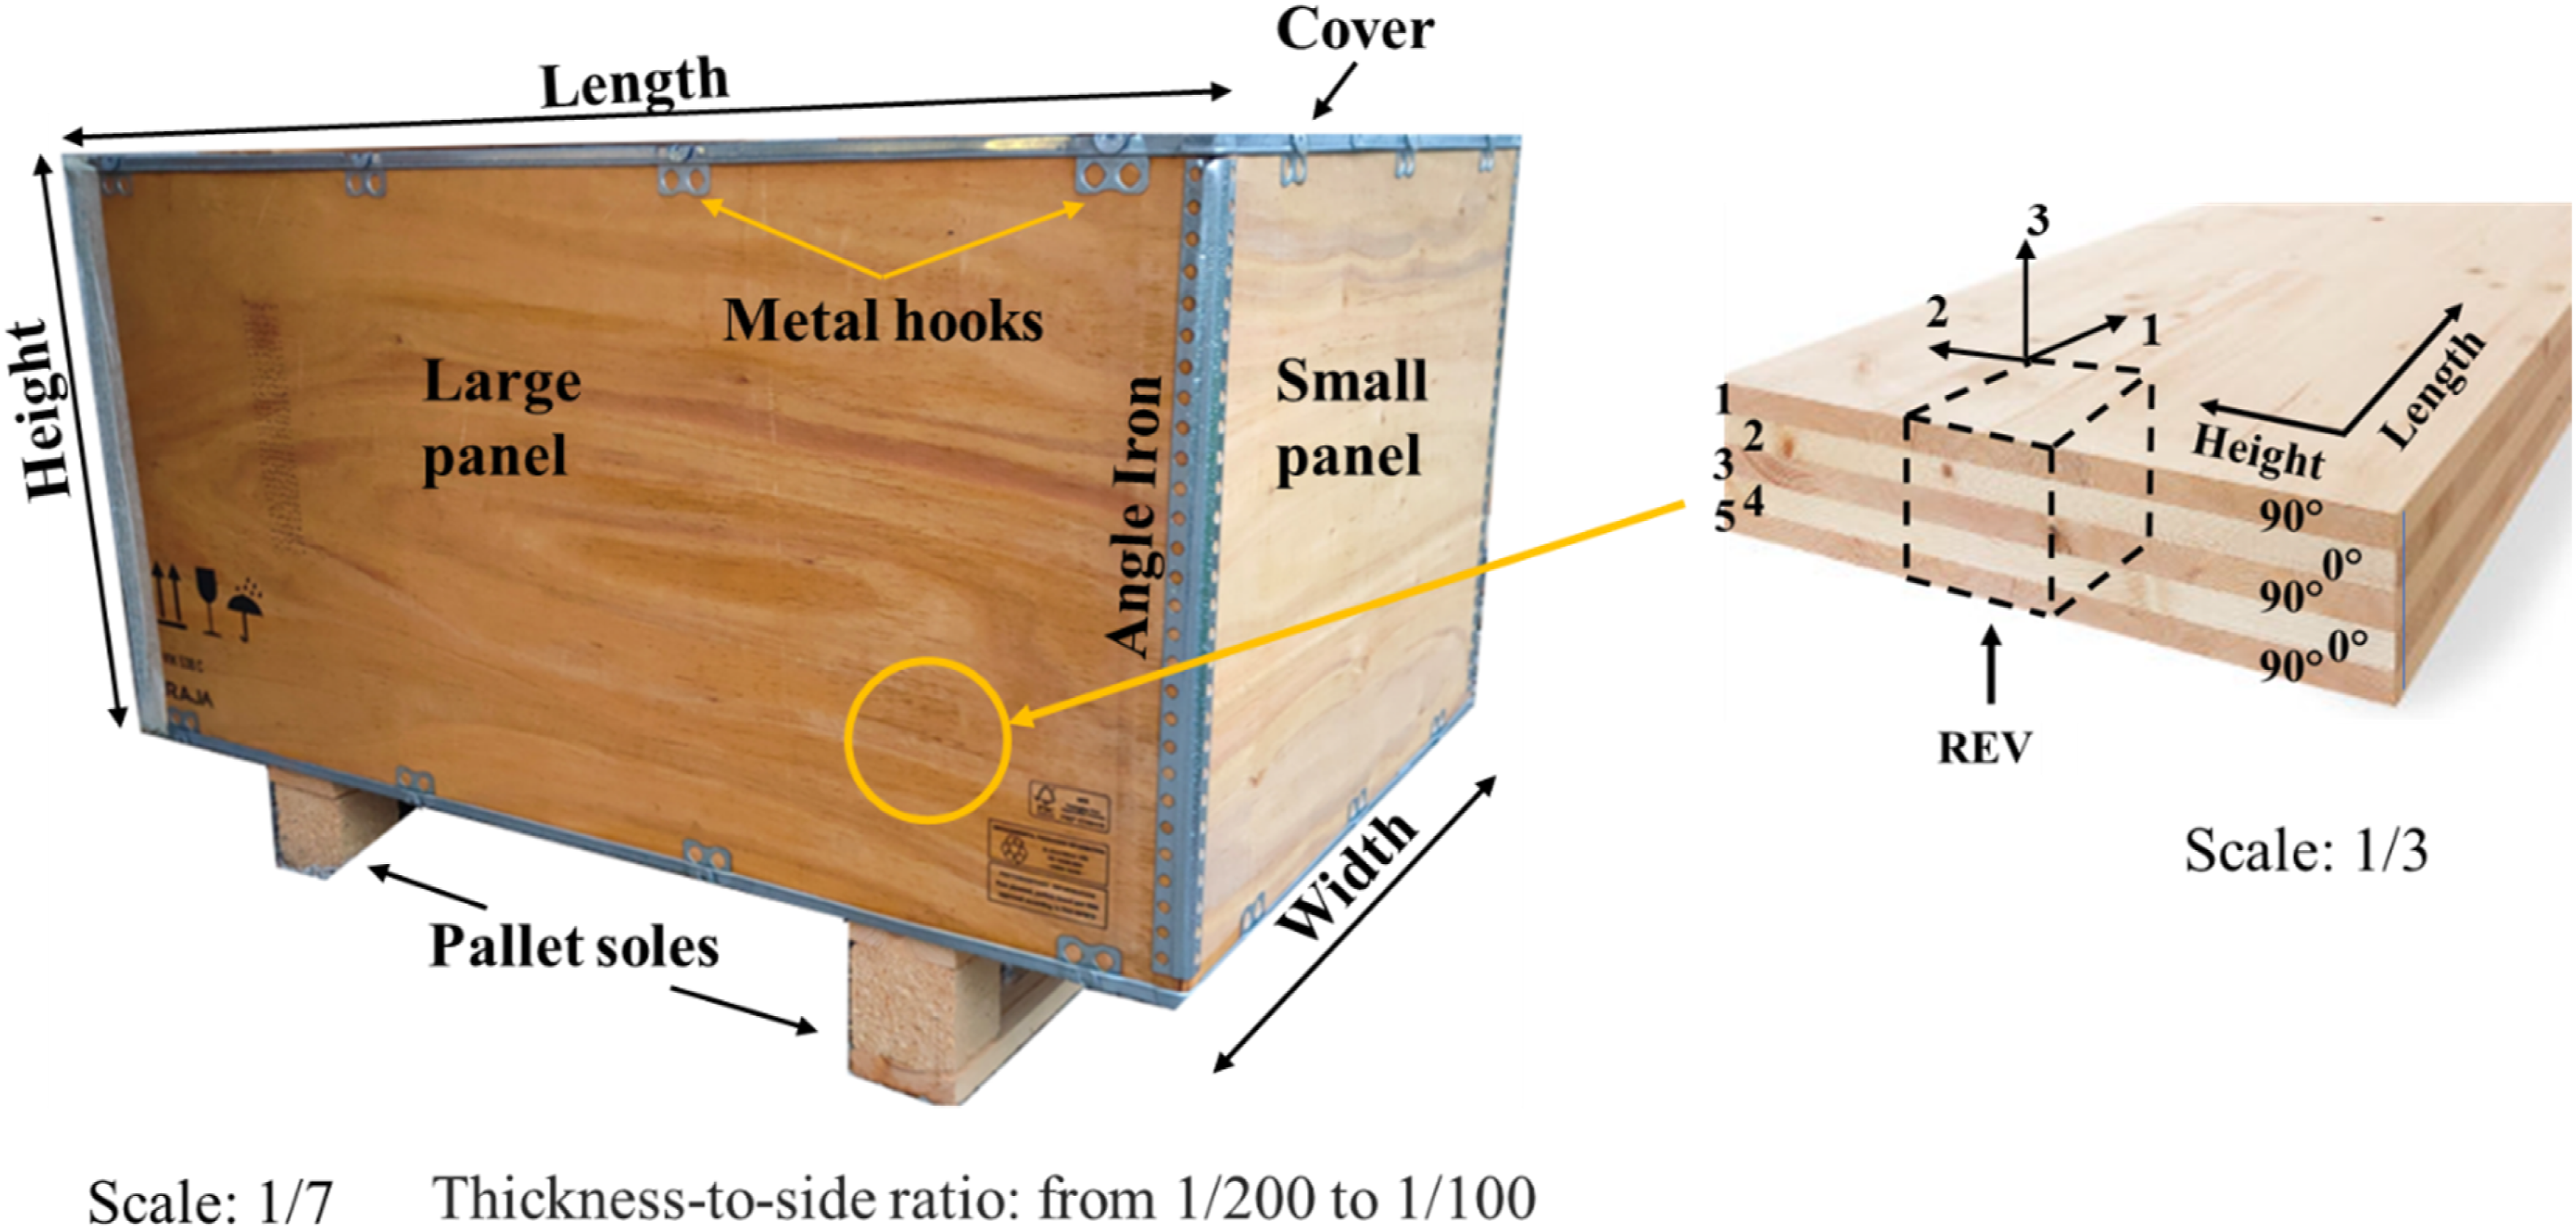
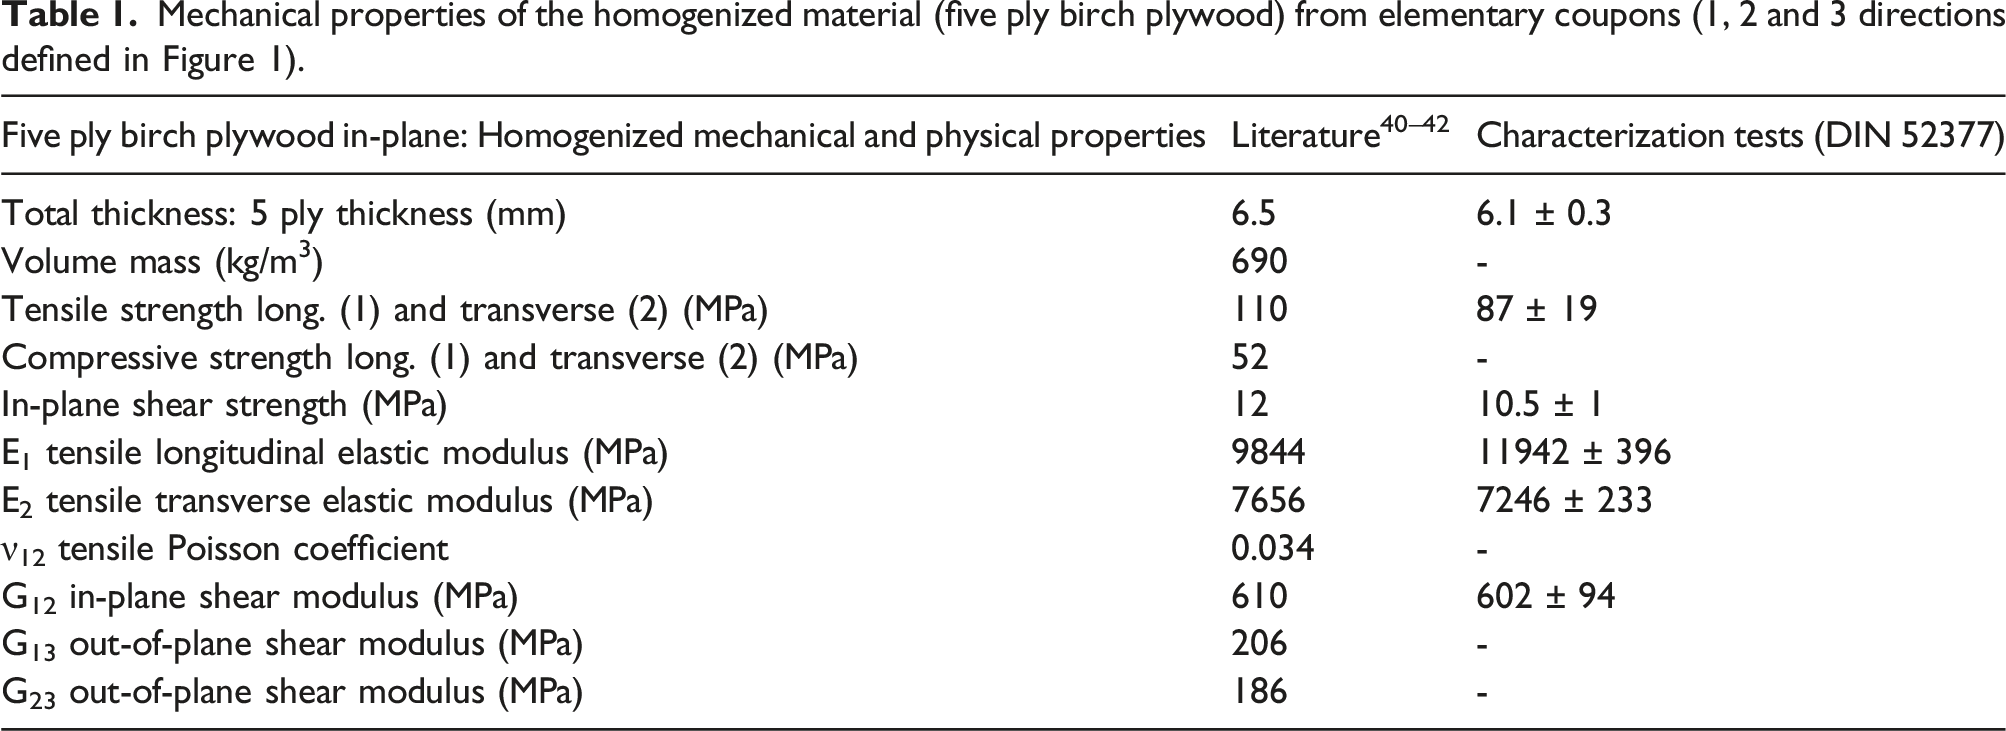
Mechanical properties of the homogenized material (five ply birch plywood) from elementary coupons (1, 2 and 3 directions defined in Figure 1).
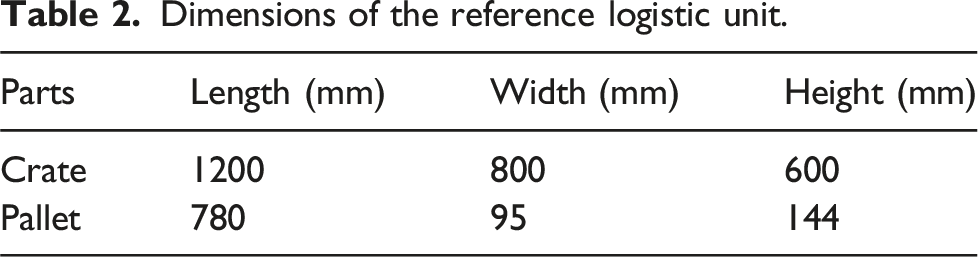
Dimensions of the reference logistic unit.
Experimental set-up for LU in compression and measurement method
Experimental set-up
As already discussed above, our objective is to put the bio-based material into representative working conditions within the structure of a chosen LU. To do this, we propose to recreate the compression loading applied on the LU produced under storage and stacking conditions. Compression tests were performed in compliance with the ISTA 3E transport standard
43
by means of a compression machine dedicated to the qualification of packaging containers; the Zwick Roell Z100 TEW compression machine with a 100 kN load cell, available on the ILIPACK platform
44
cf. Figure 2. To obtain representative conditions, a pallet is placed on the top of studied LU, cf. Figure 2. The LUs are preconditioned at the ambient temperature and humidity of the laboratory for 24 h before the test. Five tests were performed to evaluate the standard deviation of the plywood material and the structural behavior. A 12.7 mm/min (half-inch per minute) compression displacement rate of the was applied on the LU loaded up to 800 daN (approximately to the force applied by an 800 kg container placed on top of the LU) to stay within the material elastic domain. Vertical compression test representative of stacking and storage conditions with 3D DIC system targeting the large LU panel.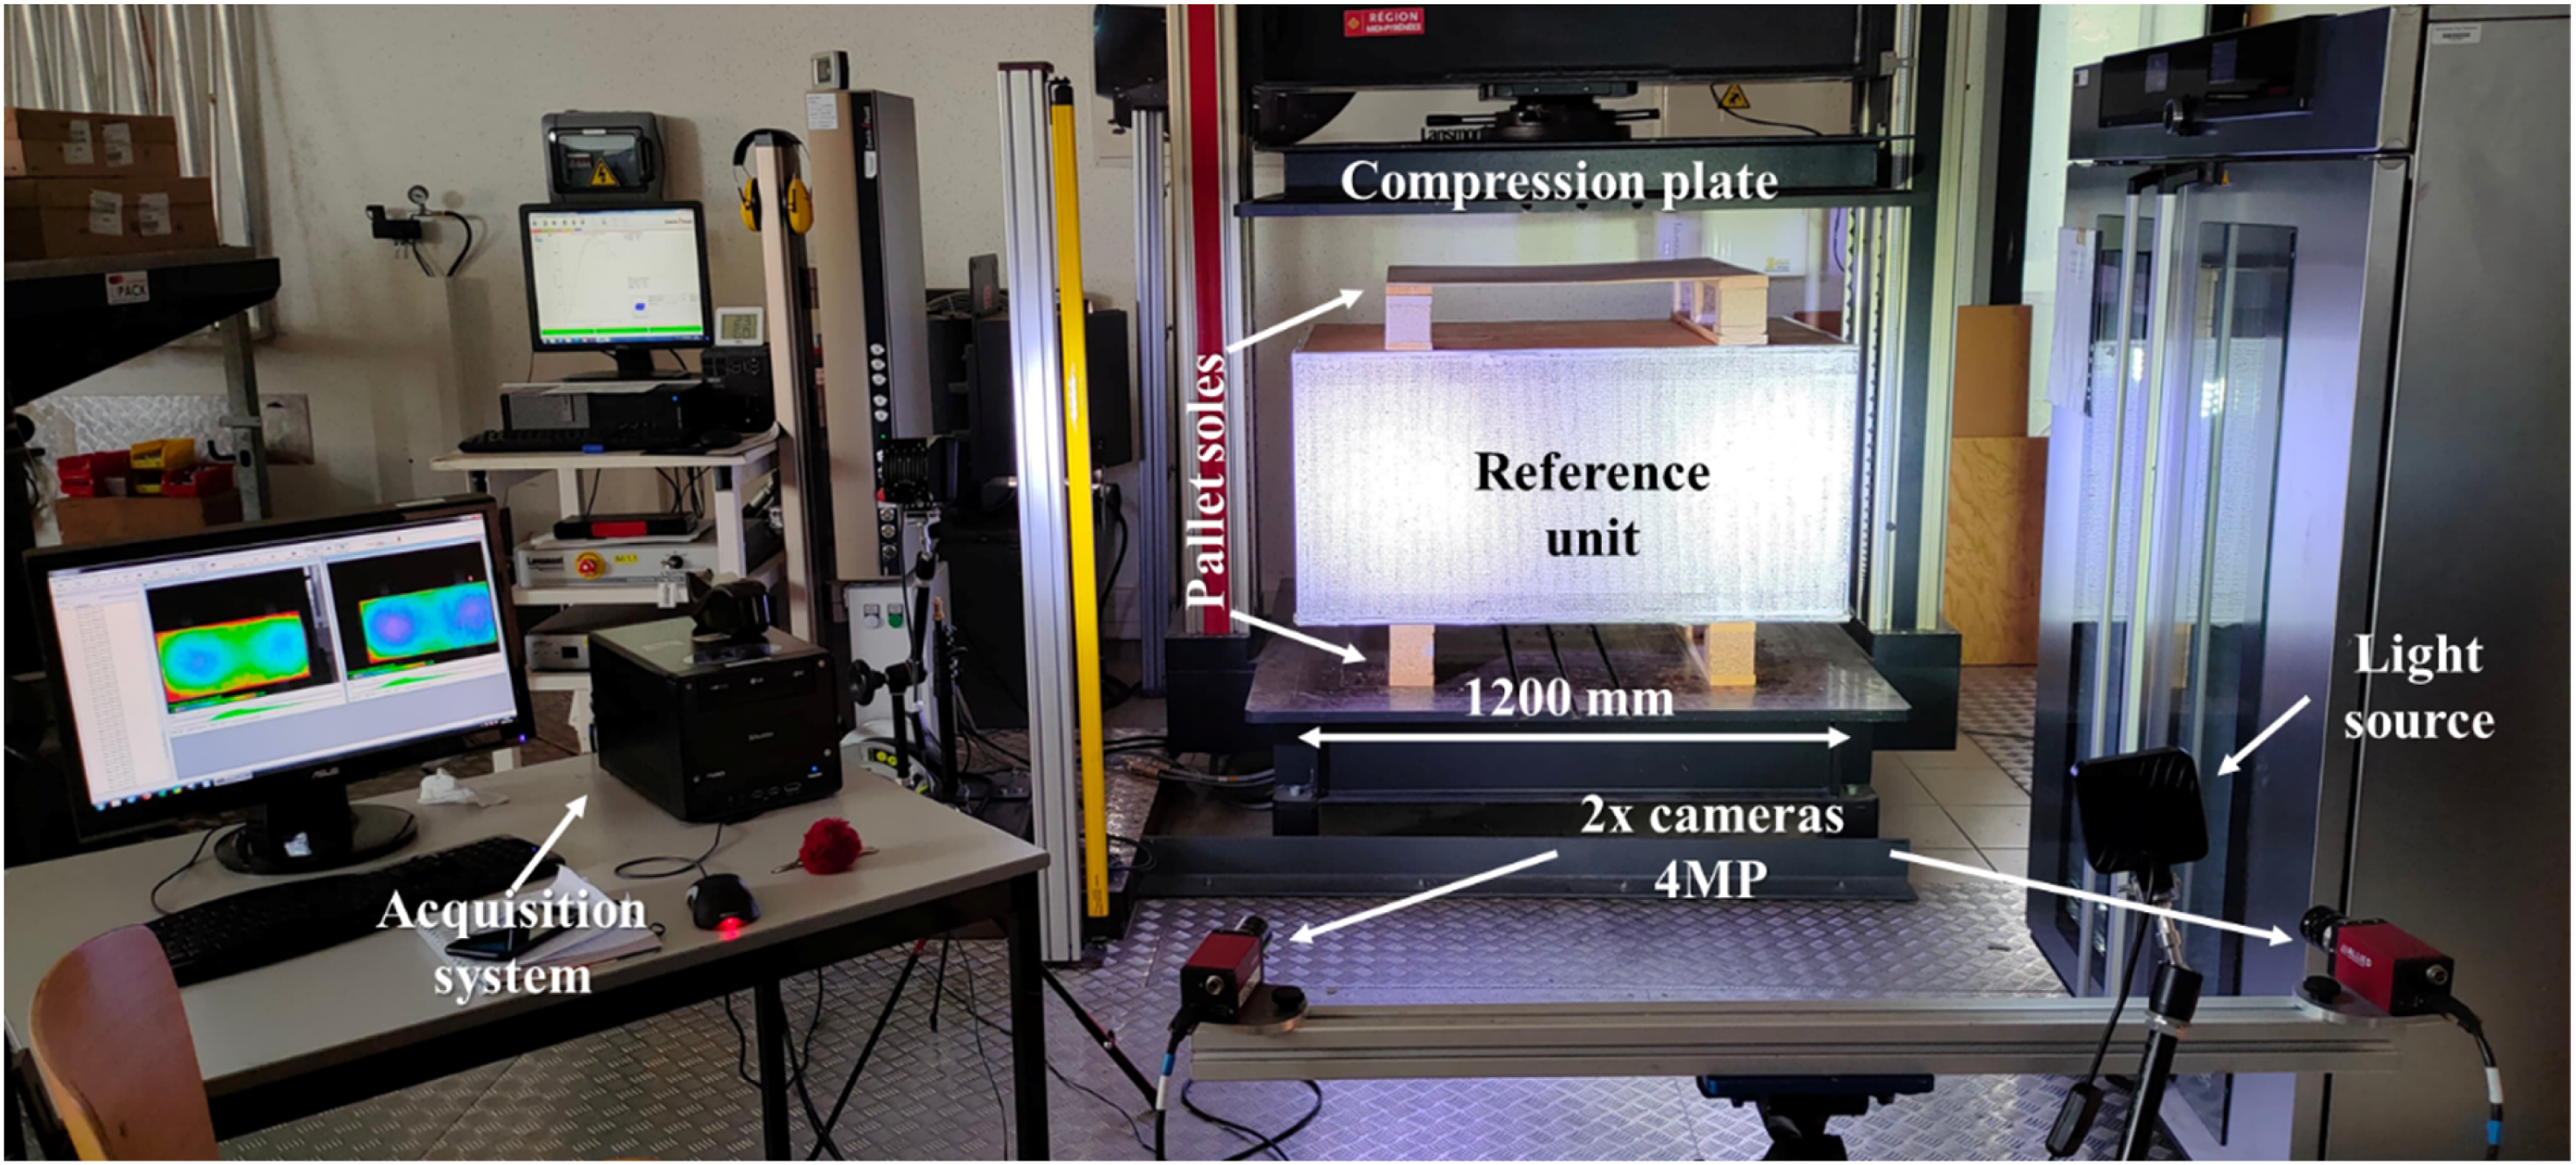
LUs show significant out-of-plane displacements at the center of the large LU panels compared to the LU small panels. The displacement field was found to be symmetrical for all large LU panels. For this reason, it was chosen to use only the displacement field from half of a large LU panel to perform a more detailed analysis. Among the zones associated with such displacement fields, the zones of interest were chosen. As mentioned before, these zones of interest have an extended area and boundary conditions that are more representative of the plywood material within the LU than those of the REV elementary coupon under uniaxial loading.
Determination of 3D digital image correlation parameters
The tests were monitored using the digital image correlation method (3D DIC) to identify the displacement fields on half of a large LU panel during the compression loading tests. Image processing using any image correlation software depends on several parameters to run in an optimal way and give acceptable results; these include the subset size, the step, and the filter size. 45 The subset size is the area of interest that is used to track the displacement between selected images. To obtain a credible correlation analysis in DIC, the size of a subset must be large enough for the intensity pattern contained in the subset to be sufficiently distinctive to differentiate it from other subsets, but not too large to prevent the loss of more localized resolution. The step size is a parameter that controls the density of points (subset centers) at which DIC data is computed, and it influences the spatial resolution of the measurements. Typically, a step size of one quarter to one third of the subset size is recommended,45,46 so that neighboring subsets partially overlap, and also to avoid having repetitive data and long computational time. A step of 2/7 subset size is used in this work.
Since the displacement field obtained by the DIC method is noisy, its numerical derivation would lead to even noisier strain maps. In the VIC® software (VIC-2D®/VIC-3D® from Correlated Solutions), for example, the strain provided to the user corresponds to an average of the strains calculated in a close vicinity of the point considered. The user specifies, in addition to the size of the DIC area of interest (subset) and the step, the value of a parameter called “filter”, that determines the number of points to be considered in the proximity to evaluate the strain. 45 In practice, the number of neighboring points used is mandatory. The size of the virtual gauge for strain calculation depends on this filter number and the step size. Thus, a parametric study of the VIC 3D® software is essential in order to optimize these two parameters during the calculation of the displacement and strain fields of the structure.
Figure 3 shows the effect of subset size on the displacement error for the unit compression test for a particular lighting configuration. For small subsets, the error varies inversely with subset size. However, for larger subsets, the error approaches an asymptote value. Similar trends have been reported in literature studies.47,48 The displacement errors obtained in the present study range from less than 5 × 10⁻³ to 2.2 × 10−2 pixels. The subset size that offers the best compromise between spatial resolution and displacement accuracy lies just below the asymptote; larger subset sizes do not further reduce the displacement error, but they lower spatial local resolution. The optimum range of subset sizes that should be used in image analysis lies between 50 and 100 pixels for approximately 5 × 10−3 pixels of displacement uncertainty. 3D DIC measurement error on displacements for different subset sizes, location of the chosen value (79 pixels).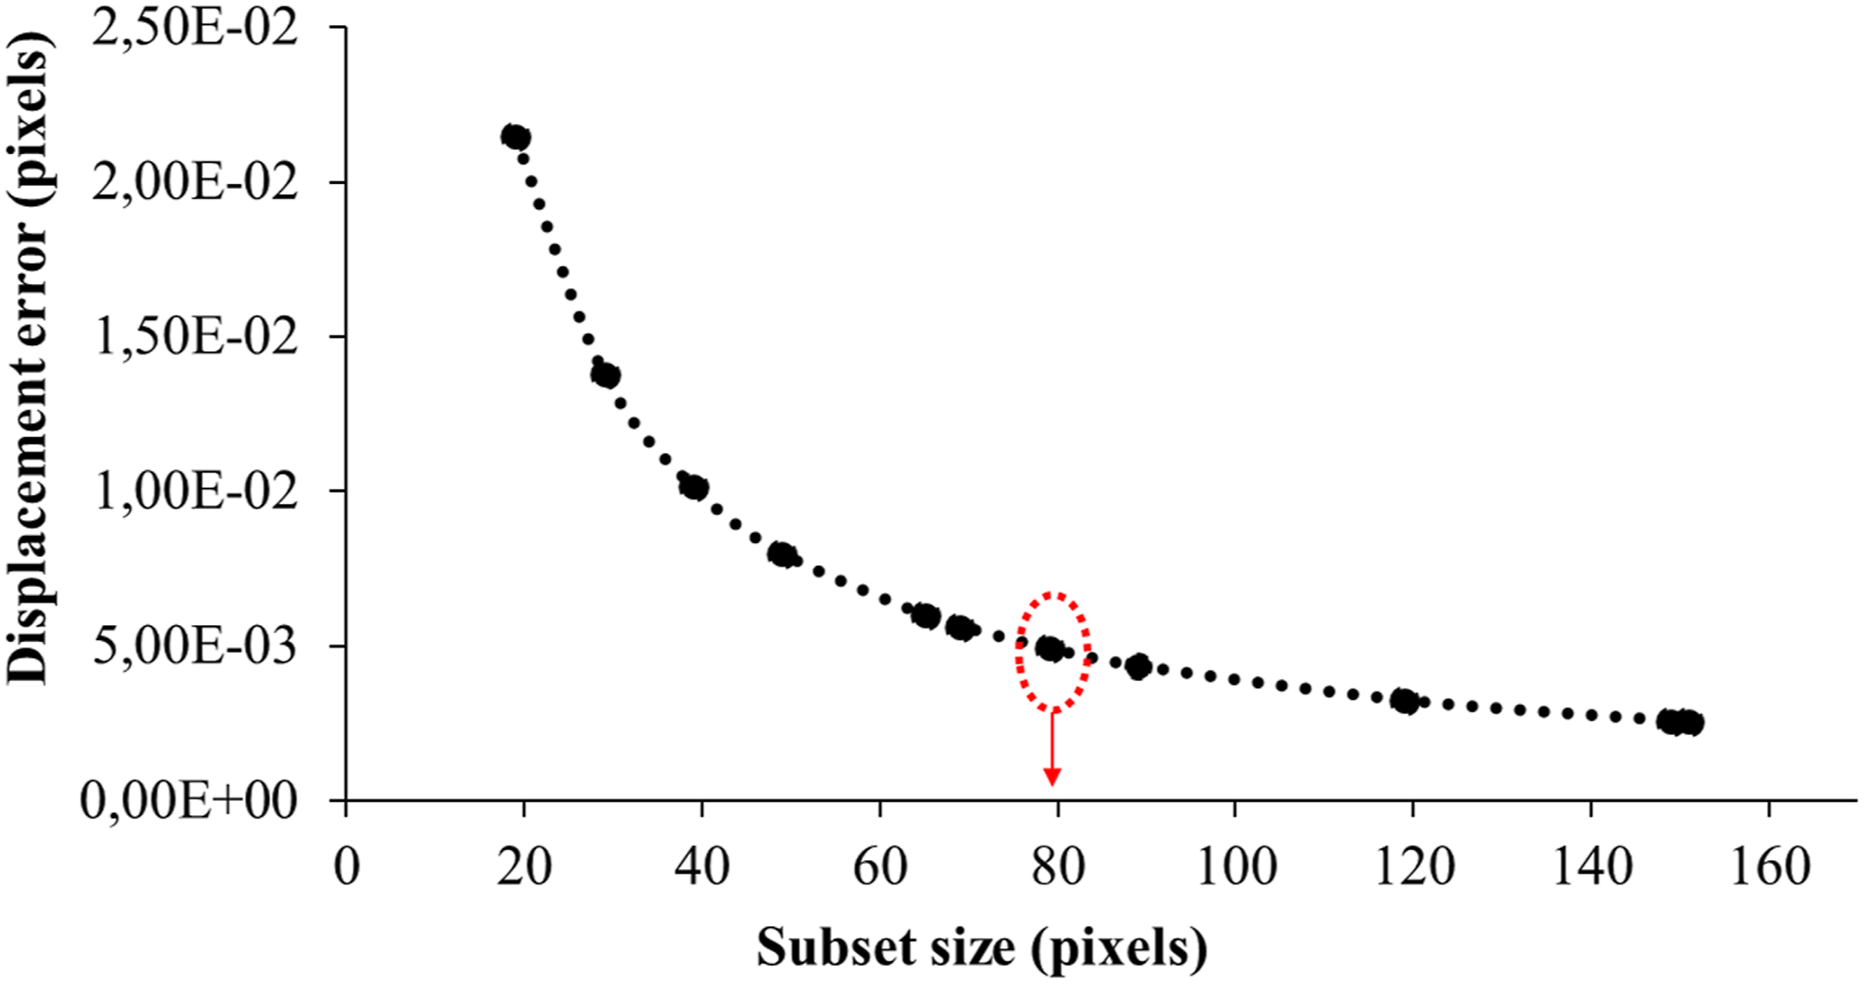
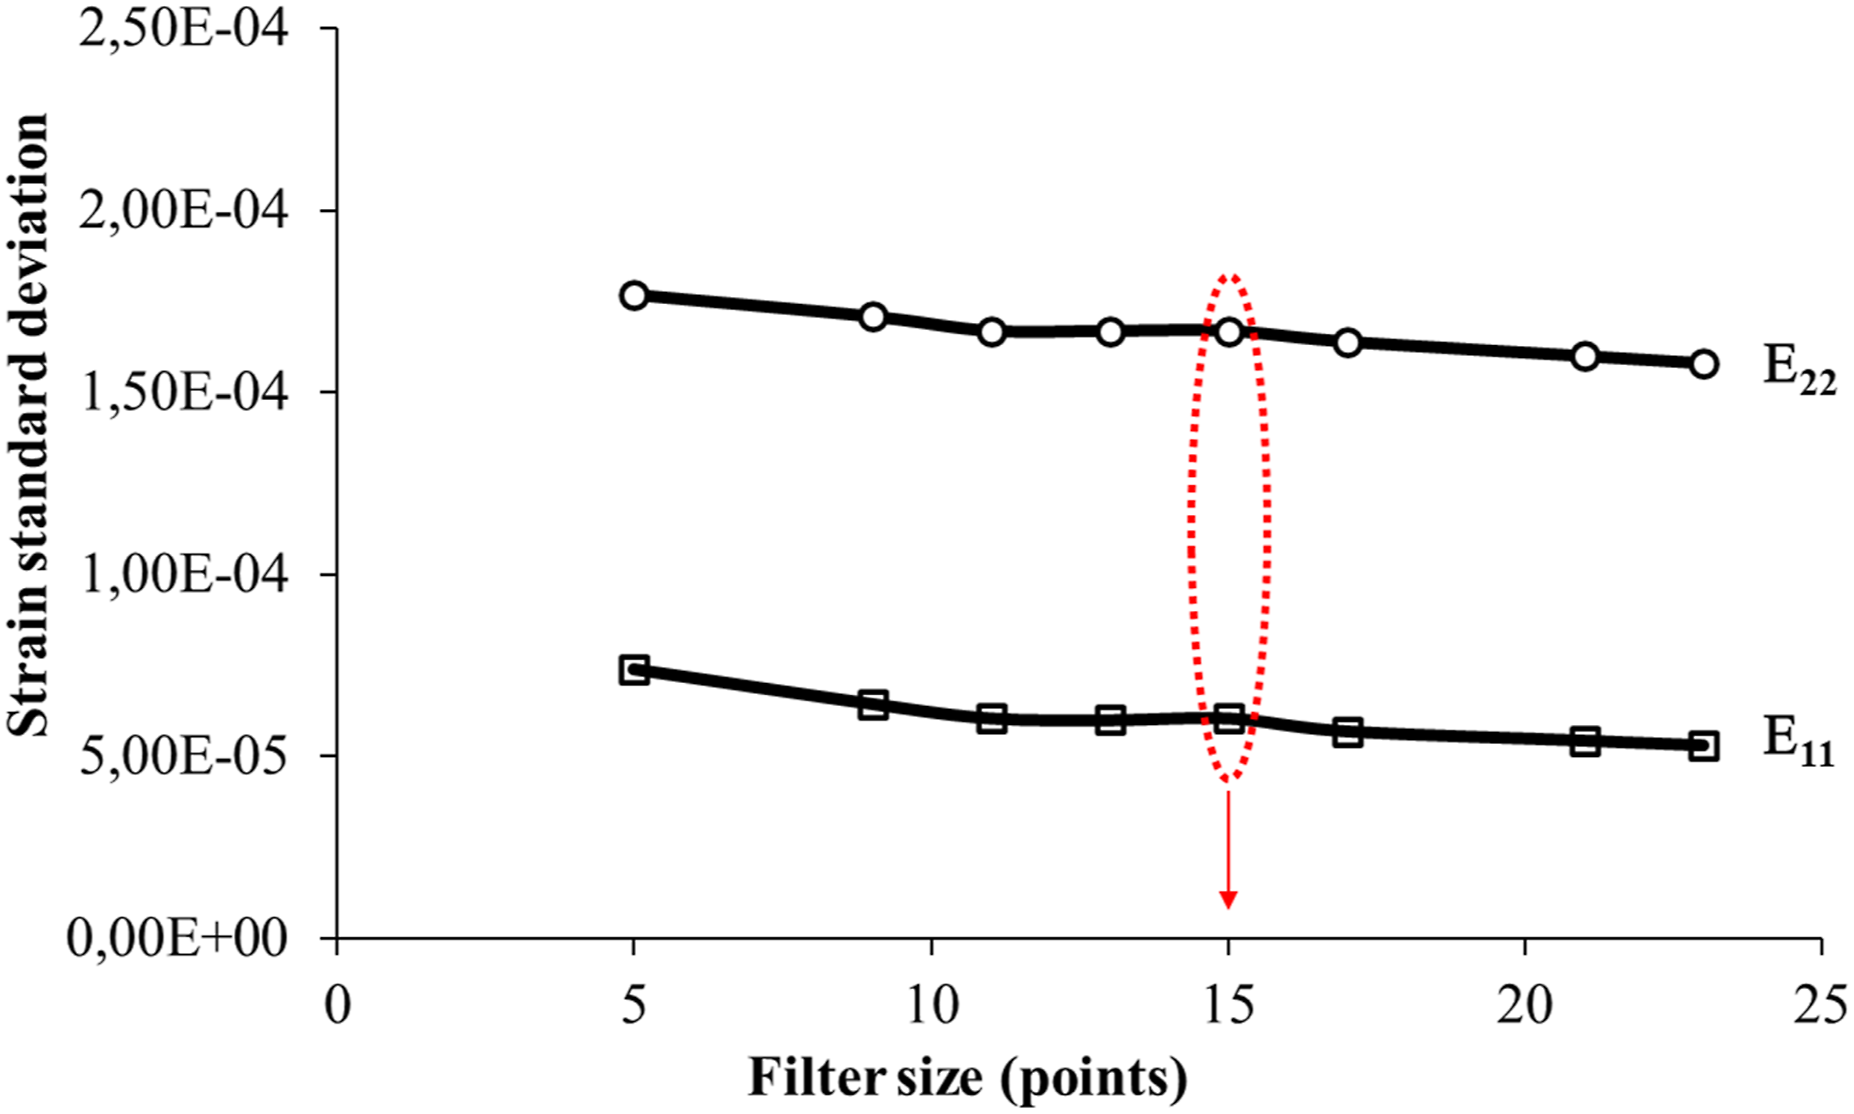
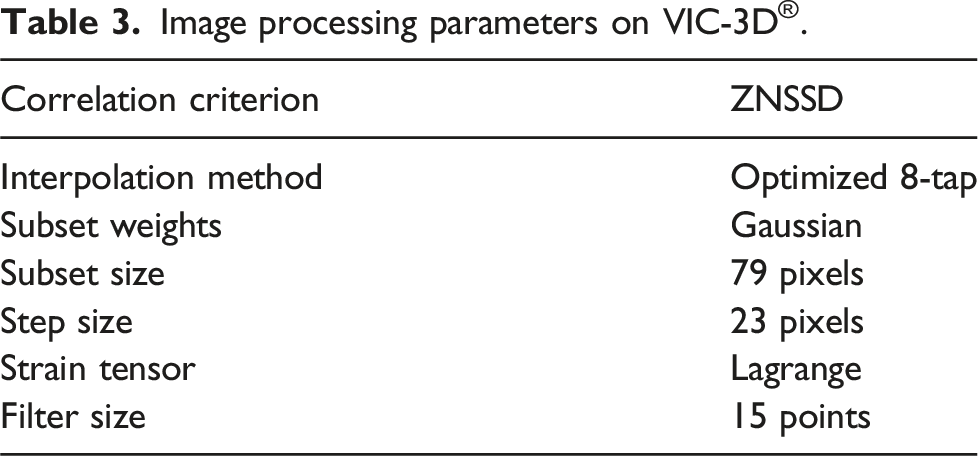
Random strain errors are reduced with increasing subset size, due to greater confidence in image correlation when more details are available in larger subsets (smoothing effect), resulting in lower standard deviations (SD) cf. Figure 4, as reported previously.45,49 The SD reflects the deviation of measured displacements from their mean value. Figure 4 shows the trend of strain standard deviation asymptotes towards a constant value, as seen with displacement errors from a range of 60 to 90 pixels. Based on these two graphs a subset size of 79 pixels was chosen for the image processing. Similarly for the size of the filter, several filter sizes were varied to examine their effect on the strain SD, cf. Figure 5. A 15 points filter was chosen to define the virtual strain gauge size for the calculation of the strain fields. The chosen parameters for displacement measuring are given in Table 3. Strain standard deviation variation at 780 daN of load as a function of subset size, location of the chosen value (79 pixels). Strain standard deviation variation at 780 daN of load as a function of filter size, location of the chosen value (15 points). Image processing parameters on VIC-3D®.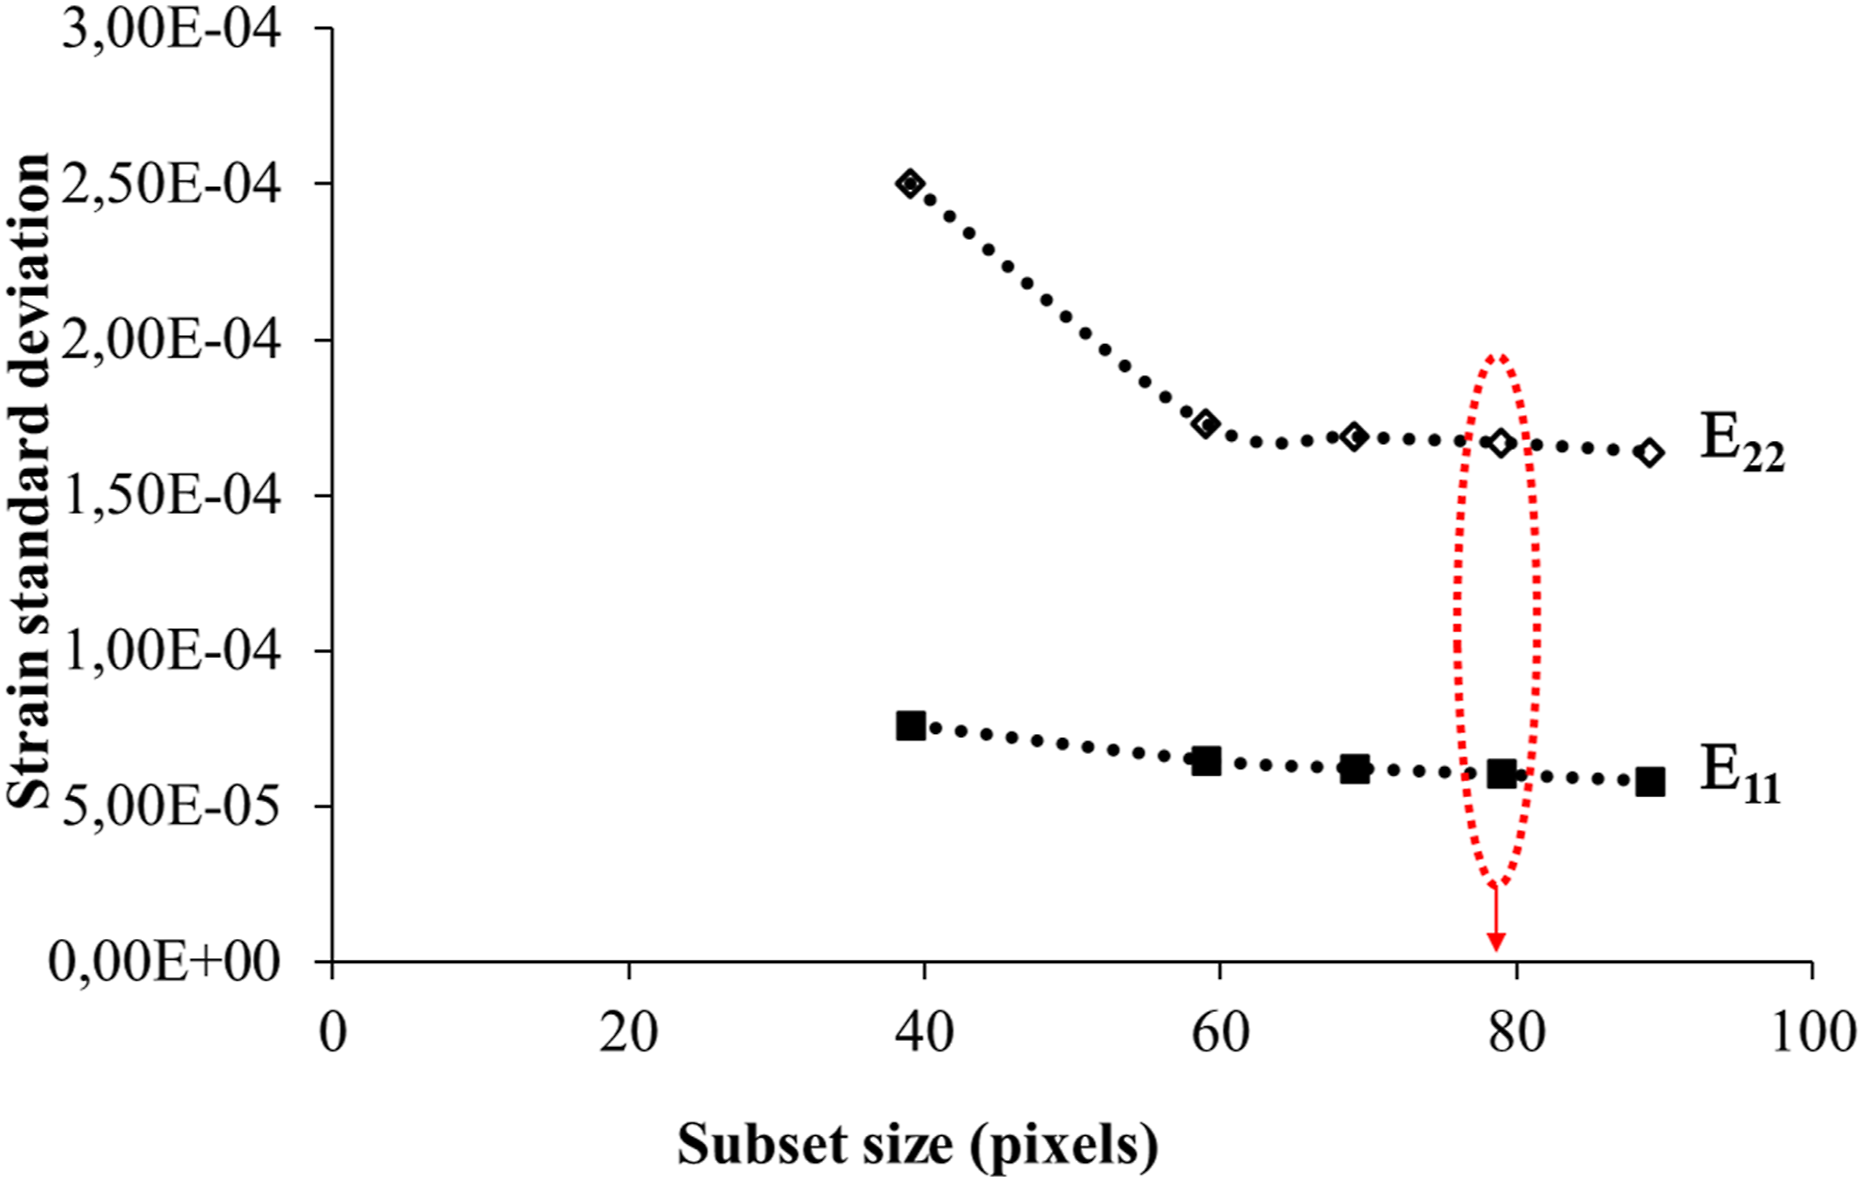
Figures 6 and 7 show, respectively, the distribution field of the out-of-plane displacement U3 and the transverse strain E22 of the half of large LU panel face before and after changing the VIC-3D® software parameters. A minor change can be seen in the distribution quality of the out-of-plane displacements, noting that the response is more averaged in the case of the 79 pixels subset. However, the strain field’s distribution is more homogenized in the case of the 15 points filter for a suitable comparison with the FEM, which is fed by homogeneous orthotropic material properties. Out-of-plane displacement U3 field’s distribution with, (a) 39 pixels subset and (b) 79 pixels subset. Transverse strain E22 field’s distribution along y direction for 79 pixels subset with, (a) 3-point filter and (b) 15-point filter.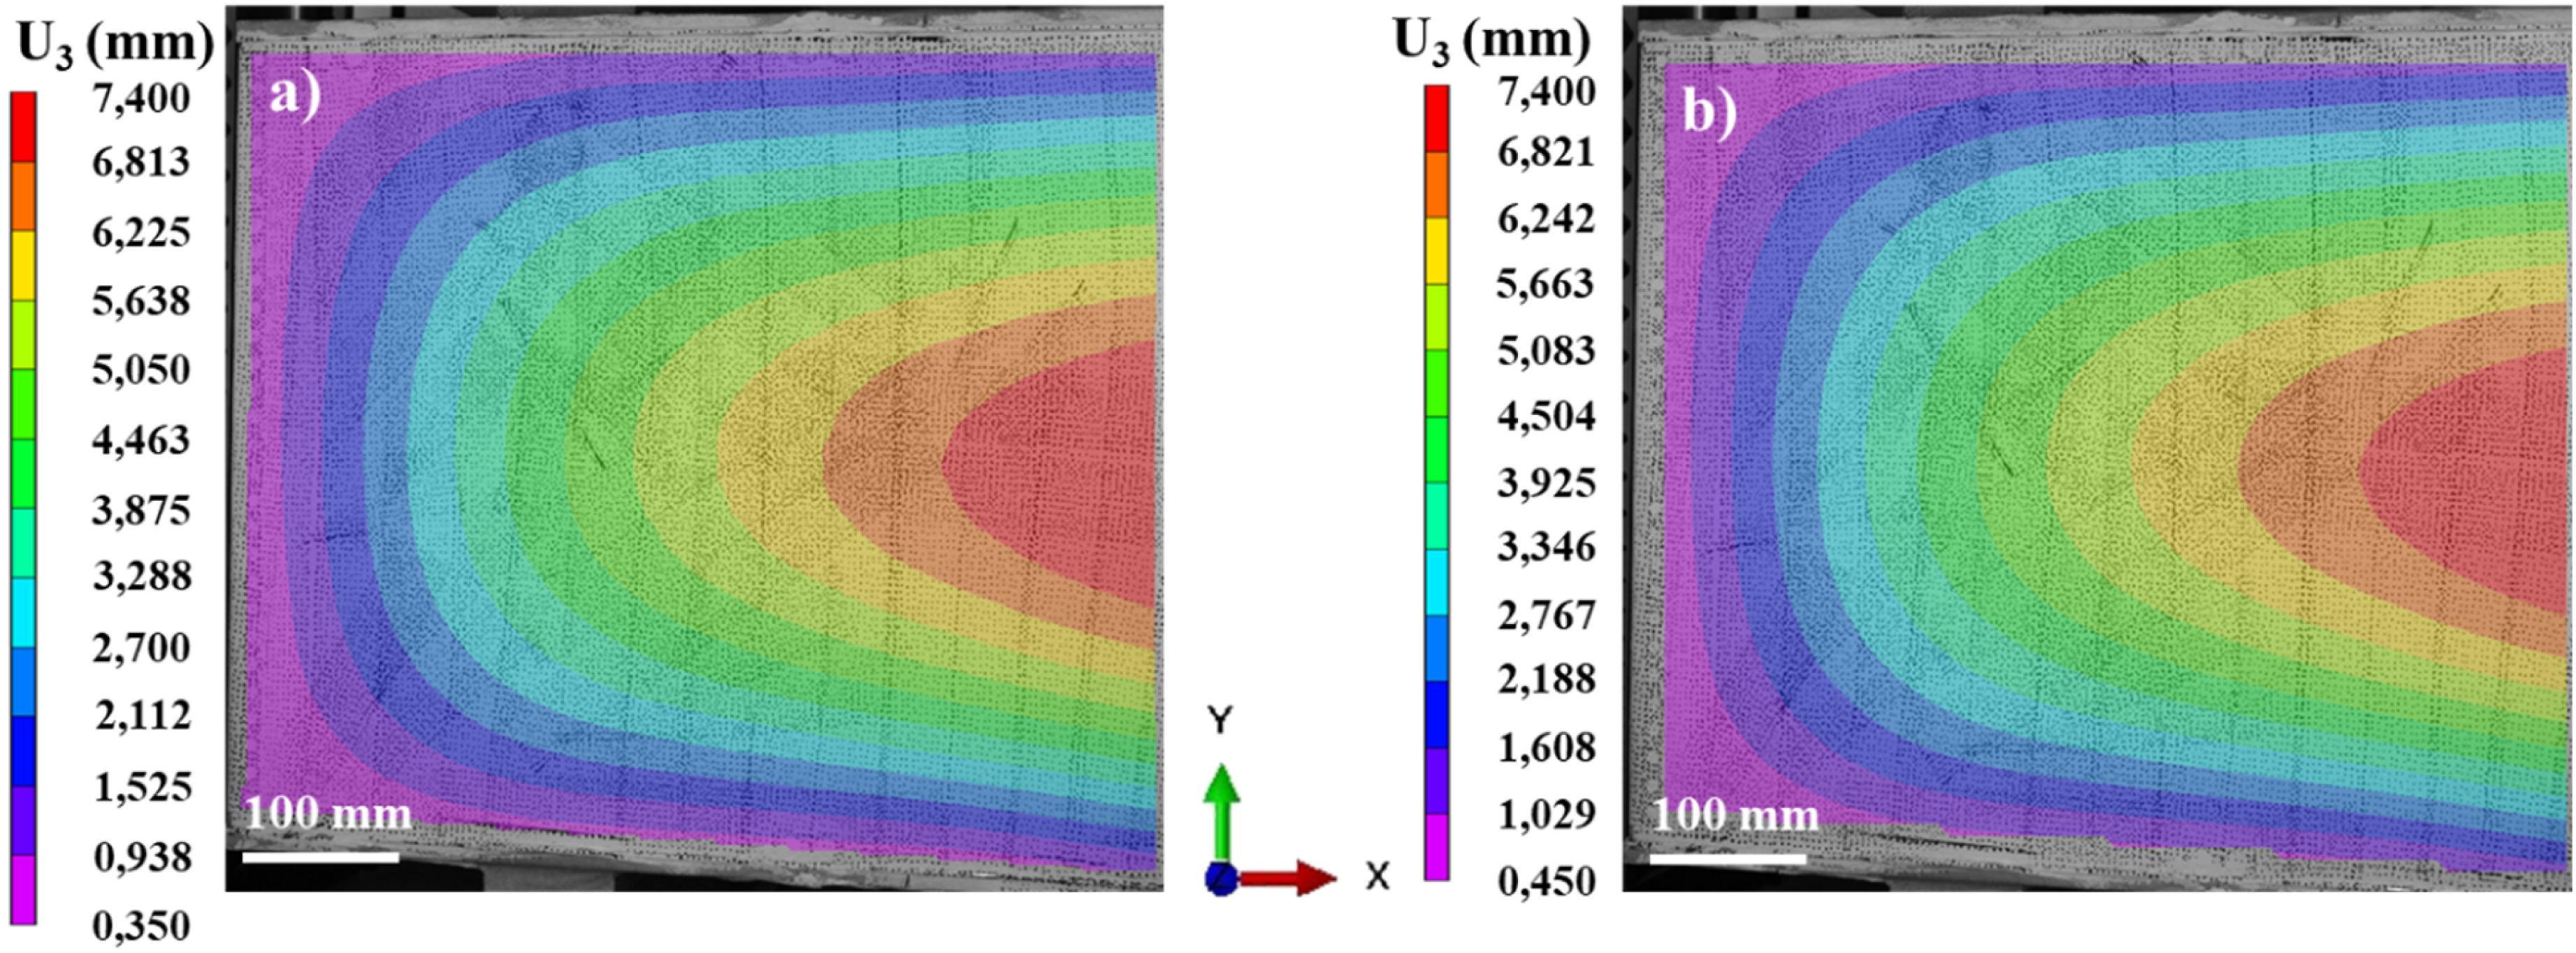
Finite element model of the reference LU under compression
A geometrically nonlinear elastic Finite Element Model (FEM) was developed using ABAQUS® software to simulate the compression loading on the studied LUs. The representation was made within the framework of Continuum Mechanics, using the elastic properties of an equivalent homogeneous material. The starting point of the calculation-test dialogue is the values of the elastic properties obtained from birch test coupons,40–42 mentioned in Table 1. These calculation assumptions are obviously far removed from the reality of the bio-based material in the panel because the local bio-based material heterogeneity is not accessible21,22 and our main objective is to develop operational tools for LU design.
The different parts of the LU were modeled using quadrilateral linear shell elements, except for the pallets which were modeled using deformable volume elements to facilitate the constraint description (i.e. load transfer with the cover and the bottom by surface/surface general contact and stiffness pallet representation), cf. Figure 8. The moving compression plate was modeled using rigid shell elements. The material assigned for the lateral plywood LU panels, bottom and cover is birch plywood with a thickness of 6 mm, with property values homogenized from five plies, cf. Table 1. The material used for the pallet was poplar (wood species), considered to be as an isotropic material to lighten the model. Finite element model of vertical compression test on the reference logistic unit (reference LU).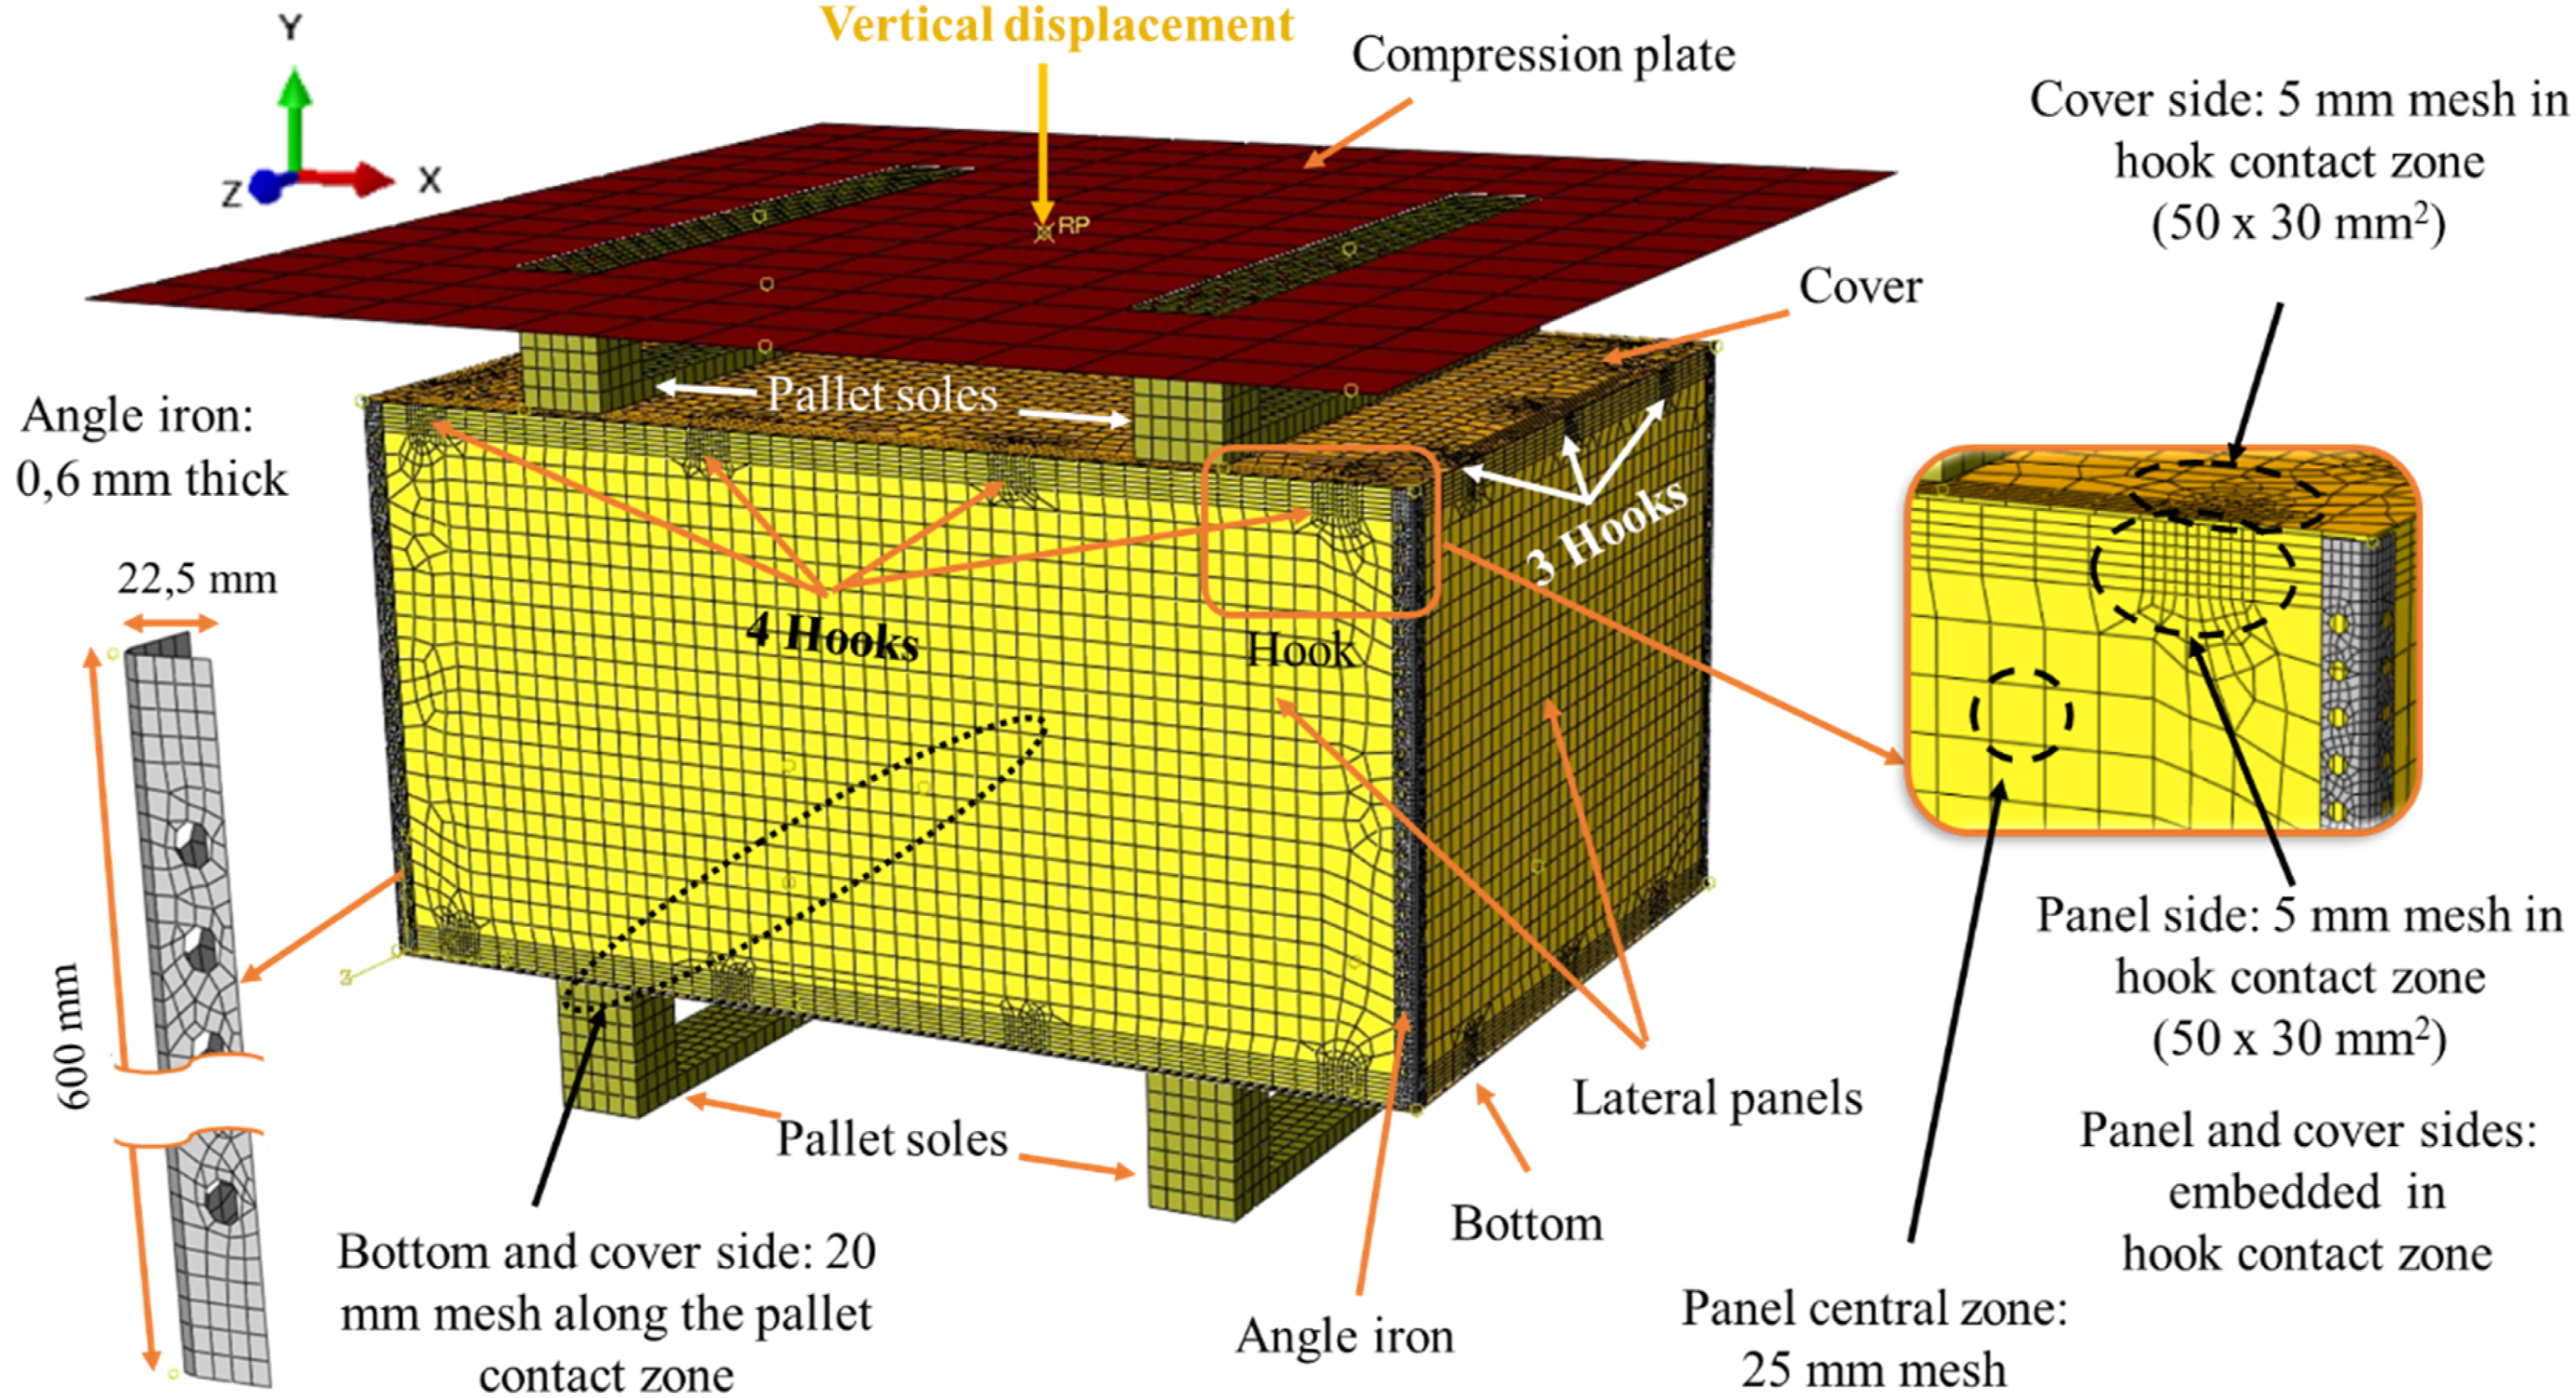
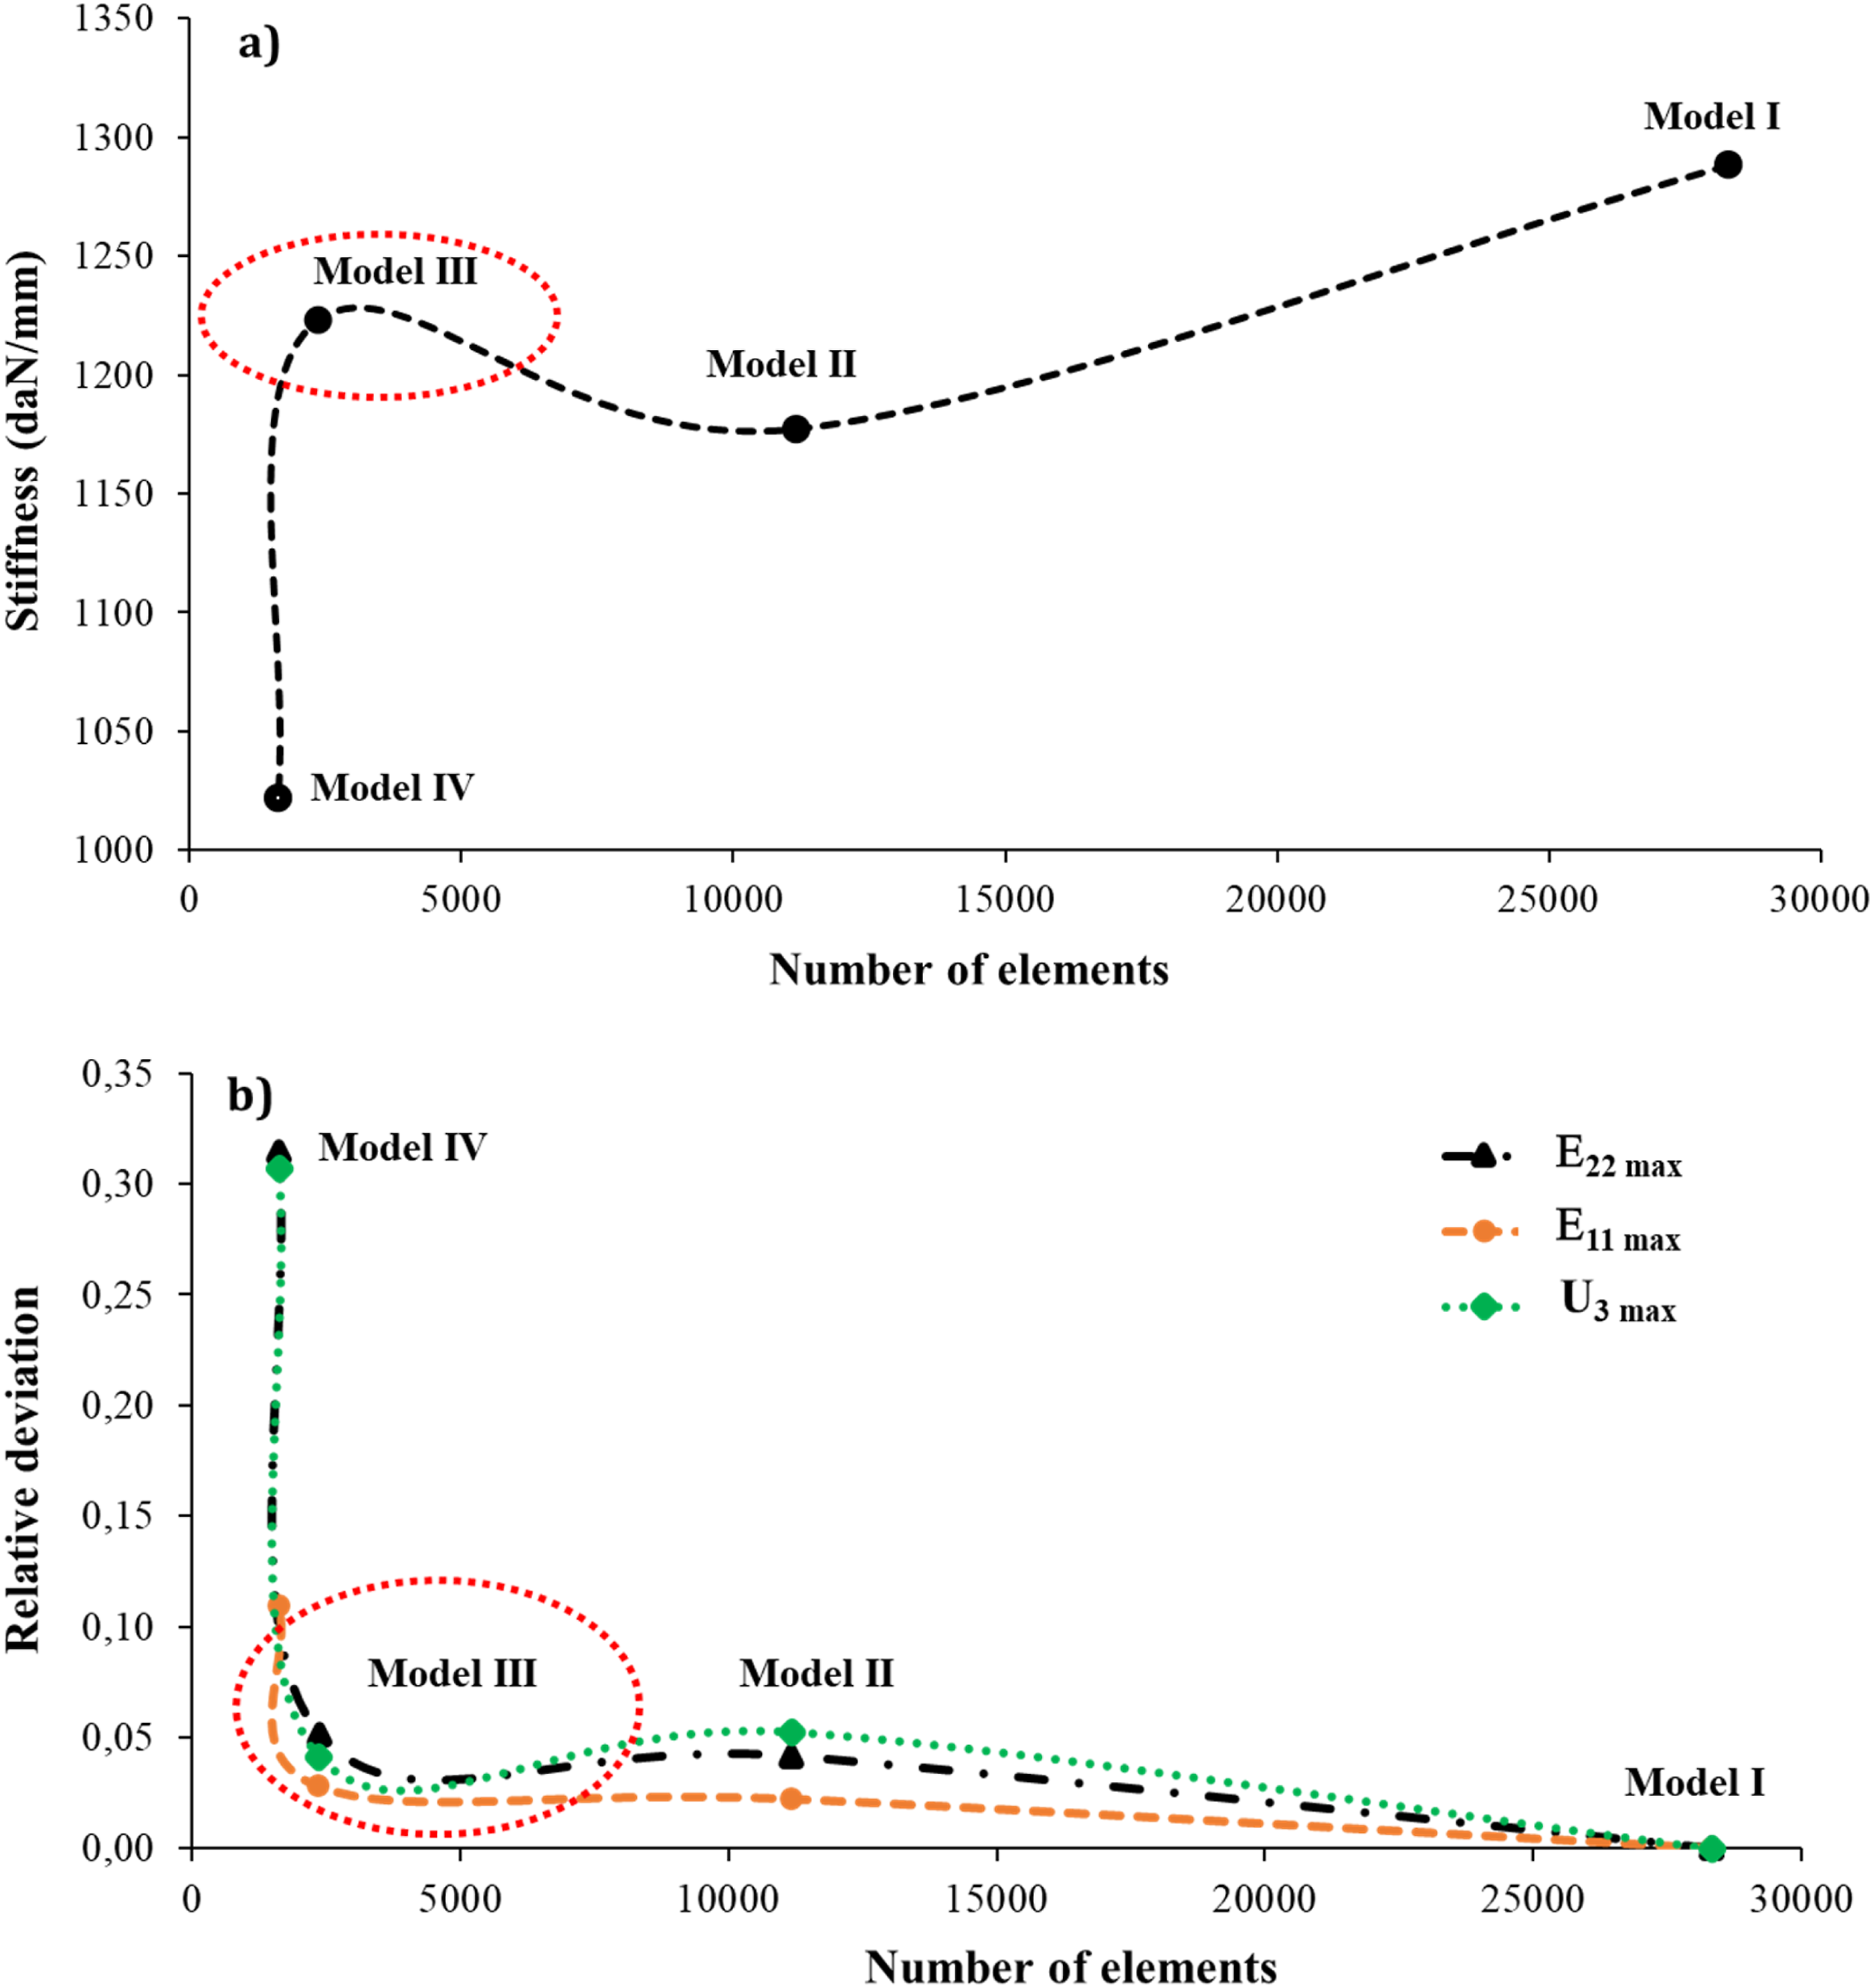
are proposed to simplify the calculation and the determination of the mechanical properties of the studied structure: • The plywood is modeled as a one ply composite with homogenized orthotropic properties using shell elements, • The hooks which are used to ensure the connection between the lateral panels, the bottom and the cover panels are modeled by partitions on the faces of the panel with Tie interactions (ABAQUS® constraint function) placed between these partitions. These partition dimensions are 50 × 30 mm2. Tie interactions in this case do not affect the stiffness of the LU. Also, this allows the transfer of the moment from the cover to the lateral panels (because the cover leans on the lateral panels), otherwise it would not be possible, since the shell elements do not have mesh elements through the thickness (which is the case of lateral panels). • The angled metal borders on the cover and bottom are not modeled here. Four FEMs are studied to evaluate the computation time and the mesh configuration influence on the LU stiffness, maximal strains (Ε11 and Ε22) and out-of-plane displacement (U3). The models were: • Model I with 5 mm mesh size on the entire geometry of the logistic unit, • Model II with 8 mm mesh size on the entire geometry of the logistic unit, • Model III with 25 mm mesh size in the central zones of the panels and with 5 mm mesh size near singular contact zones (i.e. panel/cover, panel/angle iron), • Model IV with 25 mm mesh size in the central zones of the panels and with 10 mm mesh size near singular contact zones (i.e. panel/cover, panel/angle iron). To evaluate the influence of these mesh types and sizes, the LU stiffness, the maximal strain and out-of-plane displacement values are determined and compared for each type of mesh size, cf. Table 4 and Figures 9–10. Figure 10(a) shows that the maximum value of the LU stiffness is obtained using Model I with the finest mesh elements (i.e. 5 mm). However, the computation time of Model I is nearly 330 min with the workstation used here. It would be interesting to reduce the computation time to facilitate the calculation-test correlation. Figure 10(a) shows that Model III has the closest LU stiffness with the shortest computation time (30 min vs 330 min) with respect to the finest mesh Model I, with a difference of 5 % in LU stiffness. Almost the same results are found on relative deviation versus number of elements as a function of maximal strains (Ε11 and Ε22) and out-of-plane displacement (U3) at 500 daN load, cf. Figure 10(b). Note that Model I is considered as the reference model and the deviation is calculated with respect to results from this model. Figure 10(b) shows that the relative deviations of these parameters using Model III are small and converge towards a null deviation value. It can be concluded that Model III provides satisfactory results with a good compromise between accuracy and computation time ratio (studied duration/shorter duration), cf. Table 4 (11 times faster than Model I).
Computation time required for each mesh size for shell elements (in bold for the chosen mesh size).
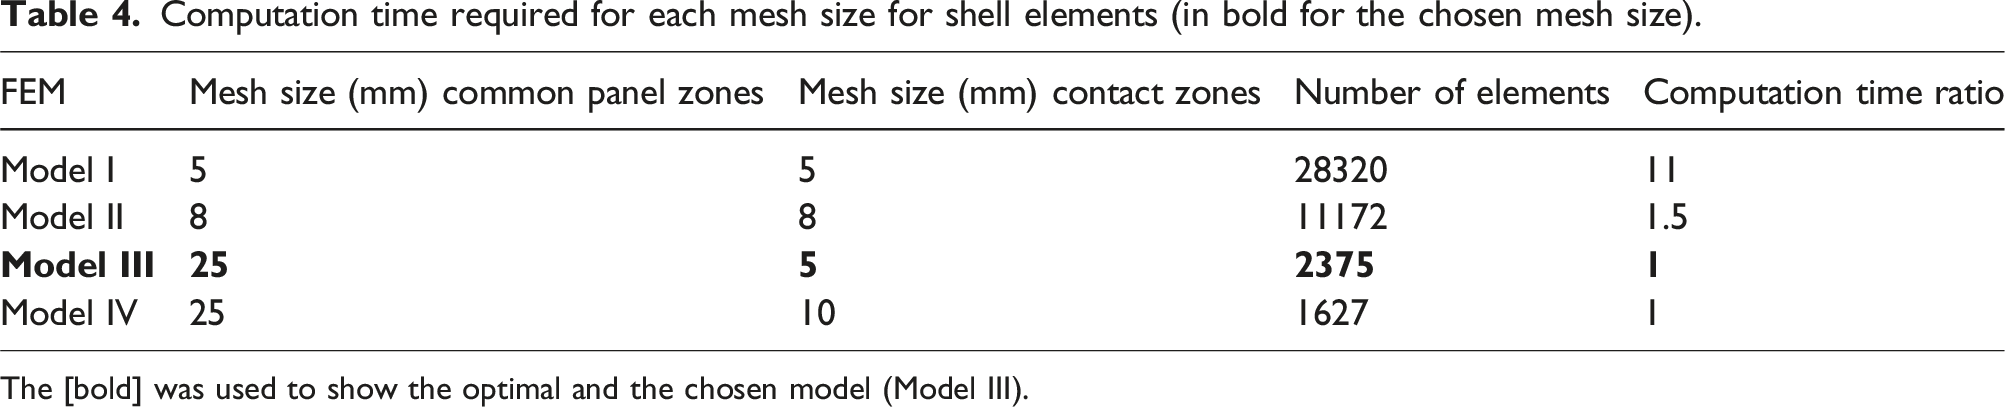
The [bold] was used to show the optimal and the chosen model (Model III).
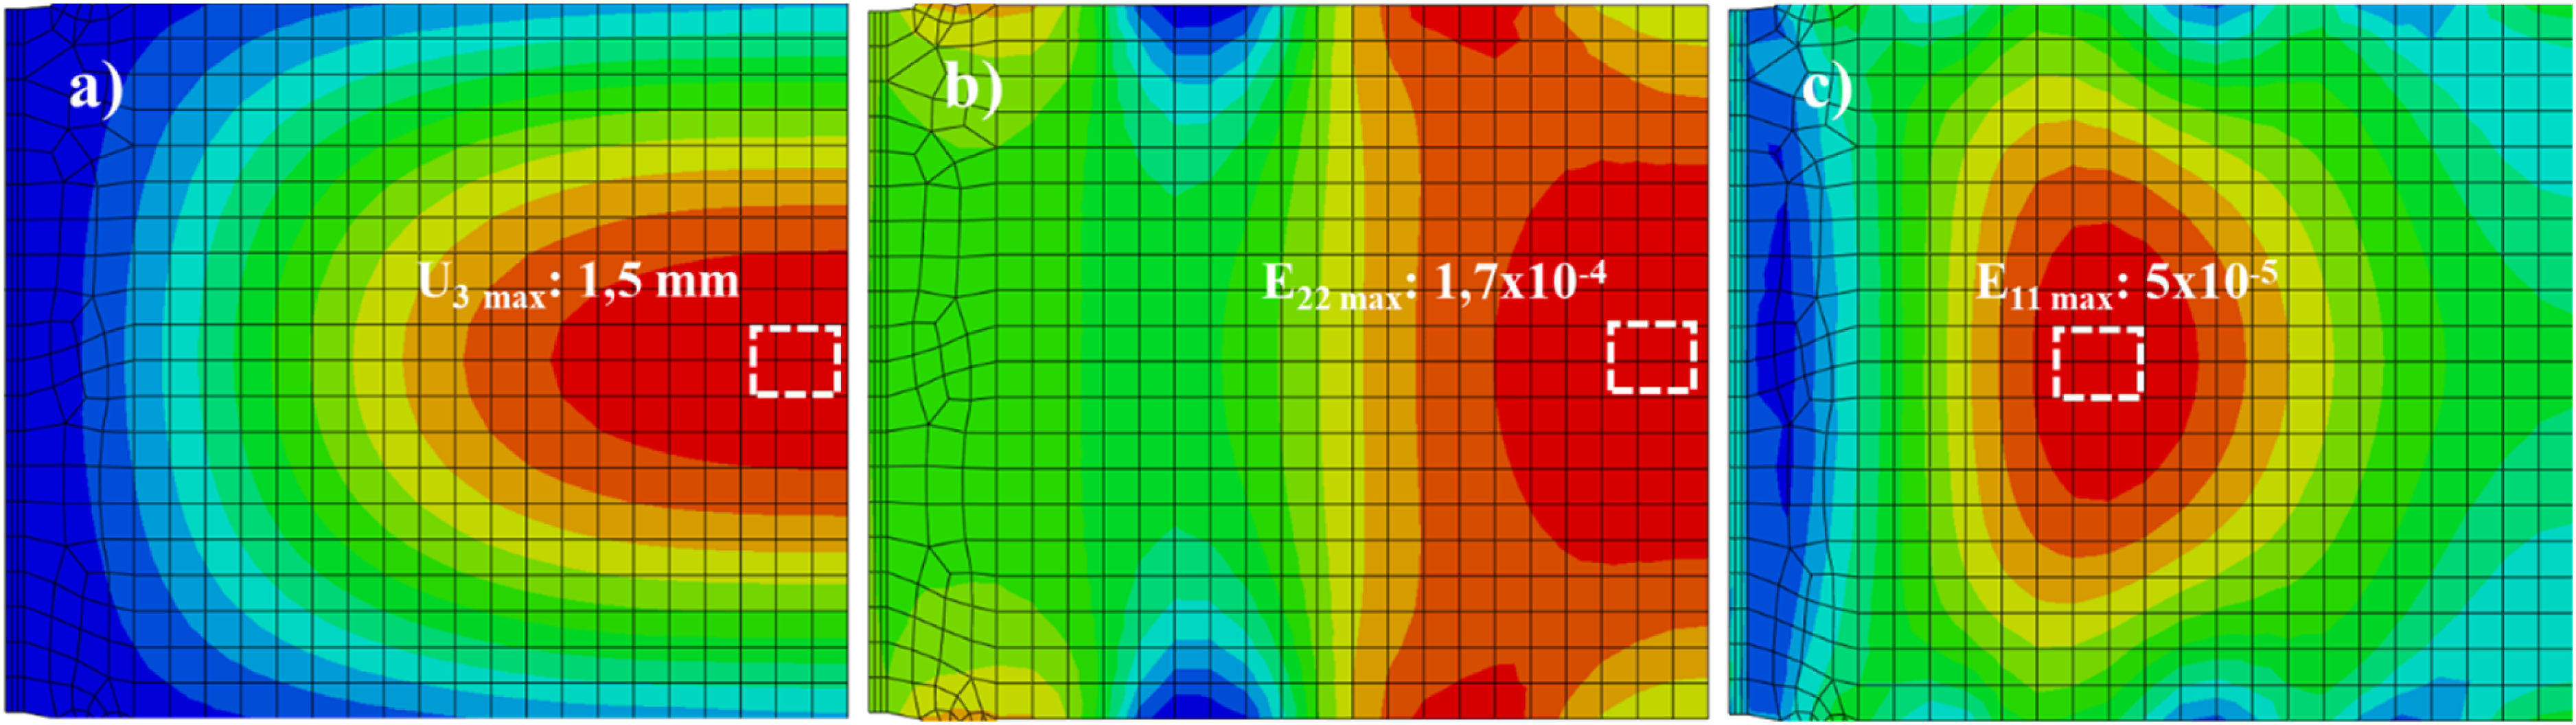
Location of maximum value zone at 500 daN (on Model III) with, (a) out-of-displacement U3, (b) transverse strain E22 and (c) Longitudinal strain E11.
Mesh size configuration at 500 daN load with respect to; (a) stiffness variation (top) and (b) relative deviation (bottom), versus the chosen mesh size.
Mechanical properties reverse identification
Different phases are required for reverse identification with a multi-scale analysis.
Baseline data
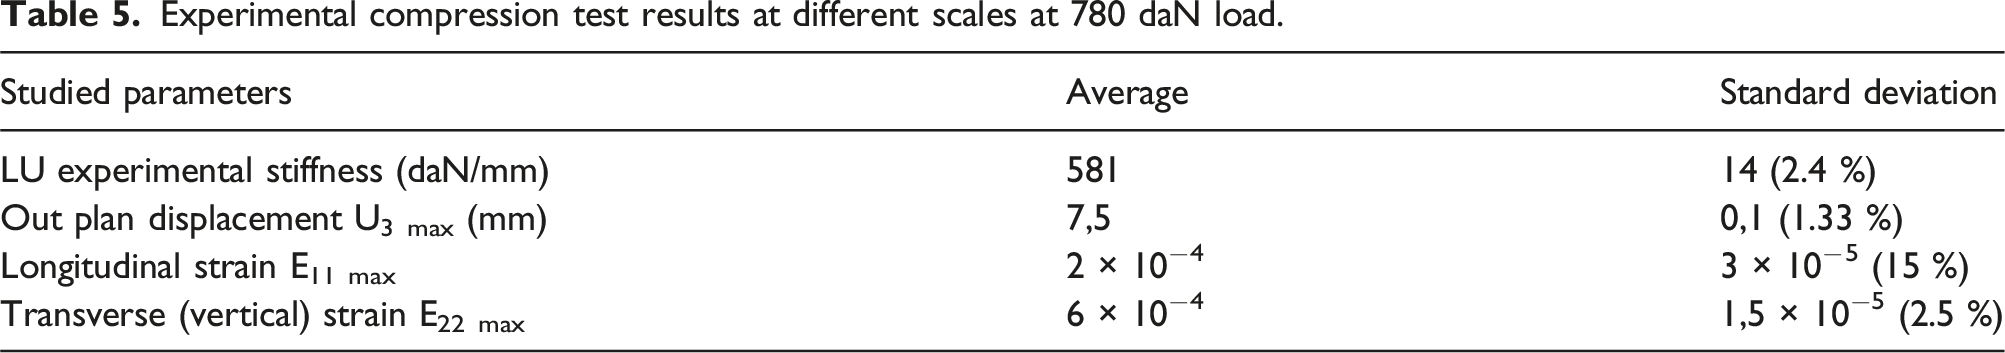
Figure 11 illustrates the five experimental and one numerical “load/vertical displacement” responses during the compression tests. The five experimental “load/vertical displacement” curves show repeatability. Table 5 indicates the LU stiffness, the maximum strains and out-of-plane displacement (U3) and standard deviation for the five tests. Only the linear elastic part of the Load-Vertical displacement curve is studied, which is within the normal operating limits of the LU. “FEM 1” corresponds to the first numerical model with initial property values. The difference between the experimental and numerical LU stiffnesses (the slope of the load vs displacement curve) is 115 %. To reduce this discrepancy, a reverse identification is proposed in the framework of a multiscale analysis. Load/vertical displacement curve of the experimental (cf. five dotted lines) and numerical (cf. One continuous line of FEM1 before properties updating by reverse identification) compression tests. Experimental compression test results at different scales at 780 daN load.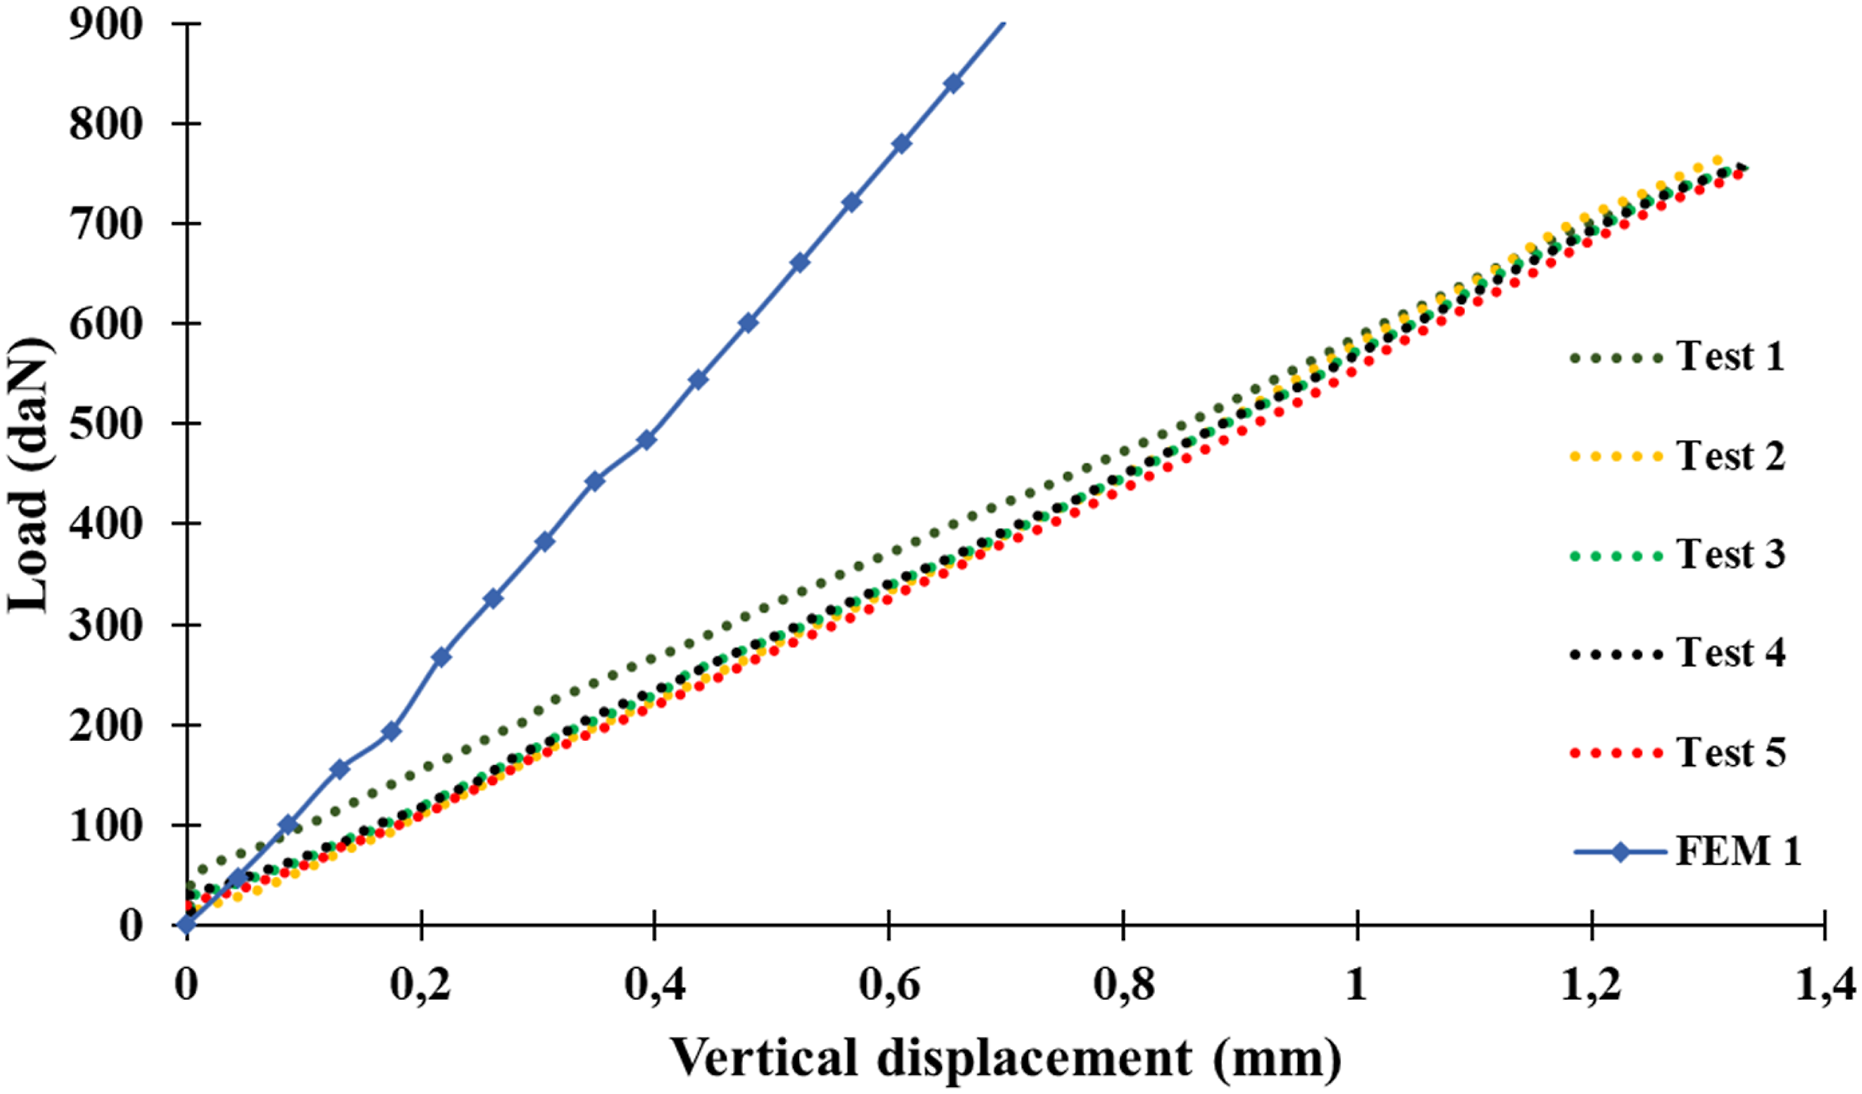
First phase of the reverse identification: LU stiffness
An adjustment of the numerical response of the LU with respect to the experimental one is a proposed way to identify the mechanical properties of the studied structure. This was achieved by adjusting the numerical stiffness with respect to the experimental stiffness by varying the material’s longitudinal modulus of elasticity E1 and transverse modulus of elasticity E2. The ratio E2/E1 = 0.77 is kept constant, thus it is only necessary to vary E1. The remaining elastic properties were also kept constant. Several models with different property values were computed until “FEM 2” where the updated LU stiffness aligns with the experimental one, cf. Figure 12. The elasticity moduli of the studied structure were found to be 3000 MPa and 2330 MPa for the longitudinal and transverse directions, respectively. Load/vertical displacement curves of the experimental (5 dotted lines) and numerical (2 continuous lines of FEM1 and FEM2) compression tests.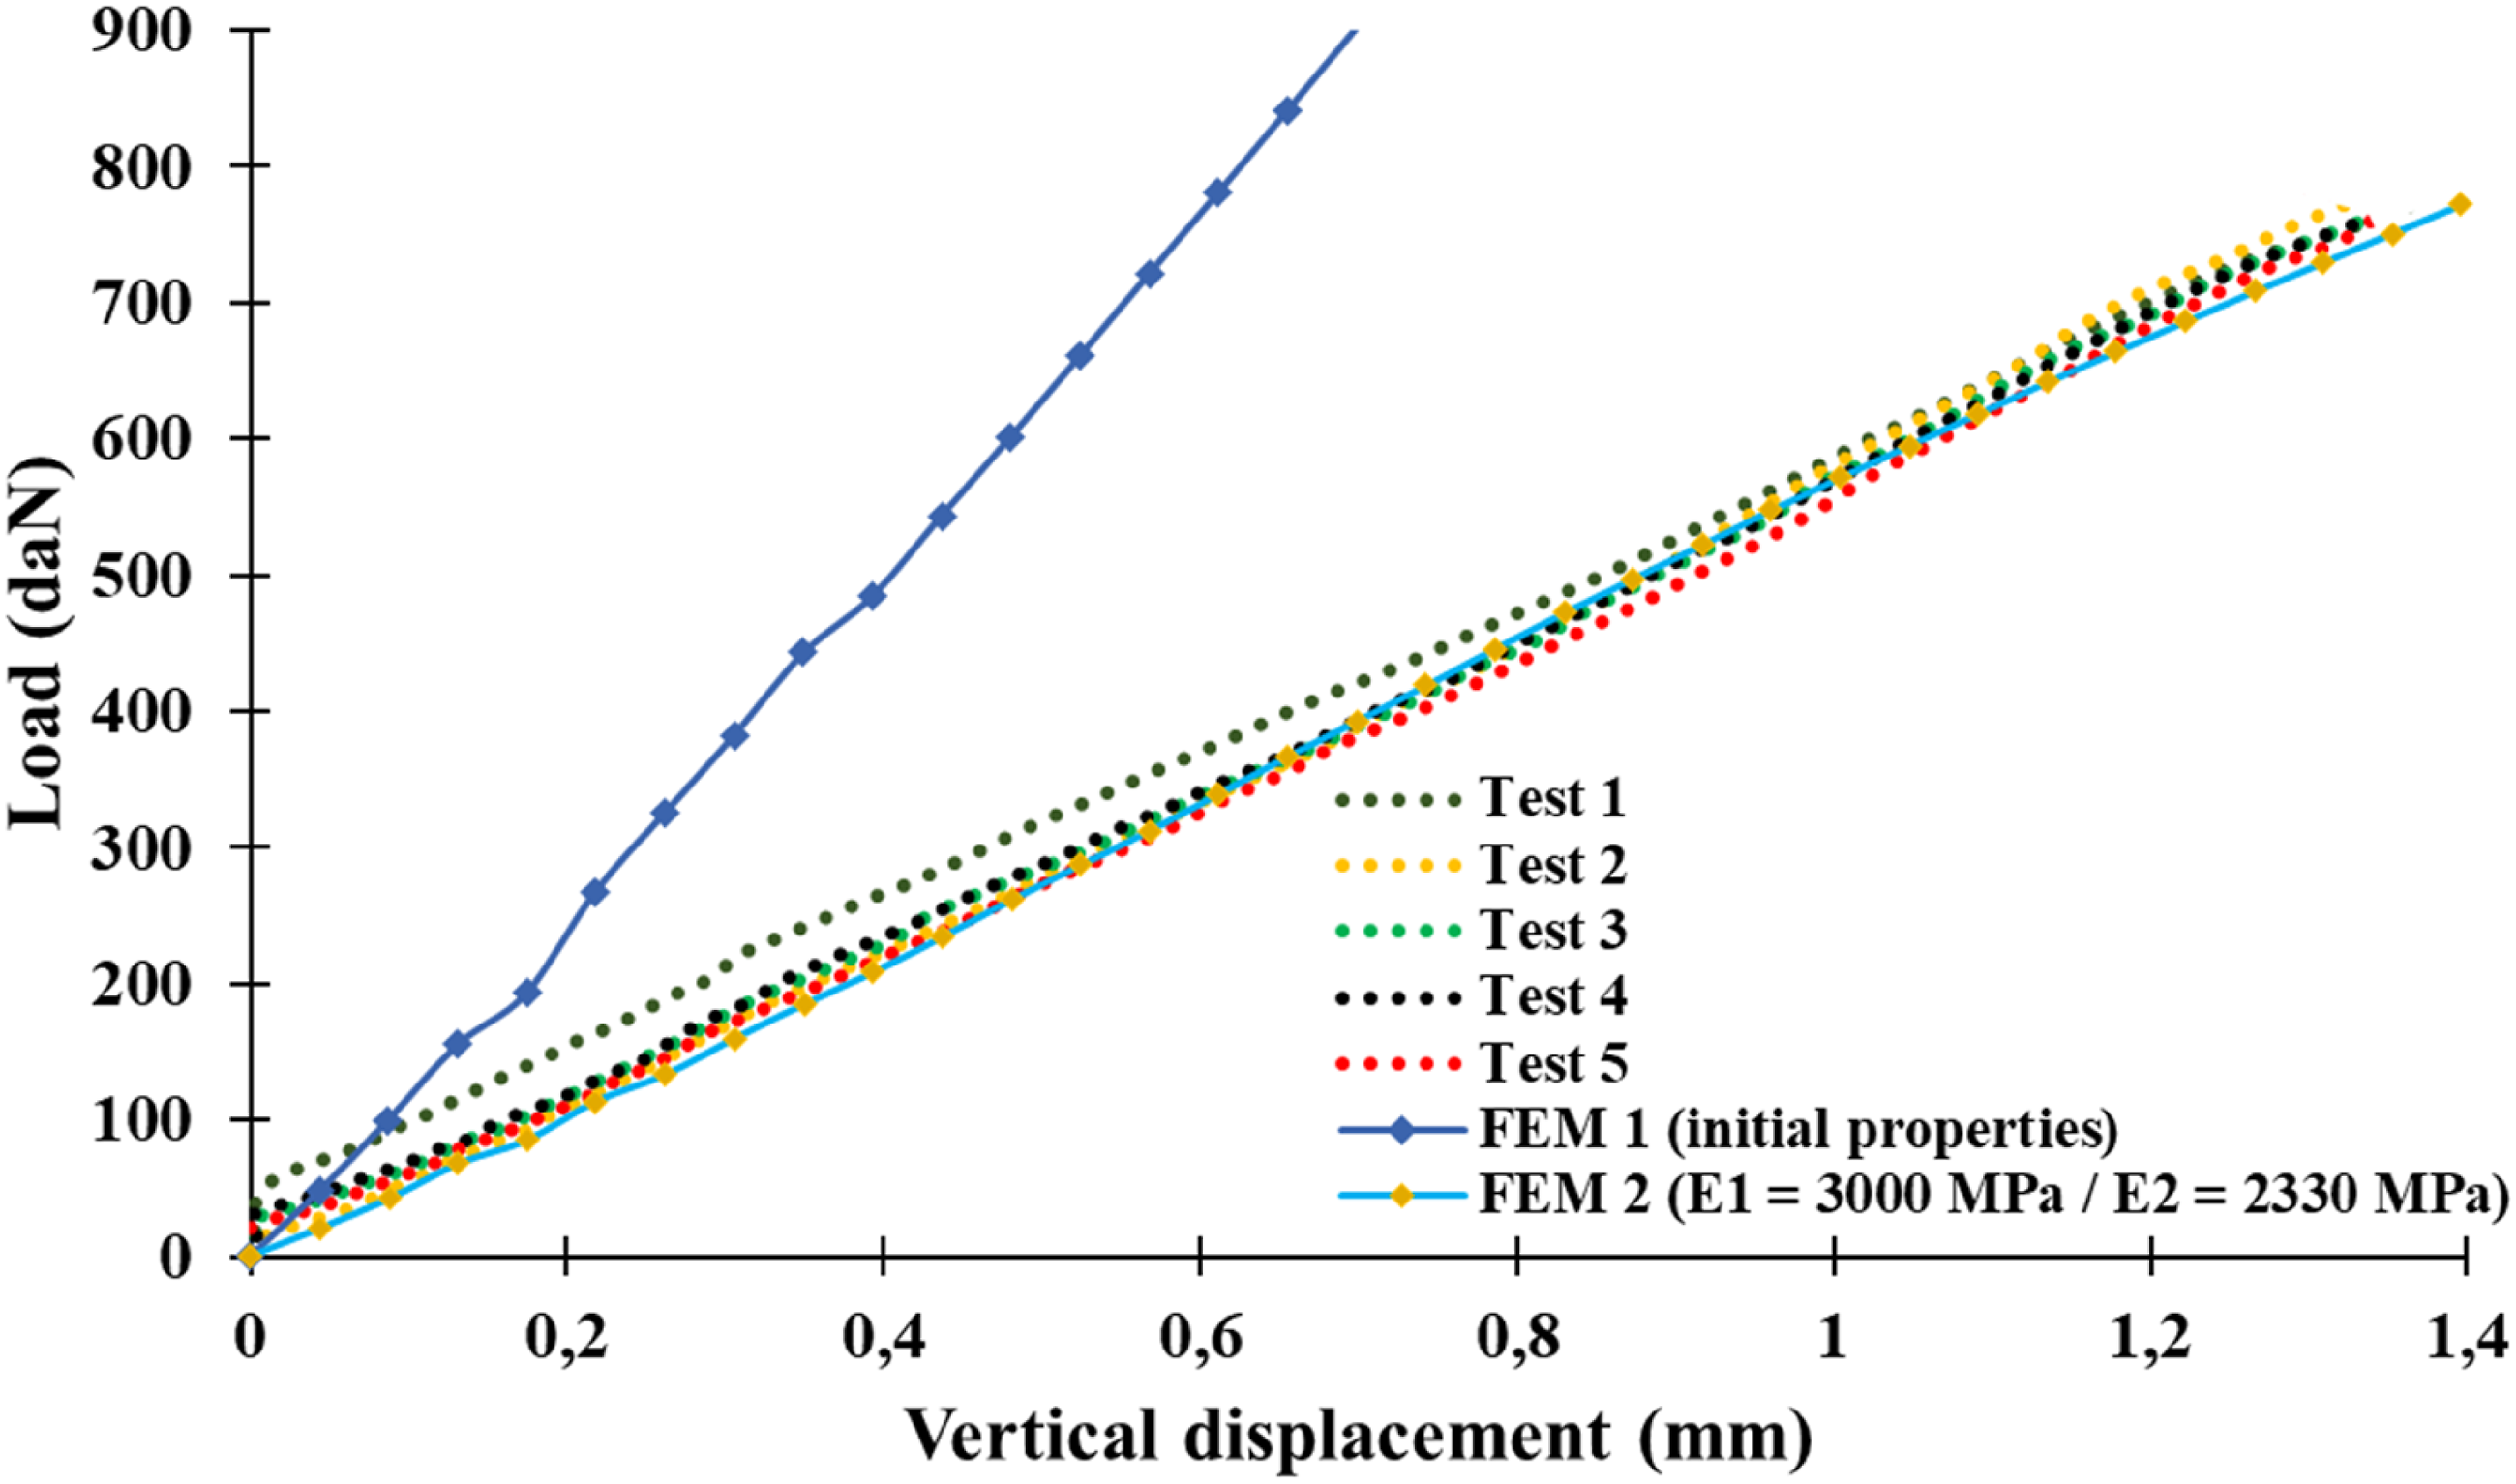
Moreover, FEM 2, fed by the new property values, can also be used to compare the numerical out-of-plane displacement and strain fields with those obtained by the 3D DIC. Figure 13 shows a comparison between the numerical and experimental out-of-plane displacements for three load stages. For each load stage, a general similarity between the numerical and experimental distributions of out-of-plane displacement fields within the panel face can be seen. However, there is a significant difference in the order of magnitude of displacements, nearly 60 % difference in the case of low loads (here 400 daN), up to 80 % in the case of a 780 daN load. Out-of-plane displacement U3 fields during the compression test with, (a) experimental measurements and (b) numerical model respectively, at 400 daN (top), 600 daN (middle) and 780 daN (bottom).
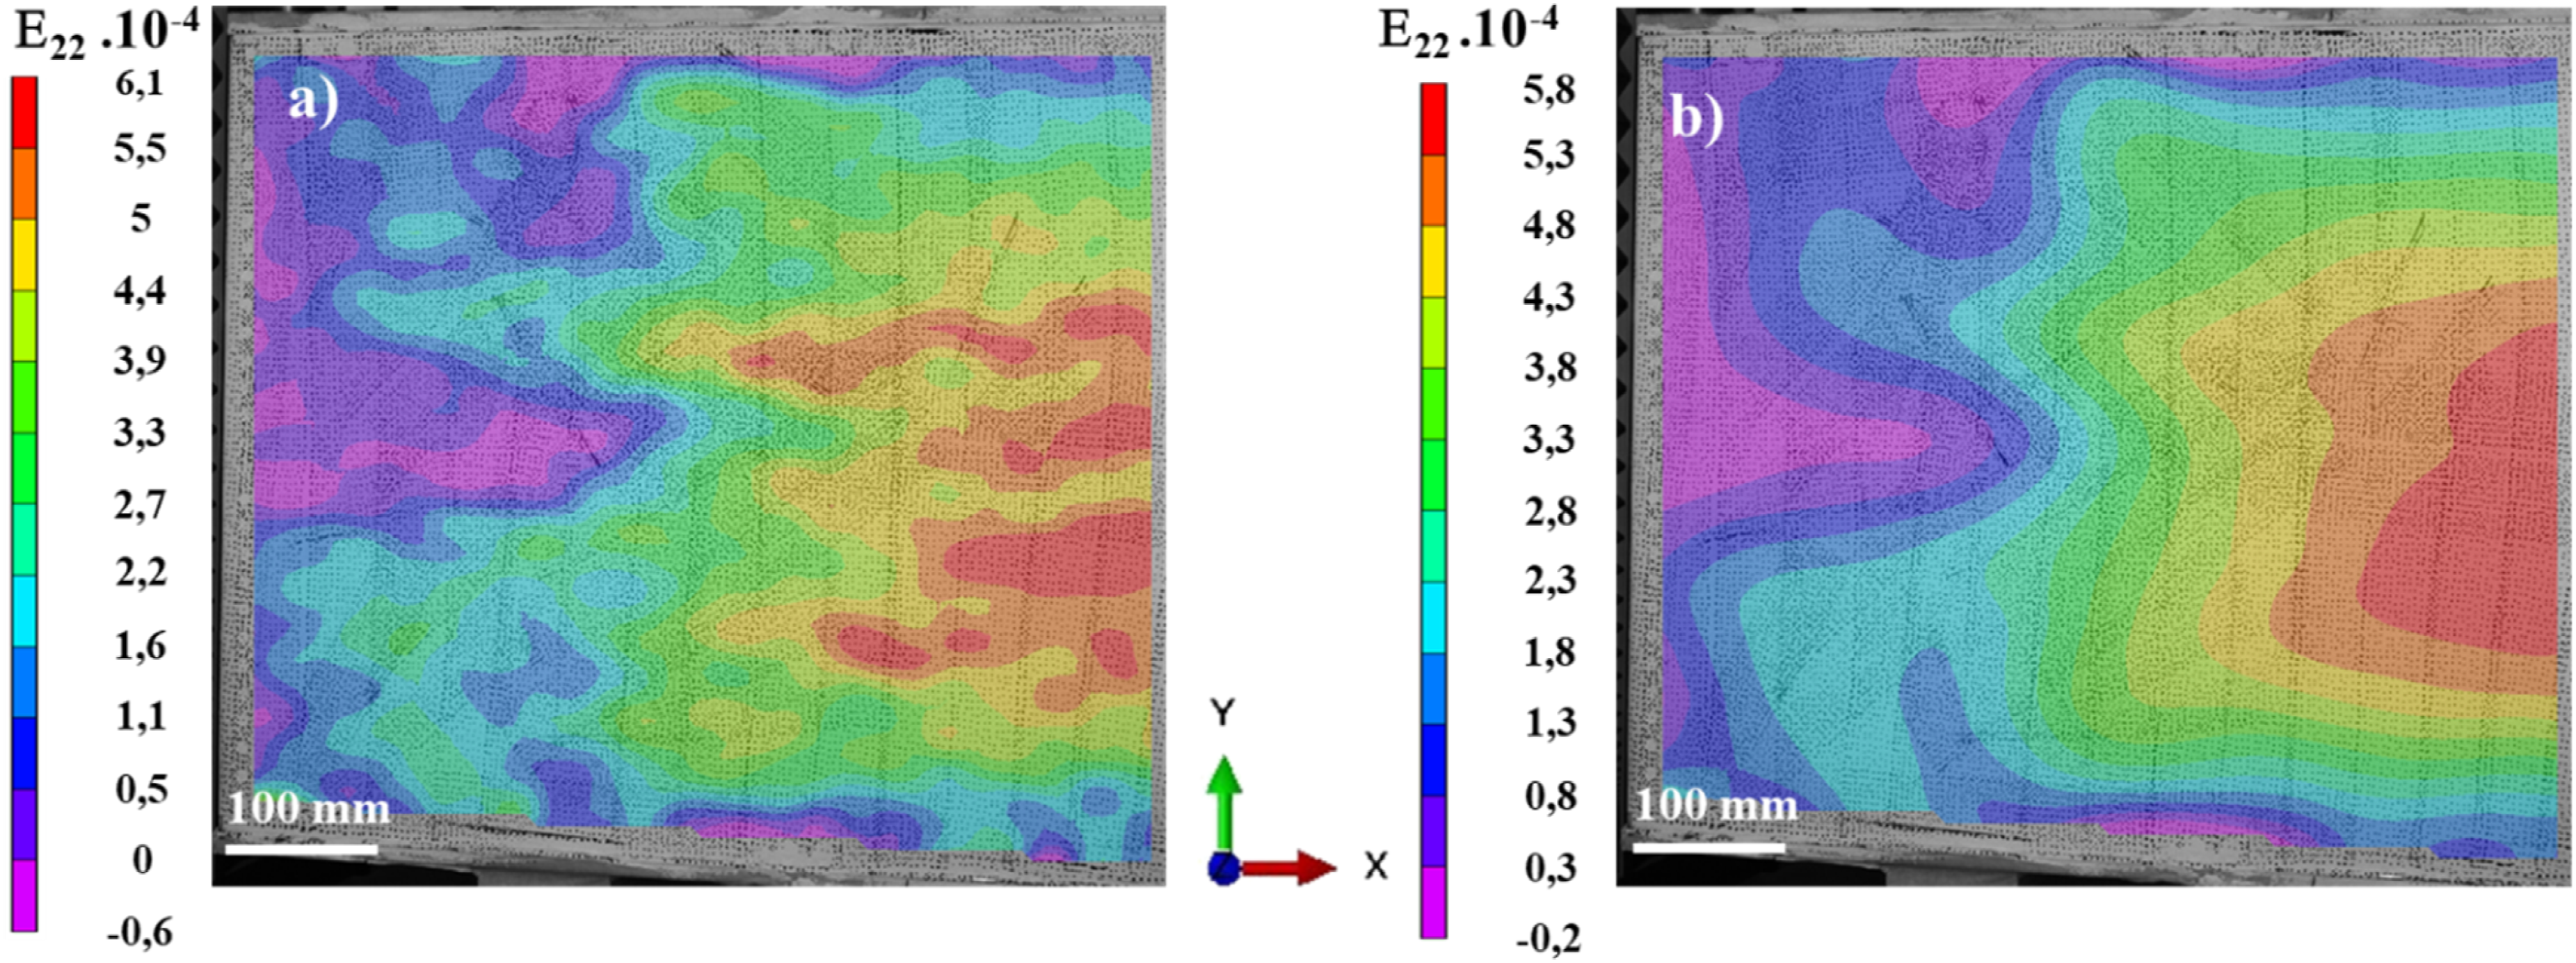
Transverse strain Ε22 fields are also compared, cf. Figure 14, and there is little similarity between measured and predicted values. The results of DIC and FEM analysis are not comparable in the case of 400 and 600 daN loads, where an out-of-plane displacement U3 begins to form. On the other hand, a slight similarity can be found in the case of a 780 daN load, when the panel takes on a regular out-of-plane displacement shape, but a significant difference between DIC measurements and FEM values is observed. This investigation helps to conclude that fitting the model considering only load/vertical displacement response is not sufficient. Transverse strain Ε22 fields during the compression test with, (a) experimental measurements and (b) numerical model respectively, at 400 daN (top), 600 daN (middle) and 780 daN (bottom).
Following this first attempt, a second phase of adjustment of the numerical input data was performed, based on minimizing the difference between experimental and numerical displacement-strain fields.
Second phase of the reverse identification: using the 3D DIC results
The reverse identification minimizes the difference between the maximal values of both experimental and FEM results at a local scale (in a chosen zone). Indeed, these input data (mechanical properties) were previously updated by reverse identification using the linear part of the load/vertical displacement curves.
However, it should be noted that the methods of representing the results field with VIC 3D® and ABAQUS® are different. They do not use the same data coordinate system, nor the same point distribution. It is therefore necessary to match the positioning of the measurement points, i.e., to place them in the same coordinate system, to be able to compare the values of the experimental fields (analyzed by VIC 3D®) and the numerical ones (obtained by ABAQUS®) at the same points of the panel. To achieve this, an interpolation algorithm is developed using MATLAB® software, which involves the following requirements: • choosing an identical analysis zone of the panel to be studied at 780 daN loading to compare experimental and numerical fields, cf. Figure 15 (500 × 300 mm2, dashed line), • positioning the 3D DIC experimental points (in an irregular surface) in accordance with the perfect virtual plan used in the FEM, • interpolating the experimental points with reference to the model point’s coordinate system to match the coordinates of the points in the same reference. Selected area (dashed line) for the second phase of property adjustment with respect to out-of-plane displacement U3 fields with respectively, (a) experimental measurements and (b) numerical model.
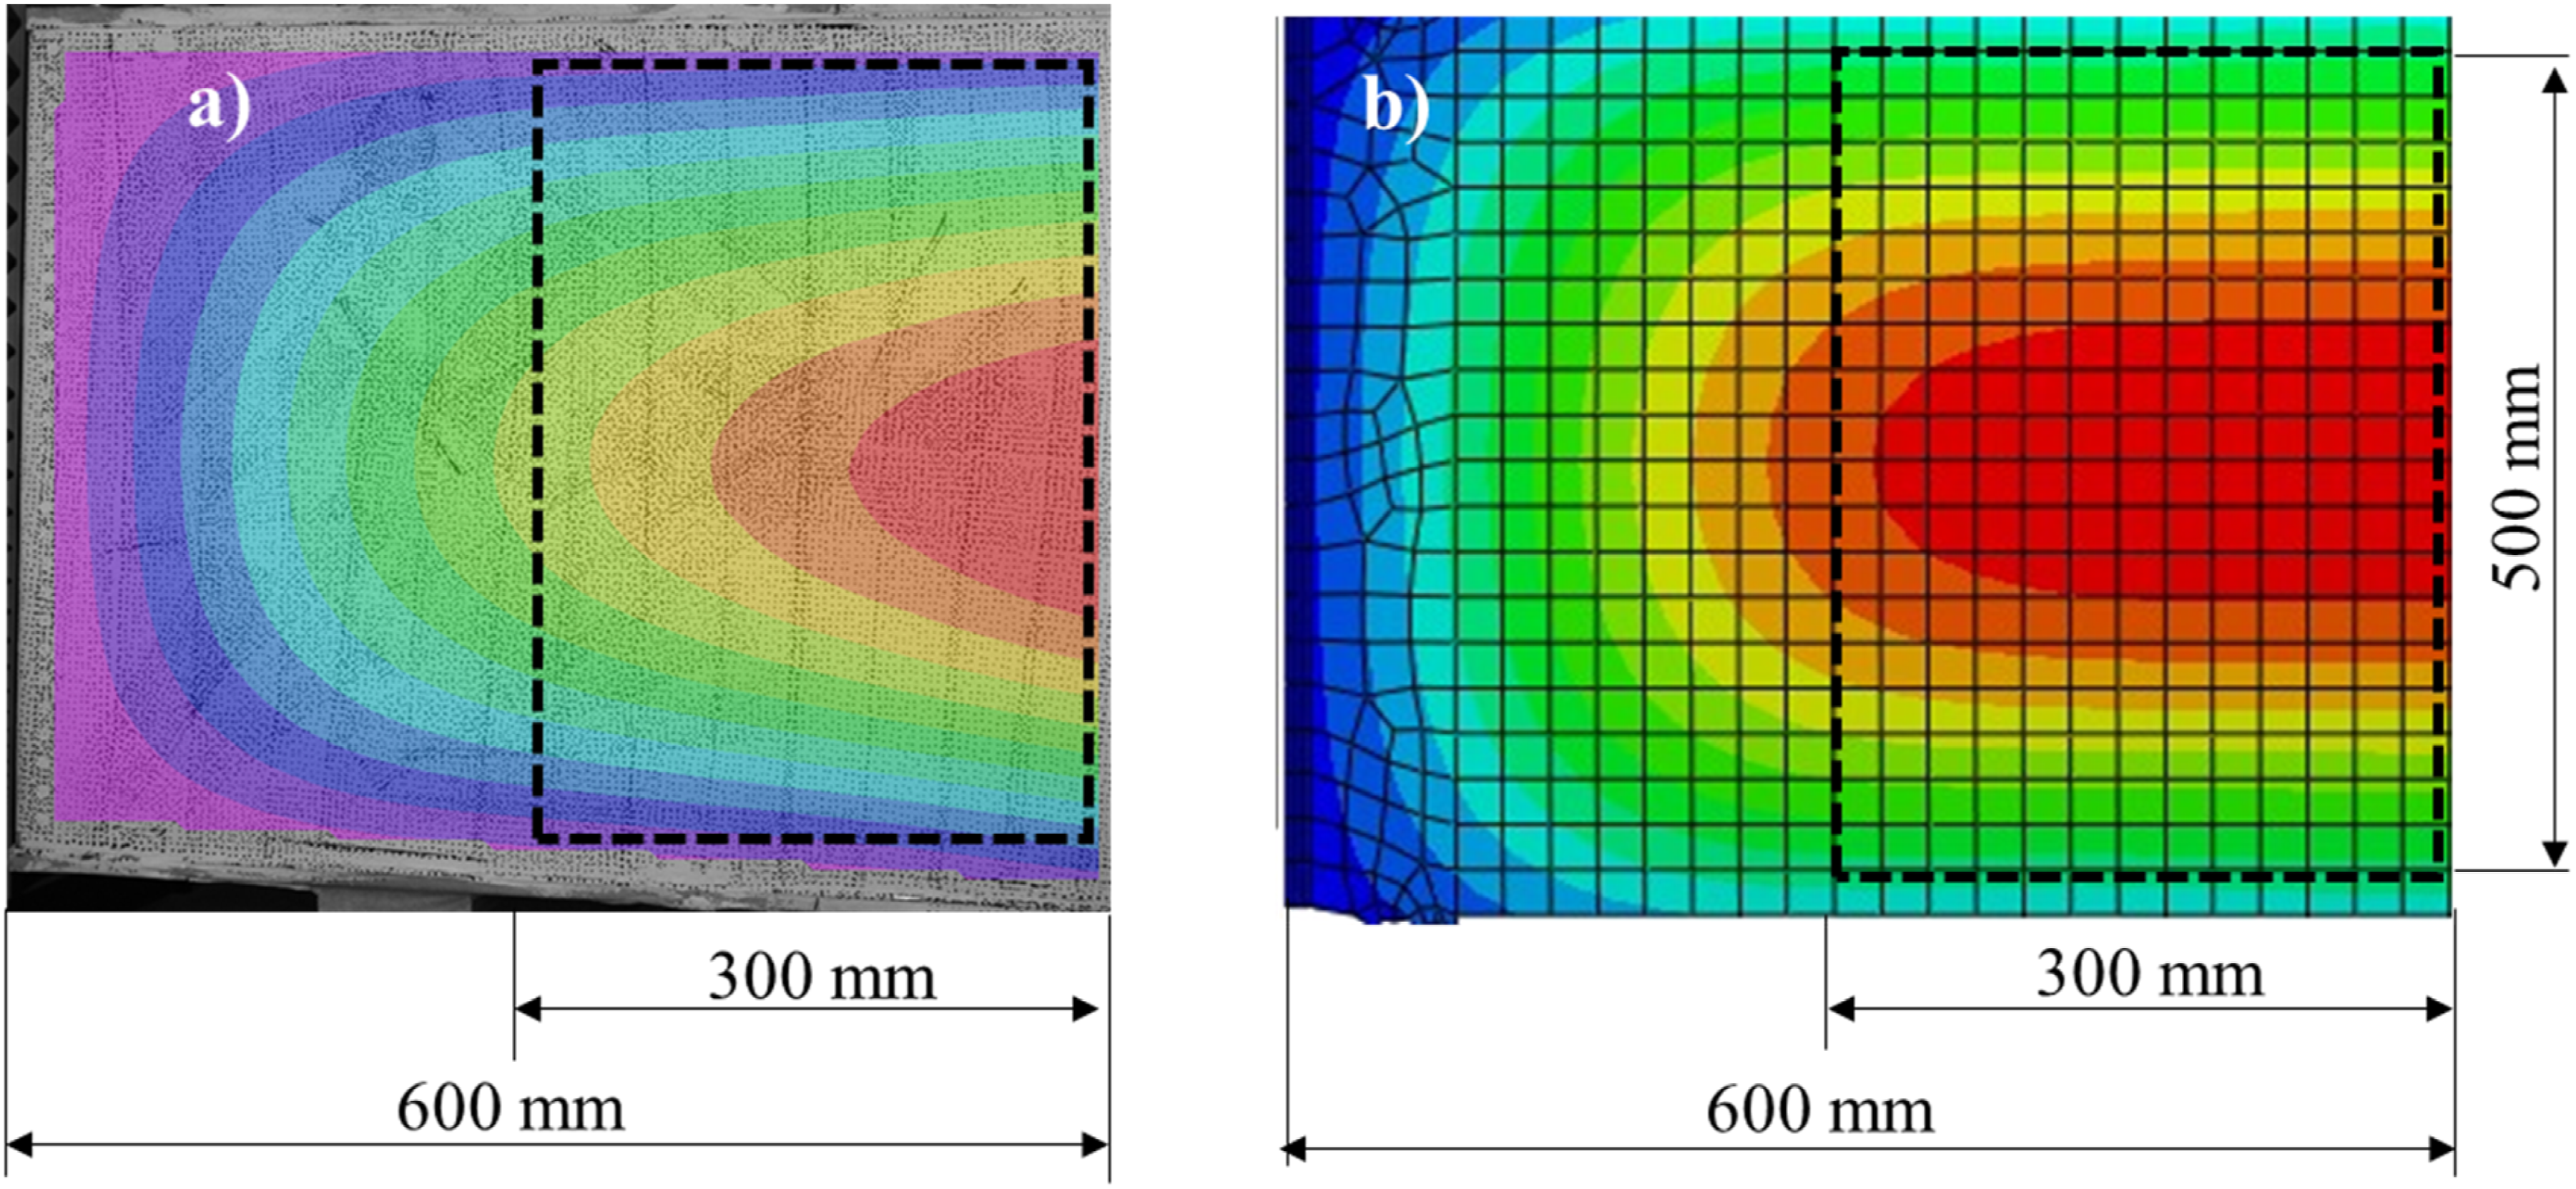
Figure 16 shows the out-of-plane displacement U3 fields resulting from this interpolation. The similarity of the profiles is observed. However, the values of the experimental and numerical data are not so close, for the same values of module E1 = 3000 MPa and E2 = 2330 MPa (reverse identification first phase). Out-of-plane displacement U3 field at 780 daN with, (a) experimental measurements and (b) numerical model before second phase (i.e. first phase) of property adjustment with respect to DIC field’s distribution on MATLAB®.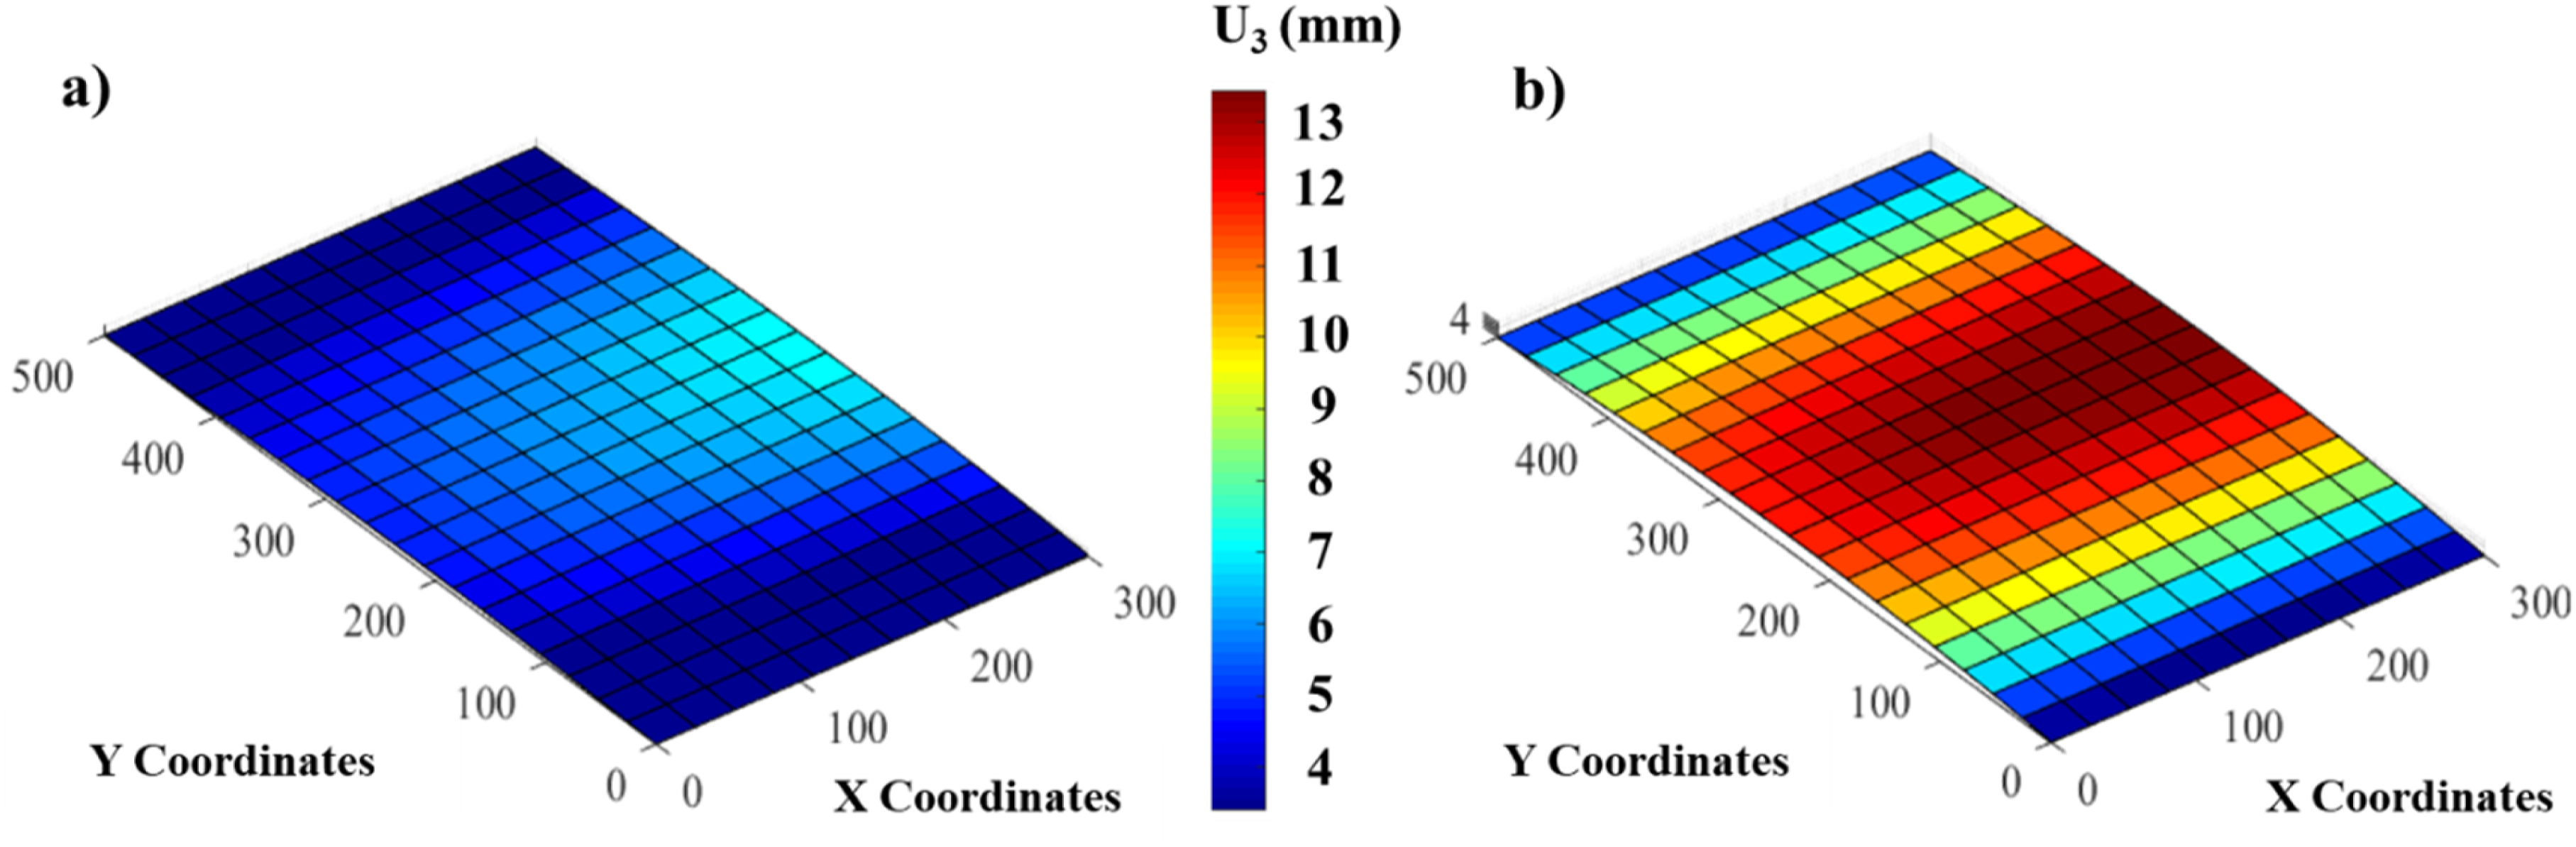
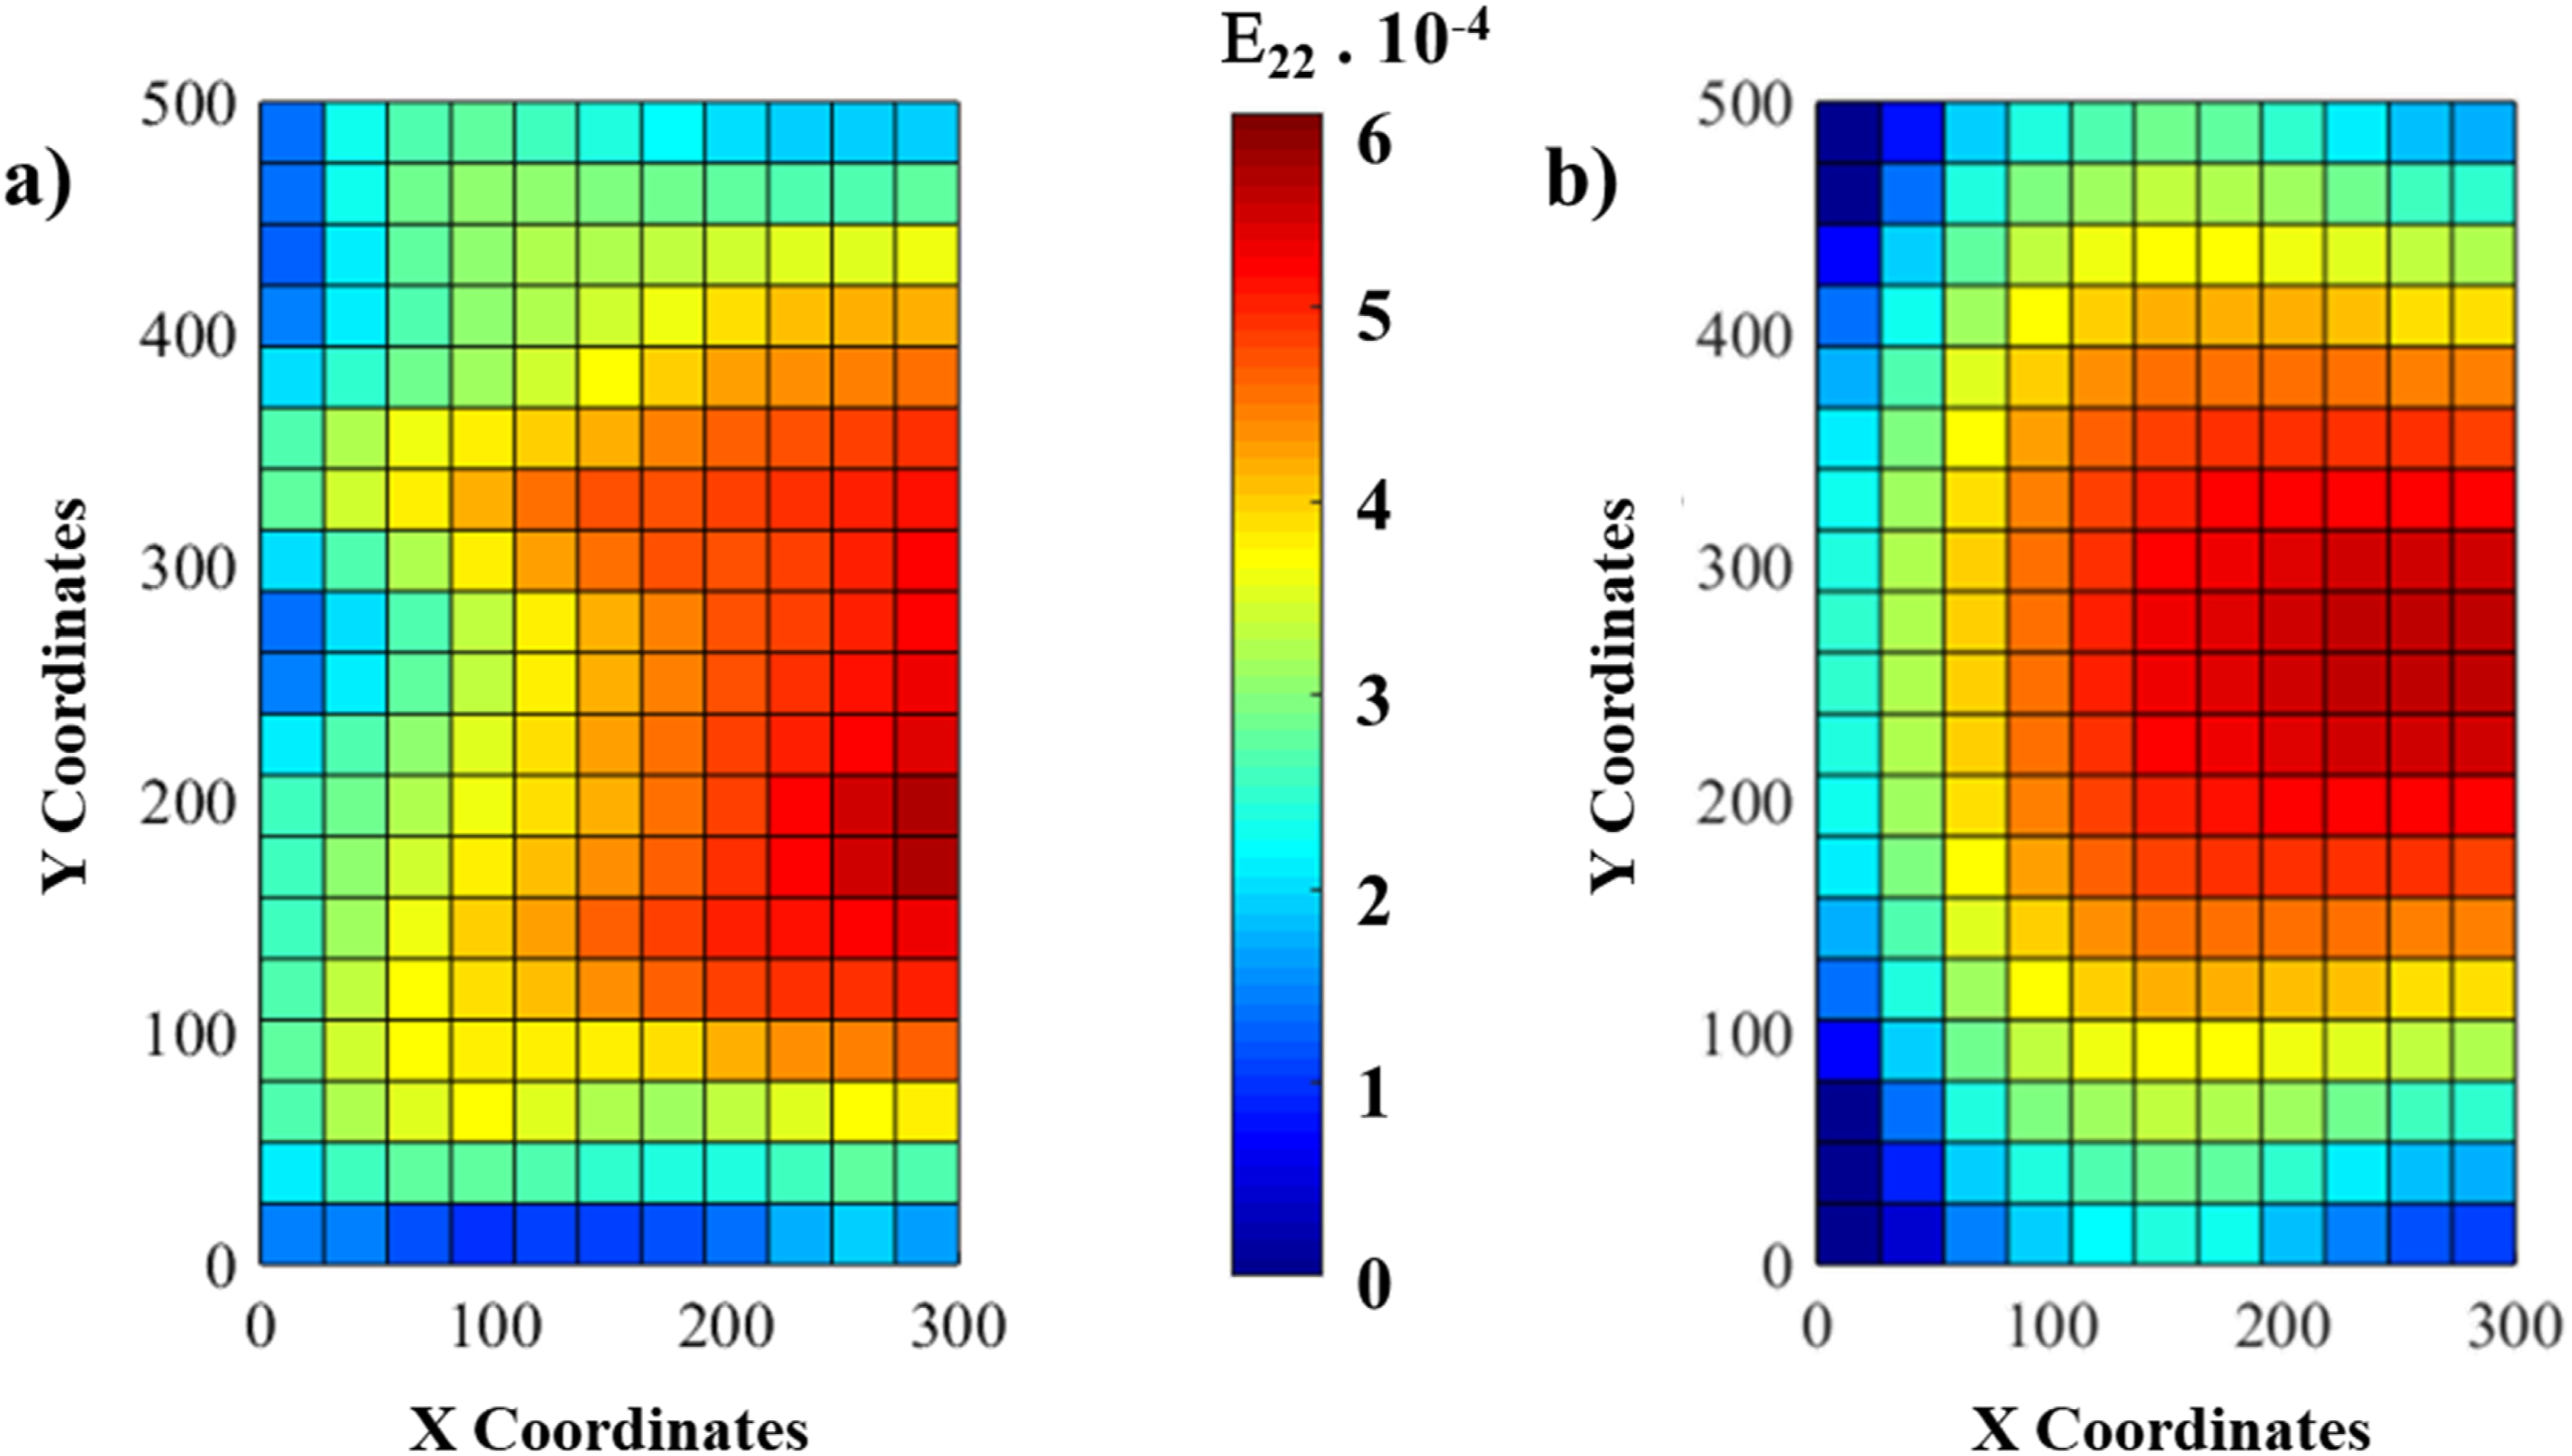
The second phase of property updating of the numerical model was carried out. To do this, the two elastic moduli of the material are updated until a match is obtained between the “FEM 3” numerical and experimental out-of-plane displacement U3 field values, cf. Figure 16. The identified longitudinal and transverse elastic modulus values are 4540 MPa for E1 (vs 3000 MPa) and 3500 MPa for E2 (vs 2330 MPa). Figures 17 and 18 display the updated numerical and experimental displacement U3 and strain Ε22 fields. An acceptable compromise is found between the numerical and experimental fields and values which validate the approach. Thus, these identified properties provide a description of the material’s response in the structure and under this type of loading, see Table 6. Out-of-plane displacement U3 field at 780 daN with, (a) experimental measurements and (b) numerical model after the second phase of property adjustment with respect to DIC field’s distribution on MATLAB®. Transverse strain E22 field at 780 daN with, (a) experimental measurements and (b) numerical model after the second phase of property adjustment with respect to DIC field’s distribution on MATLAB®. Identified mechanical properties of the birch plywood panel in the LU subjected to compression loading.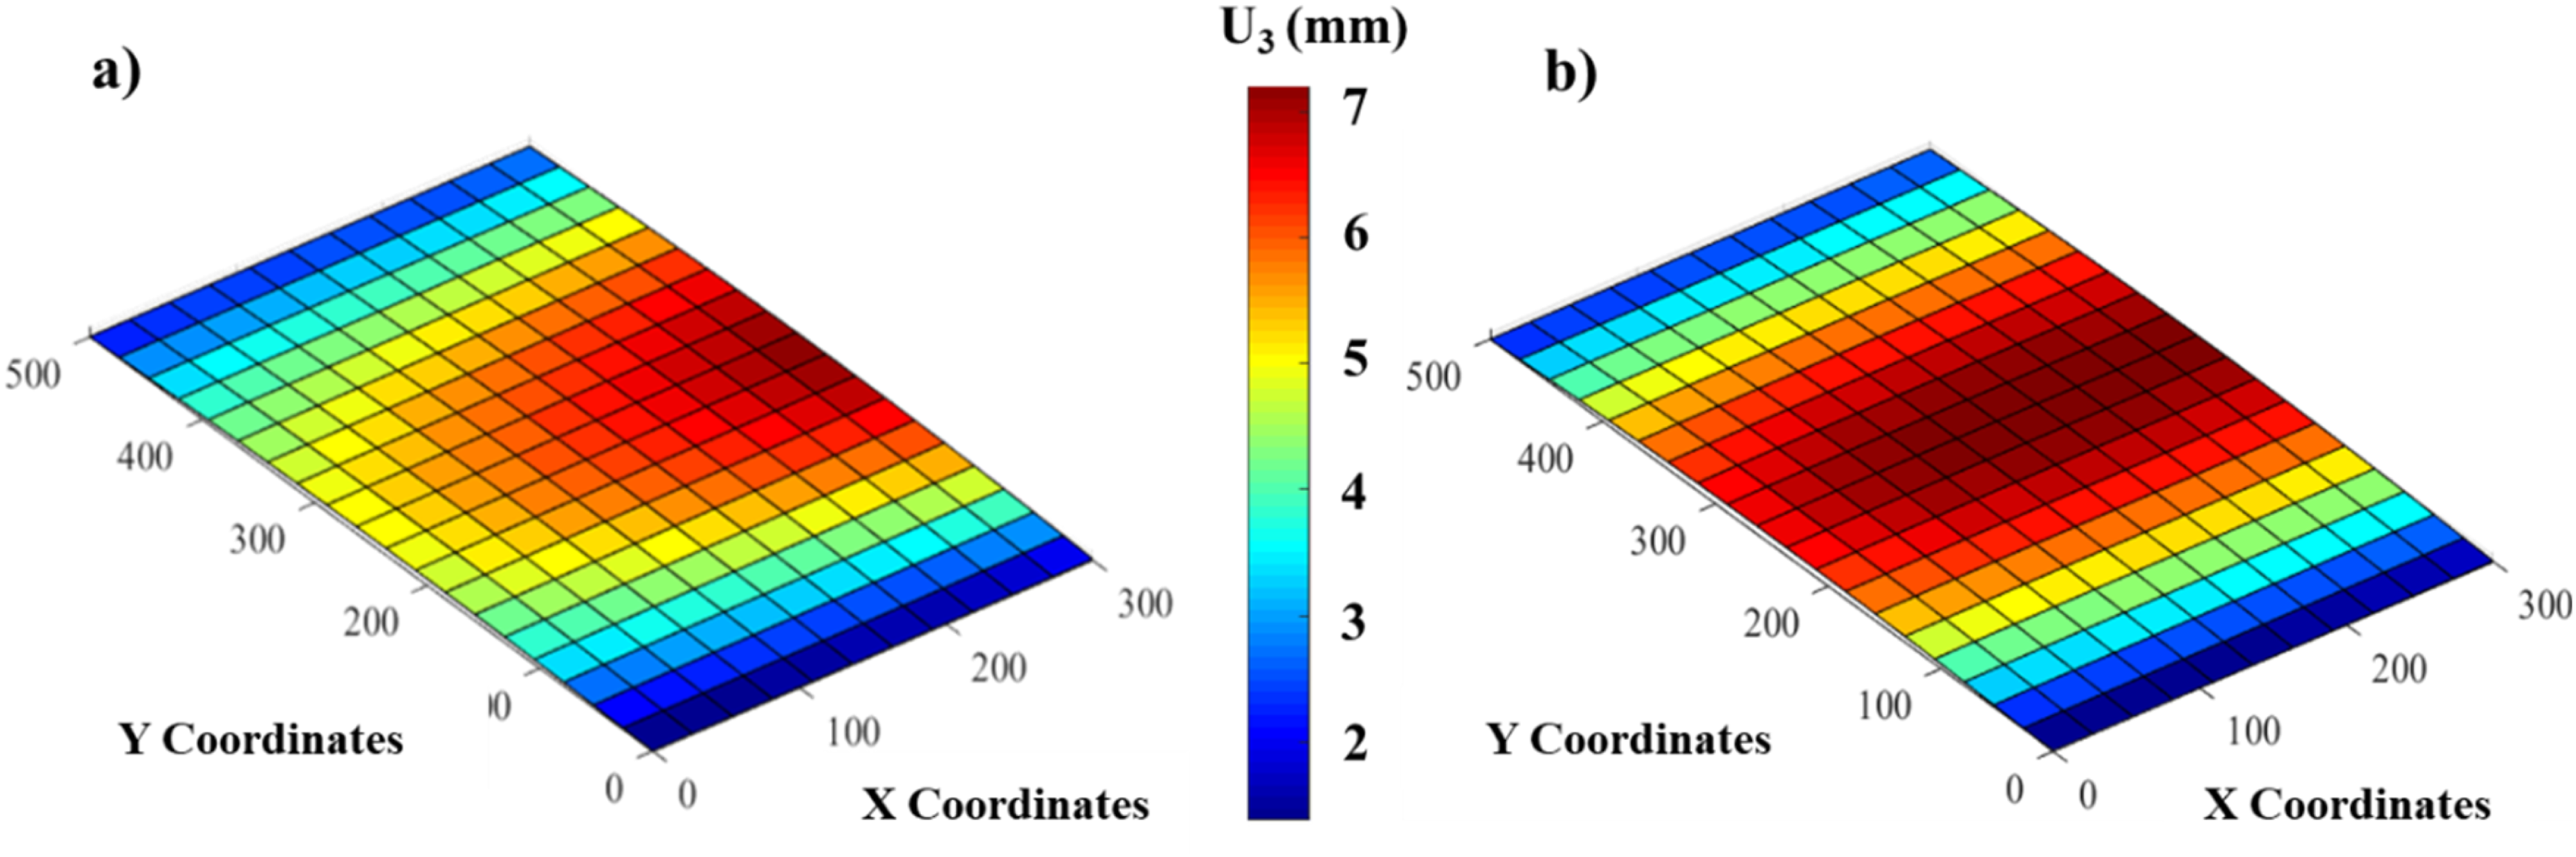
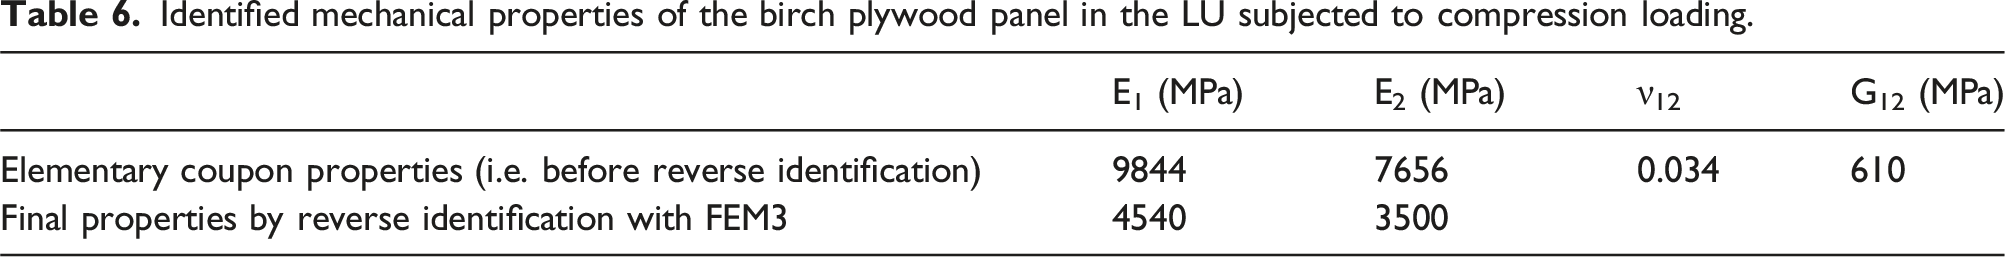
The load/vertical displacement curve of the new model “FEM 3” is plotted, cf. Figure 19, showing where the panel stiffness of the final model is positioned compared to experimental panel stiffness. A 34 % difference between the “FEM 3” stiffness and the experimental data is noted (vs 115% for “FEM 1”). This difference can be explained because the finite element model does not account for the variability of boundary conditions associated with experimental tests, such as the influence of pallet sole geometric defects. These can affect the LU loading conditions and therefore the response of the panel. According to Table 6, it is also clear that the updated property values differ significantly from the property values provided by elementary coupons, by 54%. Note that a FEM, built with input data of tensile mechanical properties derived from elementary tensile tests, leads to an unsatisfactory calculation-test correlation. A satisfactory calculation-test correlation is achieved on the scale of the structure by updating values of the elementary coupon’s properties. Load-displacement curve of the experimental (5 dotted lines) and numerical (3 continuous lines) compression tests after properties updating with respect to DIC field’s distribution on the LU scale.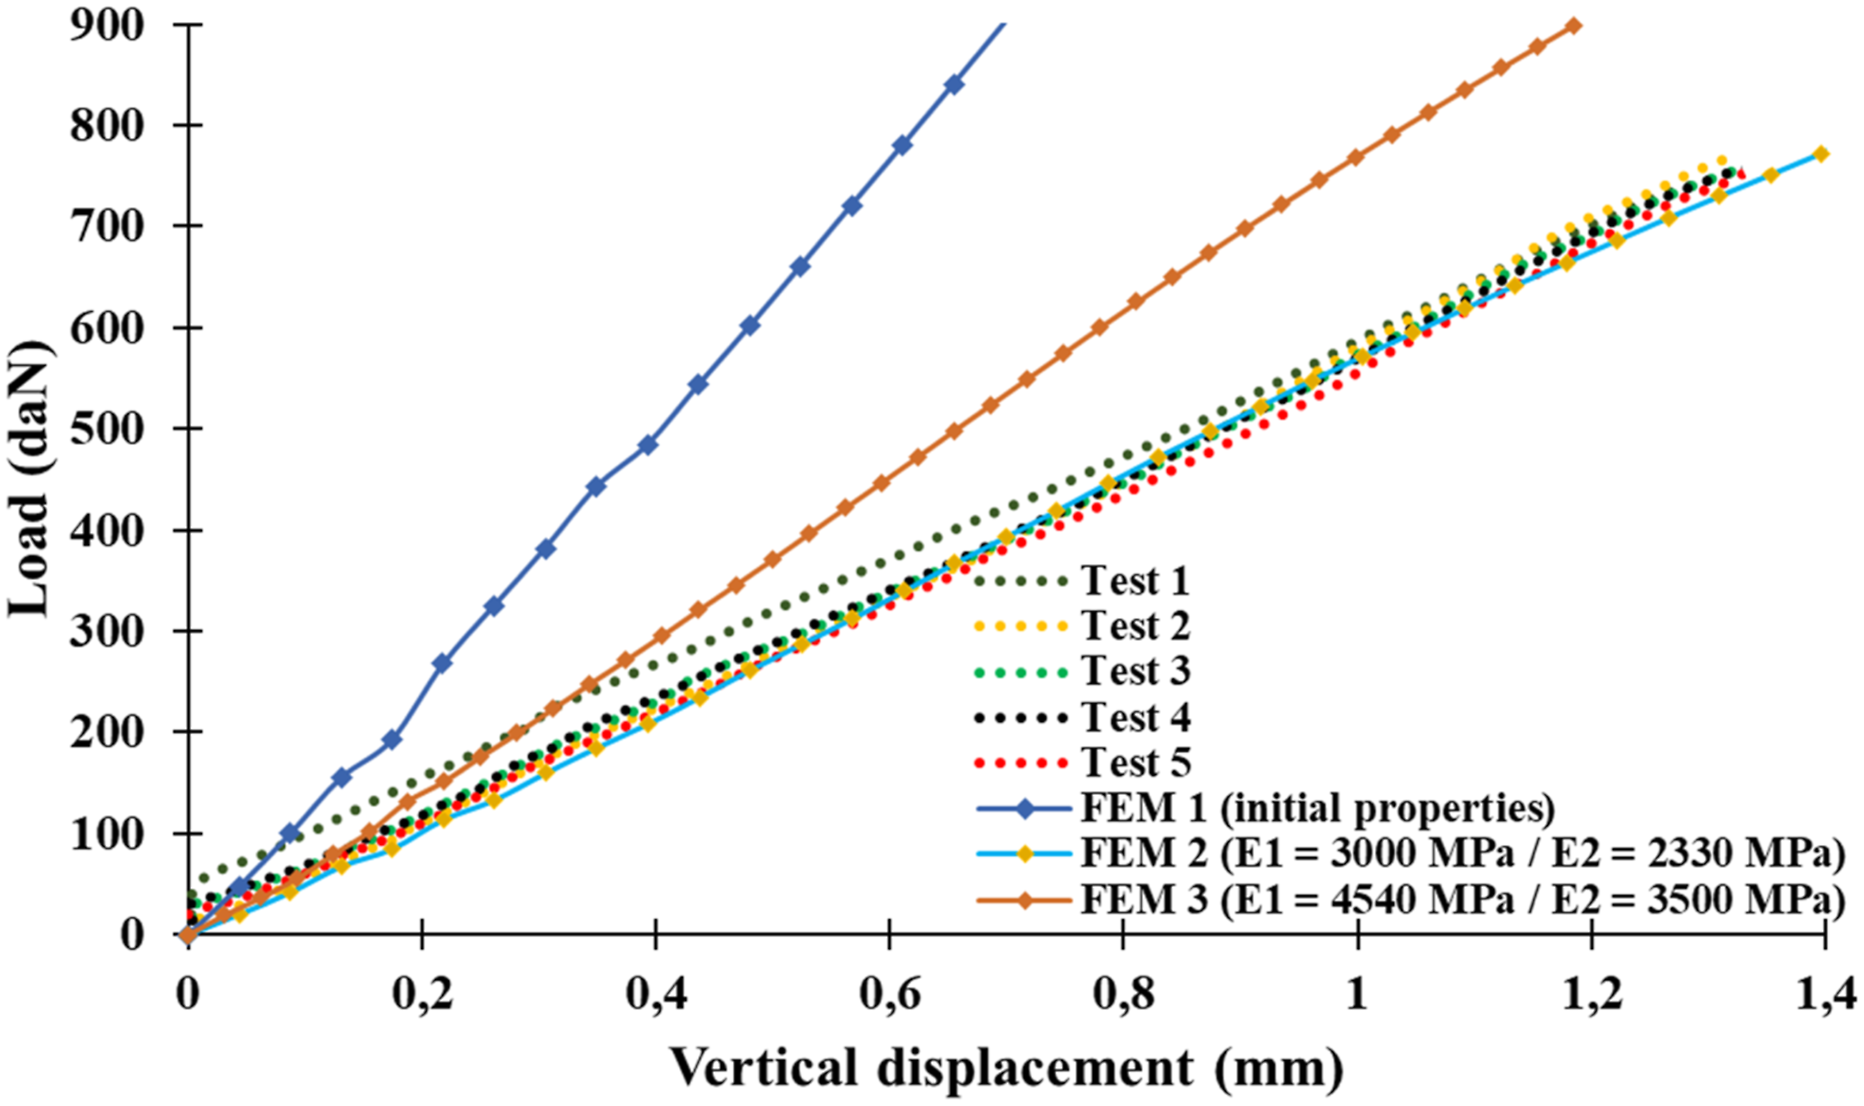
The flow chart on Figure 20 shows the different steps of the study leading to the zone of interest identification and the MITE50,51 design. It is the subject of the following paragraph (cf. §6). Flow chart of the different steps of the study leading to the zone of interest identification and the MITE design.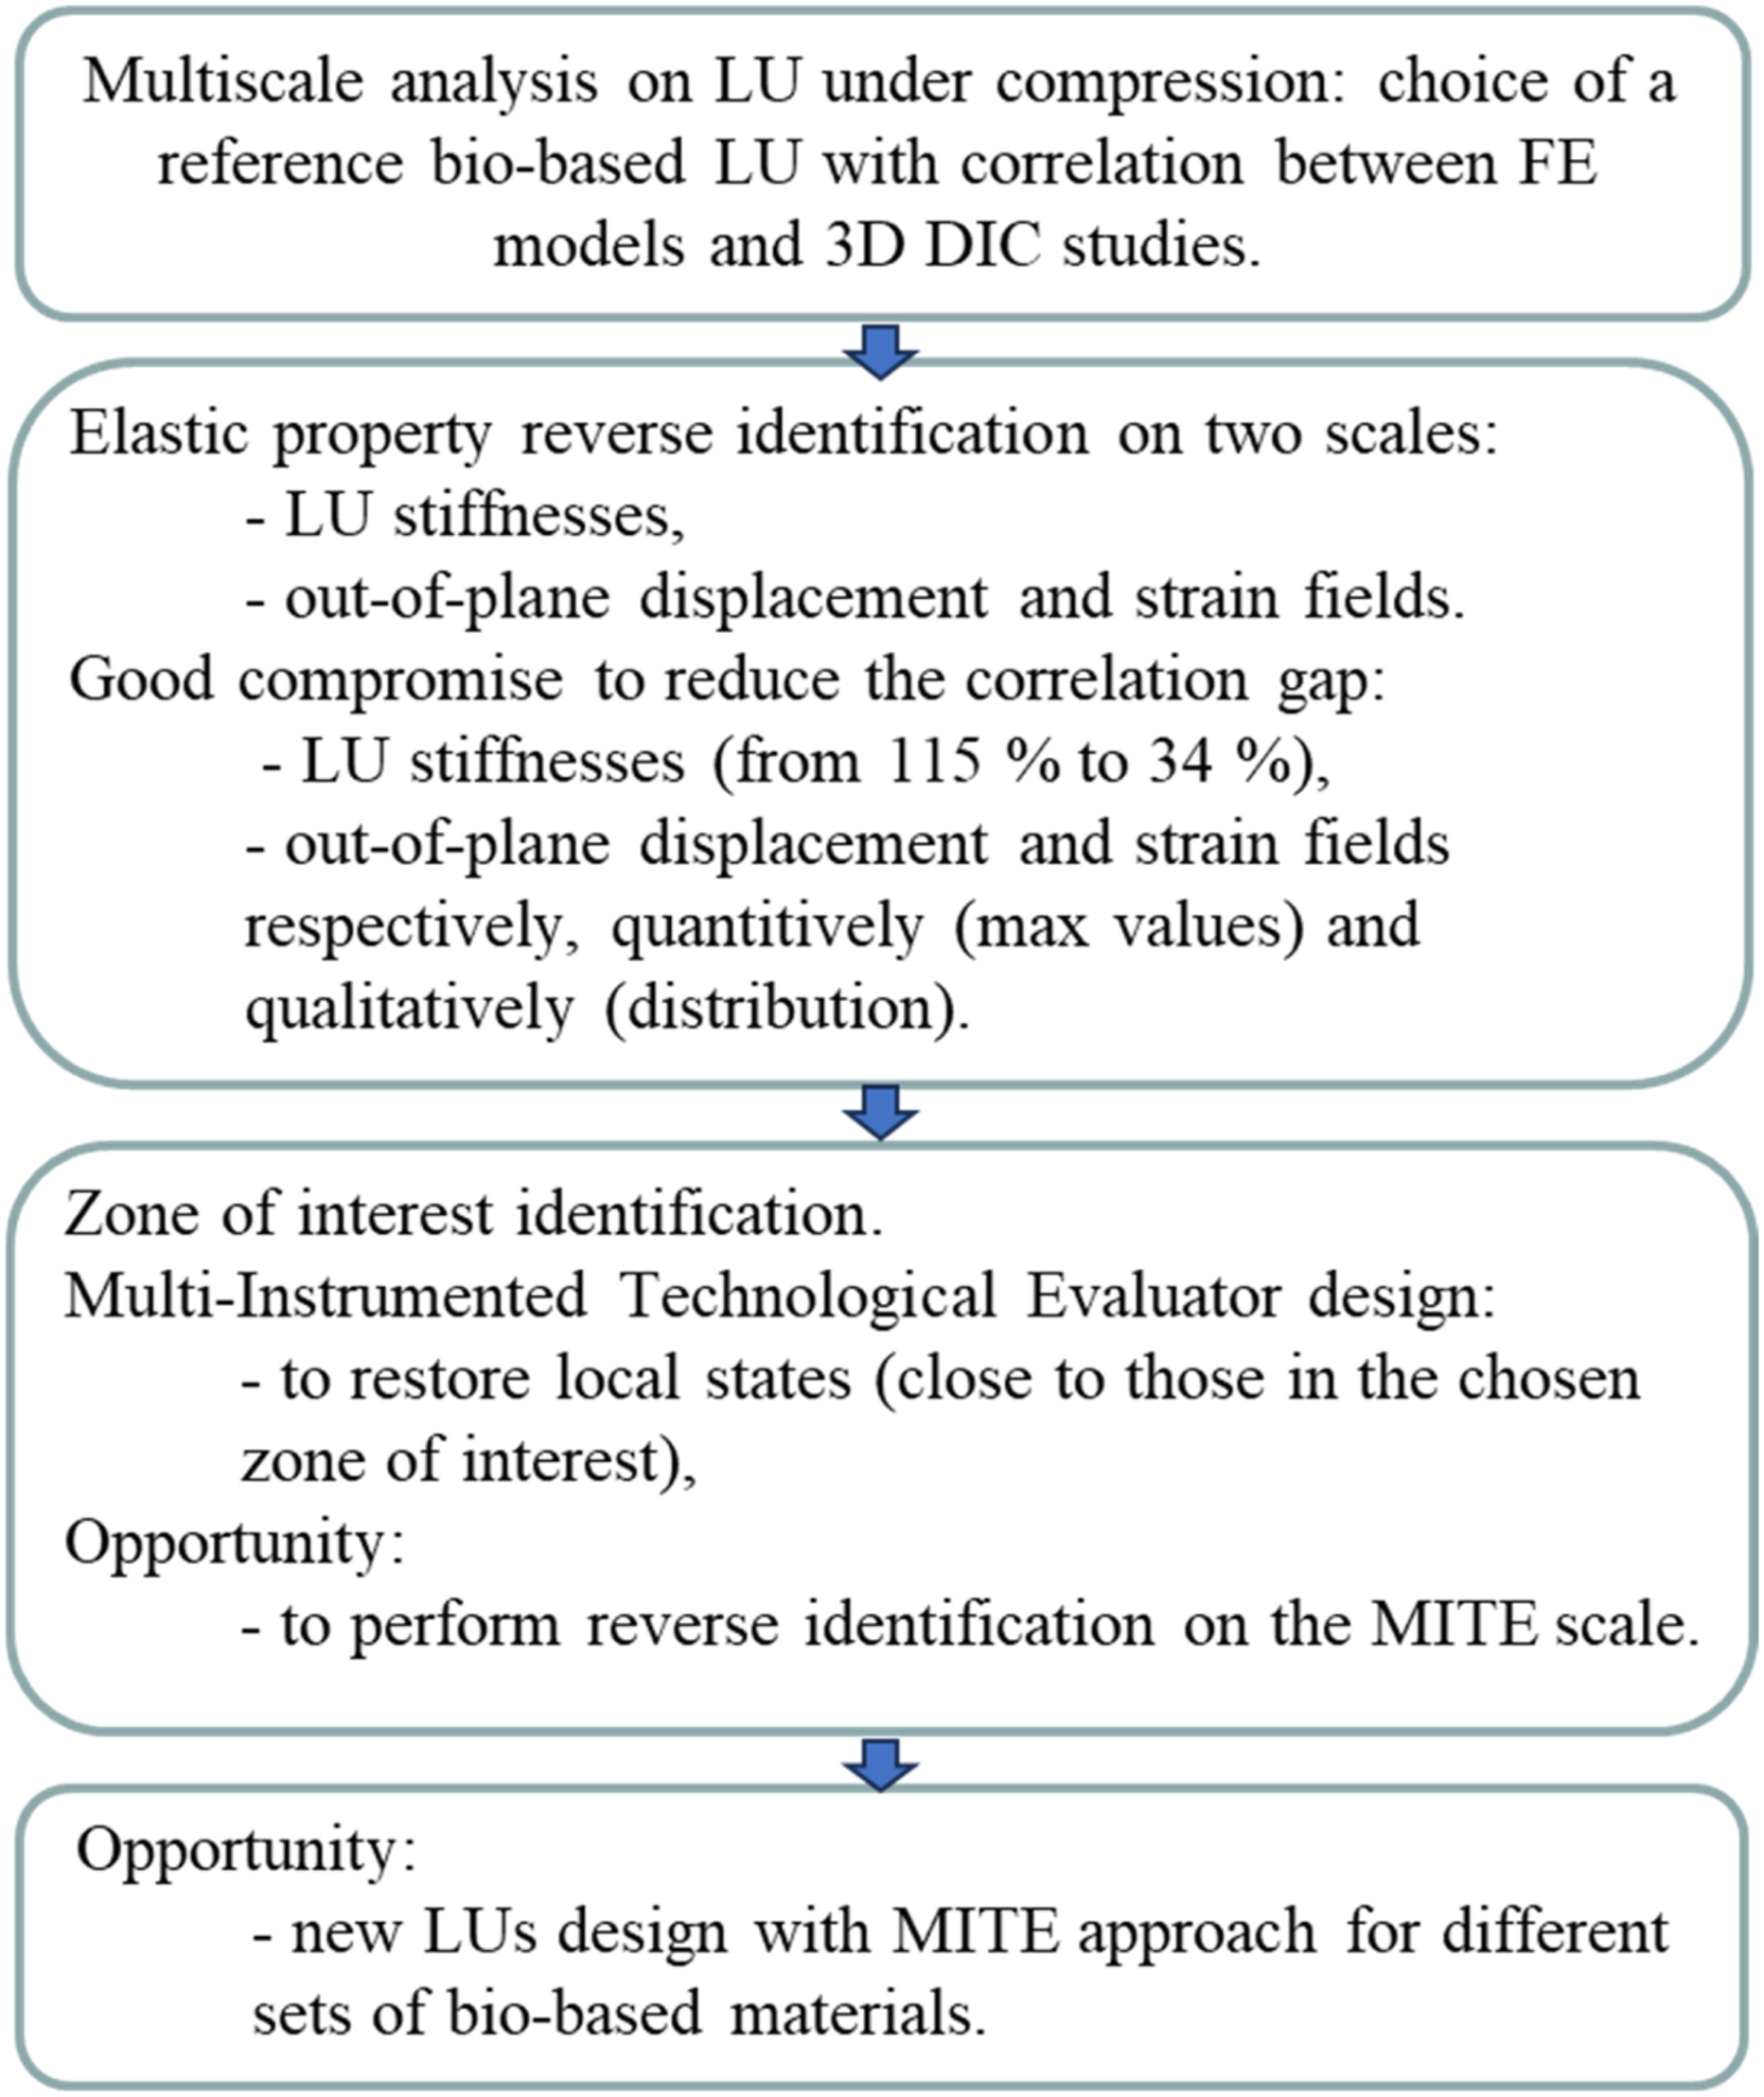
Zone of interest identification and multi-instrumented technological evaluators
Zone of interest identification
As mentioned previously, the validation of the defined FEM allows us to identify the different areas of interest within the logistic unit. The Tsai-Hill criterion is used to identify these areas as the “most stressed zones” within the unit during compression, cf. Figure 21. This criterion qualitatively translates the risk of a probable appearance of damage using material strength properties. Figure 21 illustrates areas (zones of interest) not only located at the center of the panel (Z.1) but also in the vicinity of the pallet soles (Z.2). Tsai-Hill distribution on the large LU panel face at 780 daN of load with the location of the zones of interest Z.1 and Z.2.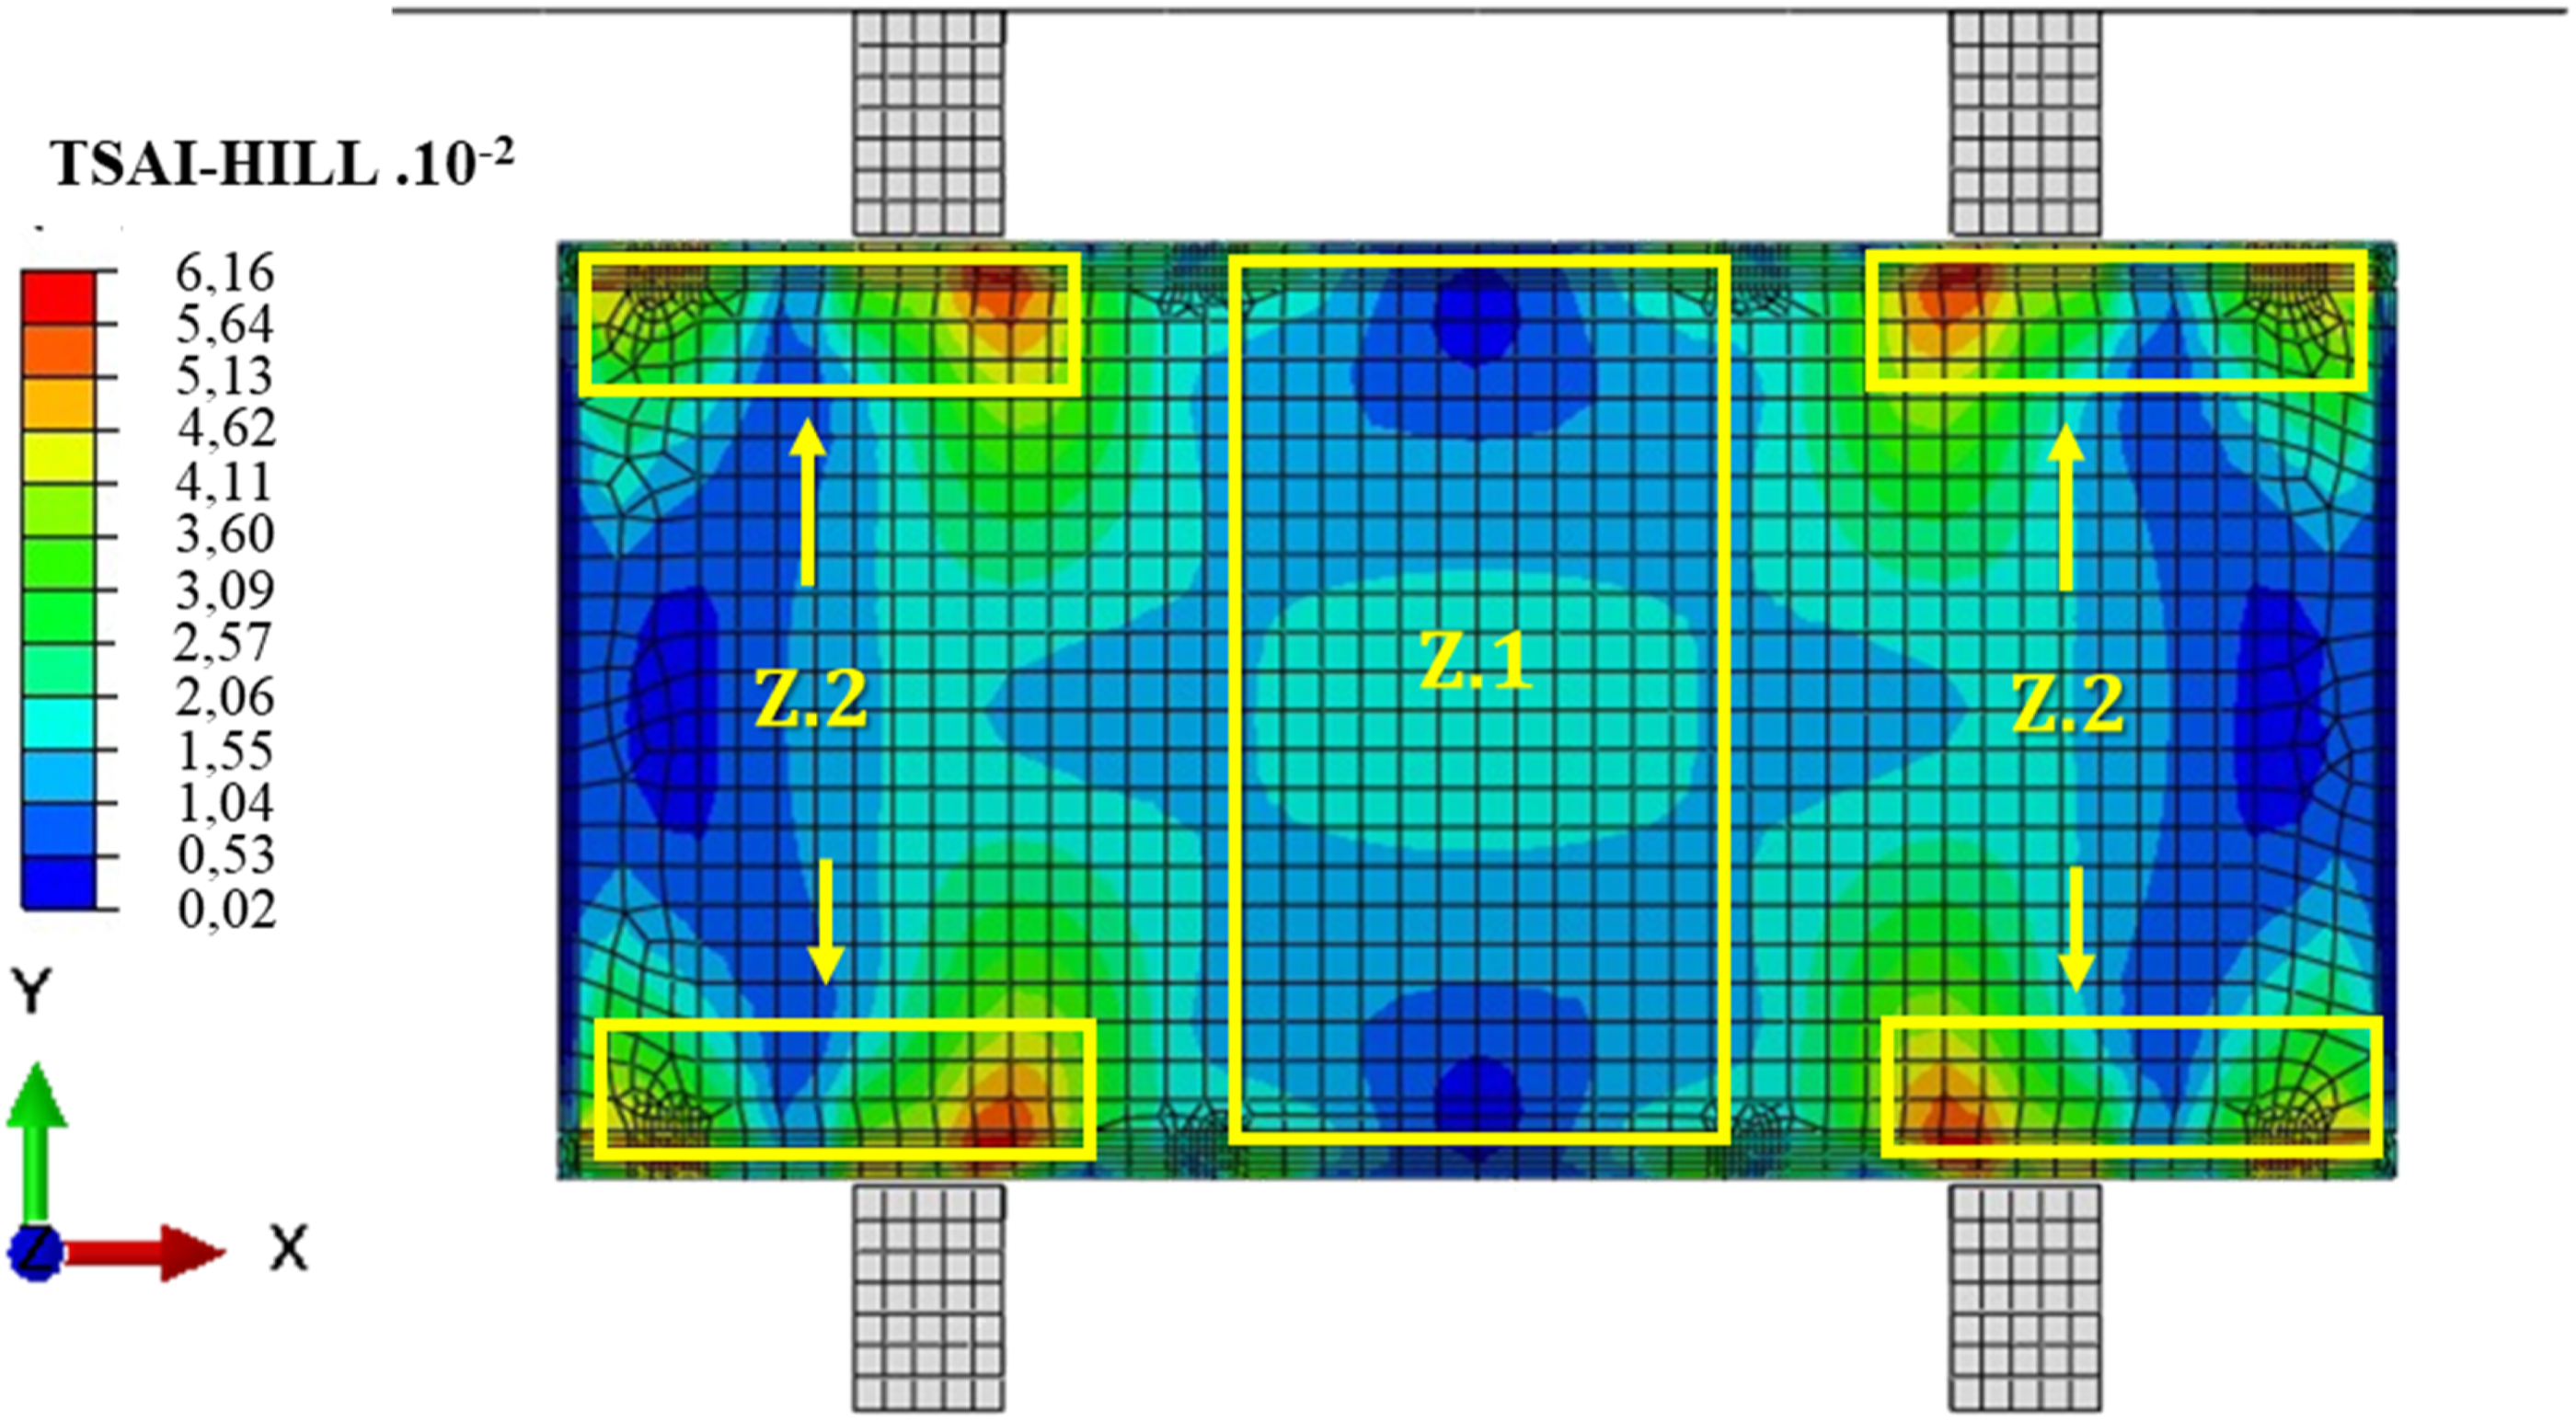
As explained previously, the zone 1 (at the center of the panel) represents an out-of-plane elastic displacement U3 field because of a vertical compressive stress, which is an expected response in the case of rectangular packaging.
36
In the zone 2, a crushing (excessive compression) phenomenon is observed experimentally at loads higher than 800 daN, cf. Figure 22; this is due to the use of top and bottom soles, as well as high shear stresses close to the contact with the iron angles. View of the experimental crushing of the LU in the vicinity of boundary conditions.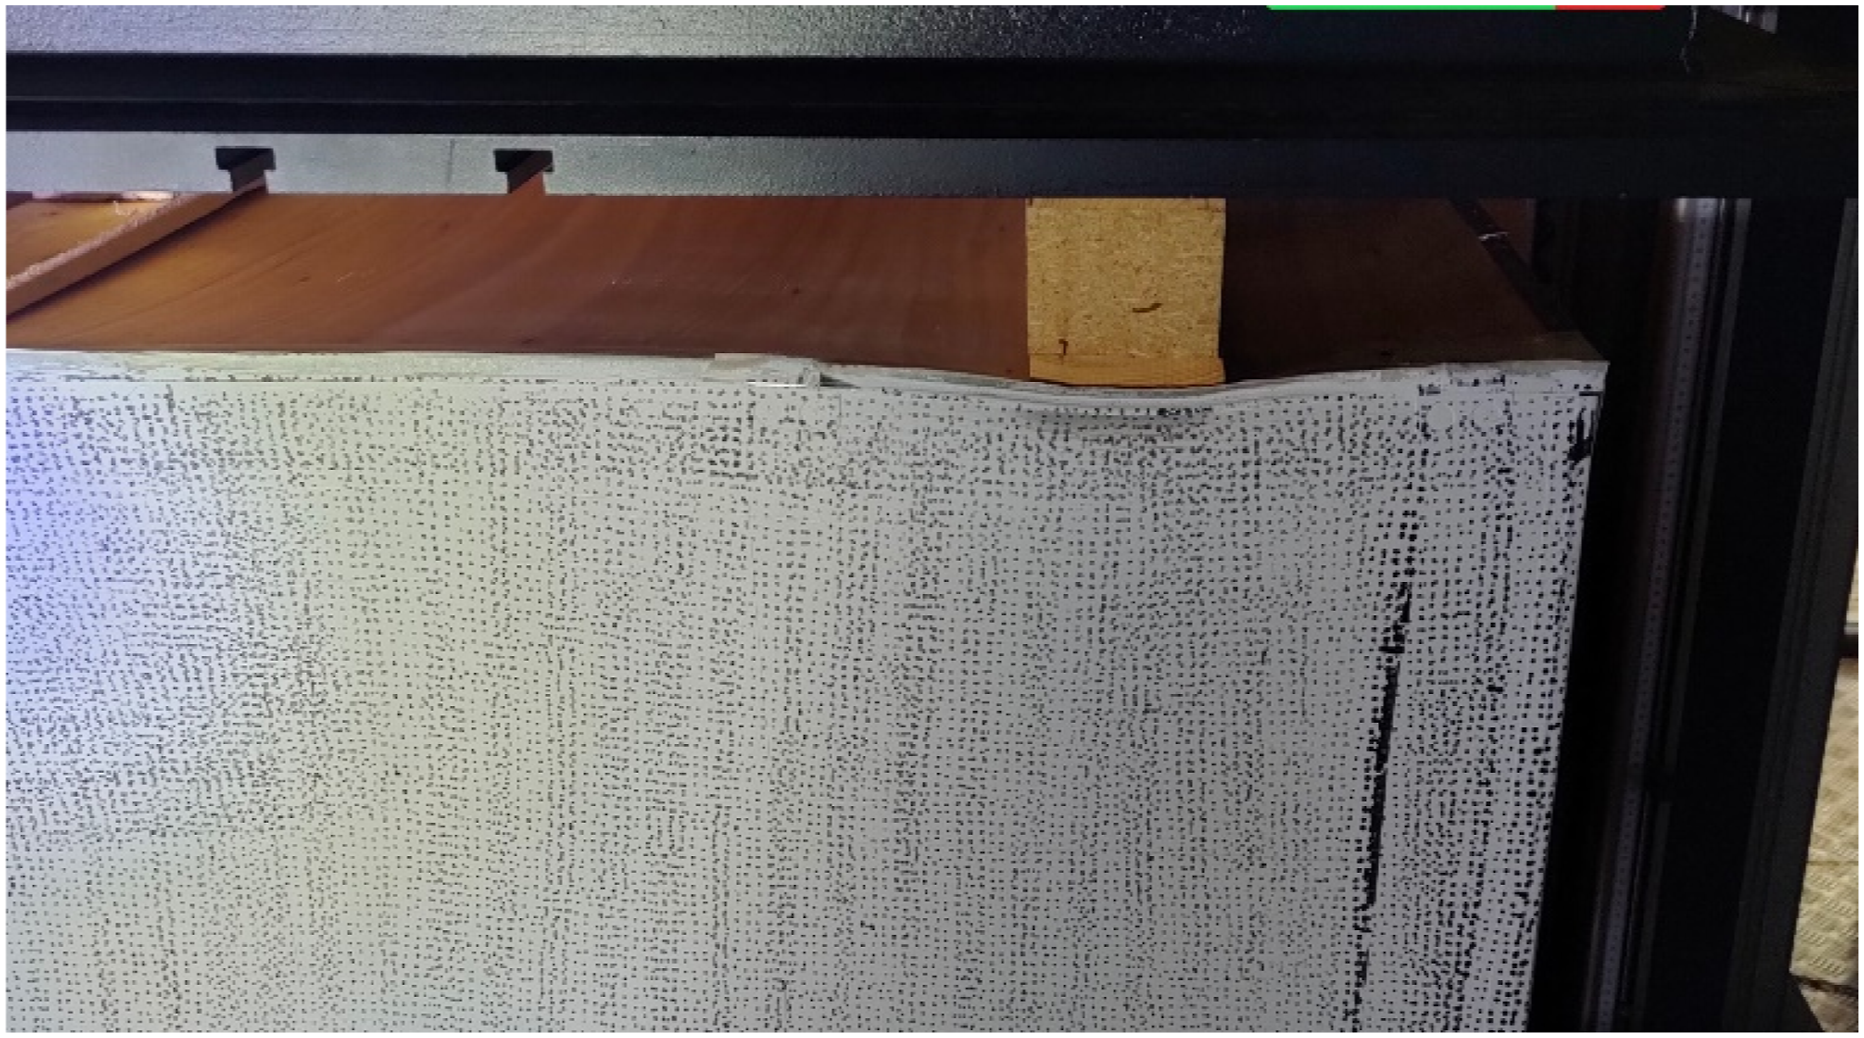
In a design approach, the logistic unit, that is the final structure, does not exist, since obviously it has yet to be designed. We can resort to the concept of the multi-instrumented technological evaluator (MITE) for performing property value updating or for studying specific zones of interest.
Added value of multi-instrumented technological evaluators
Zone 1 (Z.1) is the subject of a specific study using the concept of MITE, introduced briefly in this paper. This area allows representative properties identification of the studied structure, far from combined loading areas, where boundary conditions affect the compression response. The evaluators are parts with smaller dimensions than the final structure and whose boundary conditions and loading kinematics allow the restoration of a local state equivalent to that of the zone of interest (Z.1) of the LU as illustrated in Figure 23. The MITE approach aims to design new logistic units made from different architectures of bio-based materials with a large zone of interest such as materials with bamboo fiber reinforcement.
52
The advantage of the MITE approach
50
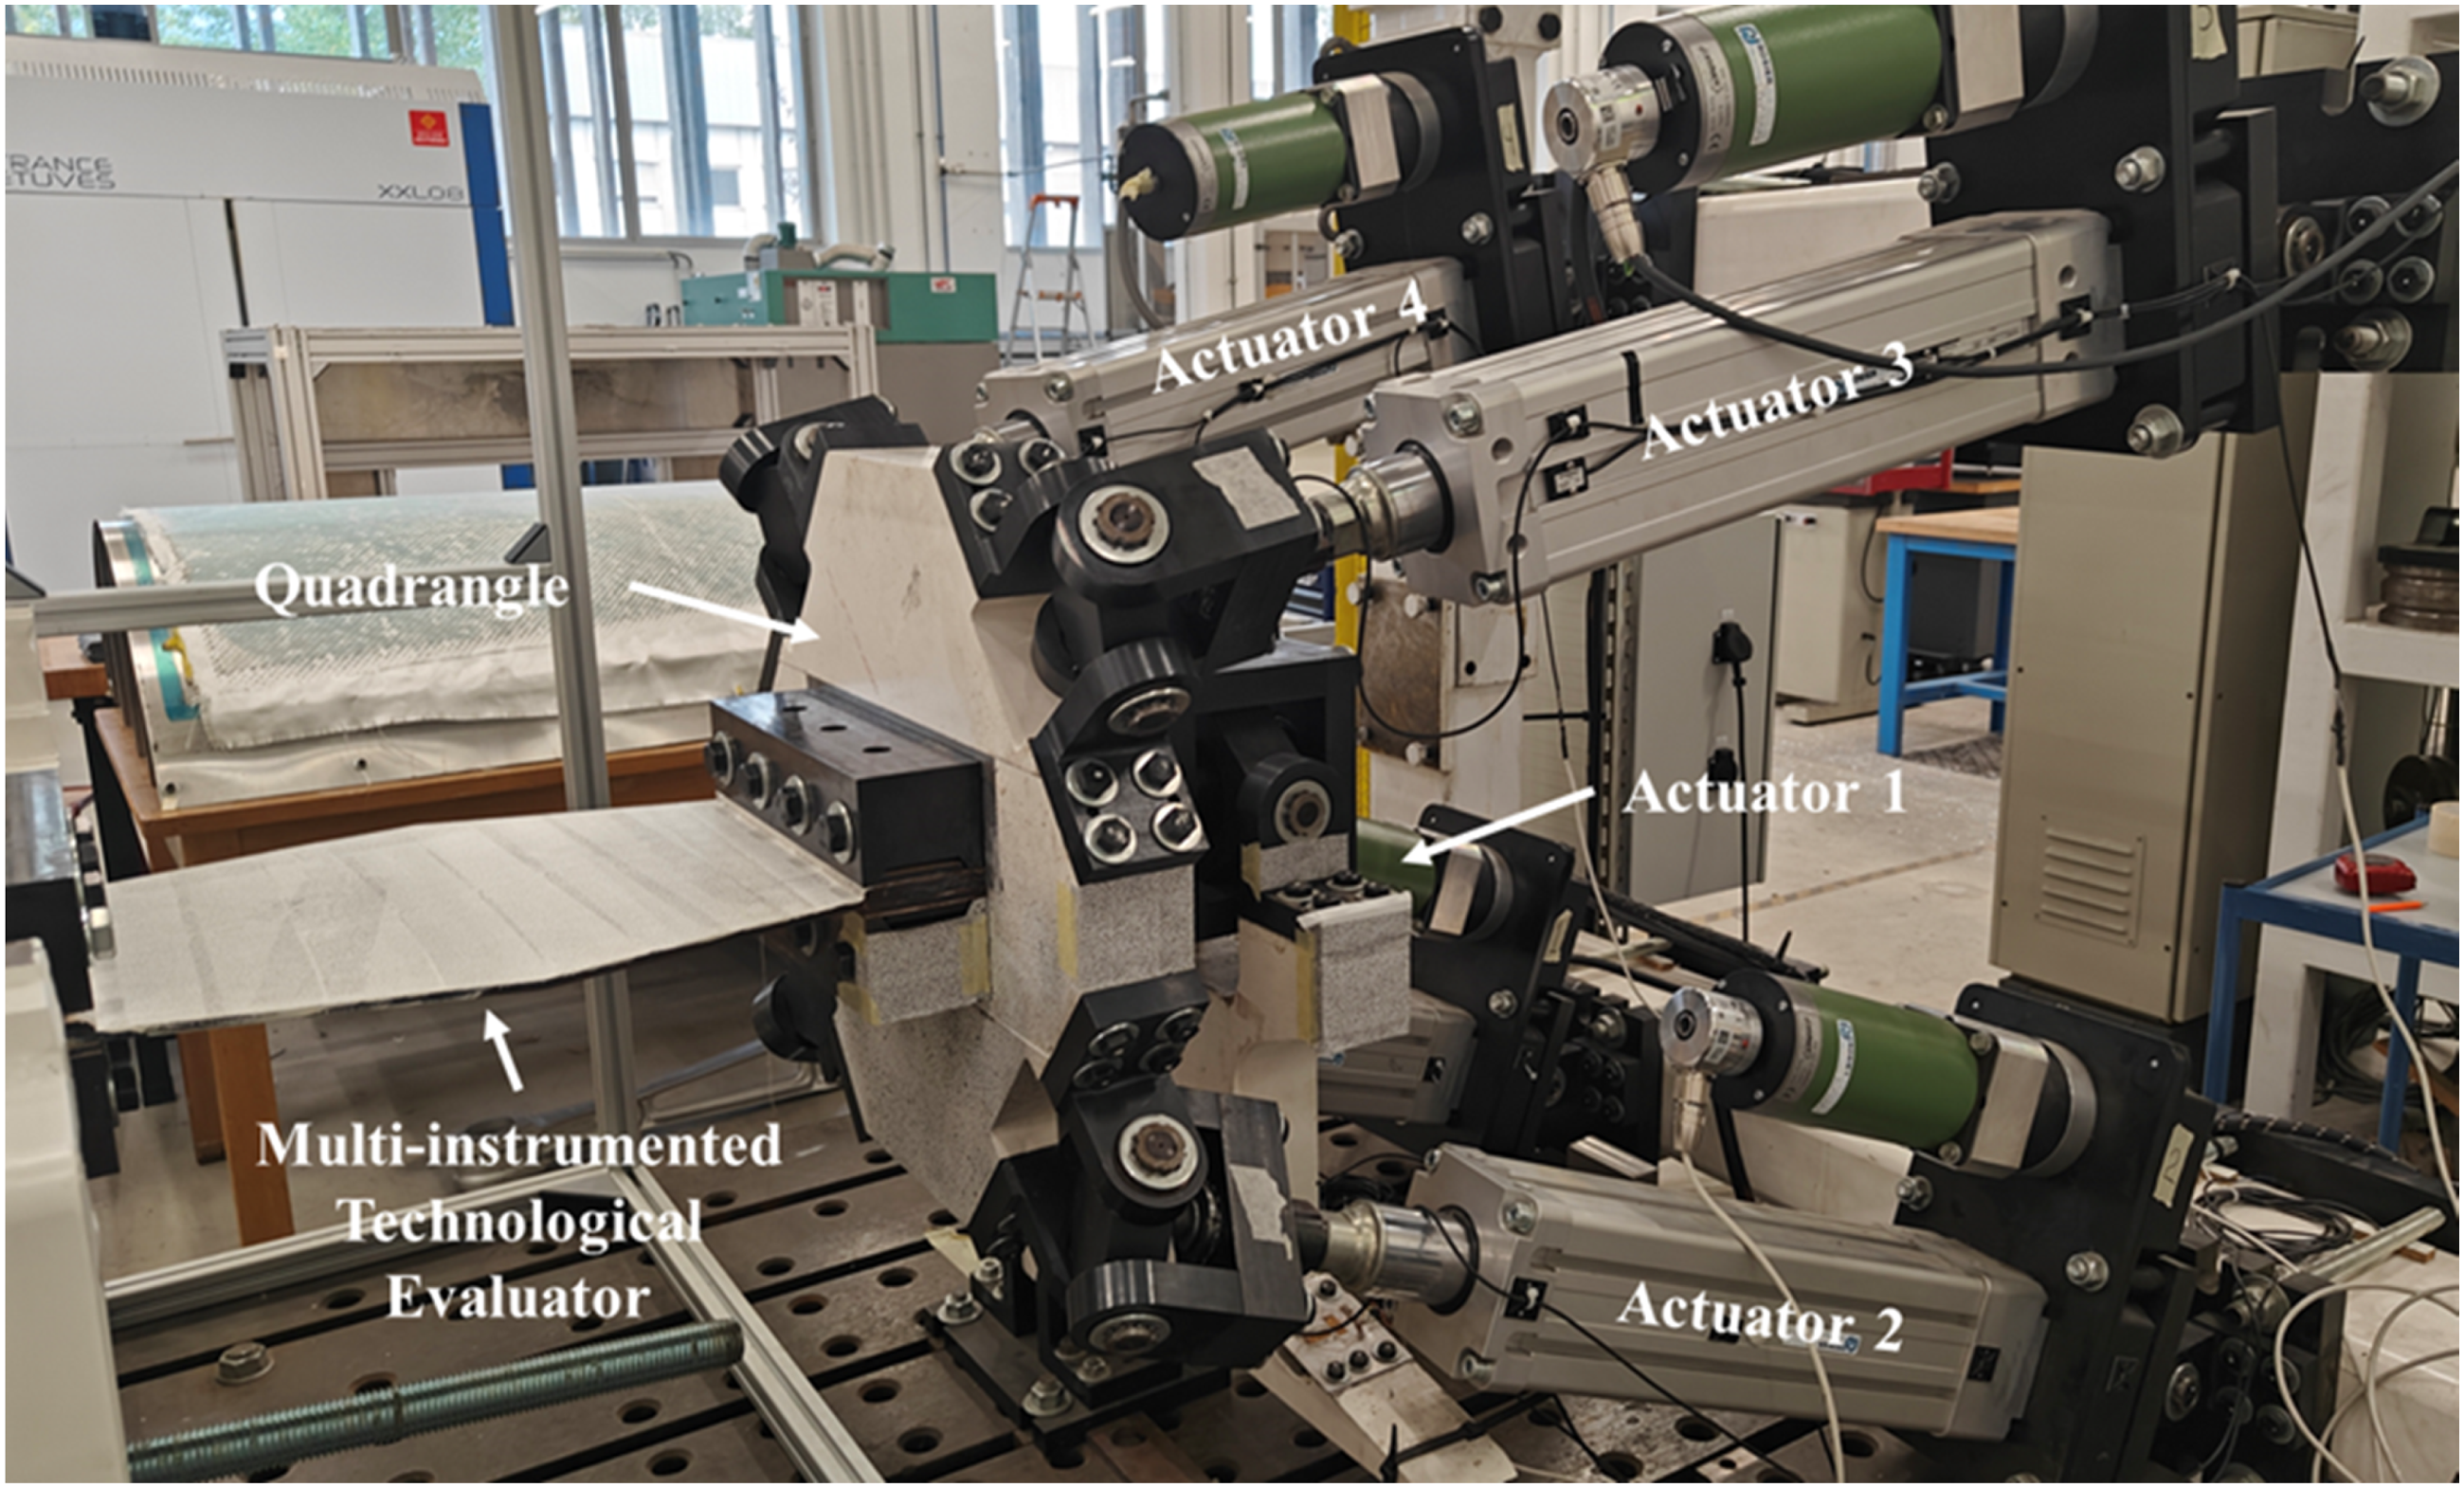
is to use only the technological evaluators, manufactured in large numbers, before investing in a validation test on the final logistic unit. Figure 24 shows the framework of the design investigation with a technological evaluator mounted on a multi-axial experimental set-up
50
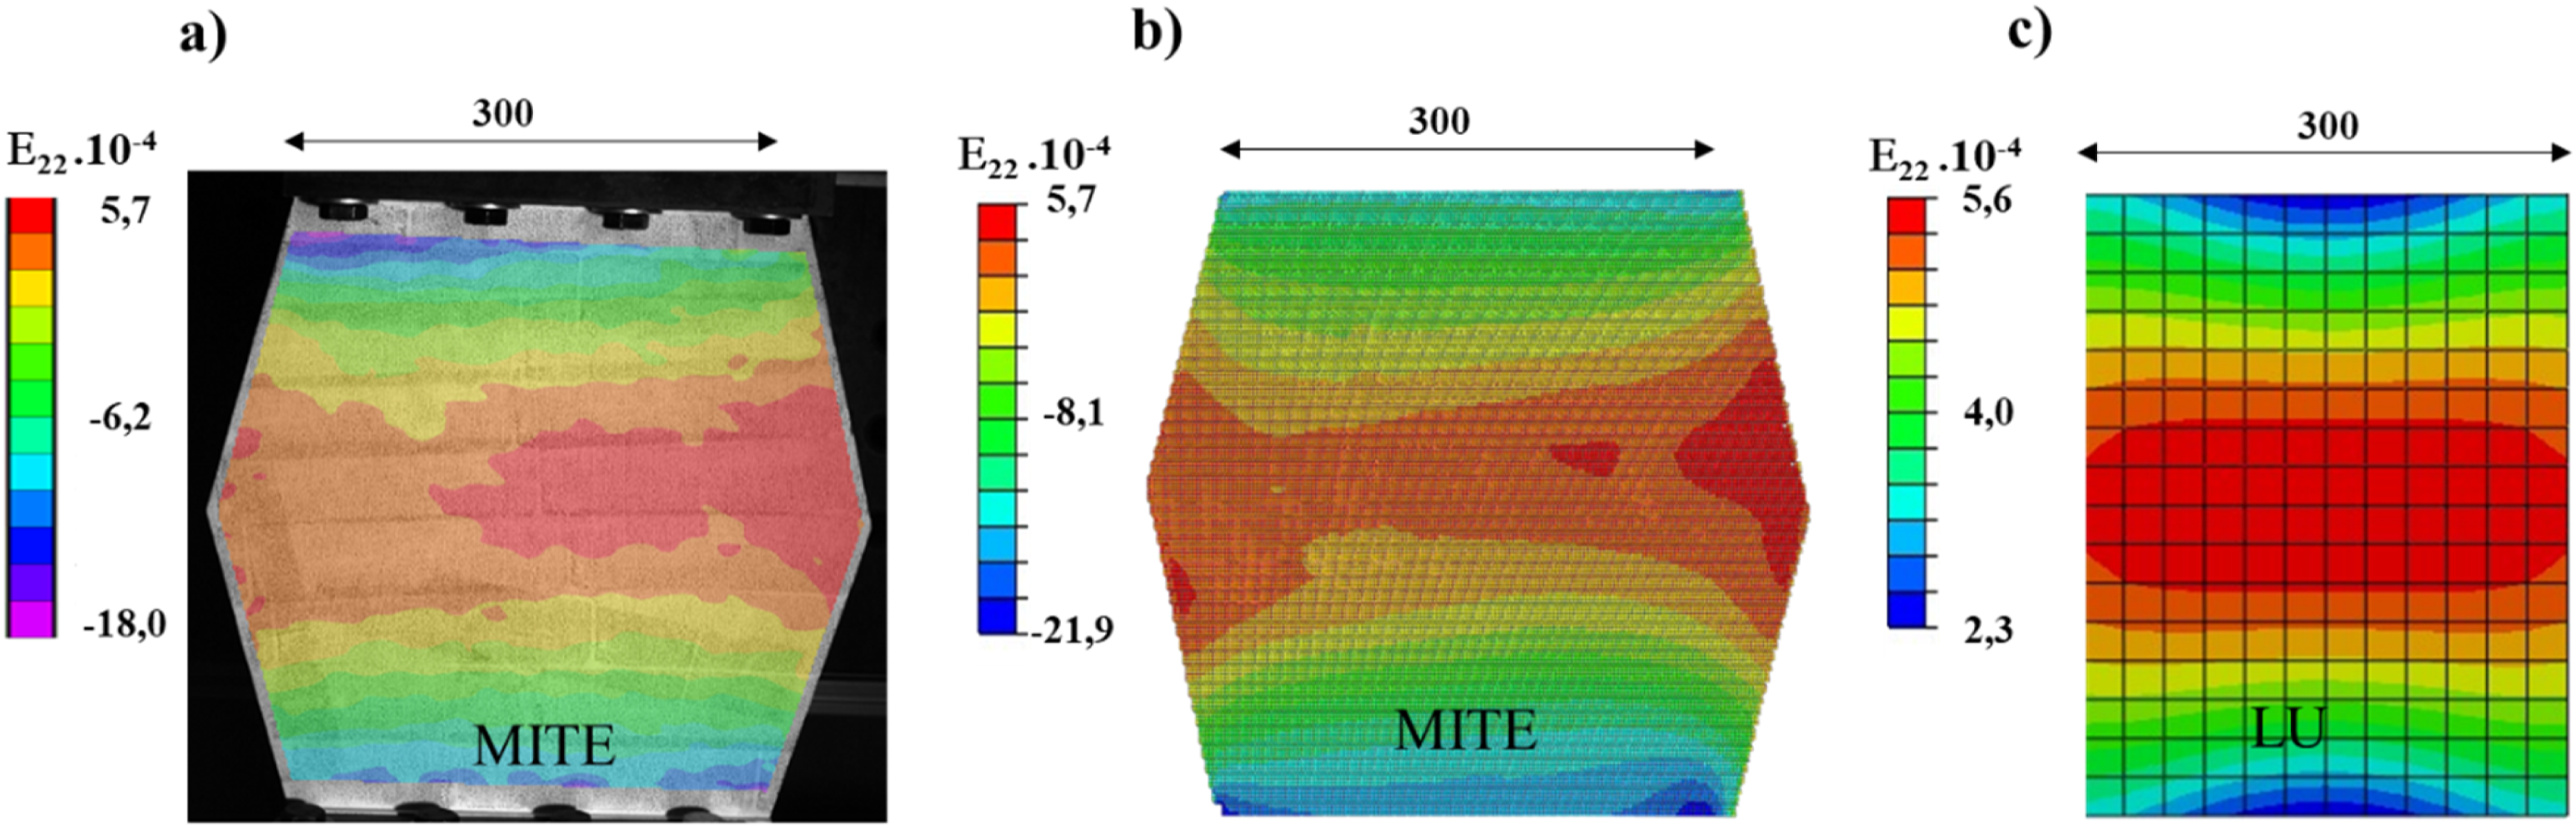
to provide a similar response of the zone of interest (Z.1) of the logistic unit at a smaller scale. The benefit of this approach is illustrated in Figure 25 in the case of the studied reference LU. A calculation-test dialogue (cf. Figure 25) allows several opportunities such as the identification of elastic mechanical properties (not presented in this paper) and essentially applying the similar type of loading, using the multi-axial testing machine. The testing machine can apply combined loads thanks to four electric actuators. These actuators are attached to a steel quadrangle, which transmits the load to the evaluator for a chosen kinematic, cf. Figure 24. Transverse strain E22 field on Z.1 (continuous and dashed line) of the LU at 780 daN. Multi-axial testing machine with the LU MITE mounted, painted with a speckled pattern. Transverse strain E22 distribution in the zone of interest (Z.1) after compression loading with, (a) an experimental response on LU MITE, (b) a FEM response on LU MITE and (c) a FEM response on the LU.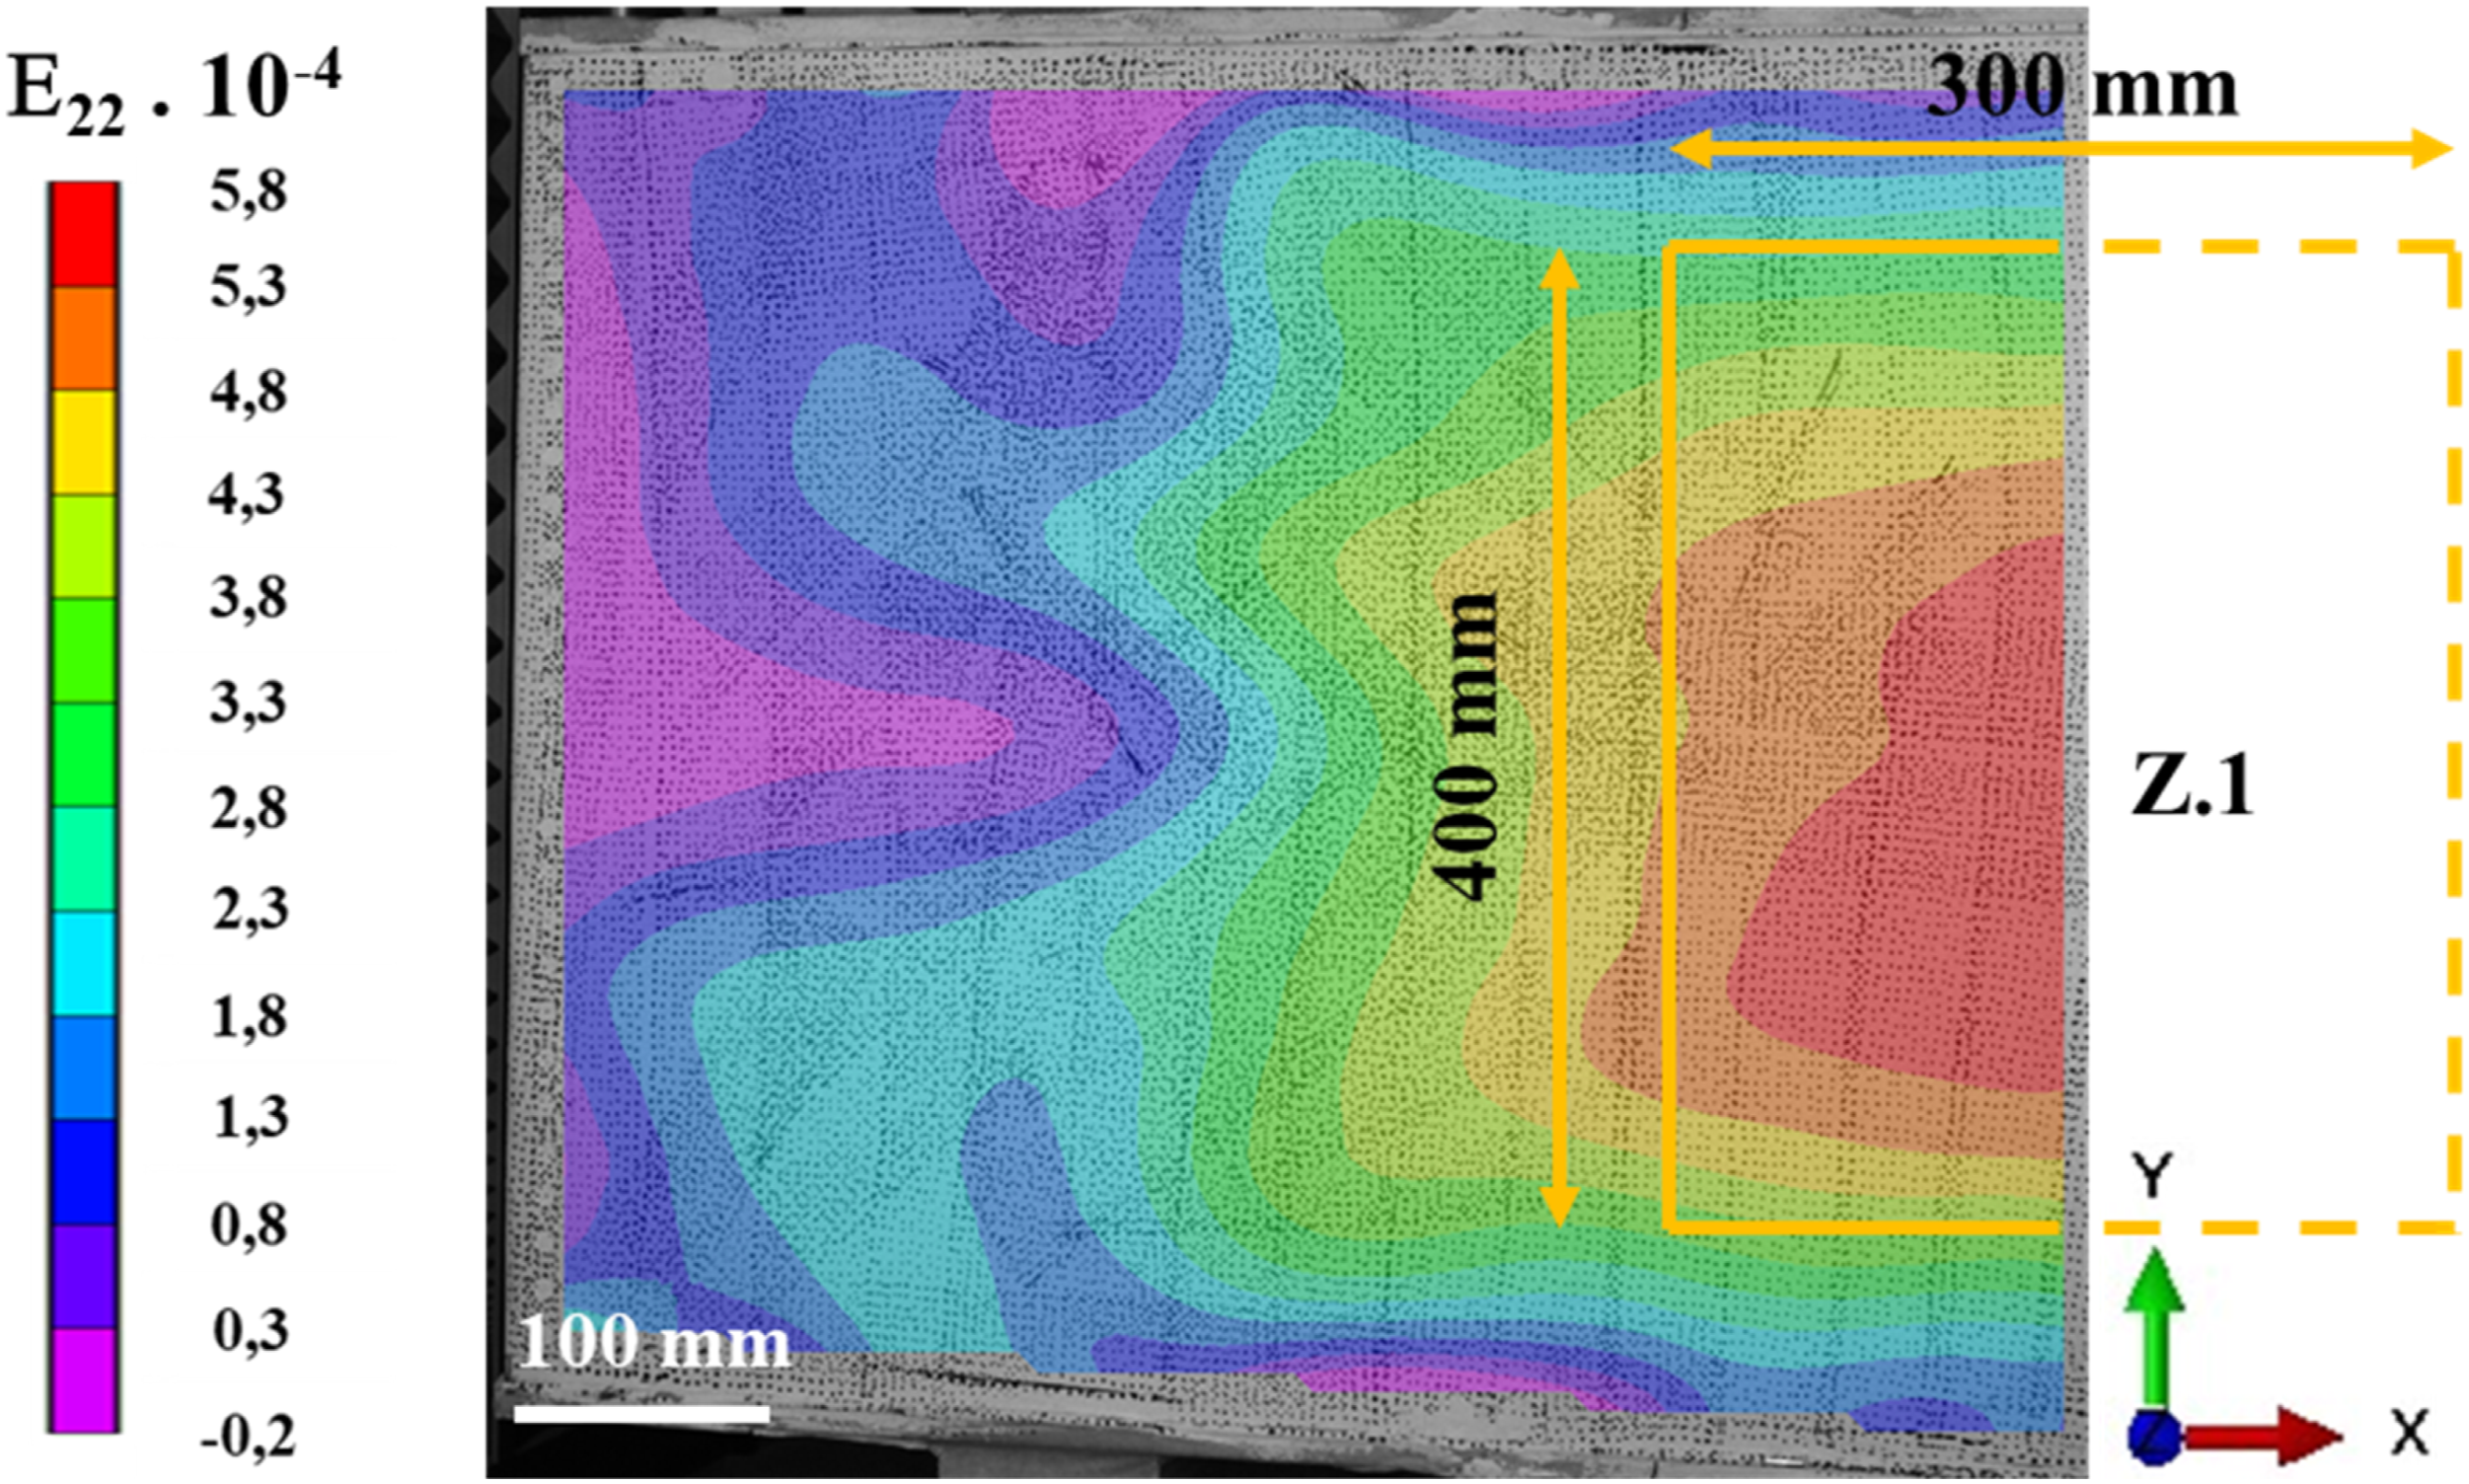
Conclusion
This paper presents a study of the elastic heterogeneous composite material properties of a structure, here a logistic unit (LU), based on bio-based materials, under normal stacking and storage conditions. The initial assumption based on properties obtained with elementary coupons characterization as input data resulted in an unsatisfactory FE calculation-experimental tests correlation. A difference of 115 % between the experimental and numerical LU stiffness values was noted. Therefore, we proposed a property updating approach, via a reverse identification in the framework of a multiscale approach, by varying the longitudinal and transverse elasticity modulus values E1 and E2, respectively.
In this paper, numerical (FEMs) and experimental (protocols and measurement techniques at different scales) tools are developed. The proposed methodology is based on an original calculation-test dialogue, to be capable of considering the representative working conditions of bio-based materials as structural materials. Using ABAQUS® software, the proposed FEM with non-linear geometry elastic material hypotheses reproduces the experimental vertical compression conditions imposed by the ISTA 3E standard. In a first phase, the adjustment (updating by reverse identification on the structural scale) of the input data (mechanical properties) of the FEM is then performed using the linear zone of the load/vertical displacement responses (LU stiffness) of the tested units. An acceptable LU stiffness correlation was obtained but the results proved that this property updating on the LU scale is insufficient to provide a satisfactory correlation at the local scale for out-of-plane displacement and strain fields in the lateral LU panels. In a second phase, FEM property updating was carried out by reverse identification using the maximum values of the out-of-plane displacement/strain fields defined by the 3D DIC technique and FE calculation. This required a MATLAB® algorithm to obtain the correspondence between 3D DIC and FEM points in the same coordinate system. A reasonable correlation between the numerical and experimental results was achieved at the global scale with a 34 % difference between the experimental and numerical LU stiffnesses and, at the local scale, between the different fields, both in terms of distribution and order of magnitude. This final updating led to a 53% reduction between the initial property values and the final ones. The proposed approach also allows other more sophisticated choices to update more elastic properties using optimization algorithms which are not shown here. The advantage of the method presented is that it shows that there is a need to adjust the values of the elastic properties, and that this adjustment must consider the response of the structure at different scales. The disadvantage of the method is to reveal that if we aim for a satisfactory correlation at the local scale in what has been defined as the zone of interest, then we cannot necessarily correlate global stiffnesses at the macroscopic scale. This is why the use of Multi Instrumented Technological Evaluator (MITE) is discussed at the end of the paper, as it enables a direct dialogue to be established between the loading (in this case, compression) and the zone of interest, without depending on the influence of panel boundary conditions within the logistics unit under study. The last part of the paper introduces the benefits of the MITE concept to design new logistic units, based on sub-scale parts and a multiaxial set-up, to be close to the LU work conditions.
Footnotes
Acknowledgments
The authors would like to thank the Occitanie Region (France) and the IUT Paul Sabatier (France) for funding Mohamed Hichem Saihi’s thesis. Our gratitude also goes to the Ilipack platform at IUT Paul Sabatier in Castres city (France), for their financial support in carrying out this work. The authors thank Nathalie Rocher, Laurent Crouzeix from ICA for their valuable support. We also would like to thank Cobratex French company at Carbonne, in the Occitanie Region, for the fruitful discussions about bio-based tertiary packaging. The authors would like to thank Dr Peter Davies from IFREMER Brest (France) for his precious help in the proofreading of this article.
Declaration of conflicting interests
The author(s) declared no potential conflicts of interest with respect to the research, authorship, and/or publication of this article.
Funding
The author(s) disclosed receipt of the following financial support for the research, authorship, and/or publication of this article: This work was supported by the Mixed syndicate, castres-mazamet; Institut Clément Ader, Université de Toulouse; Ilipack Platform.
Data Availability Statement
Data sharing not applicable to this article as no datasets were generated or analyzed during the current study.