
Abstract
Warping remains a critical challenge in fused deposition modeling (FDM) of thermoplastic composites, leading to dimensional inaccuracies and compromised mechanical properties in printed parts. Existing studies have predominantly examined individual factors that affect warpage, such as infill specifications and printing orientation, without a comprehensive assessment of their combined effects. This study addresses this gap by employing a transient thermomechanical simulation approach in Digimat-AM, which integrates material crystallinity evolution, fiber orientation effects, and toolpath-dependent thermal history to enhance warpage prediction accuracy. A short carbon fiber-reinforced polyamide 12 composite was selected as the material system due to its complex thermal behavior, including the negative thermal expansion coefficient of carbon fibers. An unmanned aerial vehicle (UAV) camera holder was used as a case study, where the effects of the infill density, the infill pattern, the printing orientation, and the raster angle on warpage and mechanical performance were systematically analyzed. The high-fidelity simulation method in Digimat-AM was utilized to predict warpage, while experimental validation was performed through tensile and bending tests. Analysis of variance was applied to optimize the process parameters. The results demonstrated that a 90% infill density, a triangular infill pattern, a flat printing orientation, and a 90° raster angle significantly reduced warpage, achieving a deviation angle of as low as 0.04°. Furthermore, the combination of 90% infill density, concentric infill pattern and 90° raster angle improved tensile strength (45.58 MPa) and stiffness (2.57 GPa), confirming improved mechanical integrity.
Keywords
Introduction
Additive manufacturing (AM) has quickly emerged as a leading manufacturing technology, enabling high-performance, efficient and cost-effective production. Various industries are affected, including automotive, 1 aerospace, 2 and biomedical fields.3–5 FDM is particularly notable among the various AM techniques due to its accessibility, affordability, and versatility in material usage.6,7 In FDM, components are created by extruding filament layer by layer. Common thermoplastic polymers used in this process include Acrylonitrile Butadiene Styrene (ABS), Poly Lactic Acid (PLA), and nylon. However, these materials often lack the structural integrity and mechanical strength required for demanding engineering applications. 8 Fiber-reinforced filaments have been introduced to address these limitations, significantly improving the mechanical properties of FDM-fabricated parts compared to those made from pure thermoplastics.9–11 Ning et al. 12 showed that short fibers often increase the tensile strength of a polymer matrix and Young’s modulus but can reduce toughness, ductility, and yield strength. 13 studied the influence of introducing short carbon fibers to a PEEK polymer matrix, using samples printed in various orientations.
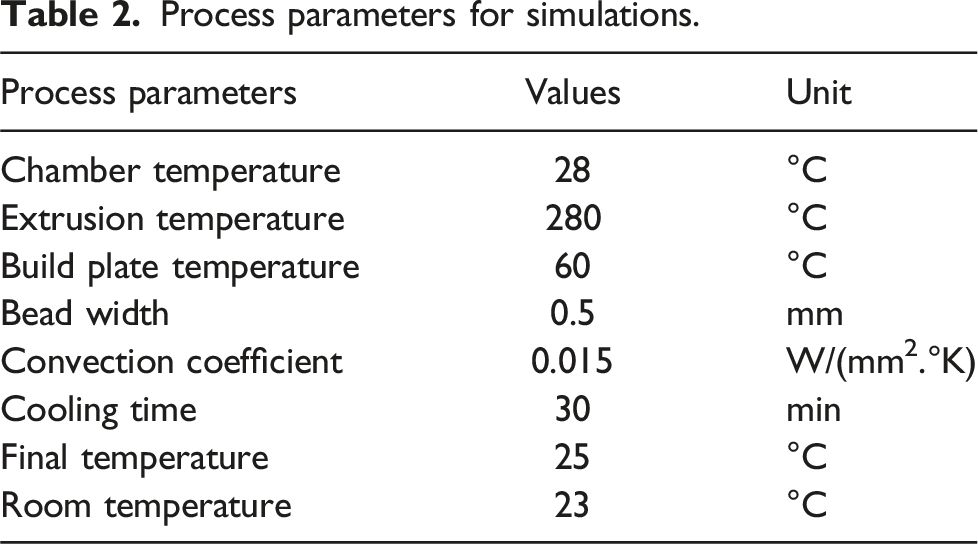
The concept of designing lightweight and durable components is extensively explored and implemented in various industries, particularly in aerospace. In addition, precision in dimensional accuracy is critical for these applications. However, warpage that arises due to residual stress and temperature gradients during the printing process remains a significant challenge in FDM. The extrusion nozzle operates at approximately 280°C, the build plate is maintained at approximately 60°C, and the ambient temperature within the chamber is generally lower than 30°C. This significant temperature difference and the varying air temperatures surrounding the printed part are the main causes of warpage.14,15
Bahandarkar et al. 16 utilized a deep learning approach to predict warpage during FDM printing of PLA and ABS. Their experiments involved printing parts at different extruder temperatures, bed temperatures, and printing speeds. The images captured during the process were analyzed, and the parts that exhibited warpage were visually identified by a noticeable curling or bending at the corners, forming an angle with the horizontal plane. Croccolo et al. 17 implemented a thermal management strategy to mitigate warpage by either increasing the nozzle temperature or disabling the cooling fan during the infilling process. Godderidge et al. 18 optimized the tool path in FDM to minimize warpage. Their study demonstrated that the optimized tool path could reduce the warpage of FDM-printed Polypropylene and Nylon-11 parts by up to 40%. Yu et al. 19 developed computational models incorporating heat transfer, thermoelectricity, and crystallization kinetics to predict the warpage of rectangular boxes made of polypropylene (PP) with varying thicknesses during 3D printing.
The warpage issue is most severe for thin-walled pieces, where maintaining structural integrity while balancing strength and lightweight design requires exact dimensional precision. The extent of the warpage is influenced by the parameters of the printing process, the properties of the material, and the geometry of the part. Previous studies have developed simulations and analytical models to predict warpage based on these factors. 20 The infill density affects the part’s thermal behavior during printing. A lower density yields lighter components that cool faster, causing more warping as a result of reduced structural support and rapid temperature changes. On the other hand, a higher density provides more robust internal support, reducing warping while increasing material utilization and the risk of internal tensions. 21
The geometry of the infill pattern is essential to distribute stresses within the part. Line and triangle infill patterns offer a more uniform stress distribution, which can reduce warpage by creating a stable internal structure. The line pattern is particularly effective in parts that require strength along one axis, while triangles offer robustness in multiple directions. 22 The direction in which a 3D print is made can impact the warping of the final product. This is because the direction affects how well the layers adhere to each other and how quickly the print cools. Printing with a flat orientation usually produces less warping, allowing for better heat dissipation and stability during printing. In contrast, printing on an edge can worsen warping as the surface area in contact with the platform is reduced, leading to uneven cooling rates. 23 The orientation of the print lines, also known as the raster angle, is crucial to determining how heat is distributed during the printing process. Choosing a 45° raster angle can help improve adhesion between layers, reducing warpage. 24 However, this angle can also result in stress concentration, leading to deformation. On the other hand, a 90° raster angle ensures a more uniform distribution of stress and material, which is ideal for parts with complex geometries or for those that need to maintain dimensional stability along multiple axes. 24
This study aims to further investigate the warpage behavior of thermoplastic composites printed via FDM by examining the effects of different infill patterns and densities. This research uses DIGIMAT AM to focus on a case study involving a camera holder (Figure 1) for a gimbal system integrated into a UAV. The objective is to determine the deviation angle between the camera and its holder due to warpage, considering various geometric and printing parameters. Although the build plate and extrusion nozzle temperatures play a crucial role in maintaining adhesion and controlling material flow, their optimal values are typically provided by filament manufacturers. As a result, this study focuses mainly on other adjustable parameters in the printing process that significantly influence warpage, such as infill specifications and printing orientation. These parameters directly impact the thermal history of the printed part, influencing residual stresses and overall dimensional accuracy. The novelty of this study lies in its integrated experimental and simulation approach, which accurately predicts warpage considering the detailed thermal history and the influence of carbon fiber reinforcements. The findings offer practical guidelines for optimizing the parameters of the FDM process, ensuring improved dimensional stability and mechanical performance in aerospace and precision-driven applications. (a) Desired assembly, (b) Camera holder.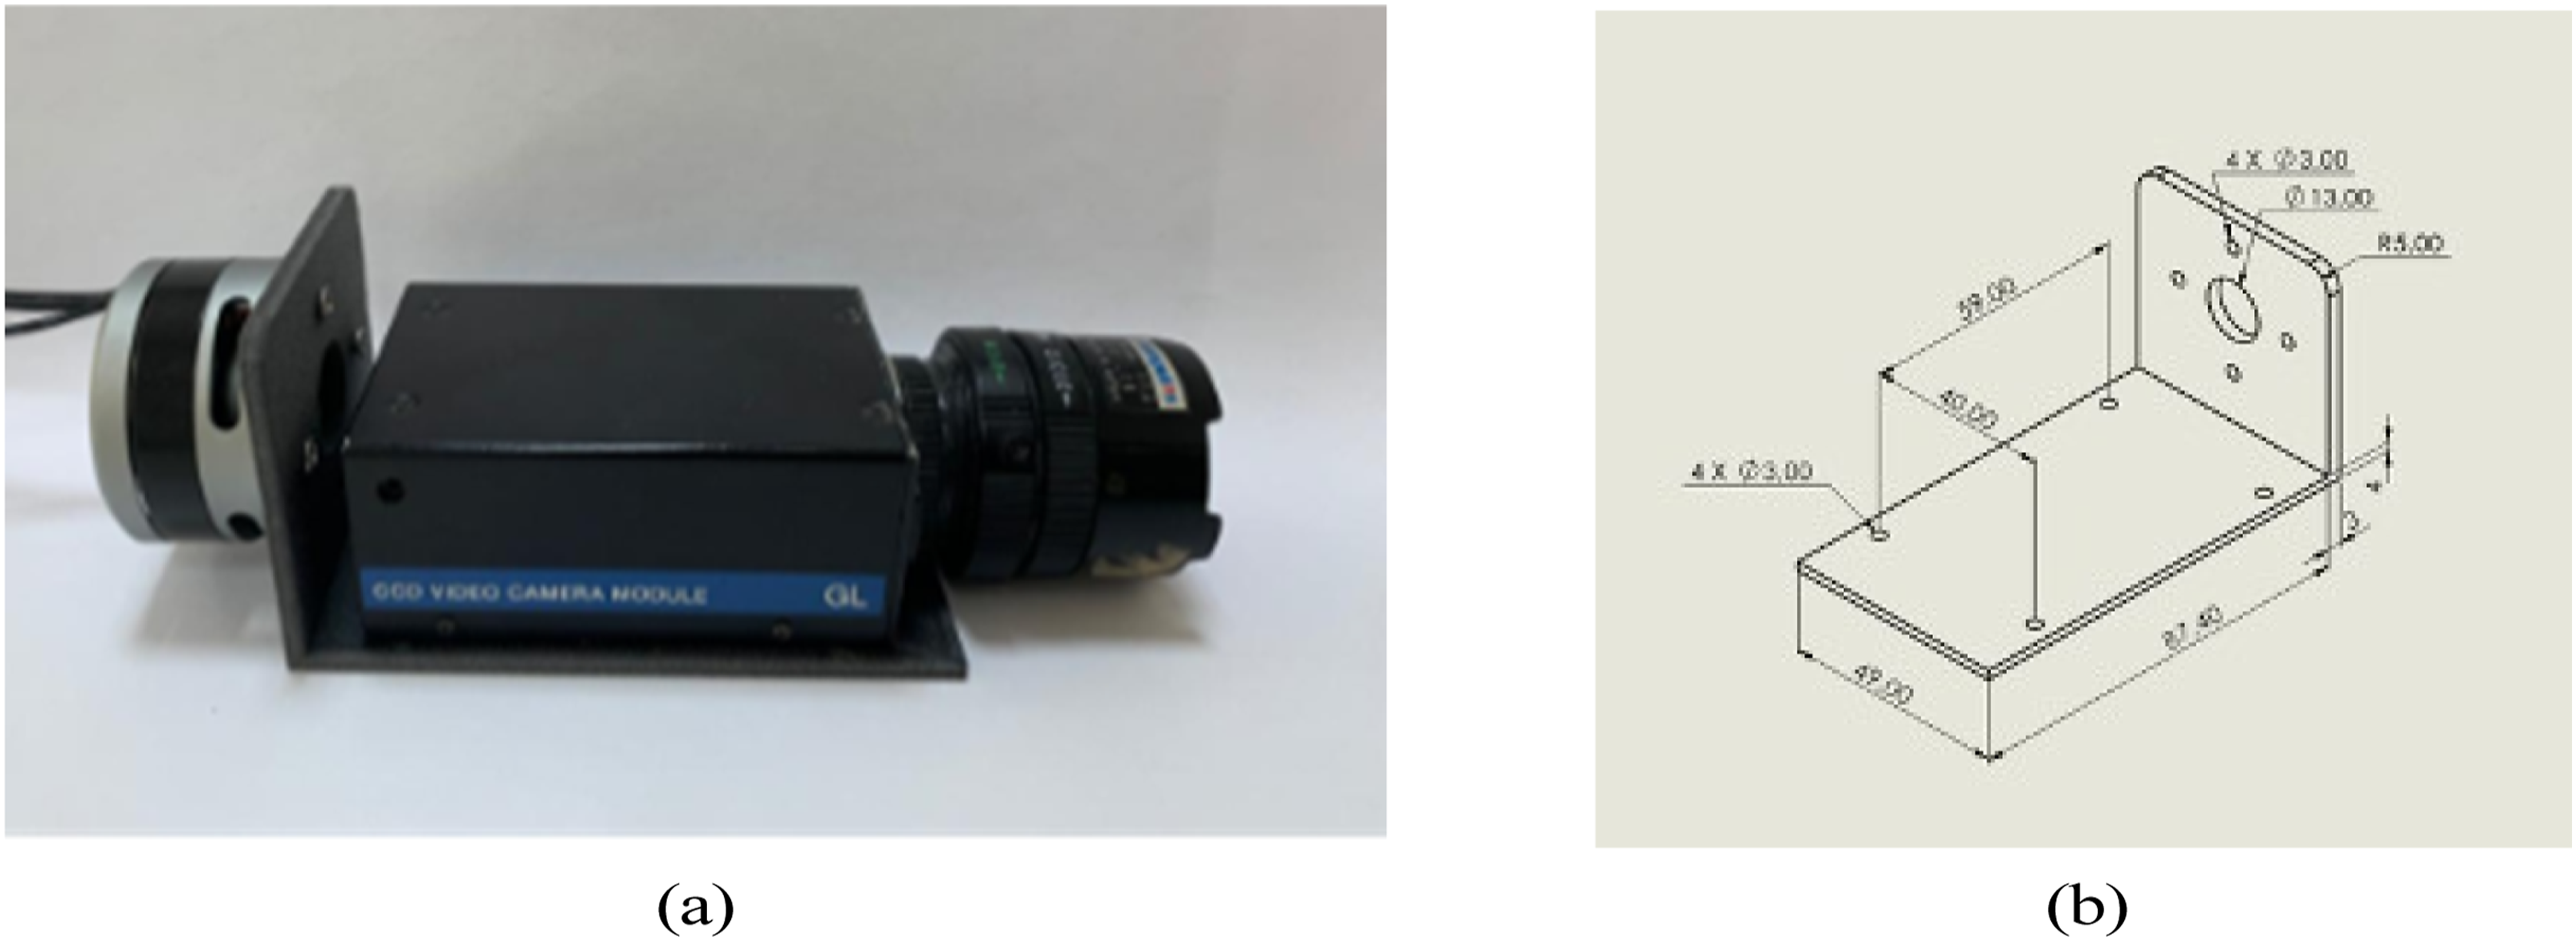
Materials and method
Investigation of warpage and deviation angle
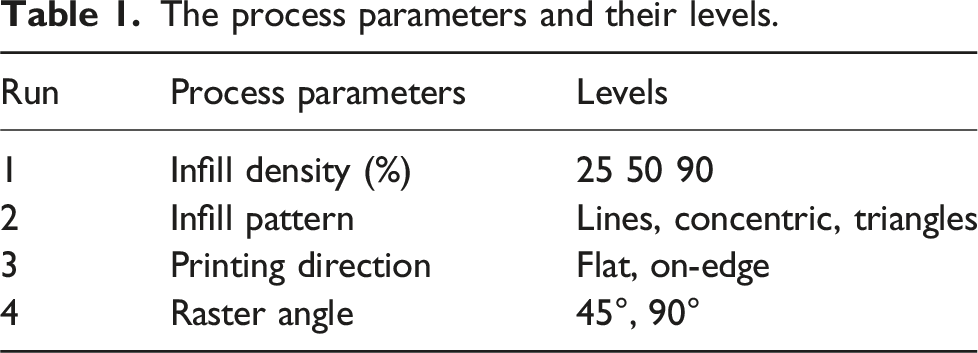
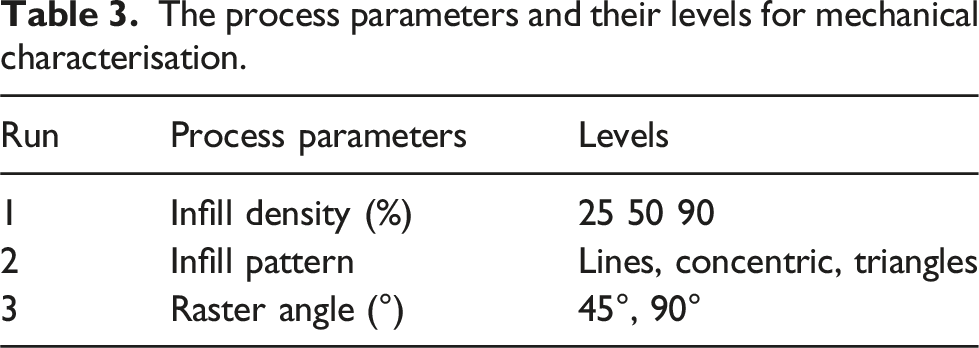
In this study, the warpage of the printed part was investigated in terms of infill percentage (25%, 50%, and 90%), infill pattern (Lines, Concentric, and Triangle), printing direction (Flat and on-edge), and raster angle (45° and 90°). The selected infill densities cover a wide range of practical applications. Densities below 25% are typically suitable for models and decorative pieces where strength is not critical. In contrast, a maximum infill density of 90% was chosen to avoid solid internal structures, which would result in excessive material use and prolonged print times. The infill patterns chosen, Lines, Concentric, and Triangle, were selected for their unique characteristics. The Lines pattern is efficient, widely used, and suitable for standard parts because of its simplicity, quick printing times, and low material consumption. The Concentric pattern introduces flexibility, while the Triangle pattern is lightweight and provides decent structural support with material efficiency. For the printing direction, flat and on-edge orientations were studied, as these are the most feasible for the L-shaped geometry of the part. The upright orientation was excluded because it was impractical for the given shape. 45° and 90° were selected to represent common printing strategies, with 45° being a standard setting to balance strength and print efficiency, and 90° offering orthogonal layer alignment for comparison. Designed of experiment techniques were used to statistically model and analyze the effect of the mentioned factors and their interactions on the response. The response can be modeled as a second-order polynomial of the form:
The process parameters and their levels.
Simulation of the warpage
The stereolithography model (STL) of the camera holder was sliced with the Ultimaker slicer, and the resulting G code was exported to DIGIMAT AM for warpage simulation. The model was then rebuilt in Digimat AM, taking into account the direction of the filaments in each layer. In addition, material properties such as the mass fraction and orientation of the reinforcement fibers, as well as FDM process characteristics such as extruder and chamber temperature, were considered. Figure 2 illustrates the workflow that Digimat AM follows to predict the warpage. Low- and high-fidelity methods are the two primary approaches that Digimat uses to predict the warpage. The low-fidelity method (inherently strain method) approximates residual stresses and distortions on the basis of the behavior of the precomputed material. This method is computationally efficient and provides a general estimate of warpage trends. However, high-fidelity transient thermomechanical simulations incorporate the full thermal his- tory of the printing process, predicting local temperature fields and stress evolution. This method provides more accurate warpage predictions, but requires significant computational resources. In this study, the warpage simulation was performed using the High-fidelity method. The matrix material (PA12) and carbon fiber reinforcements were sourced from the Digimat material library. The orientation of the carbon fiber data was obtained from.
25
The evolution of crystallinity directly influences thermal contraction and, consequently, part distortion, as crystalline structures induce greater shrinkage during their formation. Digimat-AM uses the Nakamura model or the double Nakamura model to predict the maximum degree of crystallinity reached during the printing process. The precision of the deformed geometry in the output STL file is dependent on mesh resolution, material properties, and boundary conditions applied during the simulation. The exported STL represents only the warpage state printed, without considering additional factors such as mechanical loads. Workflow of the Digimat AM.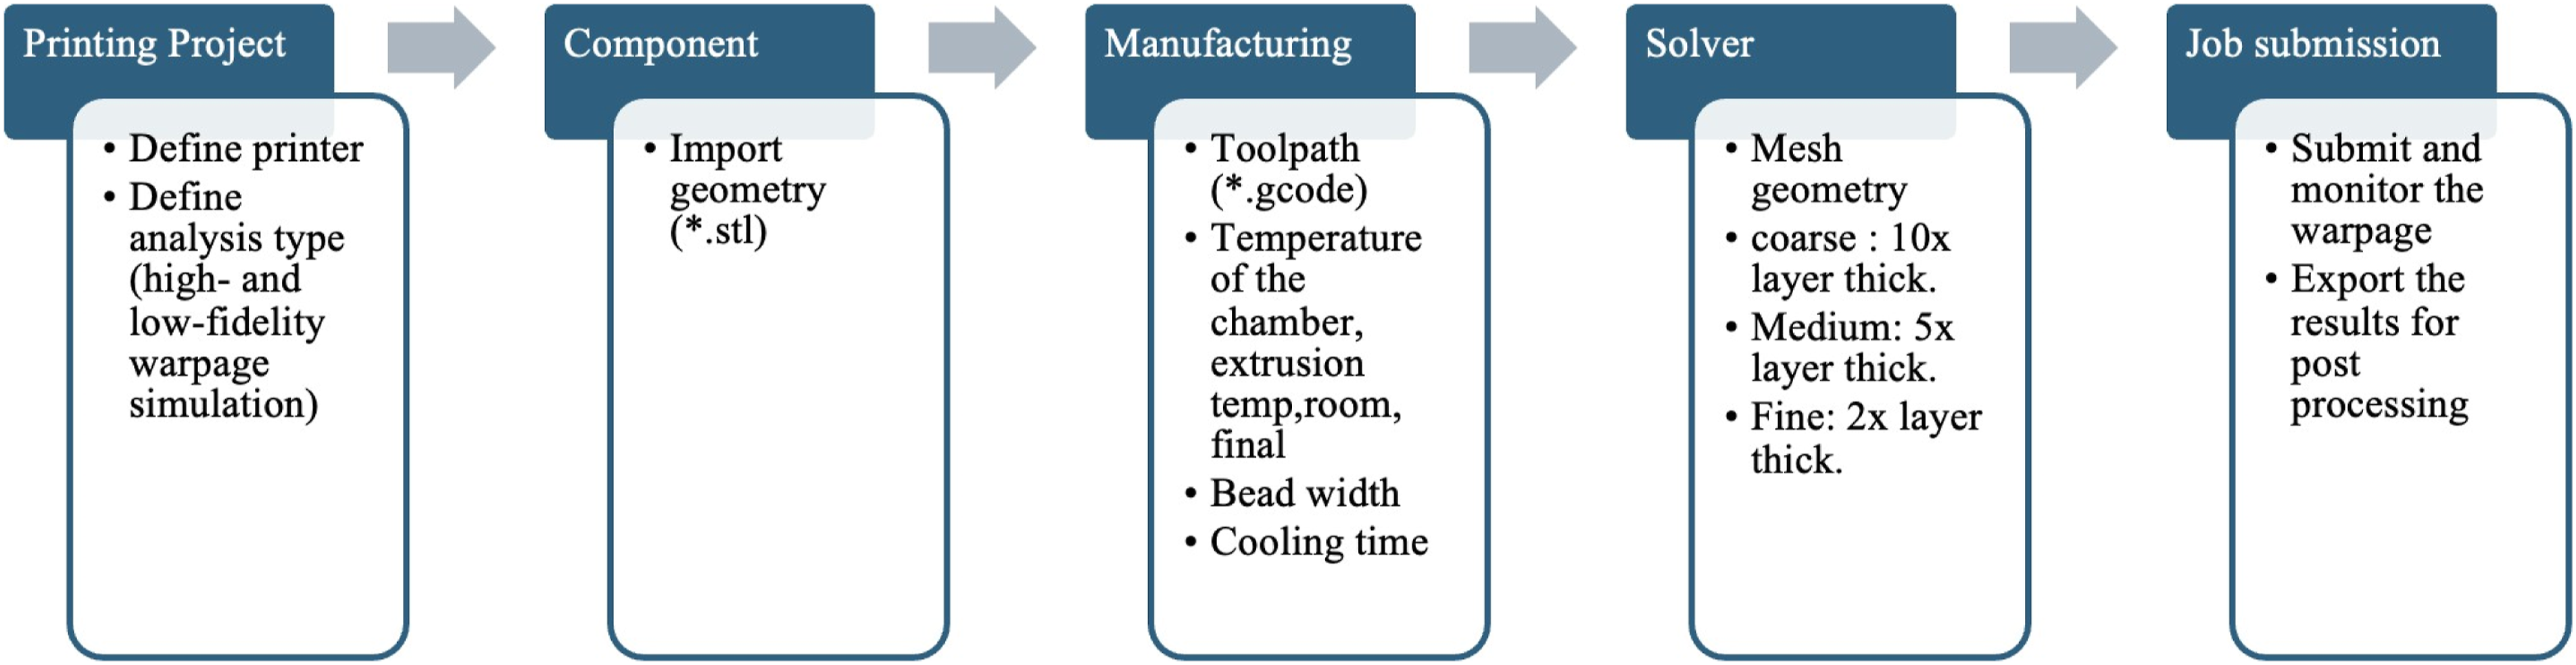
Process parameters for simulations.
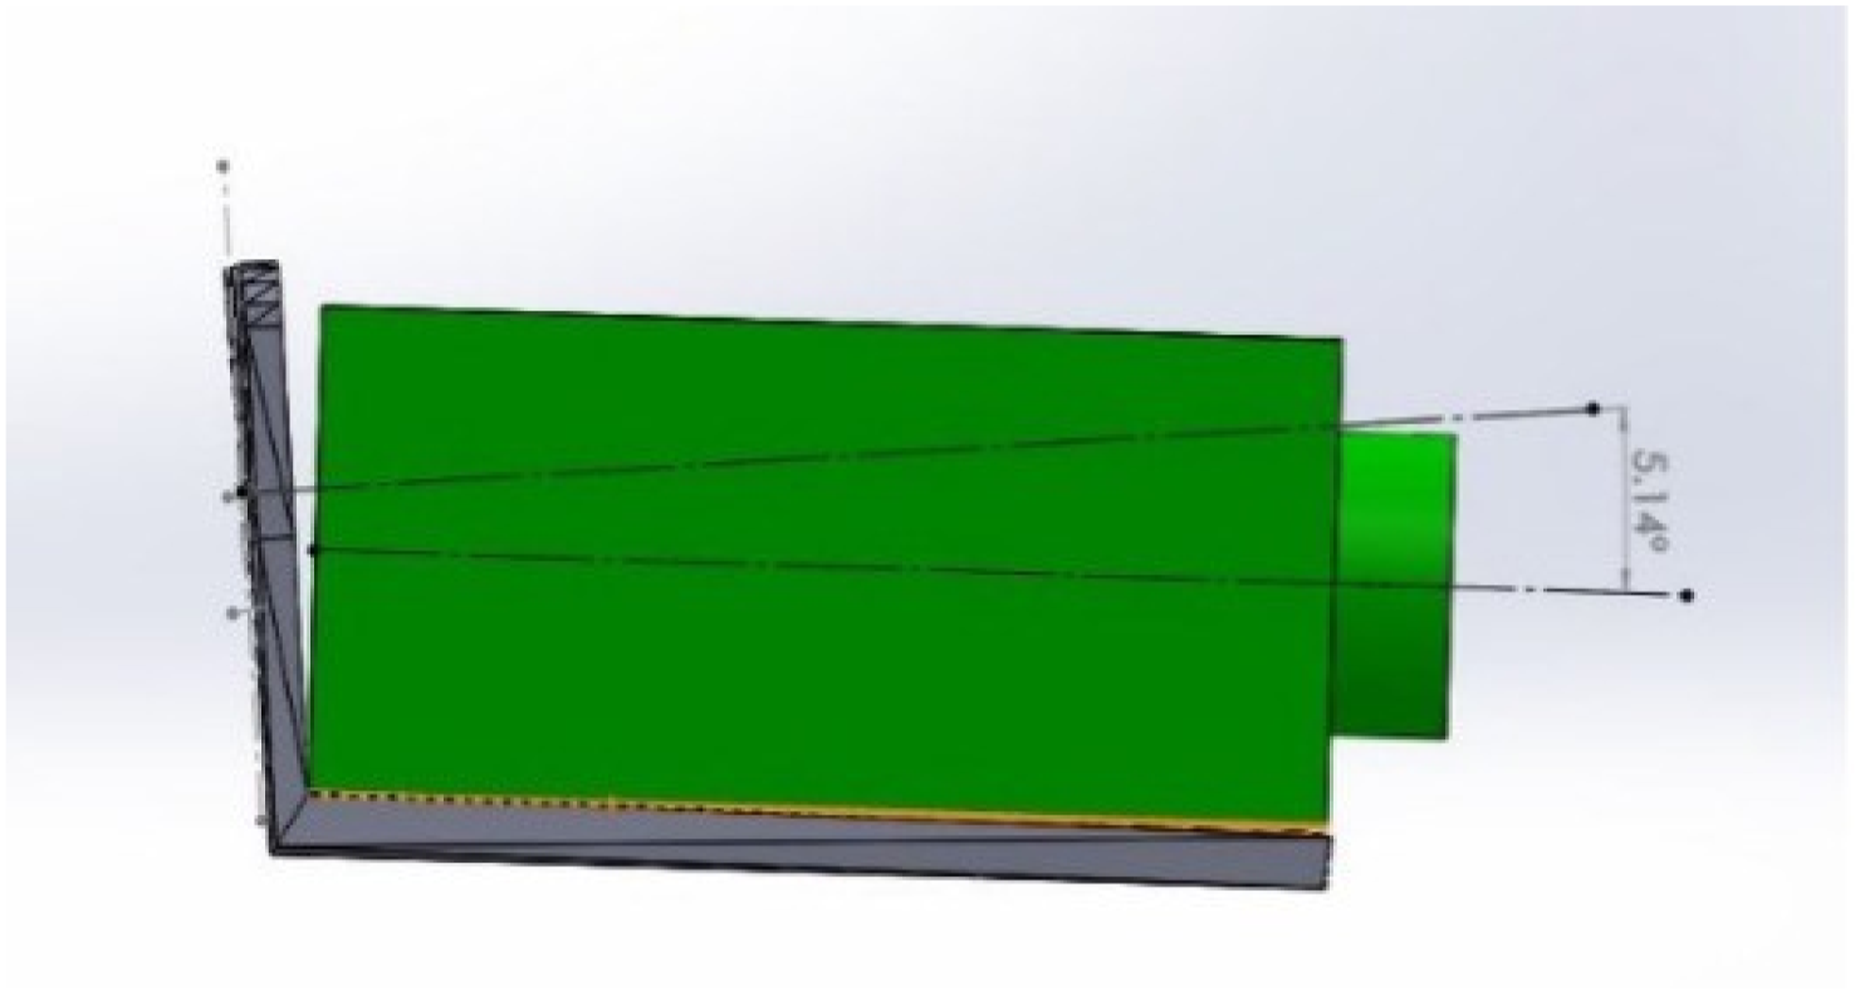
Measuring the angle between the rotation axis and axis of camera.
Although warpage occurs in three dimensions (X, Y, and Z), its most critical effects appear in the elevation (vertical) plane, as this directly influences the field of view of the camera and the precision of the line of sight. The warpage of the L-shaped holder alters the mounting plane, causing the optical axis of the camera to tilt, which manifests itself as a measurable angular deviation, known as deflection angle. This deviation provides a practical metric for assessing misalignment effects, simplifying the analysis while maintaining relevance to optical functionality. The deflection angle, such as 5.14° shown in Figure 3, was measured in the plane of interest, effectively capturing the alignment error introduced by warpage. Although a full 3D deformation analysis could provide additional insight, the 2-DOF approach used here is sufficient to quantify the practical effects on optical performance.
Mechanical characterization
Sample preparation
The process parameters and their levels for mechanical characterisation.
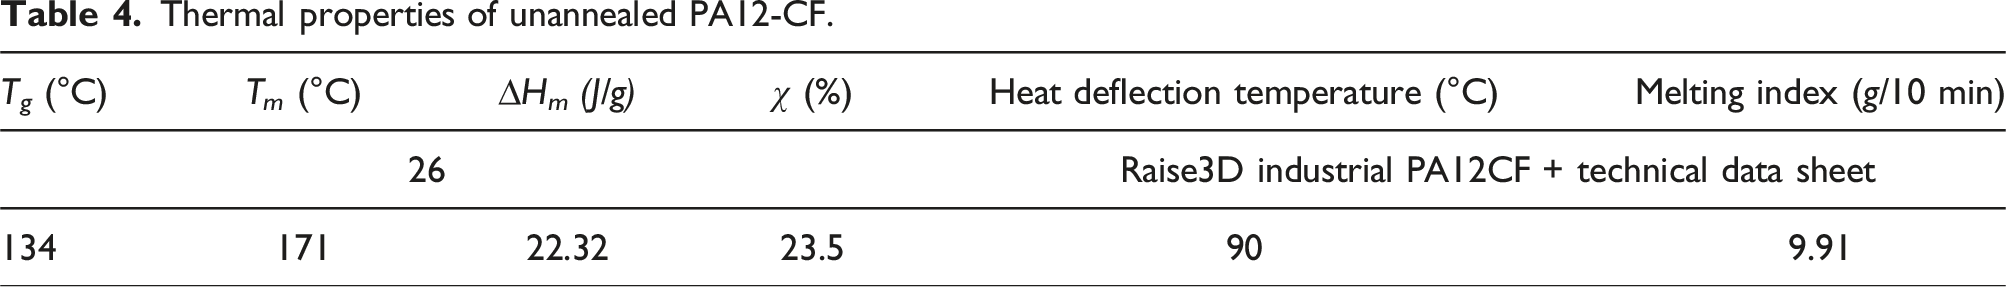
Thermal properties of unannealed PA12-CF.
Bending test
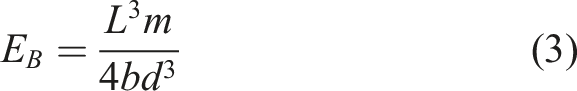
Bending tests were conducted according to the ASTM D790. Equations (2) and (3) were used to calculate the ultimate flexural stress (σ
f
) and stiffness (E
B
) as follows: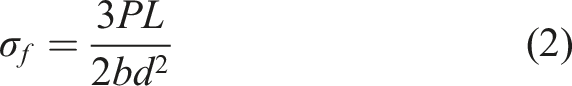
Tensile test
Tensile test samples were made according to ASTM D638 type I and tests were performed under displacement control at a rate of 0.5 mm/min using a universal tensile test machine (Tenson). The stress-strain data was then used to calculate the ultimate tensile strength and modulus of elasticity. The fabricated samples are presented in Figure 4. Fabricated samples used in the study. The samples include (a) the camera holder, (b) tensile test coupons for evaluating mechanical properties, and (c) bending test coupons for flexural strength analysis.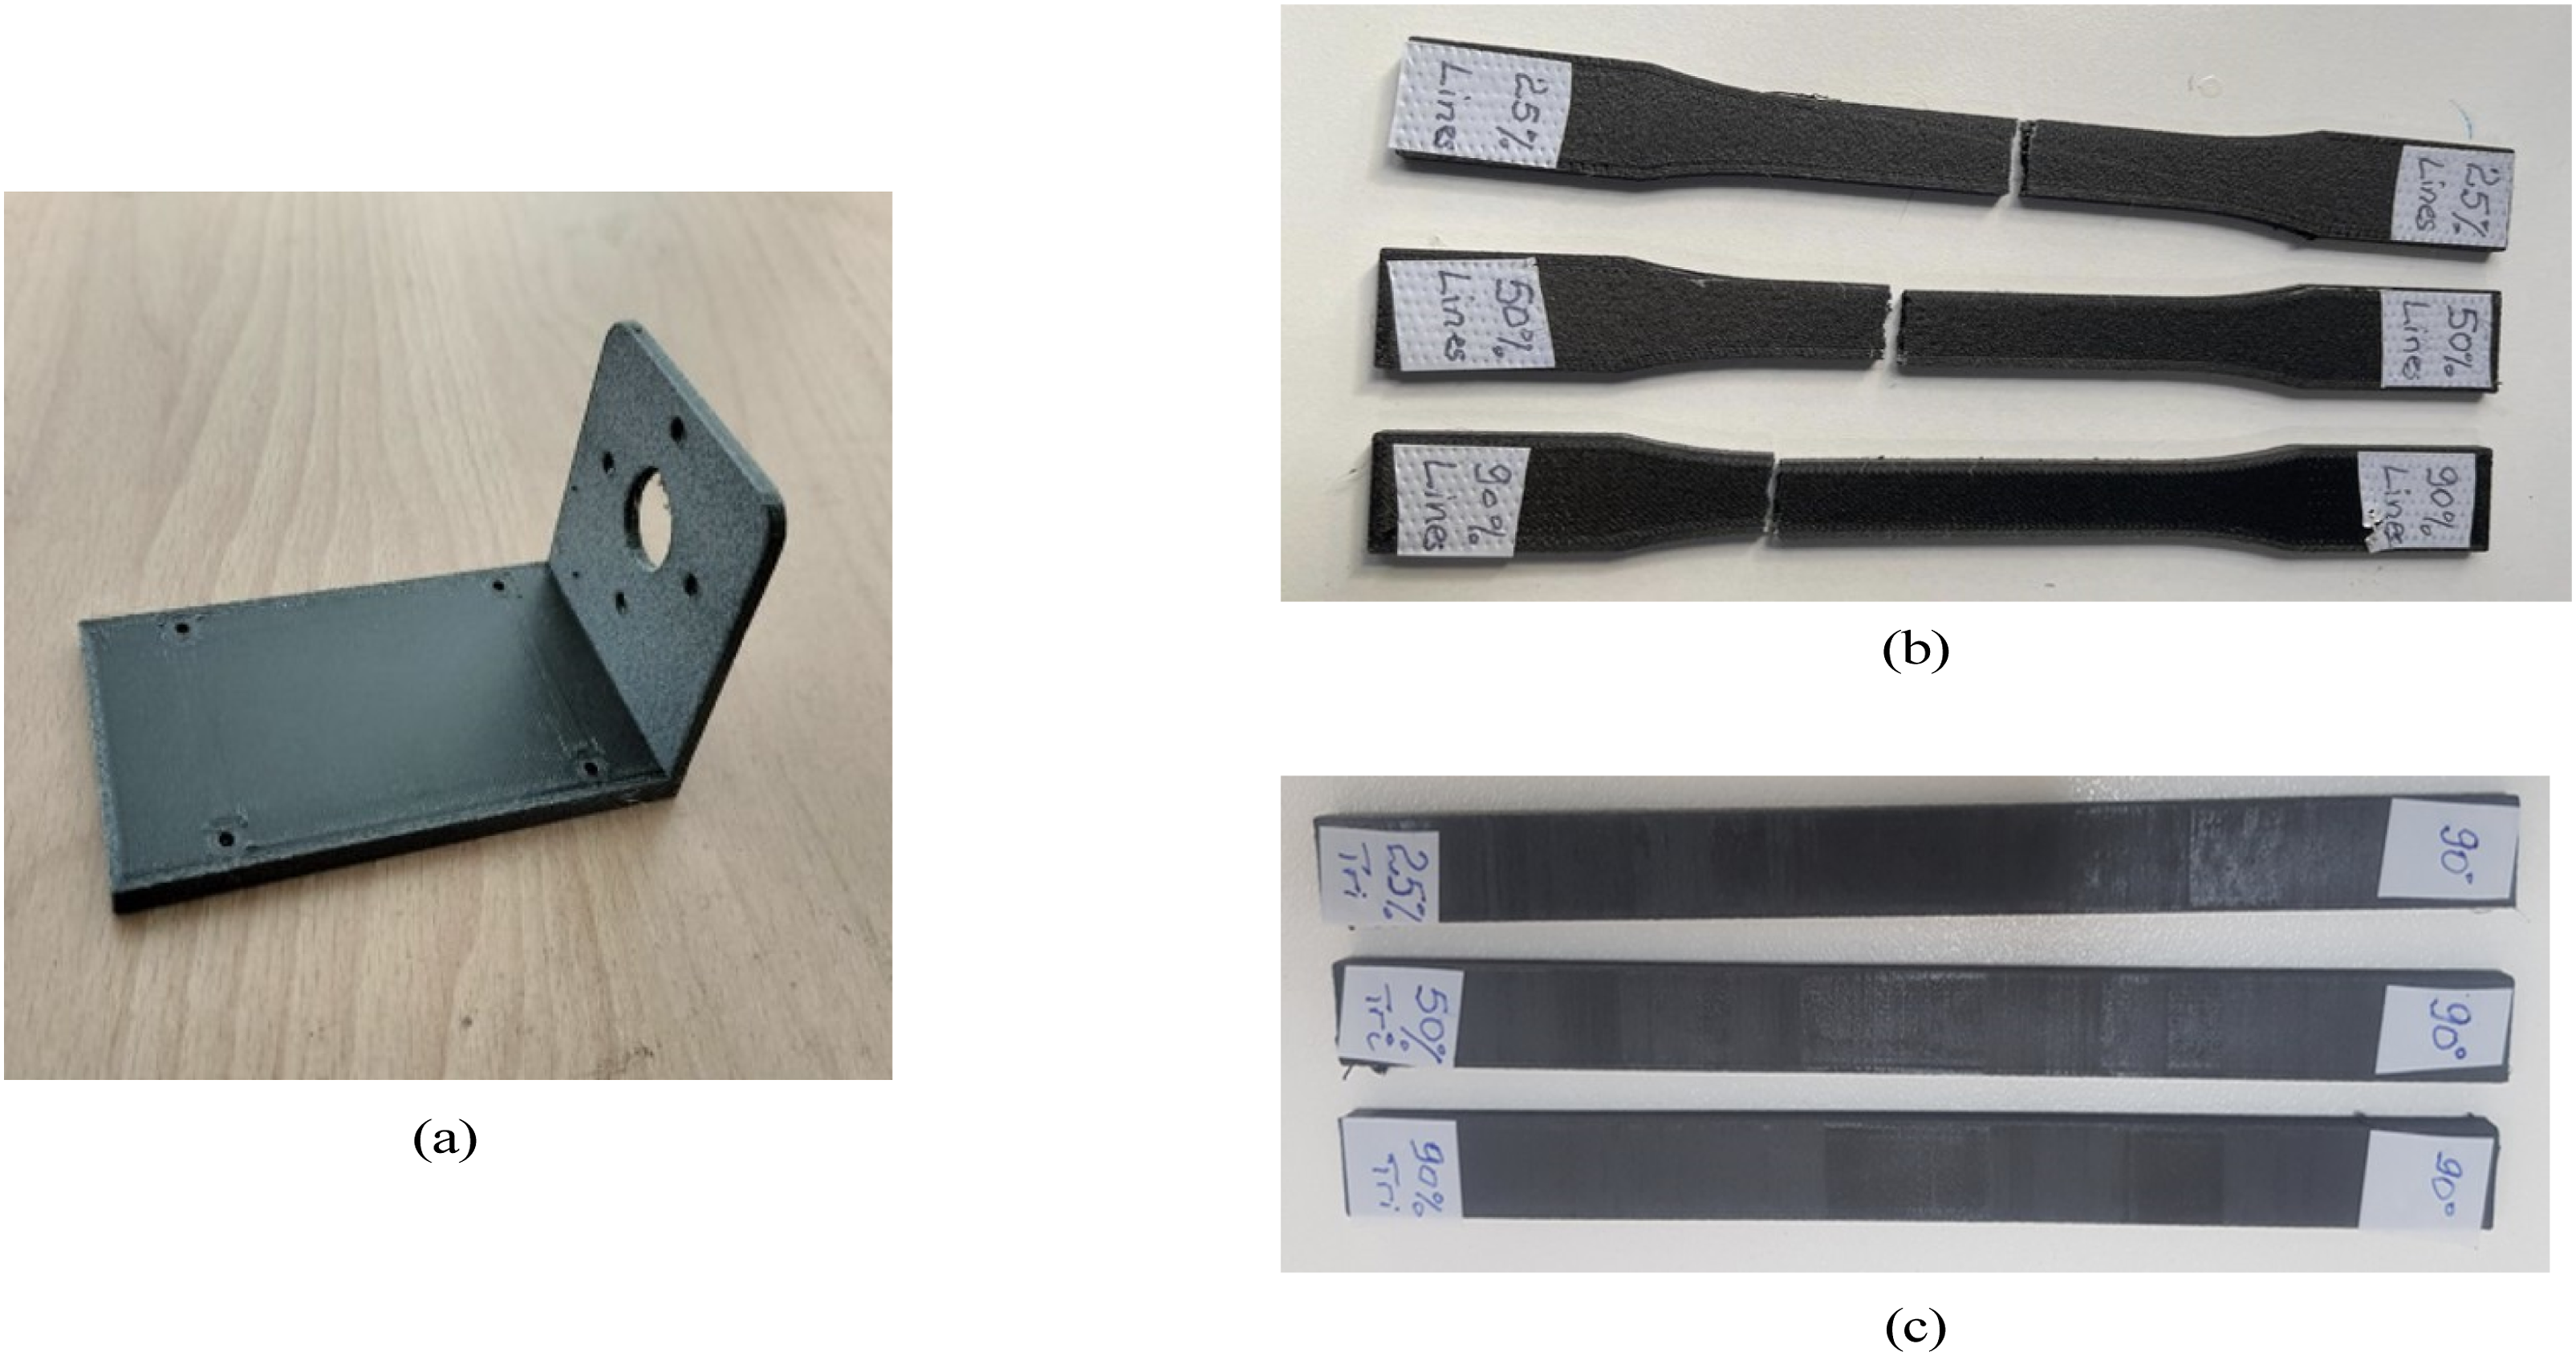
Results and discussions
Warpage analysis
Figure 5 presents the simulation results for warpage, comparing different infill densities of the samples printed with a concentrated infill pattern at a 45° raster angle and the flat printing direction. Results of warpage with concentric infill pattern.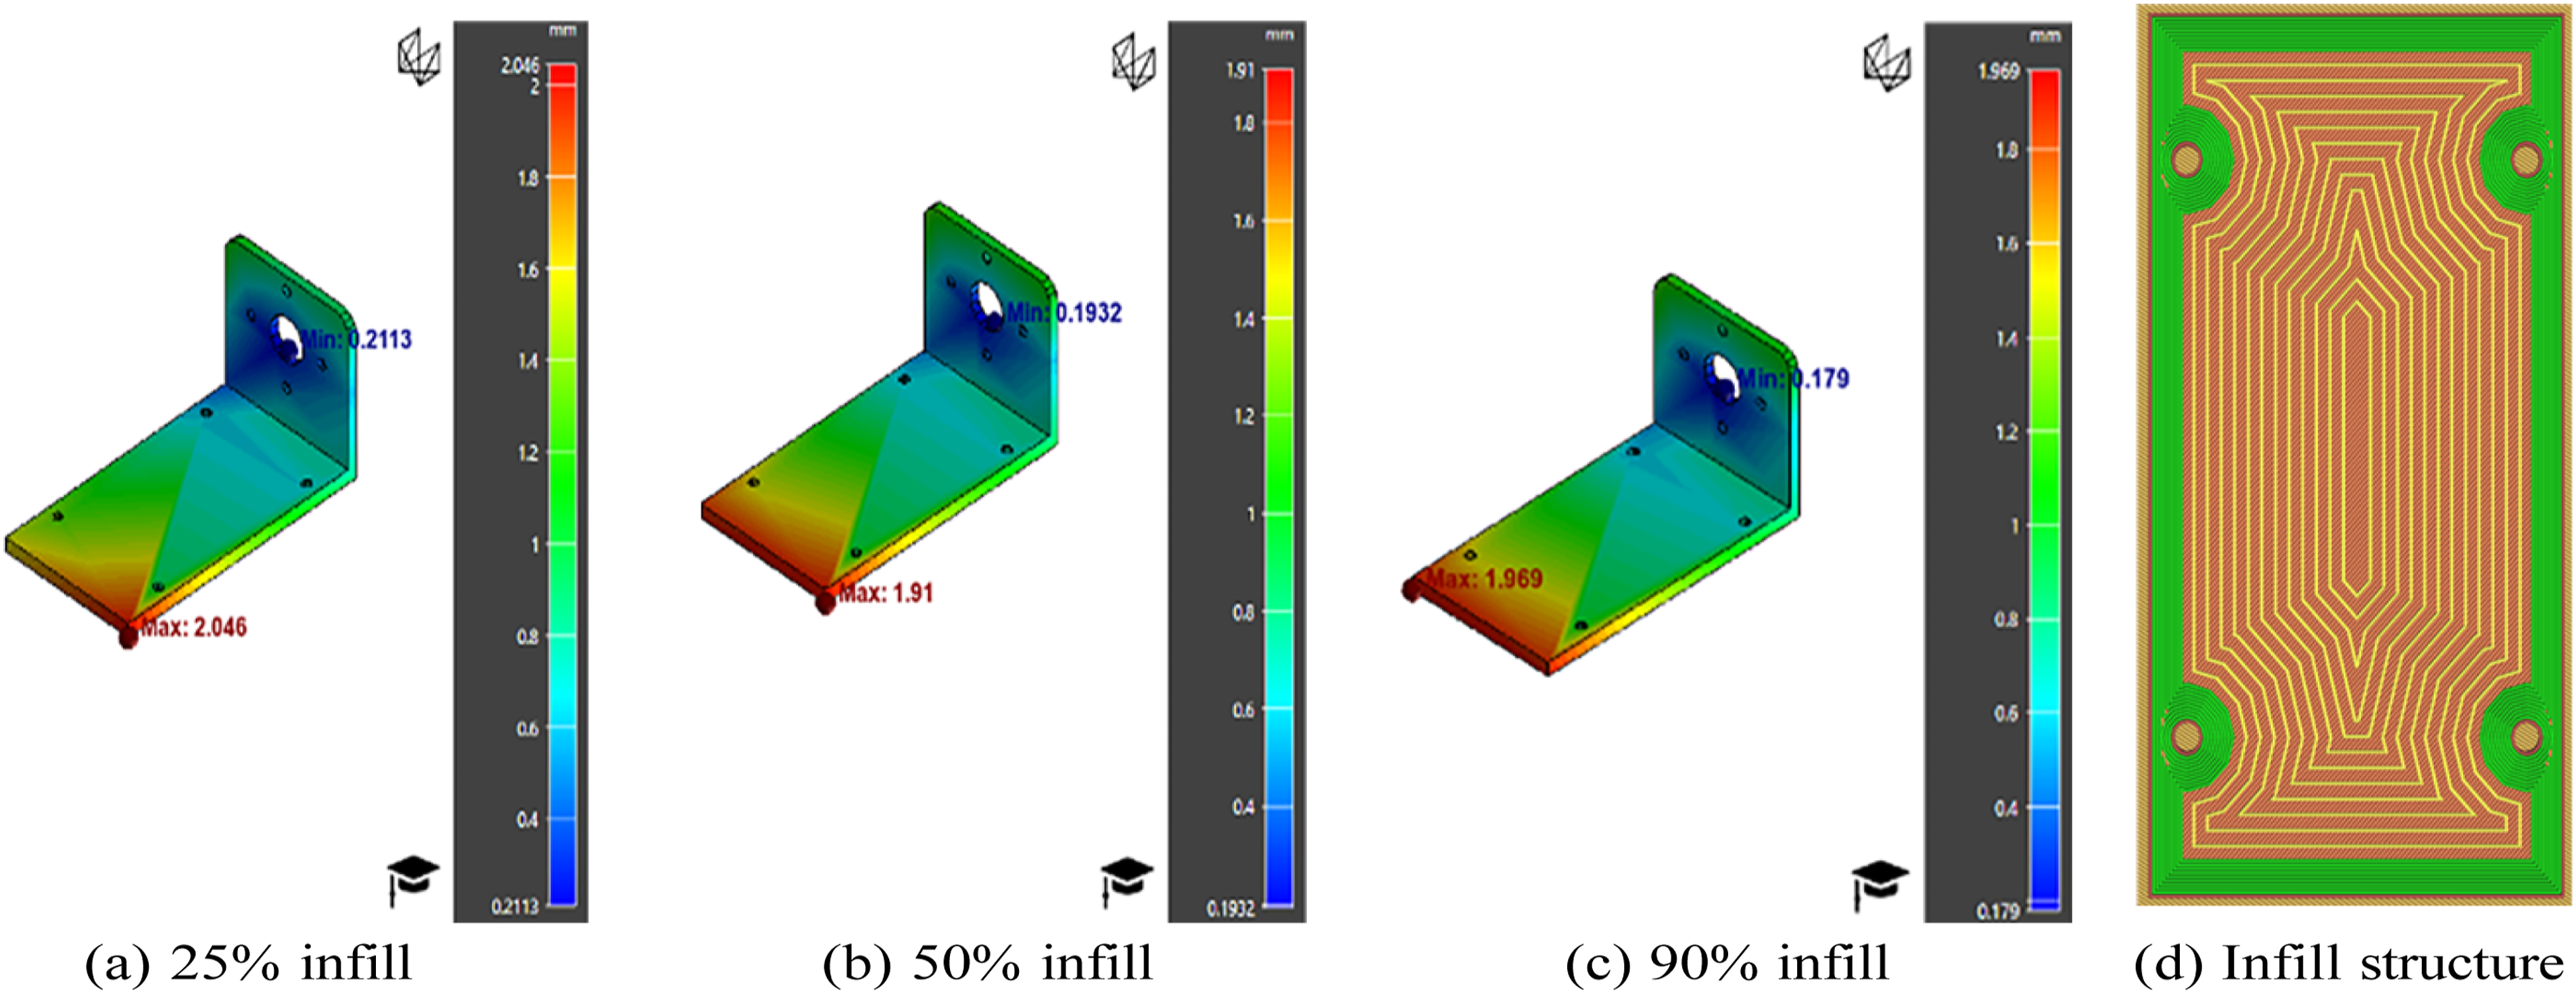
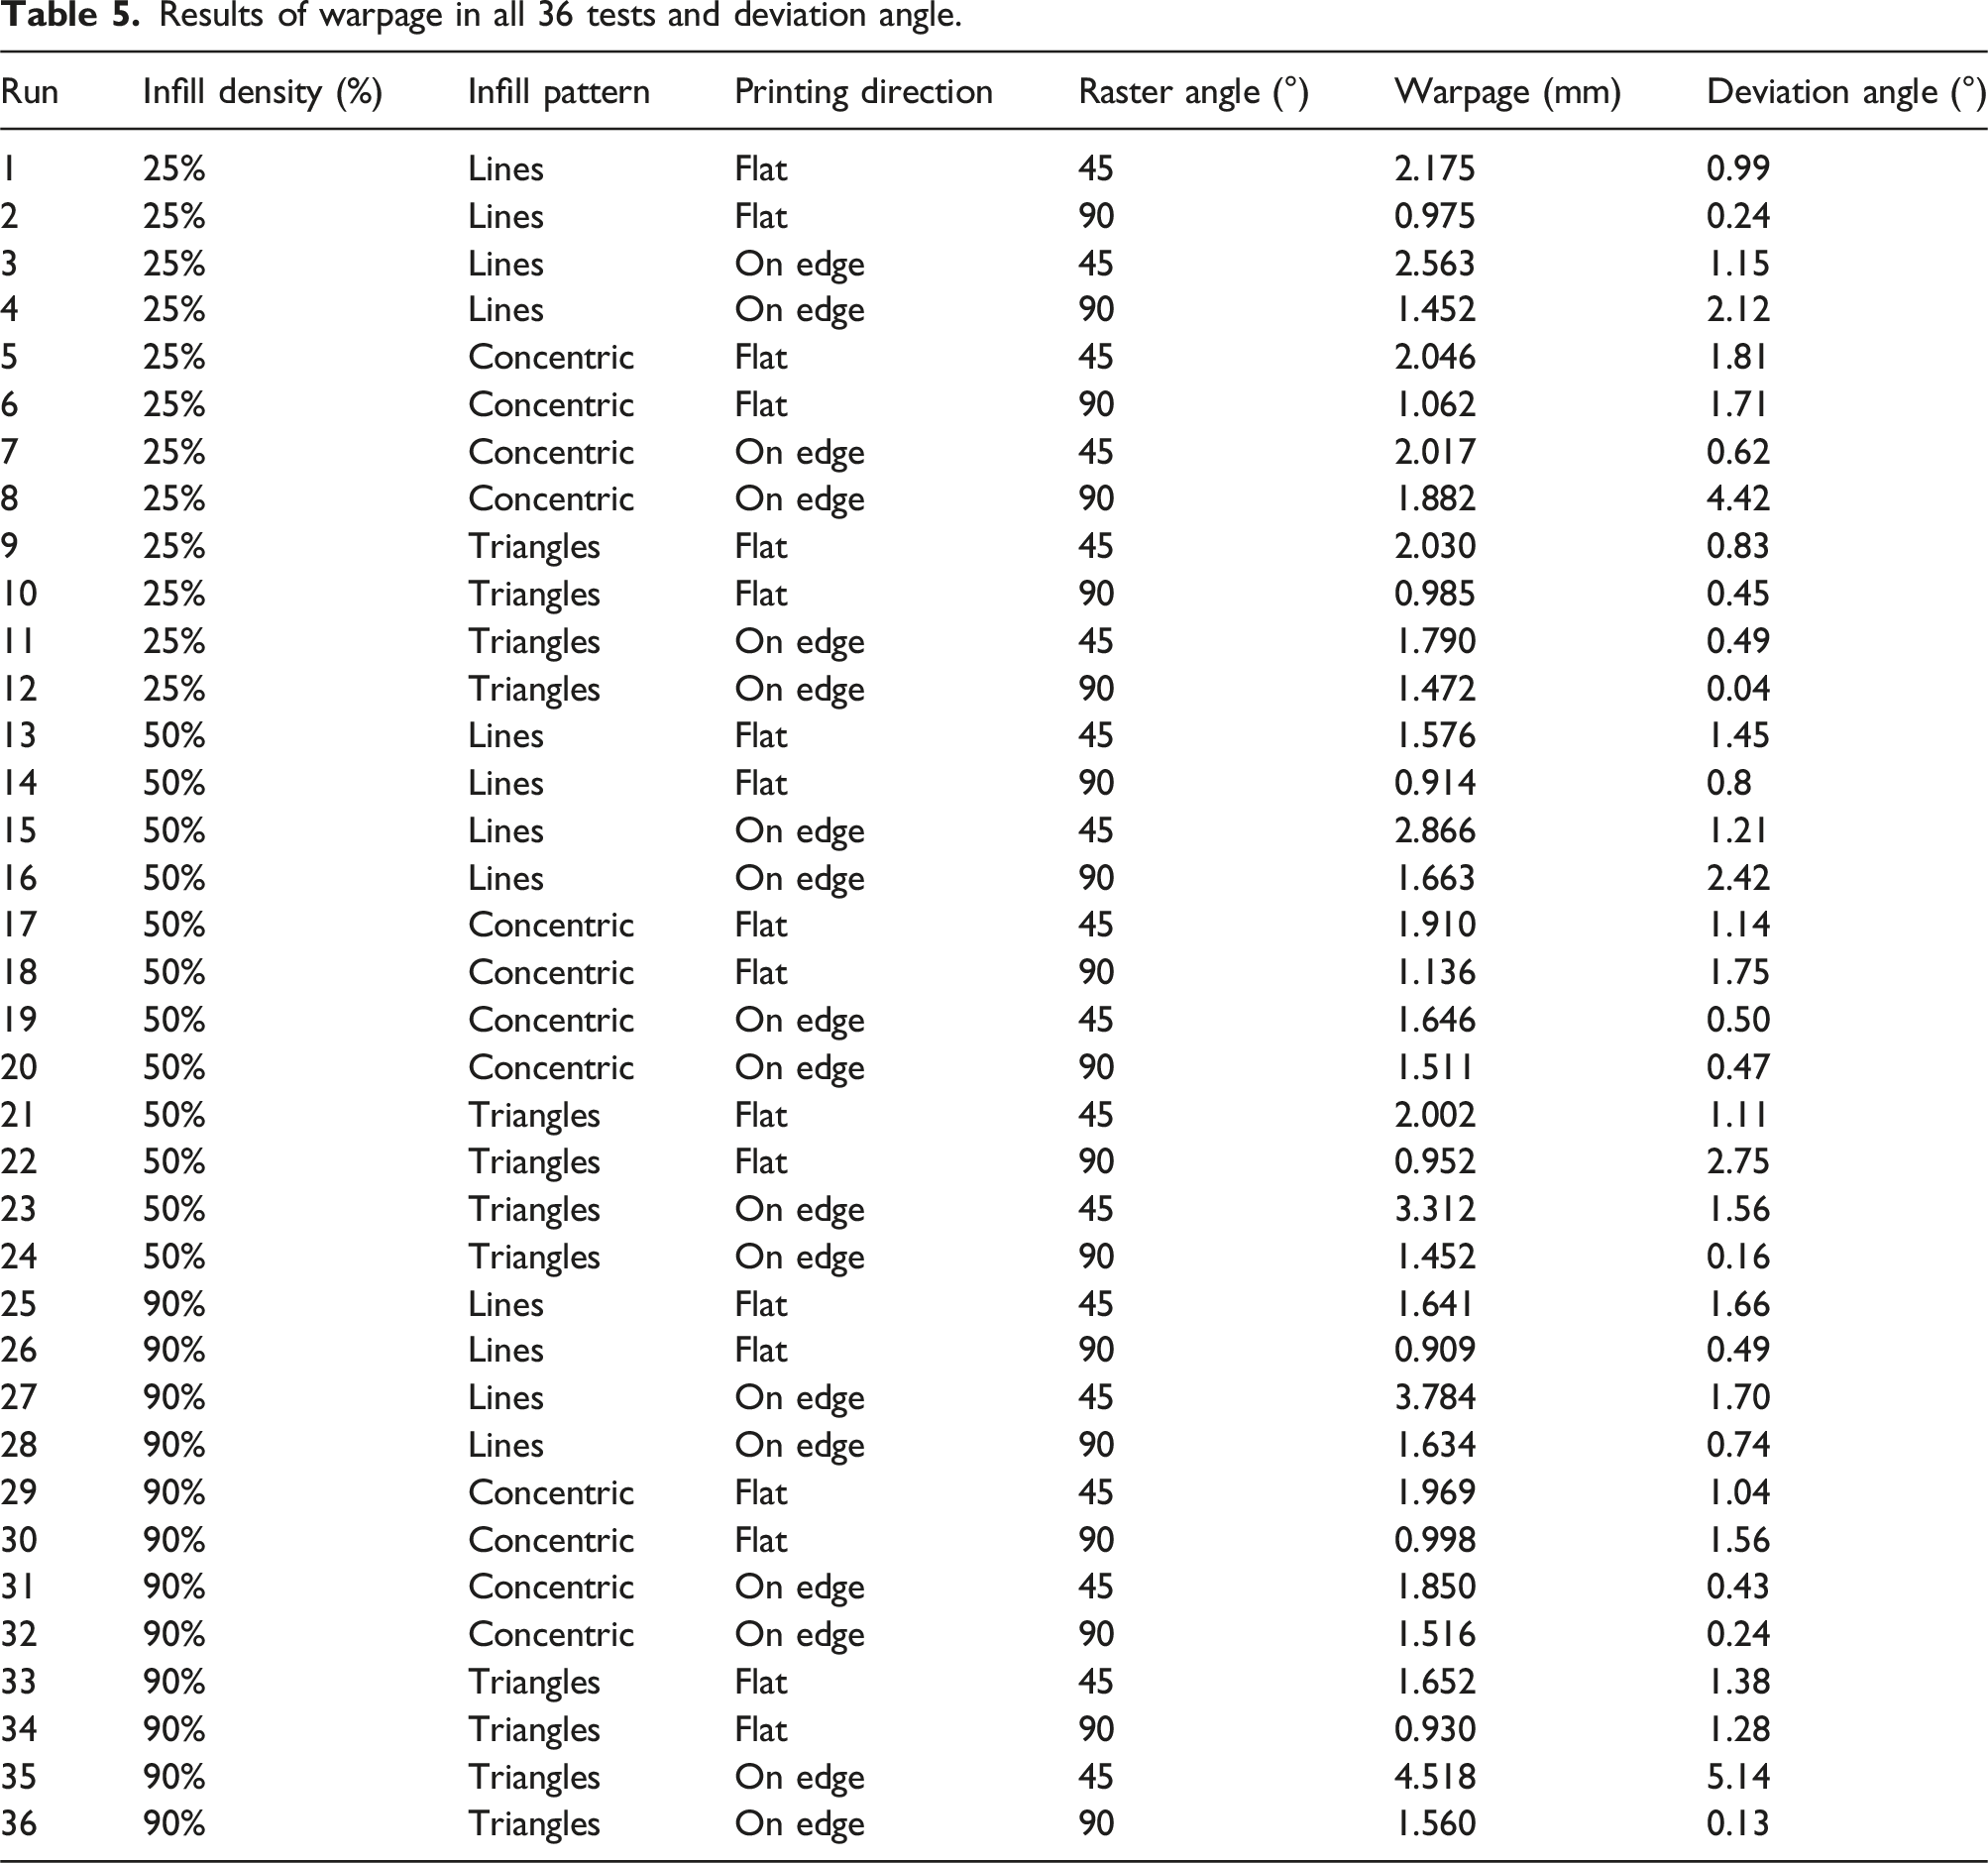
Results of warpage in all 36 tests and deviation angle.
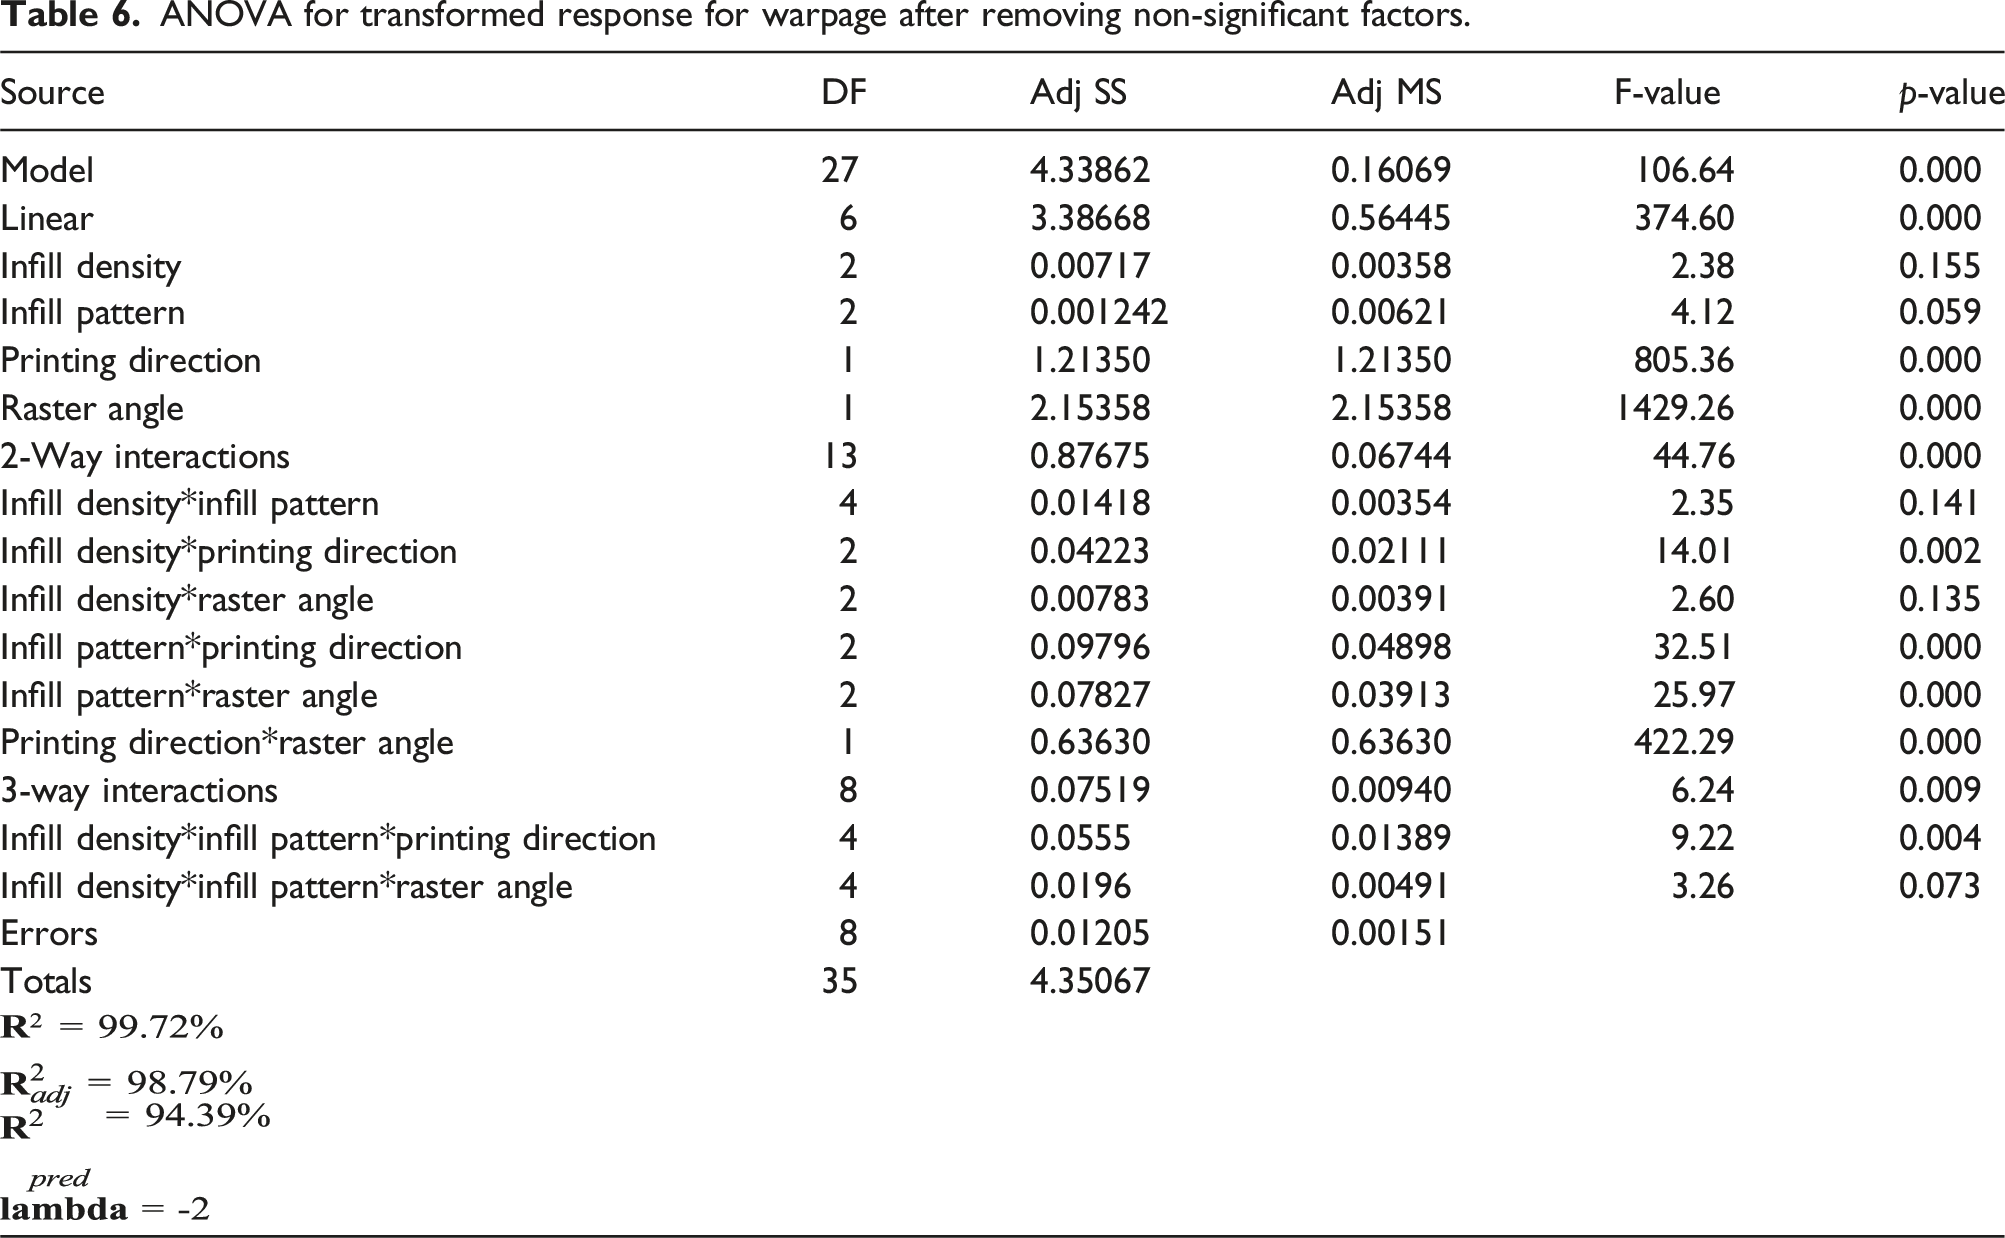
ANOVA for transformed response for warpage after removing non-significant factors.
The Lack-of-fit issue was resolved by using the transformation of the response. The Box-Cox transformation
27
is the most commonly used technique at which an appropriate exponent (Lambda) is used to transform response data. The Box-Cox transformation is defined as: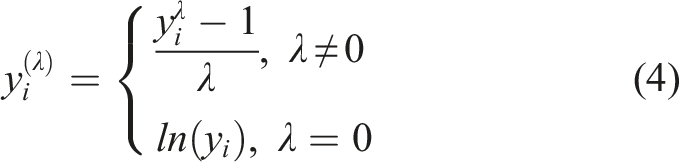
Table 6 presents the analysis of variance in transformed warpage considering the main factors and their interactions. Note that the 3-way interaction of infill density, Printing direction, and Raster angle was removed from the analysis due to the large calculated p-value (p-value = .869).
The plot of the main effect (Figure 6) was used to visualize the effect of the main parameters on the warpage. The interaction plots (Figure 7) show the interaction of the process parameters on the warpage. The main effects plots for warpage with respect to (a) infill density (%), (b) infill pattern, (c) printing orientation, (d) raster angle. Results of interaction plots for warpage: (a) infill density, infill pattern (b) infill density, printing orientation (c) infill density, raster angle (d) infill pattern, printing orientation (e) infill pattern, raster angle (f) printing orientation, raster.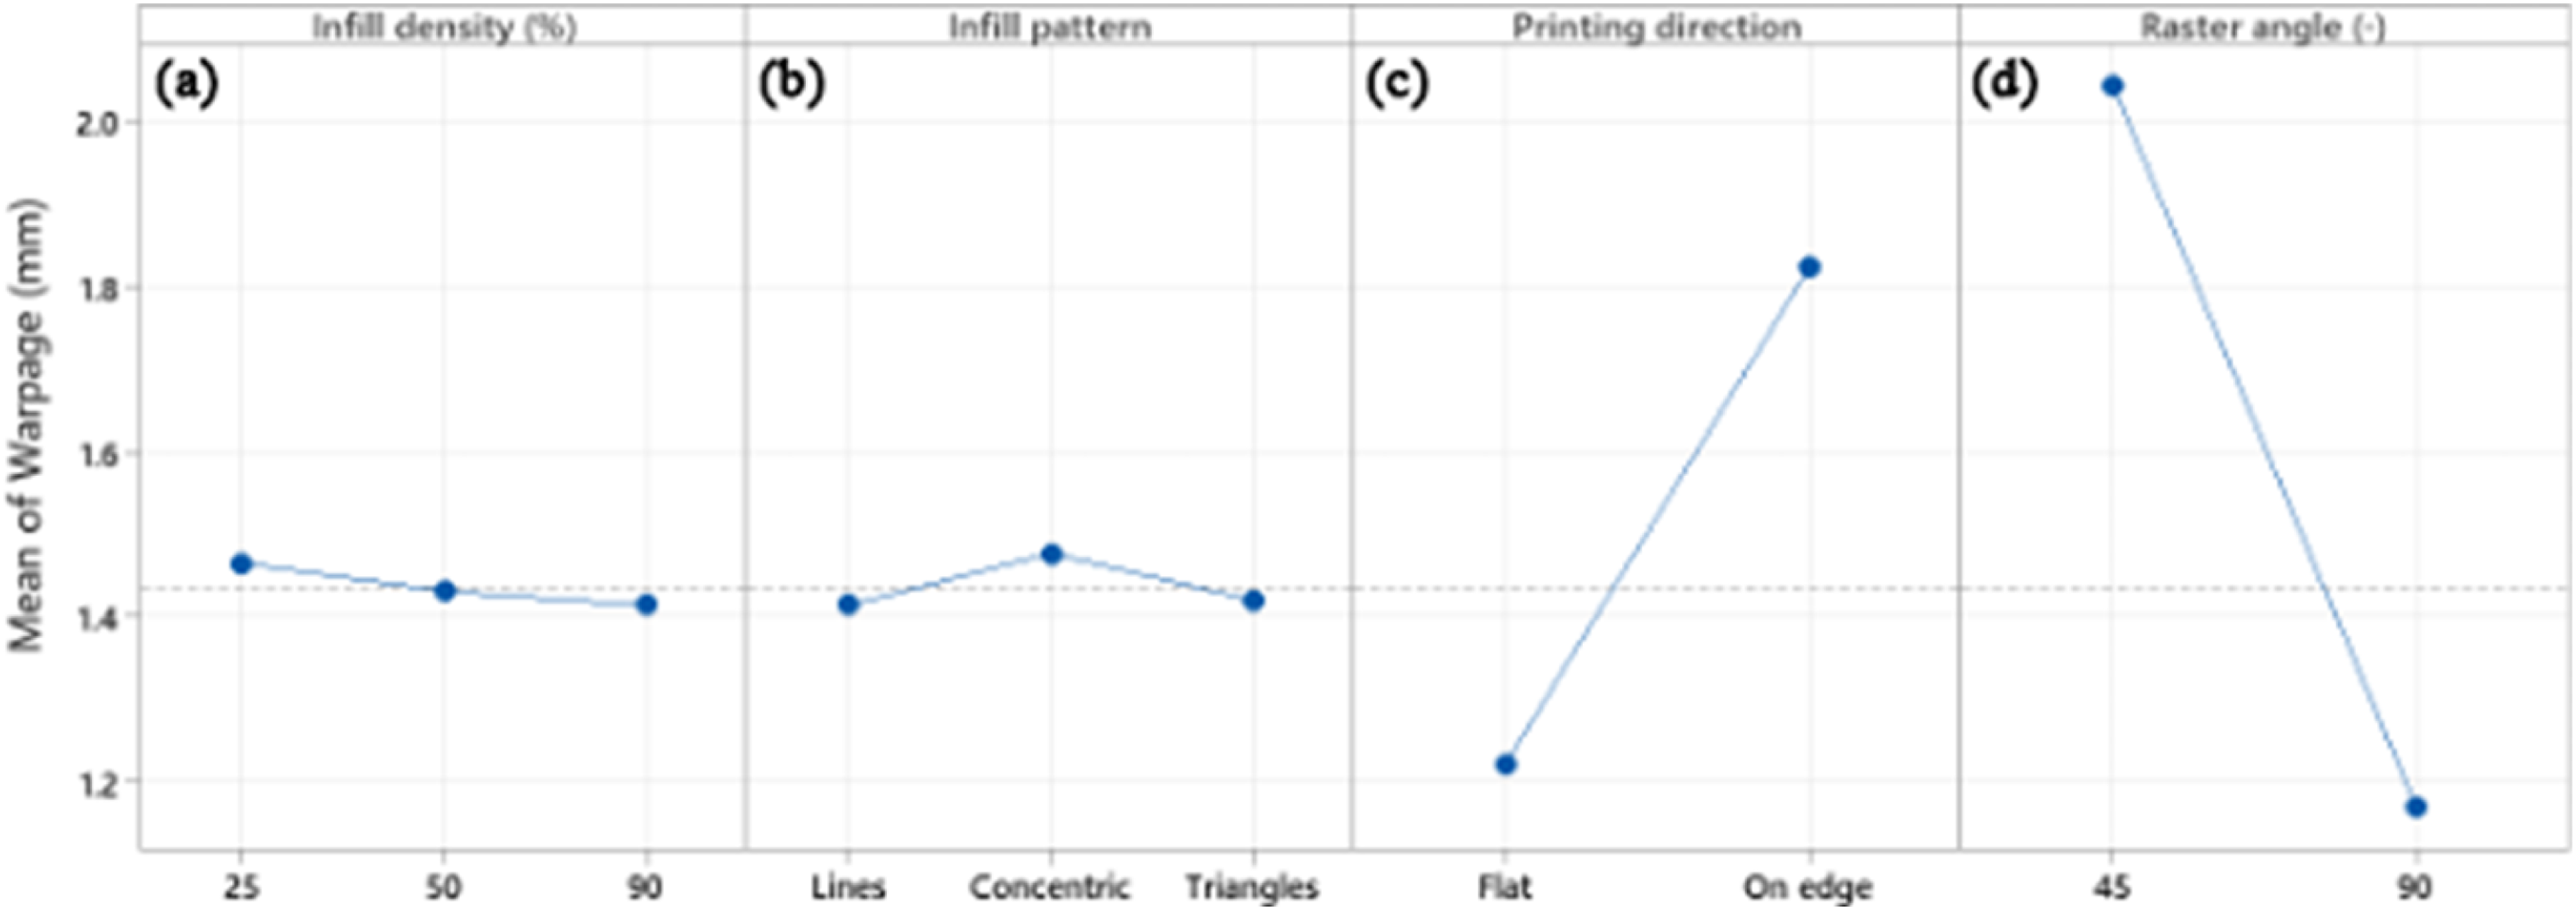
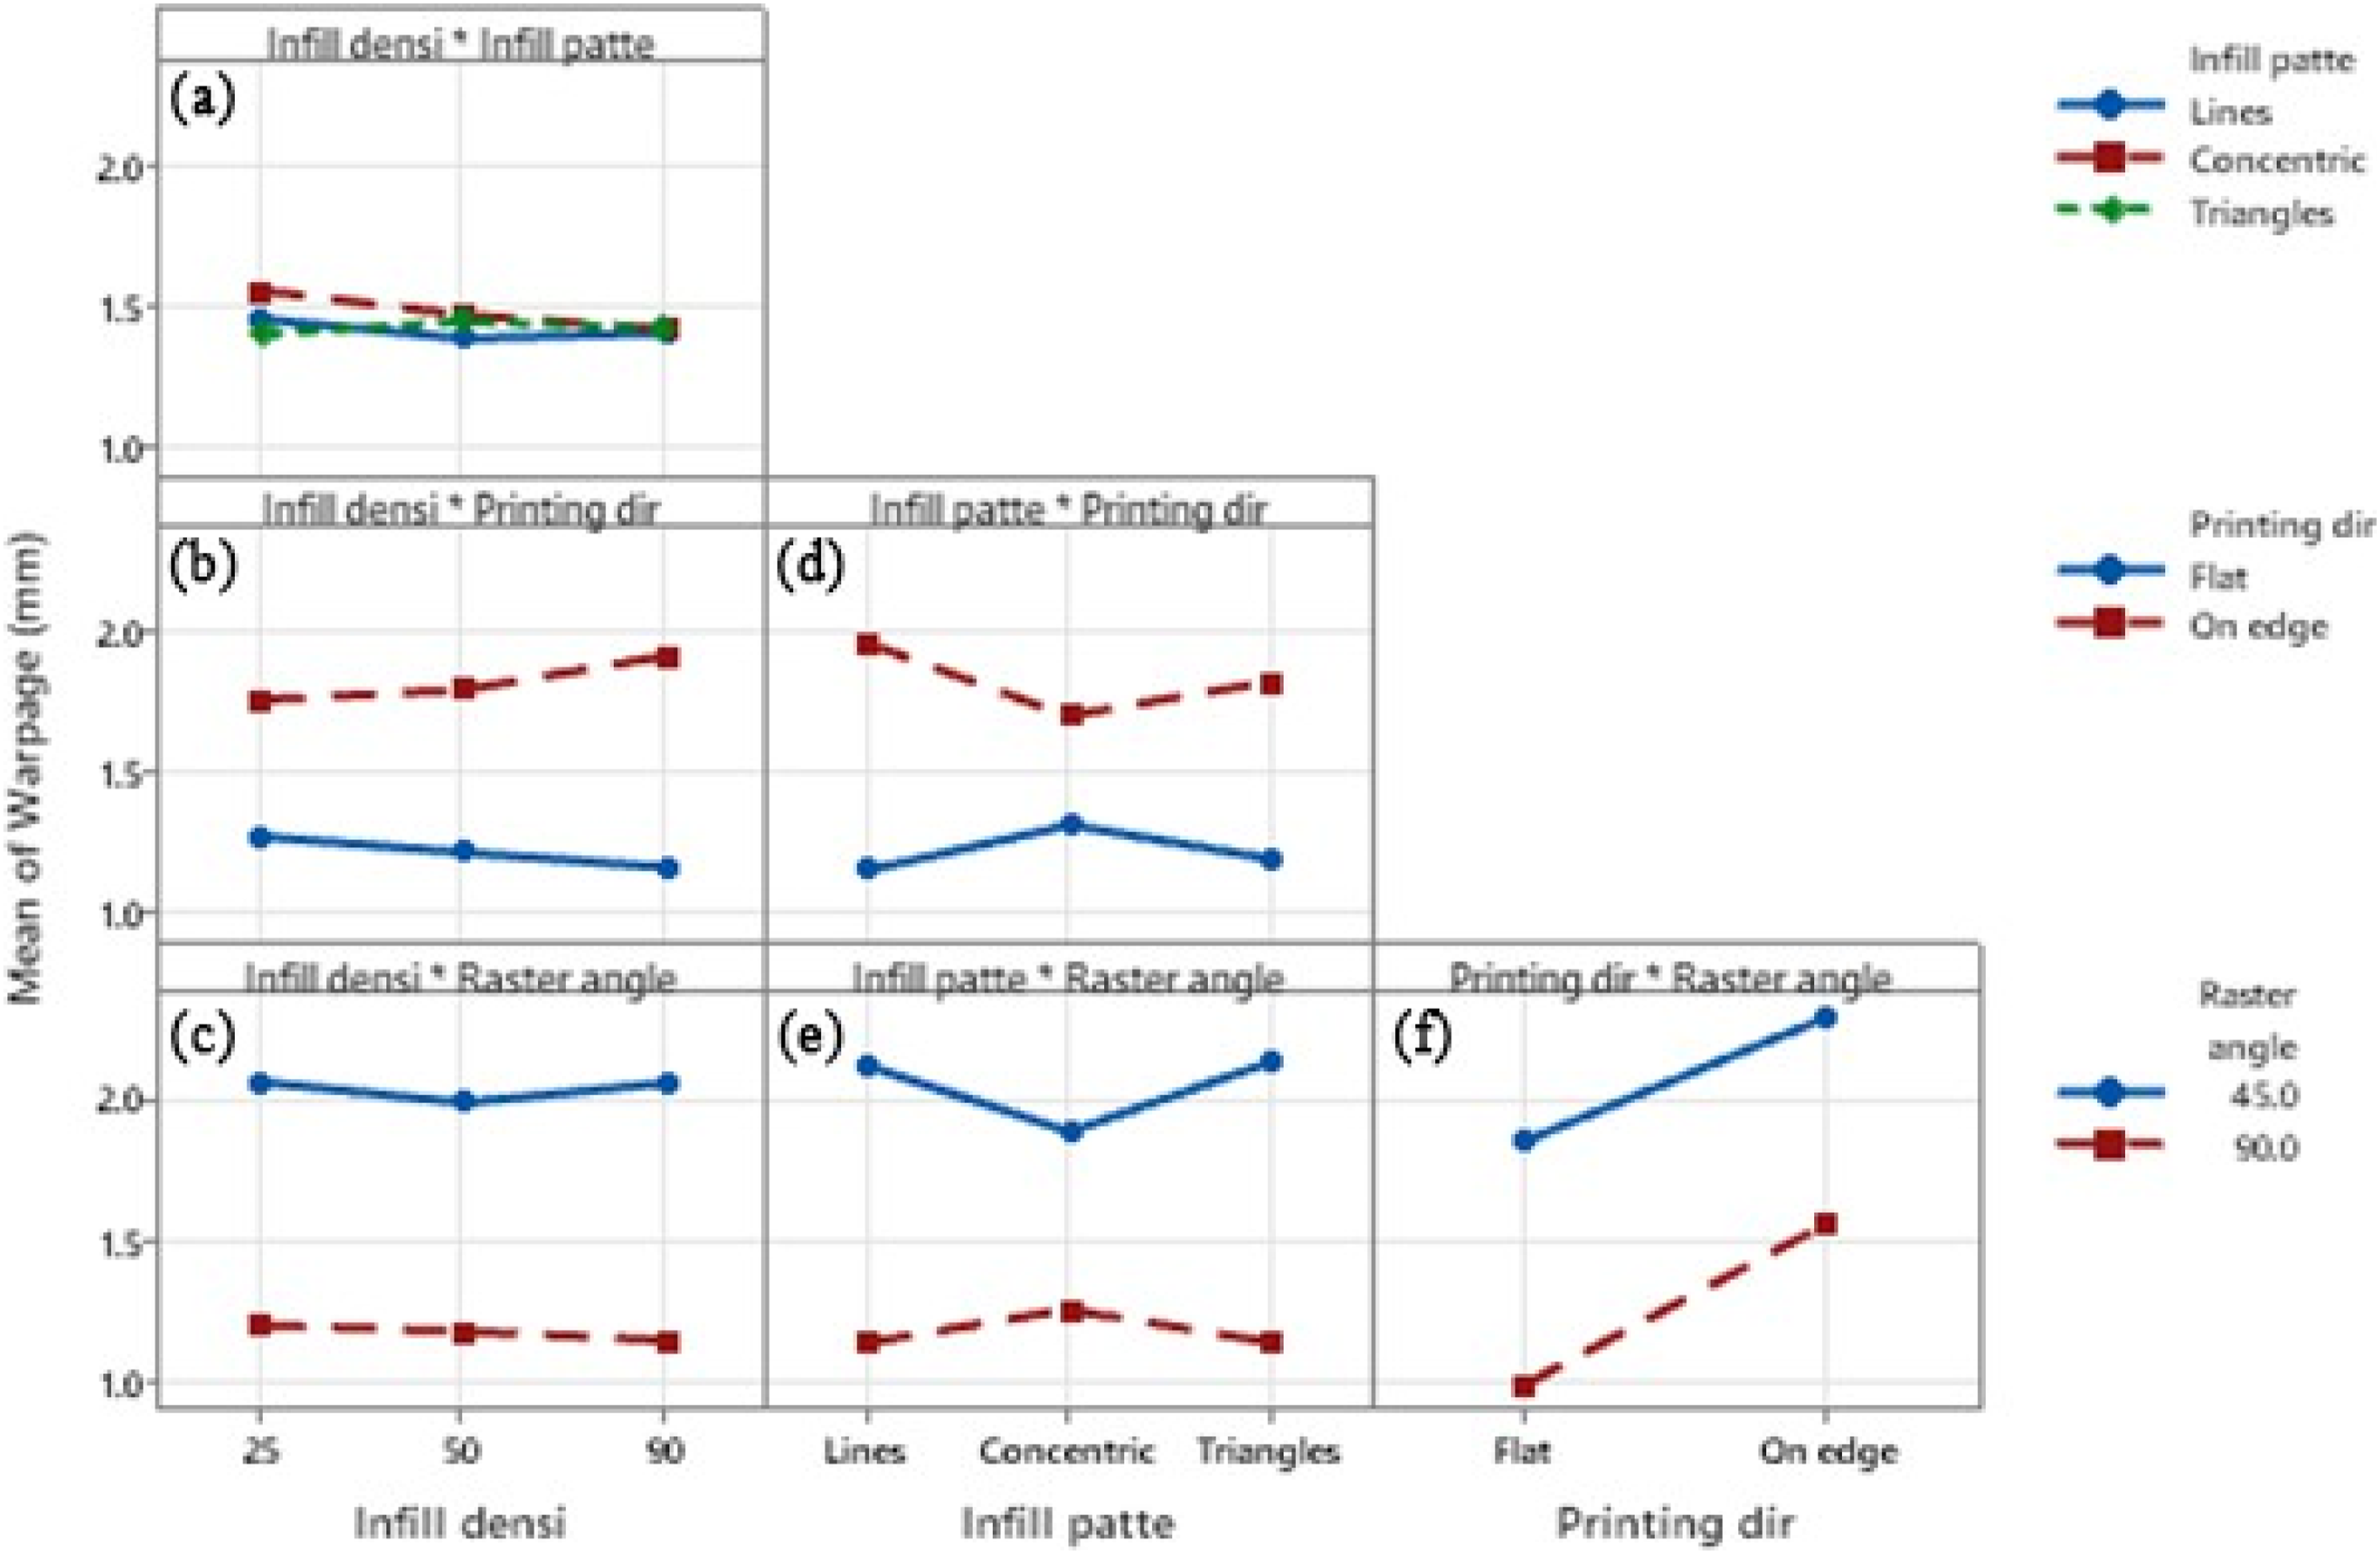
As illustrated in Figure 7(a), various infill patterns show little variation in warpage across different infill densities. The interaction between infill density and printing orientation, presented in Figure 7(b), indicates that the “on edge” printing direction leads to significantly higher warpage compared to the “flat” orientation, particularly at higher infill densities. Figure 7(c) shows that a 90° raster angle consistently reduces warpage across all infill densities, in contrast to the 45° raster angle, which results in increased deformation. Figure 7(d) explores the relationship between infill pattern and printing orientation, revealing that the “flat” printing orientation consistently yields lower warpage across all infill patterns. The interaction between the infill pattern and the raster angle, illustrated in Figure 7(e), shows that a 90° raster angle effectively reduces warpage, particularly when used with the concentric infill pattern. Lastly, Figure 7(f) highlights the impact of the printing orientation and the raster angle, demonstrating that the combination of a 90° raster angle with the “on edge” orientation significantly minimizes warpage, while a 45° raster angle in the same orientation results in a substantial increase in deformation.
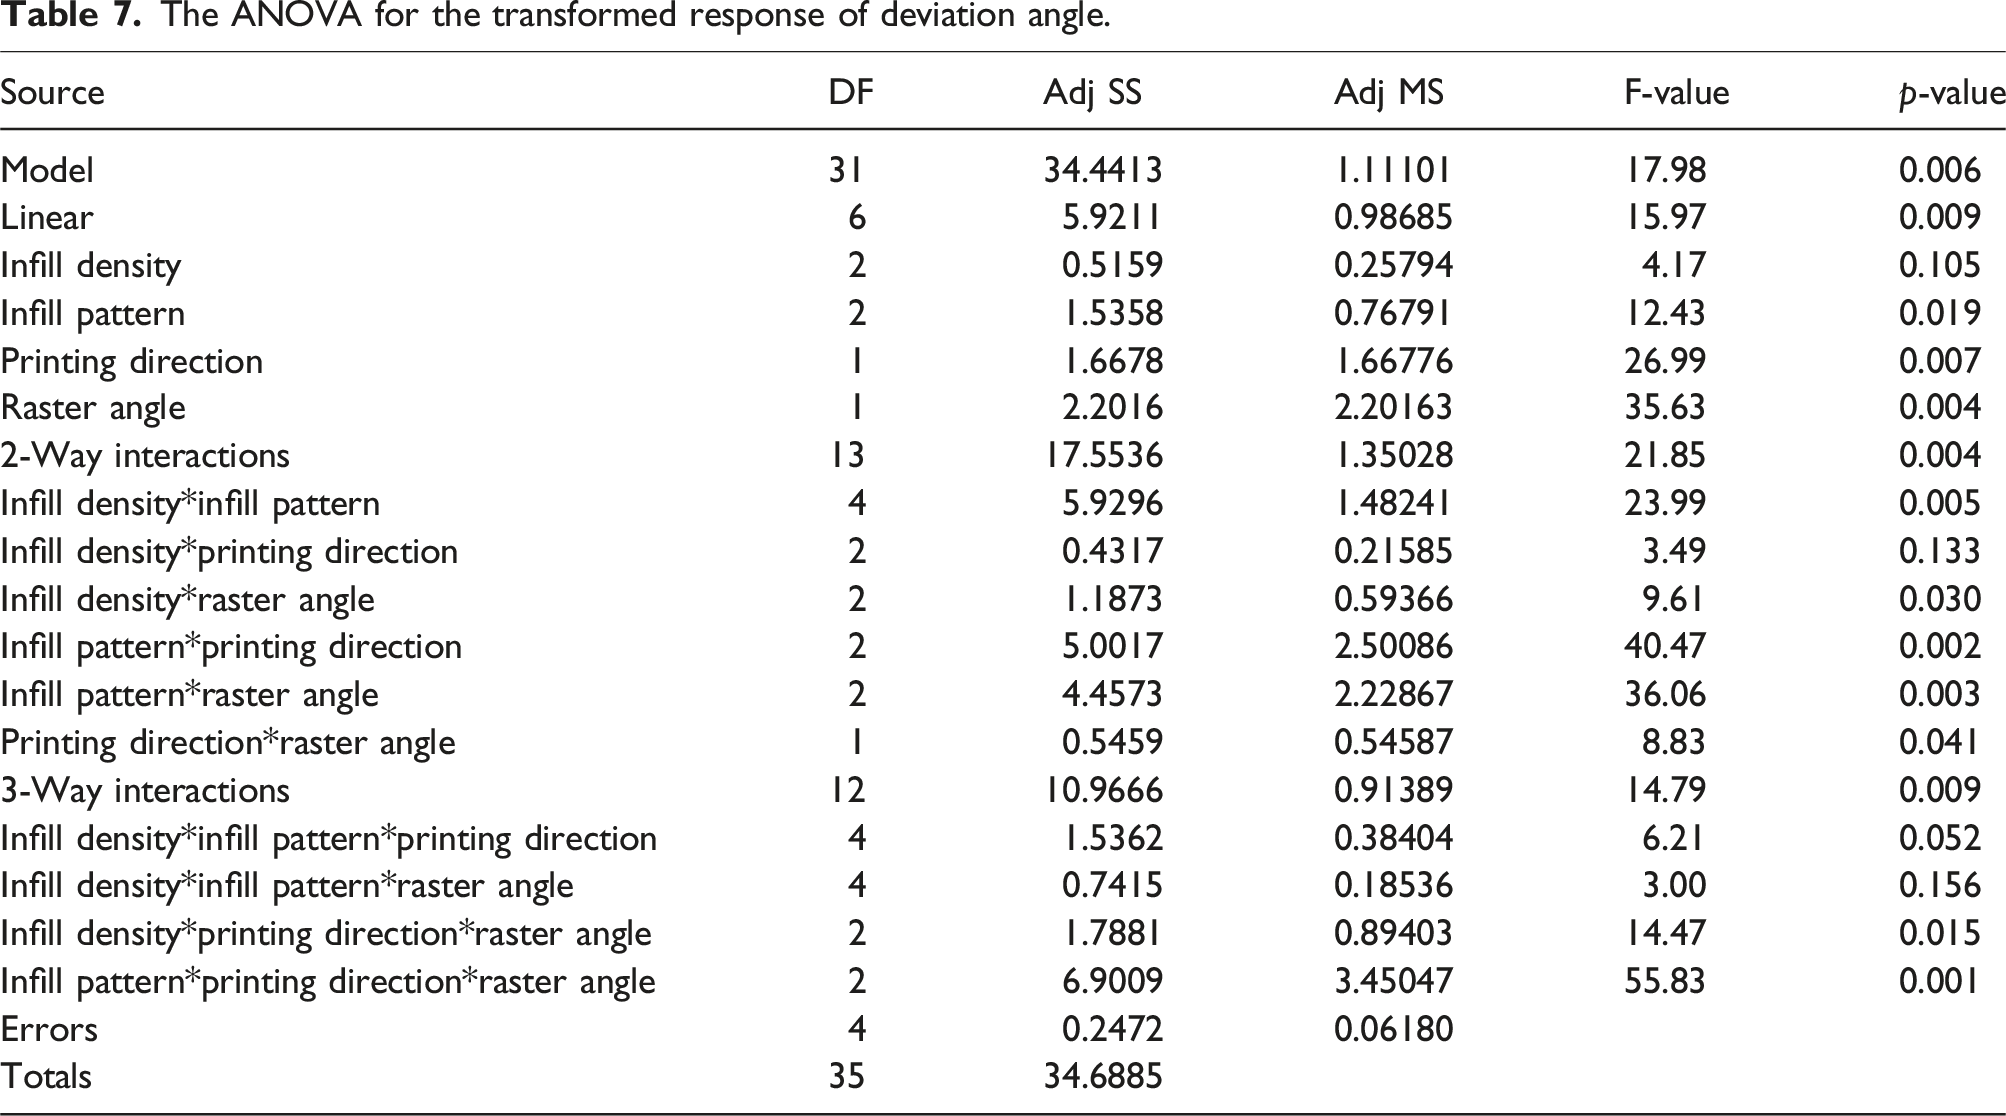
The ANOVA for the transformed response of deviation angle.
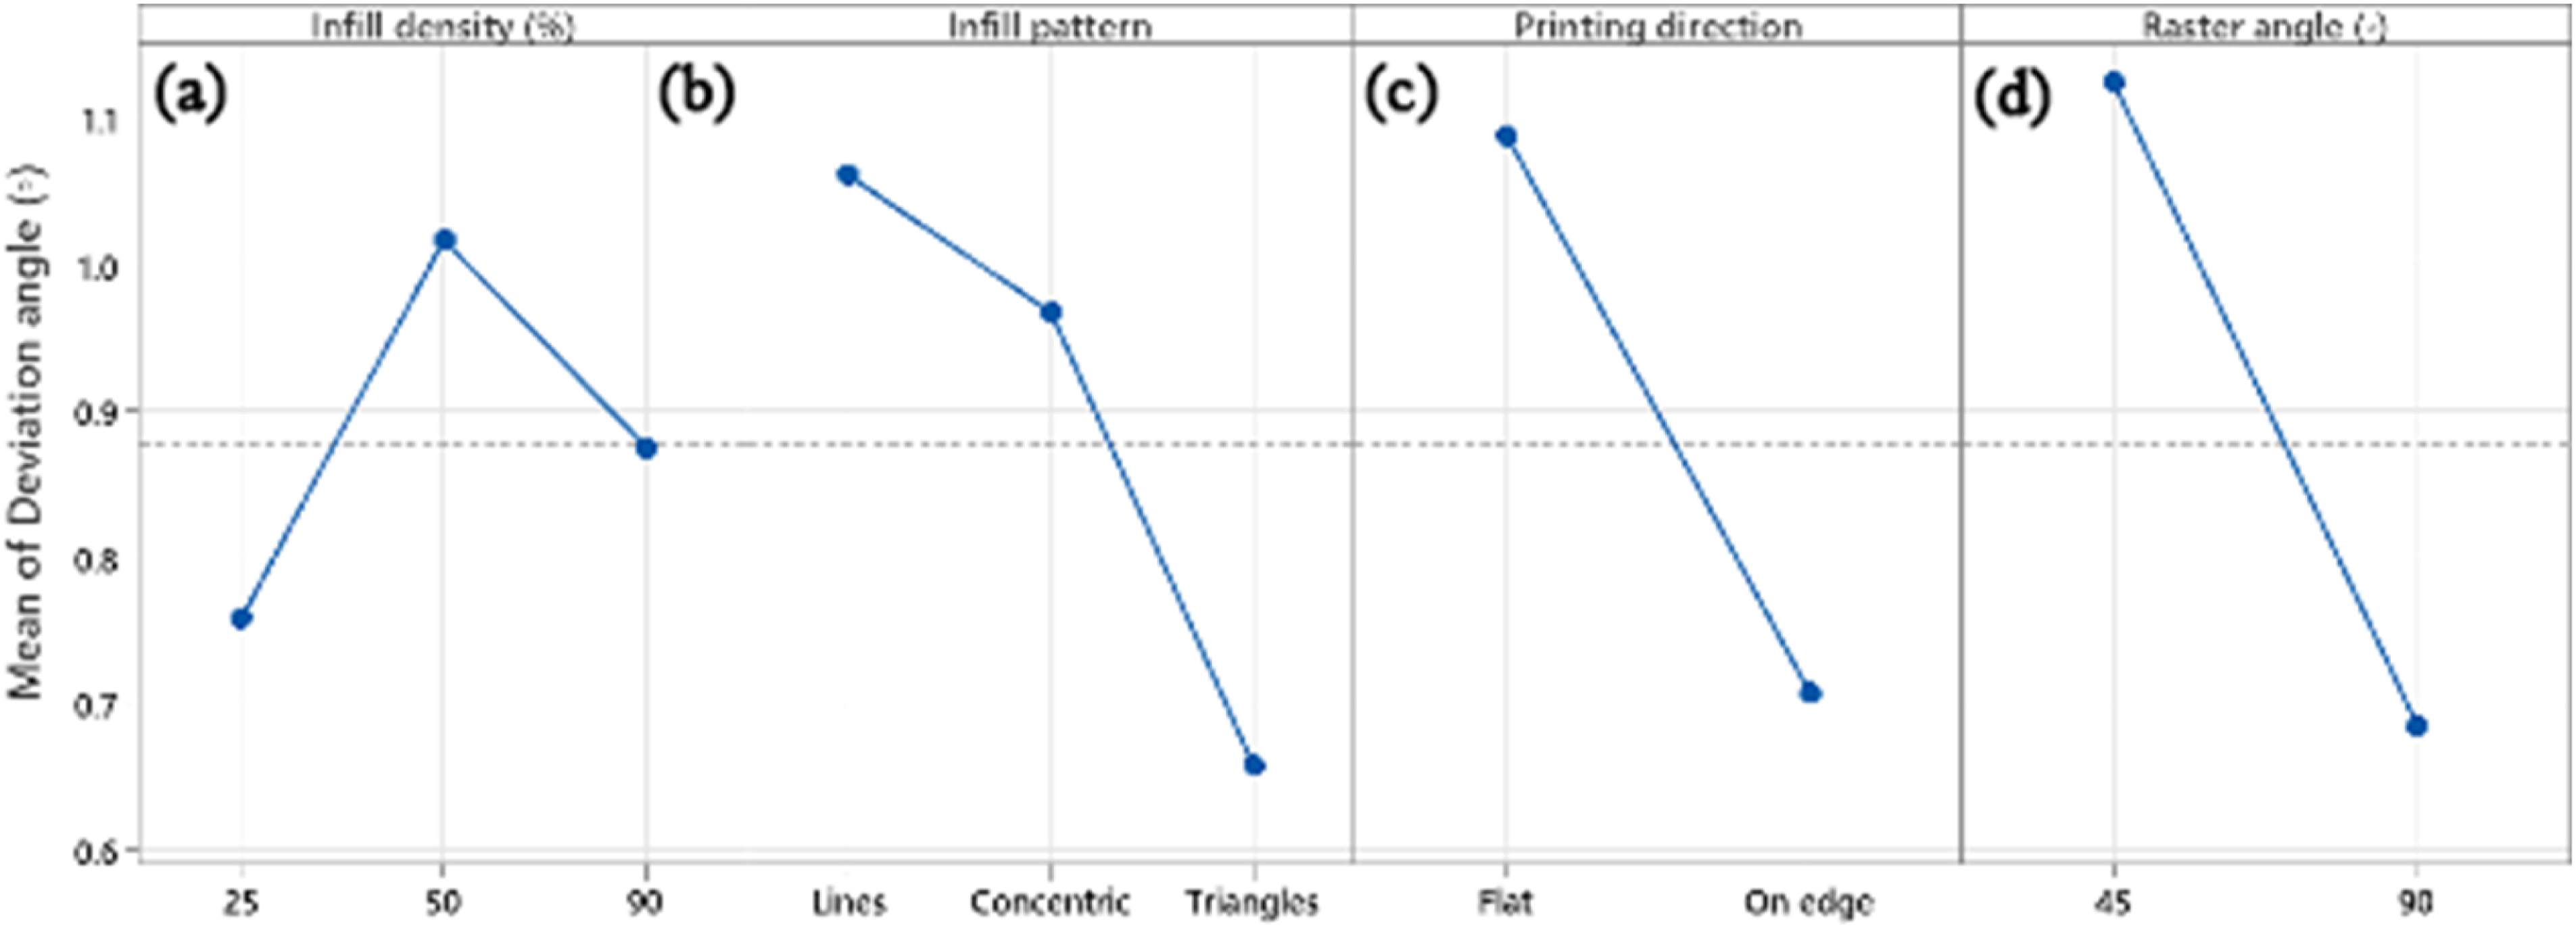
The main effects plots for deviation angle concerning (a) infill density, (b) infill pattern, (c) printing direction, (d) raster angle.
The infill density plot (Figure 8(a)) indicates that the lowest deviation angle can be obtained at the infill density 25%. The infill pattern plot (Figure 8(b)) shows that the deviation angle is reduced using a triangle pattern. The plot of the printing direction (Figure 8(c)) reveals the minimized deviation angles when printing on the edge. The plot of the raster angle (Figure 8(d)) shows that a 90° raster angle results in a lower deviation angle.
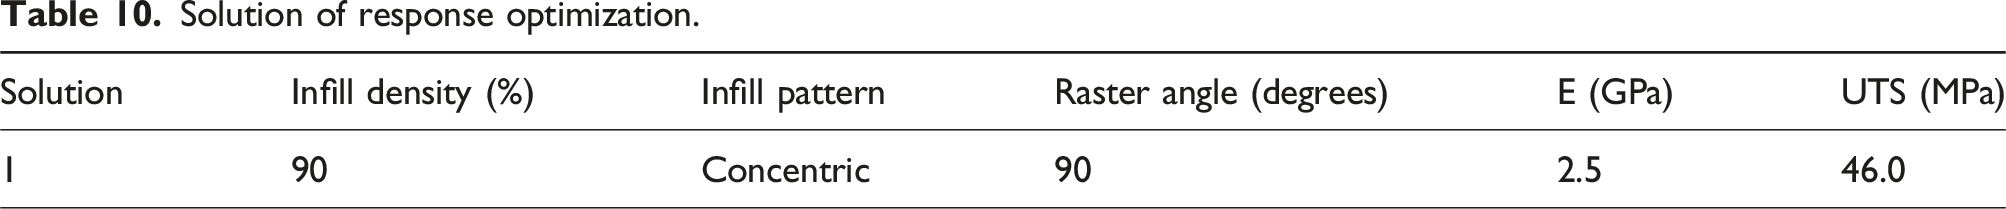
Figure 9 presents the interaction effects of various printing parameters on the deviation angle. As depicted in Figure 9(a), the triangular infill pattern exhibits the lowest deviation angle at a moderate infill density, while the concentric and line patterns display higher deviations, particularly at low and high densities. Figure 9(b) highlights the interaction between infill density and printing direction, indicating that the “on edge” printing direction results in significantly lower deviation angles compared to the “flat” orientation, especially at higher infill densities. The influence of the printing direction on different infill patterns is further examined in Figure 9(c), where the “on edge” direction effectively reduces deviation for all patterns, whereas the “flat” orientation leads to increased deviation. Figure 9(d) illustrates the effect of raster angle and infill density, demonstrating that a 90° raster angle consistently lowers the deviation compared to a 45° raster angle, particularly at higher infill densities. Similarly, Figure 9(e) shows the interaction between the infill pattern and the raster angle, where a 90° raster angle yields better angular precision in all infill patterns, with the most pronounced improvement observed for the concentric pattern. Finally, Figure 9(f) reveals that the combination of a “on edge” printing direction with a 90° raster angle achieves the lowest deviation angle, strengthening the effectiveness of this configuration in improving structural precision. Response optimization was used to determine the optimal settings for the input variables to reduce the warpage and deviation angle. The interaction plot for deviation angle with respect to (a) infill density, infill pattern (b) infill density, printing direction (c) infill pattern, printing direction (d) infill density, raster angle (e) infill pattern, raster angle (f) printing direction, raster angle.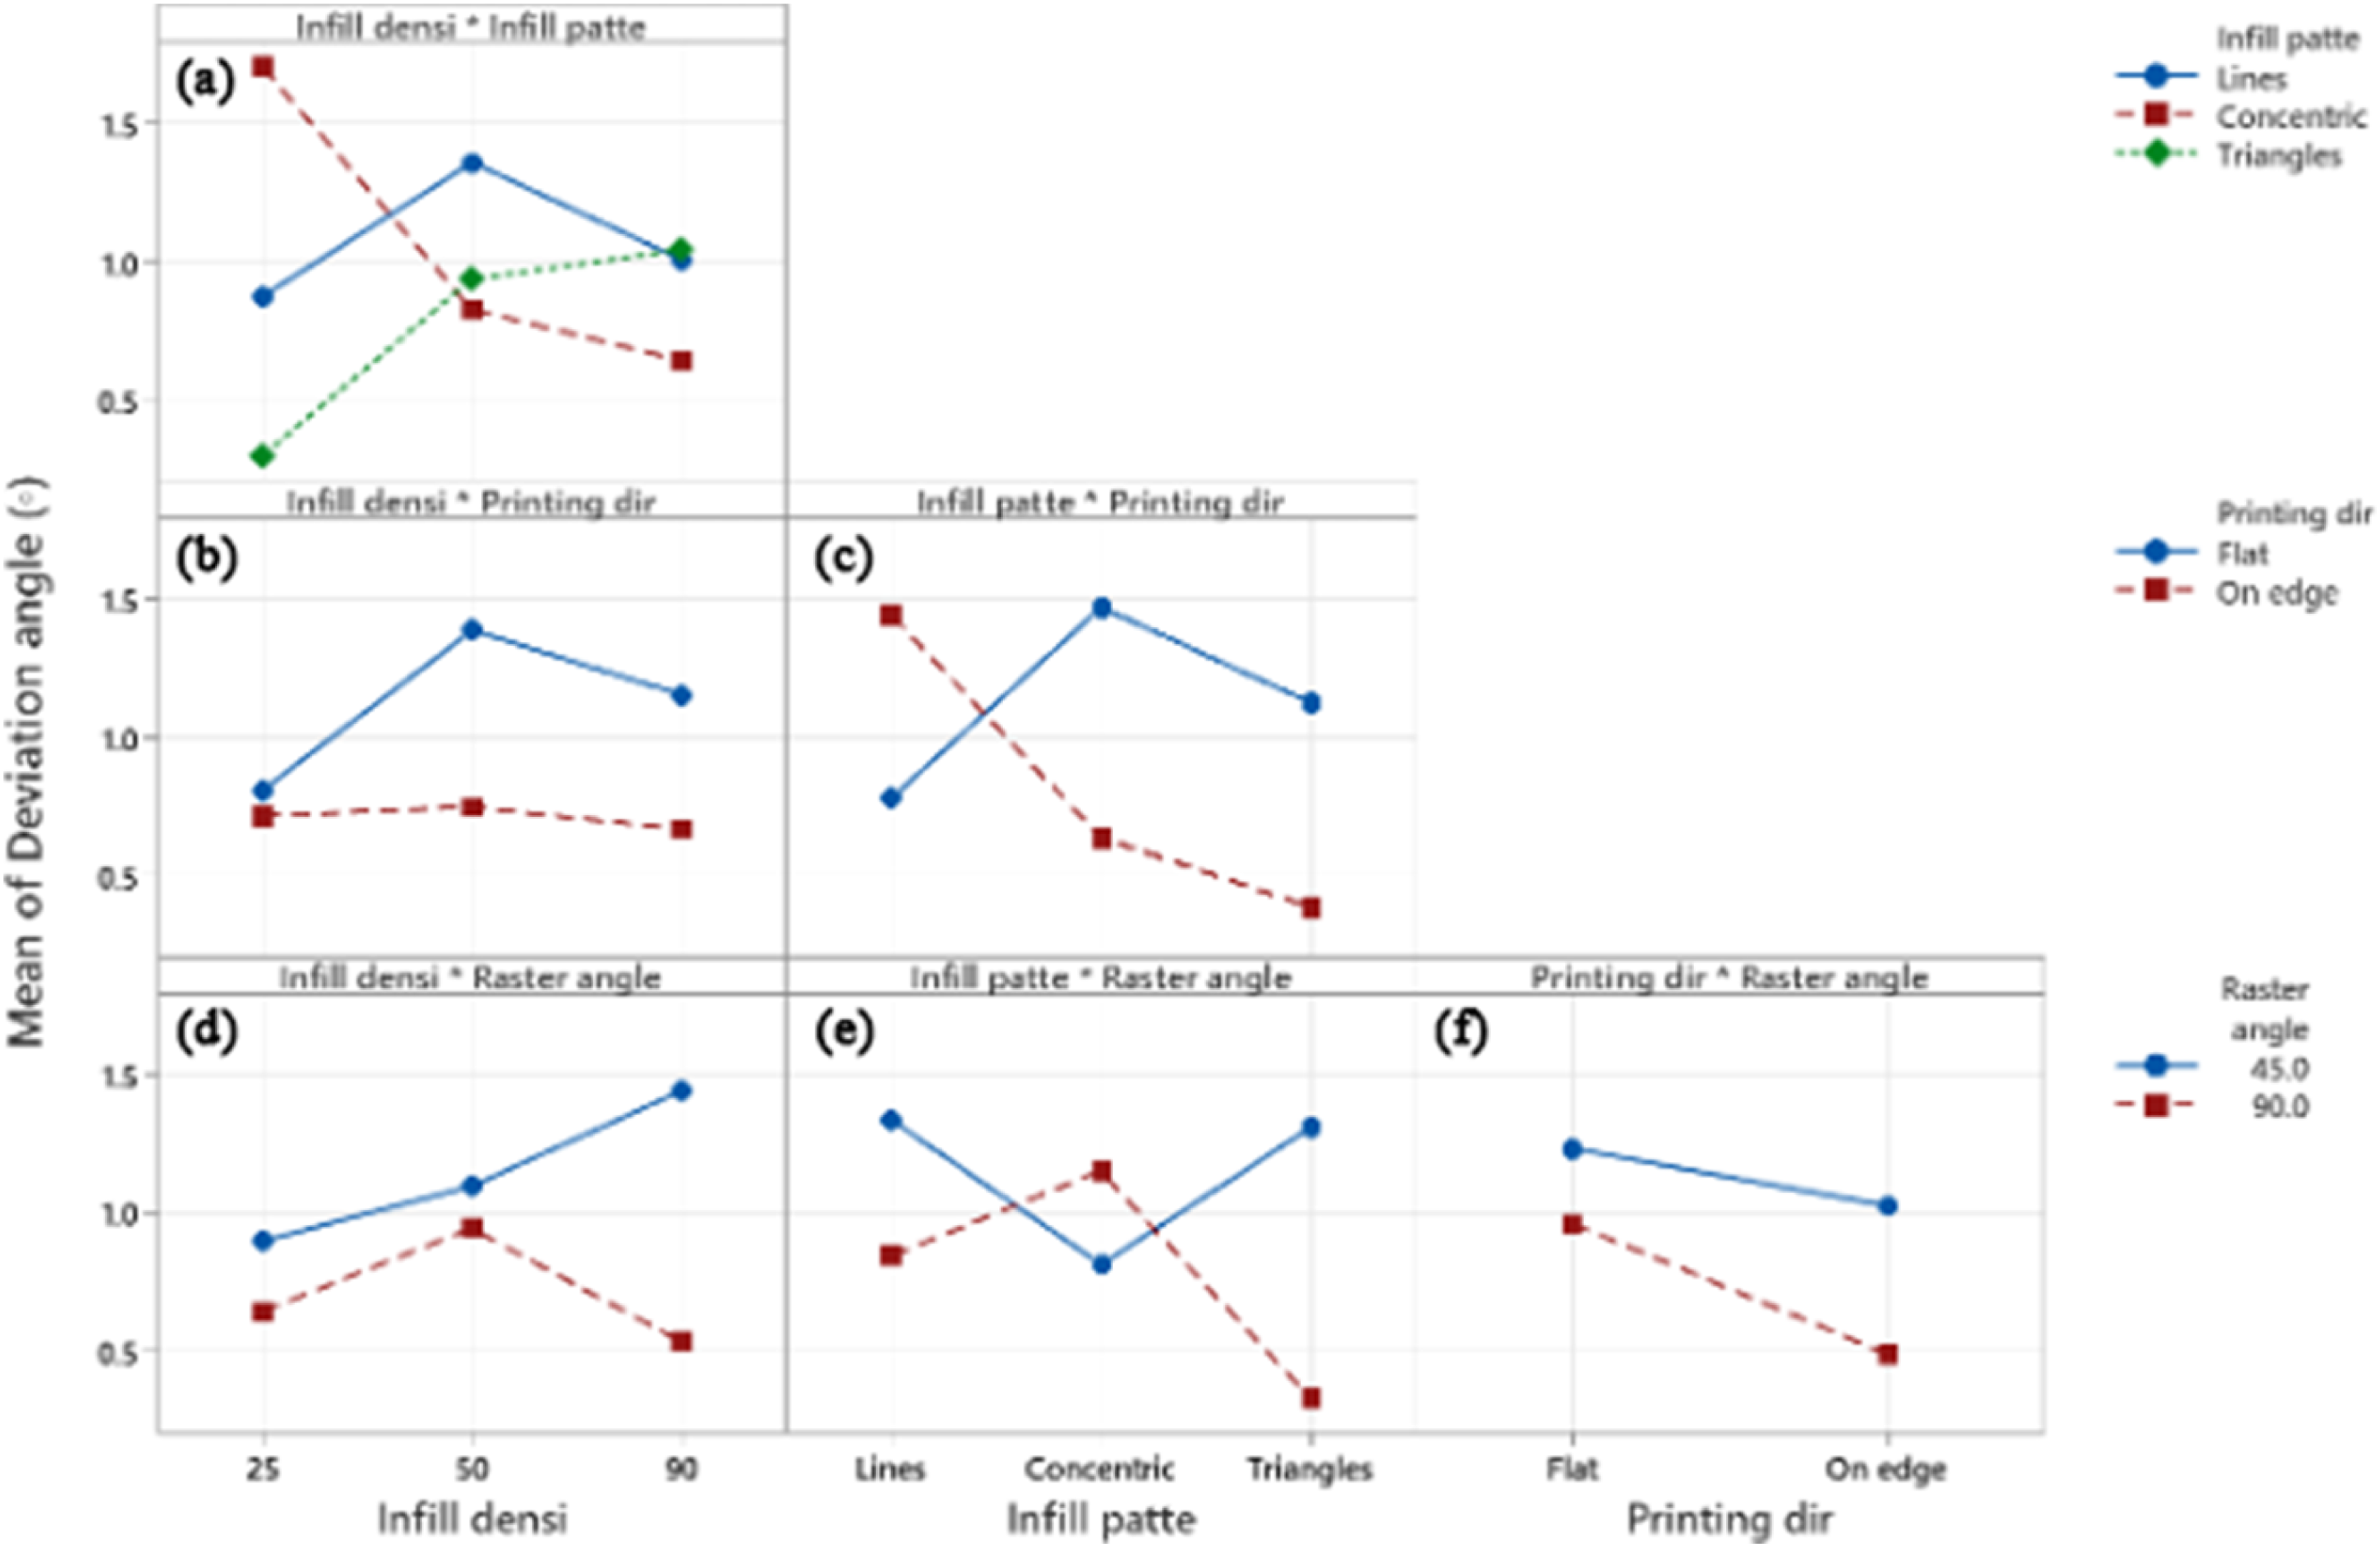
Solution of response optimization.
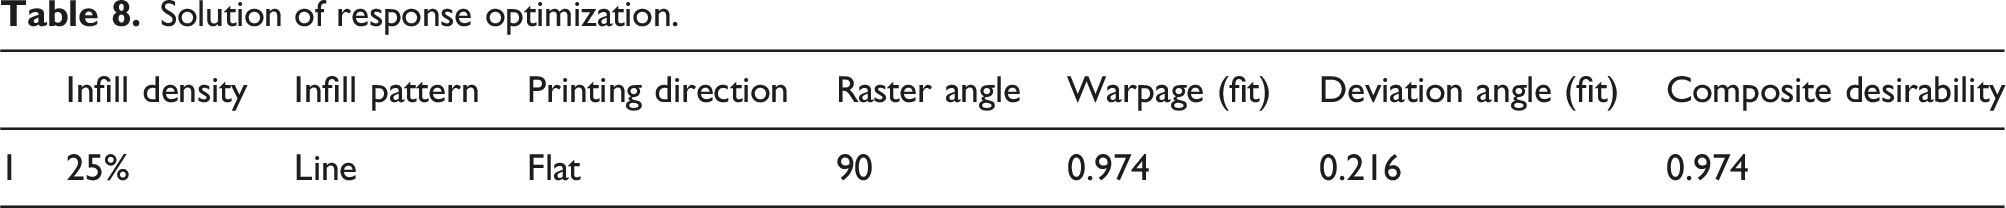
This result is consistent with the findings reported in Ref. 28, which indicate that increasing the infill density in a line infill pattern leads to a reduction in warpage. Composite desirability (Figure 10) was performed to evaluate how well these settings meet the response targets. Here, the composite desirability score of 0.960, which is close to 1, indicates that the settings appear to yield favorable results in all responses collectively. The warpage analysis reveals that the Lines infill pattern and a flat printing direction result in a significantly reduced warpage. Among the parameters tested, the 90° raster angle consistently minimized warpage in all configurations. This can be attributed to its ability to distribute thermal stresses more evenly during the cooling phase. This is consistent with the findings of previous studies, which demonstrated that aligned raster angles enhance structural stability by reducing internal stresses.
28
These findings highlight the critical role of parameter selection in achieving precise dimensional accuracy, particularly in applications requiring stringent tolerances, such as UAV components. Composite desirability plot for the warpage and deviation angle.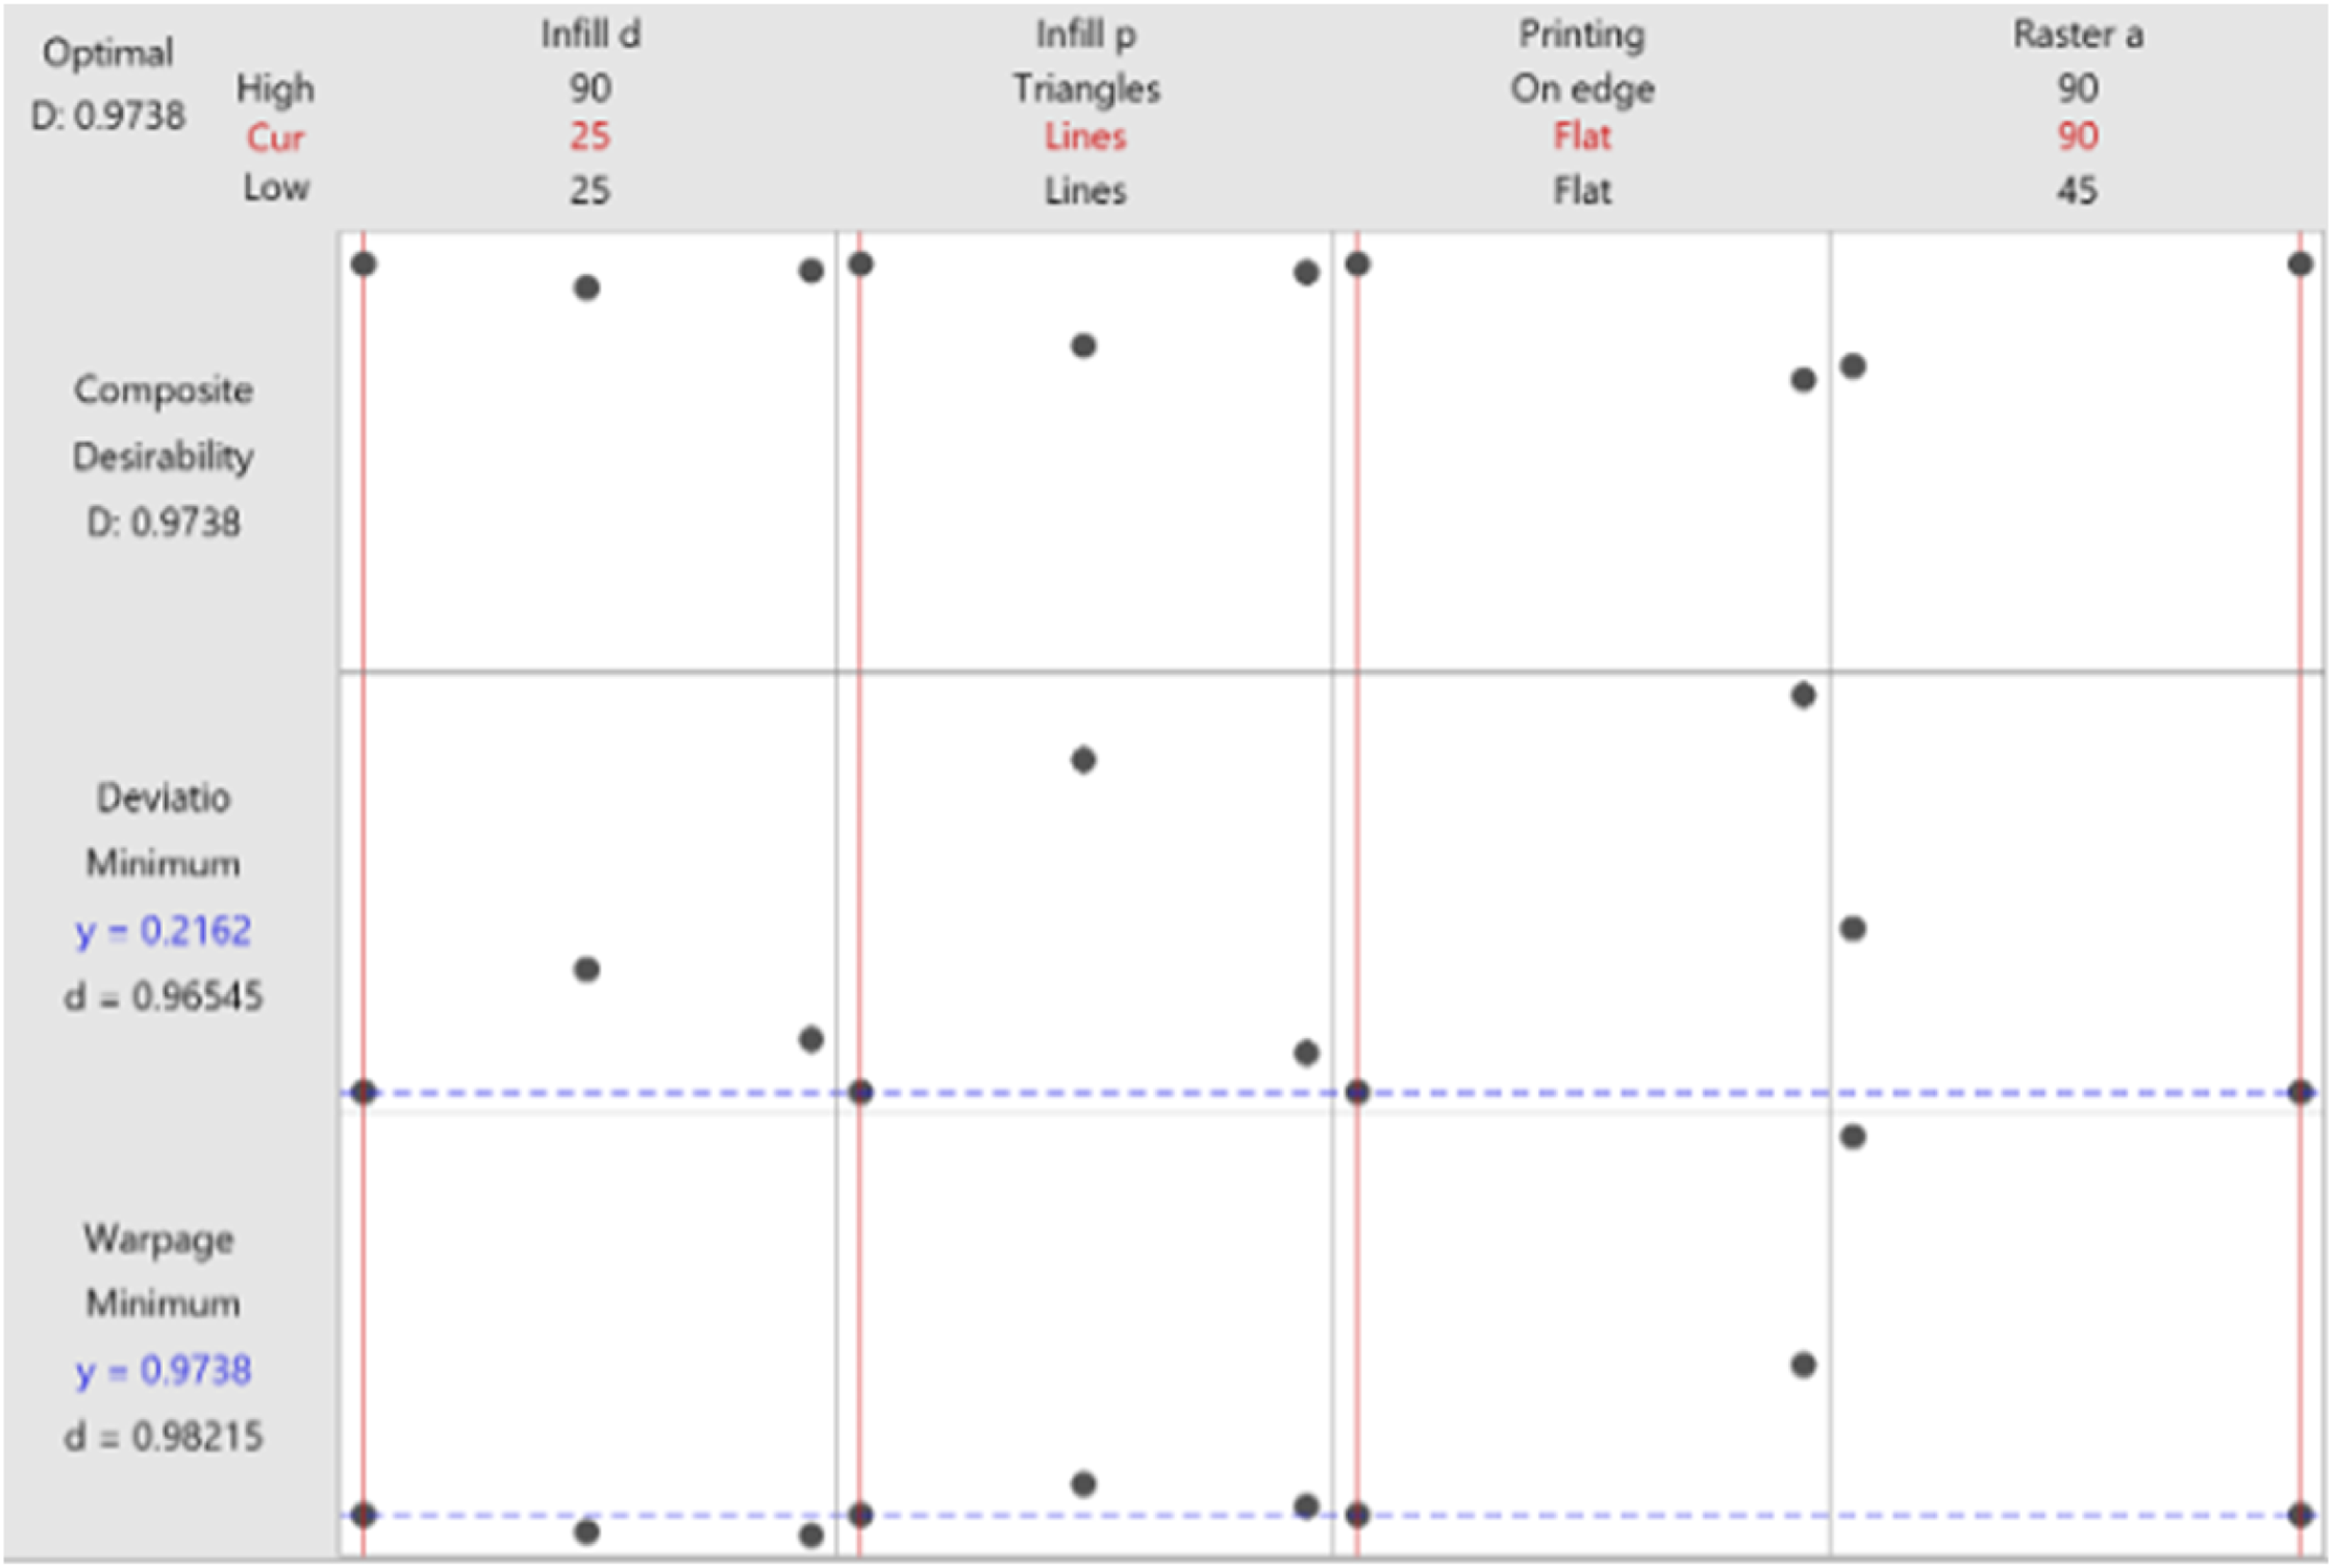
Tests
Tensile test
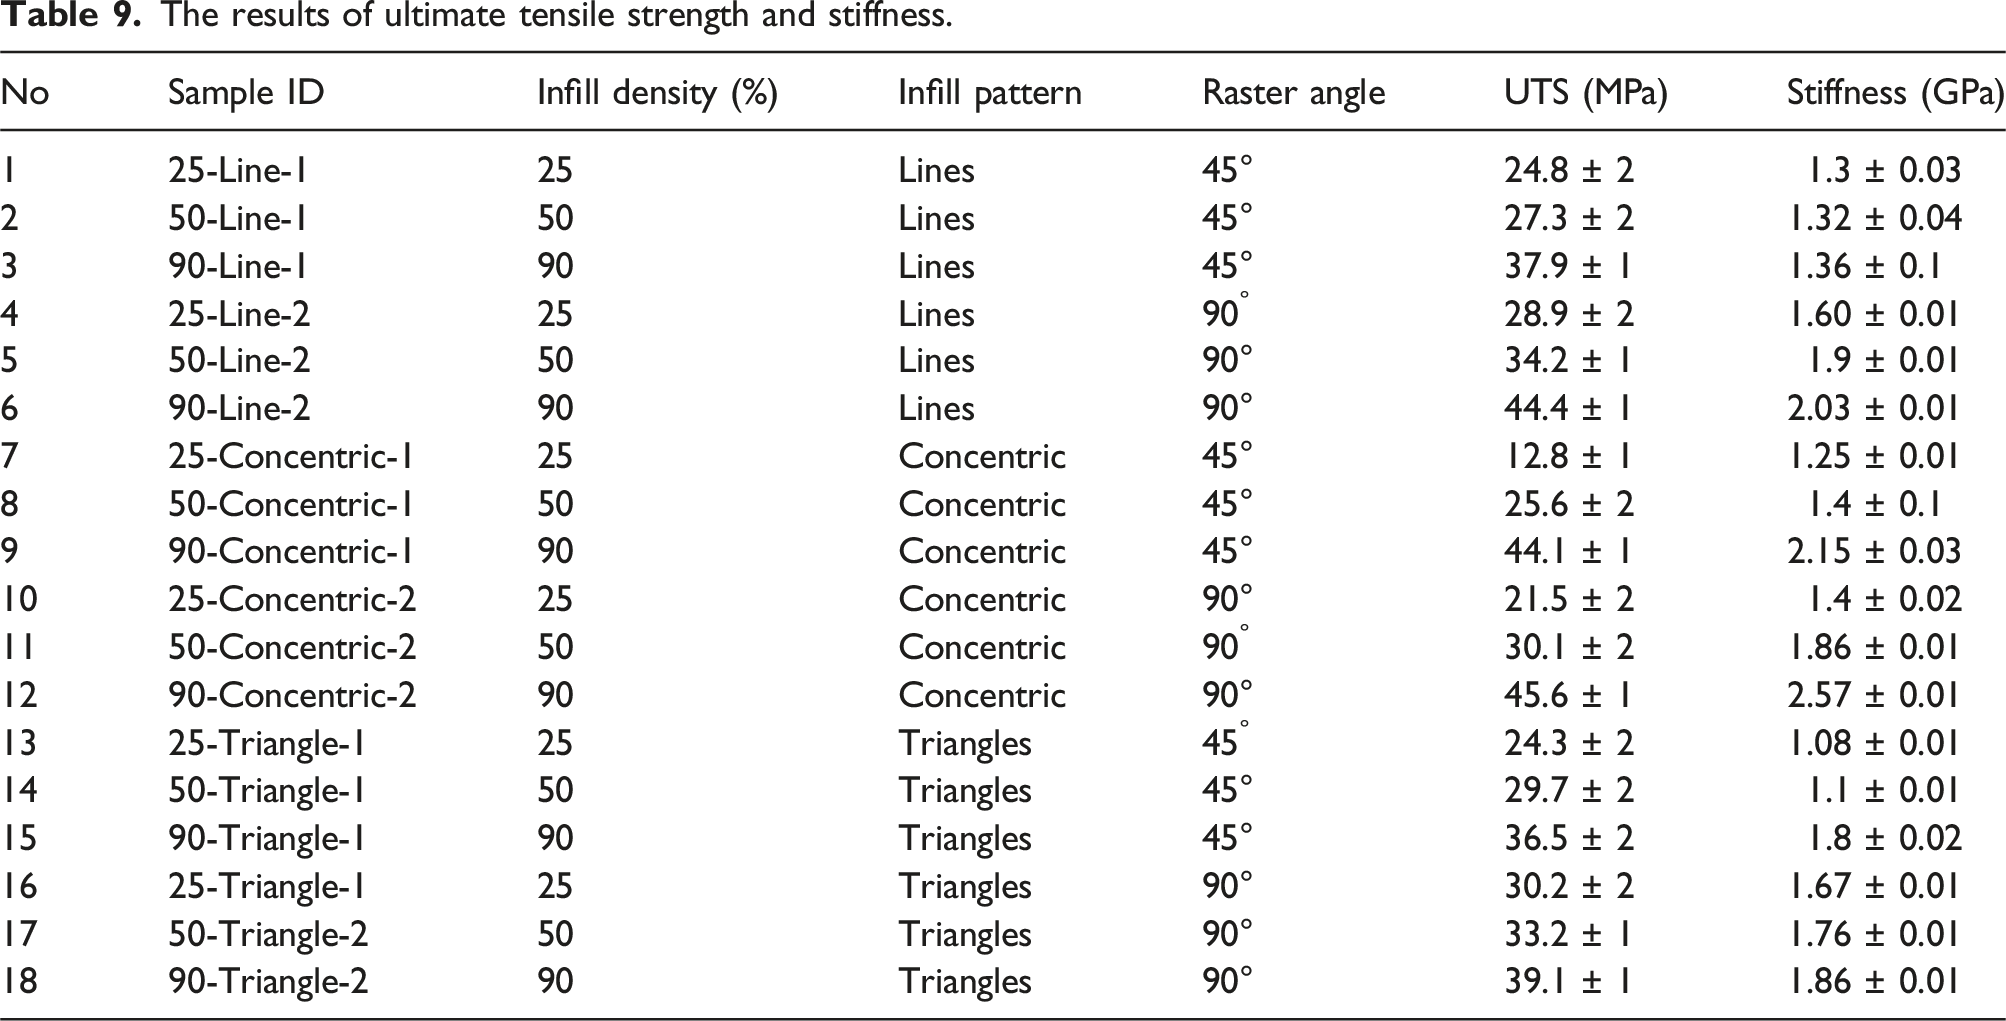
The results of ultimate tensile strength and stiffness.
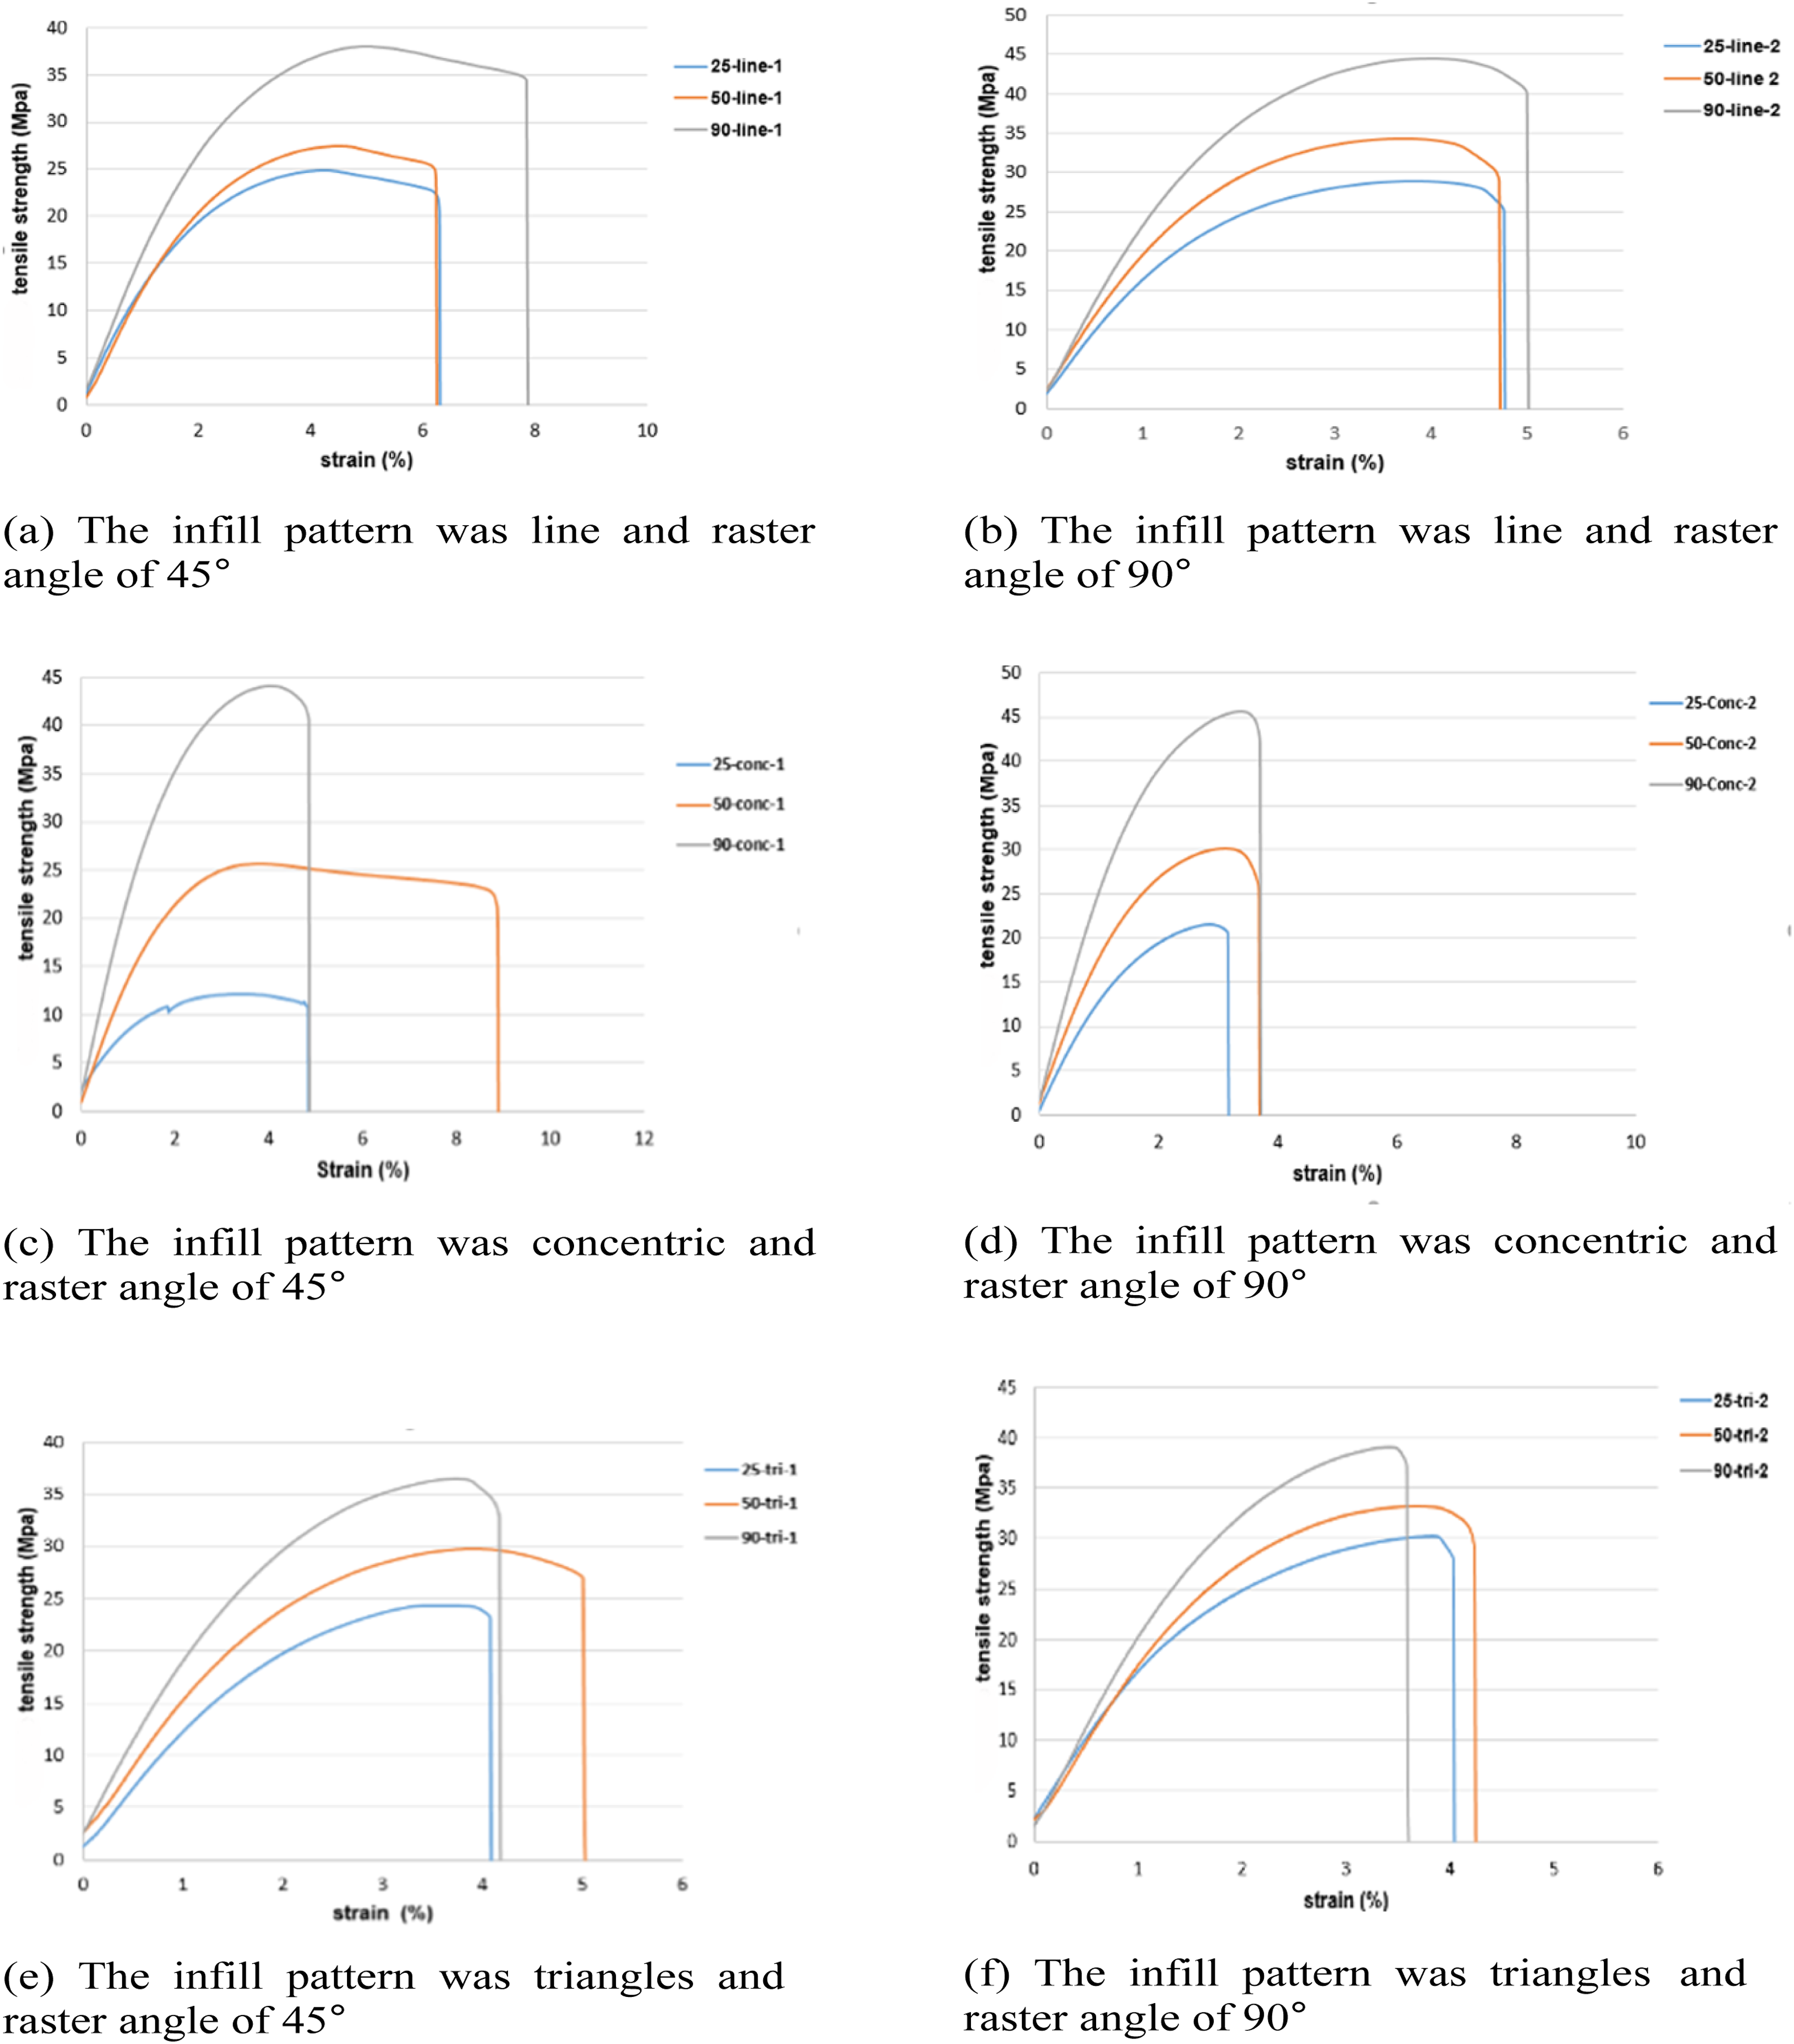
The results of tensile test with different infill densities; 25%, 50% and 90%.
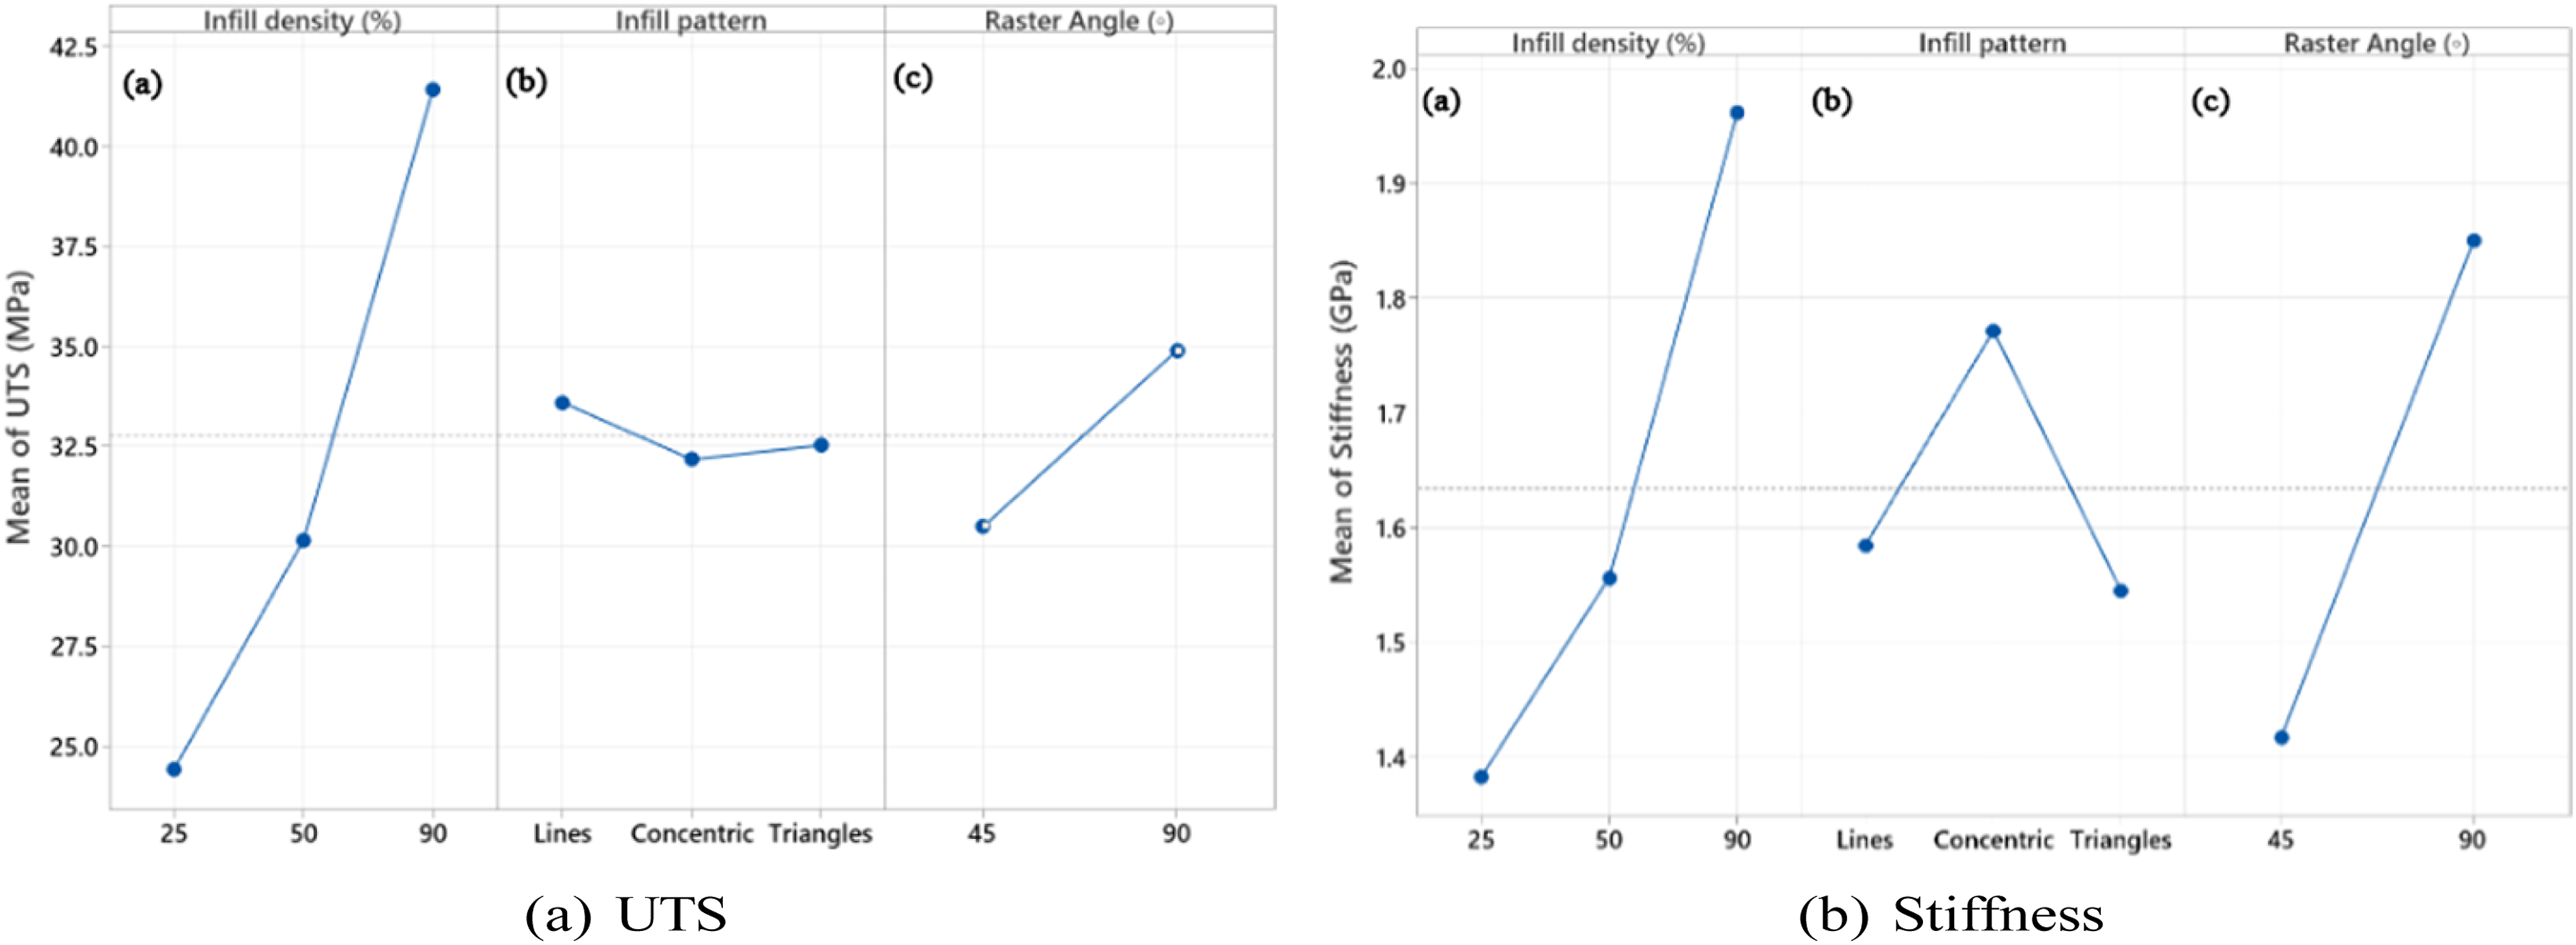
The main effects plot for (a) UTS, (b) stiffness.
The analysis of factors that influence UTS reveals several key insights. First, UTS increases with higher infill density. This reflects enhanced resistance to tensile forces due to increased material volume, recommending maximum density for superior mechanical performance. Second, while the infill pattern shows minimal impact on UTS within the tested range (lines, concentric, triangles), concentric patterns offer superior stiffness due to their uniform material distribution. Third, a raster angle of 90° surpasses 45° to improve UTS, probably due to improved layer adhesion and load distribution along the direction of applied force. This preference is advantageous for applications requiring high tensile strength.
Solution of response optimization.
Additionally, the concentric infill pattern is identified as the most effective in enhancing a part’s mechanical properties. This pattern distributes stress uniformly throughout the object, providing superior support and material distribution. The concentric pattern is particularly advantageous under uniform or radially symmetric loading conditions, leading to enhanced UTS and stiffness.
Furthermore, experiments revealed that a 90° raster angle is the most effective for achieving high UTS and stiffness. This orientation enhances the adhesion and stress distribution of the layer, especially when used in conjunction with a concentric infill pattern. The 90° raster angle aligns material deposition in a way that effectively counteracts tensile stress, contributing to the structural robustness of the part. Response optimization research provides clear guidelines for selecting 3D printing process parameters to achieve superior mechanical properties in printed items. The strength and stiffness of printed components can be significantly improved by maximizing infill density, employing a concentric pattern, and using a raster angle of 90°. This optimization is crucial to enhance the performance and durability of 3D-printed parts.
A concentric infill pattern, combined with a 90% infill density yields the highest tensile strength. This finding aligns with the results reported in Ref. 29, where the concentric infill pattern exhibited superior tensile strength compared to line and triangular infill patterns. Furthermore, according to Ref. 30, an increase in infill density further enhances the tensile strength of the concentric infill pattern.
Bending test
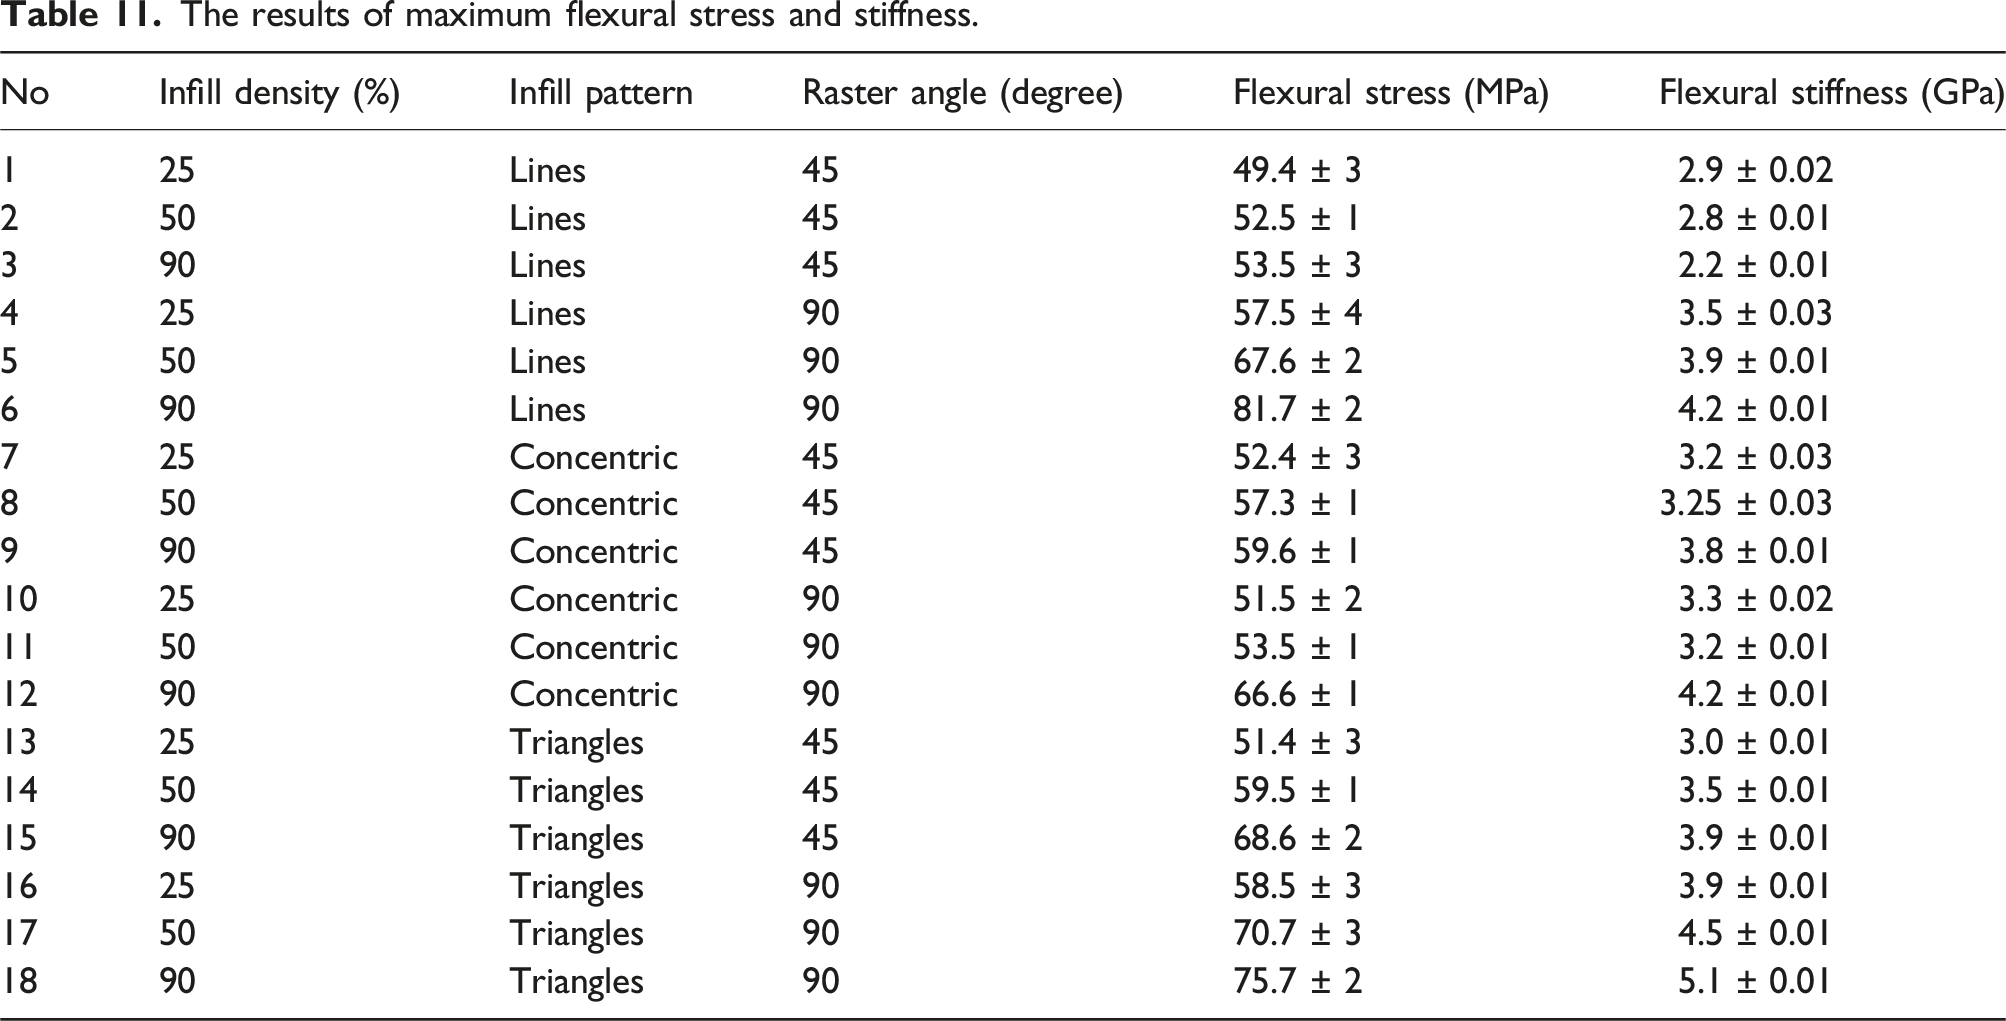
The three-point bending test was performed to evaluate the flexural properties of 3D printed samples under different infill densities, infill patterns and raster angles. This test is a widely used method to determine the flexural strength, stiffness, and overall bending performance of materials. The load-deflection diagrams are shown in Figure 13 and the results are detailed in Table 11. The results of flexural bending test of the material with different infill densities; 25%, 50% and 90%. The results of maximum flexural stress and stiffness.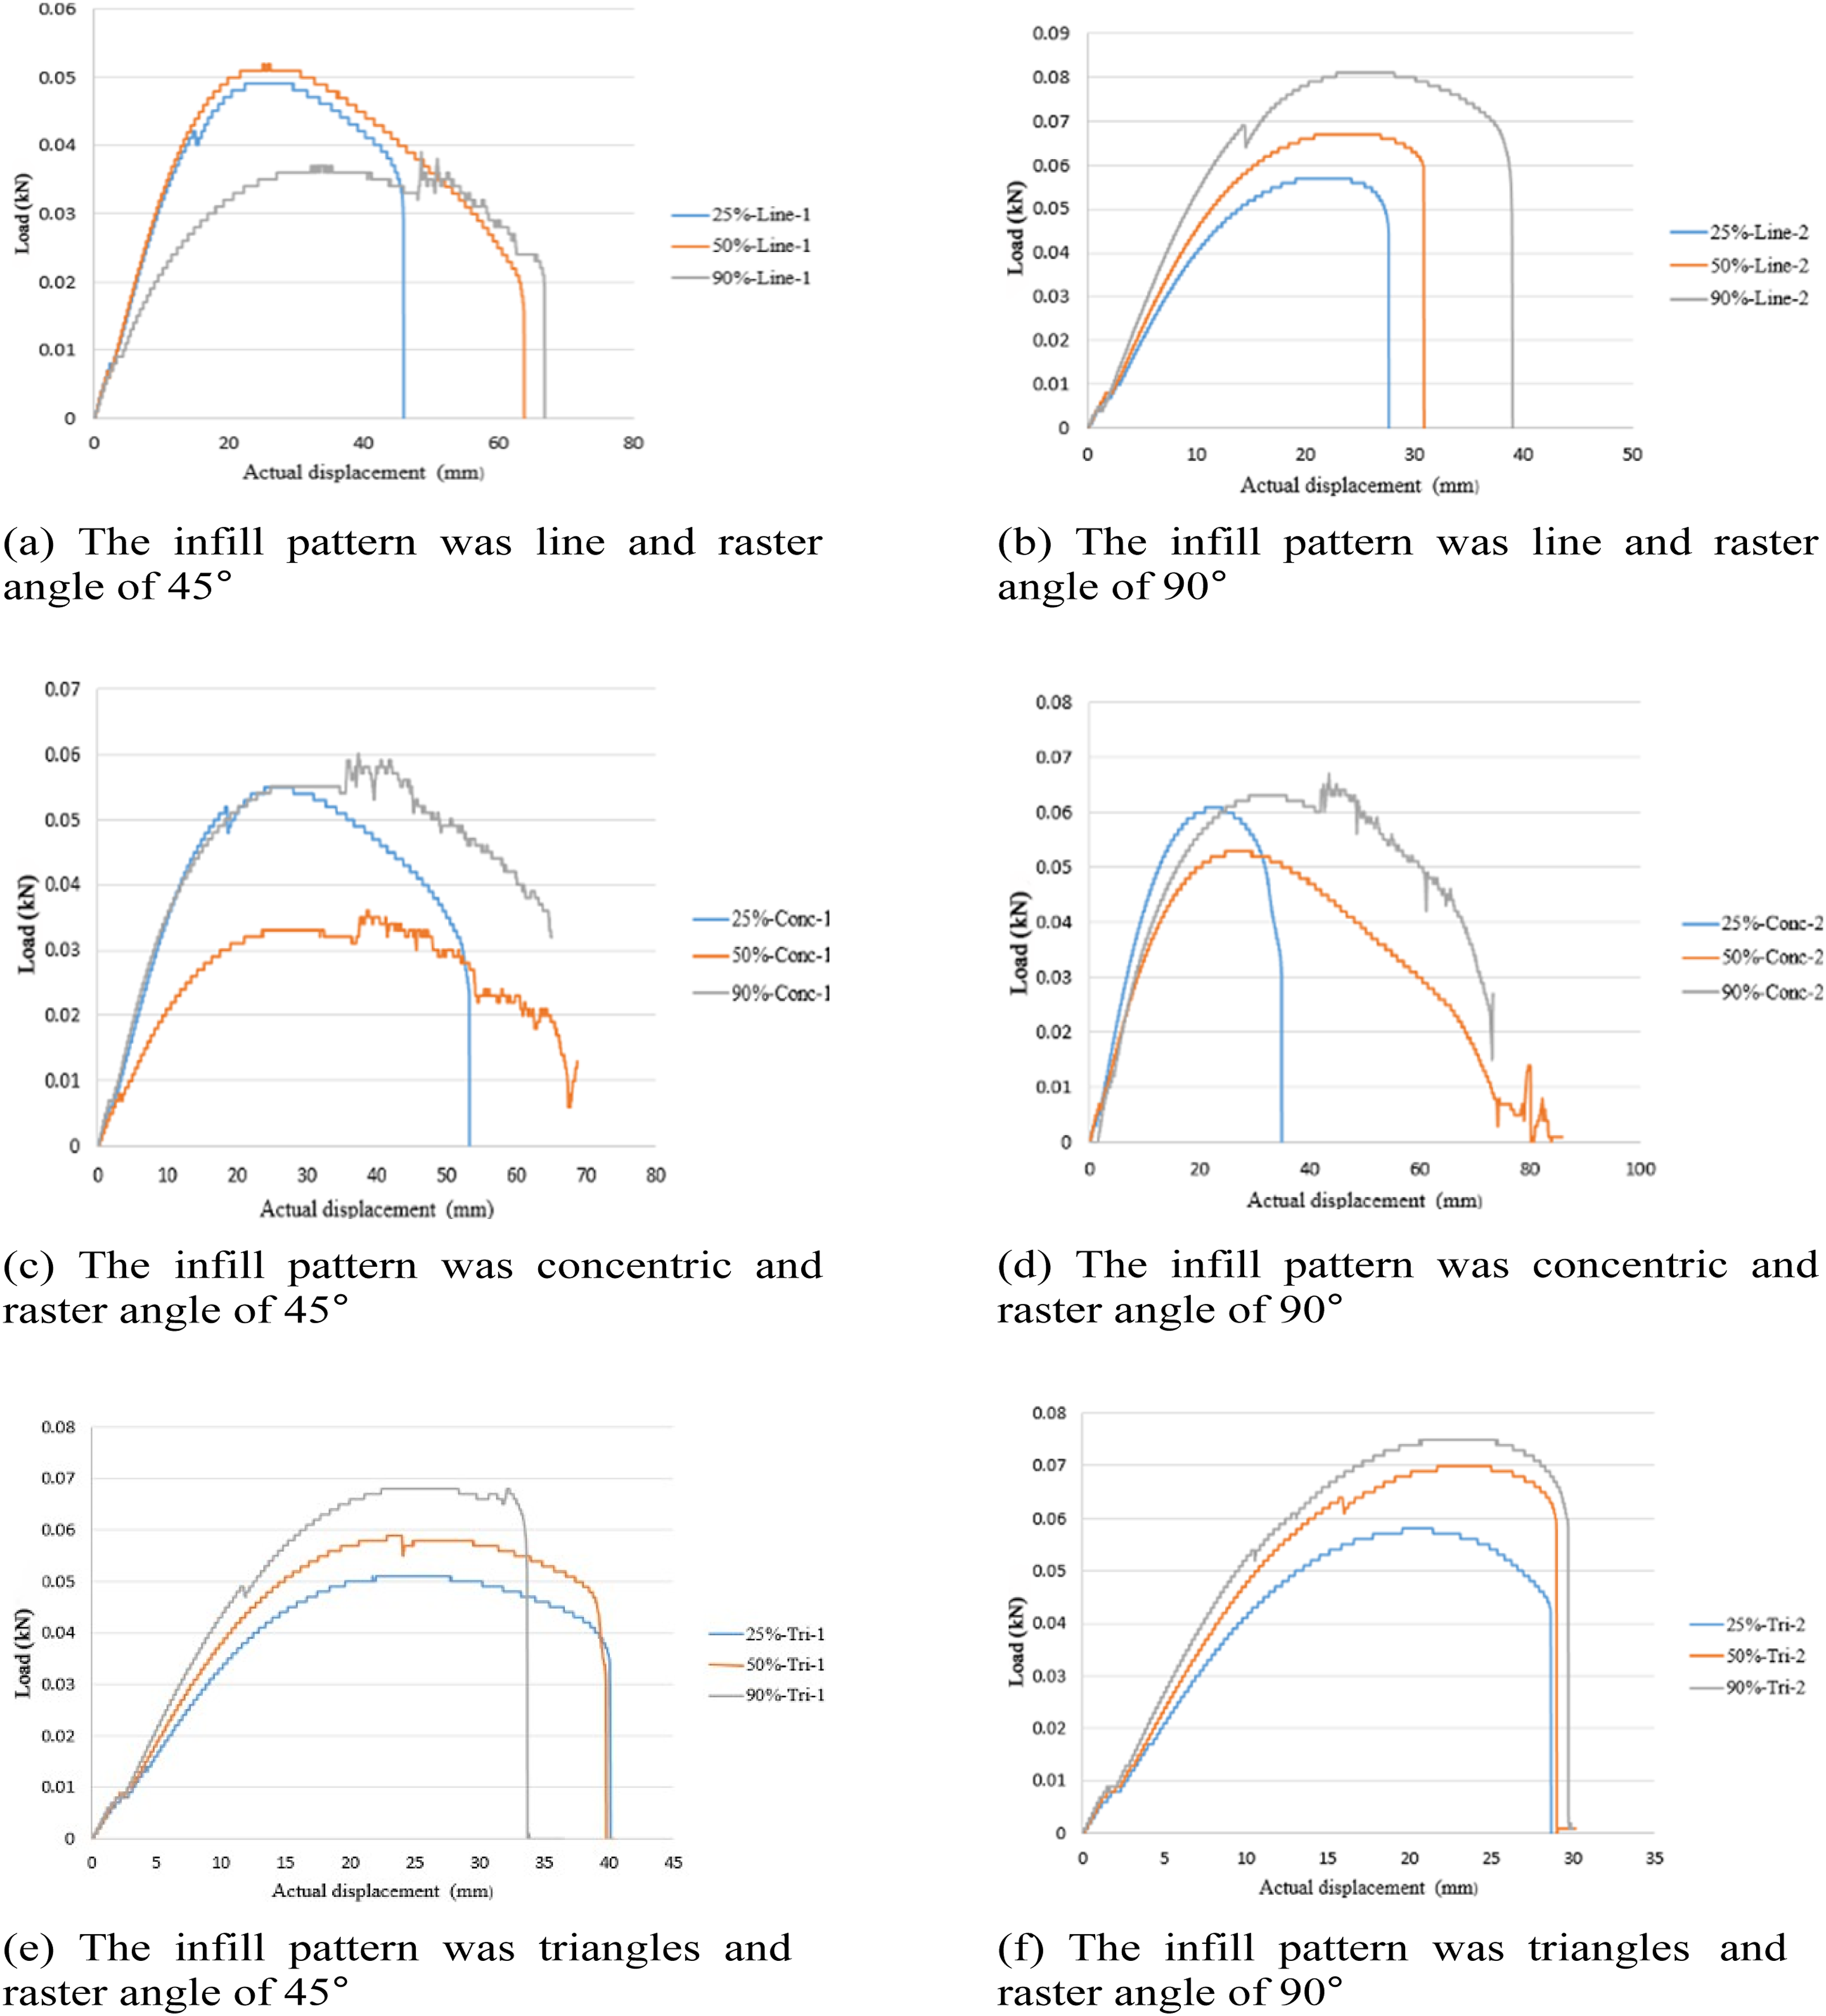
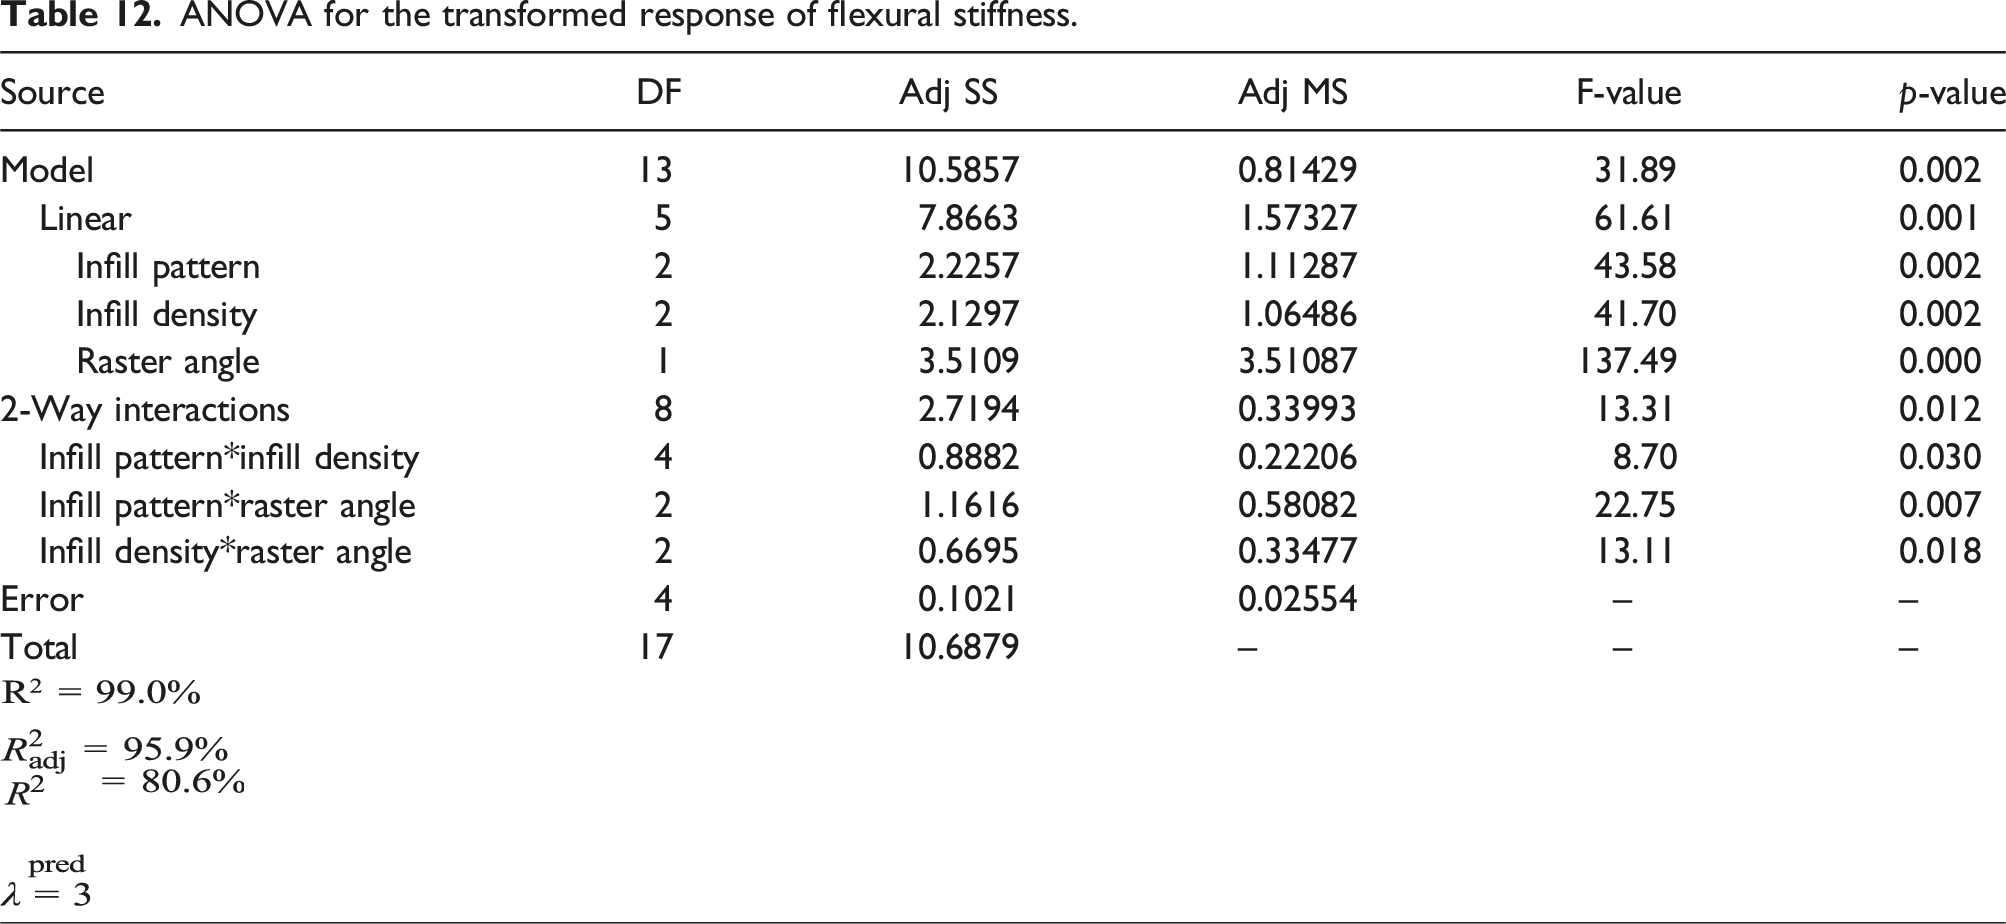
ANOVA for the transformed response of flexural stiffness.
ANOVA for the transformed response of maximum stress.
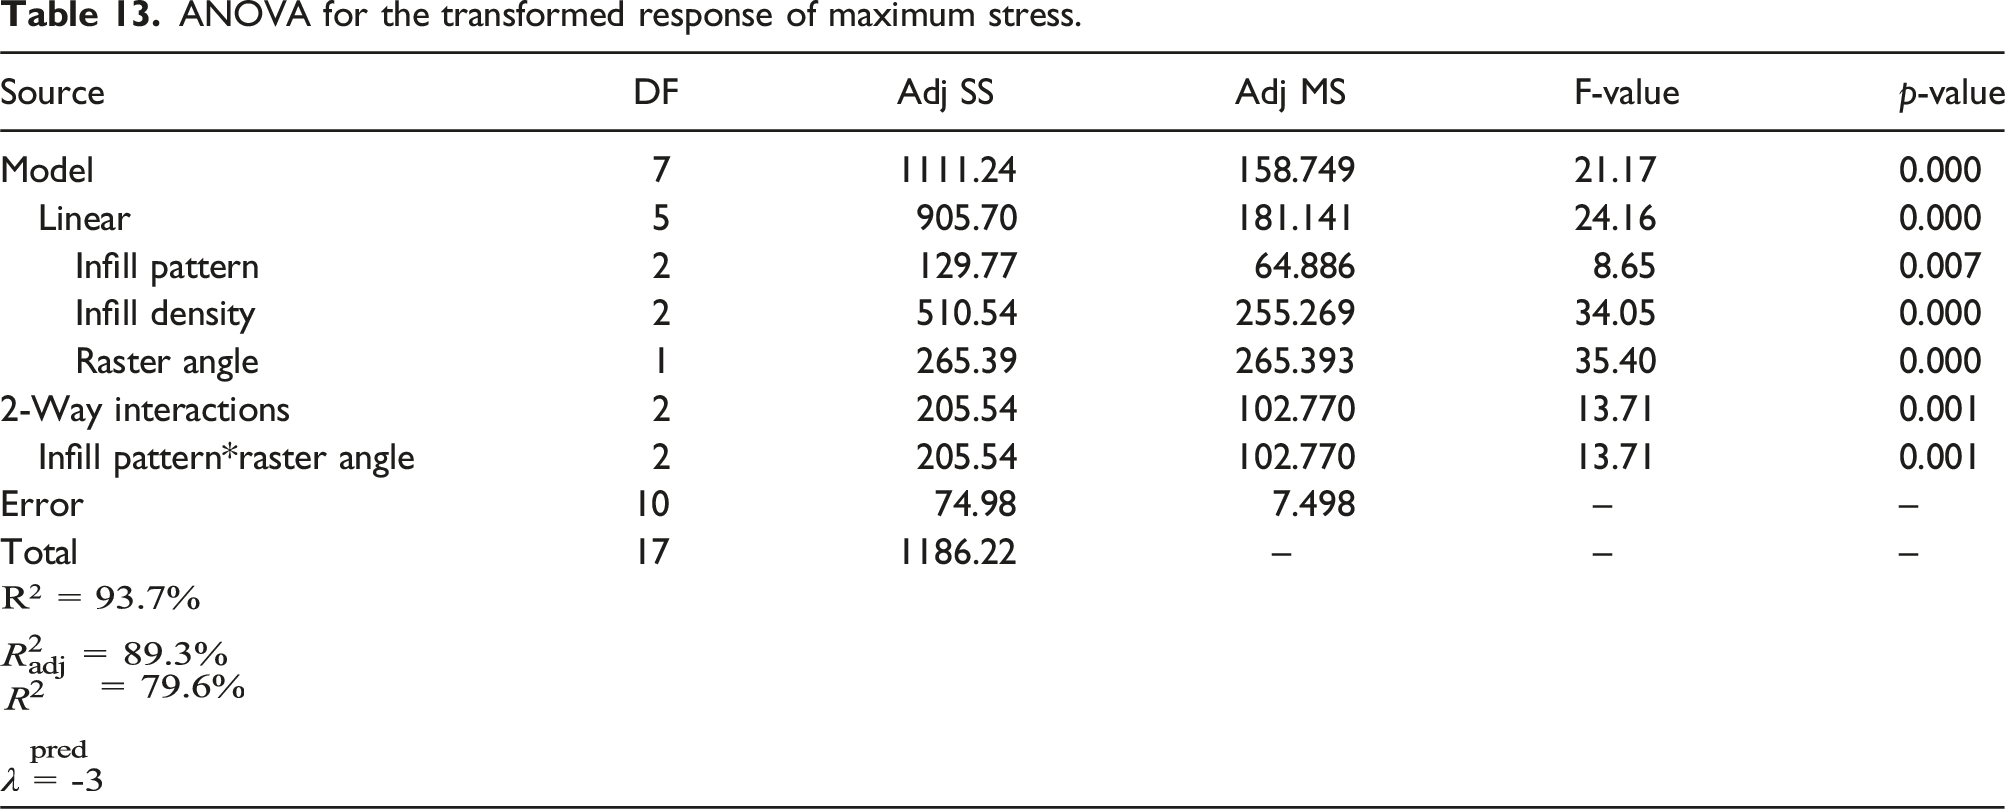
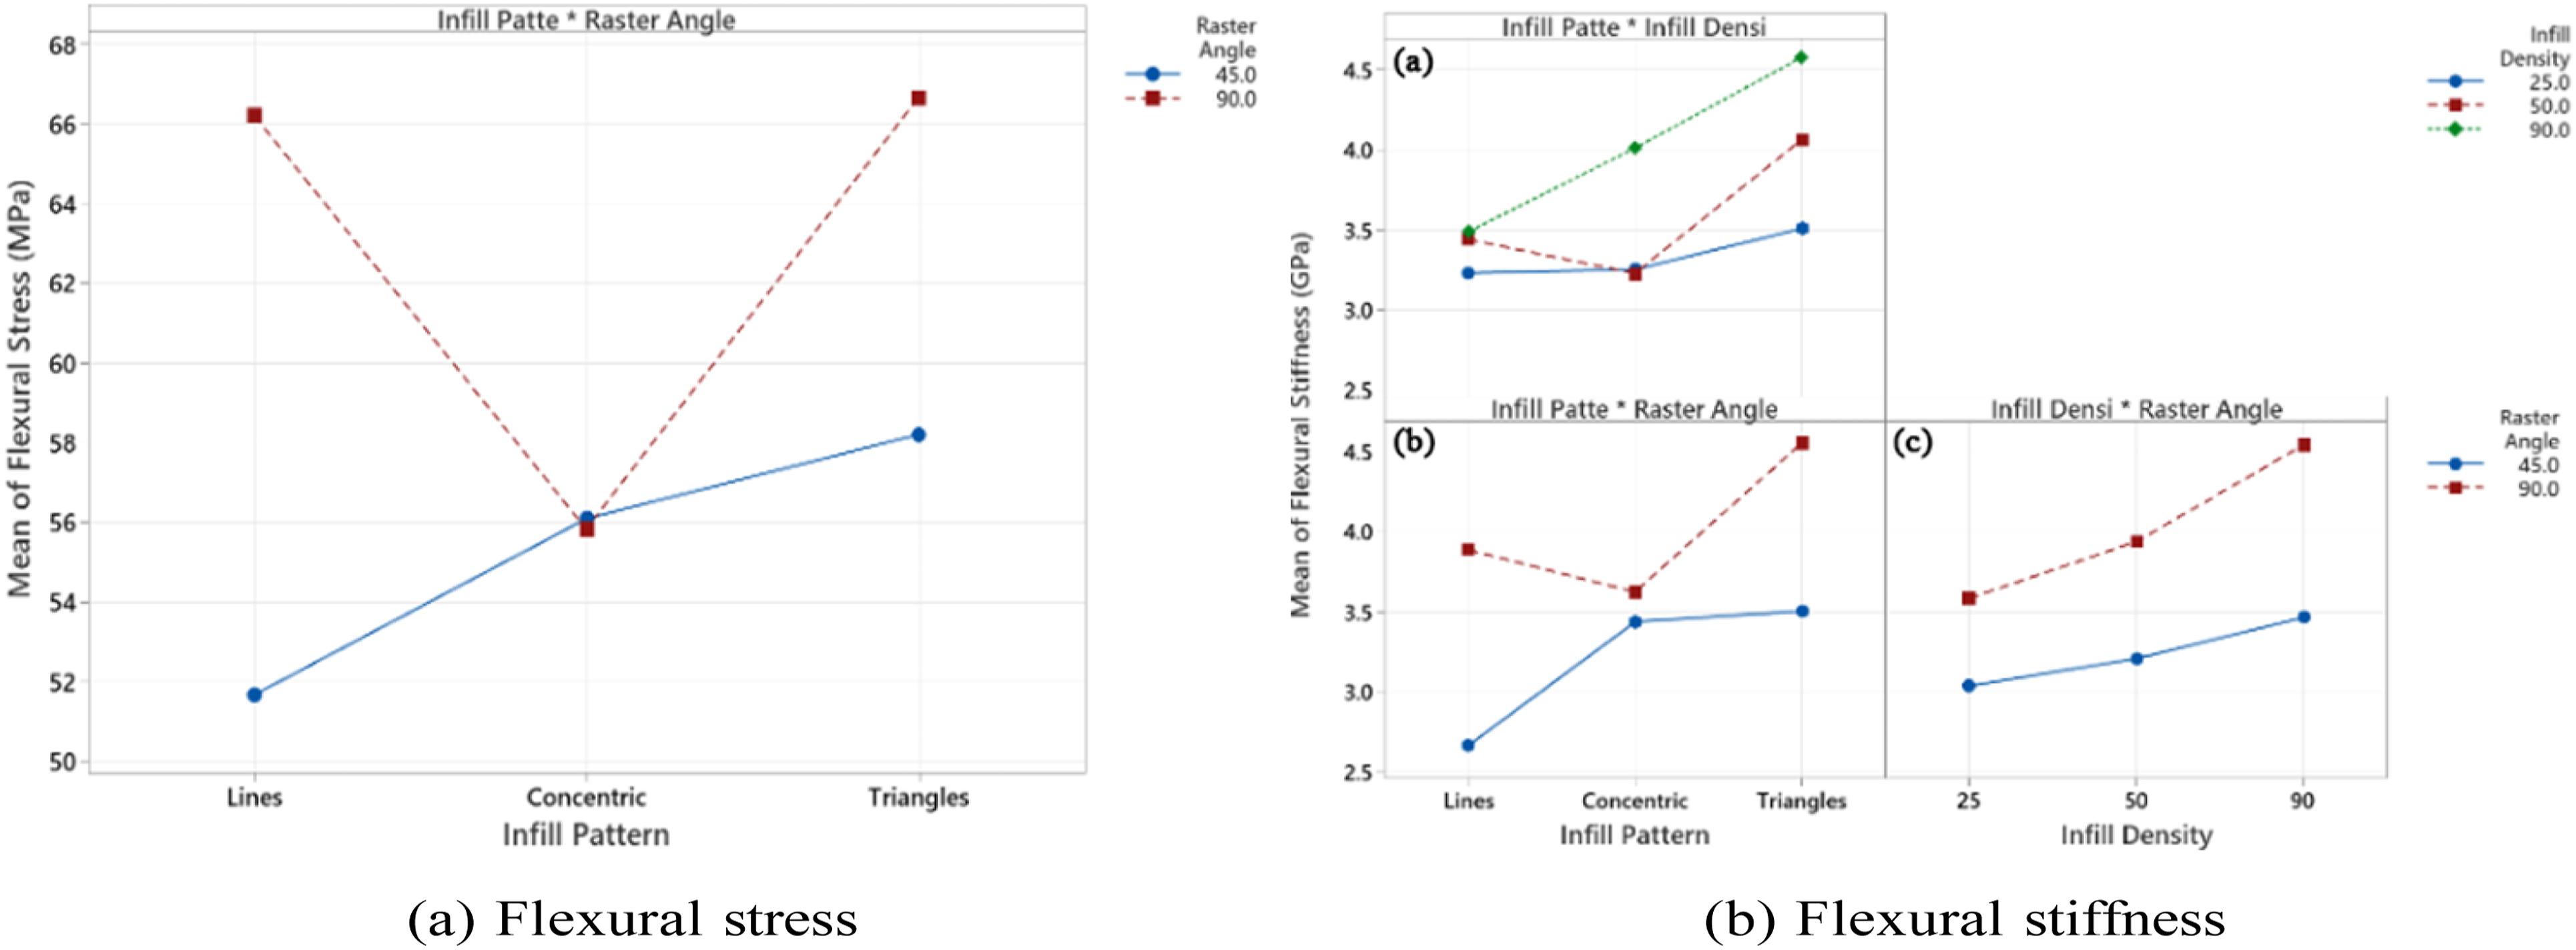
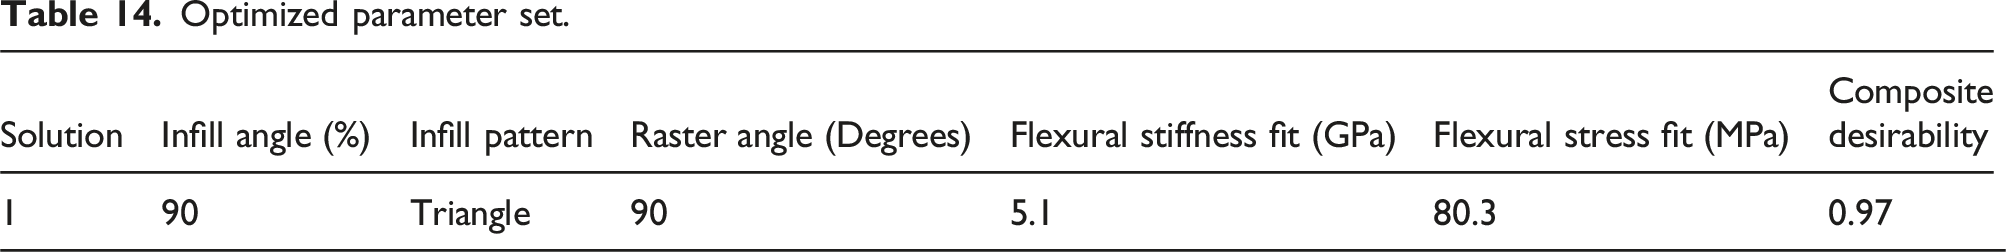
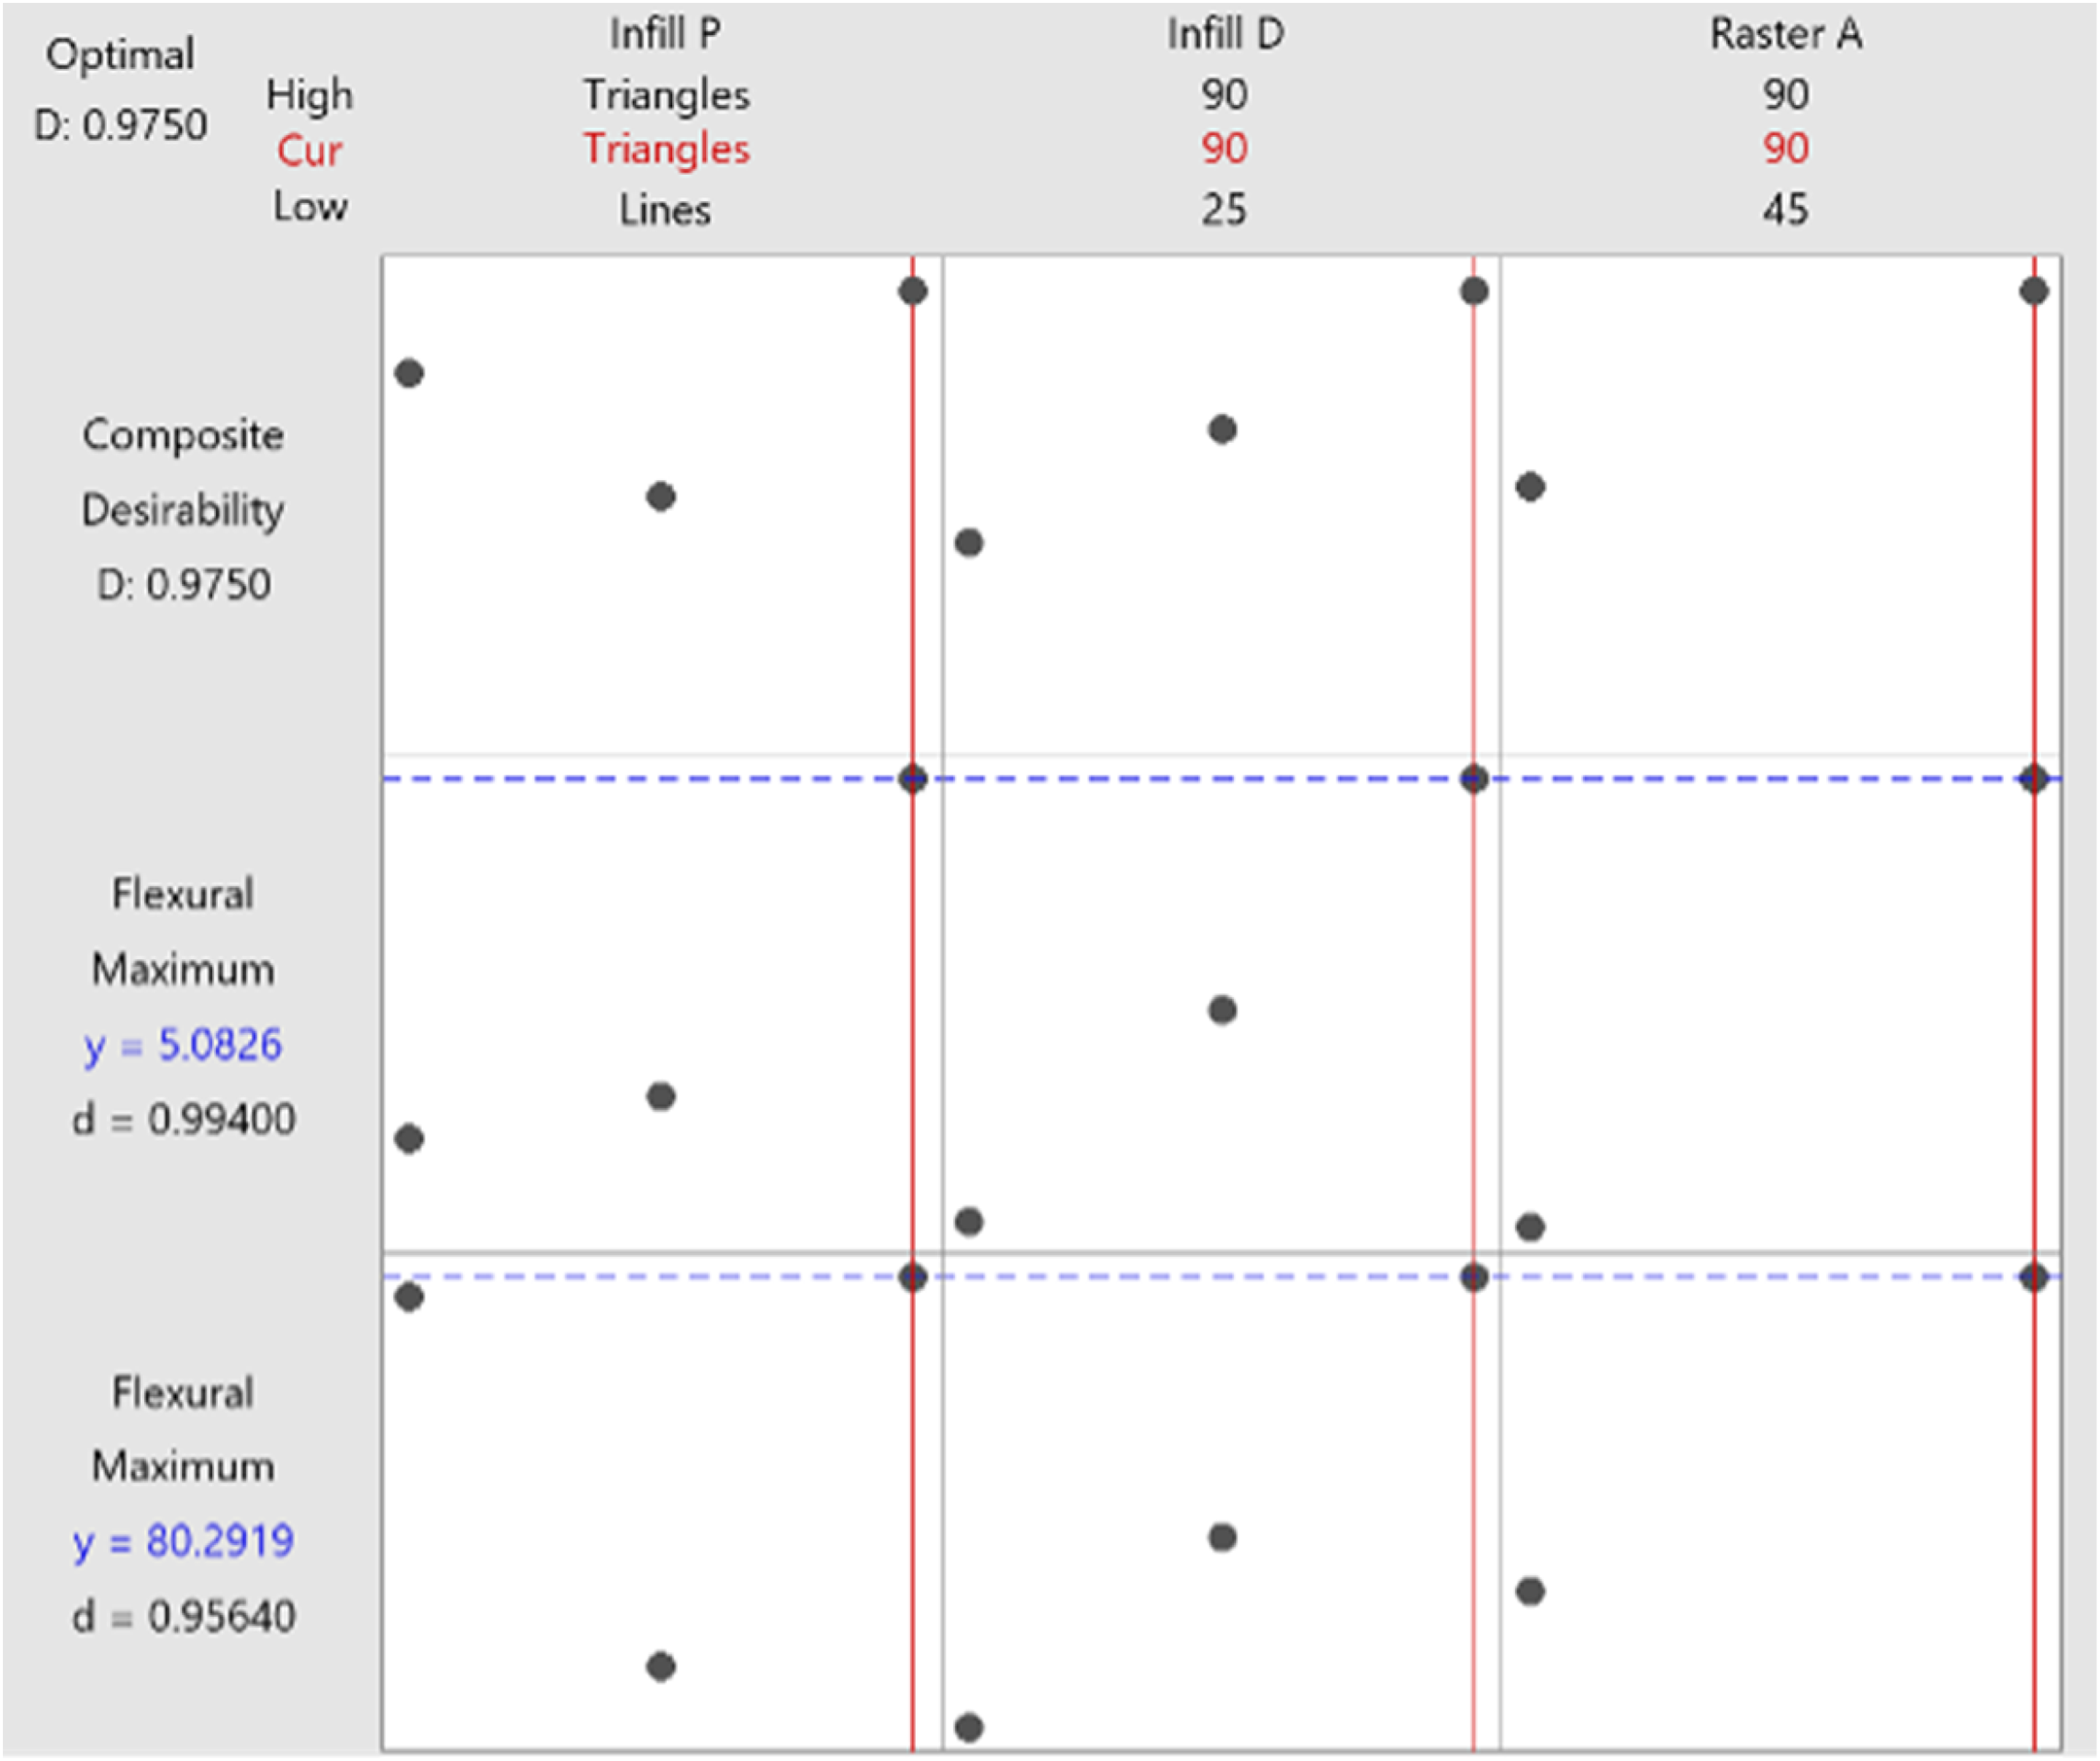
Figure 14 shows the impact of the parameters on the mean flexural strength and stiffness. Flexural strength increases with increasing fill density, probably due to reduced material porosity, which contributes to more consistent material properties that resist deformation under stress (Figure 14(a)). The fill patterns show varied responses, with triangular patterns exhibiting the highest flexural strength, highlighting how the geometric arrangement influences the distribution of the material and the resistance to stress. The angle of the raster significantly affects the flexural strength and stiffness, with stress levels markedly increasing at an angle of 90°, indicating an optimal alignment of the load bearing with the applied force direction (Figure 14(a)). Figure 15 explores the effect of the interactions on flexural properties. At lower densities, the infill pattern does not significantly affect flexural stiffness. However, at higher densities, the infill pattern has a notable impact on flexural stiffness and strength. The Triangle pattern produces the highest flexural strength and stiffness, while the concentric pattern exhibits the lowest flexural strength. Additionally, increasing the printing density and using a 90° raster angle enhances stiffness. MINITAB optimization toolbox was used to identify the optimal process parameters for the best results in flexural strength and stiffness. The optimized settings (Table 14) yielded maximum values of 5.1 GPa for flexural stiffness and 80.3 MPa for the maximum flexural stress, achieved with a fill density of 90%, a triangle pattern, and a 90
°
raster angle. This finding is consistent with the results presented in Ref. 31, which demonstrate that increasing the infill density in a triangular infill pattern leads to an increase in flexural stiffness. The composite desirability for the analyzed case is 0.97. This high value indicates that the combination of parameters selected performs exceptionally well in meeting the optimization goals for flexural stiffness and strength. The composite desirability plot (Figure 16) effectively illustrates how the combined desirability changes with variations in the parameters, specifically Infill Pattern, Infill Density, and Raster Angle. main effects plots for (a) flexural stress, (b) flexural stiffness. Main effects plots for (a) maximum flexural stress, (b) flexural stiffness. Optimized parameter set. Composite desirability plot for the flexural stiffness and maximum flexural strength.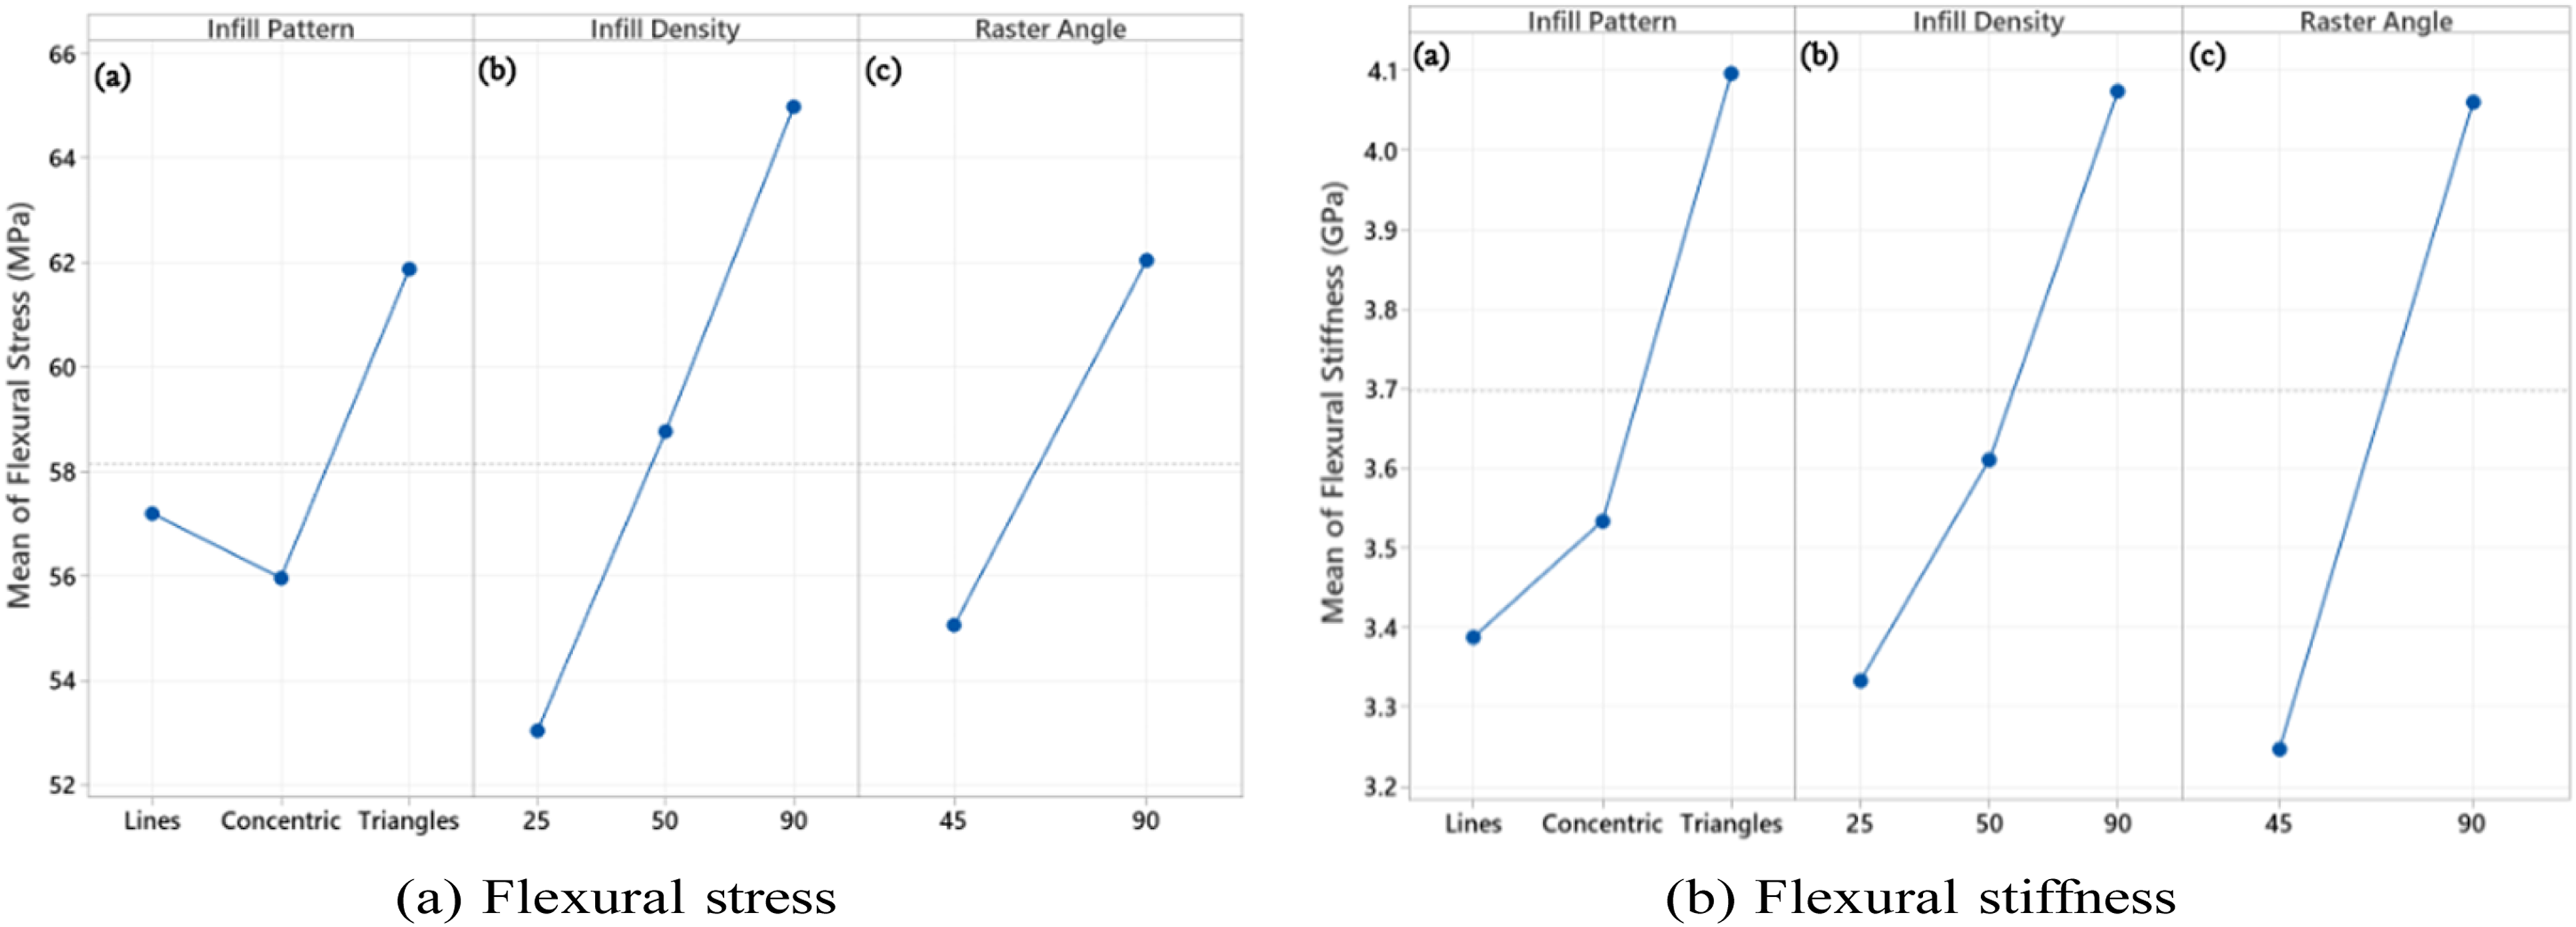
Conclusion
This study presents a comprehensive investigation into the warpage and mechanical behavior of thermoplastic composites fabricated using FDM. The research integrates both experimental and numerical approaches, utilizing Digimat-AM’s high-fidelity thermomechanical simulations to provide an accurate prediction of warpage while systematically analyzing the effects of key process parameters, including infill density, infill pattern, printing orientation, and raster angle. The key findings and contributions of this study include • The study demonstrates that a Line infill pattern, 25% infill density, flat printing orientation, and a 90° raster angle significantly reduce warpage thereby improving dimensional accuracy in FDM-printed components. • The results reveal that a concentric fill pattern at the 90% fill density with a 90° raster angle enhances tensile strength (46 MPa) and stiffness (2.5 GPa), while a triangular fill pattern with the 90% fill density at a 90° raster angle results in the highest flexural stiffness (5.1 GPa) and flexural strength (80.3 MPa). • ANOVA confirms the statistical significance of these factors, establishing a robust correlation between process parameters and warpage reduction, providing quantifiable evidence to optimize FDM printing settings. • In industrial applications, not only the magnitude of warpage but also its distribution on the part is critical. Even a lower warpage value can cause significant misalignment in an assembly, making warpage mapping an essential consideration in process optimization.
Although previous work has primarily investigated thermal management strategies or alternative toolpath modifications, this study systematically examines multiple printing parameters and employs high-fidelity thermomechanical simulations to achieve a precise warpage prediction. The incorporation of a comprehensive analytical framework, supported by statistical validation using ANOVA, further enhances the robustness of the findings.
By optimizing key FDM process parameters, such as infill density, infill pattern, printing orientation, and raster angle, the proposed methodology enables the fabrication of components with superior structural integrity and reduced warpage. These improvements not only improve mechanical performance but also contribute to cost-effective manufacturing by minimizing material waste and post-processing requirements. Although this study provides significant information on warpage minimization and mechanical optimization in FDM, more research is required to expand its applicability and address the remaining challenges. Potential future directions include • Implementing machine learning algorithms for real-time optimization of FDM process parameters, allowing adaptive control strategies that dynamically adjust printing conditions to minimize defects and maximize mechanical performance. • Exploring the integration of multi-material printing techniques with optimized FDM parameters to enhance functionality and performance in composite structures.
In conclusion, this research provides a new and systematic approach to minimize warpage in FDM printed thermoplastic composites, providing practical insight into process optimization, mechanical performance enhancement, and dimensional accuracy improvement, thereby addressing key limitations observed in previous studies.
Footnotes
Declaration of conflicting interests
The author(s) declared no potential conflicts of interest with respect to the research, authorship, and/or publication of this article.
Funding
The author(s) received no financial support for the research, authorship, and/or publication of this article.
Data availability statement
Data sharing not applicable to this article as no datasets were generated or analyzed during the current study.