
Abstract
The effect of Multi-Walled Carbon Nanotubes (MWCNT) and the selective localization of MWCNT on the electrical properties of sPS/PET/graphite composites was investigated. Incorporating MWCNTs into PET/graphite and sPS/graphite composites resulted in increased electrical conductivities. The conductivity increase was significant in PET/graphite, while it was marginal in sPS/graphite. This difference is attributed to the different affinity of MWCNT with PET and sPS. In PET/graphite composites, MWCNTs were well dispersed in the PET phase, whereas they formed numerous agglomerates in the sPS phase of sPS/graphite composites. Surface-treated MWCNTs exhibited more well-dispersed structures in the PET phase, leading to higher electrical conductivity in the PET/graphite composite compared to non-treated MWCNTs. Upon incorporation into sPS/PET/graphite composites, MWCNTs tended to selectively localize in the PET phase due to their higher affinity with PET than sPS. This selective localization resulted in a more concentrated conductive path and increased electrical conductivity of the composite. Through both surface treatment of MWCNT and selective localization, the electrical conductivity of sPS/PET/graphite composites was significantly enhanced without compromising the mechanical and processability aspects of the composites.
Keywords
Introduction
A fuel cell is being considered as an alternative power source to conventional fossil fuels to mitigate and eliminate global warming. One of various types of fuel cells, the polymer electrolyte membrane fuel cell (PEMFC), is a very promising power source for residential and mobile applications. Despite its importance, the commercialization of PEMFC is mainly hindered by its high manufacturing cost, with the bipolar plates being one of the most expensive components.1–3 Therefore, cost reduction of the bipolar plates is essential for the commercialization of PEMFC.
Various kinds of materials have been tried for bipolar plate applications. Several metallic alloys have been investigated in the literature.4–8 Since metallic bipolar plates undergo corrosive processes in the PEMFC environment,2,9,10 protective coating of the metallic bipolar plate is necessary, which increases the manufacturing cost of the PEMFC. Graphite bipolar plates are advantageous over metallic bipolar plates in terms of corrosion resistance. The bipolar plate has gas flow channels on both sides, and the channels are created via CNC machining. The high fabrication cost of the gas flow channel with a complex shape is an obstacle to mass production. In order to avoid the high production cost of the graphite bipolar plate, direct molding methods of polymer/graphite composites, such as compression, transfer, and injection molding processes, have been investigated for the complex-shaped geometry.11–13
Since the bipolar plate should be electrically conductive, the graphite concentration in the composite should be high enough. However, this consequently increases the viscosity of the composites and reduces their processability, which is not favorable for high-speed processing. Reducing the solid fraction (i.e., graphite fraction) decreases the viscosity of the composite, as well as the electrical conductivity of the composite. Therefore, reducing the viscosity of the composite without sacrificing electrical conductivity is desirable, and can be achieved by incorporating small amounts of anisotropic conductive fillers, such as carbon nanotubes (CNTs).
Many researchers have studied the electrical conductivity and mechanical properties of polymer/graphite composites. Various types of graphite, such as synthetic graphite, natural graphite, expanded graphite (EG), and expandable graphite, have been investigated. Achieve high electrical conductivity in polymer/conductive filler composites, the conductive fillers must be well dispersed and form a conductive path. In polymer/graphite composites, a large graphite phase is surrounded by a continuous polymer phase. By dispersing another conductive filler with a well-dispersed structure in the polymeric phase, a synergistic effect can be obtained. Du et al. observed a synergistic effect by mixing EG and carbon black (CB). 14 Several studies have also shown a significant increase in electrical conductivity by incorporating small amounts of MWCNTs into polymer/graphite composites.15–17 For example, Antar et al. observed a significant increase in electrical conductivity by incorporating MWCNTs into polylactic acid/EG. 15 They incorporated a relatively large amount of MWCNTs, adding half the amount of graphite. Wasuthon et al. investigated the electrical conductivity of natural rubber/graphite/MWCNT composites. They fixed the amount of MWCNTs at 3 phr and varied the amount of graphite from 5 to 50 phr. 16 It was observed that MWCNTs increased the electrical conductivity of the composite by about 1000 times. Dakate et al. observed a significant increase in electrical conductivity by incorporating 2% MWCNTs into phenolic thermosetting resin-graphite composites. 17 Previous studies have shown that the incorporation of small amounts of MWCNTs into polymer/graphite composites significantly increases conductivity, but no studies have incorporated surface-treated MWCNTs. 18
Carbon-based fillers tend to aggregate due to their low affinity with polymers, making it difficult to achieve high electrical conductivity.19,20 For instance, in polymer/graphite/CNT composites, the CNTs become entangled around the graphite particles and do not disperse well in the polymeric phase. To address this problem, many researchers have attempted to improve the dispersion of conductive fillers through surface treatment of the conductive fillers. Most of these studies investigated the polymer/surface-treated conductive filler composites, not polymer/graphite/surface-treated conductive filler composites.
In this study, we have devised a new technique to increase the conductivity of the polymer/graphite composite. We investigated the effect of surface-treated MWCNTs on the electrical conductivity, mechanical properties, and rheological properties of PET/graphite composites. We found that a very small amount of the γ-ray irradiated MWCNTs greatly increases the conductivity of the composite, with only a slight increase in the viscosity of the composites. Furthermore, while many studies have shown a decrease in the percolation threshold due to the selective localization of MWCNTs in binary polymer blends, no studies have shown a significant increase in electrical conductivity due to the selective localization of MWCNTs in polymer blend/graphite composite. We investigated the selective localization of MWCNTs in sPS/PET/MWCNT/graphite composite. When MWCNTs are incorporated into immiscible polymer blends, they are located selectively in one phase or at the interface. The selective localization in one phase is known to be an efficient way to reduce the percolation threshold, specifically when the polymer containing the MWCNTs shows a continuous phase. Therefore, the selective localization of MWCNTs in PET or sPS is crucial in the conductivity of the sPS/PET/MWCNT/graphite composite. We investigated the effect of the weight ratio of sPS/PET on the selective localization, the electrical conductivity of the sPS/PET/MWCNT/graphite composite, and the rheological properties of the composites. Ultimately, we found an optimum composition that provides the highest electrical conductivity of the composite and the processability that allows the injection molding with the sPS/PET/MWCNT/graphite composites.
Experimental
Materials
Synthetic graphite (grade name: Cond 20, Graphit Kropfmühl GmbH, Germany) powder used in this study has a density of 2.25 g/cm3 and an average particle size of 21 μm. Commercially available multi-walled carbon nanotubes (MWCNTs) (Nanocyl™ NC7000, Nanocyl SA, Belgium; thin MWCNT, 90% carbon purity, average diameter: 9.5 nm, average length: 1.5 μm), synthesized by catalytic carbon vapor deposition, were used in this work. Polyethylene terephthalate (PET) (SKYPET-BB8055, SK Chemicals, S. Korea; density: 1.40 g/cm3, intrinsic viscosity: 0.8 cm3/dg) and syndiotactic polystyrene (sPS) were used as binder polymers. sPS (weight-average molecular weight = 613 kg/mol, polydispersity index = 2.2) was synthesized via stereospecific polymerization using a cyclopentadienyl trichlorotitanium/methylene aluminoxane catalyst in our group. The sPS exhibited a melting temperature (Tm) of 275°C, as measured by differential scanning calorimetry (DSC).
Preparation of Surface-Treated MWCNTs by γ-Ray Irradiation: MWCNT powder was directly irradiated with a 60Co γ -ray source (1.17, 1.33 MeV per atom) under a dry O2 atmosphere to induce oxygen-containing functional groups on the surface of the MWCNTs. The γ -ray irradiation dose was 30 kGy over 2 hours. The irradiation process was carried out using high-level γ-ray irradiation equipment at the Korea Atomic Energy Research Institute. Subsequently, the term “γ-ray irradiated MWCNT” was replaced with “γMWCNT.”
Preparation of sPS/PET/MWCNT/graphite composites
The conducting composites were prepared by melt mixing. Prior to compounding, PET pellets were ground in a laboratory grinding mill (Polymix
For example, the notation [(PET/MWCNT)T sPS]B/graphite represents a protocol in which MWCNTs were first compounded with PET in a twin-screw extruder (denoted by the subscript T). The resulting PET/MWCNT blend was then compounded with sPS in an internal batch mixer (denoted by the subscript B). Finally, the [(PET/MWCNT)T sPS]B blend was compounded with graphite in an internal batch mixer. Since the graphite content in the composites studied was very high (70–90 wt%), the final step of incorporating graphite into the composite was performed using an internal batch mixer.
The twin-screw extruder used was a lab-scale co-rotating twin-screw extruder (Bautek BA11™ R, L/D = 400/11 mm/mm, Gyeonggi, S. Korea), operated at 150 rpm and 280°C. The internal batch mixer used was a Haake PolyLab QC-3000 (Thermo Fisher Scientific, USA), operated at 120 rpm and 280°C for 10 minutes.
Throughout the text, the numbers in the sample codes denote the mass ratio of each component. For example, [(sPS/MWCNT)TPET]B(49/2/49) refers to a composite containing 49 wt% sPS, 2 wt% MWCNT, and 49 wt% PET.
Solvent immersion test
To determine the phase in which the MWCNTs are located within the sPS/PET blends, a solvent immersion test was performed. Initially, the sPS/MWCNT composite was prepared using a twin-screw extruder. The resulting sPS/MWCNT was then compounded with PET in an internal batch mixer for varying mixing times to fabricate the [(sPS/MWCNT)TPET]B(49/2/49) blends. The mixing time was indicated as a subscript following the letter B in the sample notation. For instance, [(sPS/MWCNT)TPET]B18 indicates that the composite was mixed in the internal batch mixer for 18 minutes.
The prepared [(sPS/MWCNT)TPET]B(49/2/49) blends were immersed in hot phenol at 100°C. Hot phenol selectively dissolves PET but not sPS. Therefore, if the MWCNTs are predominantly located in the PET phase, the solution appears black due to the dispersed nanotubes. Conversely, if the MWCNTs are located in the sPS phase, the solution remains transparent.
Characterization
The composites were compression molded into discs with a diameter of 25 mm and a thickness of 1 mm. The in-plane electrical conductivities of the composites were measured using the four-point probe method (CMT-SR 1000N, Advanced Instrument Technology, South Korea).
Fracture surfaces of the samples were prepared by fracturing them in liquid nitrogen and subsequently coating the surfaces with platinum. Scanning electron microscopy (SEM) images of the composites were captured using a focused ion beam scanning electron microscope system (FIB-SEM) with a Mira-3 LMH (TESCAN, Czech Republic).
The flexural strength of the composites was tested at room temperature using a universal testing machine (Hounsfield H10KS, USA) at a crosshead speed of 1 mm/min. Specimens for the flexural tests were prepared in the form of rectangular bars with dimensions of 127 mm in length, 12.7 mm in width, and 3.2 mm in thickness.
Shear viscosities of the composites were determined using a capillary rheometer (Gottfert Rheo-Tester 2000, Germany) equipped with a capillary die of 4 mm diameter, 30 mm length, and a 45° entrance angle.
Results and discussions
Electrical conductivity of PET/graphite composites
Figure 1 shows the electrical conductivities of PET/graphite and PET/MWCNT/graphite composites as a function of graphite content. The conductivities of the PET/graphite composites increased with graphite content and with the addition of MWCNT. In this study, PET/MWCNT/graphite composites were prepared using a two-step method. Firstly, a PET/MWCNT (98/2) nanocomposite was fabricated, and then the nanocomposite was compounded with graphite at a predetermined ratio. Since ratio of PET/MWCNT was always set at (98/2) in the PET/MWCNT/graphite composites, the MWCNT contents in the composites were different with graphite contents. For example, MWCNT content is 0.2 wt% for the graphite content of 90 wt%, it is 0.4 wt% for the graphite content of 80 wt% and so on. It was observed that the addition of such a small amount of MWCNTs into the PET/graphite composites dramatically increased the conductivity of the composites at graphite contents of 85 and 90 wt%. However, at lower graphite contents (70, 75, and 80 wt%), the increase in conductivity by the incorporation of MWCNTs was marginal. Electrical conductivities of PET/graphite  , PET/MWCNT/graphite
  and PET/γMWCNT/graphite
  composites.
The electrical conductivity of the composites was significantly enhanced by the incorporation of γMWCNTs. The conductivity of the PET/graphite (1/9) composite increased more than two-fold by the addition of 0.2 wt% of γMWCNTs. This significant increase in conductivity is attributed to the enhanced dispersion of γMWCNTs and the formation of more conducting channels. Figure 2 shows SEM micrographs of the PET/graphite composites. It can be observed that there are a few agglomerates in the composite containing normal MWCNTs. On the contrary, such agglomerates are hardly visible in the composite with γMWCNTs. Many studies have reported that the dispersion of MWCNTs is enhanced by introducing functional groups on the surface of the MWCNTs.8,9,11,16 MWCNTs do not contain any polar functional groups, while PET has polar groups. Therefore, introducing polar functional groups on the MWCNT increases the affinity between MWCNT and PET. It is known that γ-ray irradiation under a dry O2 atmosphere introduces several polar functional groups, such as carbonyl and carboxylic acid, on the surface of MWCNTs.21,22 SEM micrographs of (PET/MWCNT)/graphite(14.7/0.3/85) (A and B), (PET/γMWCNT)/graphite(14.7/0.3/85) (C and D) and (sPS/MWCNT)/graphite(14.7/0.3/85) nanocomposites (E and F). Micrographs A and B are from the same sample but were taken at different observation locations. The same applies to micrographs C and D, as well as to micrographs E and F.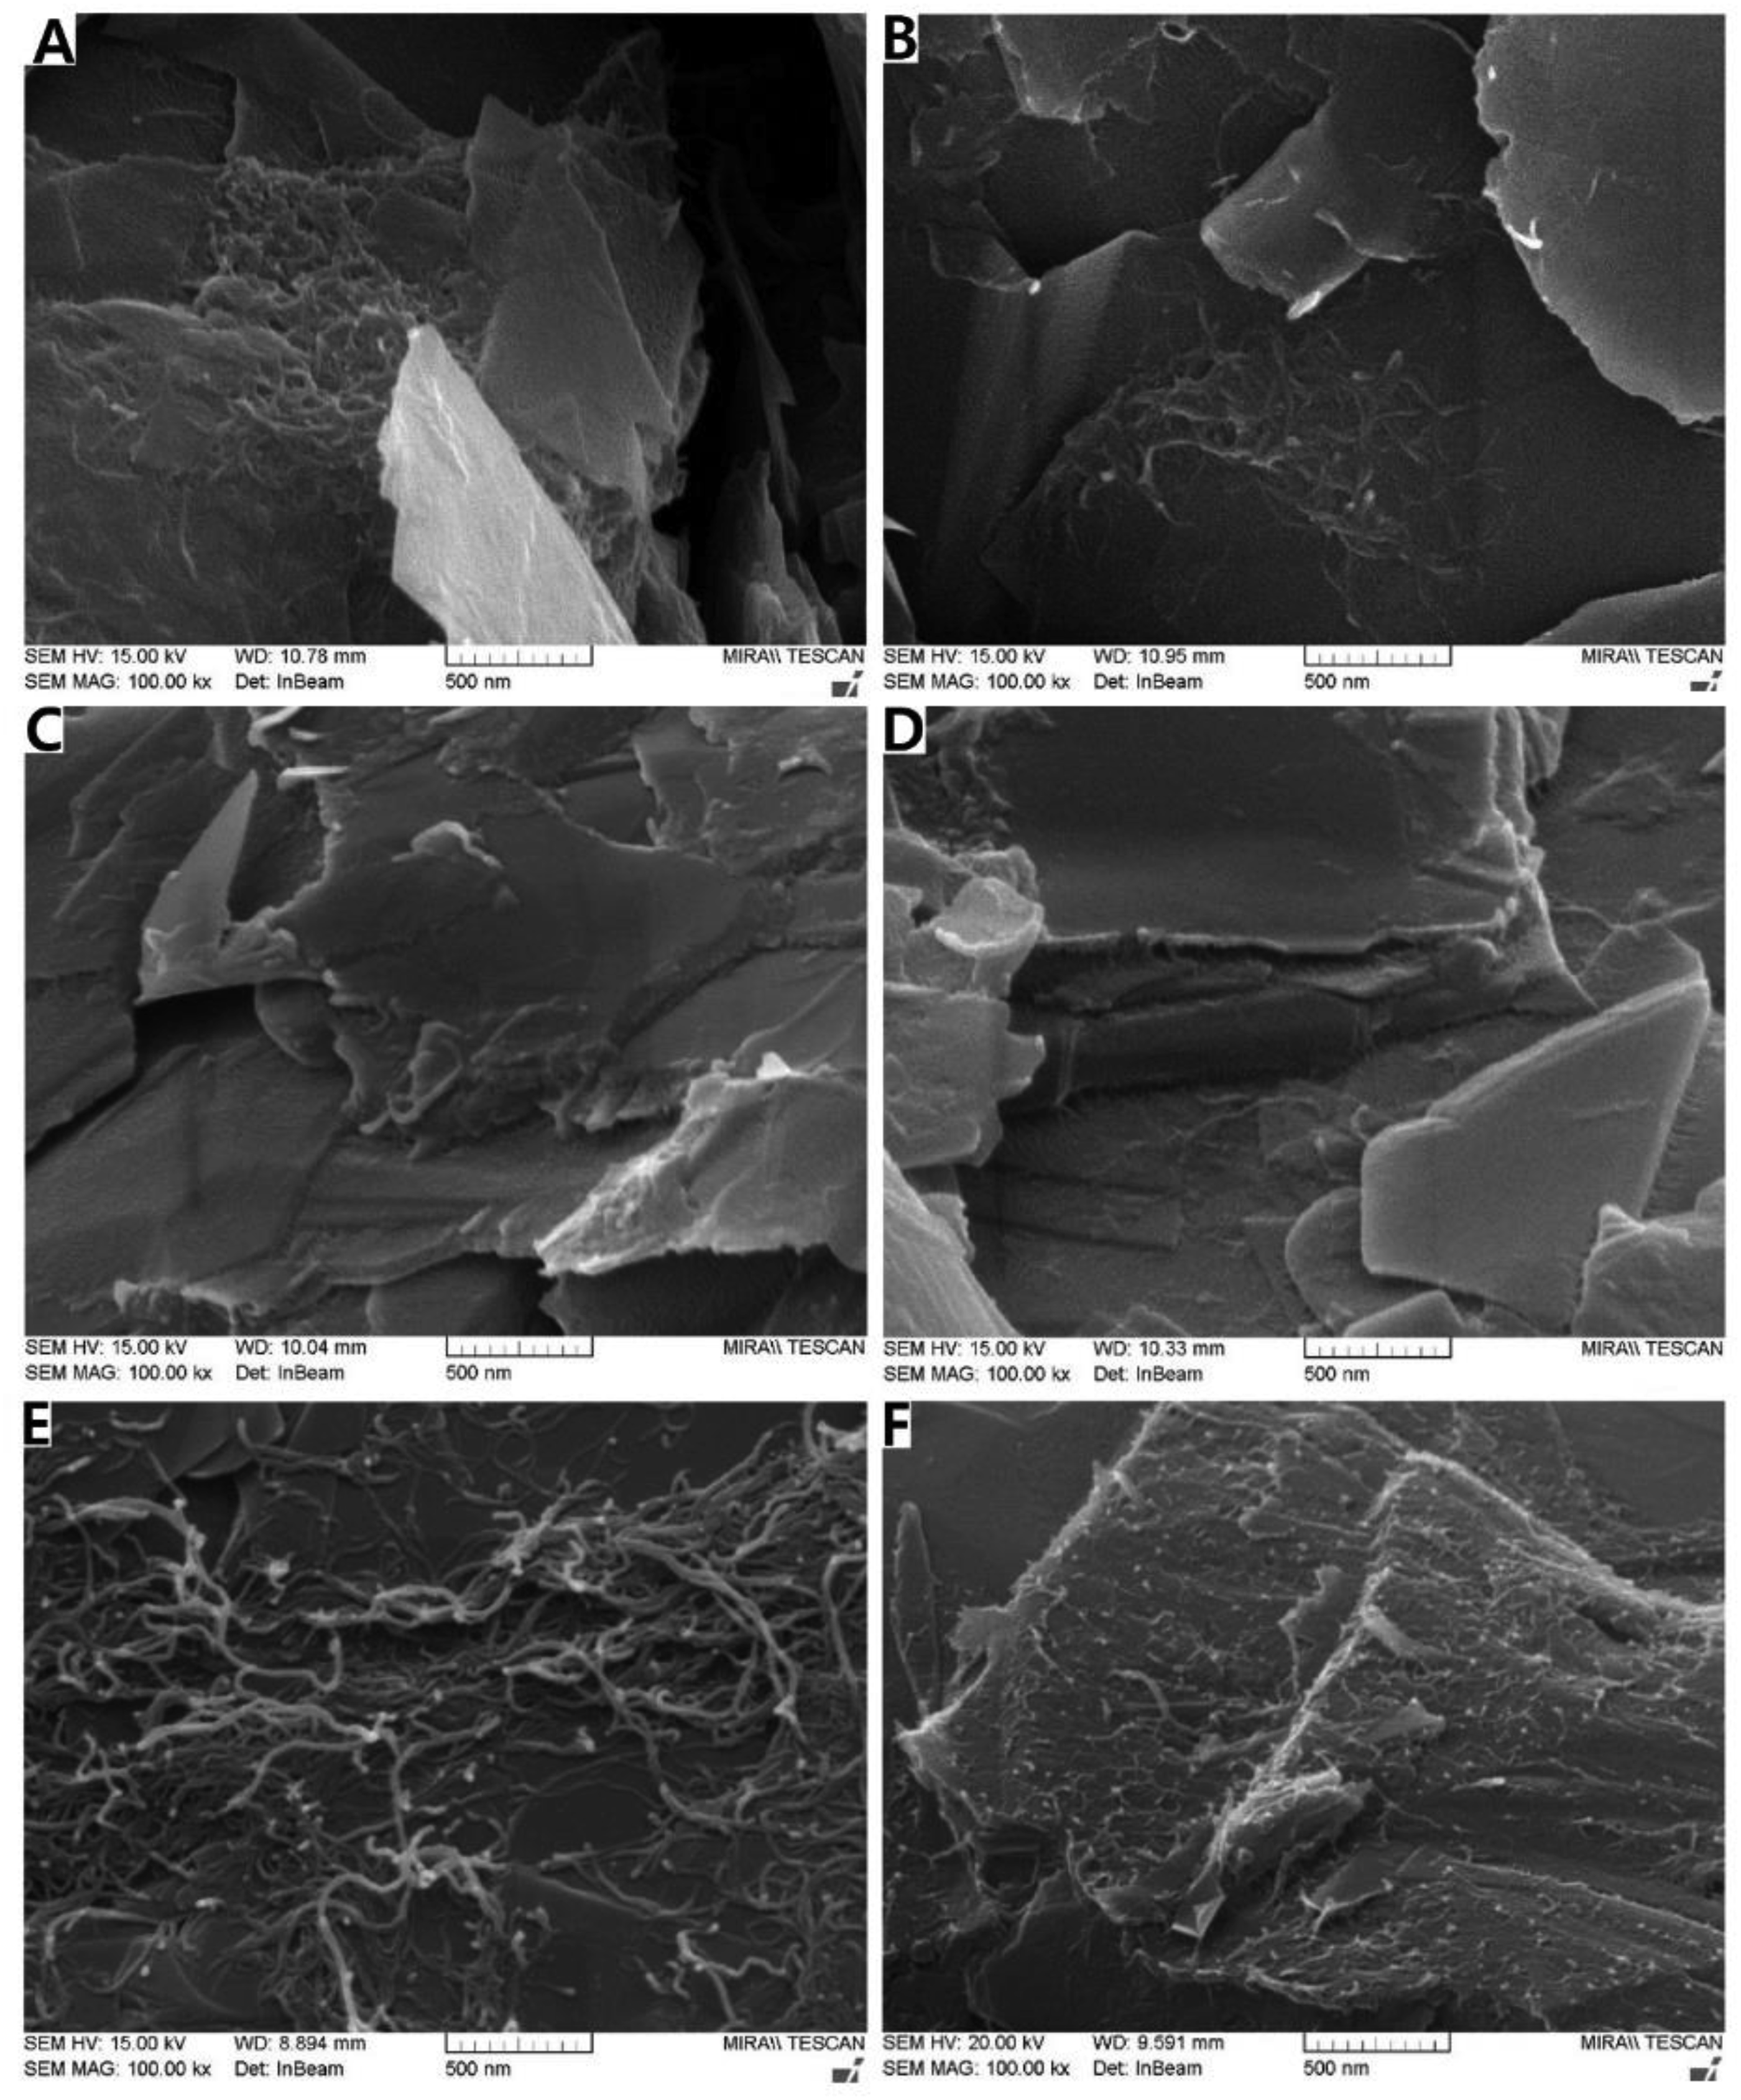
Flexural strength of PET/graphite composites
Figure 3 shows the flexural strength (FS) of PET/graphite composites as a function of graphite content. The FS of the composites decreased with the graphite content. The amount of binder polymer (PET) (10 ∼ 30 wt%) is not sufficient to impregnate the graphite particles, and this lack of impregnation became more severe as the graphite content increased. Consequently, the FS of the composites decreased with the graphite content. The addition of MWCNTs did not significantly affect the FS of the composites. Some studies have reported that the addition of MWCNTs to polymer/graphite composites can improve their FS.17,23,24 However, the increase of FS in those studies was marginal, and the amount of MWCNTs added was much higher than in our study. Moreover, the most decisive factor in the mechanical properties of particle-filled polymers is the adhesion strength. We expected that the γMWCNT would act as a compatibilizer in the PET/graphite composite, as the oxygen atoms on the γMWCNT can form hydrogen bonds with PET, and the rolled graphene of the MWCNT may have strong interactions with the graphene sheet in the graphite. However, the interaction between MWCNTs and graphite may be weak, as even the graphene sheets in graphite are stacked by weak van der Waals forces, so that Scotch tape can peel off the layer.
25
Flexural strength of PET/graphite, PET/MWCNT/graphite and PET/γMWCNTs/graphite composites.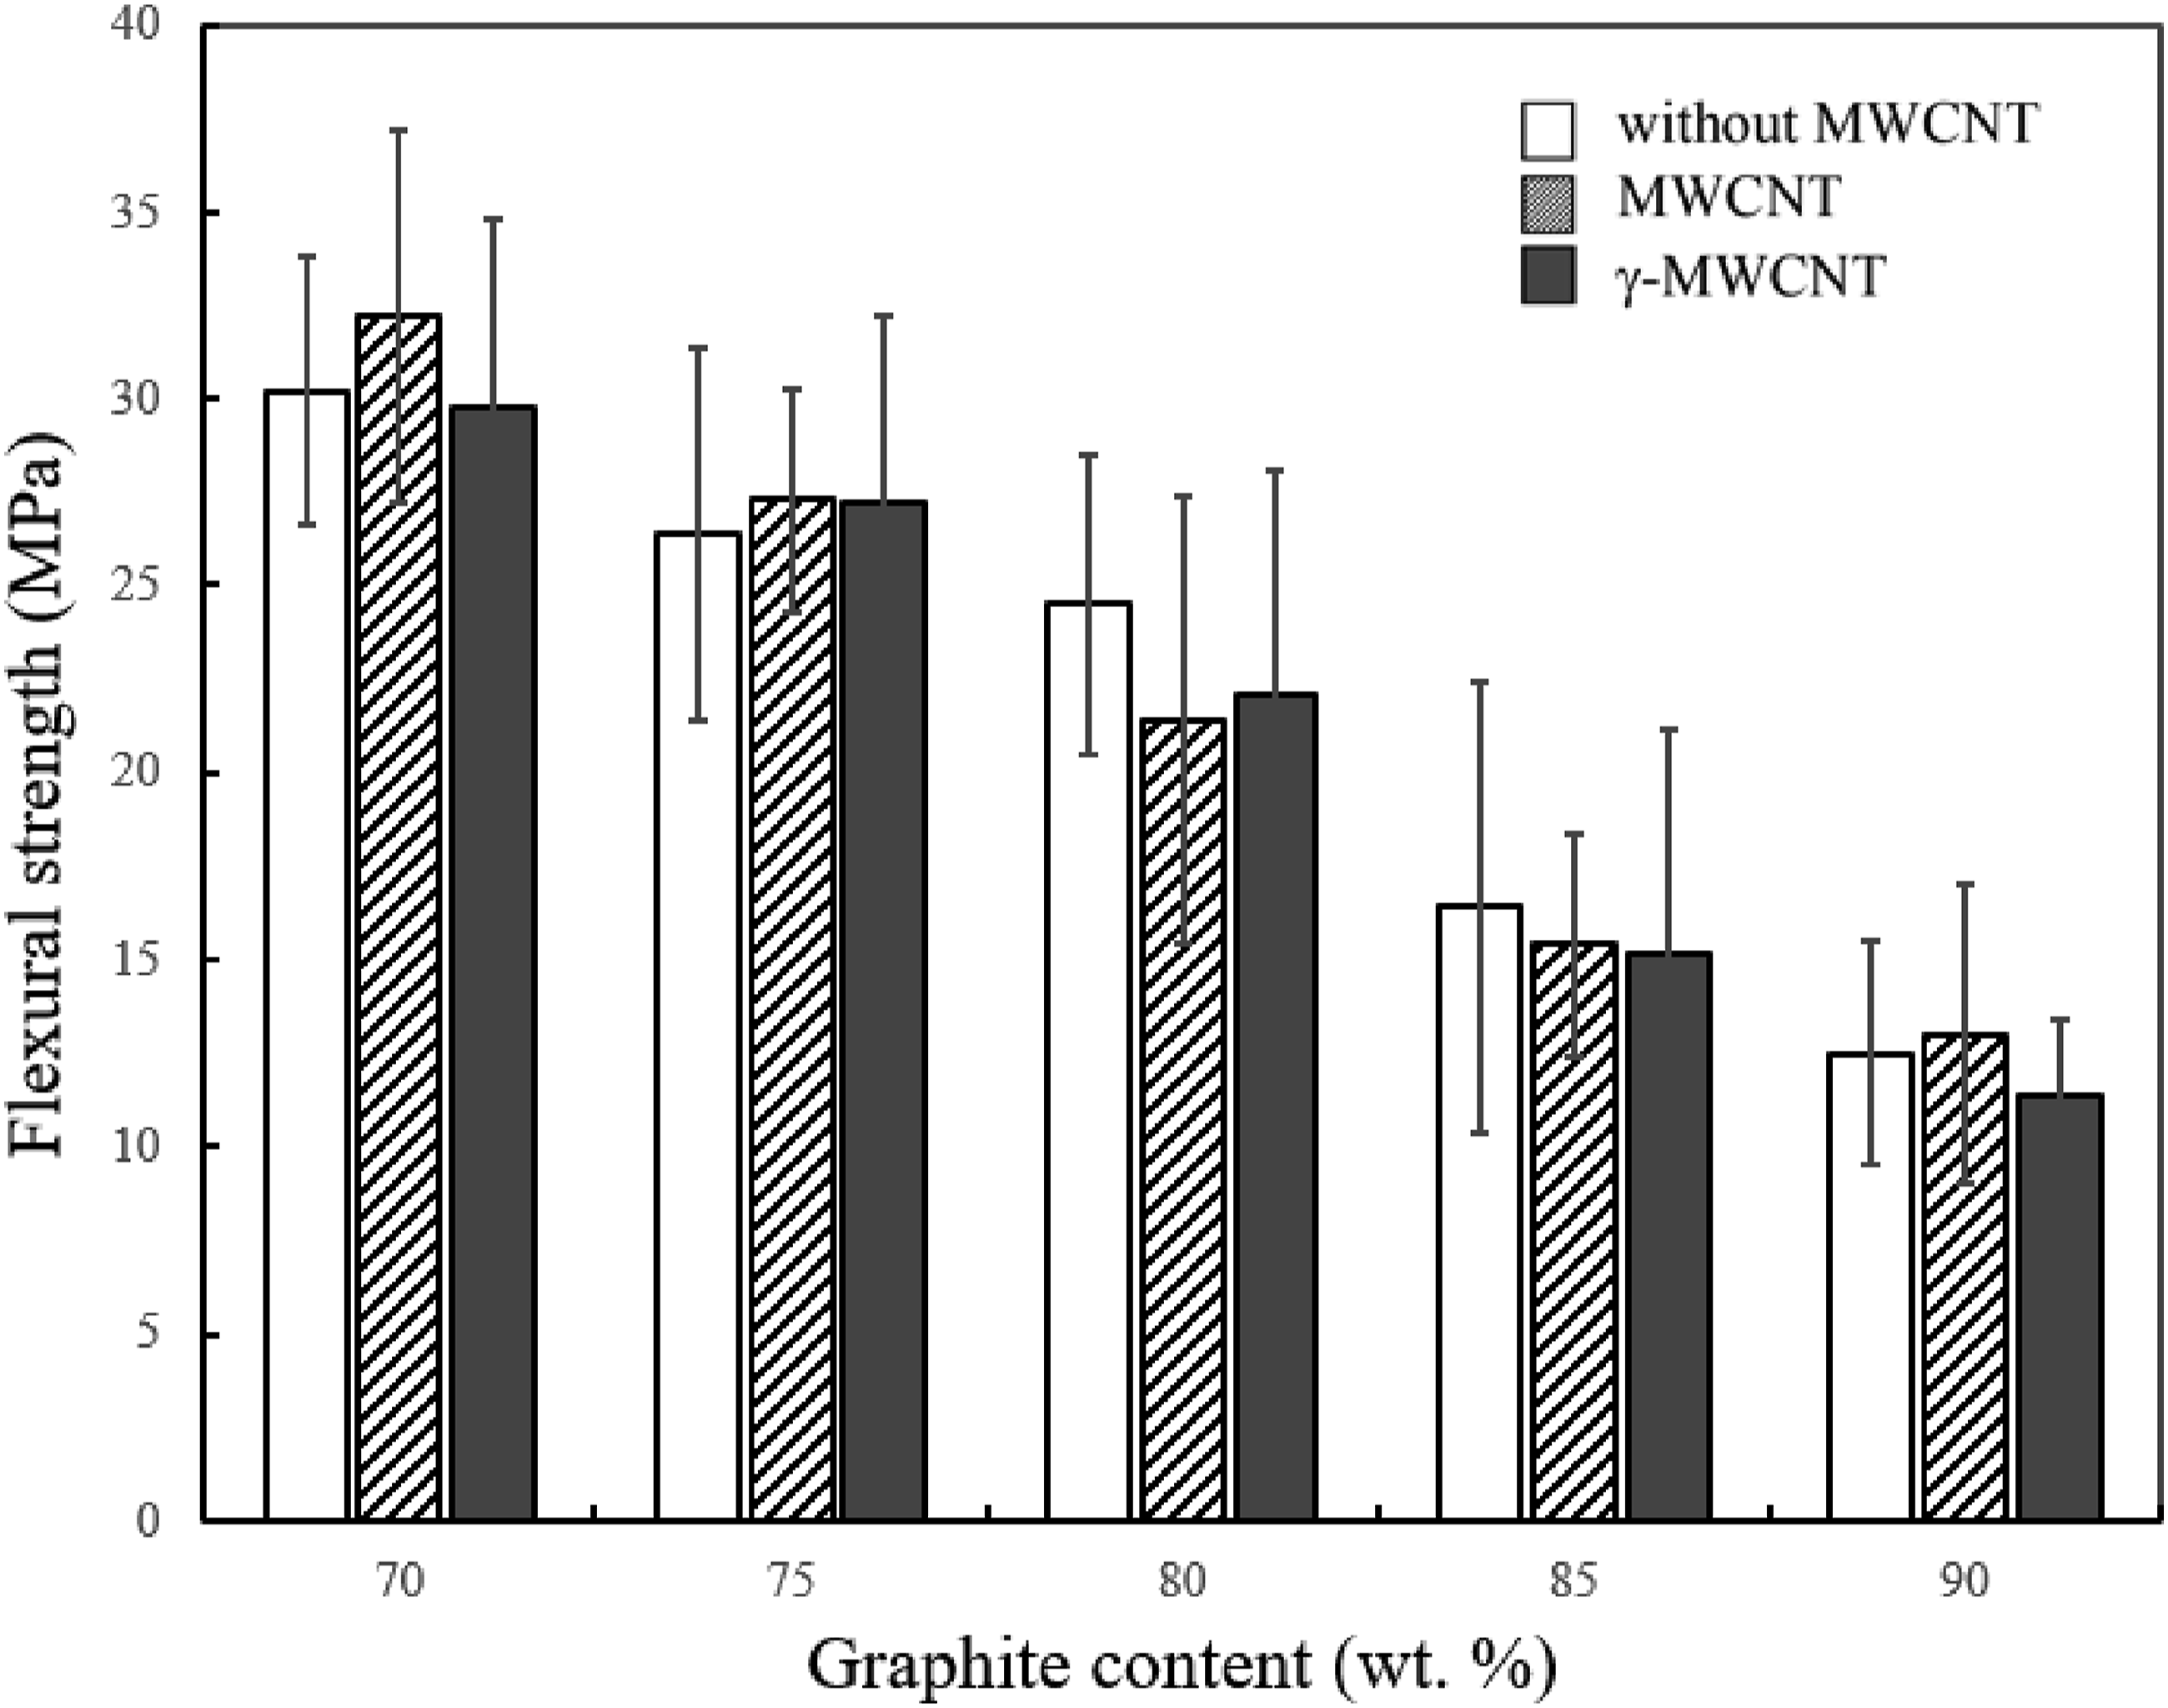
Electrical conductivity sPS/PET/graphite composites
Figure 4 shows the electrical conductivities of sPS/PET/graphite composites as a function of the sPS/(sPS + PET) ratio. An sPS/(sPS + PET) ratio of 0 corresponds to a composite with 85 wt% of graphite and 15 wt% of PET, while an sPS/(sPS + PET) ratio of 1 corresponds to a composite with 85 wt% of graphite and 15 wt% of sPS for (sPS/PET)/graphite (indicated by symbol Electrical conductivities of sPS/PET/graphite with and without MWCNTs by various mixing protocols. The graphite content of the composites was 85 wt%. The remaining 15 wt% are sPS, PET and MWCNTs. MWCNT contents were 0.3 wt% for the composites containing MWCNTs (indicated by circular and triangular symbols). ).
).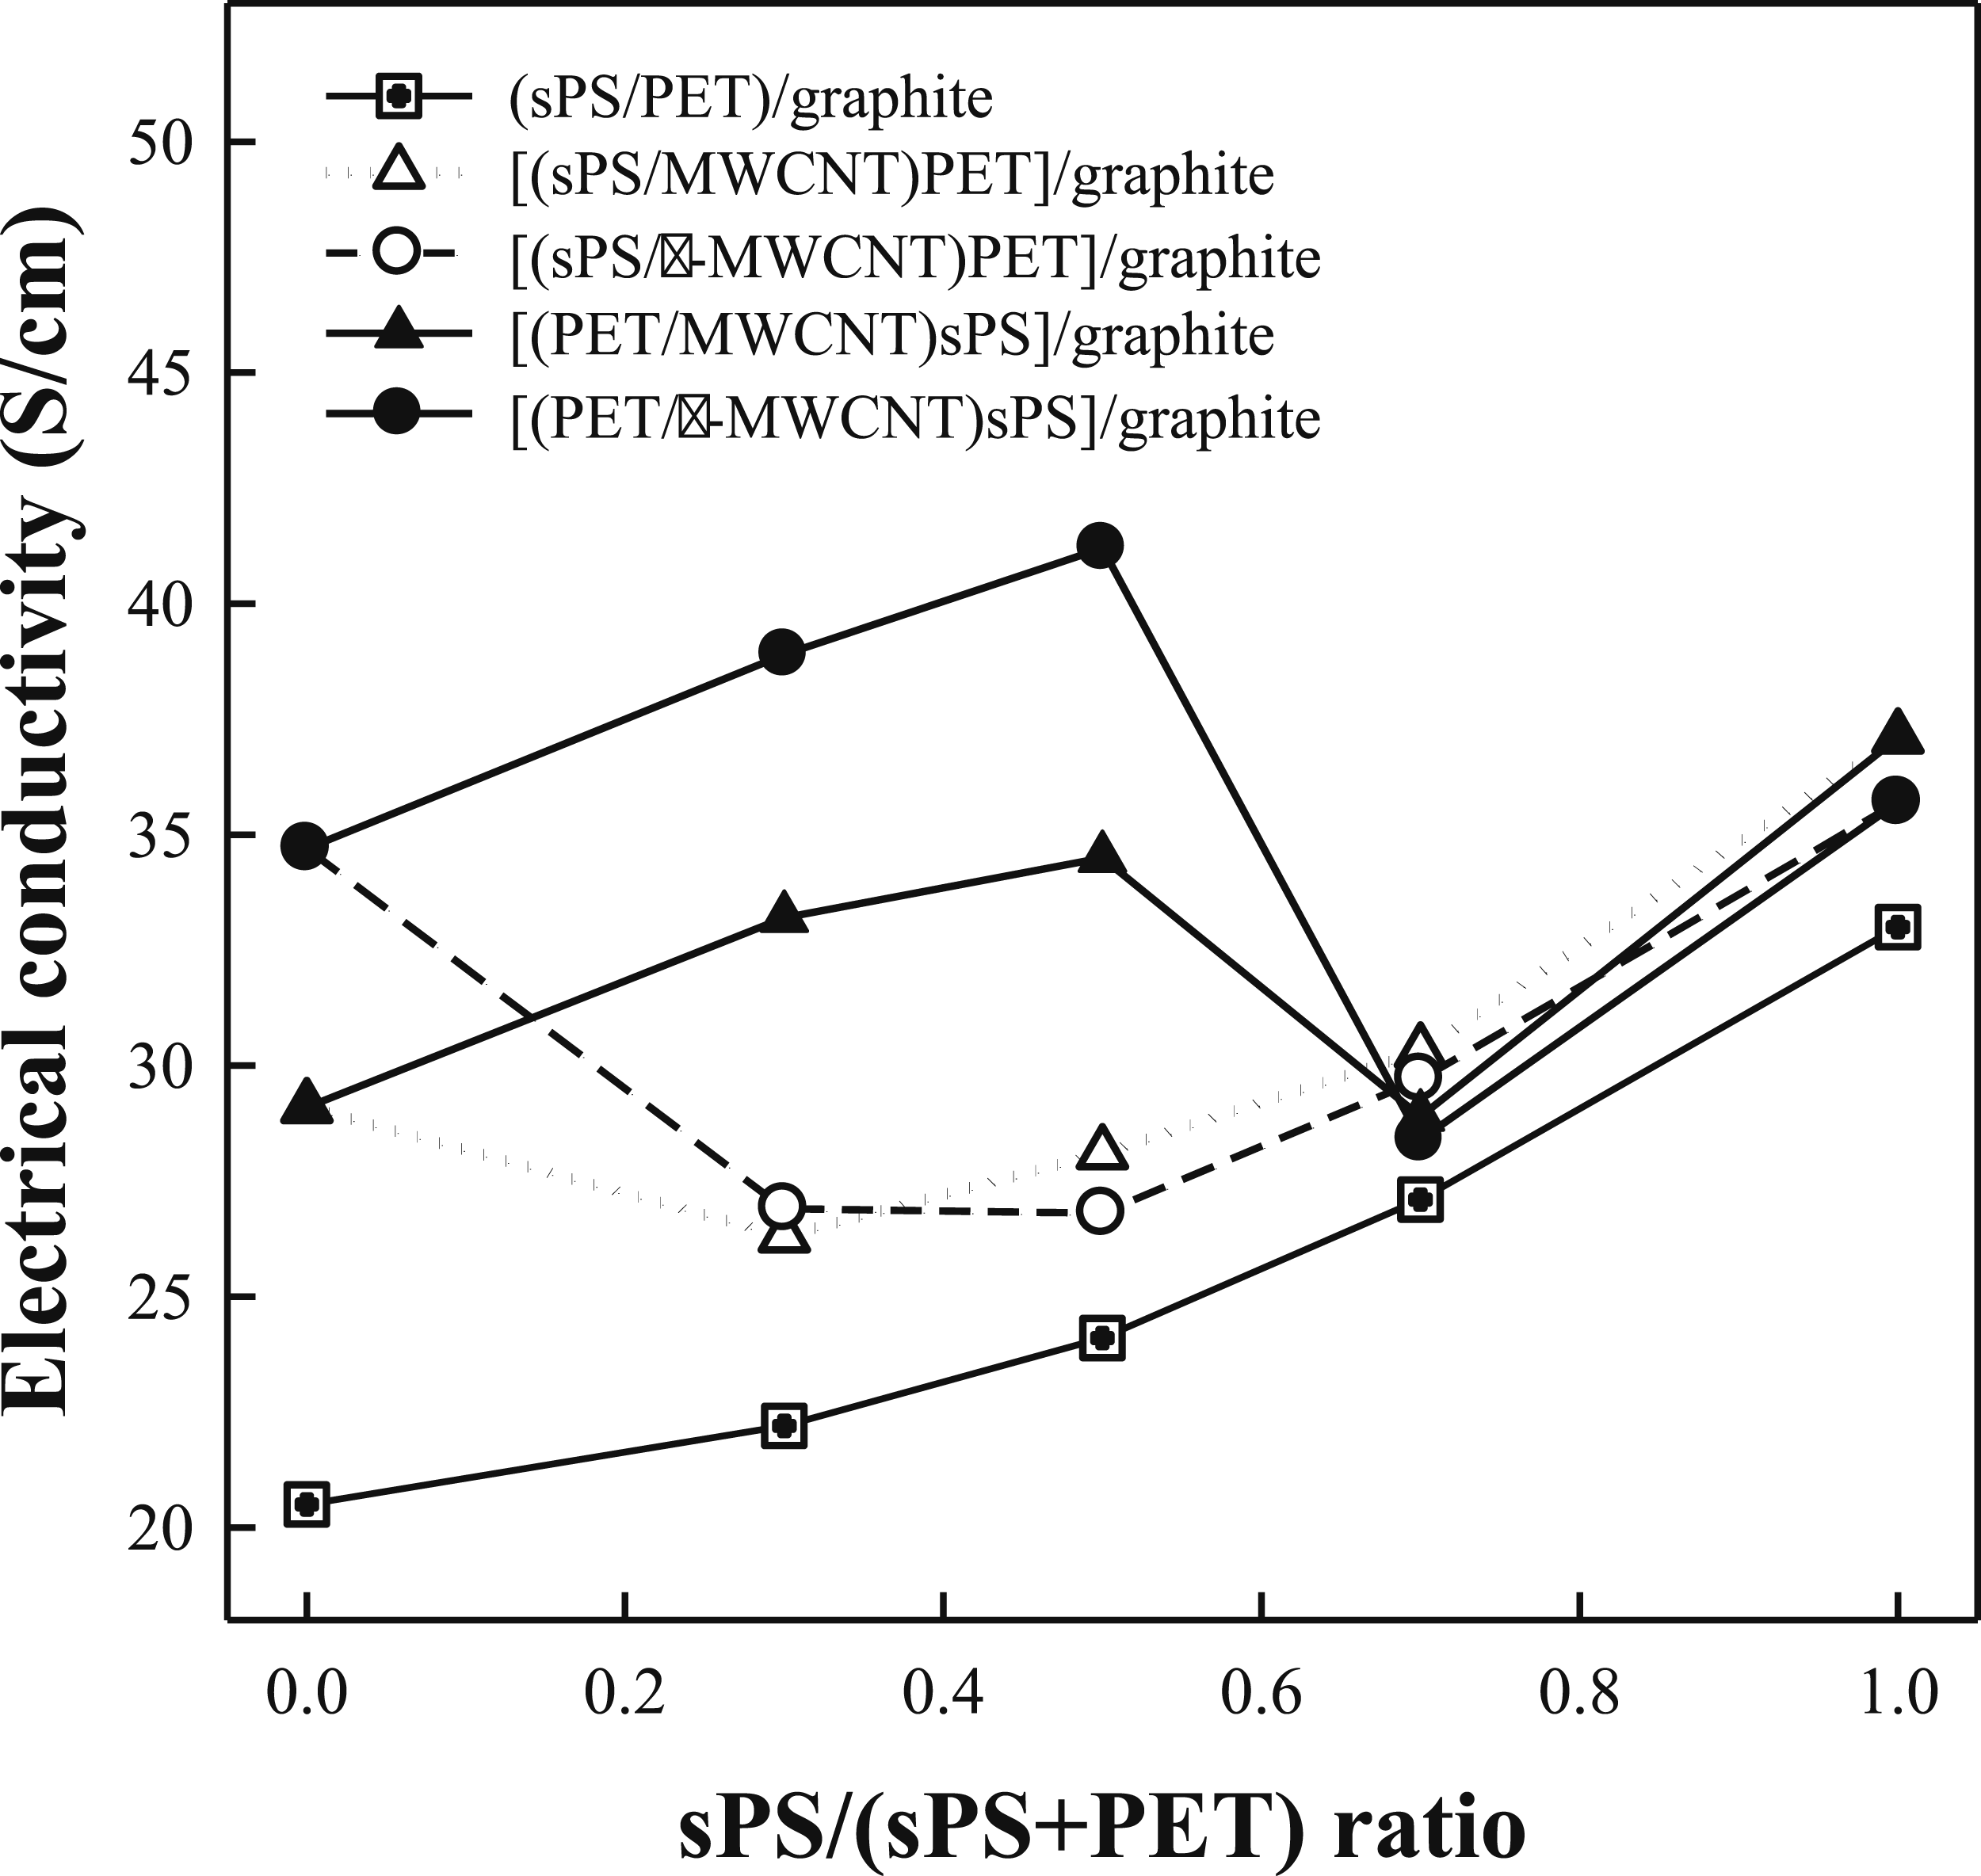
An sPS/(sPS + PET) ratio of 0.5 corresponds to a composite with 85 wt% of graphite, 7.35 wt% of PET, and 7.35 wt% of sPS and 0.3 wt% of MWCNT for composites containing MWCNTs. A binder content of 15 wt% is equivalent to 26.1 and 20.9 vol.%, respectively, when pure sPS and PET are used as a binder (with densities of sPS, PET, and graphite being 1.04, 1.4, and 2.1 g/cm3, respectively). Despite having a lower volume fraction of graphite, the sPS/graphite composite exhibited higher electrical conductivity than the PET/graphite composite. Additionally, the sPS/graphite composite provided lower viscosity than the PET/graphite composite, since the former exhibits a lower volume fraction of graphite, as shown in Figure 5. Therefore, sPS is a better binder than PET in terms of processability and conductivity in the composite without MWCNTs. Shear viscosity of PET/graphite(15/85), sPS/graphite(15/85) and [(PET/γMWCNT)sPS]/graphite(7.35/0.3/7.35/85) composite at 290°C.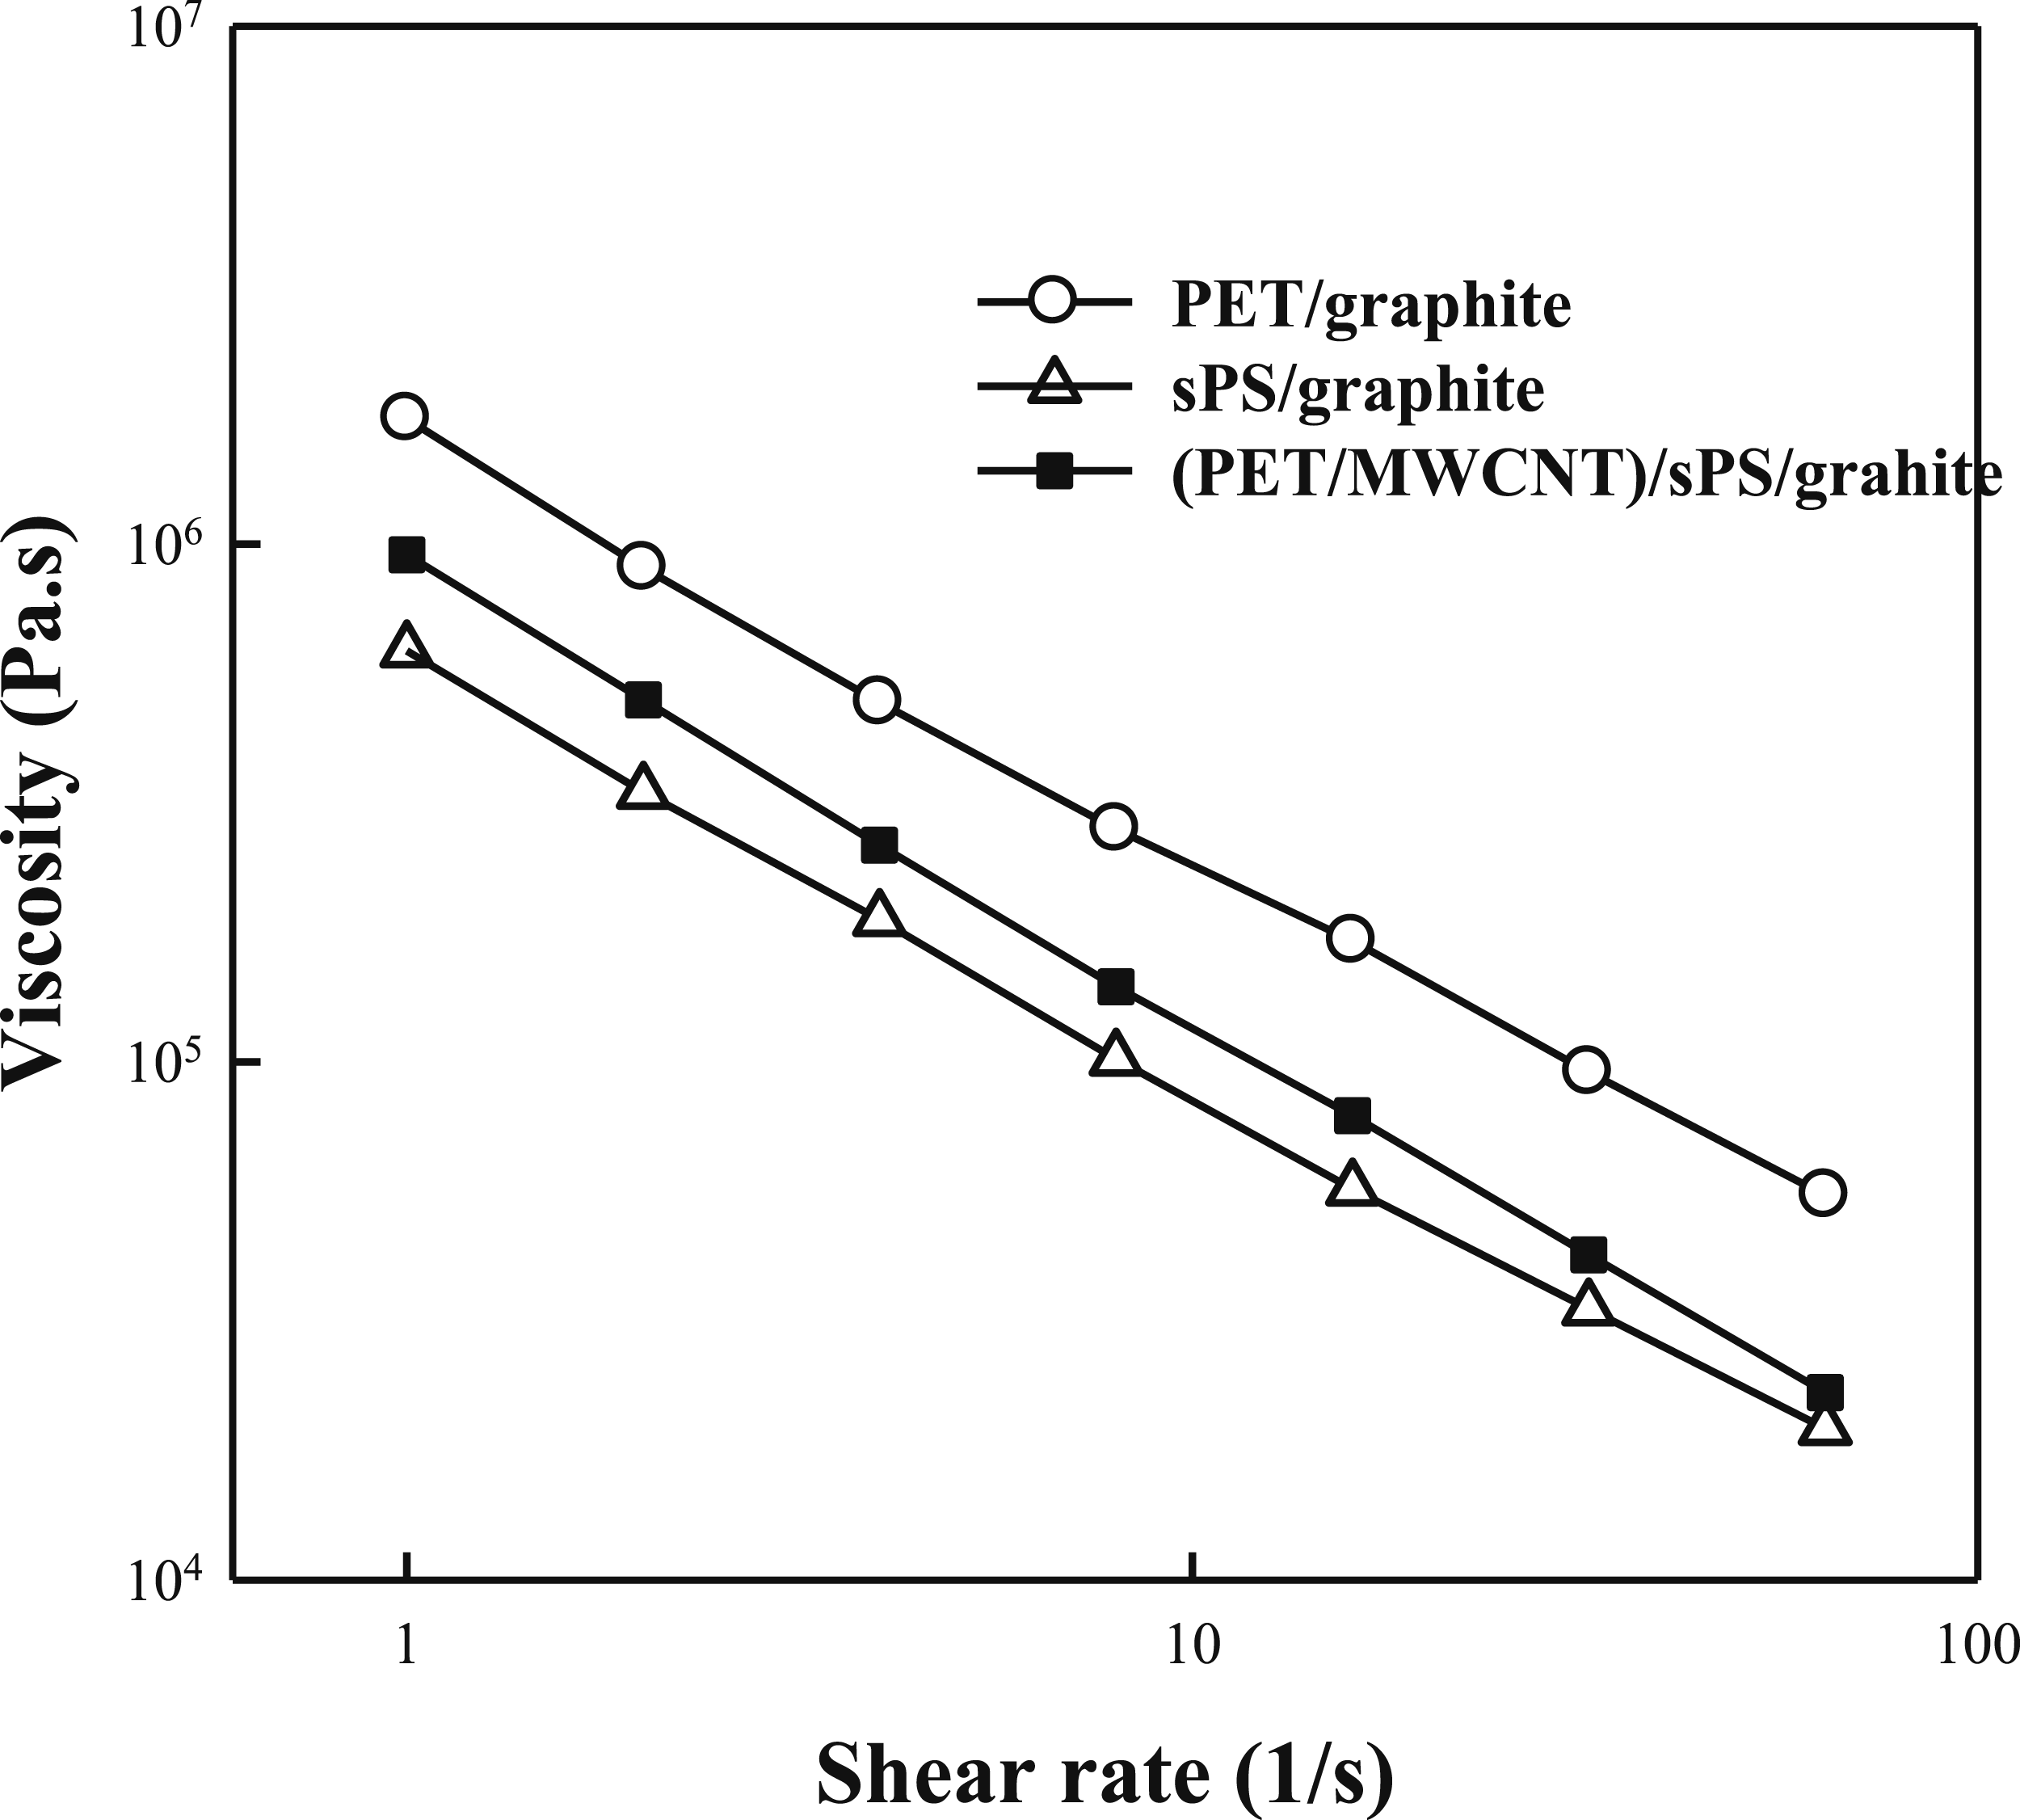
It is observed that the conductivity of the composite without MWCNTs (denoted by dotted rectangular symbols,  ) increases with the sPS/(sPS + PET) ratio, that is the conductivity of the composite increases with sPS content. Although sPS/graphite provides higher electrical conductivity than PET/graphite, the enhancement of the conductivity by incorporation of the MWCNTs is much smaller compared to PET/graphite. This is attributed to the difference in affinity. The Hidebrand solubility parameters for MWCNT, atactic PS, and PET are reported to be 20.9-22.5,
26
18.3-18.7,
27
and 20.5-21.9 MPa1/2,
27
respectively. The solubility parameter for sPS was not found in the literature. However, it is expected that the solubility parameters of sPS are not much different from that of atactic PS since they have identical chemical structures. Indeed, the SEM photograph (Figure 2) shows that the dispersion of MWCNT is more homogeneous in PET than in sPS.
) increases with the sPS/(sPS + PET) ratio, that is the conductivity of the composite increases with sPS content. Although sPS/graphite provides higher electrical conductivity than PET/graphite, the enhancement of the conductivity by incorporation of the MWCNTs is much smaller compared to PET/graphite. This is attributed to the difference in affinity. The Hidebrand solubility parameters for MWCNT, atactic PS, and PET are reported to be 20.9-22.5,
26
18.3-18.7,
27
and 20.5-21.9 MPa1/2,
27
respectively. The solubility parameter for sPS was not found in the literature. However, it is expected that the solubility parameters of sPS are not much different from that of atactic PS since they have identical chemical structures. Indeed, the SEM photograph (Figure 2) shows that the dispersion of MWCNT is more homogeneous in PET than in sPS.
Two different methods were used to incorporate MWCNTs into sPS/PET blends. Open symbols in Figure 4 (denoted by Schematics of the MWCNT location and structure for [(sPS/MWCNT)PET]/ graphite and [(PET/MWCNT)sPS]/graphite. (A) [(sPS/MWCNT)PET]/ graphite, (B) [(PET/MWCNT)sPS]/graphite, (C) Time evolution of MWCNT migration for [(sPS/MWCNT)PET]/graphite composite where both sPS and PET consist continuous phase. and
and  in the legend) represent a method where MWCNTs were first compounded with sPS, then the sPS/MWCNT was compounded with PET, and the (sPS/MWCNT)PET was finally compounded with graphite. Closed symbols (denoted by
  and
and  in the legend) represent a method where MWCNTs were first compounded with PET, then with sPS, and finally with graphite. It can be seen that [(PET/MWCNT)sPS]/graphite shows higher conductivity than [(sPS/MWCNT)PET]/graphite. Based on the estimation of solubility parameters and morphological abservation, it is evident that MWCNTs have a higher affinity with PET than with sPS. Therefore, MWCNTs tend to be located in the PET phase. If the MWCNTs pre-mixed with sPS in the first mixing step had migrated to the PET phase in the subsequent mixing step, [(sPS/MWCNT)PET]/graphite and [(PET/MWCNT)sPS]/graphite would have had the same conductivities. However, since the electrical conductivity of the [(sPS/MWCNT)PET]/graphite is lower than that of the [(PET/MWCNT)sPS]/graphite, it appears that the pre-mixed MWCNTs in the sPS phase did not completely migrate to the PET phase. It is presumed that the mixing time in the present study is not sufficient for the complete migration of the MWCNTs. As illustrated in Figure 6, it is presumed that the dispersion of MWCNTs in [(PET/MWCNT)sPS]/graphite is more homogeneous compared to that in [(sPS/MWCNT)PET]/graphite due to the higher affinity of MWCNTs with PET.
It is noteworthy that [(PET/MWCNT)sPS]/graphite at sPS/(sPS + PET) ratios of 0.3 and 0.5 shows higher conductivity than (PET/MWCNT)/graphite (data for closed triangular symbol at sPS/(sPS + PET) ratio = 0 in Figure 4) despite the same amount of MWCNTs incorporated. This is because all MWCNTs are selectively located in the PET phase for [(PET/MWCNT)sPS]/graphite, making them more concentrated conductive path in [(PET/MWCNT)sPS]/graphite compared to (PET/MWCNT)/graphite, as illustrated in Figures 6(B) and (C) at t = ∞.
Migration of MWCNTs during the mixing
As illustrated earlier, the location of MWCNTs in the sPS/PET/MWCNT/graphite composites plays a critical role in determining the electrical properties of the composites. To emphasize the importance of the MWCNT location, we investigated the migration behavior of MWCNTs during the mixing process of sPS/PET/MWCNT/graphite composites. Initially, sPS/MWCNT was compounded in a twin-screw extruder. This sPS/MWCNT mixture was then compounded with PET using an internal batch mixer for various mixing times to prepare [(sPS/MWCNT)TPET]B(49/2/49). Subsequently, the [(sPS/MWCNT)TPET]B/graphite composite was prepared by introducing additional graphite into the [(sPS/MWCNT)TPET]B(49/2/49). Figure 7 illustrates the electrical conductivity of [(sPS/MWCNT)TPET]B/graphite as a function of the mixing time for the preparation of [(sPS/MWCNT)TPET]B. The electrical conductivity of the composite increased with mixing time, reached a maximum at 30 minutes, then decreased, and eventually stabilized at an equilibrium value. This trend is closely related to the location of the MWCNTs, and we attribute this behavior to the migration of MWCNTs during the mixing process. Electrical conductivities of [(sPS/MWCNT)TPET]B/graphite(7.35/0.3/7.35/85) as a function of mixing time for preparation of the composites in batch mixer.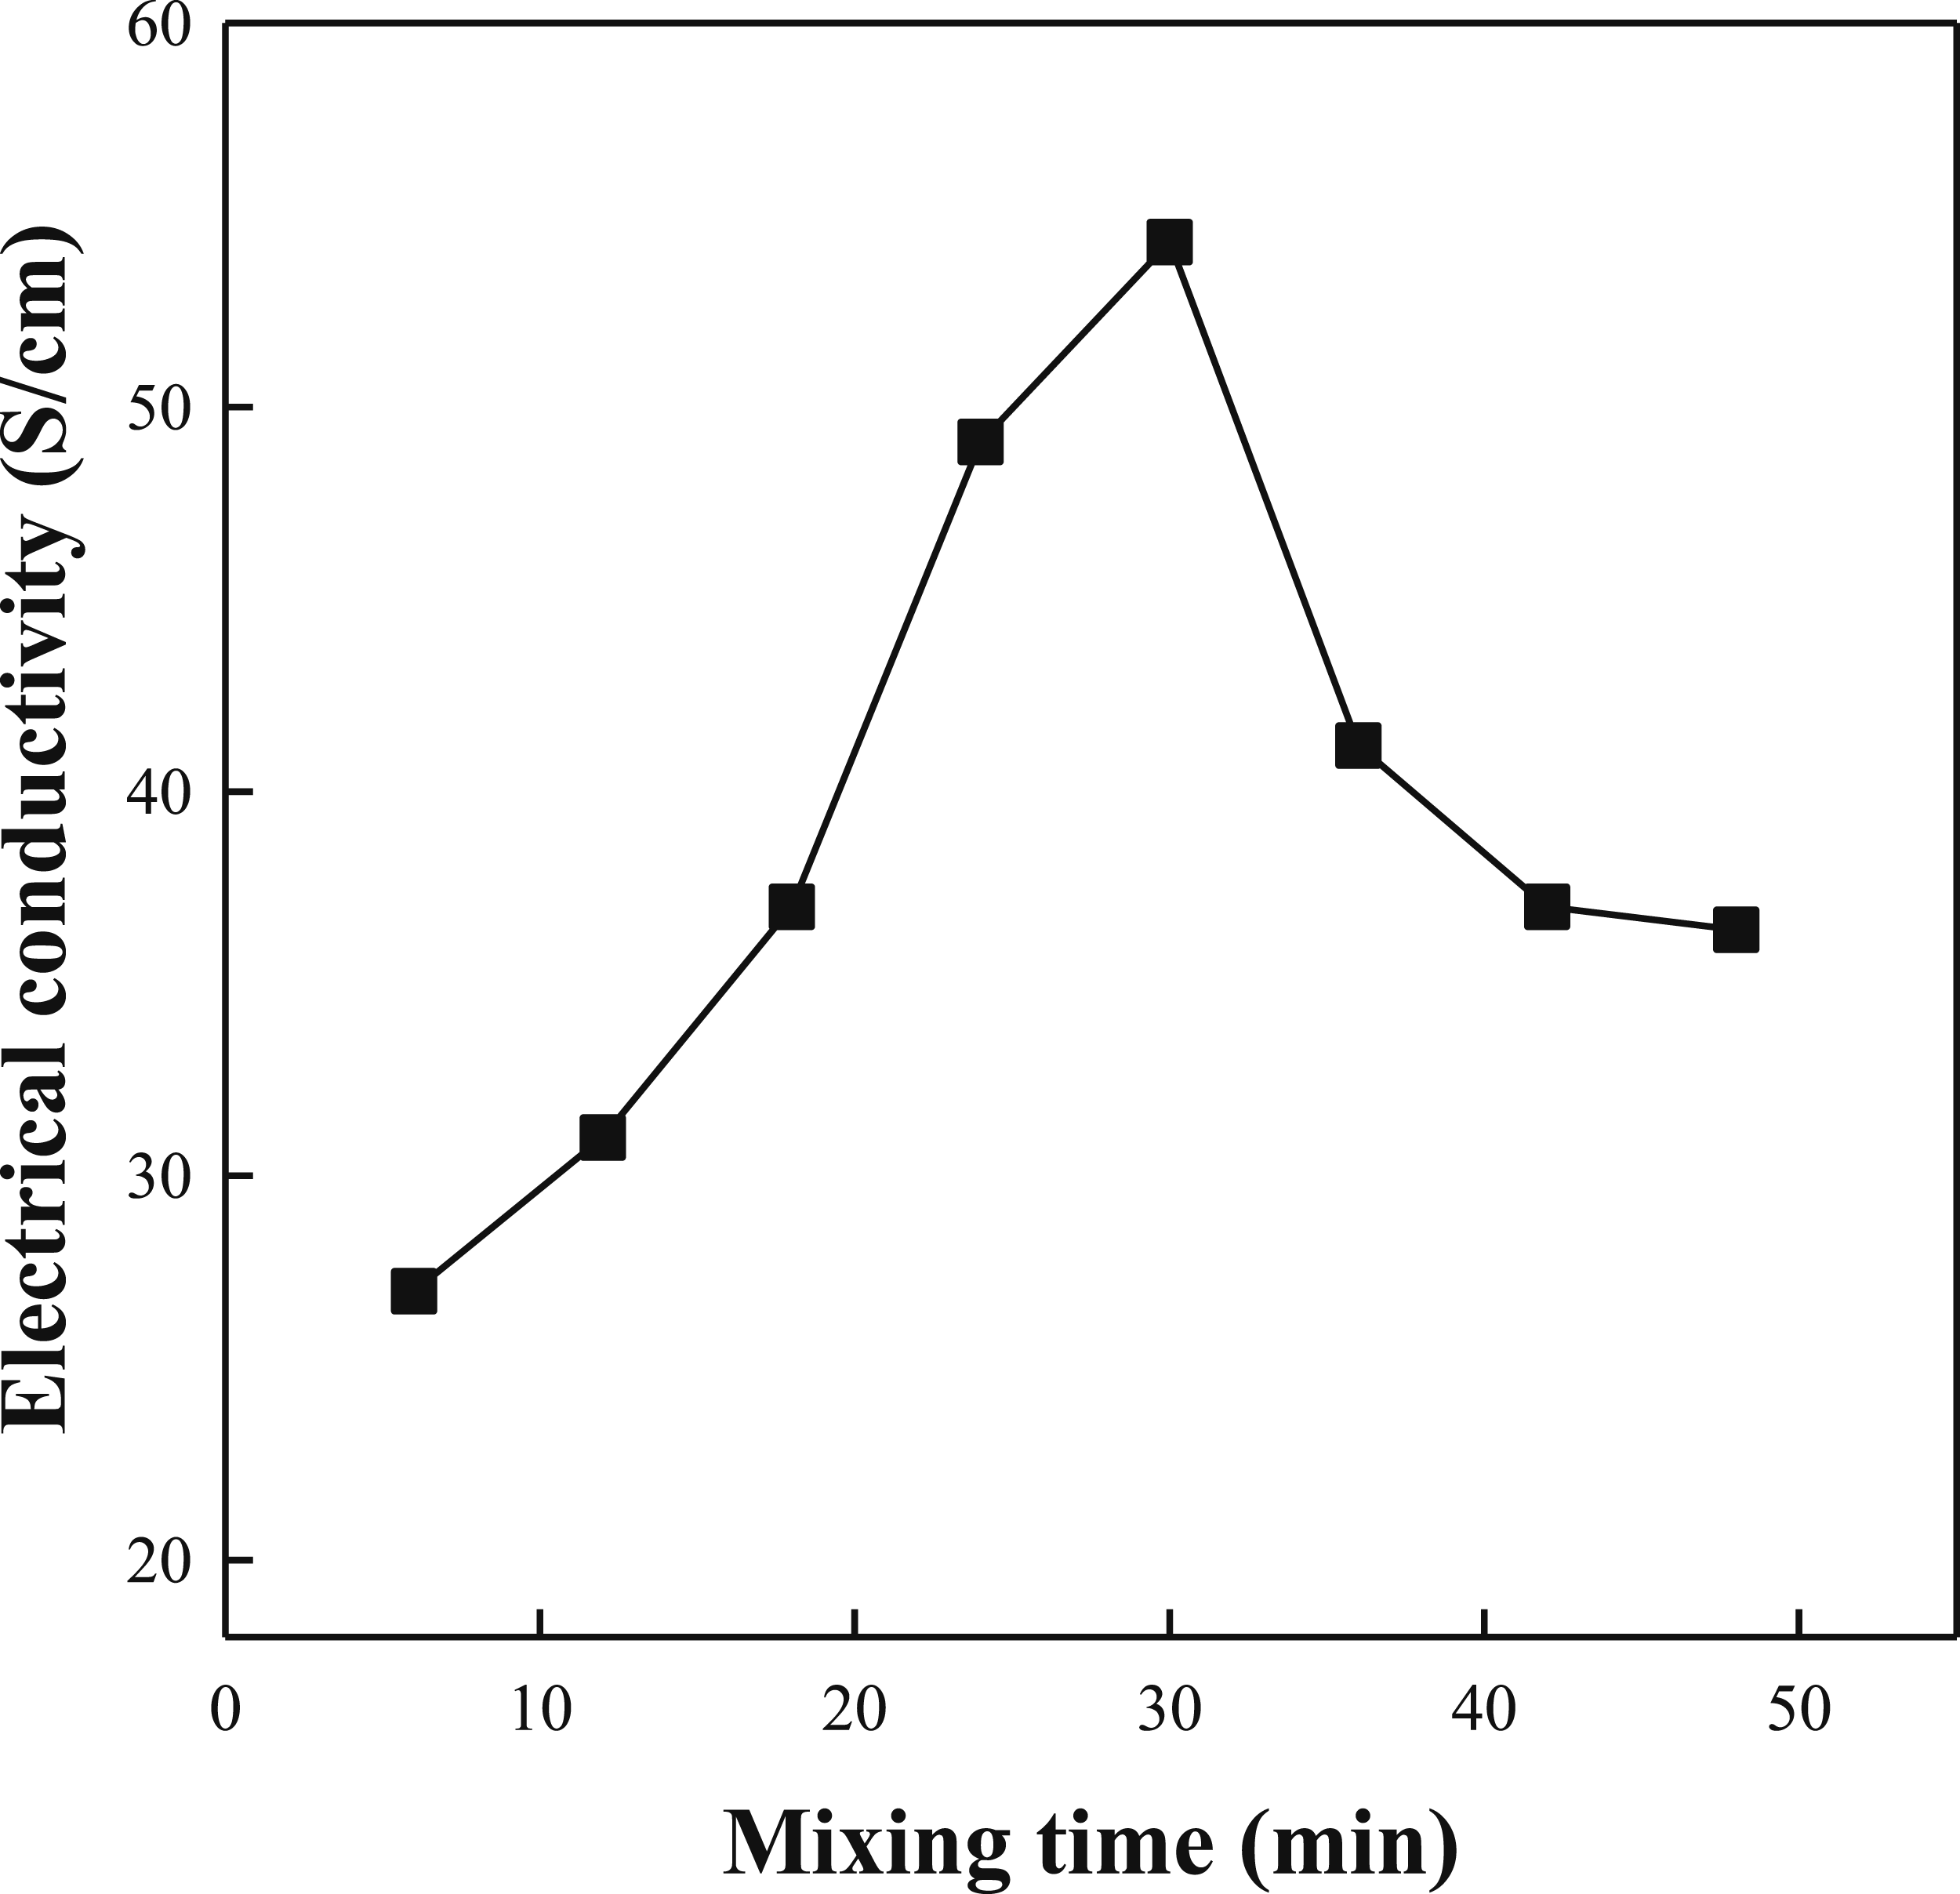
To estimate the location of MWCNTs in the blend, a solvent immersion test was conducted. The samples tested included sPS/MWCNT (98/2), PET/MWCNT (98/2), [(sPS/MWCNT)TPET]T (49/2/49), [(PET/MWCNT)TsPS]T (49/2/49), and [(sPS/MWCNT)TPET]B (49/2/49), prepared with varying mixing times in a batch mixer. These samples were immersed in hot phenol (60°C), which dissolves the PET phase but not the sPS phase. Solvent immersion test of sPS/MWCNT(98/2) (a), [(sPS/MWCNT)PET]T(48/2/48) (A), PET/MWCNT(98/2) (b), [(PET/MWCNT)sPS]T(48/2/48) (B) and [(sPS/MWCNT)PET]B(48/2/48) (C). Numbers indicated in Figure 8(C) represent time (in min) for compounding of [(sPS/MWCNT)PET] in the internal batch mixer.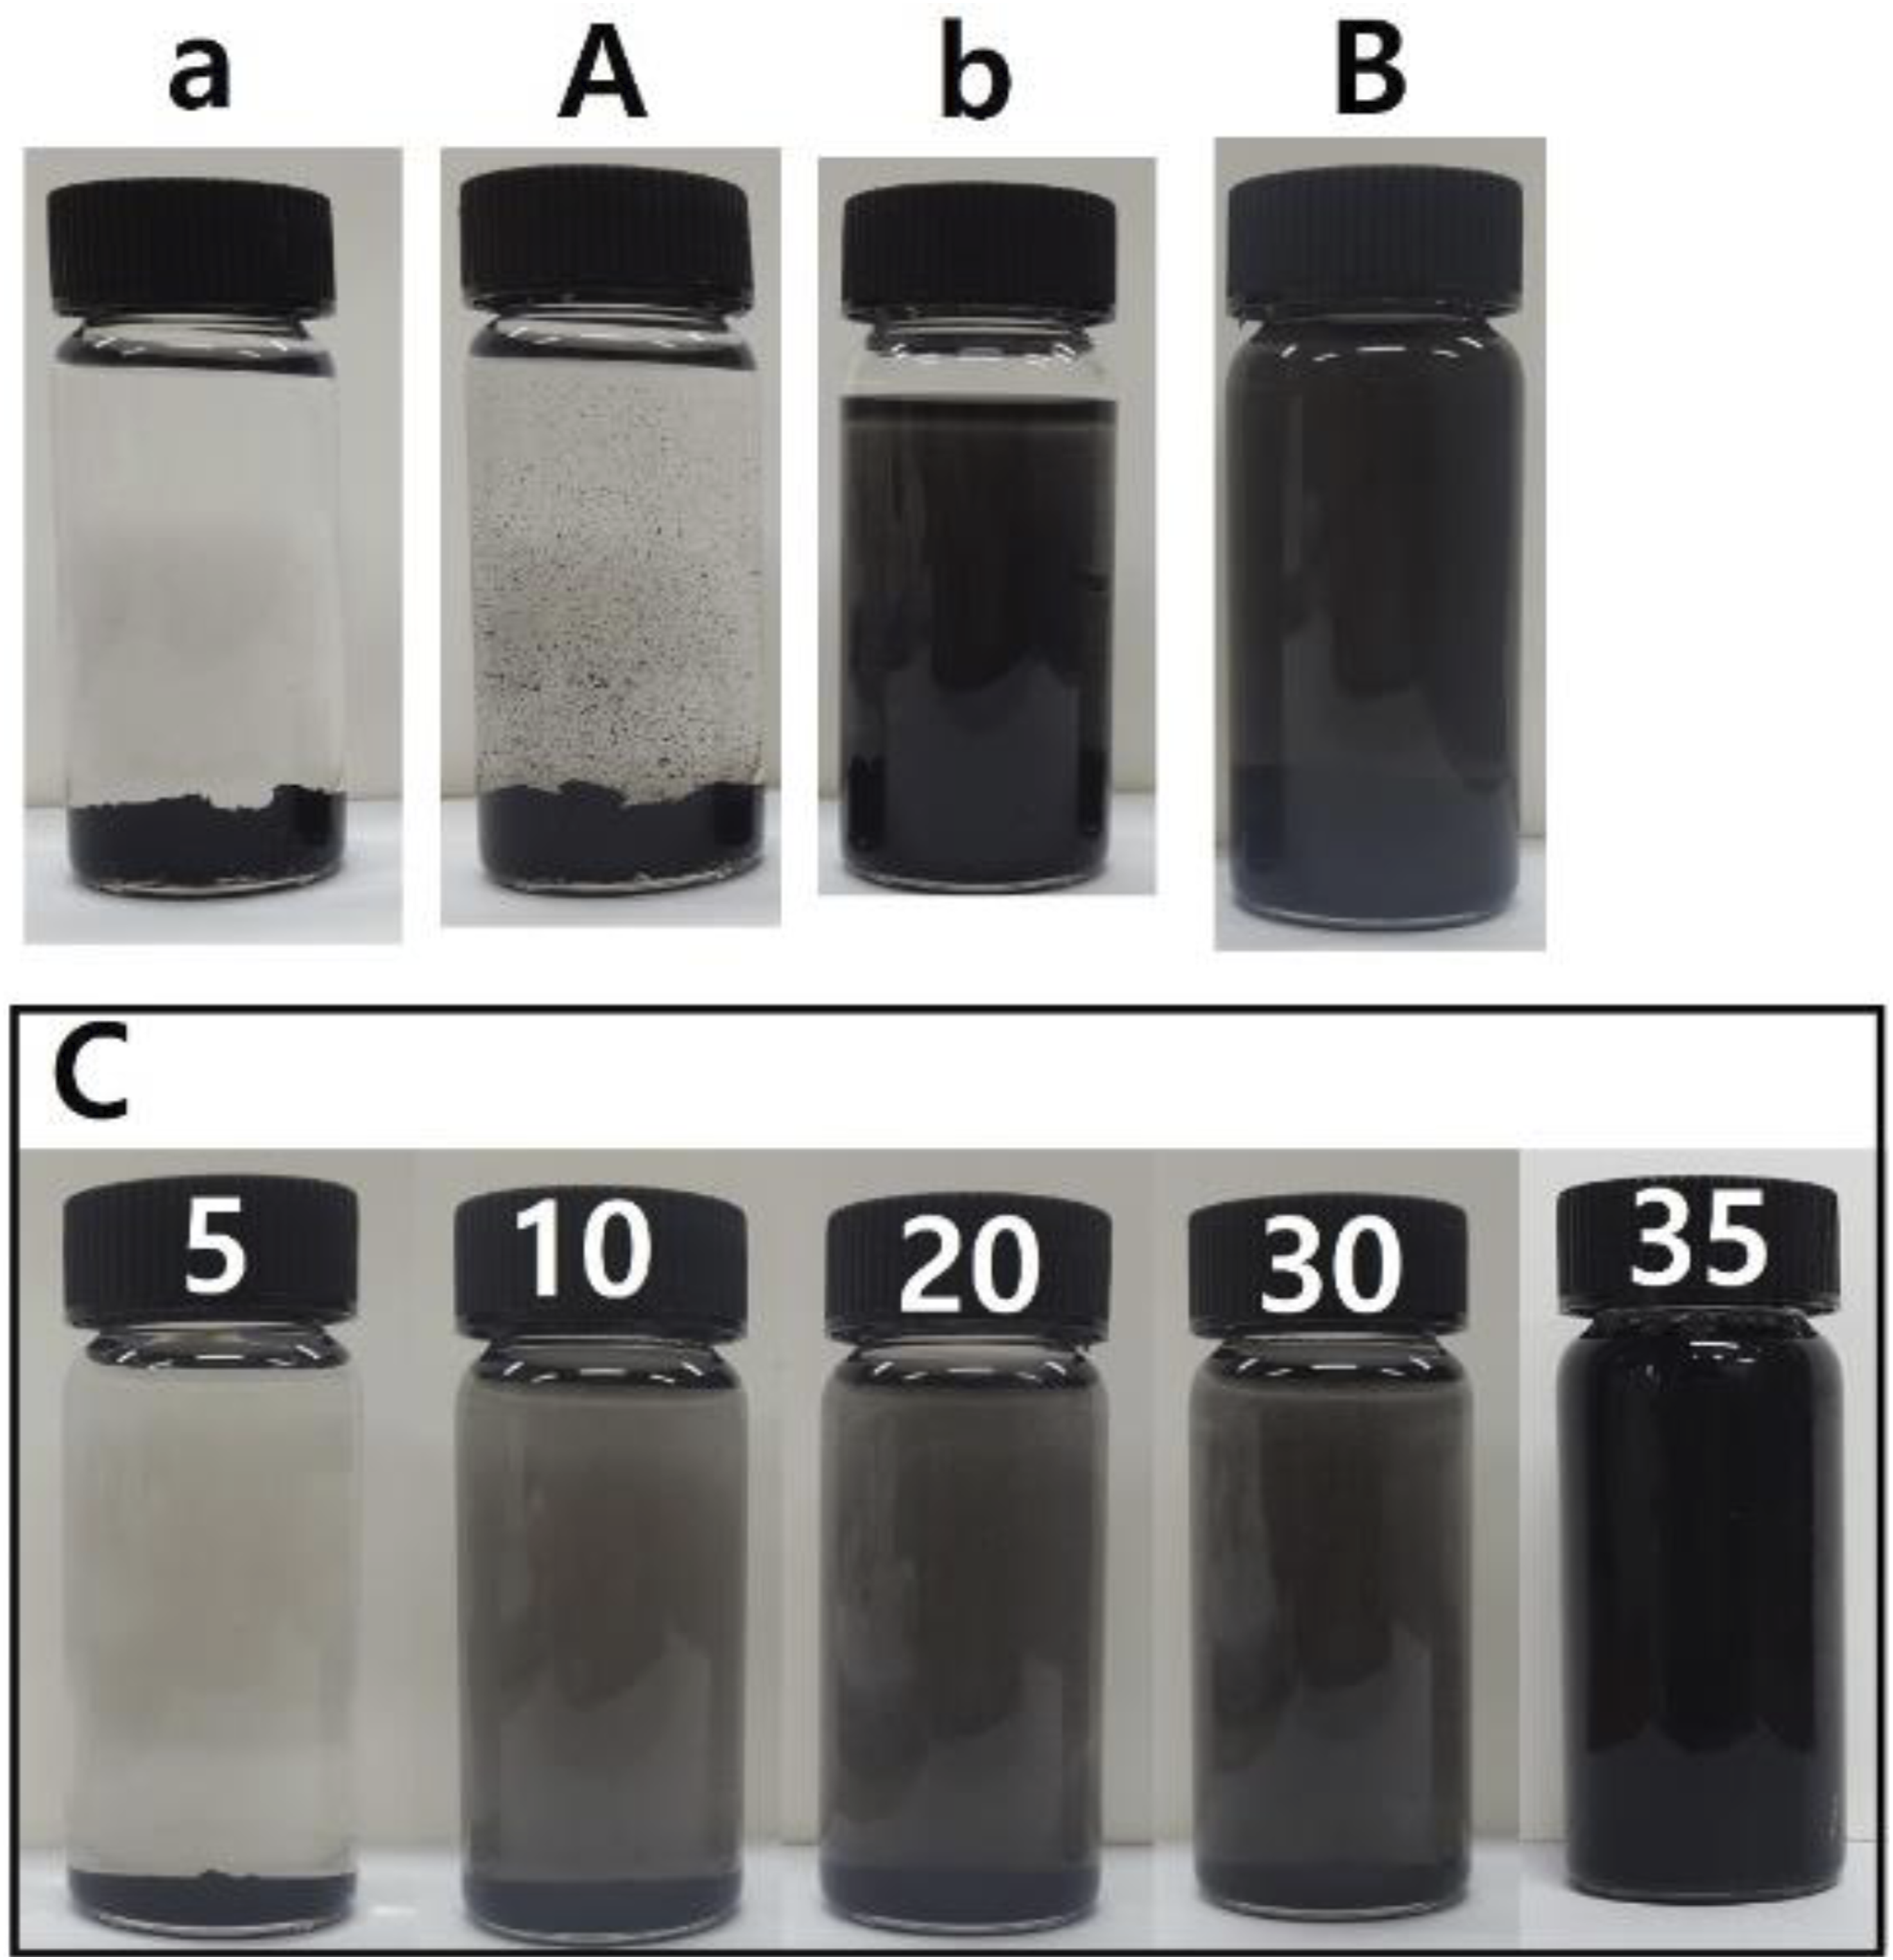
The solution of PET/MWCNT (98/2) turned black, indicating that the MWCNTs dispersed in the PET phase dissolved in the phenol. In contrast, the sPS/MWCNT (98/2) solution remained transparent, as sPS is insoluble in phenol, and the MWCNTs remained within the sPS phase. For [(sPS/MWCNT)TPET]T(49/2/49), the solution was fairly transparent, suggesting that MWCNTs premixed with the sPS phase barely migrated to the PET phase during the blending process. Conversely, the solution of [(PET/MWCNT)TsPS]T (49/2/49) turned dark, implying that the MWCNTs were primarily located in the PET phase.
For [(sPS/MWCNT)TPET]B samples prepared with varying mixing times (indicated by the number following subscript B), the color of the solution changed progressively. The solution of [(sPS/MWCNT)TPET]B5 was transparent, while [(sPS/MWCNT)PET]B10 appeared light grey, indicating a small amount of MWCNTs dissolved in phenol with PET. As the mixing time increased, the solution became progressively darker—moderate grey for [(sPS/MWCNT) TPET]B20, darker grey for [(sPS/MWCNT) TPET]B30, and dark black for [(sPS/MWCNT) TPET]B35. This progression strongly suggests that the MWCNTs migrated from the sPS phase to the PET phase during the mixing process in the internal batch mixer.
The solvent immersion test indicates that, initially, all MWCNTs are located in the sPS phase due to premixing with sPS but gradually migrate to the PET phase because of their higher affinity for PET. During the migration process, MWCNTs temporarily position themselves near the interface of the two polymers. This phenomenon explains why the [(sPS/MWCNT)TPET]B30/graphite composite exhibited the highest electrical conductivity, as shown in Figure 7. A concentrated and interconnected MWCNT structure at that moment provides optimal electrical conductivity, as demonstrated by Gao et al. 28 They achieved a 2D conductive network by directly compression-molding PE powder coated with an MWCNT/alcohol dispersion, resulting in composites with an exceptionally low percolation threshold.
Flexural strength of (sPS/PET)/graphite composites
Figure 9 shows the flexural strength (FS) of the (sPS/PET)/graphite composites. The flexural strength of sPS/graphite(15/85) is slightly higher than that of PET/graphite(15/85). As previously mentioned, this is due to the lower density of sPS compared to PET, resulting in a lower volume fraction of graphite in sPS/graphite(15/85). As observed in Figure 3, FS increases linearly with PET binder content, indicating that higher binder content leads to higher FS. Consequently, the higher FS of sPS/graphite(15/85) is attributed to the increased volume fraction of the binder due to the lower density of sPS. Flexural strength of (sPS/PET)/graphite composites with and without γMWCNT as a function of sPS weight fraction in polymer binder. The compositions and symbols are same with those in Figure 4.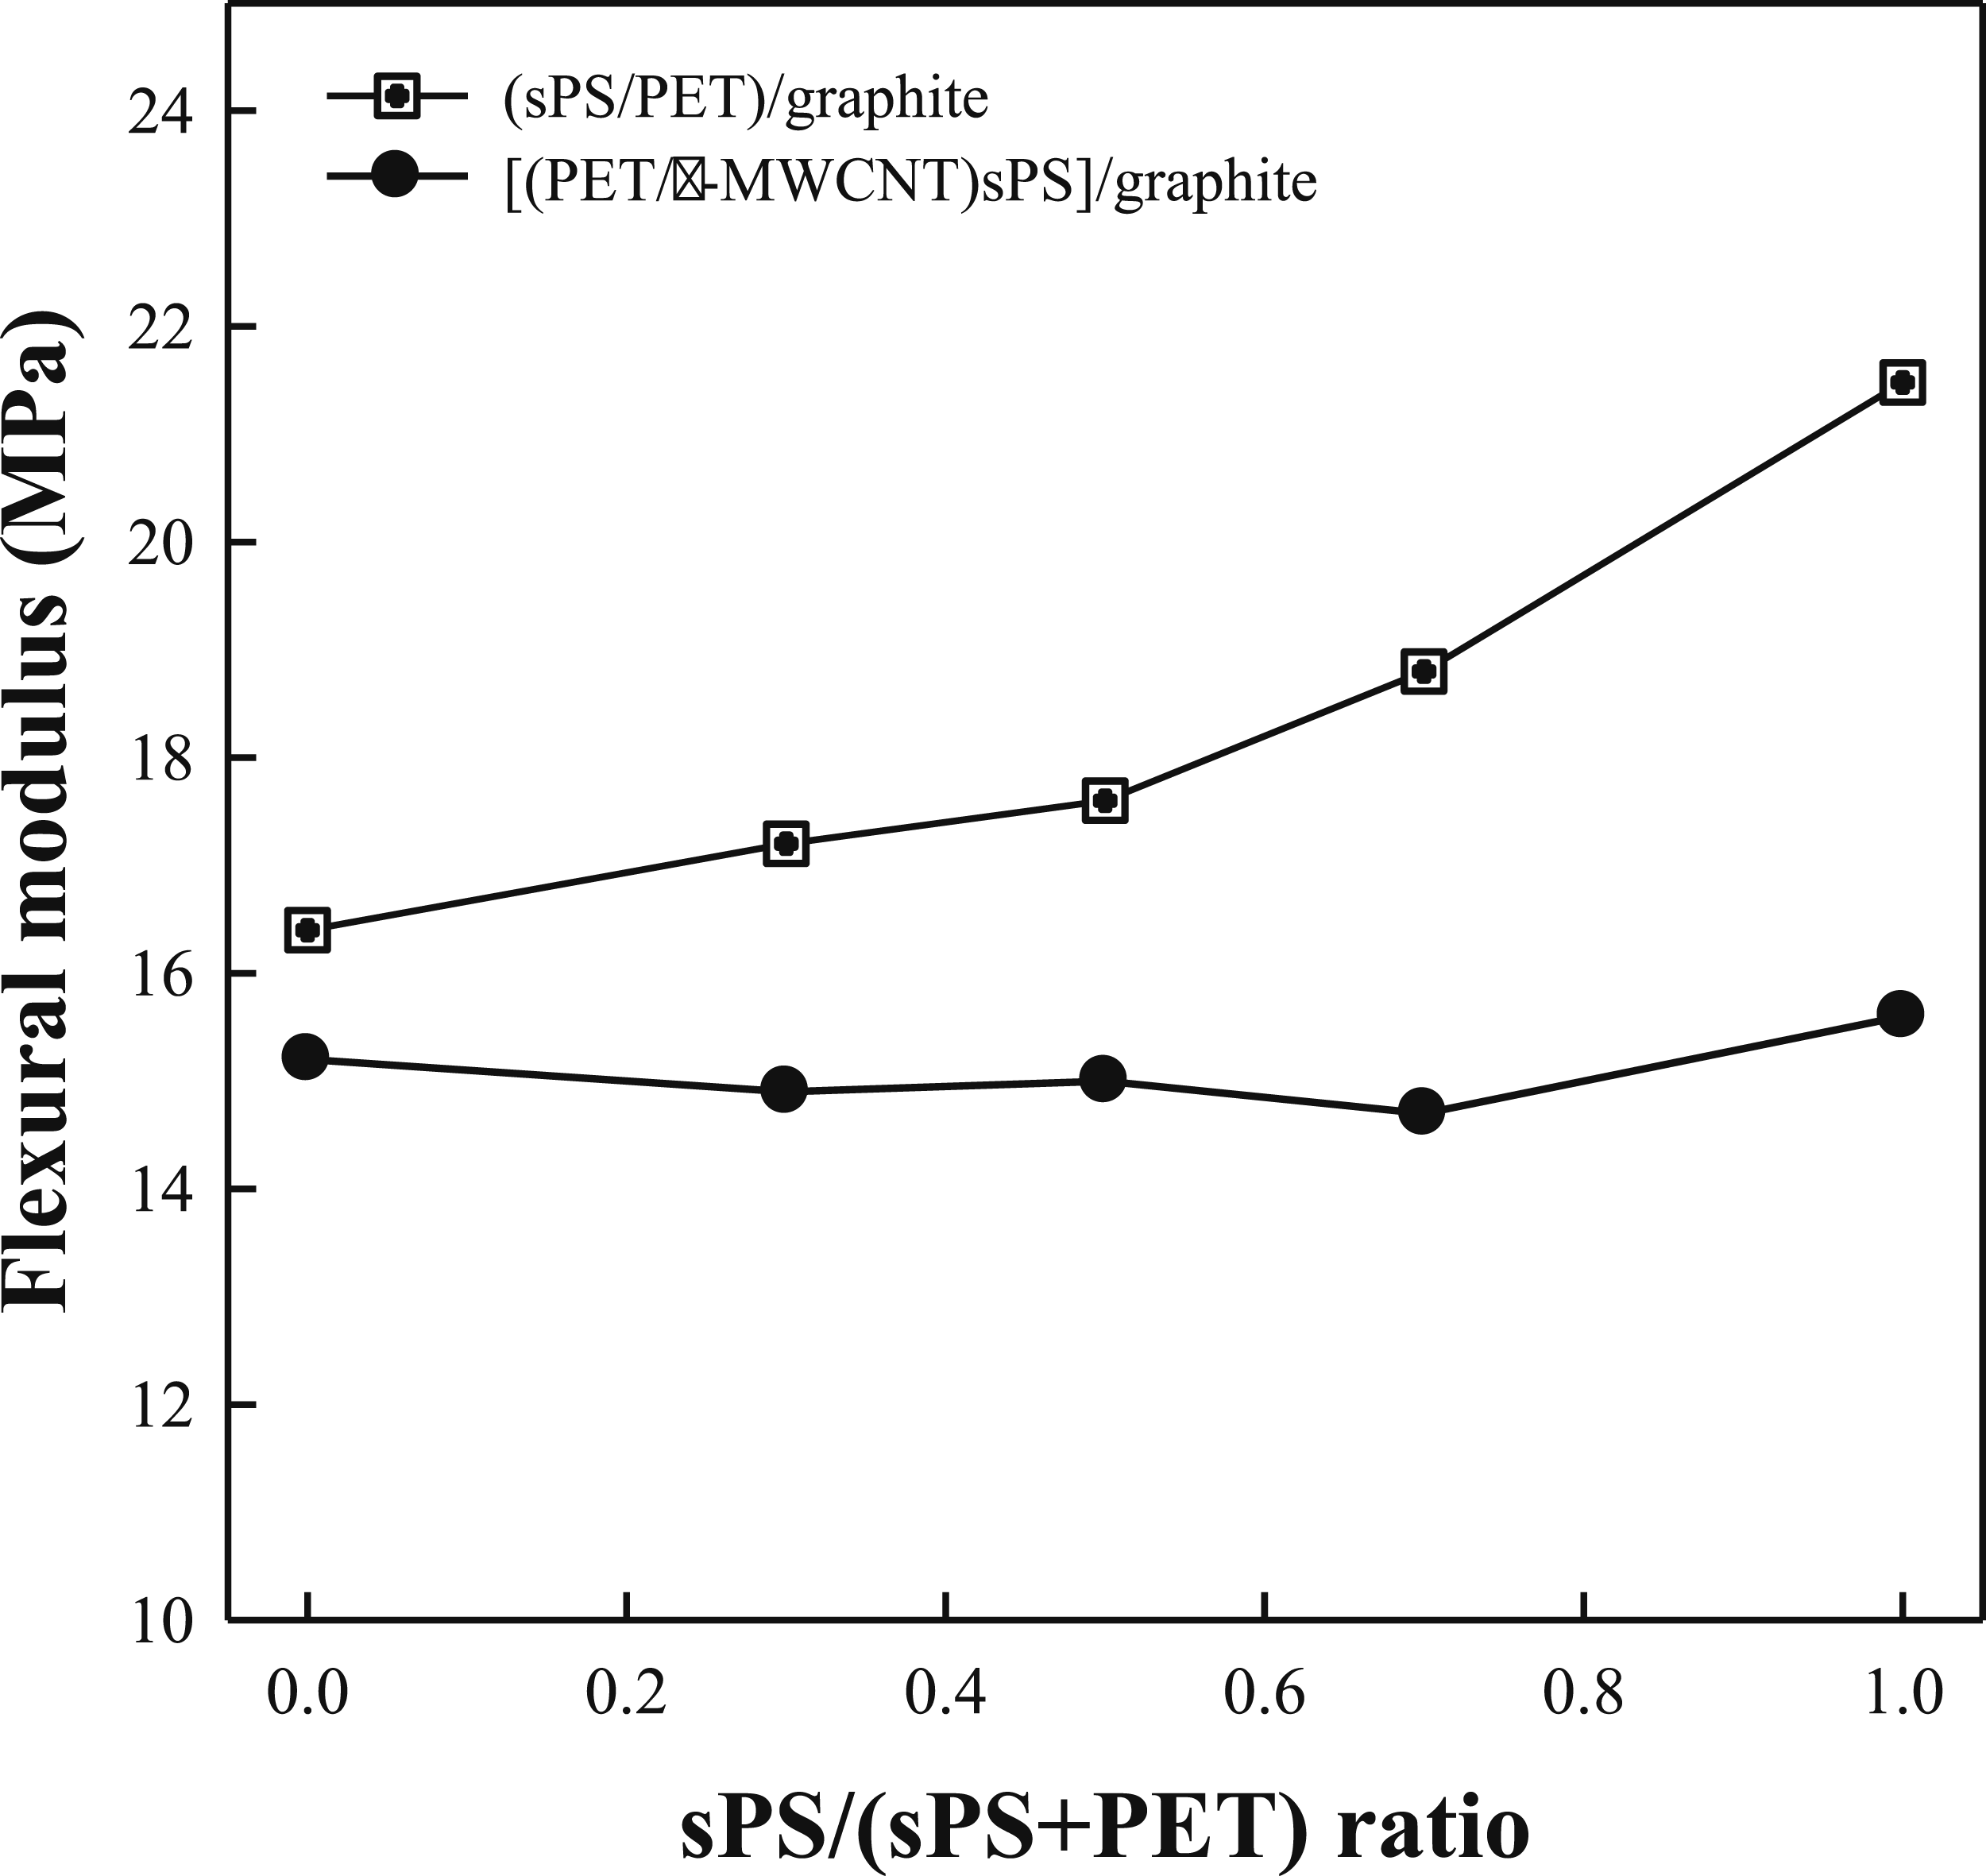
The FS of (sPS/PET)/graphite composites falls between those of sPS/graphite(15/85) and PET/graphite(15/85). Notably, the negative deviation commonly observed in many immiscible polymer blends is not present. This can be explained by the fact that the interfacial adhesion between the organic polymers (sPS and PET) and the inorganic graphite is much lower than the adhesion between sPS and PET, both organic materials. As a result, when the polymer blend is used as a binder for graphite, the inherently low mechanical properties of the incompatible sPS/PET blend have little effect on the mechanical properties of the sPS/PET/graphite composite. Instead, the much lower interfacial adhesion between the polymers and graphite becomes the determining factor.
Contrary to our expectations, the FS was reduced with the incorporation of γMWCNTs. Notably, as the sPS content in the composite materials increased, the reduction in FS became more pronounced. As previously mentioned, the affinity between sPS and MWCNTs is lower than that between PET and MWCNTs. Consequently, significant MWCNT agglomeration occurred in the sPS/graphite composite. These agglomerates are presumed to act as stress concentrators, thereby reducing the mechanical properties of the composites.
As shown in Figure 5, the viscosity of [(PET/γMWCNT)sPS]/graphite composites is lower than the average viscosity of sPS/graphite and PET/graphite composites, particularly at higher shear rates. This indicates that incorporating γMWCNTs in small quantities is an effective strategy to increase the conductivity of the sPS/PET/graphite composite without compromising the processability of the composites.
sPS/PET blends were investigated as a binder in polymer/graphite composites. We discovered that MWCNTs can be preferentially located in one phase by controlling the mixing protocol, leading to enhanced electrical conductivity without increasing the MWCNT content or sacrificing mechanical properties. Given the high cost of MWCNTs compared to graphite, this study provides a meaningful step forward in advancing the commercial viability of polymer electrolyte membrane fuel cells.
Conclusion
The incorporation of MWCNT into PET/graphite composites significantly enhanced electrical conductivity, albeit with a slight increase in composite viscosity and a marginal decrease in mechanical properties. This effect is attributed to the establishment of a conductive path within the PET phase facilitated by the inclusion of MWCNTs. Moreover, surface-treated MWCNTs through γ-ray radiation further enhanced the electrical conductivity of the PET/graphite composite.
The study revealed that the dispersion of γMWCNT in the PET phase was more homogeneous compared to that of MWCNT, primarily due to its stronger affinity with PET facilitated by functional groups on its surface. This enhanced dispersion contributed to improved electrical conductivity.
Contrastingly, the enhancement of electrical conductivity in sPS/graphite composites by MWCNT and γMWCNT was not significant. This can be attributed to the lower affinity of MWCNT with sPS compared to PET.
When MWCNTs were introduced into sPS/PET/graphite composites, they exhibited a preference for selective localization in the PET phase over the sPS phase due to their higher affinity with PET. This selective localization resulted in a reduced percolation threshold, consequently leading to a more pronounced enhancement in electrical conductivity for a given amount of MWCNTs.
Footnotes
Declaration of conflicting interests
The author(s) declared no potential conflicts of interest with respect to the research, authorship, and/or publication of this article.
Funding
The author(s) received no financial support for the research, authorship, and/or publication of this article.
Data Availability Statement
Data sharing not applicable to this article as no datasets were generated or analyzed during the current study.