
Abstract
This study investigates the electrical resistivity behavior of cementitious composites incorporating carbon fiber (CF), carbon black (CB), and their hybrid combinations under varying curing ages, humidity levels (0–100%), and temperatures (0°C to 120°C). 16 different mixtures are prepared with CF contents up to 0.9 vol.% and CB contents up to 9 wt.% of cement. Experimental results reveal that hydration-induced densification significantly increases resistivity in plain cement paste (from 267.5 to 999.5 Ω·cm over 28 days), whereas hybrid CF–CB composites maintain low and stable resistivity values (3.9–7.1 Ω·cm), demonstrating superior environmental robustness. Moisture loss and sub-zero temperatures markedly increase resistivity in the control specimen, while conductive fillers preserve electrical continuity. At elevated temperatures, hybrid composites exhibit a thermally stable conductive response, in contrast to the signal degradation observed in the control due to thermal cracking. Machine learning models (XGBoost, SVR, and MLP) are employed to predict resistivity based on five input variables, achieving high predictive accuracy, with XGBoost reaching an R2 of 0.981 on test data. SHAP analysis identifies carbon black as the dominant contributor to conductivity, quantitatively validating the synergistic CF–CB mechanism. These findings demonstrate a scalable pathway for designing environmentally resilient, self-sensing cementitious materials supported by data-driven modeling.
Introduction
Cement-based composites are widely used in the construction industry due to their high load-bearing capacity. 1 However, with the advancement of technology and the increasing complexity of modern living conditions, this property alone is no longer considered sufficient. Contemporary construction materials are expected to exhibit multiple functions beyond structural support. 2 These additional functionalities include energy storage, 3 self-sensing, 4 stress/strain detection, 5 self-heating capabilities, 6 and electromagnetic interference (EMI) shielding, 7 among others. To enable these advanced properties, cement-based composites are modified by incorporating conductive fillers, 8 transforming them into multifunctional “smart materials”.
Cementitious composites, by nature, exhibit predominantly insulating behavior. 9 However, the introduction of conductive additives enhances their electrical conductivity, enabling self-sensing capabilities. Self-sensing refers to the ability of a material to detect changes in its own electrical properties, which correlate with variations in temperature, stress, strain, or moisture content. 10 Since these factors influence the composite’s electrical resistance or capacitance, monitoring its electrical properties allows for real-time assessment of structural conditions. 11 Traditionally, such measurements are performed using external or embedded sensors, 12 which either require direct integration within the structure or are mounted externally to gather data. However, embedded sensors pose challenges in terms of maintenance and potential structural integrity concerns, whereas externally mounted sensors are susceptible to environmental factors that may degrade their performance over time.
In contrast, self-sensing cementitious composites eliminate the need for external electronic sensors, as the material itself functions as a sensor. 13 This characteristic provides significant advantages, including enhanced structural integrity, reduced maintenance requirements, and improved long-term reliability. As a result, self-sensing materials offer a promising alternative for advanced infrastructure monitoring, particularly in applications where continuous real-time assessment is required.
Among the various conductive fillers used to impart electrical conductivity to cementitious composites, carbon-based materials 14 are among the most widely utilized due to their superior electrical properties, mechanical reinforcement capability, and availability in various forms. These materials include carbon fiber (CF), 15 carbon nanotubes, 16 graphene, 17 graphite, 18 and carbon black (CB), 19 each offering distinct advantages depending on the specific application. Discontinuous CF, in particular, are extensively employed in cementitious composites due to their dual functionality as both crack-bridging reinforcements and conductivity enhancers, effectively lowering the material’s electrical resistivity. The widespread availability of CF makes them an attractive option for large-scale applications. However, their relatively high cost remains a limiting factor in practical implementations. 20
An alternative to CF is CB, a fine particulate carbon material commonly used as a reinforcing filler in tire and rubber products. 21 CB is both cost-effective and readily available, making it a viable substitute or complementary additive in conductive cementitious composites. The synergistic effect of combining CB with CF is particularly relevant from an economic perspective, as it allows for reduced fiber content while maintaining or even enhancing electrical performance. Although extensive research has been conducted on the independent use of CF and CB in cement-based composites, limited studies have explored their combined (hybrid) utilization. Investigating this hybrid approach is essential for optimizing the cost-performance balance of smart cementitious materials.
Most existing studies on multifunctional cementitious composites are conducted under laboratory-controlled conditions, typically assuming constant temperature and humidity environments.22–28 However, in real service conditions, cement-based materials are inevitably subjected to fluctuating environmental factors, particularly variations in moisture content and temperature, which can profoundly alter their electrical response and sensing reliability. Despite the growing interest in conductive cementitious materials, systematic investigations that simultaneously account for curing age, humidity, and temperature—especially in hybrid carbon fiber–carbon black (CF–CB) systems—remain notably limited.
In parallel, while machine learning techniques have been extensively applied to predict mechanical and strength-related properties of cement-based composites, their use for interpreting environmentally driven electrical behavior and uncovering the underlying conduction mechanisms is still in its infancy. Against this background, the novelty of the present study lies in two key aspects: (i) the experimental demonstration of the superior environmental robustness of hybrid CF–CB conductive networks across a wide range of humidity and temperature conditions, and (ii) the quantitative validation of the proposed synergistic conduction mechanism through interpretable machine learning, specifically SHAP analysis. By directly linking experimental observations with data-driven physical interpretation, this study advances the understanding of environmentally resilient self-sensing cementitious materials and provides a robust framework for their rational design.
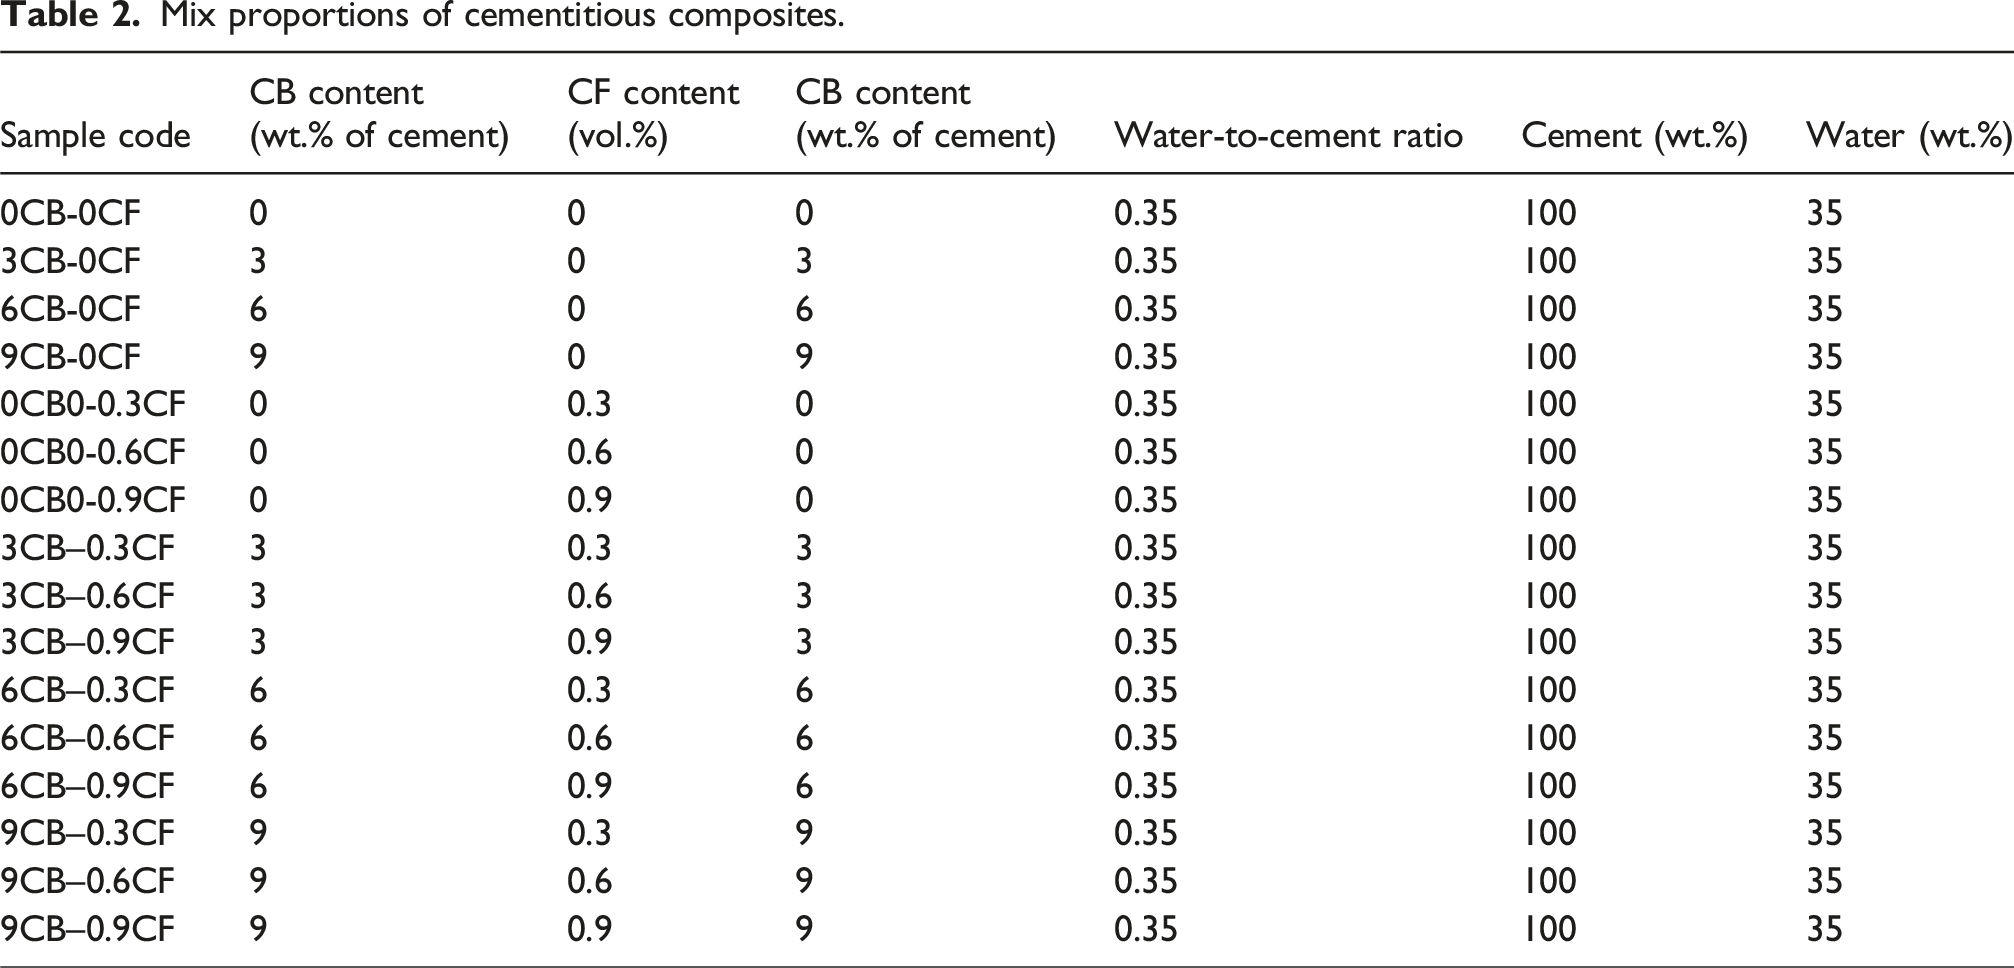
In this study, cement pastes are designed using CF at volume fractions of 0% to 0.9% and CB at binder weight percentages of 0% to 9%, both independently and in hybrid combinations. A total of 16 different mix designs are developed to systematically investigate the effect of these conductive fillers on the electrical properties of cementitious composites. The selected CF and CB contents are determined based on preliminary trial mixtures, in which workability, dispersion quality, and economic considerations are evaluated to define practically applicable and experimentally manageable composition ranges. The electrical properties of these composites are examined under varying curing time (1-28 days), varying humidity levels (0%–100%) and temperature conditions ranging from 0°C to 120°C, allowing for a comprehensive evaluation in real-world scenarios. In addition, this study utilizes machine learning (ML) for predicting resistivity. In particular, a set of ML models, including XGBoost (XGB), Support Vector Regression (SVR), and Multi-Layer Perceptron (MLP), is employed to predict the resistivity based on the selected input parameters, including CF, CB, time in days, and environmental conditions. The findings of the computational experiments demonstrate the strong predictive power and generalization ability of these models, with XGBoost yielding the most accurate performance metrics.
Materials and method
Key properties of CF and CB.
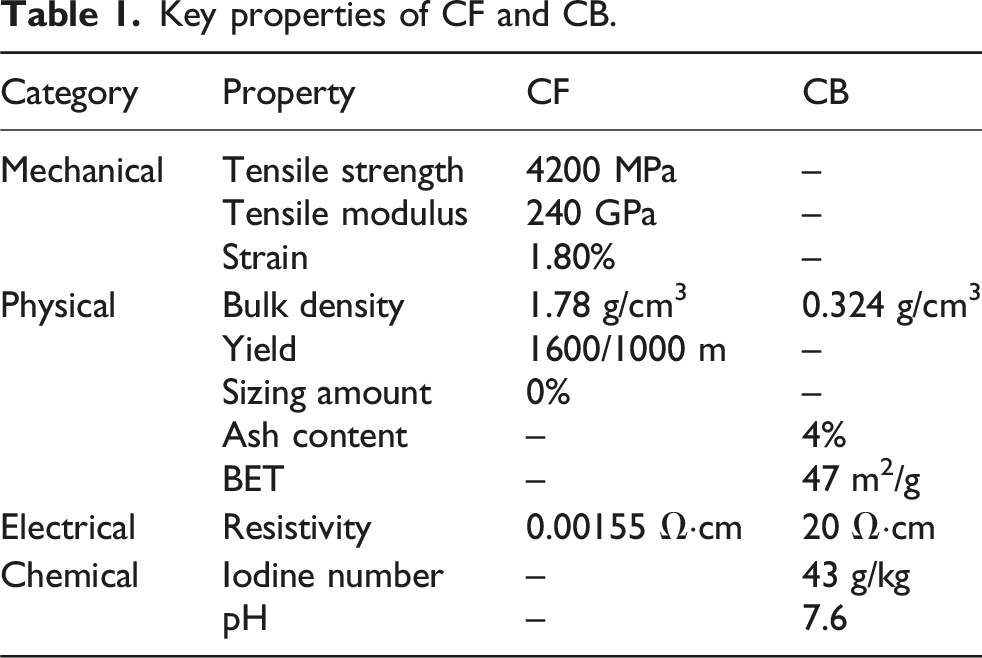
The CB, utilized as a reinforcing filler in rubber manufacturing, is N550 type CB obtained from Metekim Kauçuk (Bursa, Türkiye). Detailed particle size information for the carbon black is not provided by the manufacturer; however, the material corresponds to an industrial-grade carbon black commonly used in engineering applications. A polycarboxylate ether-based superplasticizer (Glenium SKY 675) is employed to adjust the workability of the composites, while tap water is used as the mixing liquid.
The dry ingredients are first mixed using a variable-speed Hobart mixer for 3 min to ensure uniform distribution. Subsequently, the water-superplasticizer mixture is gradually added while mixing continues until a homogeneous blend is obtained. The resulting fresh mixture is poured into 25 mm × 25 mm × 60 mm lubricated steel molds. For specimens designated for electrical measurements, copper mesh electrodes with a 0.5 mm mesh opening are embedded into the fresh composite. These electrodes are placed parallel to each other, ensuring an inter-electrode distance of 10 mm. The dimensions of each electrode are 10 mm in width, 40 mm in length, and 0.5 mm in thickness, with 25 mm of the electrode embedded into the composite while the remaining 15 mm protruded for electrical connections. Specimens intended for mechanical testing are cast without electrodes. Although the mold dimensions are non-standard, they do not compromise the electrical measurements, as all specimens share identical geometry and at least six replicates are prepared for each mix to ensure repeatability.
Mix proportions of cementitious composites.
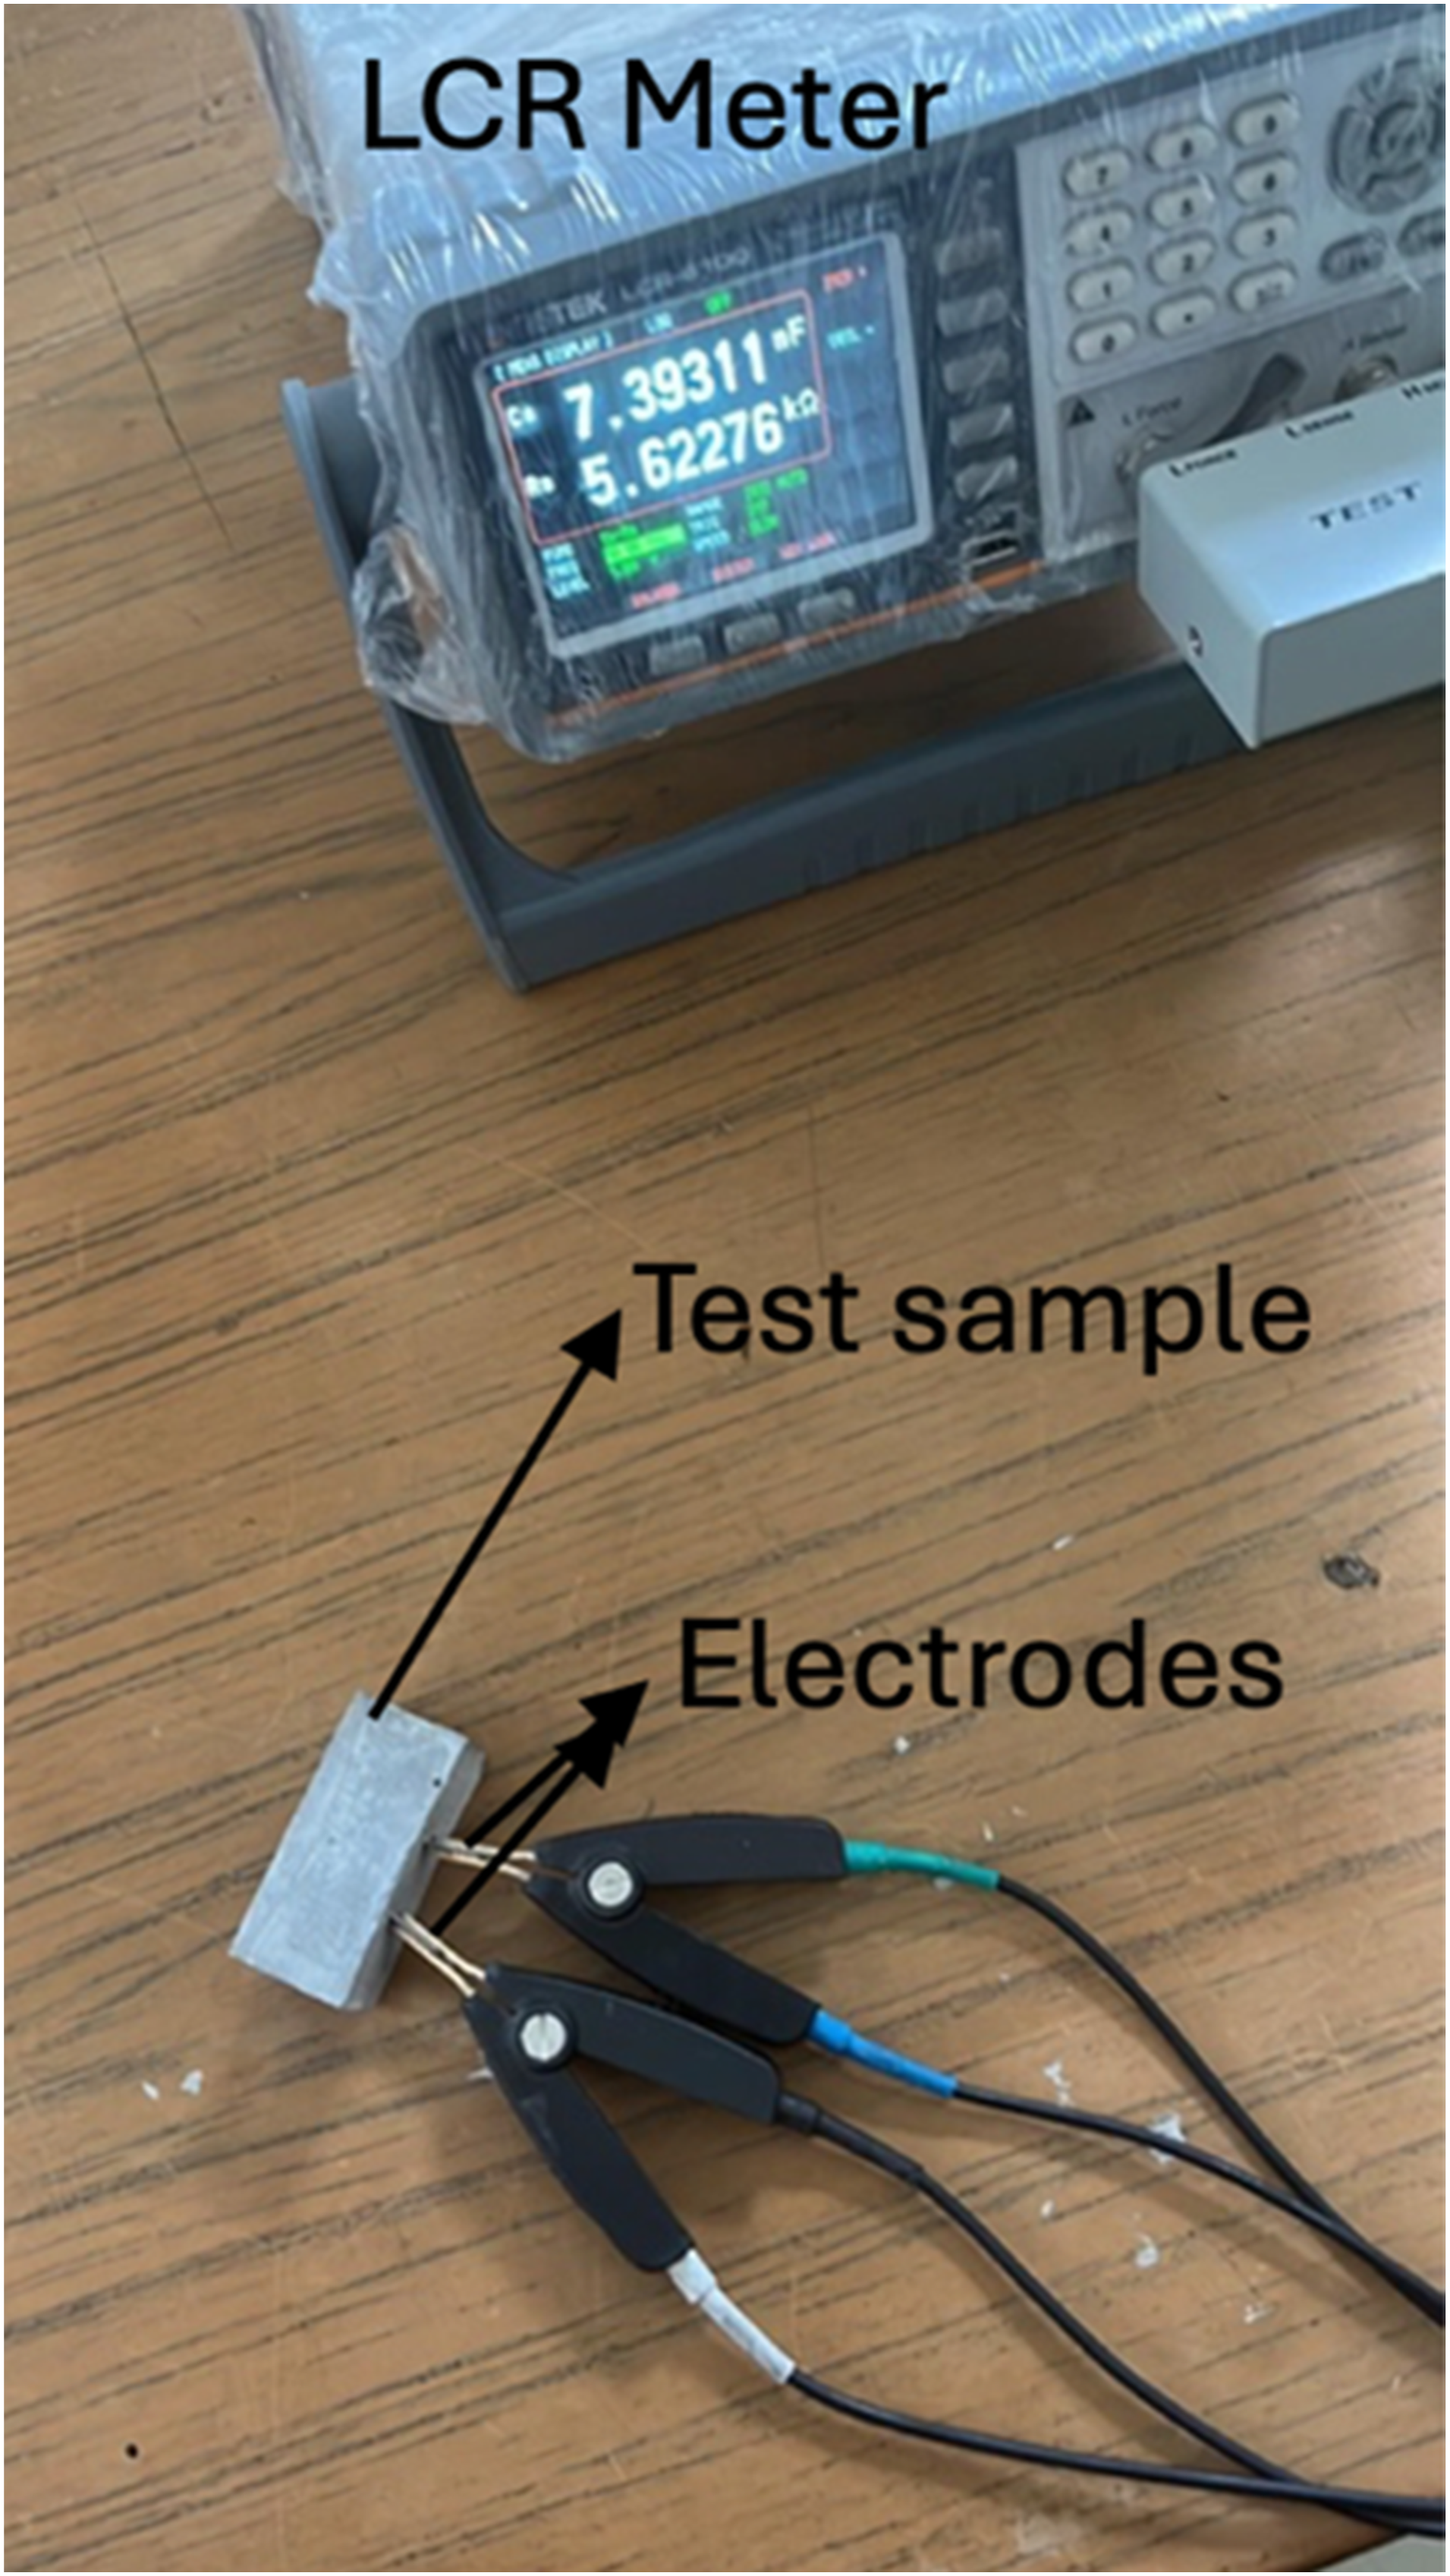
For electrical testing, the resistance values of the specimens are measured using an LCR meter (LCR-6000, GW Instek, Taiwan). Measurements are conducted at 50 kHz frequency and 1.000 V AC voltage in a configuration where resistance and capacitance are connected in series. The resistivity (ρ) of the composites is calculated using the following equation: Electrical measurement test setup.
Electrical measurements are conducted on specimens at different curing ages, specifically immediately after demolding and at 2, 7, 14, and 28 days to assess hydration-induced changes in resistivity. The selected curing ages are chosen to represent different stages of cement hydration and microstructural evolution. The early-age measurement corresponds to a pore-solution-dominated ionic conduction regime, whereas later ages reflect hydration-induced densification and reduced ionic mobility. The 28-days age is conventionally regarded as a reference maturity point and is widely used in cement-based material studies.
To examine the effect of moisture on the electrical properties of the 28-day-old specimens, fully cured samples are tested in their saturated surface-dry condition and then dried in an oven at 40°C. Intermediate resistivity measurements are taken until the specimens are fully dried. The moisture content (
The effect of temperature on electrical properties is also evaluated by subjecting fully dried specimens to different temperature conditions. Specimens are stored at 0°C in a freezer and at 40°C, 70°C, and 120°C in an oven. Before resistivity measurements, specimens are maintained at the target temperature for 24 h to ensure thermal equilibrium throughout the specimen volume, thereby minimizing temperature gradients during testing. This approach allowed for the analysis of resistivity variations under different thermal conditions. The temperature range is selected to simulate realistic service conditions and extreme thermal exposures that cementitious materials may experience in cold climates, hot environments, or industrial applications. All temperature-dependent resistivity tests are performed on fully dried specimens to eliminate the influence of moisture. Consequently, humidity is not a variable during temperature testing, and the measured resistivity variations are solely attributed to temperature effects rather than coupled temperature–humidity interactions.
This study presents a comprehensive experimental methodology to evaluate the electrical properties of cementitious composites, providing valuable insights into their self-sensing potential under different conditions. In addition, this study utilize machine learning (ML) for predicting resistivity. In particular, a set of ML models, including XGBoost (XGB), Support Vector Regression (SVR), and Multi-Layer Perceptron (MLP), are employed to predict the resistivity based on the selected input parameters, including CF, CB, time in days, and environmental conditions. The findings of the computational experiments demonstrate the strong predictive power and generalization ability of these models, with XGBoost yielding the best performance metrics.
Experimental results
Ageing effect on electrical resistivity
Figure 2 illustrates the influence of curing time on the electrical resistivity of cementitious composites incorporating CF, CB, and their hybrid combinations (CF + CB). The resistivity measurements are conducted at four different curing ages—1, 7, 14, and 28 days—to evaluate how the hydration process, microstructural evolution, and conductive network formation affect the electrical properties of these composites over time. The results demonstrate that the inclusion of conductive fillers significantly reduces electrical resistivity compared to the control specimen, which contains no conductive additives. This reduction is attributed to the formation of conductive pathways within the cement matrix, facilitating electron transport and enhancing overall conductivity.
29
The influence of curing time on the electrical resistivity of cementitious composites incorporating CF, CB, and their hybrid combinations (CF + CB).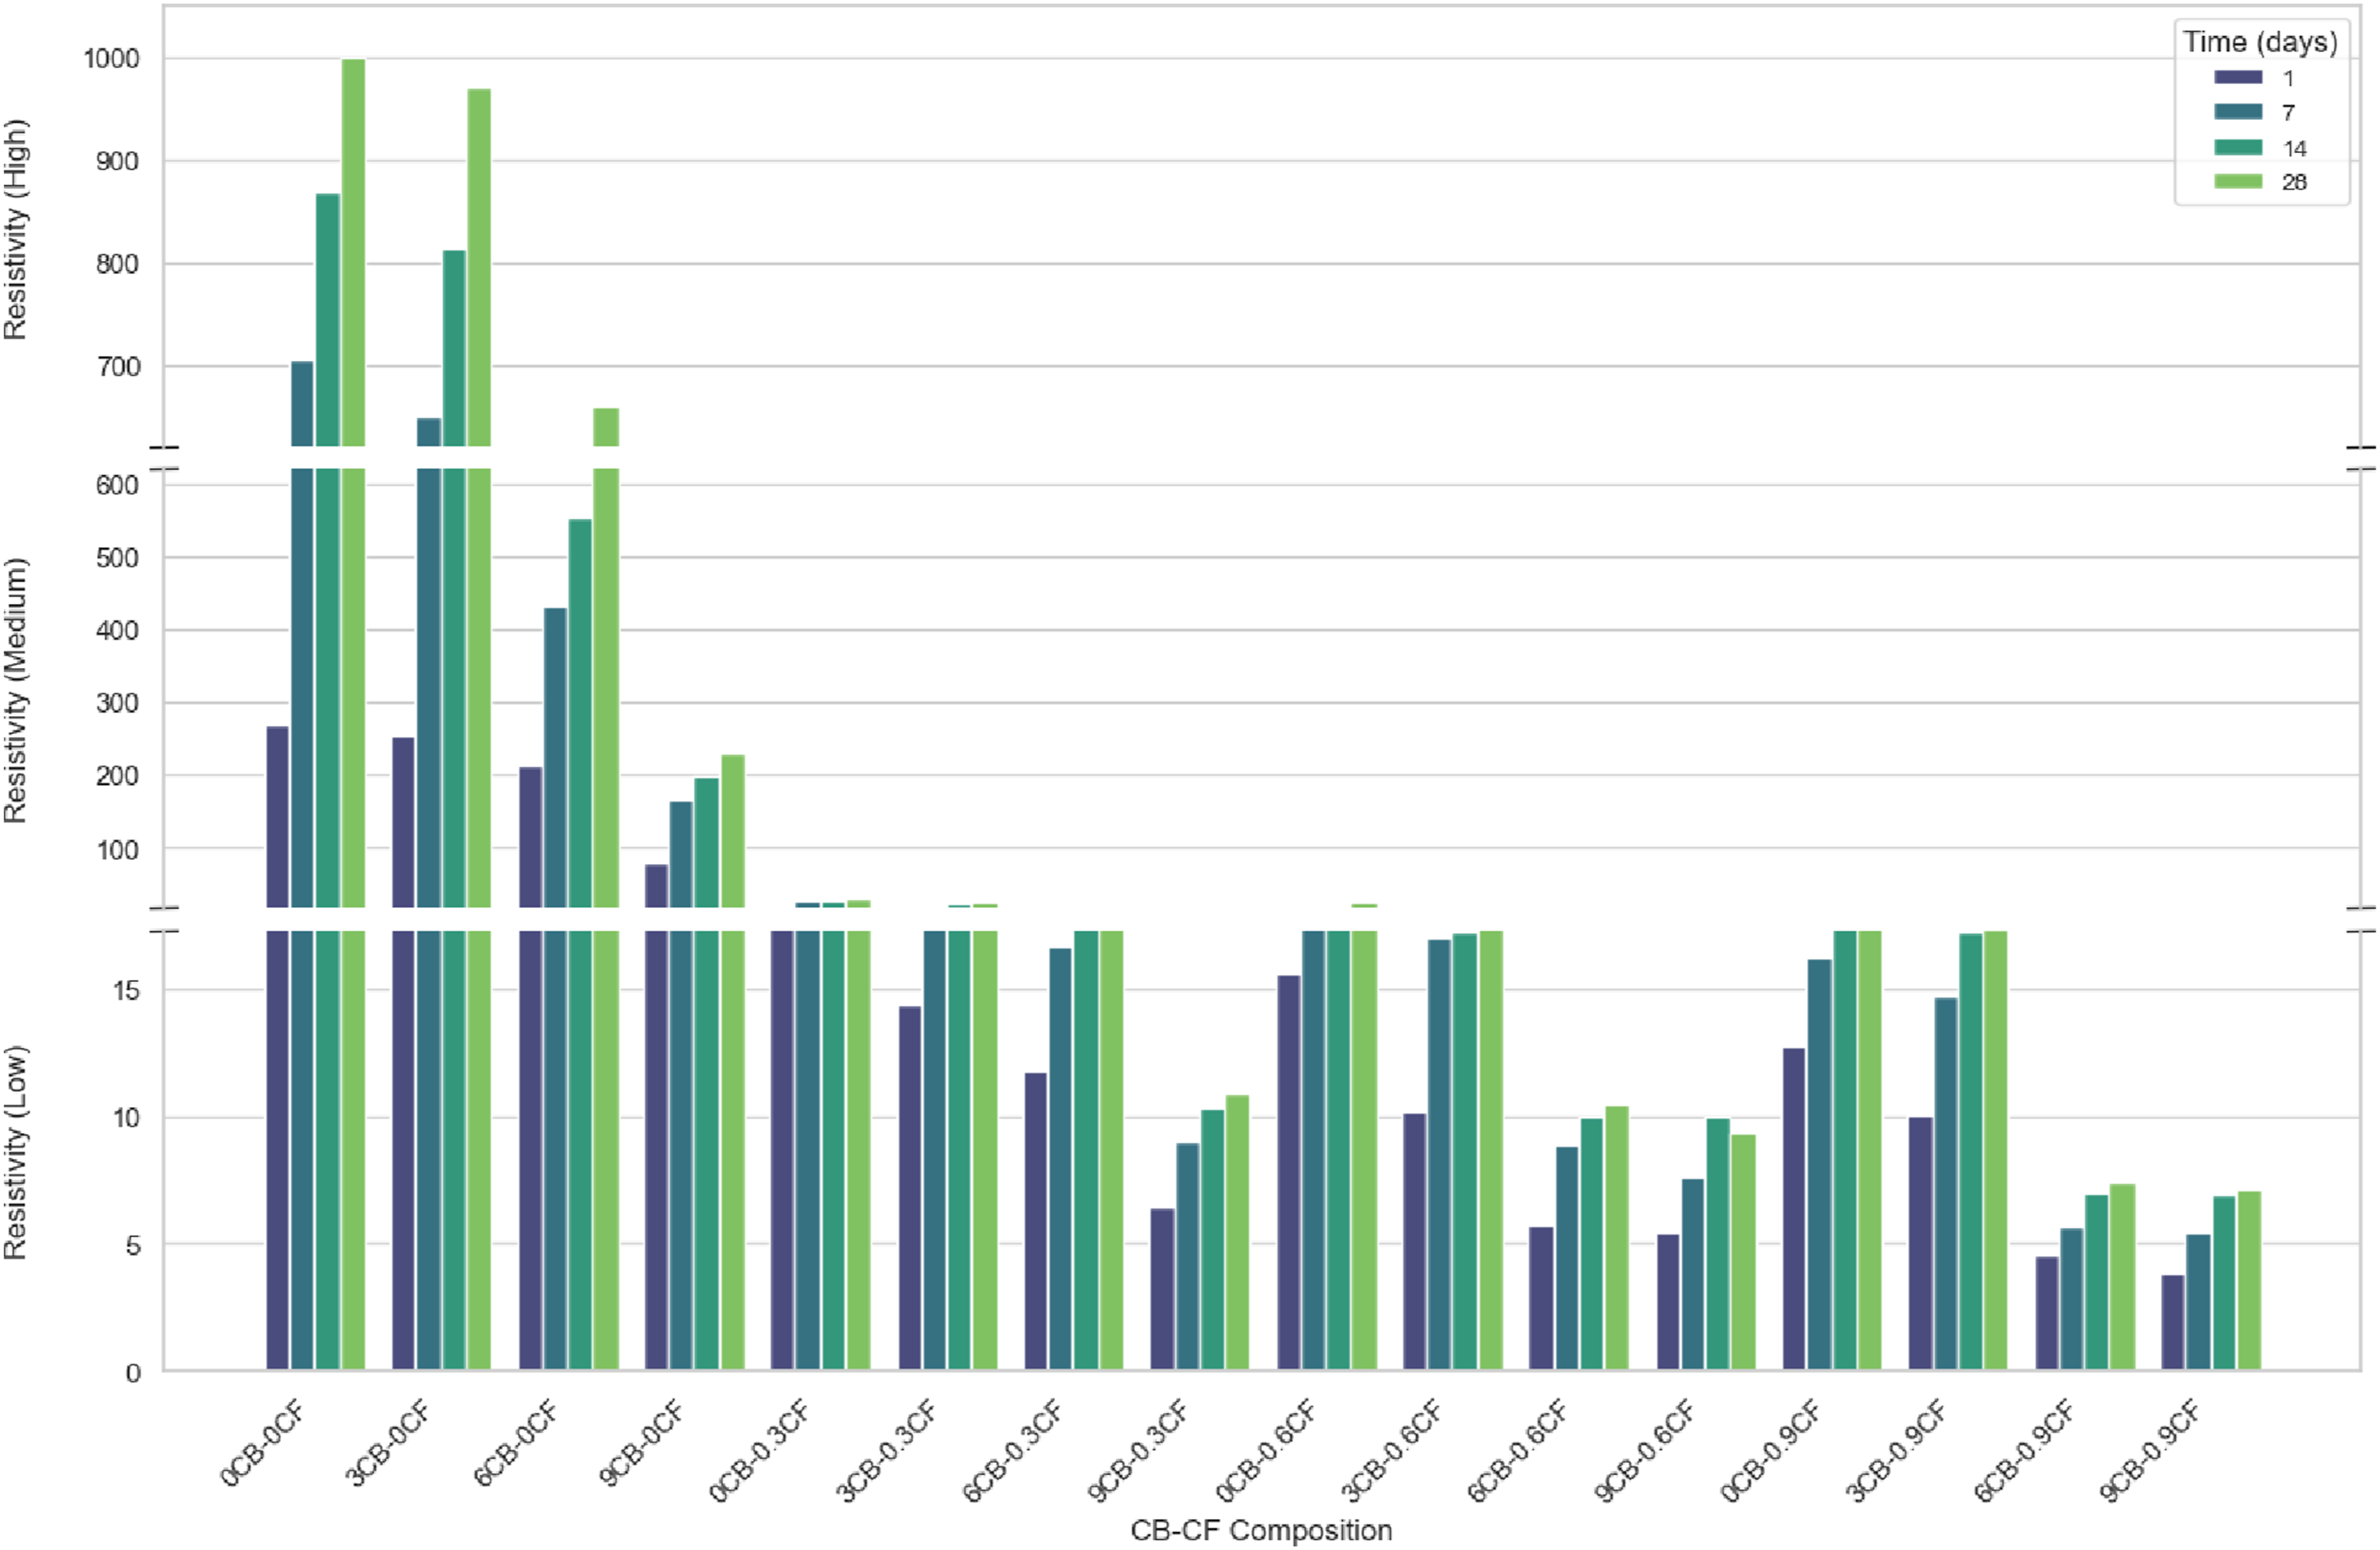
Regardless of the specific conductive filler content, a progressive increase in electrical resistivity is observed across all test specimens as curing time advances. This trend is directly linked to the cement hydration process, which governs the porosity reduction, phase development, and densification of the composite microstructure. 30 At early hydration stages, particularly at 1 day of curing, the material retains a high volume of interconnected pores filled with free water, enabling ionic conduction and resulting in relatively low resistivity values. However, as hydration progresses over time, calcium silicate hydrate (C-S-H) gel and other hydration products gradually fill the void spaces, leading to a reduction in ionic pathways and an overall increase in electrical resistivity. 31 This effect is observed in both the control and conductive filler-containing specimens, although the extent of resistivity changes varies depending on the type and concentration of conductive additives.
At 1 day of curing age, the control specimen exhibits an electrical resistivity of 267.5 Ω·cm, reflecting its high initial ionic conductivity due to free water content. Over the course of 28 days, the resistivity increases nearly fourfold, reaching 999.5 Ω·cm, underscoring the impact of hydration-induced densification on the material’s electrical properties. By contrast, composites incorporating the highest concentrations of conductive fillers—0.9 vol.% CF, 9 wt.% CB, and a hybrid mixture of 0.9 vol.% CF + 9 wt.% CB—demonstrate significantly lower resistivity values. Specifically, at 1 day of curing, the resistivity values for these specimens are recorded as 12.8 Ω·cm, 79.8 Ω·cm, and 3.9 Ω·cm, respectively. As hydration progresses and microstructural densification occurs, these values increase to 19.5 Ω·cm, 229.5 Ω·cm, and 7.1 Ω·cm, respectively, at 28 days of curing.
A comparison of the fractional increase in electrical resistivity from day 1 to day 28 reveals notable differences between the control sample and the conductive filler-containing composites. The control specimen exhibits the highest percentage increase, reaching 273.6%, due to its lack of an internal conductive network, making it more susceptible to hydration-driven microstructural changes. In contrast, composites incorporating 0.9 vol.% CF, 9 wt.% CB, and the hybrid formulation (0.9 vol.% CF + 9 wt.% CB) show fractional resistivity increases of 52.7%, 187.6%, and 83.3%, respectively. These findings suggest that while hydration-induced densification generally leads to increased resistivity over time, the presence of conductive fillers significantly mitigates this effect by maintaining a percolated conductive network within the composite.
Furthermore, the results highlight the superior conductivity-enhancing ability of CF compared to CB. The resistivity measurements indicate that CF inclusion leads to a more substantial reduction in electrical resistivity than CB, likely due to its high aspect ratio and ability to form long-range conductive networks within the cement matrix. 32
The electrical resistivity values obtained for specimens containing only carbon fiber (CF) or only carbon black (CB) are consistent with previously reported results. CF-only composites in this study exhibit resistivity values on the order of 10–20 Ω·cm at higher fiber contents, in agreement with reported values for low-doped carbon fiber reinforced cementitious materials where long-range conductive networks are formed.13,20 In contrast, CB-only specimens show higher resistivity levels, typically ranging from several tens to a few hundred Ω·cm, which aligns well with literature findings indicating that carbon black primarily enhances conductivity through localized particle contacts and tunneling effects rather than continuous conductive pathways.32,14
In summary, the data presented in Figure 2 confirm that hydration reactions play a dominant role in governing the evolution of electrical resistivity in cementitious composites, with the inclusion of carbon-based conductive fillers effectively reducing resistivity and moderating its increase over time. These findings demonstrate the potential of CF- and CB-modified cementitious composites for self-sensing applications, as their electrical properties remain significantly more stable compared to conventional cementitious materials.
Moisture effect on electrical resistivity
Figure 3 illustrates the influence of moisture content on the electrical resistivity of cementitious composites incorporating CF, CB, and their hybrid combinations (CF + CB). The electrical resistivity measurements are conducted on specimens subjected to different moisture exposure conditions to assess how varying levels of retained water influence resistivity. For moisture exposure tests, fully saturated specimens are progressively dried in an oven at 40°C, and electrical resistivity is measured at successive stages of moisture removal. To achieve this, three distinct moisture states are defined for testing: The first category, representing the fully saturated condition (100% moisture content), consists of specimens that are completely immersed in water for 28 days. Following immersion, the specimens are removed from the water, and their surface moisture is lightly dried using a towel before electrical measurements. In this condition, the cementitious pores remain entirely filled with water, maximizing the potential for ionic conduction. The second category, referred to as the partially dry condition (75% moisture content), includes specimens that are air-dried for 5 days after being removed from the 28-days water immersion period. The third category, denoted as the completely dry condition (0% moisture content), consists of specimens that undergo drying in a 40°C oven until they reach a constant weight, ensuring the complete removal of free moisture. This approach allows for a systematic evaluation of the progressive impact of moisture loss on electrical resistivity. The influence of moisture content on the electrical resistivity of cementitious composites incorporating CF, CB, and their hybrid combinations (CF + CB).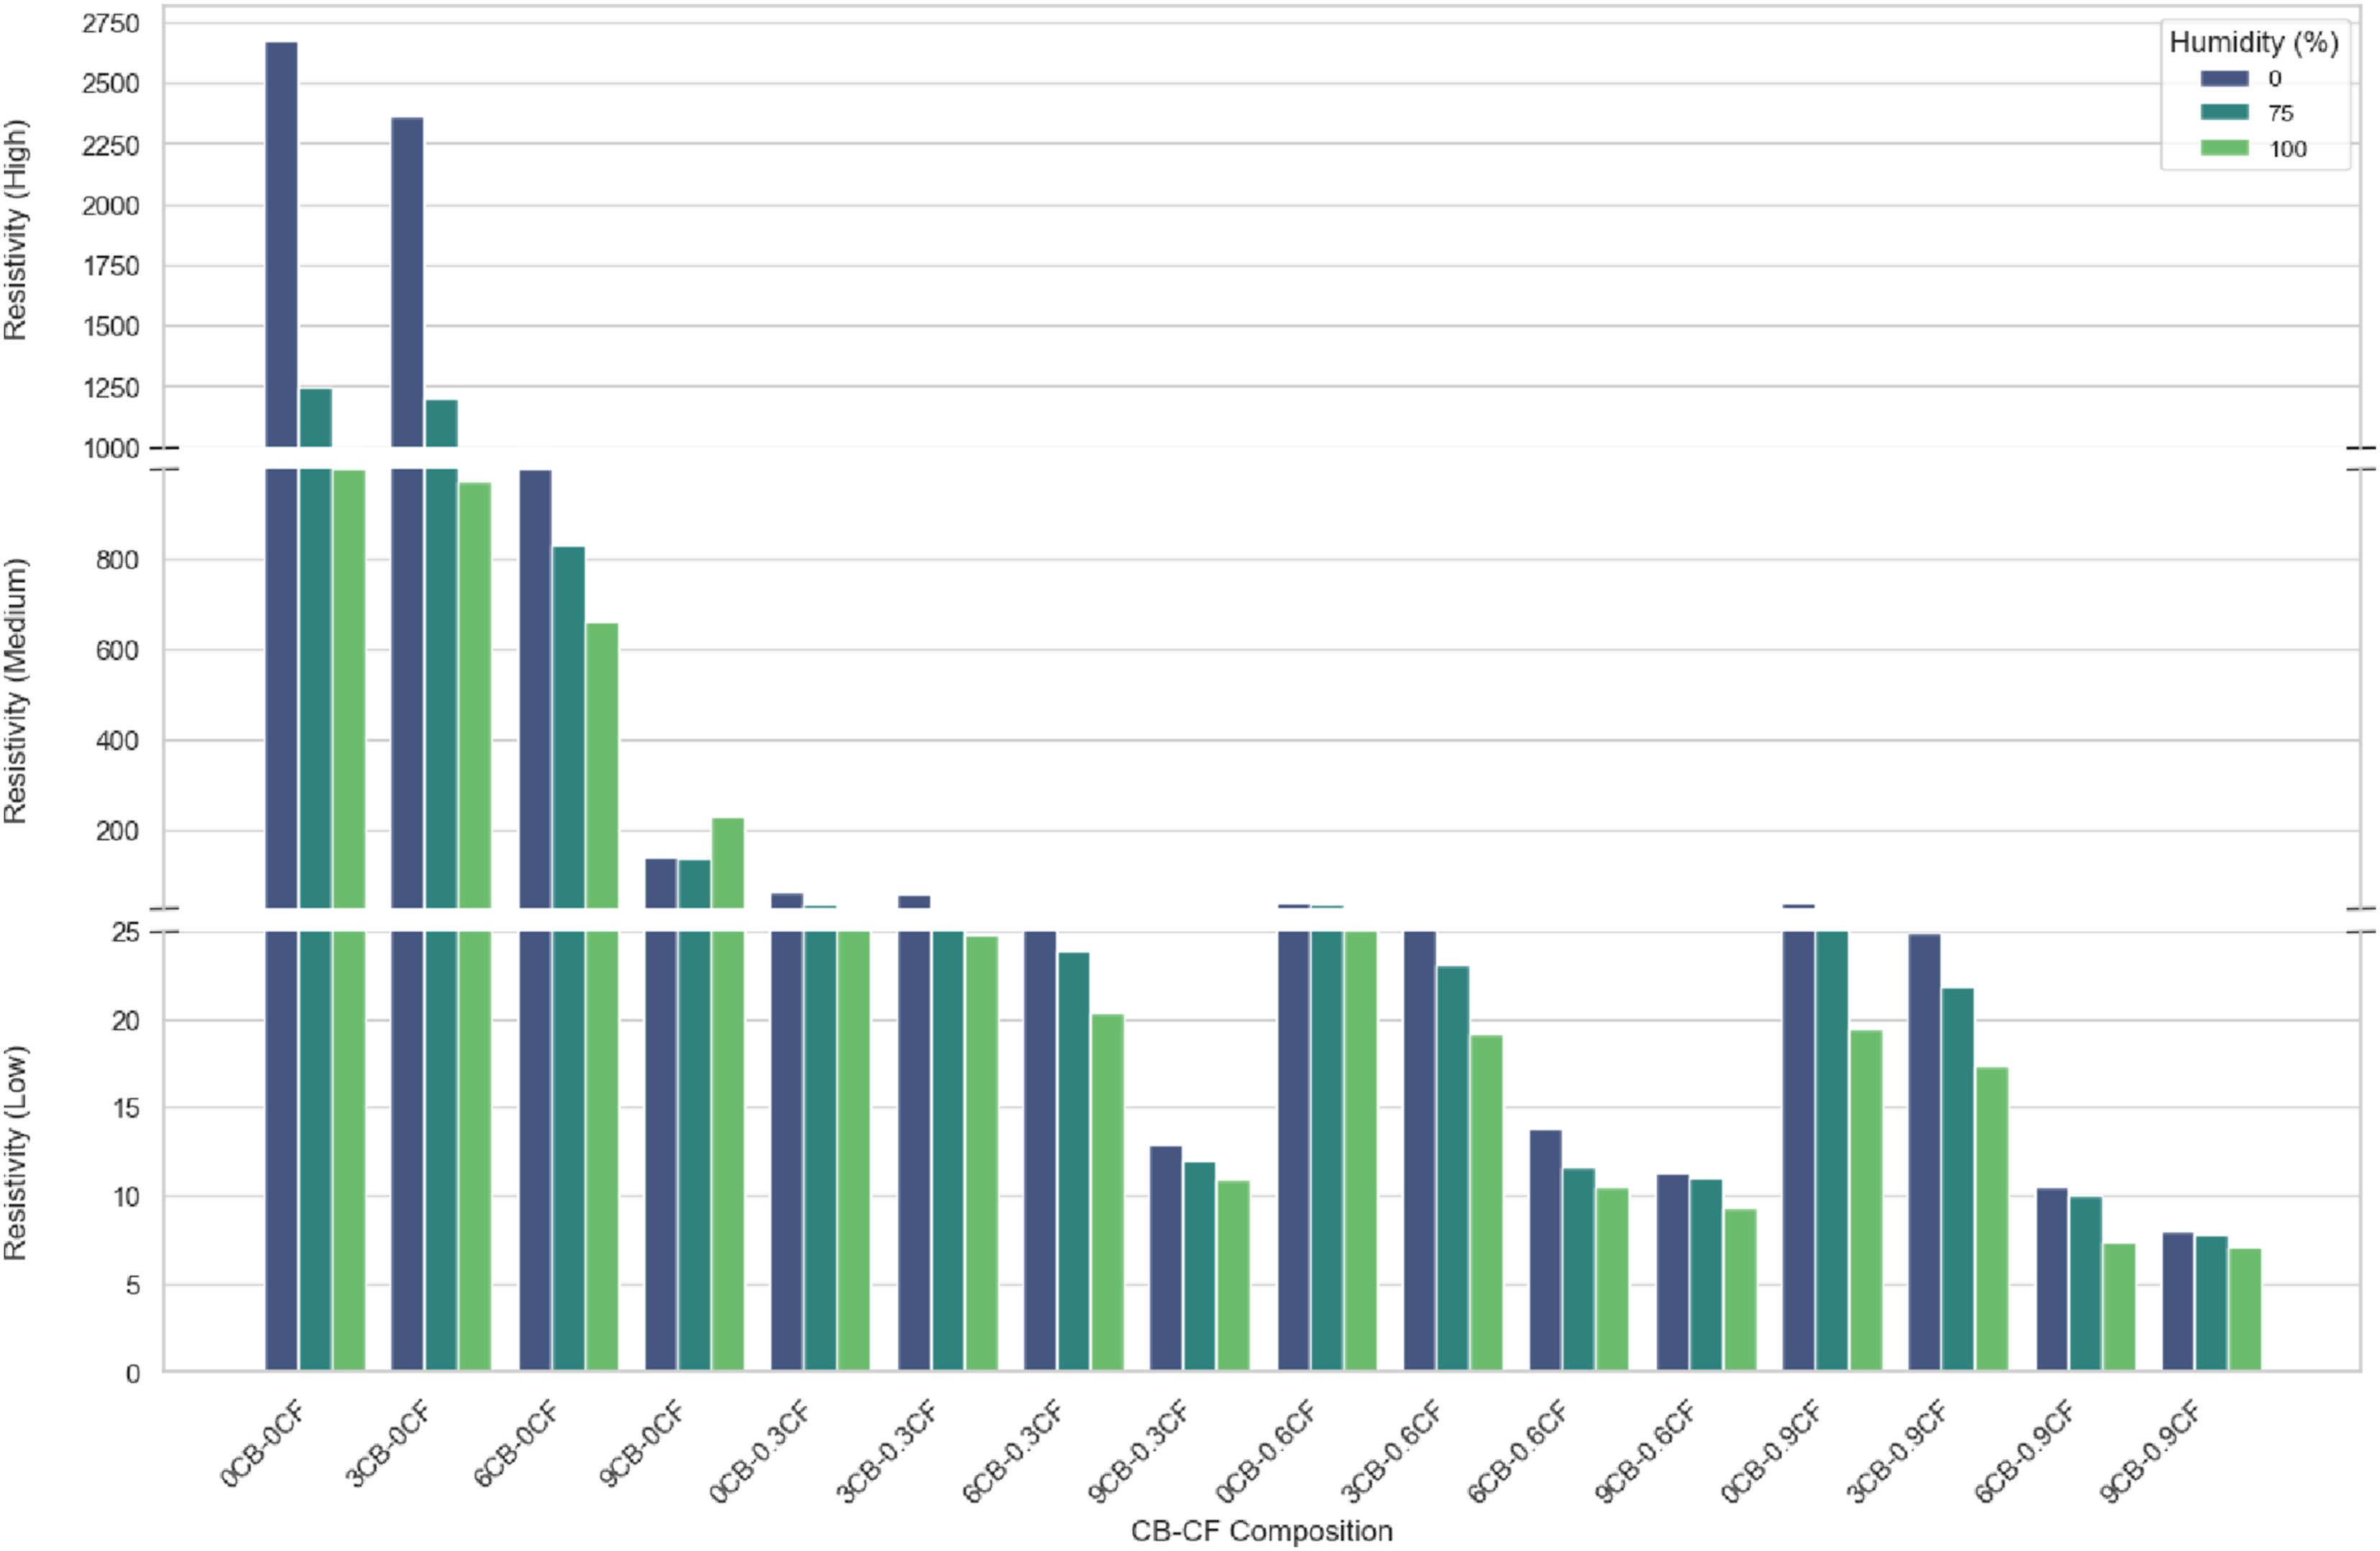
The results reveal that regardless of the type or concentration of conductive fillers, electrical resistivity increases as moisture content decreases. 33 When the specimens are in a fully saturated state, they exhibit the lowest resistivity values, which is attributed to the high ionic conductivity of water within the pore structure. In this condition, free ions within the pore solution facilitate charge transport, enabling efficient electrical conduction. 34 As moisture content decreases due to drying, the ionic pathways within the cementitious matrix become restricted, resulting in a progressive rise in electrical resistivity. This phenomenon is evident across all tested specimens, although the extent of resistivity variation depends on the type and concentration of conductive fillers.
The control specimen, which does not contain any conductive additives, exhibits a notable increase in electrical resistivity as moisture content decreases. At 100% moisture saturation, the electrical resistivity of the control specimen measures 1082 Ω·cm. As drying progresses and moisture is removed, resistivity rises approximately 2.5 times, reaching 2680 Ω·cm in the completely dry state. This substantial increase highlights the critical role of moisture-dependent ionic conduction in determining the electrical properties of cementitious composites. In comparison, specimens containing conductive fillers display a significantly lower rate of resistivity increase, suggesting that the conductive network established by CF and CB mitigates the impact of moisture loss on electrical conductivity.
For specimens containing the highest concentrations of conductive fillers—0.9 vol.% CF, 9 wt.% CB, and the hybrid mixture (0.9 vol.% CF + 9 wt.% CB)—the resistivity values at 100% moisture saturation are measured as 22.9 Ω·cm, 130.1 Ω·cm, and 7.5 Ω·cm, respectively. As the specimens transition to the completely dry state, these values increase to 36.8 Ω·cm, 141.9 Ω·cm, and 7.9 Ω·cm, respectively. The fractional increase in electrical resistivity between the saturated and fully dry states varies among different formulations, with increases of 60.9% for the 0.9 vol.% CF specimen, 9.2% for the 9 wt.% CB specimen, and only 6.3% for the hybrid CF + CB specimen. These values suggest that CB-containing specimens experience a much smaller change in resistivity compared to control specimens, while CF-containing specimens exhibit a more pronounced increase. The control sample, which lacks conductive fillers, undergoes the highest resistivity increase, reaching 147.6%, further confirming that moisture removal significantly influences electrical resistivity in cementitious composites without conductive reinforcements. This behavior may also be associated with differences in percolation thresholds, as specimens closer to or above the percolation limit exhibit more stable conductive networks that are less sensitive to moisture removal.
Among all tested formulations, the hybrid combination of CF and CB demonstrates the lowest resistivity fluctuations across different moisture levels. This behavior suggests the existence of a synergistic effect, wherein the combined presence of both CF and CB enhances electrical conductivity more effectively than either filler used individually. The enhanced performance of hybrid composites can be attributed to CF forming long-range conductive networks, while CB improves particle connectivity and enhances localized electron transport. As a result, the CF + CB hybrid mixture maintains greater conductivity stability across varying moisture conditions, making it more suitable for practical applications where environmental moisture fluctuations are inevitable.
Overall, the results presented in Figure 3 confirm that moisture content plays a crucial role in determining the electrical resistivity of cementitious composites. The presence of carbon-based conductive fillers reduces the extent of resistivity variations associated with moisture loss, making these composites more stable in changing environmental conditions. These findings highlight the potential of hybrid CF-CB composites for applications requiring long-term reliability in moisture-variable environments, such as smart infrastructure, self-sensing concrete, and conductive building materials.
Temperature effect on electrical resistivity
Figure 4 presents the variations in electrical resistivity of cementitious composites containing different proportions of CF, CB, and their hybrid combinations (CF + CB) as a function of temperature. To isolate the effects of temperature from moisture content, all tested specimens are completely dry, ensuring that observed resistivity changes are solely attributed to thermal effects. The variations in electrical resistivity of cementitious composites containing different proportions of CF, CB, and their hybrid combinations (CF + CB) for different temperatures.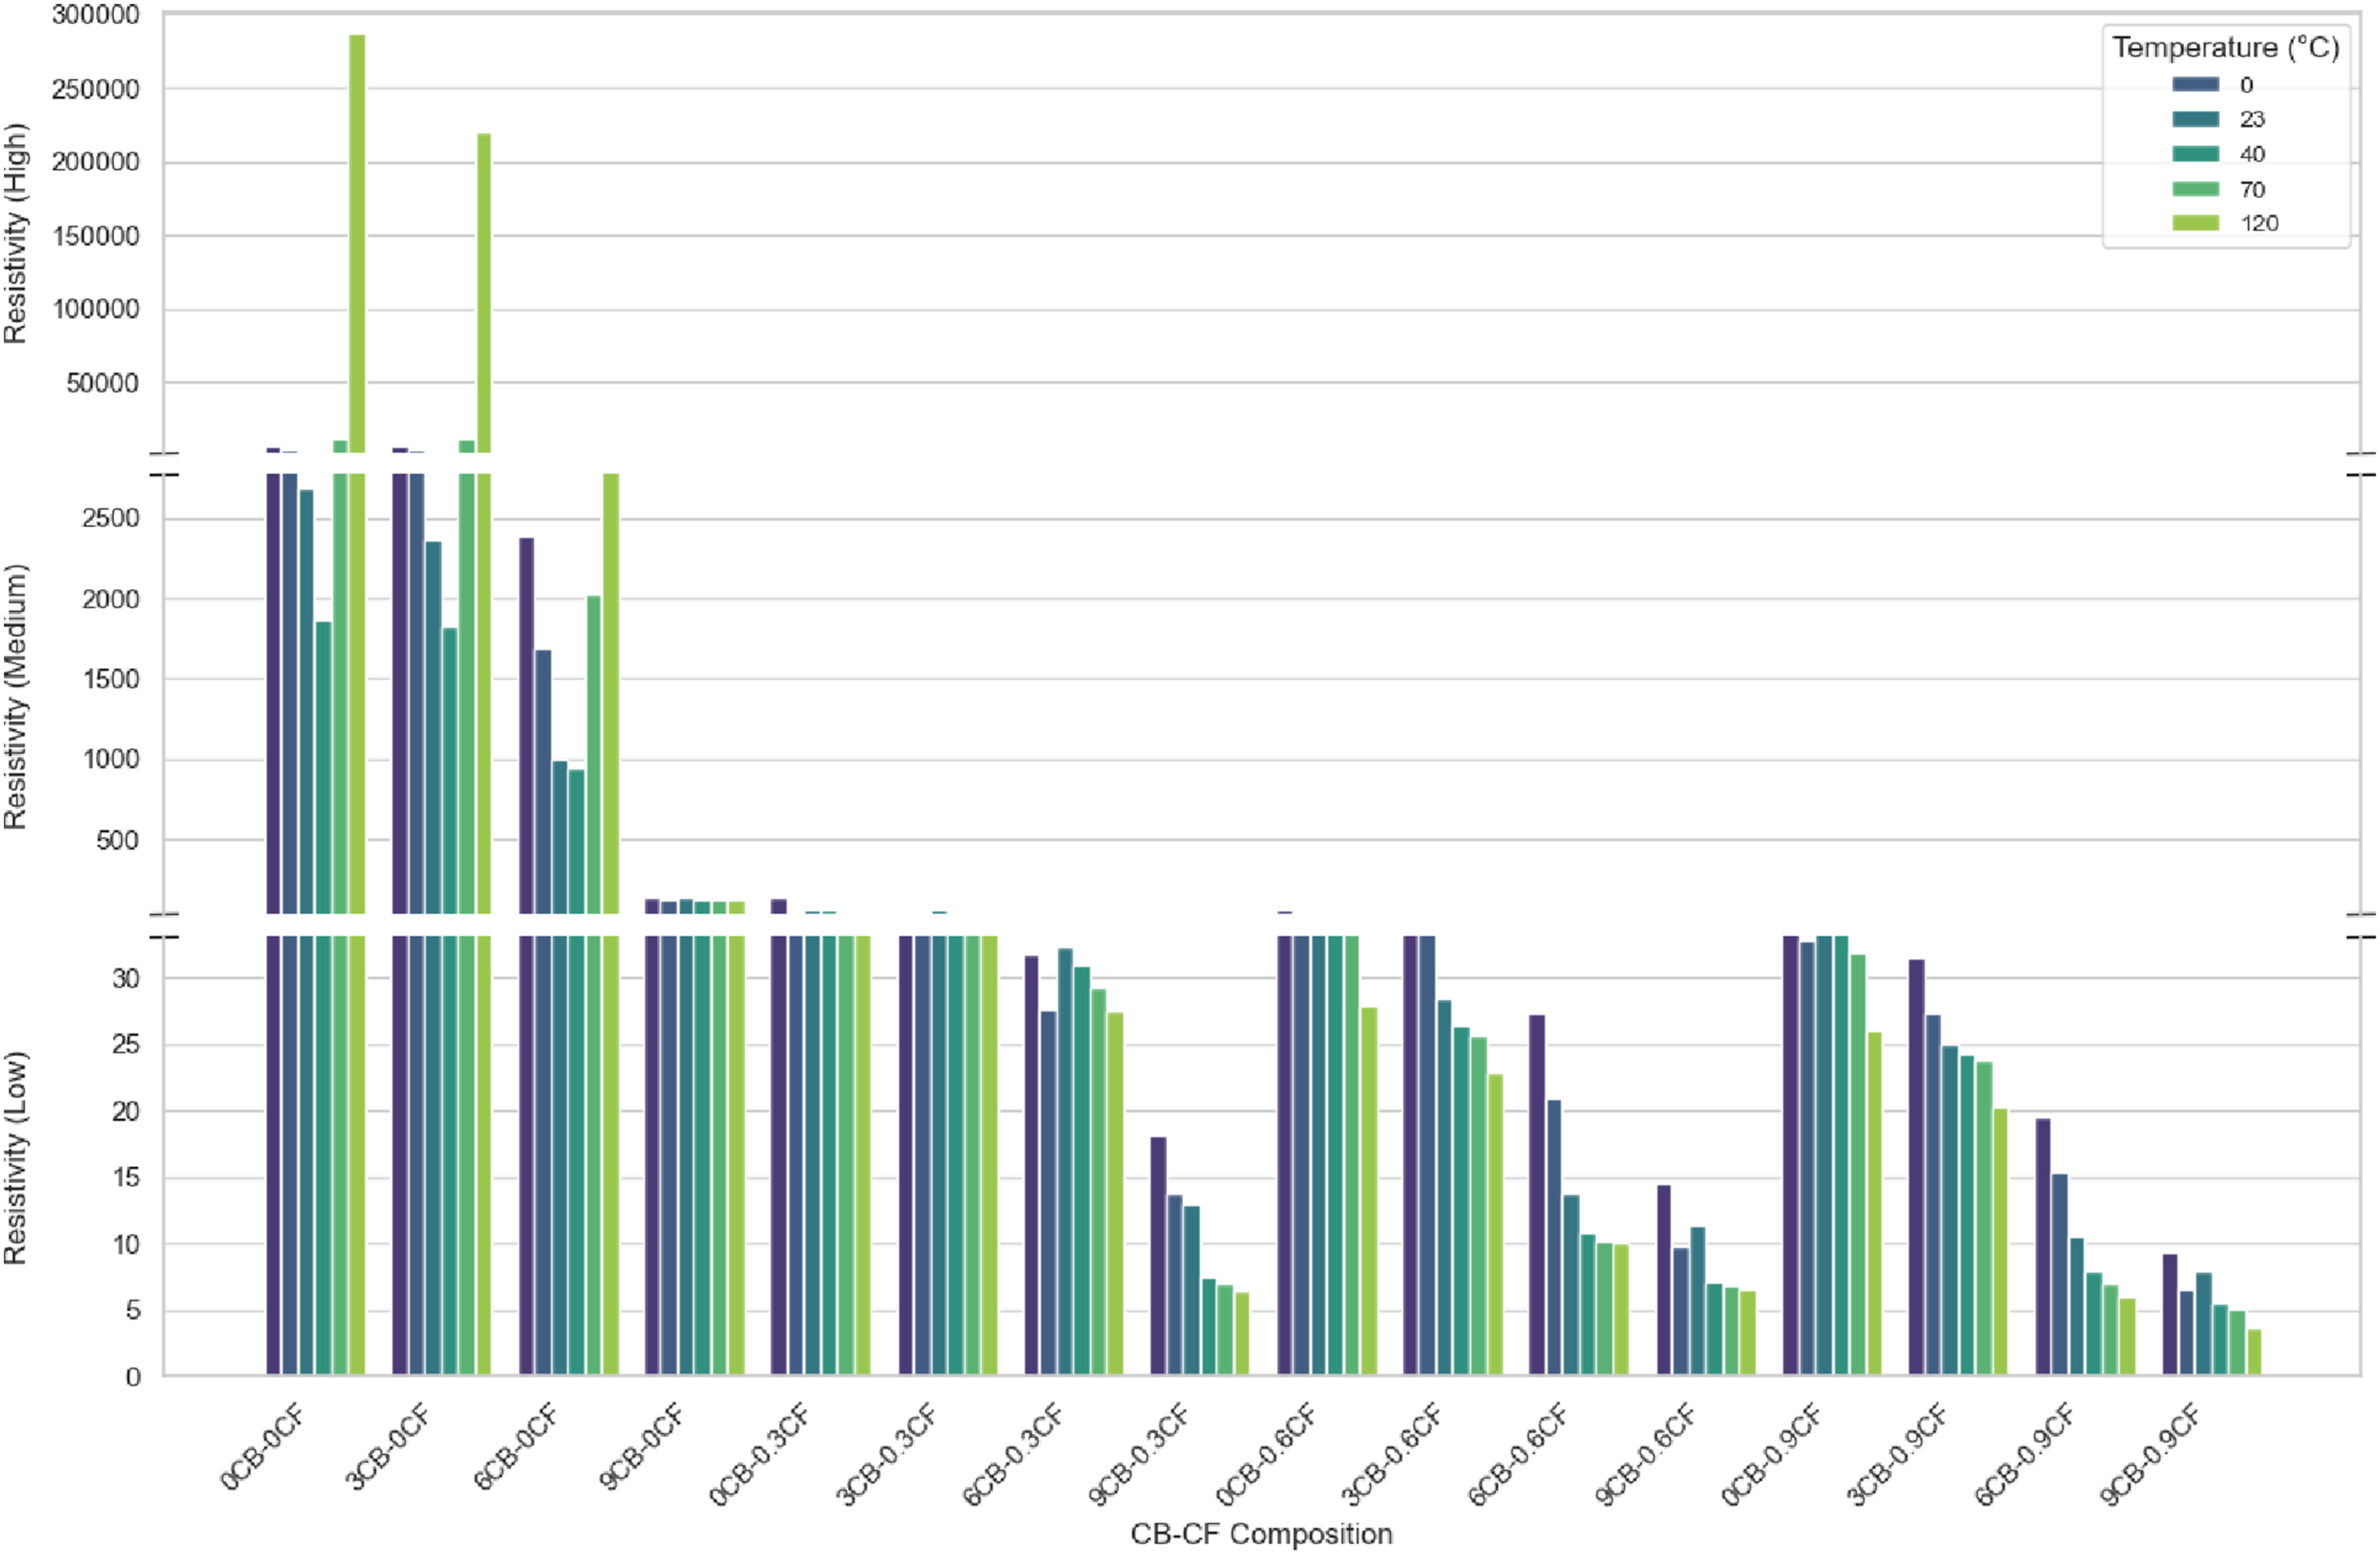
To examine the influence of elevated temperatures, the specimens are heated in an oven and tested at 24°C (room temperature), 40°C, 70°C, and 120°C. Conversely, to assess the impact of lower temperatures, the specimens are placed in a freezer and tested at 0°C. This systematic approach allows for a comprehensive evaluation of how electrical resistivity evolves across a broad temperature spectrum, from zero to high-temperature conditions.
The results indicate that regardless of conductive filler type or concentration, electrical resistivity increases as temperature decreases. 34 In general, lower temperatures correspond to higher resistivity values, which can be attributed to the reduced mobility of both ions and electrons within the cementitious matrix. 35 As temperature decreases, charge carriers experience increased resistance due to restricted mobility, leading to higher resistivity values. Therefore, as temperature decreases, electrical resistivity increases, regardless of the composition of the cementitious composite.
The control specimen, which does not contain any conductive fillers, exhibits a substantial increase in electrical resistivity at low temperatures. At 0°C, the electrical resistivity of the control specimen reaches 8460 Ω·cm. As the temperature increases to 24°C (room temperature), the resistivity decreases significantly, reaching 2680 Ω·cm, which corresponds to a reduction of nearly one-third of its resistivity at 0°C. Further heating to 40°C results in a continued decrease, bringing the resistivity down to 1864 Ω·cm. However, an unexpected trend emerges as the temperature is increasing beyond 70°C. At this point, the resistivity rises sharply, reaching 12,360 Ω·cm. When the temperature is further increased to 120°C, resistivity undergoes a dramatic rise, reaching 287,000 Ω·cm. This anomalous increase in resistivity at high temperatures is likely due to thermal cracking, which disrupts the conductive pathways within the composite, thereby increasing electrical resistance.
The influence of temperature on electrical resistivity is also strongly dependent on the type and concentration of conductive fillers present in the composite. For specimens containing the highest concentrations of conductive fillers—0.9 vol.% CF, 9 wt.% CB, and the hybrid mixture (0.9 vol.% CF + 9 wt.% CB)—the resistivity values at 0°C are measured as 44.12 Ω·cm, 138.2 Ω·cm, and 10.2 Ω·cm, respectively. As the temperature increases to 24°C, these values increase. The fractional decrease in electrical resistivity between 0°C and 24°C varies among different mixtures. For specimens containing 0.9 vol.% CF, 9 wt.% CB, and the hybrid mixture (0.9 vol.% CF + 9 wt.% CB), resistivity changes by 16.6%, 2.7%, and 22.2%, respectively.
A comparison of resistivity changes across different formulations reveals distinct trends. Increasing the temperature from 24°C to 40°C leads to a general decrease in resistivity for all tested specimens. However, at higher temperatures (above 70°C), different behaviors emerge depending on the filler type and concentration. In control specimens and composites containing lower CB concentrations (3 wt.% and 6 wt.%), resistivity increases unexpectedly at 70°C rather than decreasing, as would be expected in conductive materials. This increase is likely due to thermal cracking, which interrupts the conductive network and reduces electrical connectivity. 36
Conversely, in composites containing 9 wt.% CB, 0.3–0.9 vol.% CF, and all hybrid CF-CB formulations, electrical resistivity continues to decrease with increasing temperature, suggesting greater thermal stability in these mixtures. For instance, in the 9 wt.% CB specimens, increasing the temperature from 24°C to 120°C leads to a reduction in resistivity to 120.94 Ω·cm. Similarly, in the 0.9 vol.% CF specimen, the resistivity decreases to 26 Ω·cm at 120°C. The most significant reduction is observed in the hybrid composite (0.9 vol.% CF + 9 wt.% CB), where resistivity drops to just 3 Ω·cm at 120°C, highlighting the superior conductivity of this formulation.
The fractional decrease in electrical resistivity between 24°C and 120°C varies among different mixtures. For specimens containing 0.9 vol.% CF, 9 wt.% CB, and the hybrid mixture (0.9 vol.% CF + 9 wt.% CB), resistivity decreases by 29.3%, 14.8%, and 53.4%, respectively. These results indicate that CB-containing specimens exhibit the least variation in resistivity across different temperatures, suggesting that CB enhances thermal stability and minimizes fluctuations in conductivity.
Some non-monotonic resistivity trends, particularly the abrupt increase and signal instability observed in the control specimens at elevated temperatures, are attributed to the sensitivity of ion-dominated conduction mechanisms to thermal degradation. Dehydration and thermally induced microcracking disrupt ionic transport in the plain cement matrix, whereas specimens containing carbon-based conductive fillers exhibit smoother resistivity variations with reduced scatter due to filler-dominated electronic conduction. The variability of the measurements was quantified using standard deviation and coefficient of variation, indicating good repeatability of the resistivity data despite the intrinsic heterogeneity of cementitious materials.
Overall, the data in Figure 4 confirms that electrical resistivity is highly dependent on temperature, with resistivity increasing at lower temperatures due to reduced charge mobility and, in some cases, increasing at high temperatures due to thermal cracking effects. The combination of CB demonstrates the lowest resistivity fluctuations across the tested temperature range, reinforcing its superior thermal stability. These findings highlight the importance of selecting appropriate conductive fillers in cementitious composites to ensure reliable electrical performance across varying temperature conditions, particularly in self-sensing applications and smart infrastructure monitoring systems.
Computational results: Statistical analysis and machine learning prediction
Figure 5 illustrates the structured progression of the machine learning methodology adopted in this research. Initially, the complete dataset is partitioned into two distinct components: a development subset used for model construction, and a separate test subset reserved for final performance assessment. The development data is subsequently divided into training and validation portions. Within the training phase, processes such as hyperparameter tuning and k-fold cross-validation are systematically applied. The outcomes of these procedures inform the selection of the most effective model configuration. Finally, the chosen model is subjected to evaluation using the previously unseen test data to objectively determine its predictive accuracy and generalization performance. Workflow of the ML process.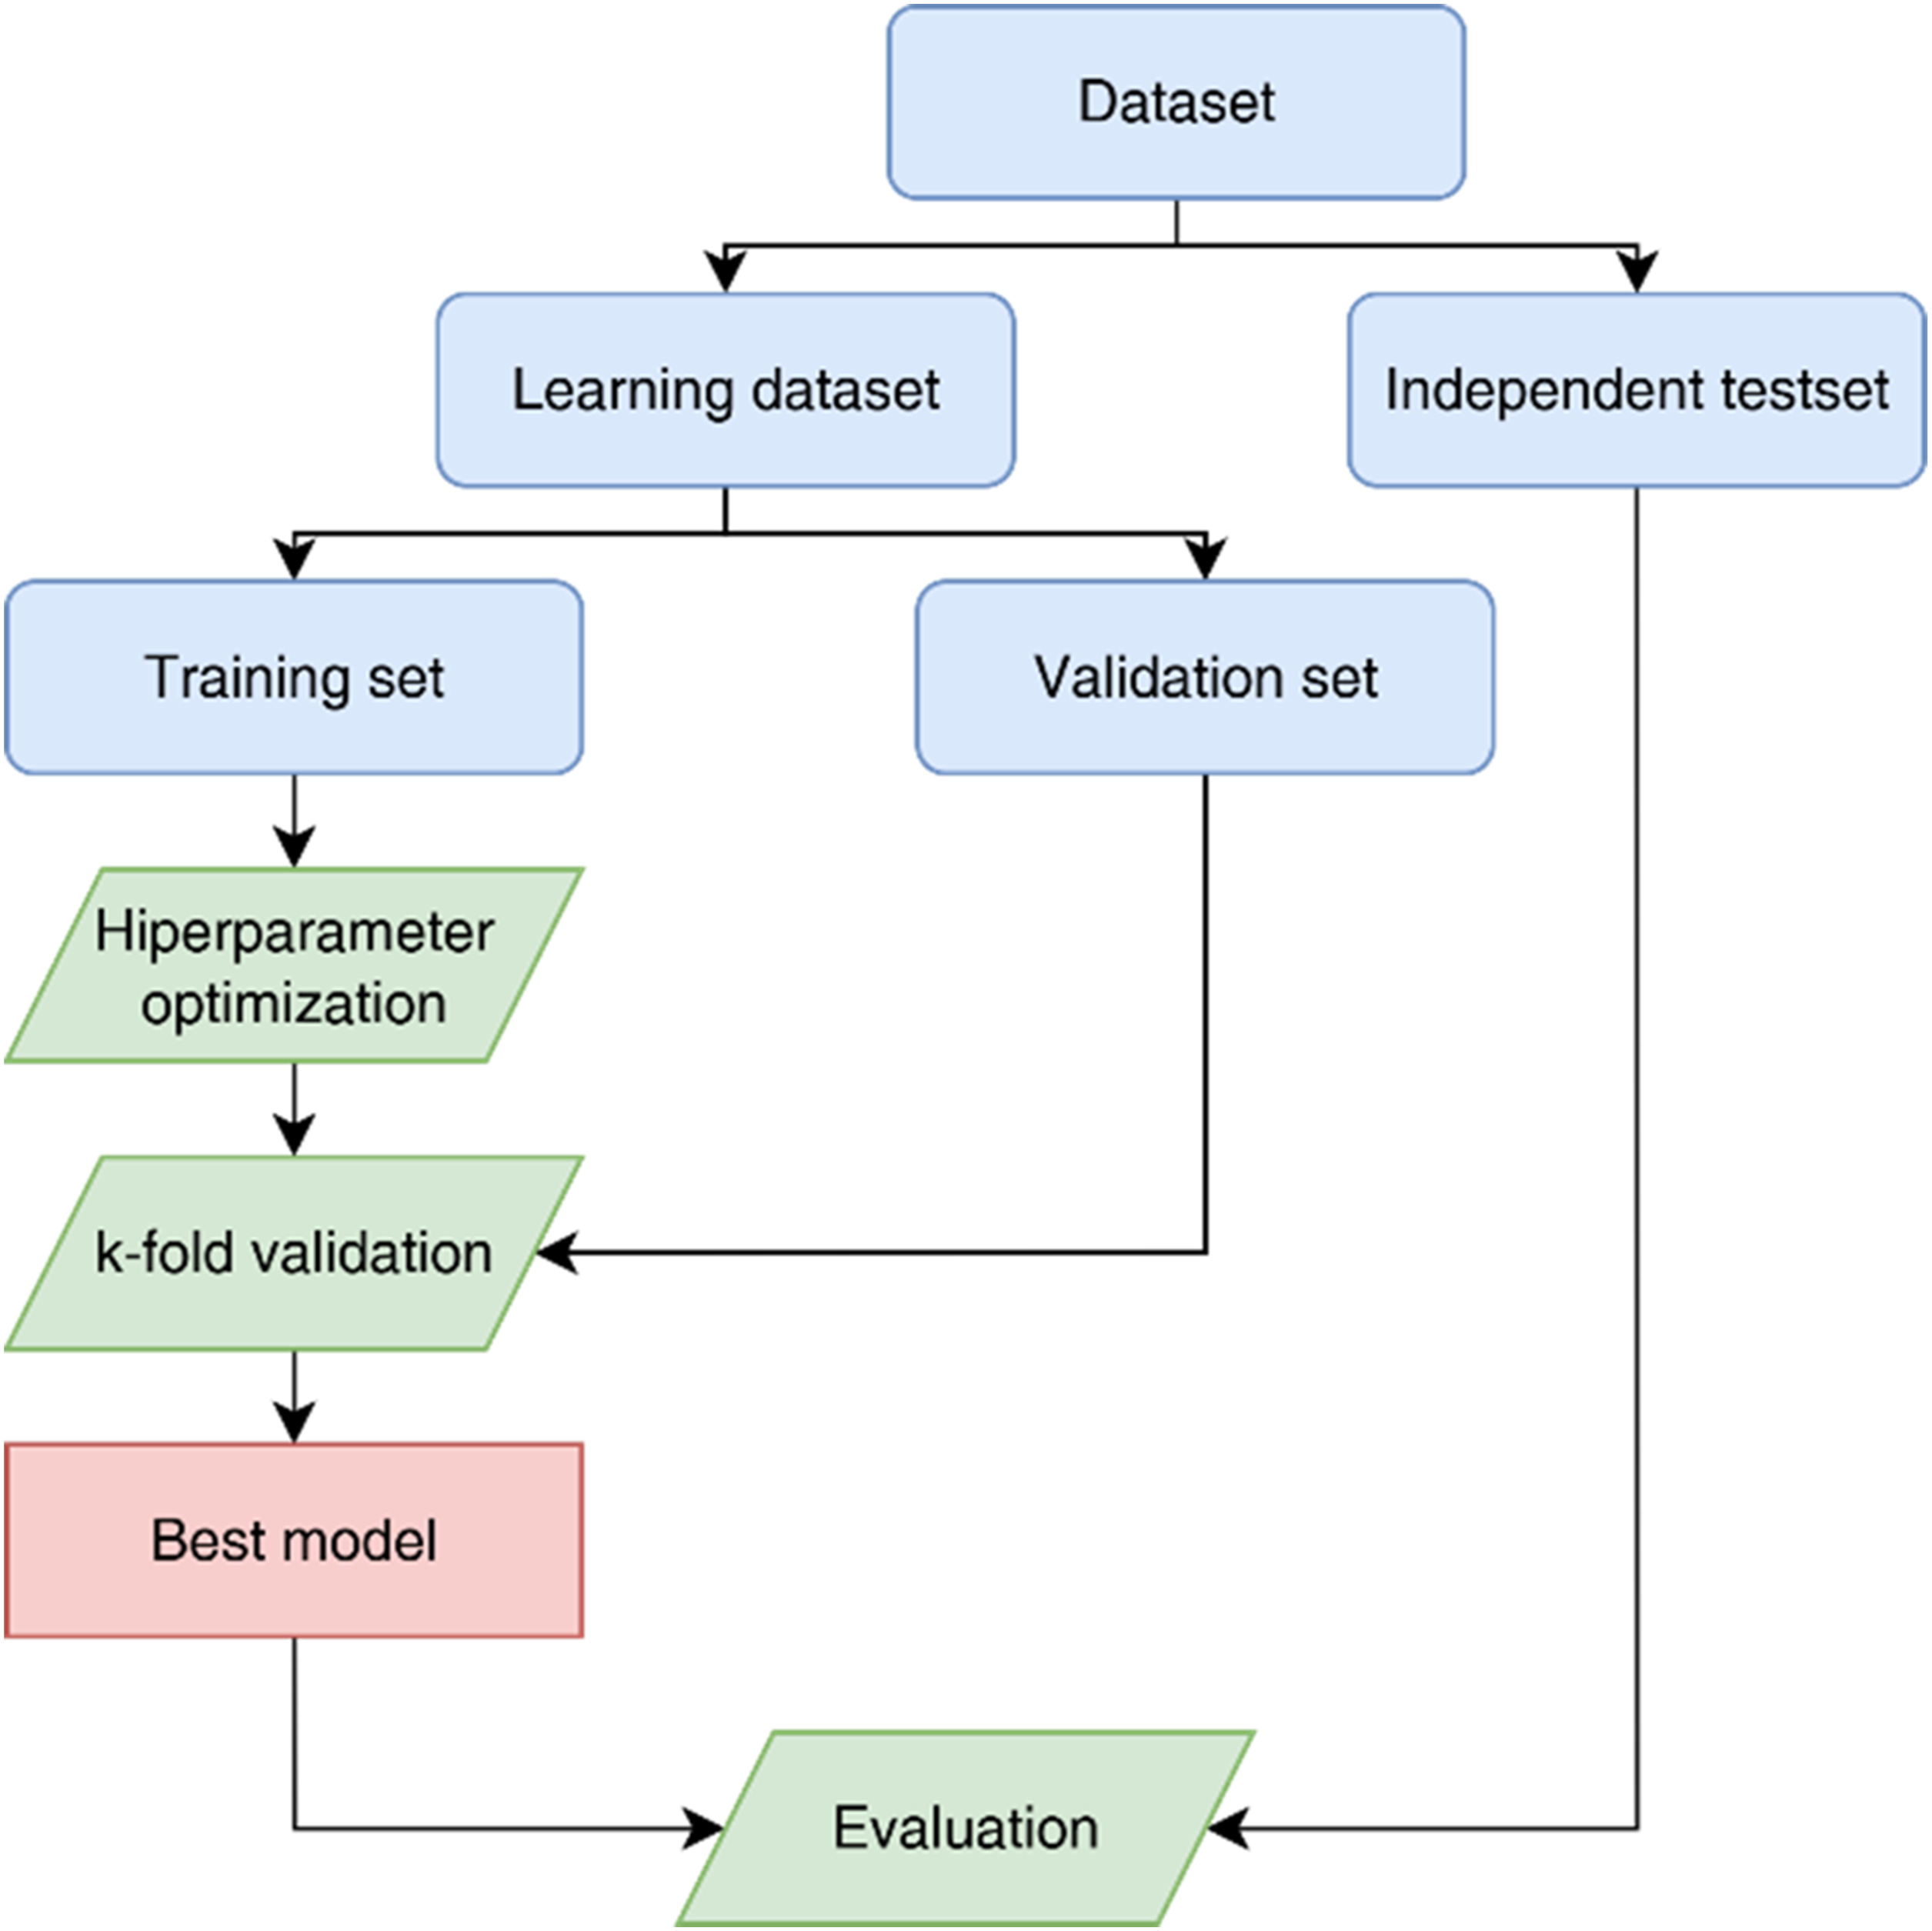
Database description and pre-processing
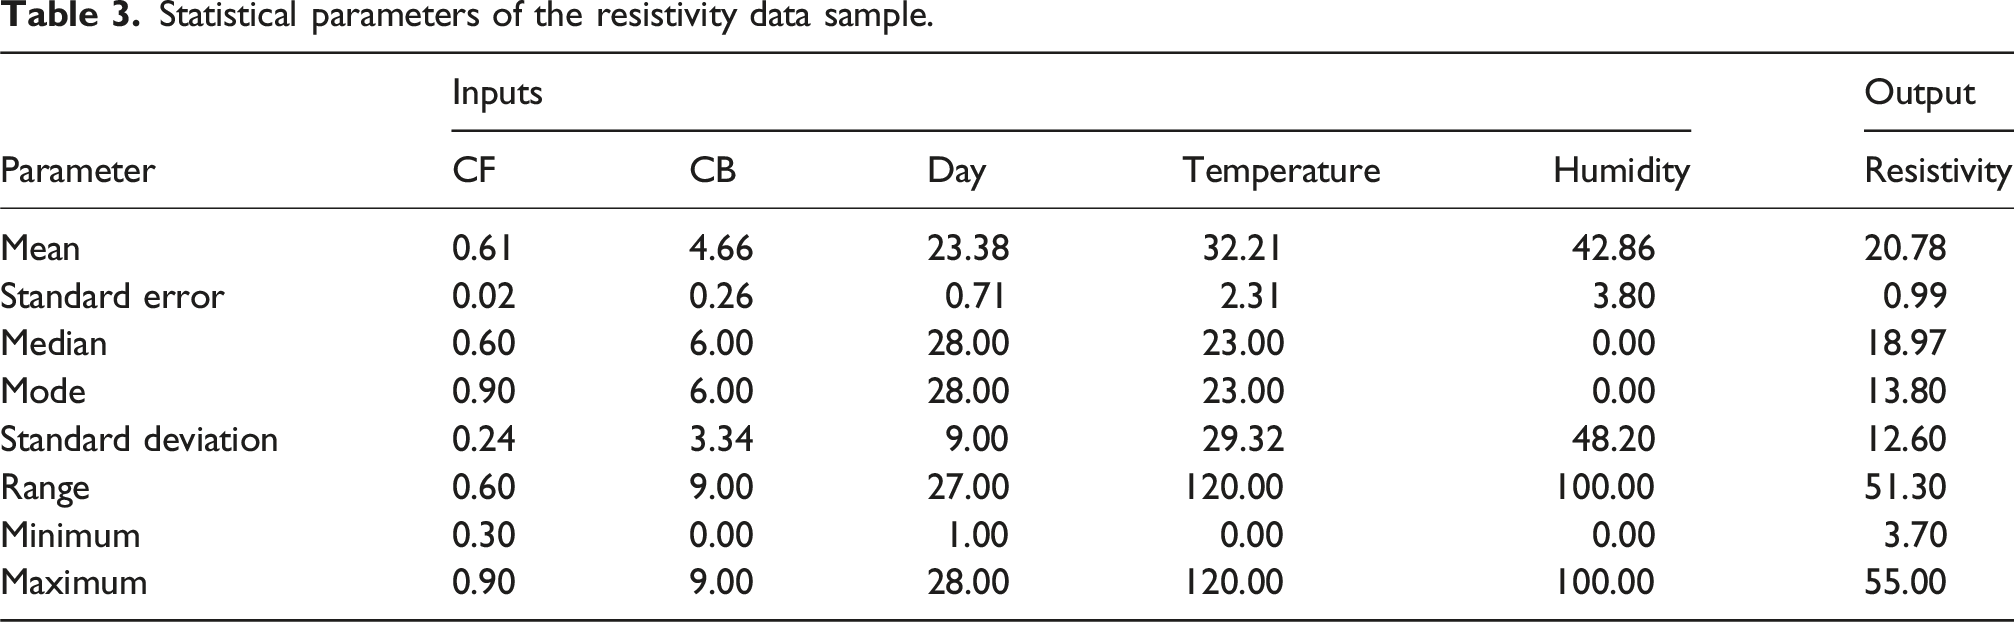
The dataset is thoroughly examined prior to modelling. No missing values are found in either the input or the output variables. To ensure comparability among features and improve model performance, all input variables are standardized using Z-score normalization.
Statistical parameters of the resistivity data sample.
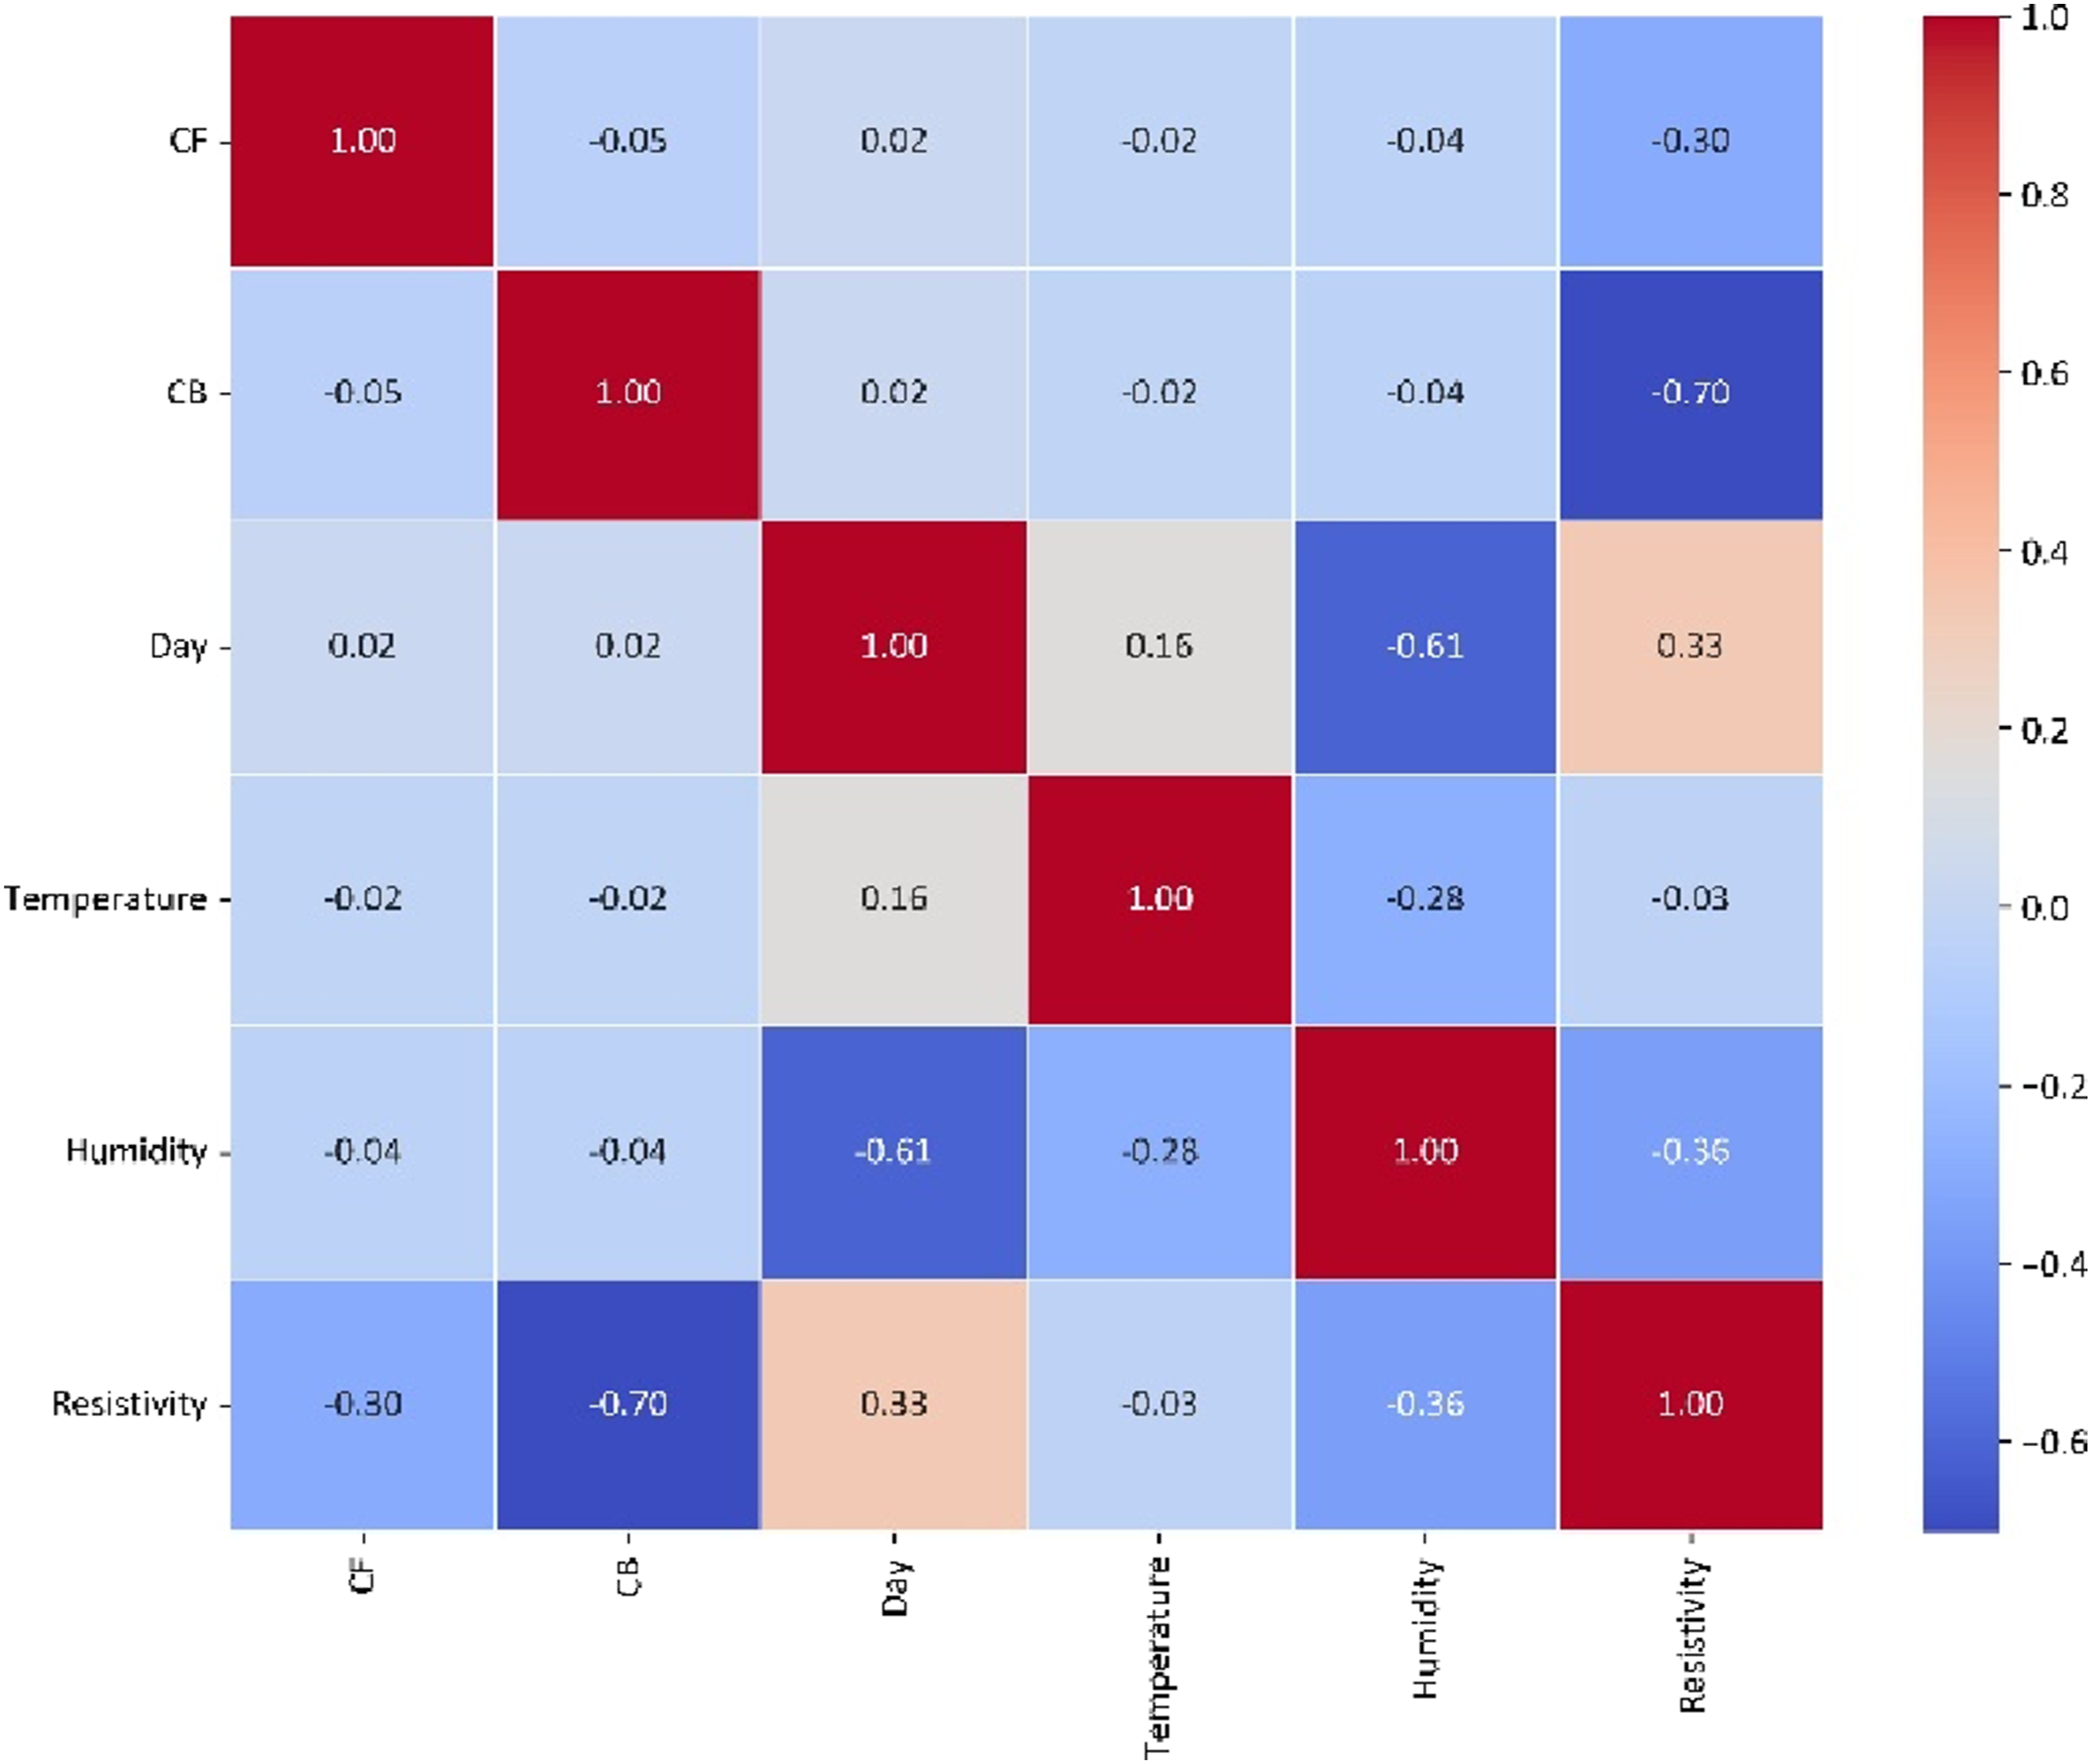
Pearson’s correlation coefficient between variables.
Analysis of the correlation matrix reveals several significant relationships among the variables. Notably, resistivity shows relatively strong negative correlation with CB (−0.70) and somewhat negative correlation with CF (−0.30) and humidity (−0.36). On the other hand, it is somewhat positively correlated with day (0.33). Additionally, humidity and day exhibit a relatively strong negative correlation (−0.61). These findings suggest that CB and CF might have some degree of influence on the resistivity with the resistivity decreasing as CB and CF increase while it is positively correlated with the number of days.
Description of employed techniques
In this study, three machine learning models, including XGBoost, Support Vector Regression (SVR), and Multilayer Perceptron Regression (MLP) are employed to model the effects of the input variables on resistivity. Overall, these models share the ability to capture nonlinear relationships and complex interactions among input variables, which is essential for accurately modeling resistivity. XGBoost stands out for its robustness against overfitting and reduced sensitivity to feature scaling, while SVR provides stable performance but requires careful scaling and higher computational effort. MLP offers high flexibility in learning complex patterns; however, it behaves more like a black-box model and is more prone to overfitting. Therefore, employing these three models together enables a balanced evaluation of predictive performance, robustness, and model complexity. The dataset is divided into an 80% training set and a 20% test set, and model training is conducted accordingly. The scikit-learn library is extensively used for data preprocessing, hyperparameter optimization, and model validation through k-fold cross-validation.
XGBoost regressor
The XGBoost algorithm, developed by Chen and Guestrin, is based on the fundamental principle of gradient tree boosting (GTB) algorithms, which aim to build a high-error decision trees (also known as base or weak learning trees) by combining multiple weak decision trees with high error rates. 37 XGBoost is capable of rapidly generating boosting trees, running in parallel, and solving both regression and classification problems. 38 The primary goal of this algorithm is to maximize the value of the objective function. By leveraging modern computational advantages such as parallel and distributed processing, XGBoost enables faster model training and achieves higher accuracy rates. 39 The algorithm consists of multiple decision trees, each constructed using the gradient descent method. Throughout the model training process, each new tree is optimized to minimize the errors made by the previous ones.
Although the number of studies considering the prediction of electrical resistivity is limited, the superior predictive performance of the algorithm aligns with findings from previous studies in the literature, where XGBoost is consistently demonstrated high accuracy and generalization capability across various concrete types. In particular, its effectiveness has been validated in estimating the strength of high-performance concrete, ultra-high-performance concrete, fiber-reinforced polymer strengthened concrete, and geopolymer concrete.40–43 The algorithm’s ability to iteratively reduce prediction errors through gradient boosting and handle complex nonlinear relationships makes it a robust and reliable tool in civil engineering applications in general. These results collectively affirm that XGBoost is not only suitable for conventional datasets but also highly applicable to diverse concrete systems, providing strong support for its use in practical prediction tasks.
Support vector regressor
Support Vector Machine (SVM), a supervised learning algorithm originally developed by Vapnik, 44 is rooted in the principles of Vapnik-Chervonenkis theory. Though initially formulated for classification and regression tasks, the approach has evolved into Support Vector Regression (SVR) to improve predictive performance in continuous output problems. 45 SVR operates by minimizing prediction deviations while identifying the most appropriate function to map the training data. Furthermore, it emphasizes maintaining functional smoothness, which aids in preventing the model from converging to suboptimal local minima during the learning phase. 46
Multi-layer perceptron
The Multilayer Perceptron (MLP), a type of artificial neural network (ANN), is extensively utilized across a broad range of machine learning applications, encompassing both regression and classification tasks.47,48 Originating from the seminal work of McCulloch and Pitts, 49 the concept of ANNs has laid the groundwork for the development of modern deep learning frameworks. Structurally, MLPs are composed of an input layer, one or more hidden layers, and an output layer, forming a feed-forward topology. Neurons in each layer are densely connected to all neurons in the succeeding layer, and the size of the input layer directly corresponds to the number of features in the dataset. The architecture of hidden layers—both in terms of quantity and neuron count—can be tailored to suit the complexity of the target problem. 50 Owing to their ability to incorporate various activation functions, such as sigmoid, tanh, and ReLU, MLPs are well-suited for capturing non-linear patterns in data. 51
MLPs are trained using a combination of forward and backward propagation algorithms. During training, the discrepancy between the model’s predictions and the actual target values is quantified using a predefined loss function. This error signal is then propagated backward through the network to iteratively adjust the model’s weights via optimization techniques. Among these, Stochastic Gradient Descent (SGD) is widely adopted for its simplicity and efficiency, updating parameters using mini batches of data. More advanced optimizers, such as Adam, introduce adaptive learning rates and momentum-based gradient estimations to achieve faster convergence and improved stability. Additionally, the Limited-memory Broyden–Fletcher–Goldfarb–Shanno (L-BFGS) algorithm, which leverages second-order derivative information, is particularly effective for fine-tuning models on smaller datasets. Owing to their multi-layered, adaptable architecture, MLPs continue to serve as a robust and flexible approach in contemporary machine learning tasks. 52
SHAP analysis
SHAP (SHapley Additive exPlanations) is an interpretability framework grounded in cooperative game theory, which utilizes Shapley values to quantify the individual contribution of each input feature to a model’s prediction.53,54 Within this paradigm, features are conceptualized as players in a game, and the model’s output represents the resulting payoff. 55 First introduced by Lundberg and Lee, 56 SHAP is categorized under additive feature attribution methods, which distribute prediction values among input variables in a fair and mathematically consistent manner. TreeSHAP, a specialized adaptation for tree-based algorithms such as Decision Trees (DT), Random Forests (RF), and Extreme Gradient Boosting (XGB), allows for efficient and accurate computation of feature importances. By demystifying the inner workings of complex machine learning models, SHAP contributes significantly to model transparency and trustworthiness.57,58 Furthermore, SHAP offers various visualization tools, such as summary plots and dependence plots, that help elucidate both the direction and magnitude of feature effects on individual predictions.59,60
Hyperparameter tuning and optimization
In supervised ML models, including regression and classification, selecting appropriate hyperparameters is a critical step in model training. 61 Although hyperparameter values may be set using default settings from the corresponding ML packages or determined through a trial-and-error process, the trial-and-error approach may be time-consuming and labor-intensive. 62 In general, hyperparameter optimization and tuning techniques are often employed to save time and resources.
Hyperparameter settings for ML models in resistivity estimation.

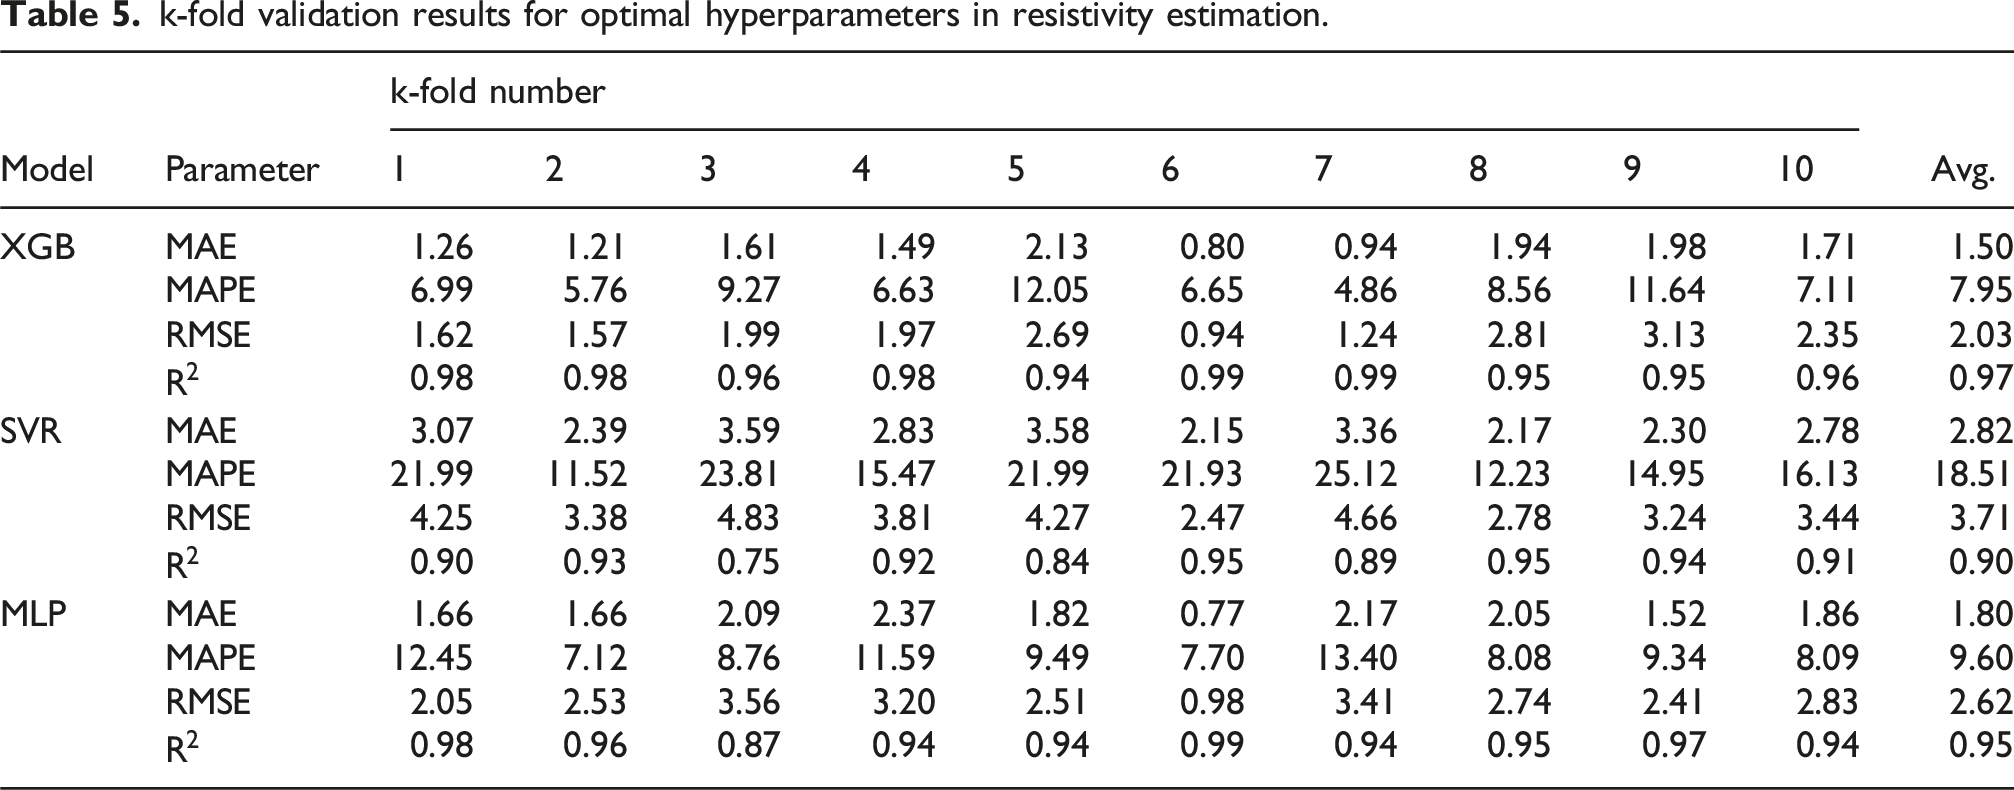
k-fold validation results for optimal hyperparameters in resistivity estimation.
Performance evaluation of models
The performance of the model is assessed using statistical parameters such as R2, MAE, RMSE, and MAPE. In addition to the R2 score reflecting the accuracy of the model, the statistical evaluation of model accuracy is conducted using Equations (3)–(5), where 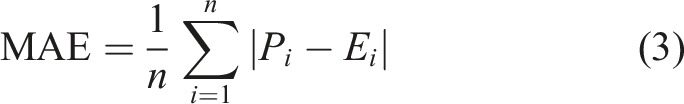

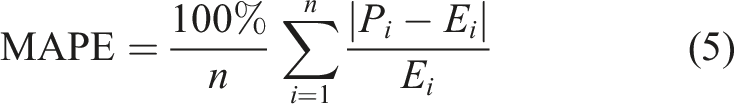
Figure 7 presents the dispersal of the estimated, actual, and absolute error values on the testing datasets for the three models: (a) XGB, (b) SVR, and (c) MLP. Dispersal of the estimated, actual, and absolute error values for testing datasets using (a) XGB, (b) SVR, and (c) MLP models.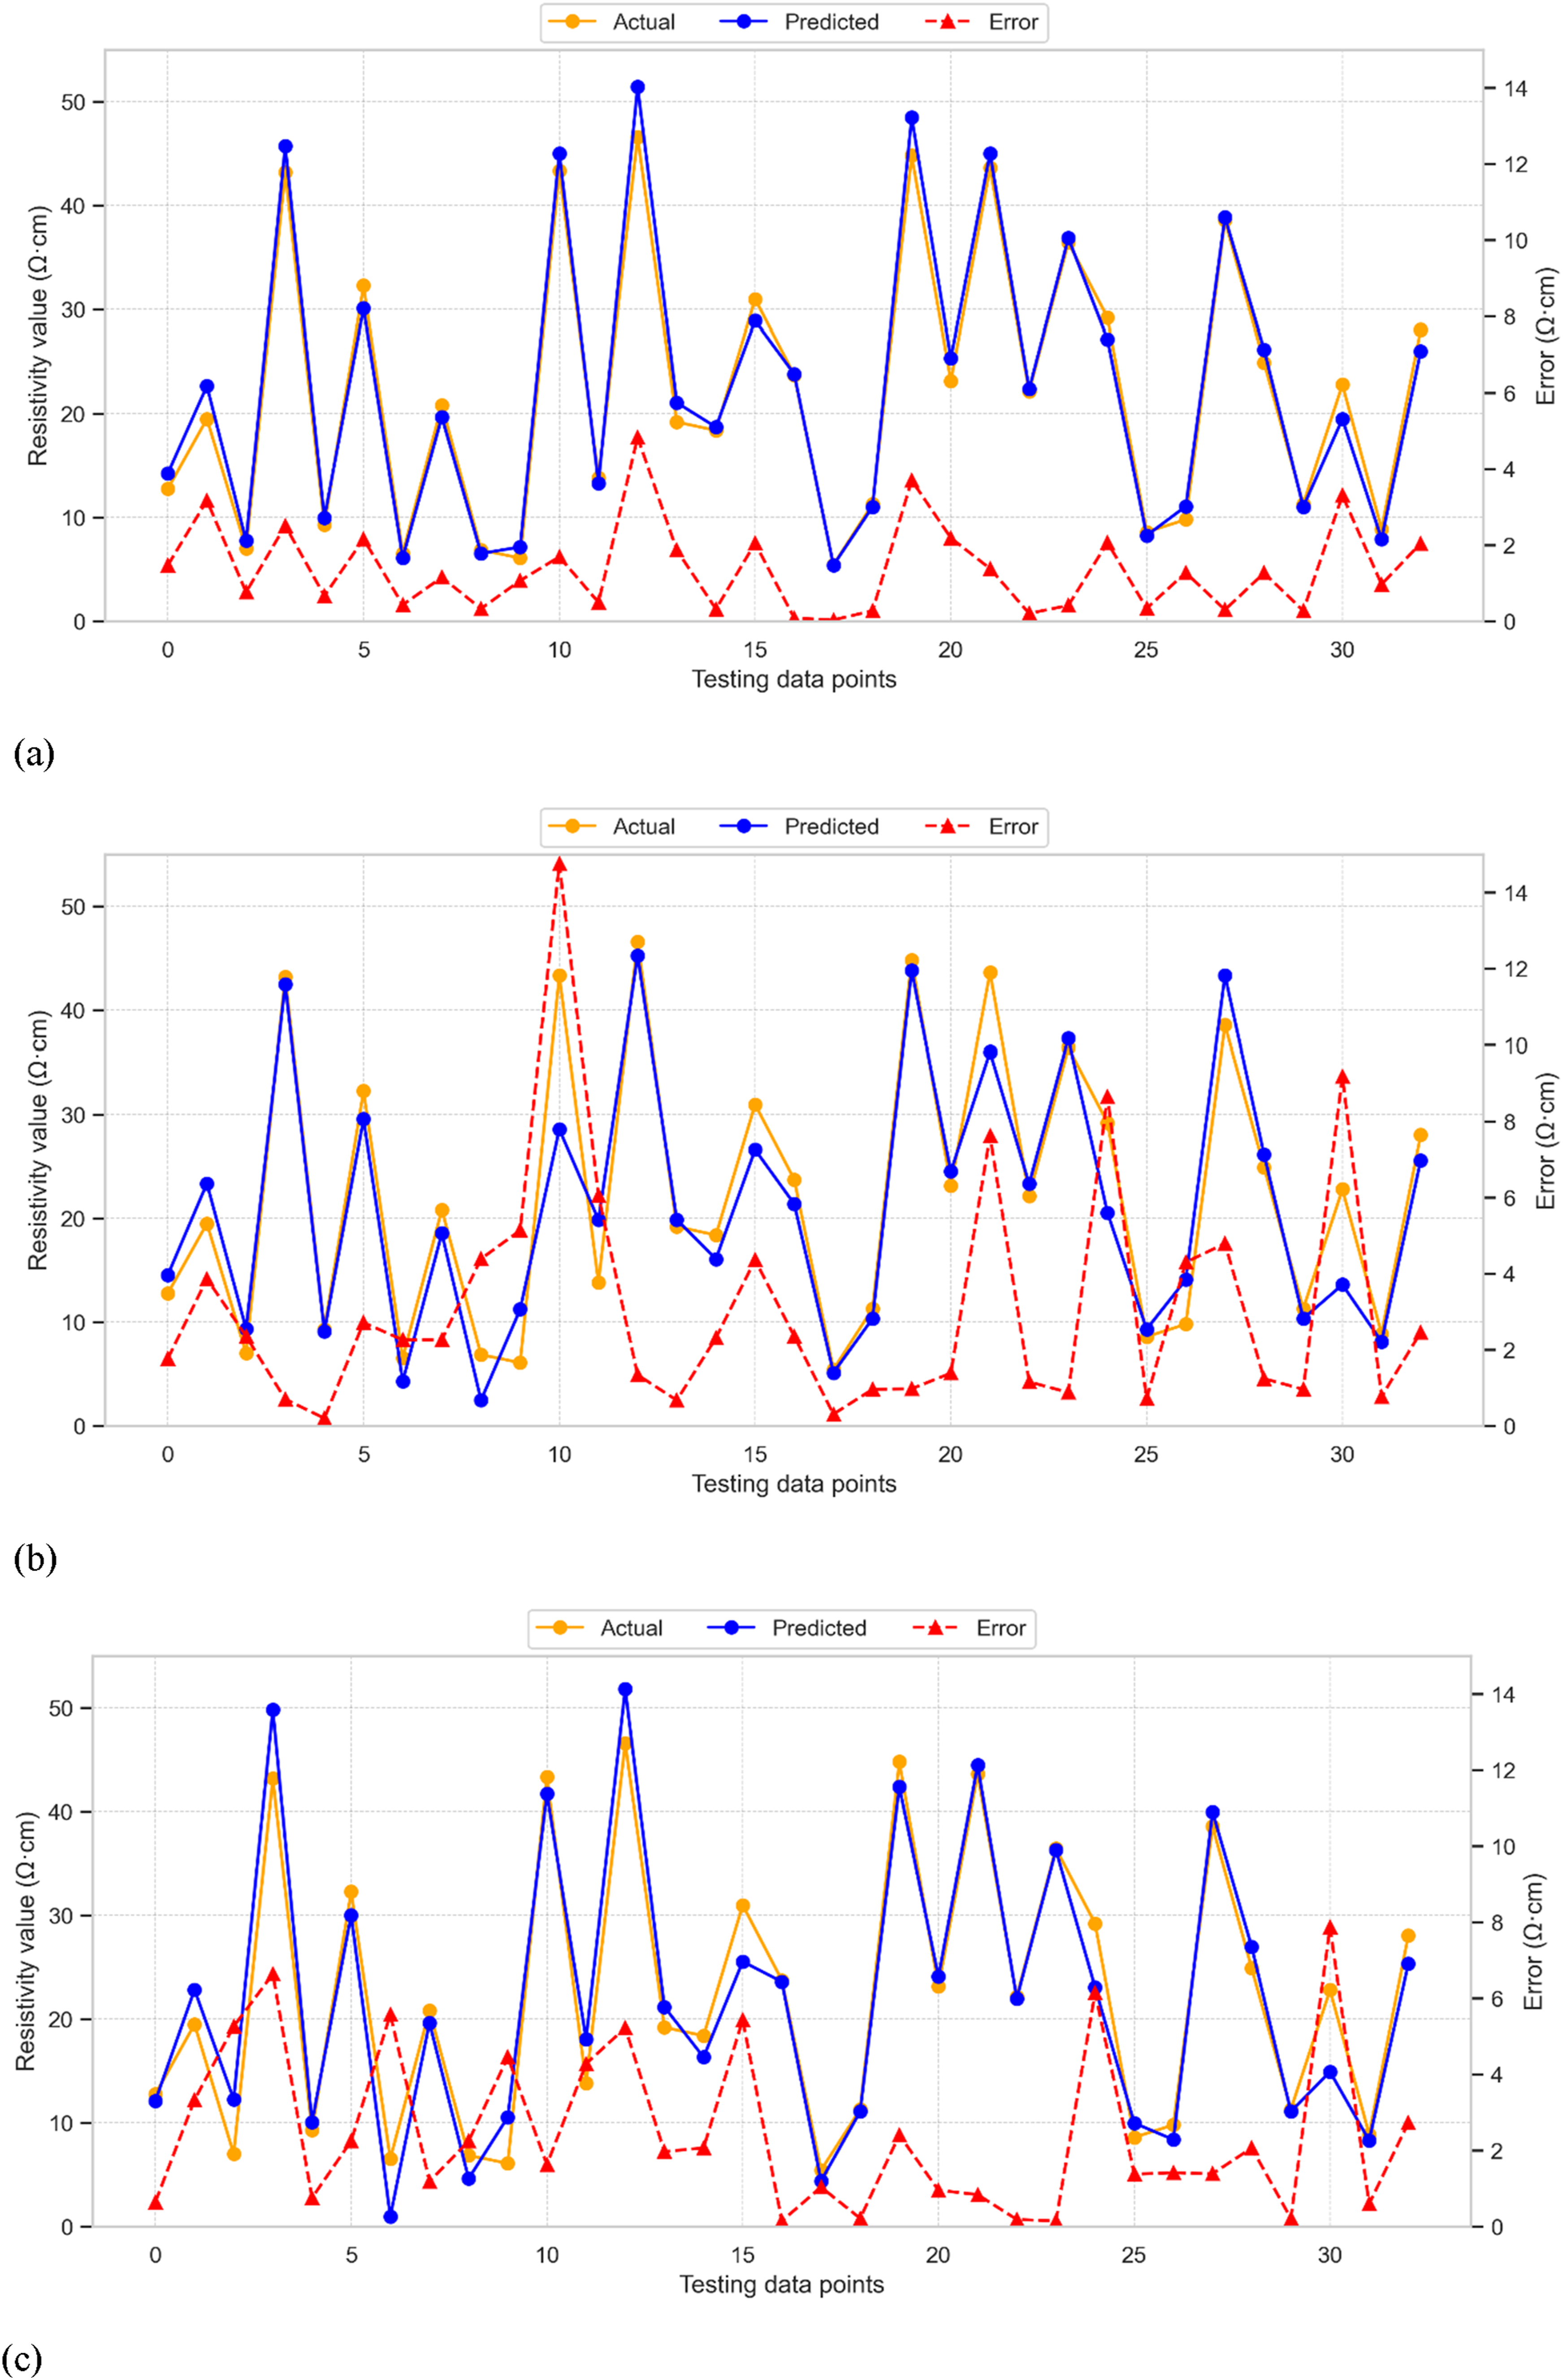
Among these algorithms, the XGBoost model demonstrates the highest predictive accuracy, achieving an R2 value of 0.981, along with a minimum absolute error of 0.03 Ω·cm, a maximum of 4.83 Ω·cm, and a mean absolute error of 1.37 Ω·cm. The corresponding MAE, MAPE, and RMSE are 1.37 Ω·cm, 6.68%, and 1.79 Ω·cm, respectively.
The SVR model, while capturing the overall trend, performs with lower accuracy, as reflected in an R2 value of 0.883. The minimum, maximum, and mean absolute errors for SVR are 0.20 Ω·cm, 14.76 Ω·cm, and 3.15 Ω·cm, respectively. Its MAE, MAPE, and RMSE are 3.15 Ω·cm, 18.40%, and 4.43 Ω·cm, indicating higher variability in predictions and reduced robustness.
The MLP model provides more accurate predictions than SVR, reaching an R2 of 0.936. It exhibits a minimum error of 0.15 Ω·cm, a maximum of 7.87 Ω·cm, and a mean absolute error of 2.51 Ω·cm. The model’s MAE, MAPE, and RMSE are 2.51 Ω·cm, 16.97%, and 3.30 Ω·cm, respectively, suggesting more stable predictions than SVR but still less precise than XGBoost.
Figure 8 displays the relationship between observed and predicted values for both the training and test datasets. These scatter plots, accompanied by the respective R2 metrics, provide a visual assessment of the predictive capabilities of each machine learning model. Specifically, Figure 7(a) corresponds to the training set, while Figure 7(b) represents the test set results. Comparison of actual and predicted values for training (a) and test (b) sets with corresponding R2 scores.
Among the evaluated models, XGB exhibits the most consistent performance, with an R2 of 0.996 on the training set and 0.981 on the test set. In comparison, SVR achieved R2 values of 0.934 (train) and 0.883 (test), while MLP yielded 0.992 and 0.922 for training and test sets, respectively. The smaller gap between the training and test R2 values in the XGB model suggests that it has superior generalization ability and is less prone to overfitting. When considered alongside the results of k-fold cross-validation, these findings further confirm the robustness and stability of the XGB model across different data partitions.
The performance of machine learning models is evaluated using Taylor diagrams based on the correlation coefficient (r) and standard deviation values. The results of this analysis are presented in Figure 9, providing a comparative visualization of the agreement between predicted and actual values for each model. Taylor diagram of model performance.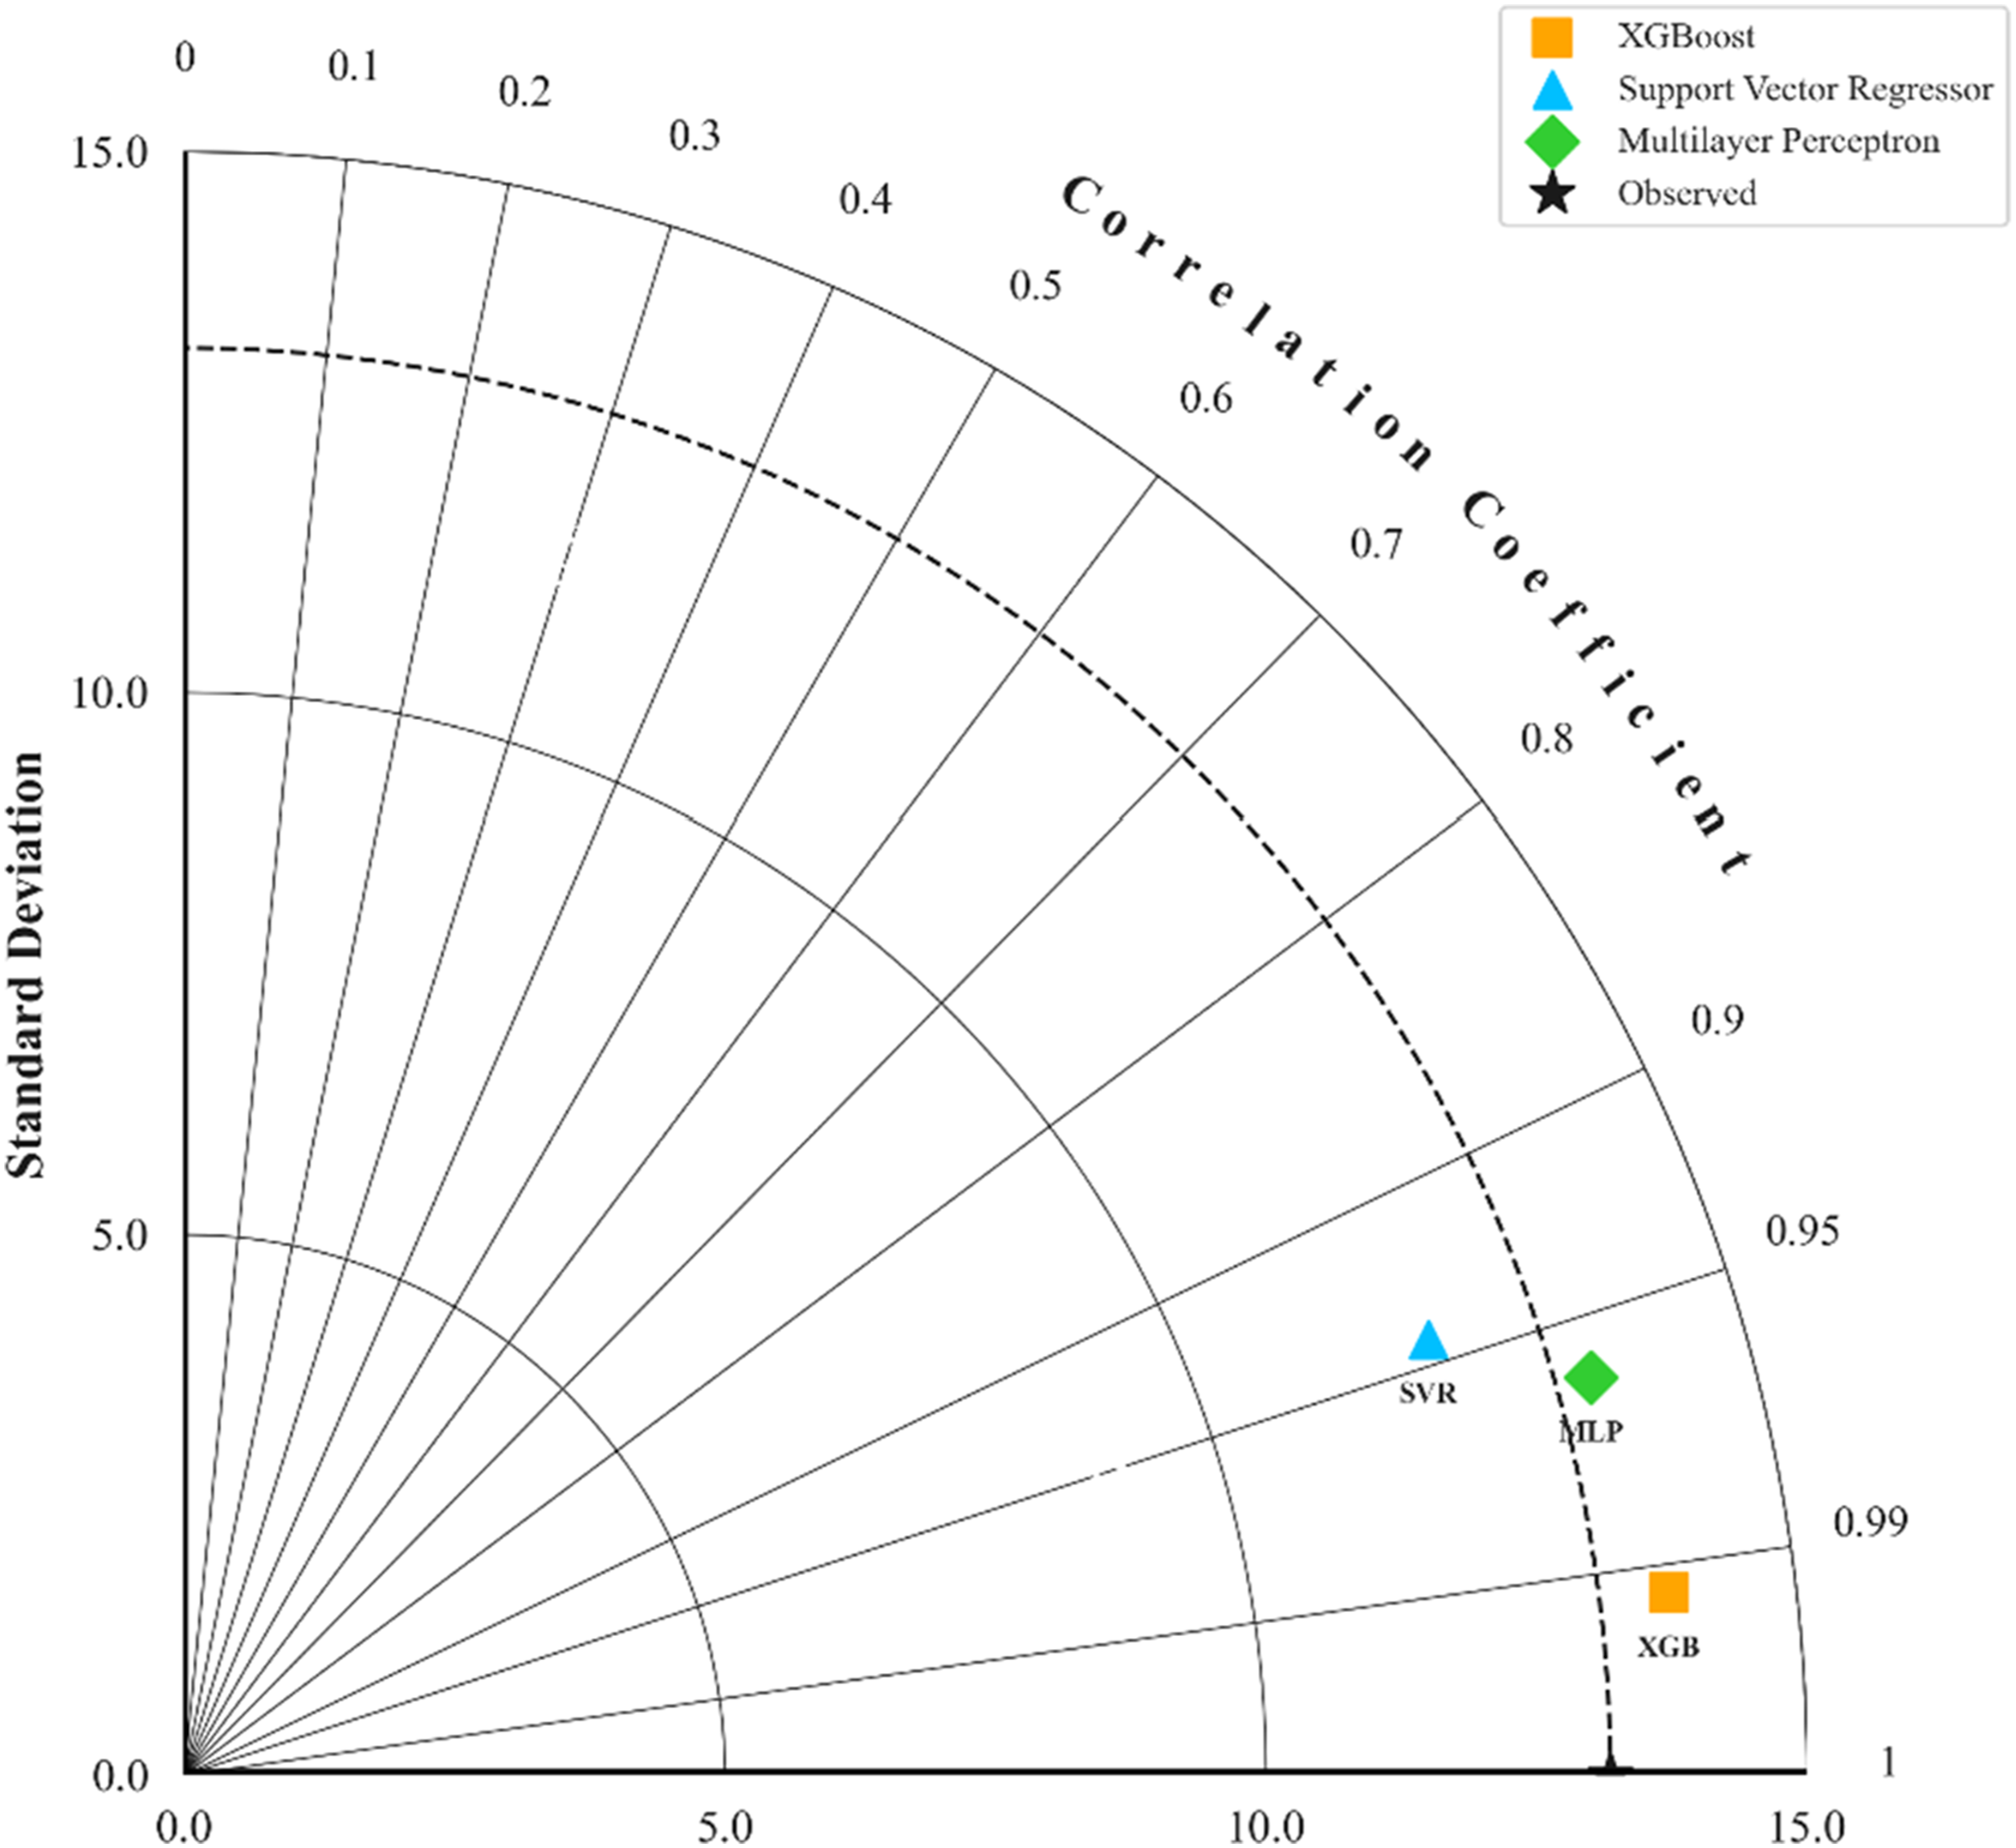
The correlation coefficients for the models are 0.993 for XGB, 0.944 for SVR, and 0.962 for MLP, indicating that the XGB model most effectively captures the relationship between predicted and actual values. In terms of standard deviation, the values are 13.83 for XGB, 12.18 for SVR, and 13.51 for MLP. Although SVR demonstrated slightly lower standard deviation, the relatively lower correlation coefficient suggests reduced overall predictive alignment. Overall, the XGB model exhibited the strongest correlation and maintained a balanced level of variance, making it the most reliable model among the three. MLP also showed satisfactory performance with relatively high correlation and comparable dispersion. Figure 10 illustrates the distribution of residuals for each model, providing insight into the prediction errors and overall accuracy. Residual comparison of built ML models.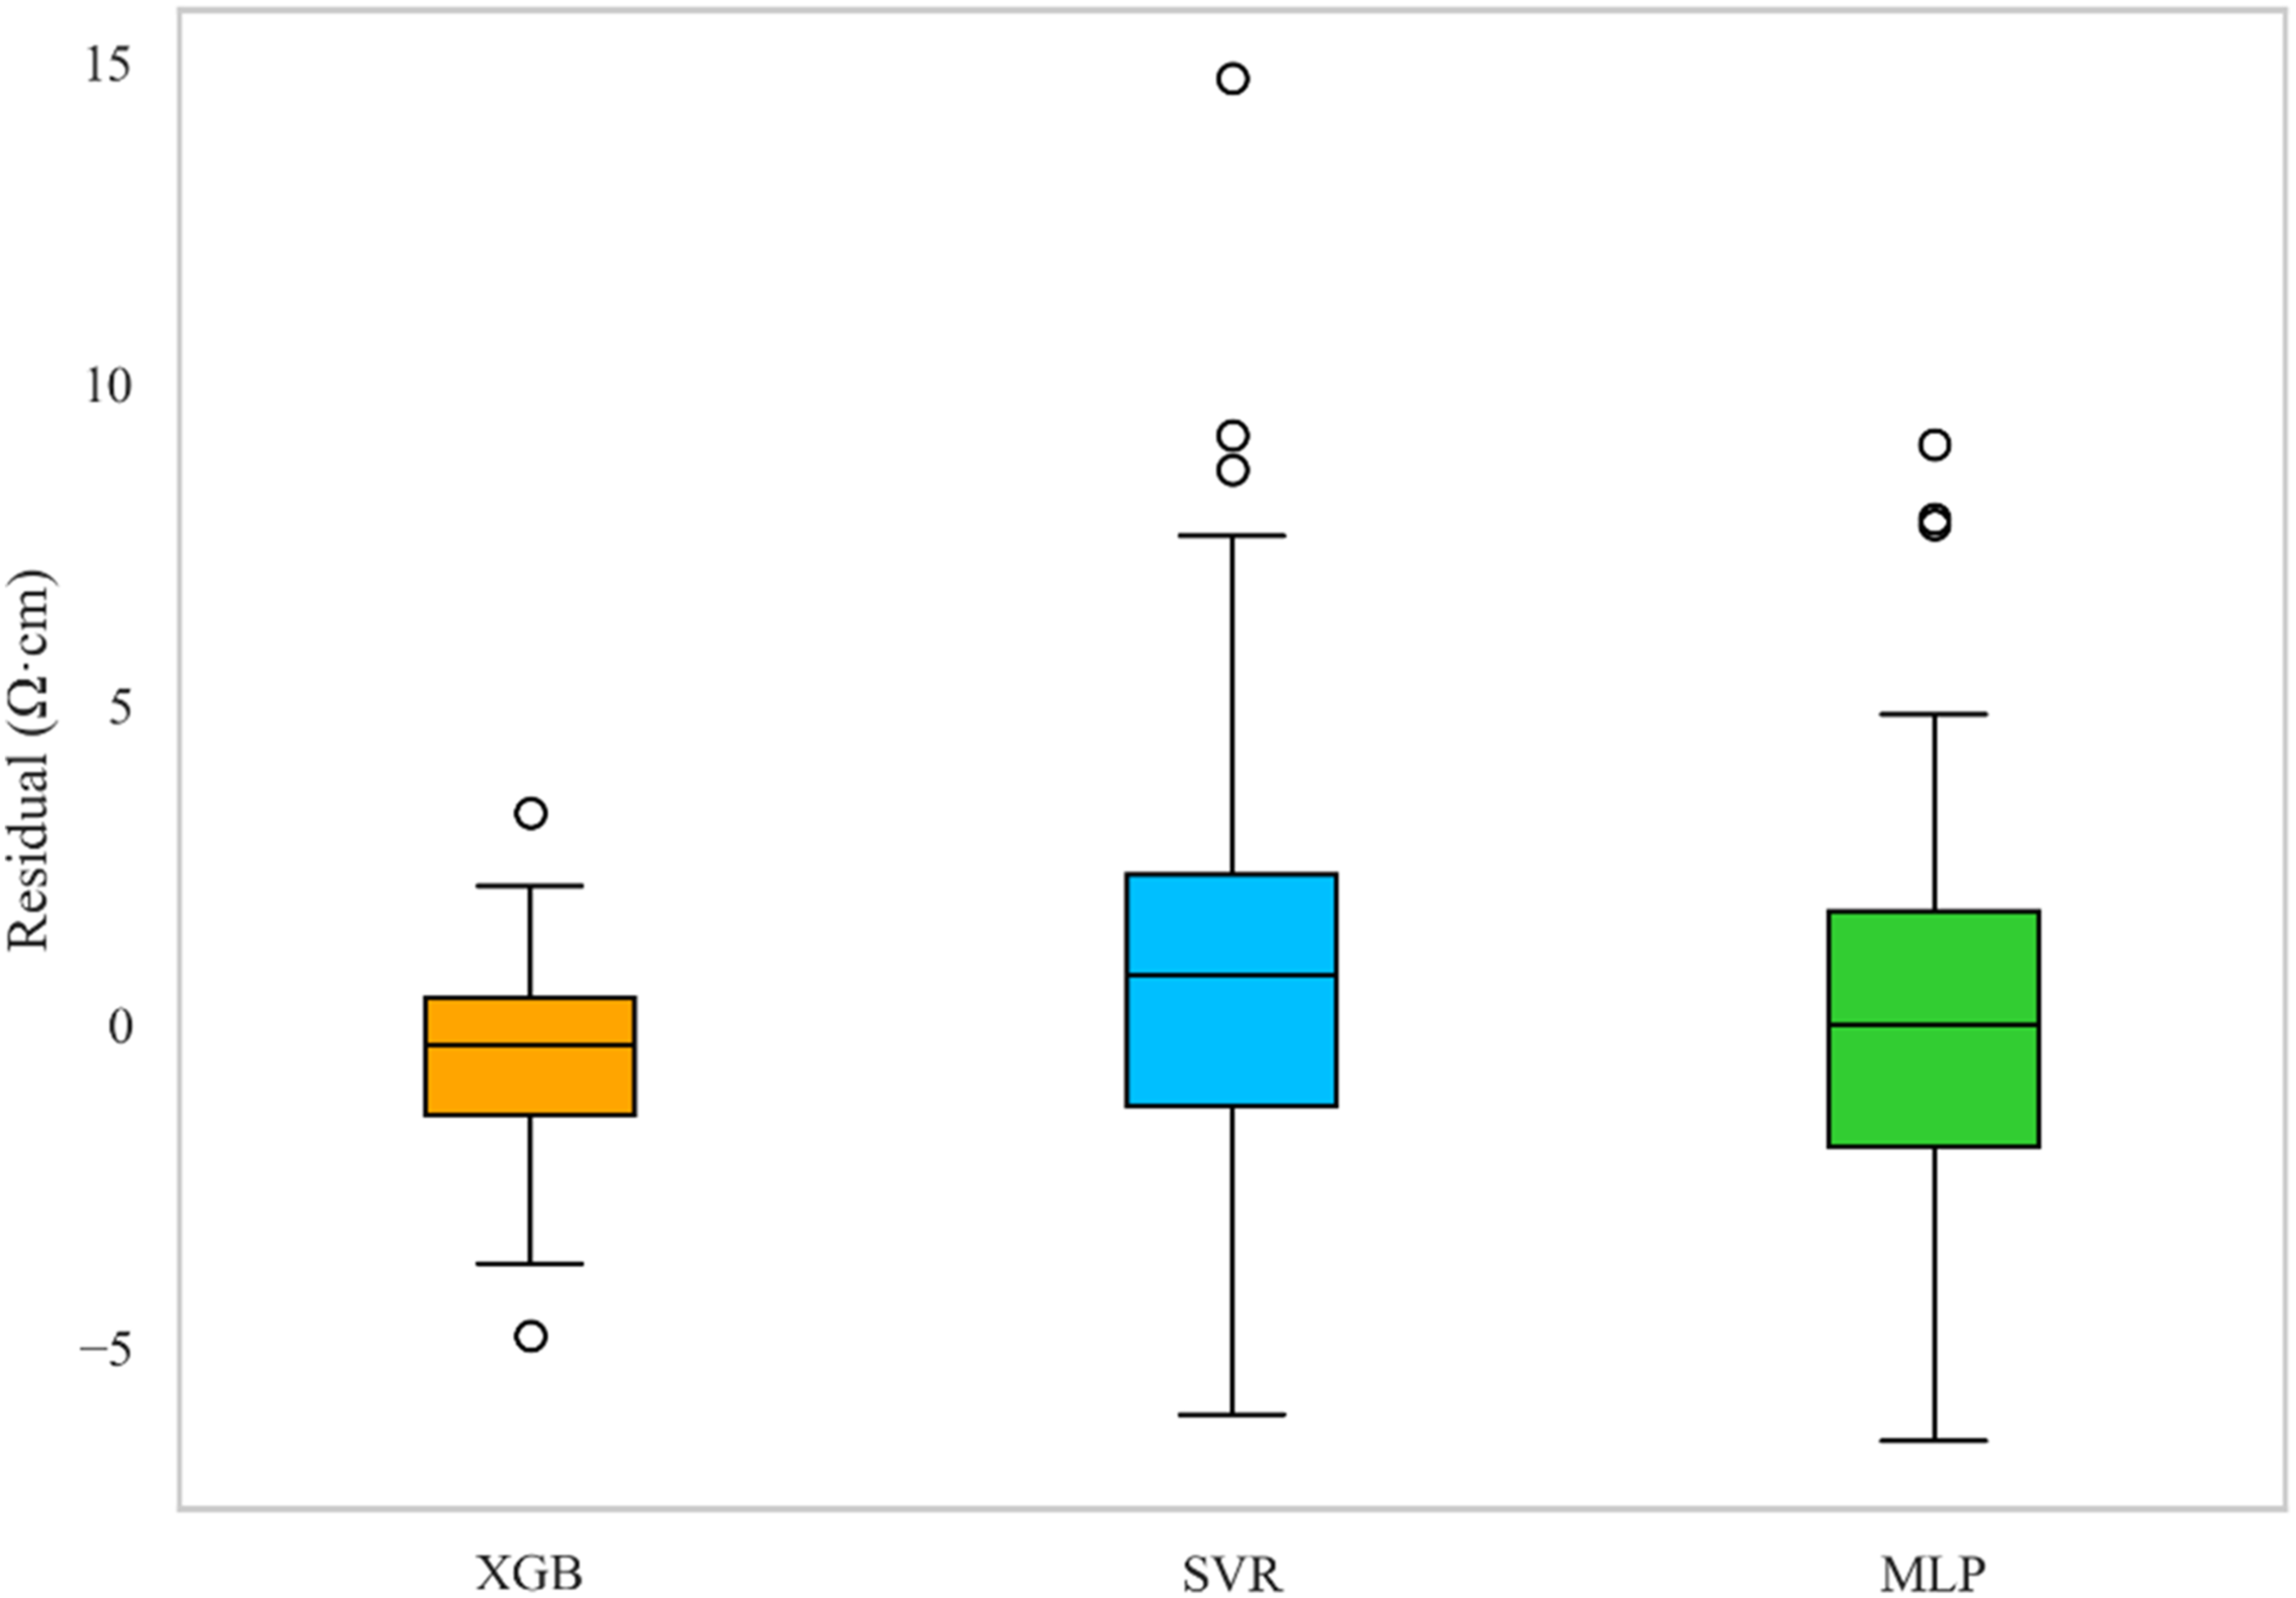
The residual distributions reveal that all three models perform reasonably well, with limited presence of extreme outliers, indicating overall robustness in predictions. Among them, the XGBoost model stands out with residuals closely centered around zero and the most compact spread, suggesting highly accurate, consistent, and unbiased predictions. The MLP model also demonstrates good predictive performance, though with a slight positive bias in the residuals. Similarly, the SVR model shows a more noticeable positive deviation, indicating a tendency to underestimate resistivity values. Despite these differences, the low variance and limited outliers in all models confirm their general reliability, while XGBoost emerges as the most effective in capturing the underlying data patterns.
SHAP analysis
Understanding the factors that influence the electrical resistivity of cementitious composites containing conductive additives is essential for optimizing their performance under various conditions. In this study, SHAP analysis based on the XGB model is applied to quantitatively evaluate the contribution of each input feature to the prediction of electrical resistivity. As shown in Figure 11, CB is found to be the most influential factor, followed by CF, humidity, temperature, and day. The high impact of CB may be attributed to its fine particle size and high surface area, which facilitate better dispersion and conductive network formation within the matrix. Although CF also contributed significantly, its effect is relatively lower than that of CB. Environmental factors such as humidity and temperature showed moderate importance, while curing age has the least influence. These insights help reveal the relative importance of various parameters and support the optimization of electrically functional cementitious composites. Mean SHAP value-based feature importance analysis.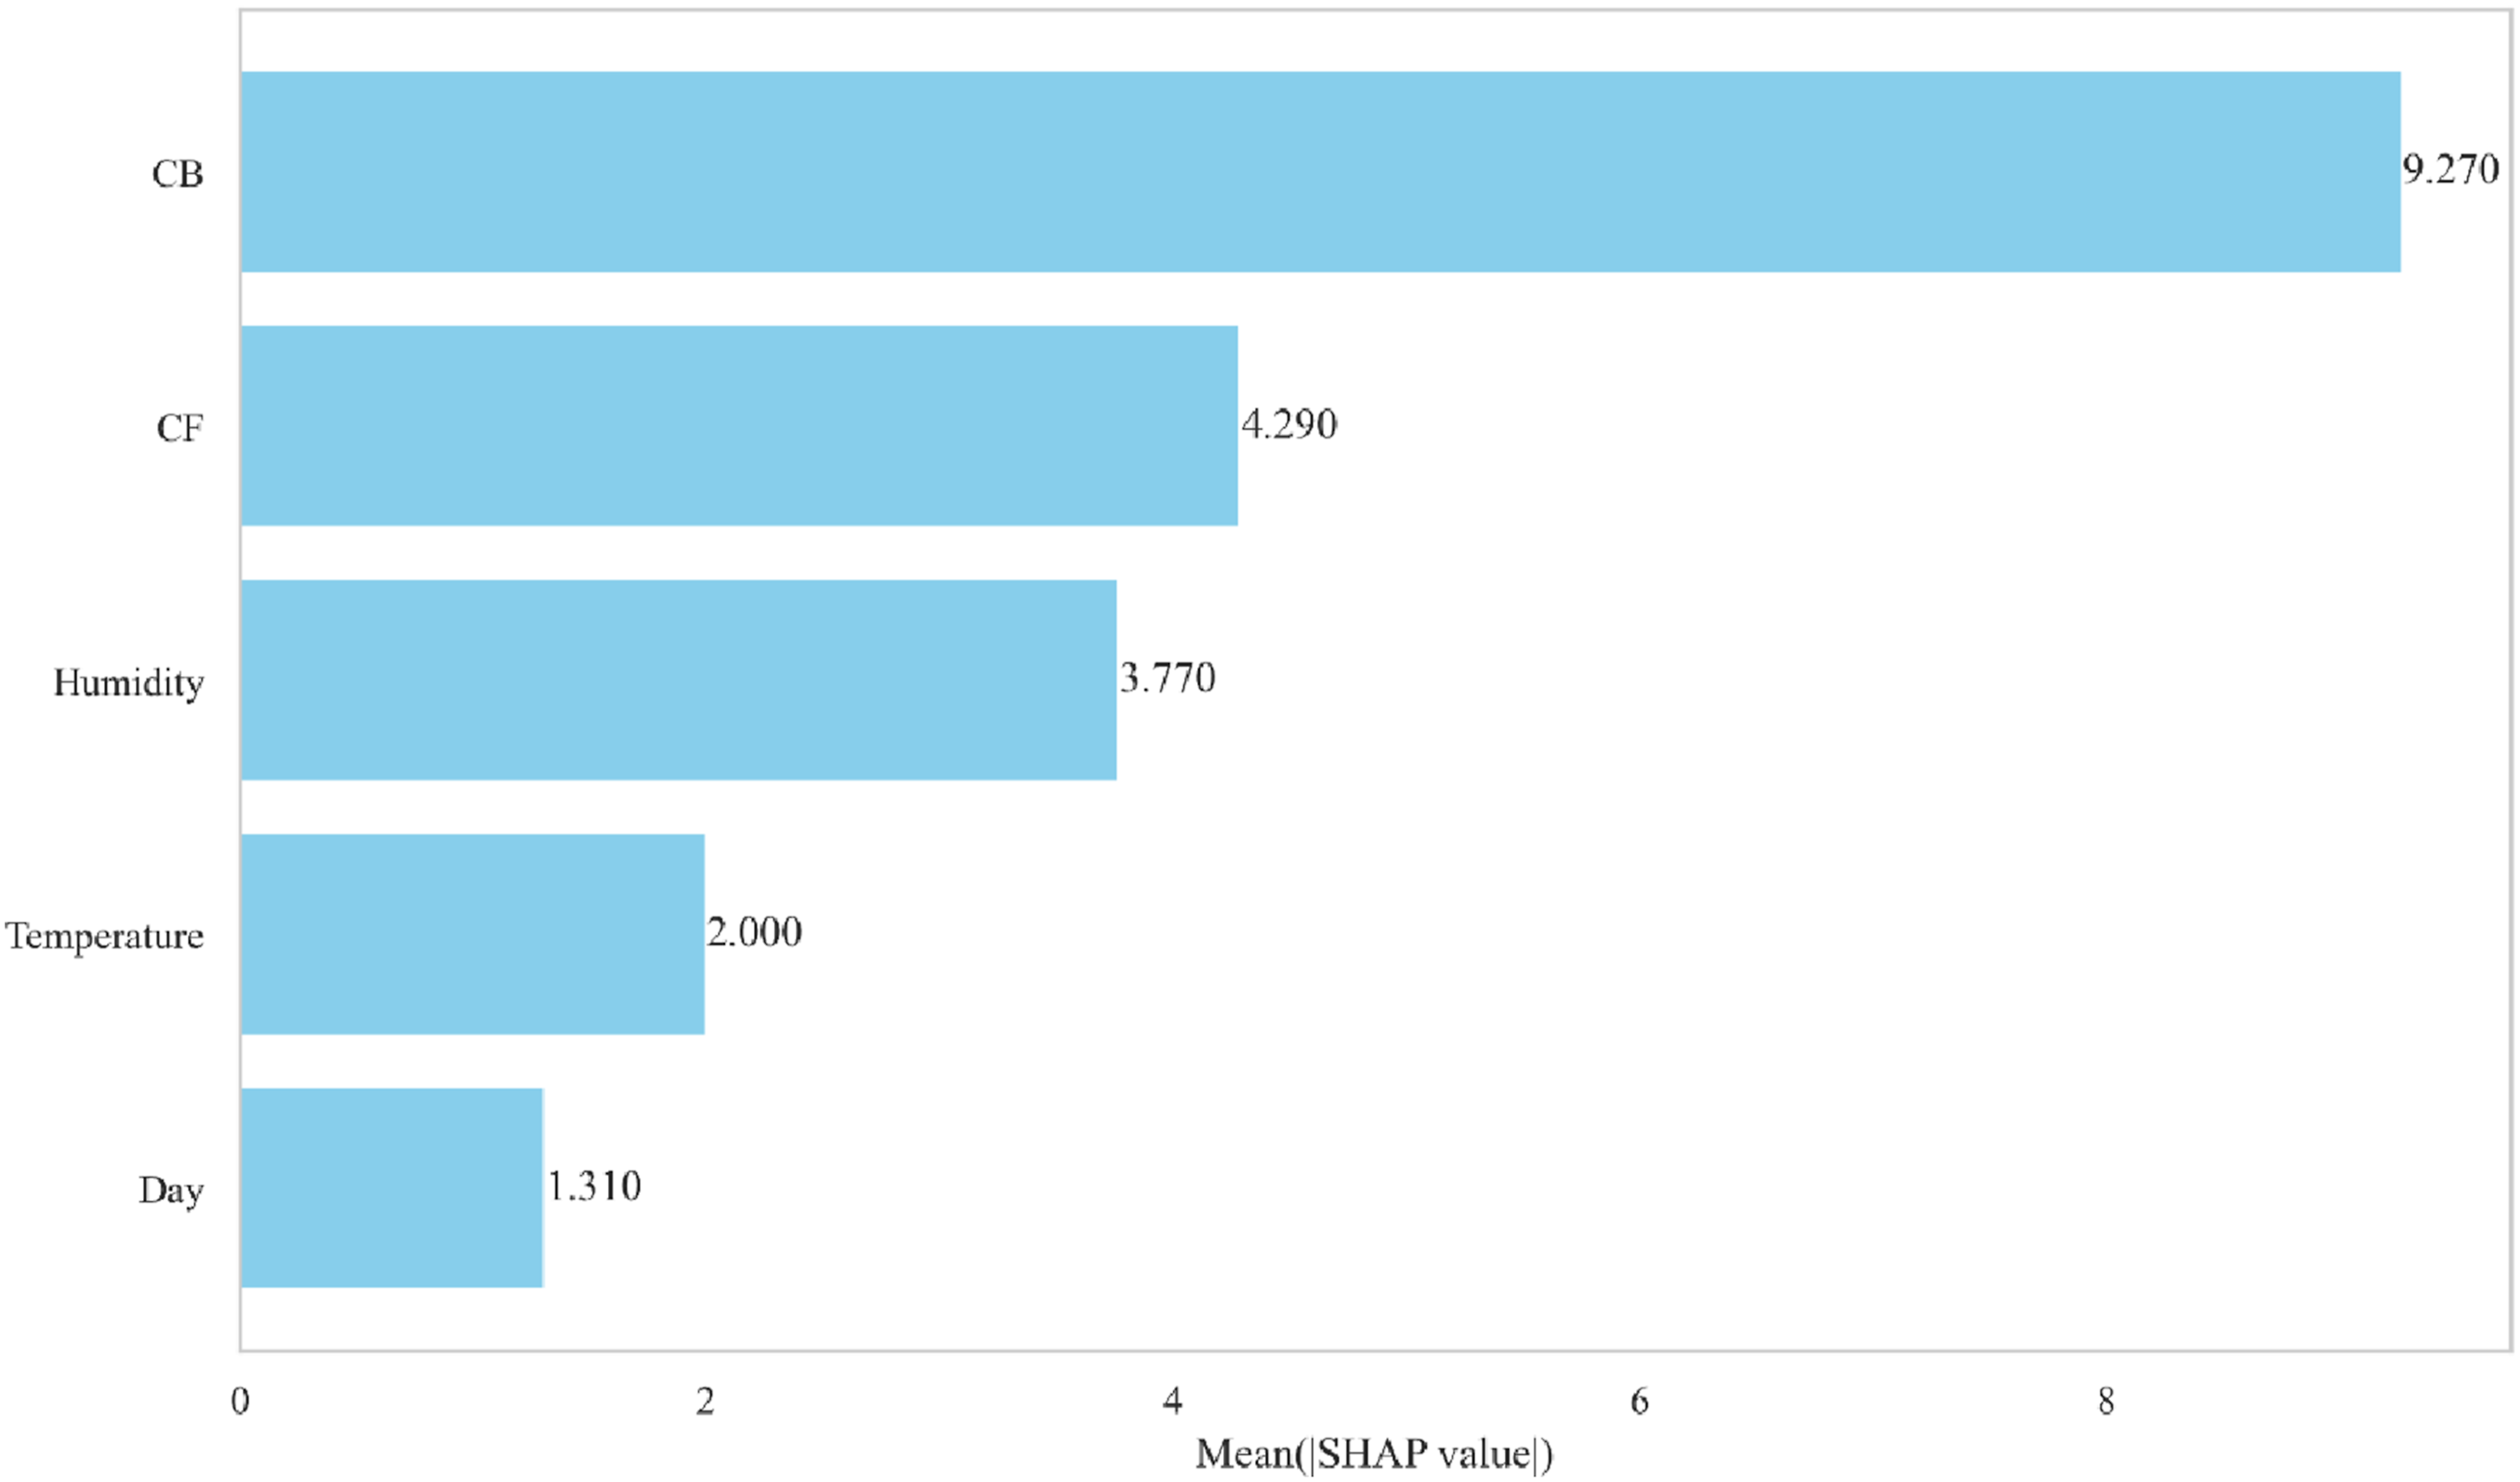
Figure 12 provides a detailed visualization of the influence of each input variable on the predicted electrical resistivity values. Visualization of feature influence using SHAP summary plot.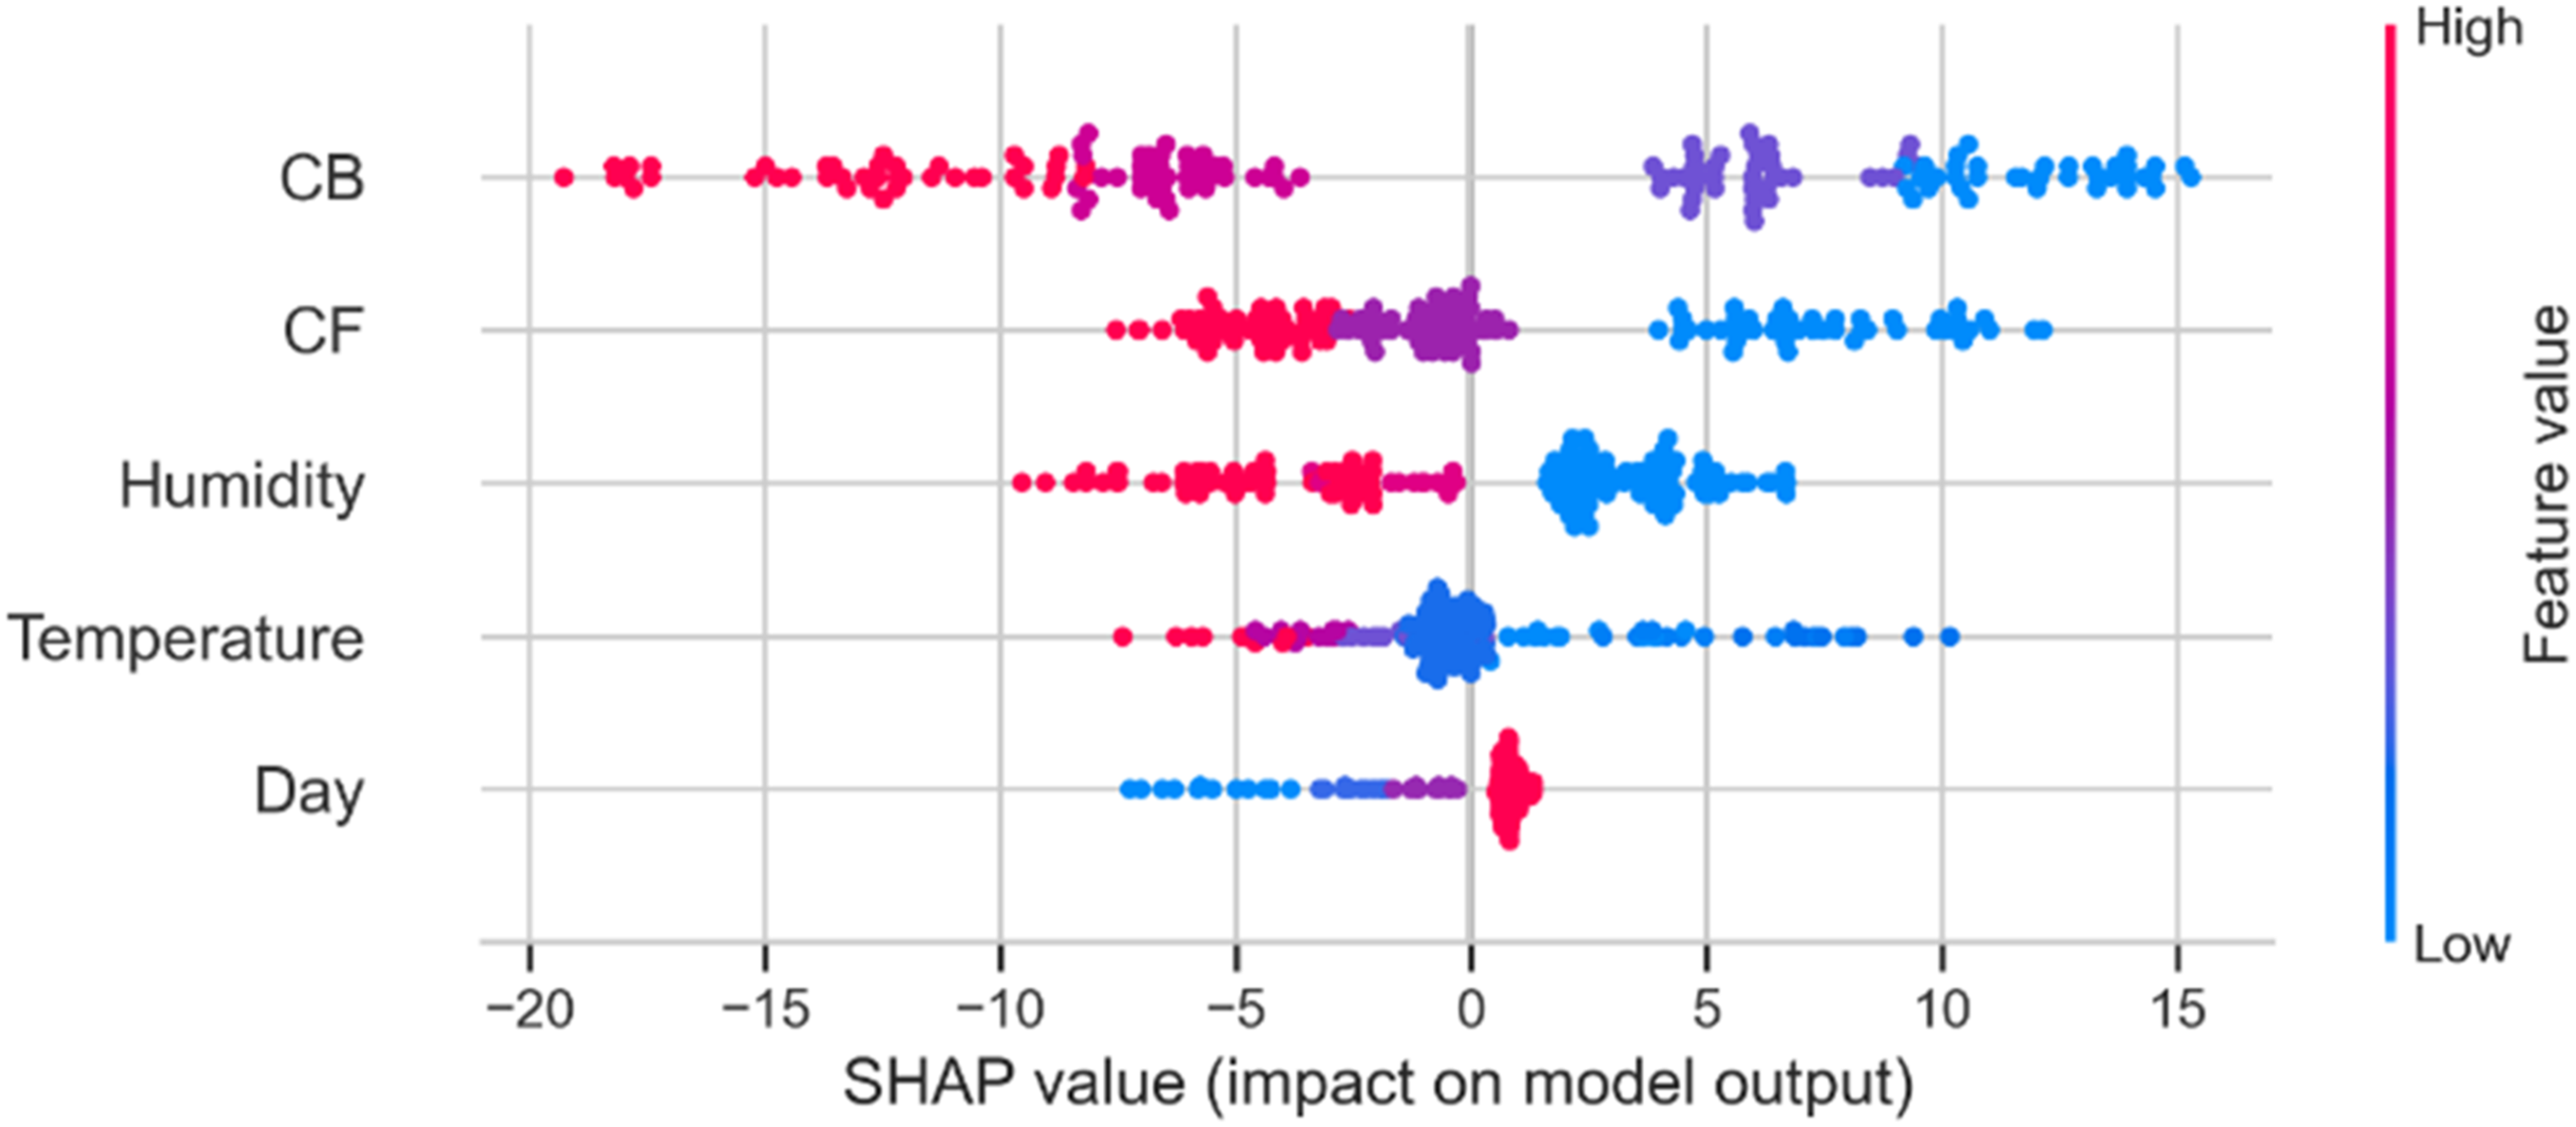
CB, CF, and humidity exhibit strong negative SHAP values when their feature values are high, suggesting that increasing these parameters contributes to lower resistivity, i.e., improved electrical conductivity. On the other hand, day shows a consistent positive contribution at higher values, indicating an increase in resistivity with longer curing. Temperature shows a mixed pattern with less pronounced impact. This analysis highlights the dominant role of conductive additives and environmental humidity in reducing resistivity, while extended curing may hinder conductivity performance.
Conclusion
In this study, the electrical resistivity behavior of cementitious composites modified with CF, CB and their hybrid combinations is investigated under various environmental conditions and curing times. The influence of curing time is found to be a critical factor, as it directly affects the microstructure and ionic conduction pathways of the composites. As hydration progresses, resistivity tends to increase due to pore refinement and reduced moisture content. However, in mixtures containing conductive fillers, this time-dependent increase is significantly mitigated. For instance, while the control specimen exhibits a resistivity increase from 267.5 Ω·cm to 999.5 Ω·cm over 28 days, the hybrid composite with 0.9 vol.% CF and 9 wt.% CB shows only a minor change from 3.9 Ω·cm to 7.1 Ω·cm.
The presence of carbon fiber (CF) and carbon black (CB)—particularly in hybrid form—establishes stable, filler-dominated conductive networks that maintain low electrical resistivity across different curing stages, moisture conditions, and temperature ranges. Unlike the control specimen, which exhibits abrupt resistivity increases and signal loss at elevated temperatures due to thermally induced microstructural damage, the hybrid composites preserve electrical continuity and provide a thermally robust conductive pathway. Quantitatively, the hybrid formulation shows only a 6.3% resistivity variation due to drying and a pronounced 70.6% decrease in resistivity between −20°C and 120°C, indicating a reliable and highly sensitive temperature-dependent electrical response. This combination of environmental robustness, signal stability, and thermal sensitivity highlights the strong potential of hybrid CF–CB cementitious composites for self-sensing applications in smart infrastructure exposed to variable environmental and thermal loading.
Furthermore, machine learning algorithms such as XGBoost, SVR, and MLP are used to predict electrical resistivity based on CF content, CB content, curing time, temperature, and humidity. Among them, XGBoost showed the highest predictive accuracy (R2 = 0.981 on test data), supporting the use of data-driven methods in material design.
The machine learning analysis not only achieved high predictive accuracy but also provided important insight into the fundamental mechanisms governing electrical resistivity. The SHAP analysis clearly identified carbon black (CB) as the most dominant parameter, with a SHAP value of 9.270, which is more than twice the contribution of carbon fiber (4.290). This quantitative result scientifically confirms that CB plays a primary role in conductive network formation due to its fine particle size and high specific surface area, while CF contributes in a more complementary manner.
While environmental factors such as humidity and temperature exhibit a limited influence, the effect of curing age on electrical resistivity is found to be minimal. These findings indicate that hybrid CF–CB systems form stable and environmentally robust conductive networks and demonstrate that explainable machine learning is a powerful tool for the design and optimization of electrically functional cementitious composites.
Although the present study focuses exclusively on the electrical behavior of CF-, CB-, and hybrid CF–CB cementitious composites, the results provide a clear and successful experimental demonstration of how conductive fillers enable environmentally resilient and thermally robust self-sensing functionality. The data show that hybrid conductive networks maintain electrical continuity and deliver a reliable, highly sensitive temperature-dependent signal under varying curing ages, moisture states, and temperature conditions, in stark contrast to the signal degradation observed in the plain cement matrix. These findings advance the state of the art by establishing a solid experimental and data-driven foundation for the rational design of self-sensing cementitious materials using scalable hybrid filler strategies. At the same time, it is emphasized that mechanical performance and long-term durability are not addressed in this study and should be considered as urgent priorities in future research. Systematic investigations on mechanical properties, cyclic environmental loading, and long-term durability are essential before structural implementation, ensuring that the demonstrated electrical functionality can be reliably translated into practical smart infrastructure applications.
Footnotes
Acknowledgments
The authors thank to BUU BAP Unit for their support.
Funding
The authors disclosed receipt of the following financial support for the research, authorship, and/or publication of this article: This study was supported by Bursa Uludag University Research Projects Coordination Office under the Grant Number FGA-2025-2027. The authors would also like to thank TUBITAK for the support provided to G.T.G during this study under the 2244 program, project 119C152.
Declaration of conflicting interests
The authors declared no potential conflicts of interest with respect to the research, authorship, and/or publication of this article.
Data Availability Statement
All data generated or used during the study are available upon request.