
Abstract
Natural fiber-reinforced polyolefin composites have emerged as promising sustainable materials; however, their mechanical performance is strongly governed by the chemical composition and moisture characteristics of the reinforcing fibers. This research establishes an interpretable Response Surface Methodology (RSM)-based framework to forecast and enhance the tensile strength (TS) and tensile modulus (TM) of natural fiber/HDPE composites as functions of cellulose content, hemicellulose content, moisture content, and filler loading. A complete dataset from the literature was put together, cleaned up, normalized, and coded for regression analysis. Second-order polynomial models were formulated within a Central Composite Design (CCD)-based analytical framework and validated using analysis of variance (ANOVA), residual diagnostics, and cross-validation. The developed models were highly significant (p < 0.0001), exhibited excellent goodness of fit (R2 > 0.98), and achieved average external validation errors below 5%. The results indicated that TS and TM increased with cellulose content and filler loading up to an optimal region of approximately 65–70 wt.% cellulose and 25–30 wt.% filler, after which performance declined because of fiber agglomeration and reduced polymer wetting. In contrast, increasing hemicellulose and moisture content decreased mechanical performance because of their hygroscopic and amorphous characteristics. Multi-response optimization identified an optimal composition of approximately 66 wt.% cellulose, 19 wt.% hemicellulose, 8 wt.% moisture, and 27 wt.% filler, corresponding to maximum predicted values of 45.2 MPa for TS and 2.95 GPa for TM. The proposed composition-driven RSM framework provides a practical quantitative basis for designing high-performance sustainable polyolefin composites.
Keywords
Introduction
The growing demand for environmentally sustainable materials has accelerated the replacement of conventional synthetic composites with bio-based alternatives derived from renewable resources. Among these, natural fiber–reinforced polyolefin composites have gained significant attention due to their low density, biodegradability, cost-effectiveness, and favorable mechanical-to-weight ratio. Polyolefin such as high-density polyethylene (HDPE) is widely employed as thermoplastic matrices because of their recyclability and good processability 1 The mechanical performance of these bio-composites is highly dependent on the intrinsic characteristics of the reinforcing fibers, particularly their chemical composition, moisture content, and compatibility with the polymer matrix. The inherent hydrophilicity and variability of lignocellulosic fibers often lead to weak interfacial adhesion, reduced stiffness, and compromised strength, thereby necessitating systematic optimization of fiber composition and loading to achieve consistent performance. 2
Over the past decade, numerous studies have investigated the influence of processing parameters, fiber treatments, and compatibilizing agents on the mechanical properties of polymer composites. Statistical and experimental design techniques such as the factorial method, Taguchi design, and Response Surface Methodology (RSM) have been applied to optimize process conditions and additive contents. 3 For instance, 4 and 5 demonstrated that optimizing compatibilizer and fiber loading improves tensile strength and modulus of polyolefin composites. Similarly, 6 compared different design-of-experiments (DOE) frameworks to predict mechanical performance in hybrid fiber systems. While these studies successfully optimized process and additive variables, they primarily focused on manufacturing parameters rather than the intrinsic fiber composition. Consequently, the chemical constituents of the reinforcing fibers, cellulose, hemicellulose, lignin, and moisture, remain insufficiently modeled as predictors of composite performance despite their critical role in governing interfacial bonding and stress transfer efficiency. 5 The density of the particulate reinforcement can directly influence the overall density of the composite because the final composite density is governed by the relative densities and fractions of the constituent phases. Although natural fiber-reinforced composites are widely regarded as environmentally favorable alternatives to conventional synthetic systems, the present study focuses specifically on composition-driven mechanical modeling and optimization rather than direct quantification of environmental indicators such as carbon footprint, biodegradability rate, or life cycle burden.
The research gap, therefore, lies in the absence of comprehensive statistical models that directly link fiber chemical composition and filler loading to the mechanical behavior of natural fiber–reinforced polyolefin composites. Existing models often treat these compositional variables independently or omit them altogether, resulting in limited predictive performance and suboptimal optimization. Furthermore, most prior works have adopted single-response optimization, addressing either tensile strength or modulus separately, without considering the inherent trade-offs between these properties in multi-objective design scenarios.
Over the past 20 years, many studies have focused on optimizing natural-fiber polymer composites using chemical, structural, and process-based approaches to improve mechanical performance. 5 Investigated how the mechanical performance of polyethylene aspen wood composites was affected by maleated polyethylene (MAPE), dicumyl peroxide (DCP), and nanoclay. Instead of maintaining fiber loading at 30 wt.%, they used Stat Graphics to conduct a central composite design (CCD) experiment in which additive concentrations were varied simultaneously. They found that adding DCP in the final stage of processing maximized impact strength, and that adding MAPE at a rate of about 3% significantly improved both tensile and impact properties. Furthermore, they reported that Cloisite Na+ performed better than 10 Å clay in terms of reinforcing efficiency. However, although their model achieved notable mechanical improvement, it did not explicitly account for moisture content or fiber chemical composition.
Similarly,
7
developed first-order regression models from available literature data to investigate the effects of cellulose, hemicellulose, and fiber treatment on the tensile strength and modulus of polypropylene-based green composites. They showed that fiber chemistry has a direct effect on composite behavior, but the predictive performance remained moderate because of limited data diversity and the absence of higher-order modeling. This indicates that the importance of fiber chemistry was recognized, but not yet integrated into a sufficiently comprehensive predictive framework. In another direction,
6
compared factorial analysis, Taguchi design, and RSM approaches to maximize the mechanical performance of epoxy hybrid composites reinforced with natural Chambira and synthetic fibers such as glass, carbon, and Kevlar. They found that the modified factorial design outperformed both RSM and Taguchi methods using a 90-run DOE framework, achieving
Trokourey et al. 8 optimized the injection molding and extrusion parameters for flax fiber/recycled plastic composites and developed predictive models with adjusted R^2 values up to 0.91. They identified extrusion, barrel, and mold temperatures as the most influential processing variables and reported significant improvements in process efficiency and mechanical performance. However, the methodology did not include statistical modeling of fiber chemical composition. In a related study, 9 combined process optimization with chemical compatibilization using MAPP and EO-g-MAH resulted in substantial gains in tensile and flexural modulus. Even so, both studies assumed fixed fiber composition and did not incorporate cellulose, hemicellulose, or moisture content as explicit predictive variables. Additional work by 10 optimized the tensile strength of hybrid PALF/glass fiber epoxy composites using a Taguchi L9 orthogonal array. Although their best configuration produced a tensile strength of 95.31 MPa, the model remained single-response and did not consider fiber chemistry or environmental descriptors such as moisture.
A significant development in natural fiber composite statistical modeling was reported by 11 who used a Box–Behnken RSM design to optimize the tensile behavior of polypropylene/kenaf composites. They achieved high model accuracy by varying compatibilizer content, fiber loading, and fiber length, and SEM analysis confirmed strong interfacial bonding. However, their study was restricted to mechanical and geometric factors and did not include fiber chemical composition. In the same way, 12 extended this framework to investigate flexural properties, but moisture content and fiber chemical constitution were again not explicitly considered.
Taken together, the existing literature confirms the usefulness of statistical optimization for natural fiber composites, but also reveals a persistent limitation: most models emphasize processing conditions, compatibilizer dosage, or geometric parameters, while the measurable chemical quality of the fibers themselves remains insufficiently integrated into predictive design. As a result, important descriptors such as cellulose content, hemicellulose content, moisture content, and filler loading are still not jointly modeled in a unified way, despite their direct influence on interfacial bonding, hygroscopicity, stress-transfer efficiency, and final mechanical response.
To address these limitations, this study aims to develop a statistically robust and interpretable RSM-based modeling framework that quantifies and optimizes the combined effects of cellulose, hemicellulose, moisture, and filler loading on the tensile properties of natural fiber–reinforced HDPE composites. Specifically, second-order polynomial regression models are constructed to capture both linear and nonlinear interactions among the compositional variables. The models are validated using analysis of variance (ANOVA), residual diagnostics, and cross-validation techniques to ensure predictive reliability. 13 Multi-response optimization is then performed through the desirability function approach to simultaneously maximize tensile strength and modulus, thereby establishing a balanced compositional design for superior mechanical performance.
The importance of the present study lies in providing a composition-driven predictive framework that is more directly useful for material design than many existing approaches limited to process settings or single-response optimization. By integrating cellulose, hemicellulose, moisture content, and filler loading within one second-order RSM framework, the current work offers a more comprehensive basis for understanding and optimizing the tensile behavior of natural fiber/HDPE composites. In contrast to many previous studies, the proposed model simultaneously captures linear, interaction, and curvature effects, validates them statistically through ANOVA and diagnostic analysis, and applies multi-response optimization to balance tensile strength and tensile modulus together. The novelty of this work lies in shifting the optimization paradigm from process-driven to composition-driven modeling by integrating fiber chemistry as a core predictive factor. This approach not only enhances the understanding of how fiber constituents influence polymer reinforcement mechanisms but also provides a reproducible, data-driven pathway for designing sustainable polyolefin composites with tailored mechanical properties. Therefore, the current work is more useful than much of the existing literature because it links measurable fiber-quality descriptors directly to final composite performance and provides a practical optimization route for selecting compositionally favorable formulations in sustainable polyolefin systems.
Methodology
Developing a statistically sound and interpretable framework that can forecast and optimize the mechanical performance of natural fiber reinforced polyolefin composites based on the physical and chemical properties of the reinforcing fibers was the main goal of the suggested methodology. The purpose of this framework was to determine the ideal compositional conditions that optimize composite strength, stiffness, and stability; to quantify the relative influence of fiber constituents, such as cellulose, hemicellulose, lignin, ash, and extractives, on key mechanical and thermal responses; and to develop predictive models that characterize these relationships. The methodology combines multi-response statistical optimization with data-driven modeling to accomplish these goals. The first thorough dataset is assembled from published experimental studies that reported on the thermal, tensile, and flexural performance metrics of HDPE composites reinforced with different lignocellulosic fillers. Chemical and morphological characteristics of the fibers, such as composition, filler loading, and particle dimensions are used to describe each record.
Thorough preprocessing was performed on the gathered data to guarantee statistical coherence and homogeneity. In order to align variable scales and transform continuous descriptors into coded forms appropriate for regression-based design and analysis, normalization and discretization are used. The empirical second order models that could capture the main, quadratic and interactive effects of the input parameters on the measured responses are then built using RSM.
Natural fiber-reinforced polyolefin composites were analyzed through a composition-driven mathematical modeling framework based on Response Surface Methodology (RSM). The analysis began by identifying the main measurable predictors governing composite behavior, namely cellulose content, hemicellulose content, moisture content, and filler loading, while tensile strength and tensile modulus were selected as the output responses. After compiling and preprocessing the literature-derived dataset, the variables were normalized, coded, and mapped into a four-factor analytical design space. A second-order polynomial regression model was then used to mathematically describe the relationship between the compositional inputs and the mechanical outputs, enabling simultaneous estimation of linear, quadratic, and interaction effects. The fitted equations were subsequently evaluated using ANOVA, multicollinearity analysis, residual diagnostics, and cross-validation, after which the validated models were used for response-surface interpretation and multi-response optimization. The reliability and predictive accuracy of the fitted models were confirmed by means of diagnostic residual analyses and analysis of variance to ensure model adequacy. Ultimately, multi-objective optimization is carried out using the desirability function approach, which simultaneously maximizes tensile and flexural properties while preserving desired thermal stability. Statistical inference, empirical modeling, and optimization are all connected into a single data-centric pipeline for advanced composite design in Figure 1, which schematically summarizes the entire methodological concept. Statistical modeling and optimization framework for natural fiber–reinforced polyolefin composites.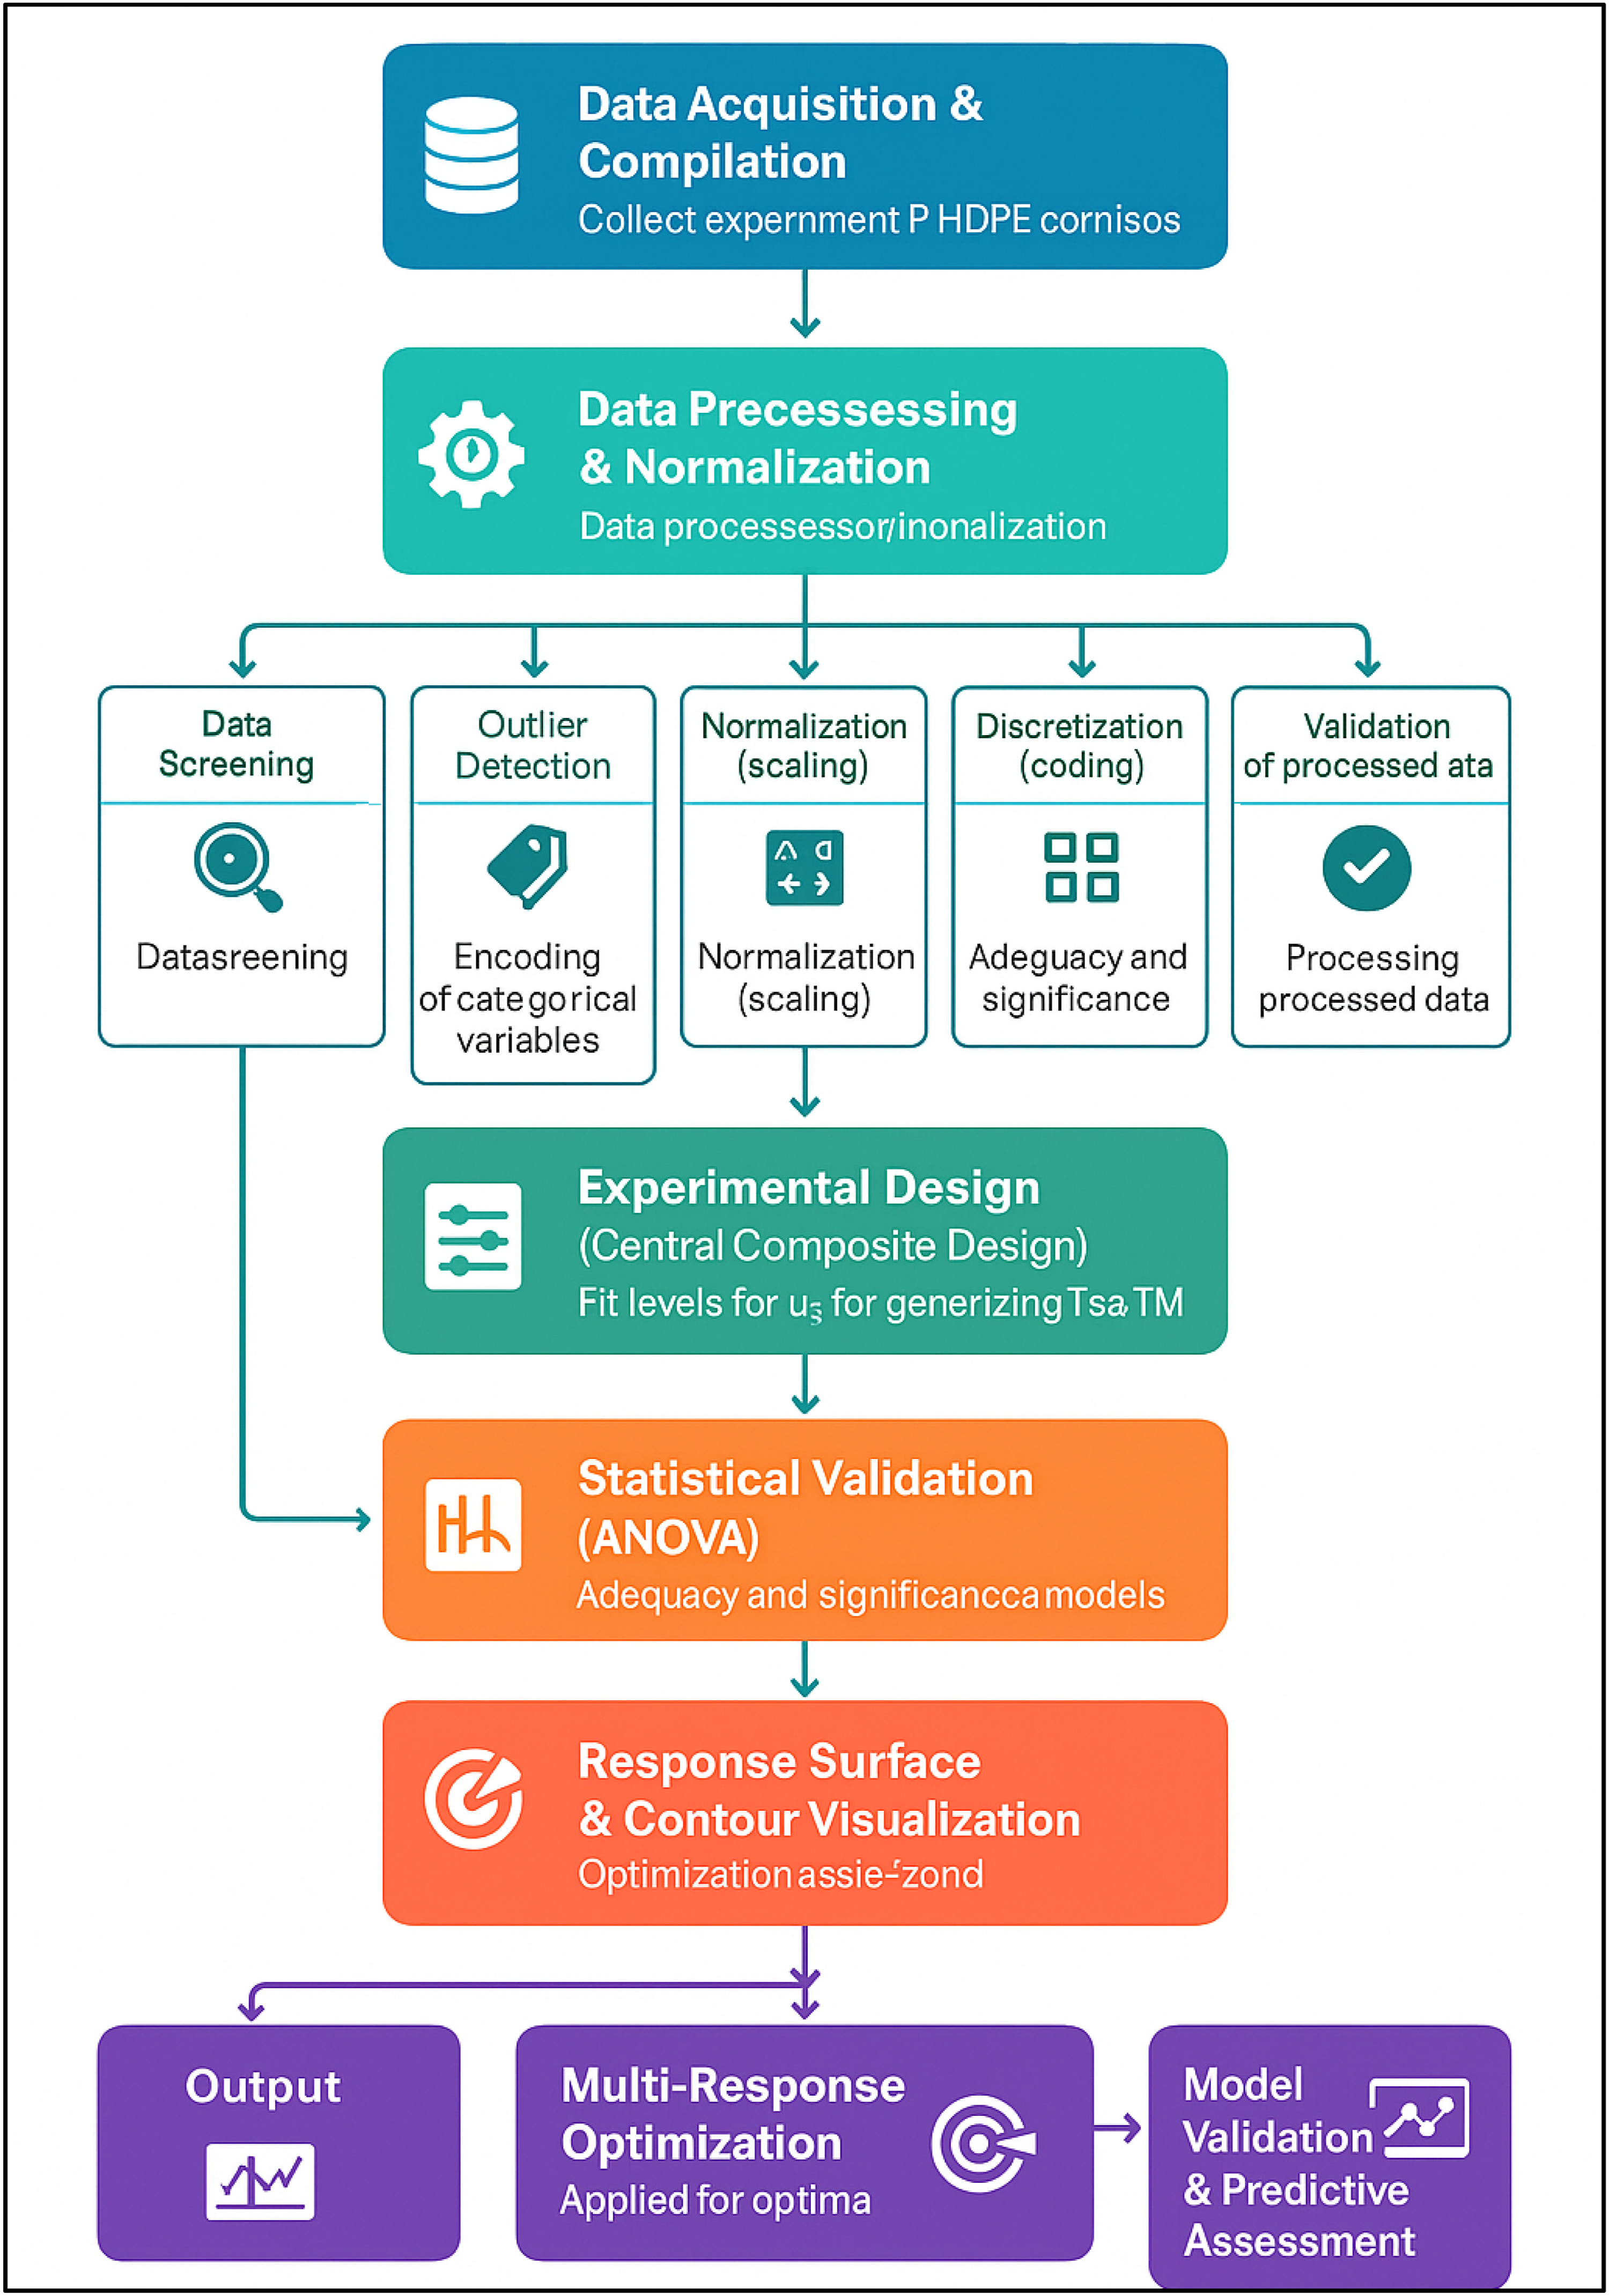
Data collection and compilation
A comprehensive dataset has been compiled from peer-reviewed publications that detail the performance of polyolefin-based composites reinforced with natural fibers, aligning with the objectives outlined in the methodological framework. The main focus is on HDPE matrices, which are the most widely used thermoplastic in sustainable composite applications. To ensure that the data can support reliable statistical modeling and optimization, only studies providing sufficiently detailed descriptions of the reinforcing fibers and the performance of the resulting composites are included.
A set of input variables describing the chemical composition and fundamental physical properties of the fibers, along with output responses representing the composite’s overall mechanical, thermal, and physical performance, defines each record in the dataset. Moisture levels, filler loading as weight percentage, and the amounts of cellulose and hemicellulose are among the input variables. Tensile strength and tensile modulus, which together characterize the stiffness and strength behavior of the material under load, are included in the responses. This integrated representation enables a direct correlation between fiber chemistry, moisture behavior, and mechanical performance, serving as the basis for further statistical modeling and optimization.
Collected experimental dataset of natural fiber-reinforced HDPE composites 14 .
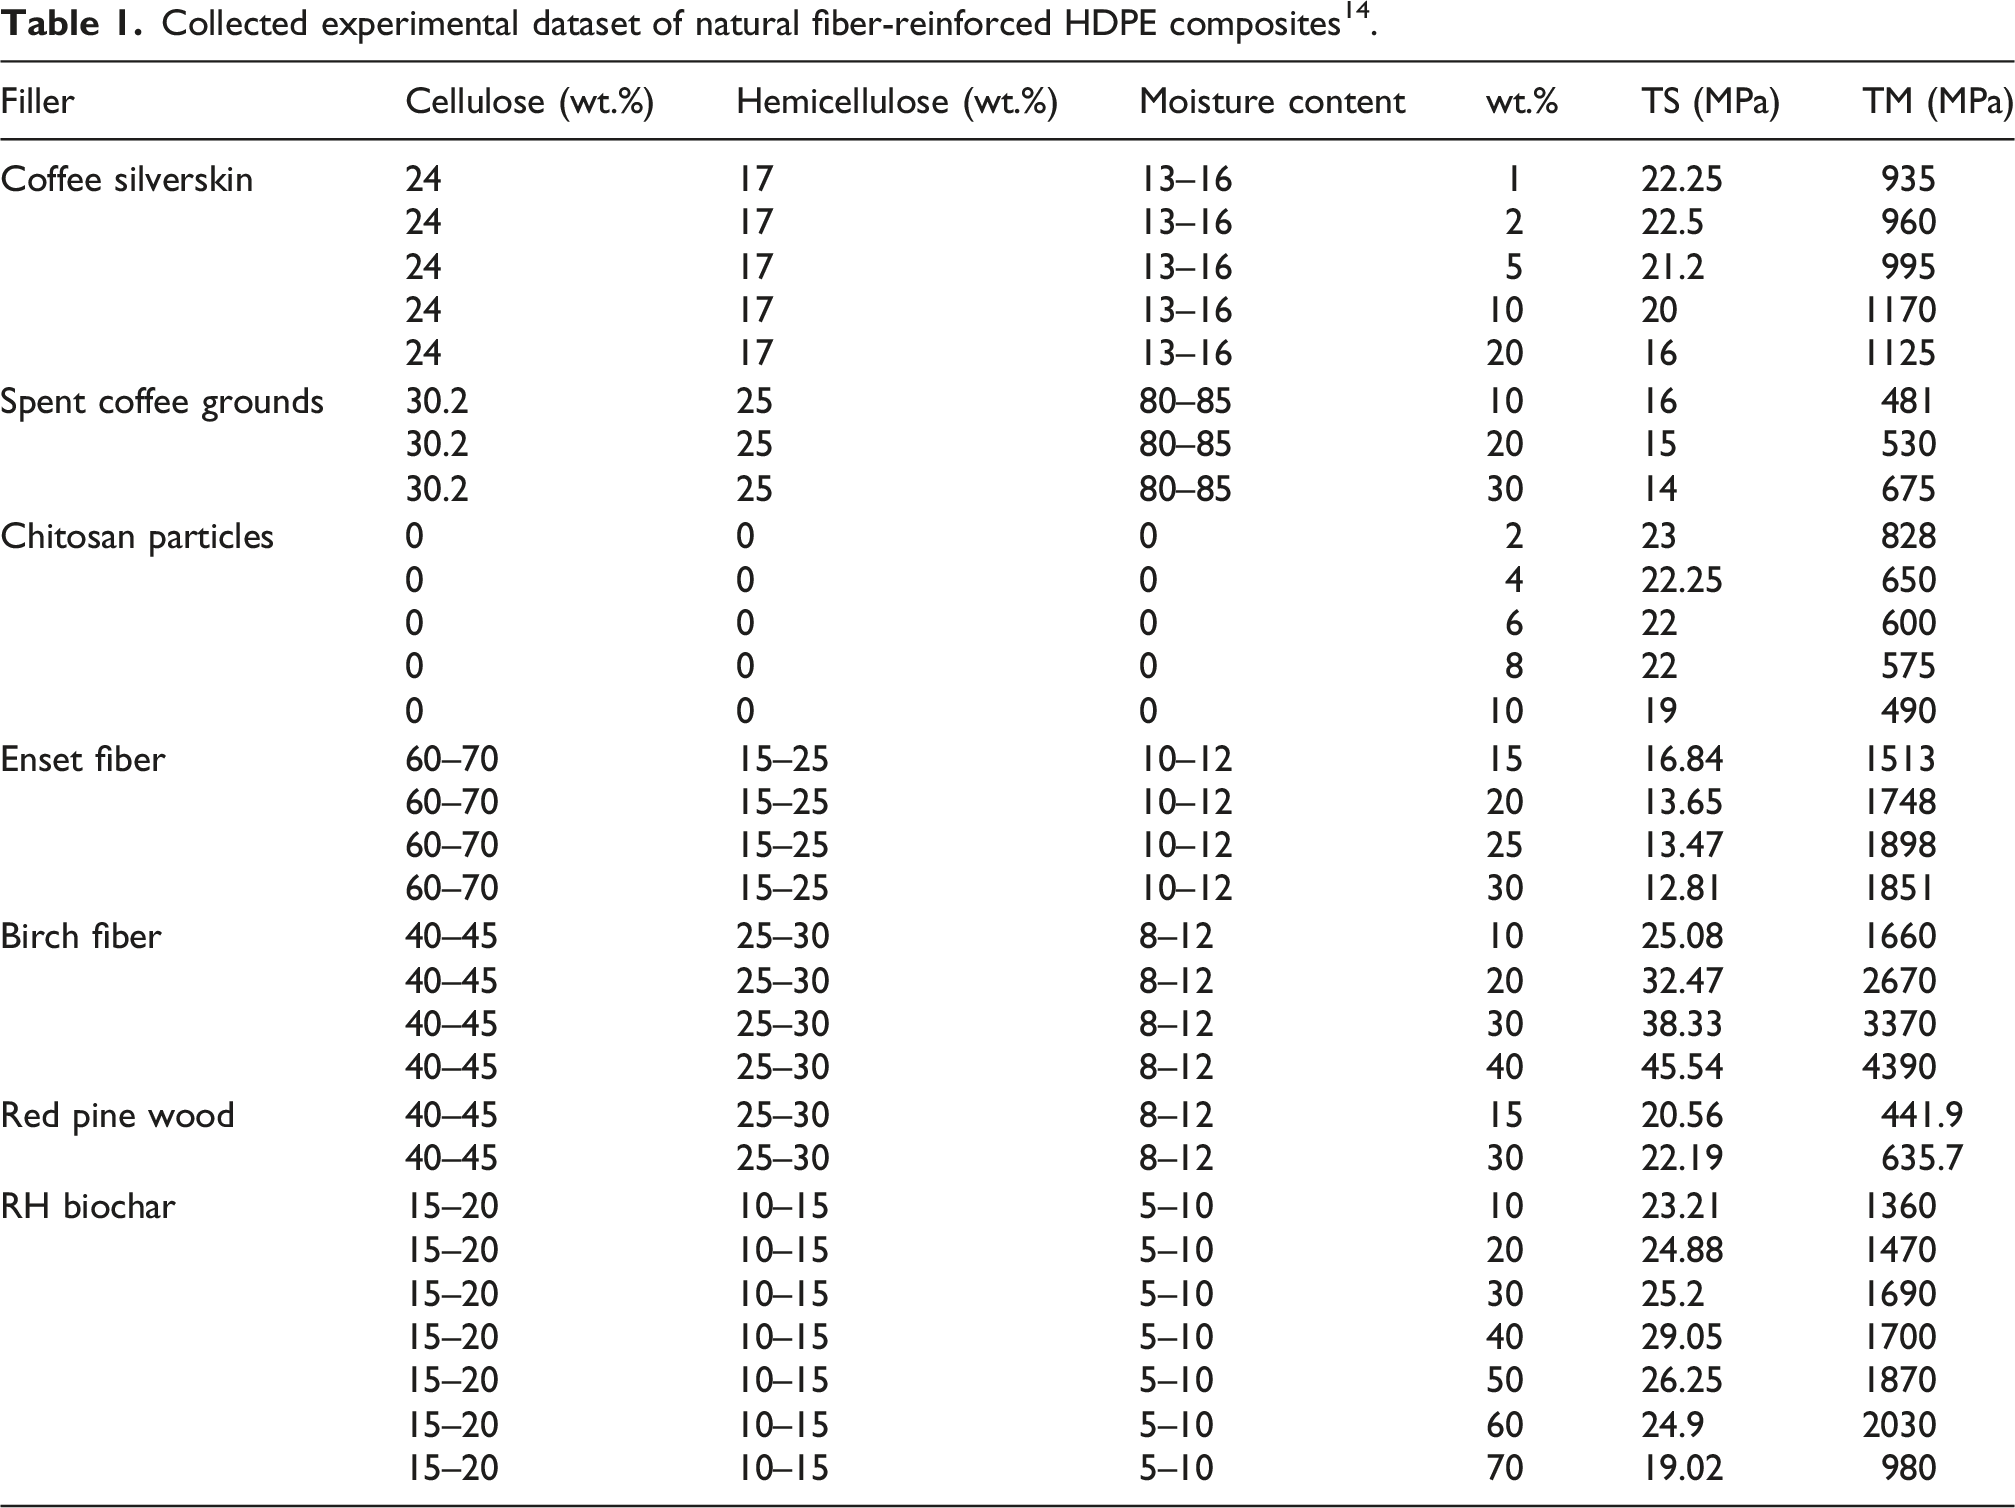
The raw dataset collected from previous studies was not originally reported as a fully expanded record-level dataset. Instead, many of the source studies presented material composition and mechanical property values in the form of ranges or bounded intervals. In this raw form, the compiled dataset was not directly suitable for statistical learning, regression modeling, or response-surface-based predictive analysis. Therefore, a dedicated data decoding procedure was developed to transform these interval-based entries into discrete machine-readable records. Through this range-decoding and discretization process, the raw literature dataset was expanded into a final analytical dataset containing 1452 records, which was subsequently used for model development, validation, and optimization.
Despite the strong statistical performance of the developed RSM models, several limitations associated with literature-based modeling should be acknowledged. First, the compiled dataset was derived from multiple independent studies and therefore reflects unavoidable heterogeneity in specimen preparation methods, fiber treatments, polymer grades, compatibilizer usage, processing conditions, and mechanical testing protocols. In addition, the intrinsic quality of natural fibers may vary because of factors such as species origin, soil characteristics, weather conditions, agricultural practices, harvest timing, and storage history, all of which can influence the resulting chemical composition and moisture behavior of the fibers. In the present framework, this variability was captured only to the extent that it was expressed through the measurable descriptors reported in the literature, particularly cellulose, hemicellulose, moisture content, and filler loading. Second, some of the original literature data were reported in range-based form rather than as fully expanded record-level observations, which required a range-decoding and discretization procedure to construct the final analytical dataset. Although this step enabled large-scale modeling, it may introduce approximation effects relative to raw experimental measurements. Third, not all potentially influential variables were reported consistently across the source studies, which means that some secondary effects could not be included explicitly in the present regression framework. Accordingly, the proposed models should be interpreted as robust composition-driven predictive tools within the domain represented by the curated literature dataset, rather than as universally transferable physical laws for all natural fiber–reinforced polyolefin composite systems. Future work should therefore validate the identified optimal regions using controlled experimental campaigns under standardized processing and testing conditions while also incorporating source-specific fiber quality descriptors wherever available.
Figure 2 provides quantitative evidence that the response surfaces are governed not only by general compositional trends, but also by unequal curvature intensity and interaction strength among the predictors. For tensile strength, the strongest interaction is observed between cellulose and filler loading (X1X4), which is supported by the highest interaction F-value of 35.68, indicating that the strengthening effect of cellulose becomes significantly more pronounced when the filler fraction lies within the moderate reinforcement range. Secondary interaction effects are associated with X1X2 (F = 15.74) and X2X4 (F = 12.49), whereas the moisture-related interactions are weaker, with X1X3, X3X4, and X2X3 yielding F-values of 9.05, 6.73, and 5.56, respectively. The curvature of the TS surface is dominated by the cellulose quadratic term X12 (F = 75.27), followed by filler loading X42 (F = 19.68), confirming that the surface is sharply nonlinear with respect to cellulose and moderately nonlinear with respect to filler addition, while hemicellulose and moisture contribute weaker curvature through X22 (F = 13.36) and X32 (F = 4.56). A similar pattern is observed for tensile modulus, where the dominant interaction is again X1X4 (F = 35.09), followed by X1X2 (F = 15.11) and X2X4 (F = 11.76), while the strongest curvature arises from X12 (F = 72.21) and X42 (F = 30.59). These quantitative rankings confirm that cellulose and filler loading are the principal drivers of both surface steepness and interaction intensity, which explains why the mechanically optimal region is concentrated around high cellulose content and moderate filler loading, whereas the negative influence of hemicellulose and moisture appears as a secondary but still statistically significant flattening and downward shifting of the response surfaces. Response surface plots showing the interactive effects of fiber composition and filler loading on the tensile properties of the composites.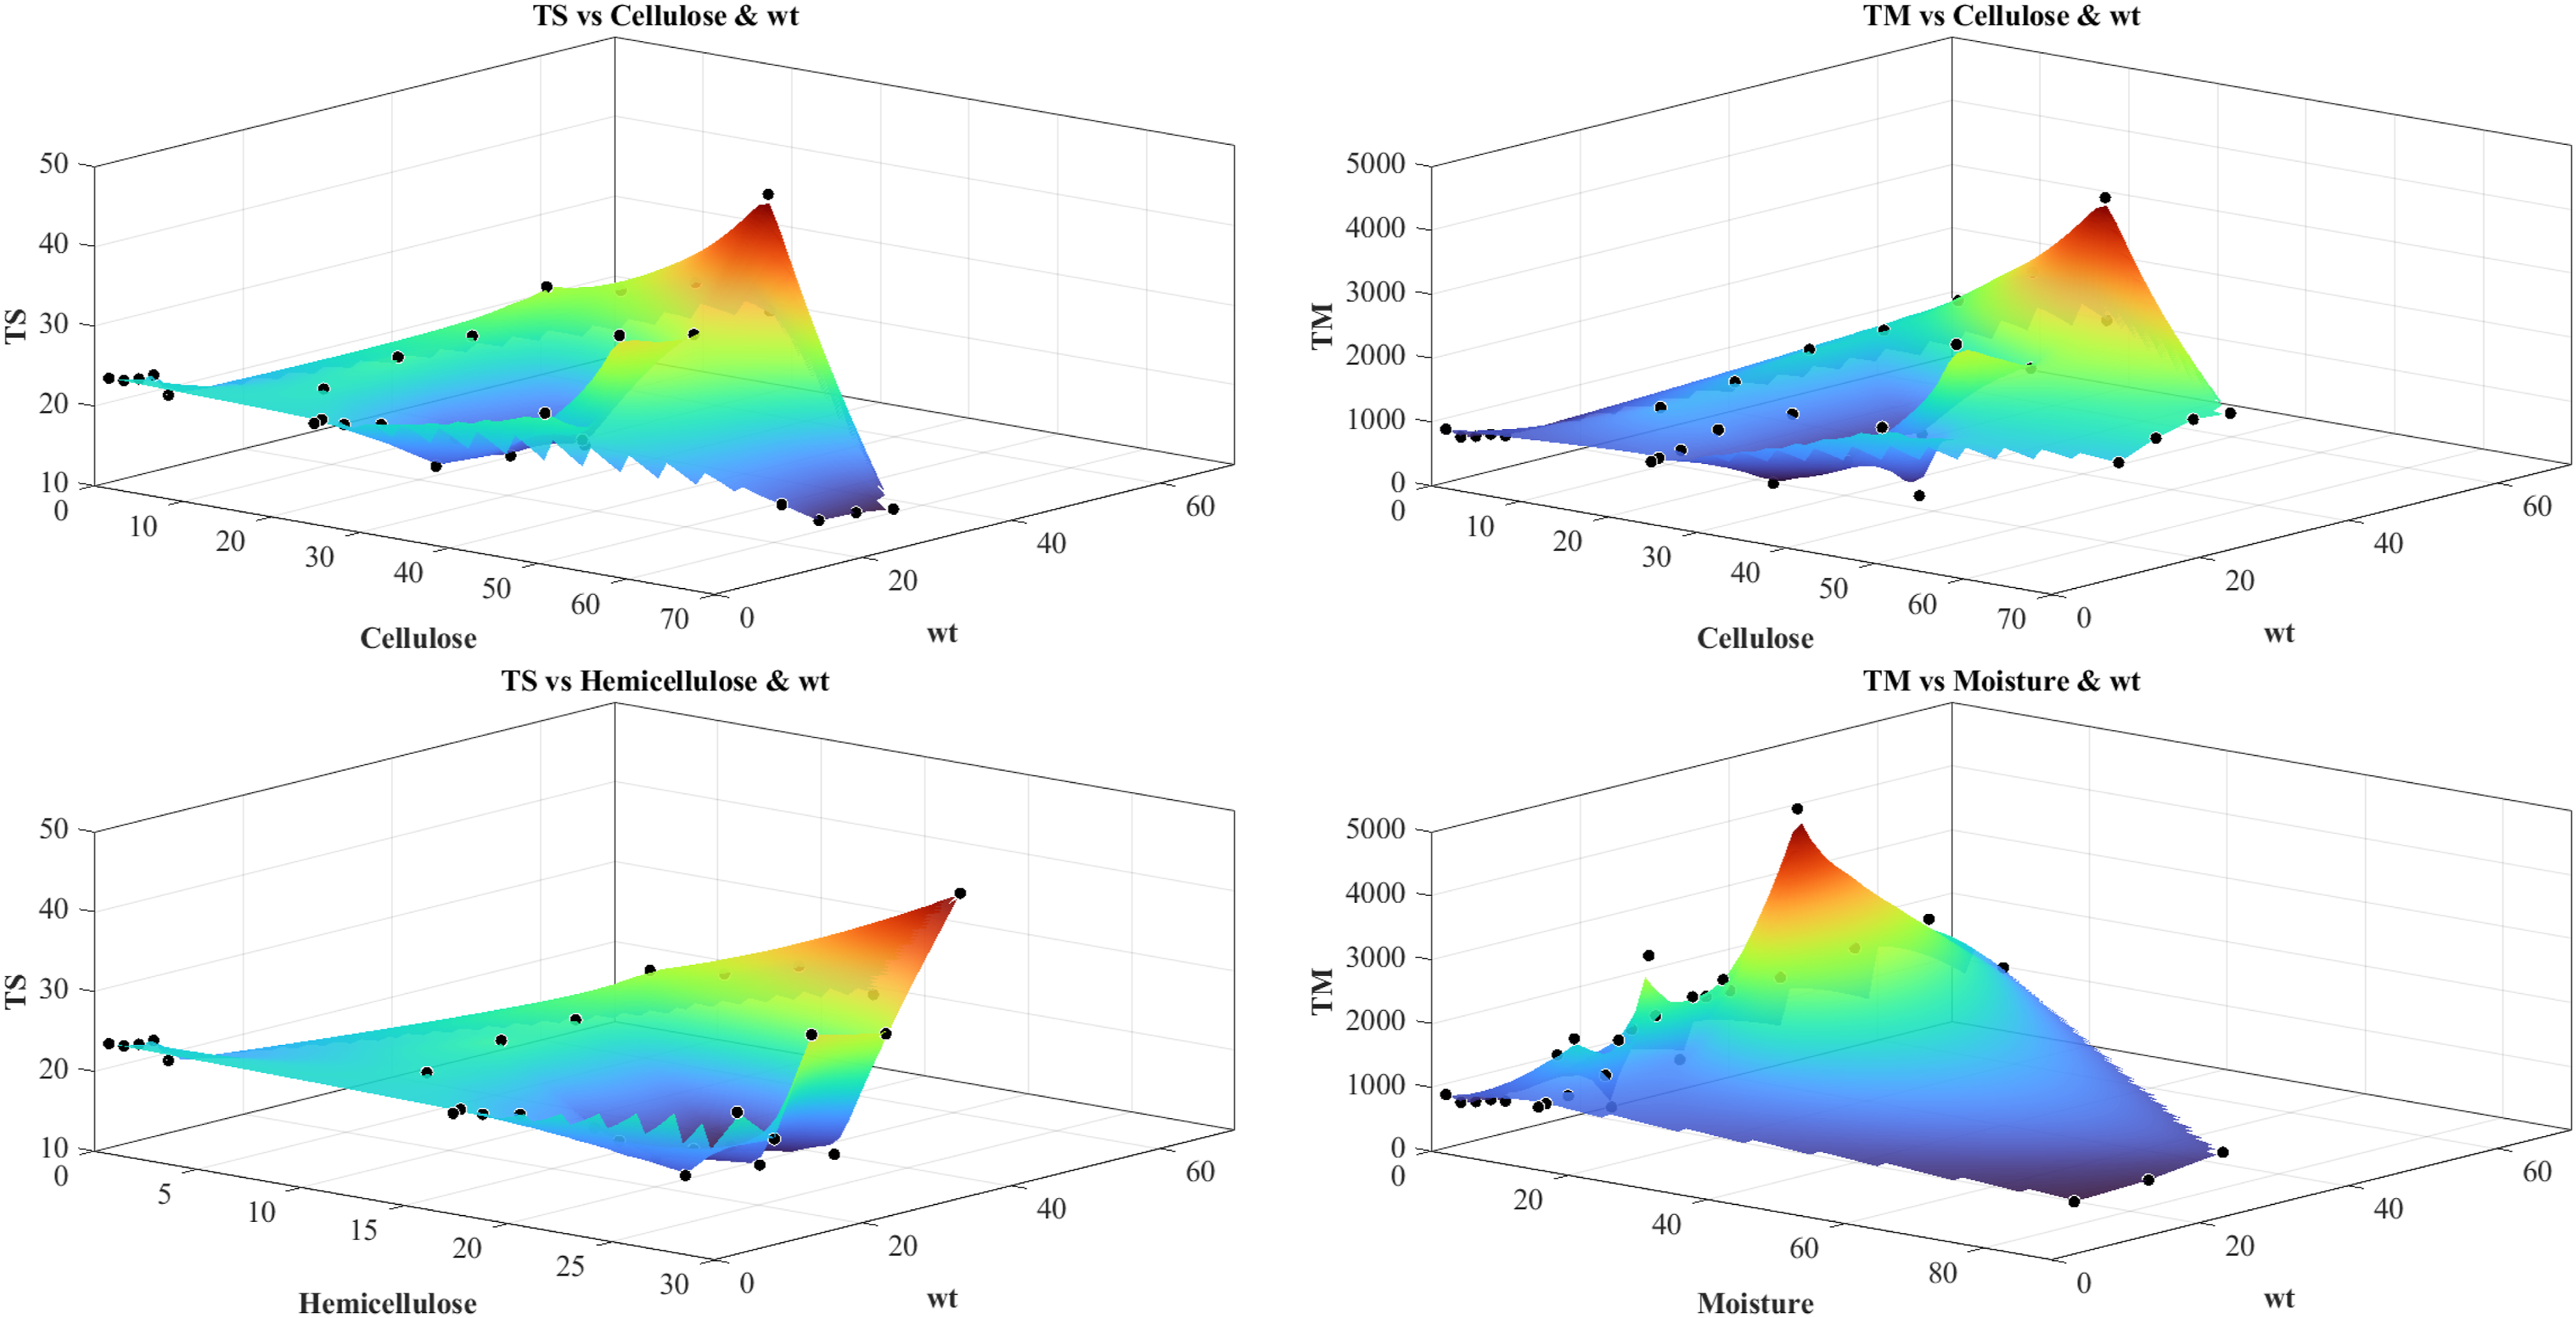
Data preprocessing and normalization
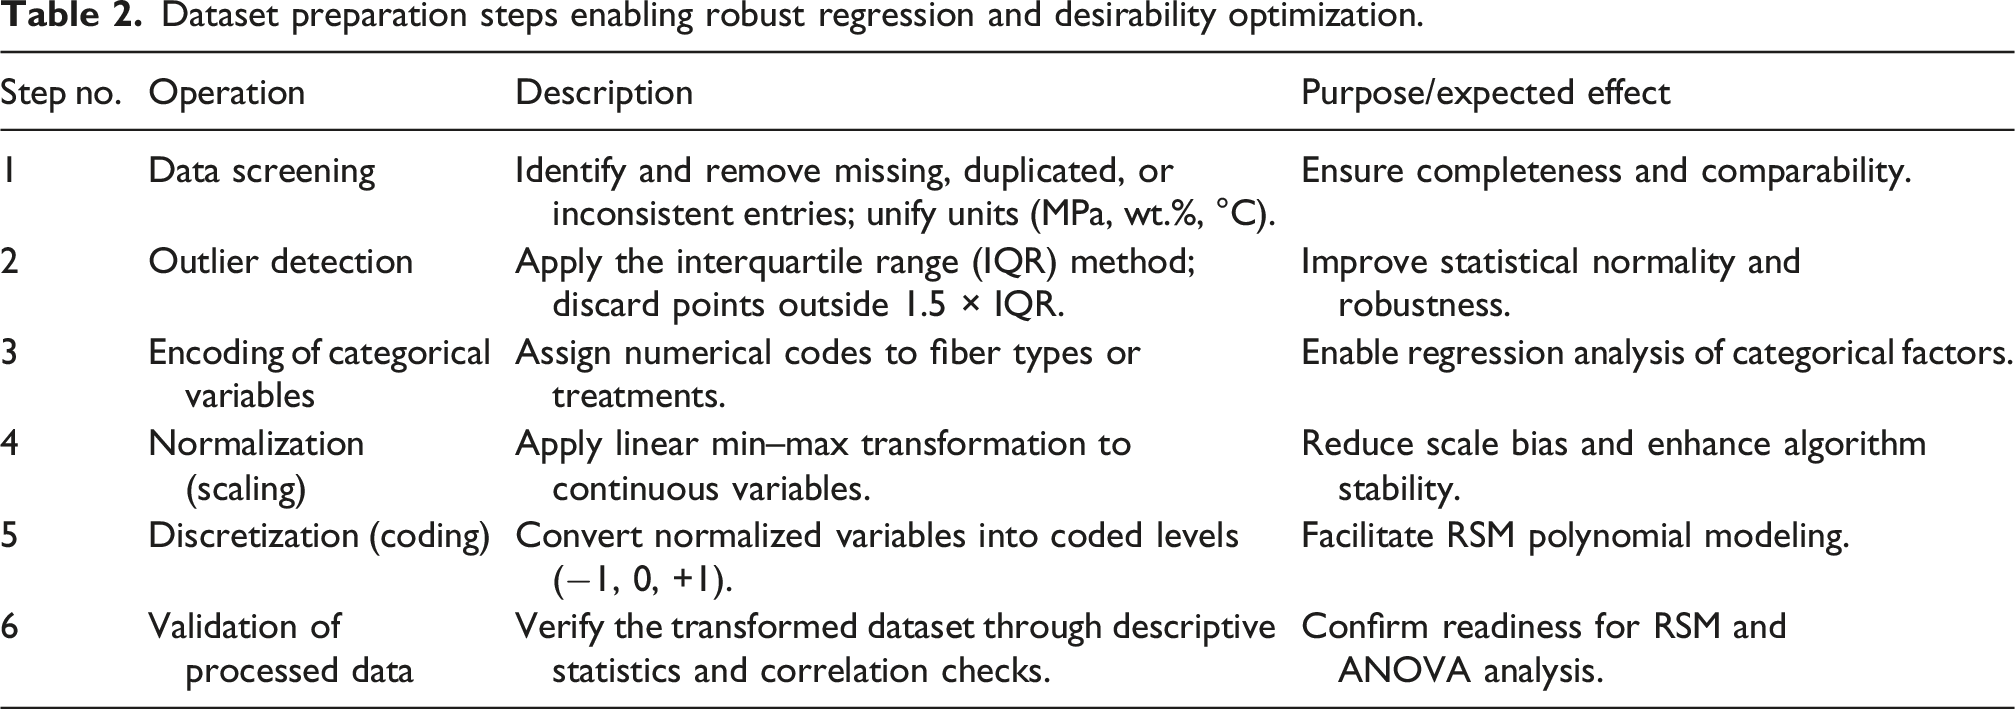
The compiled dataset is subjected to a systematic preprocessing process before statistical modeling in order to guarantee data consistency, eliminate redundancy and get all variables ready for regression-based optimization. Initial harmonization is crucial because the experimental results are taken from various sources, each of which used different measurement units, testing standards and reporting accuracies. To generate a consistent modeling dataset, each range-based entry extracted from the literature was decoded using a structured discretization procedure. This procedure converted bounded variable intervals into representative numerical records while preserving the feasible composition domain reported in the original studies. The objective of this step was to convert heterogeneous literature-reported ranges into a unified tabular dataset that could be processed by machine learning and statistical modeling tools. The resulting expanded dataset preserved the underlying material-design space while enabling regression fitting, cross-validation, error analysis, and response-surface optimization on a sufficiently large sample base. To maintain dataset integrity, the raw data were first checked for missing, duplicate, or physically inconsistent values. The remaining numerical variables were then transformed to uniform SI units and scaled by converting all moisture or compositional parameters to percentage fractions and all strength and modulus-related values to megapascals (MPa). For statistical compatibility with continuous predictors, numerical identifiers are used to encode categorical descriptors (such as fiber type). The interquartile range (IQR) criterion is used to detect outliers and remove abnormal points that are larger than 1.5 × IQR. This ensured that the final dataset had a near-normal distribution that was appropriate for response surface modeling. To reduce bias among variables measured on various scales, the dataset is standardized using normalization and discretization after validation and cleaning. The numerical stability of the regression estimation is enhanced by normalizing continuous variables such as fiber composition, filler loading, and tensile properties using linear min–max transformation to confine all values within the interval [0, 1].
Dataset preparation steps enabling robust regression and desirability optimization.
All continuous input features are first normalized using a linear min–max transformation to guarantee comparability between variables measured on various scales. By limiting each variable to a predetermined range between 0 and 1, this scaling technique removes scale bias and enhances numerical stability when performing regression modeling. For each variable 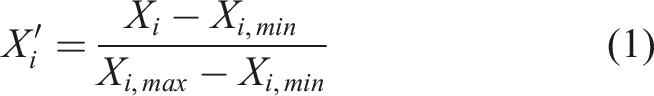
Z-score standardization is also used as a diagnostic tool to assess the distribution of the data and find possible outliers. This process enables the identification of anomalous or extreme observations by expressing each variable in terms of its deviation from the mean in units of standard deviation. The standardized score 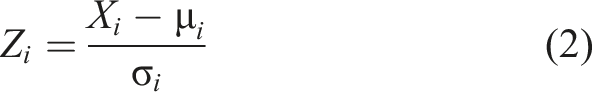
All normalized variables are converted into coded factors for the RSM to express their levels in relation to the central reference point. By giving the low, central, and high experimental levels fixed coded values of −1, 0, and +1, this transformation makes model fitting and interpretation easier. The coded variable 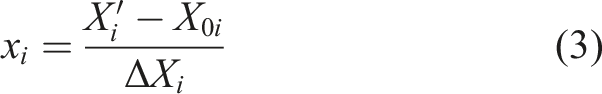
Experimental design and response surface modeling
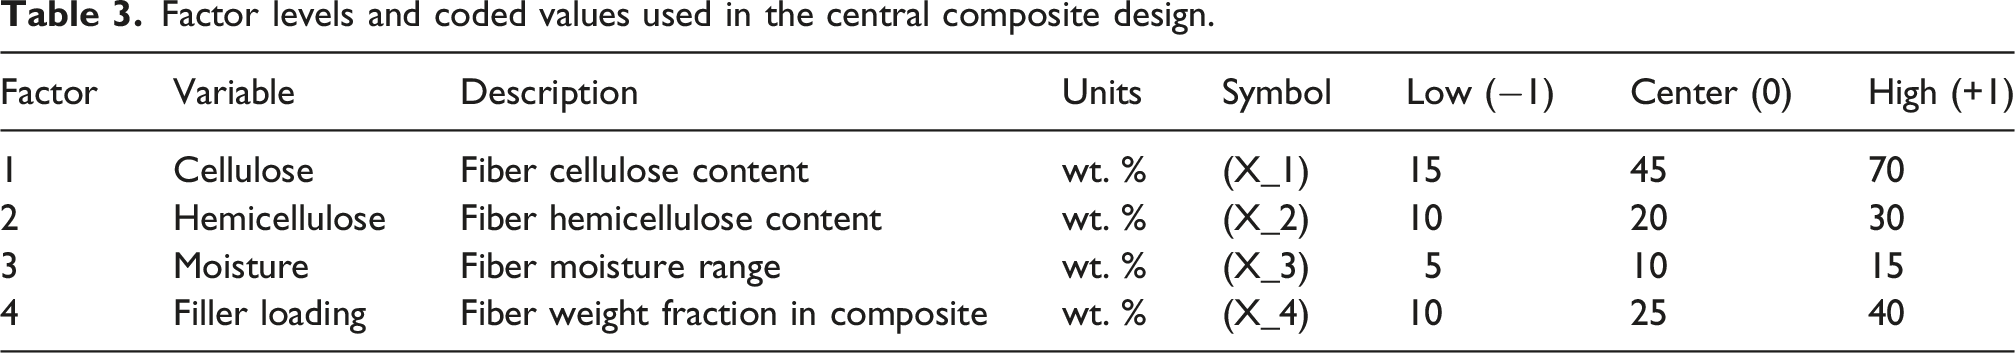
The Response Surface Methodology (RSM) based on Central Composite Design (CCD) was adopted in this study as a statistical framework for constructing and optimizing second-order predictive models for the mechanical performance of natural fiber-reinforced polyolefin composites. It should be emphasized that, because this work is based on curated literature-derived data rather than newly performed physical experiments, the CCD was not applied as a conventional laboratory design-of-experiments sequence. Rather, it was employed as a coded response-surface structure that enabled the harmonized literature observations to be mapped into a common four-factor design space and analyzed consistently using quadratic regression. This framework is particularly suitable for composite systems in which tensile strength and tensile modulus are affected in a nonlinear manner by fiber chemistry and formulation variables. Based on the refined dataset, four independent variables were selected as the primary predictors of mechanical behavior: cellulose content (x1), hemicellulose content (x2), moisture content (x3), and filler loading (x4). The corresponding response variables were tensile strength (TS) and tensile modulus (TM), denoted by Y1 and Y2, respectively. To facilitate RSM analysis, each factor was represented using coded levels of −1, 0, and +1, corresponding to the low, central, and high values identified from the feasible ranges observed in the refined literature dataset.
Factor levels and coded values used in the central composite design.

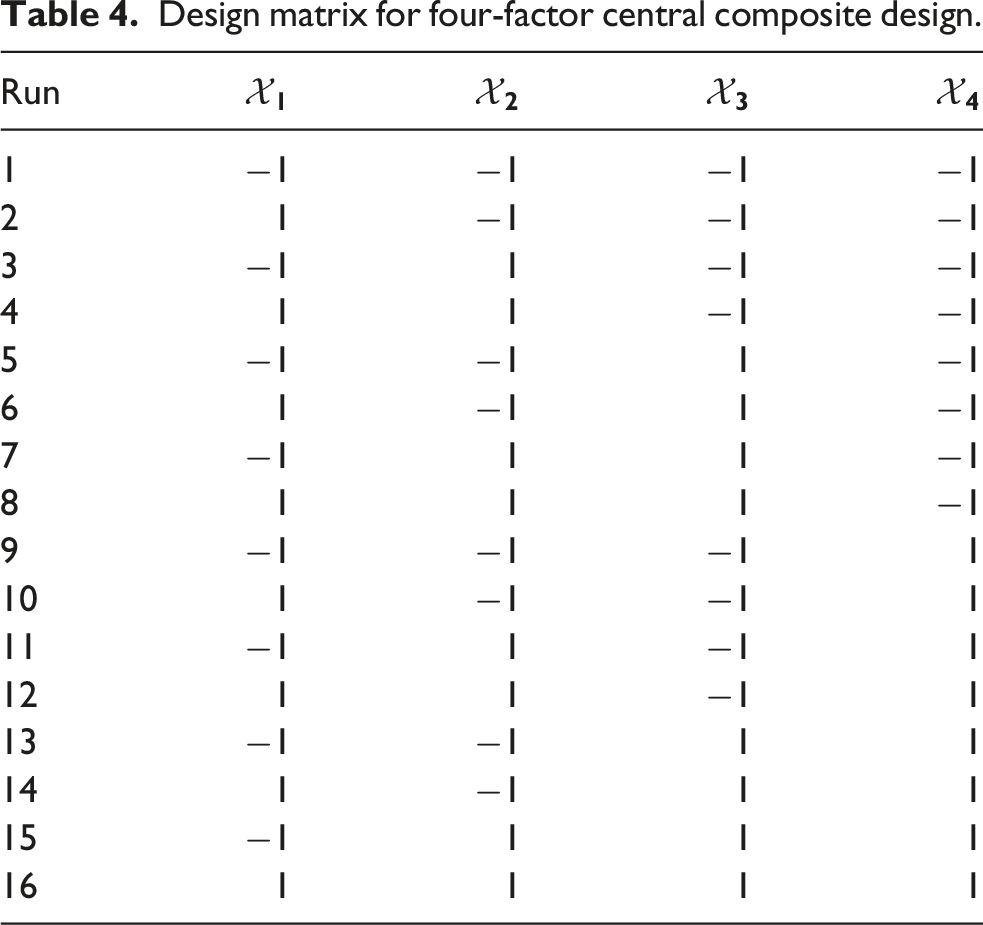
Design matrix for four-factor central composite design.
Empirical model formulation
The second-order polynomial regression model, which served as the basis for Response RSM, was used to describe the quantitative relationship between the selected factors and the measured responses. Fiber composition, moisture, and filler loading all have both direct and indirect effects on the composite’s mechanical performance. This empirical formulation enables the simultaneous assessment of linear, quadratic, and interactive effects among the independent variables. Mathematically, the composite system was analyzed by expressing tensile strength and tensile modulus as continuous functions of the selected compositional variables. Rather than relying on purely descriptive comparison of experimental observations, the study formulated predictive regression equations that quantify how each input factor and its interactions influence the mechanical responses. This approach allows the natural fiber composite behavior to be examined systematically in terms of direct effects, curvature effects, and coupled factor interactions, thereby transforming heterogeneous literature observations into an interpretable mathematical model suitable for prediction and optimization. For each response variable, TS and TM, the general predictive model can be represented as:
The least squares approach, which minimizes the sum of squared deviations between observed and predicted responses, is used to estimate the coefficients to build the model: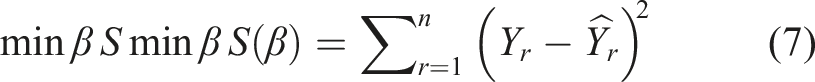

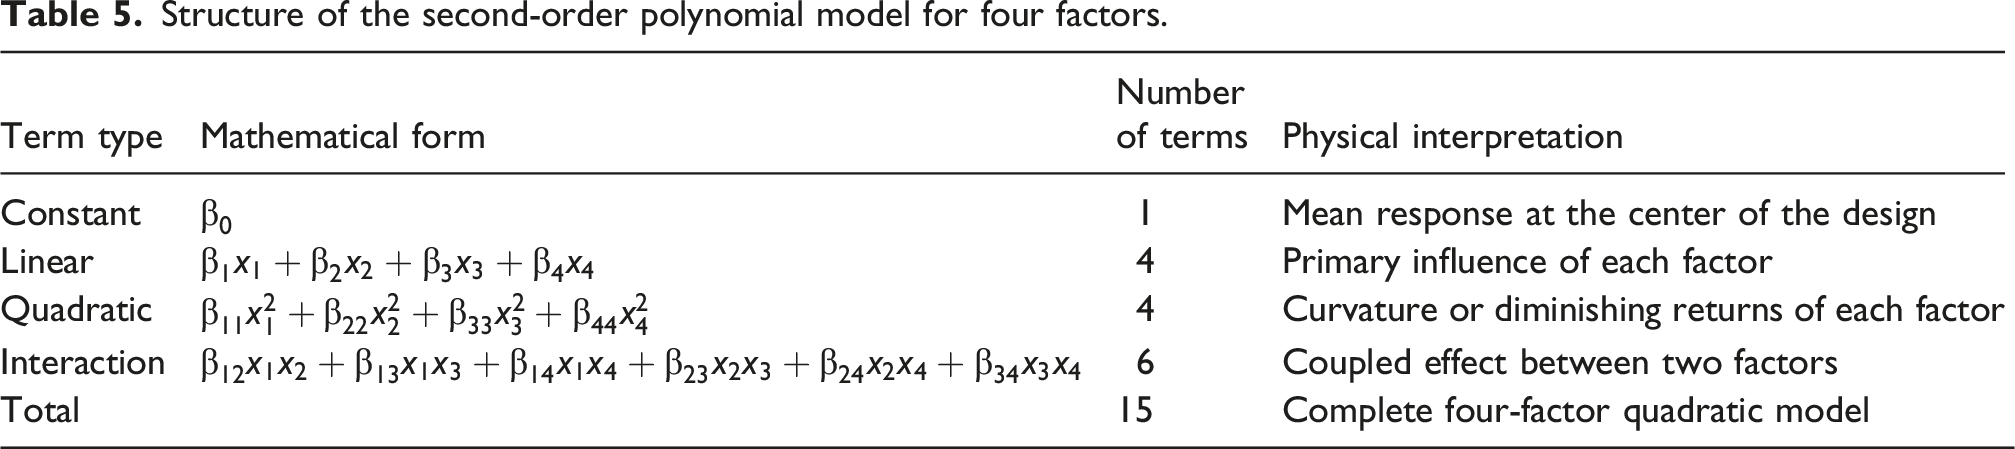
Structure of the second-order polynomial model for four factors.
Statistical analysis and model adequacy
The developed second-order polynomial models for tensile strength and tensile modulus were statistically validated through analysis of variance (ANOVA) to determine the reliability and significance of the fitted relationships. ANOVA decomposes the total variation in the experimental data into individual components attributable to the regression model and to residual error.
The ratio of the mean square due to regression to that due to residual error (the F-statistic) is used to test the overall adequacy of the model at a selected confidence level (typically 95%).
A smaller p-value (<0.05) indicates that the corresponding term exerts a statistically significant influence on the response. The total sum of squares can be expressed as:
The total variation is partitioned into regression and residual components:
Each sum of squares is divided by its corresponding degrees of freedom (df) to yield the mean squares: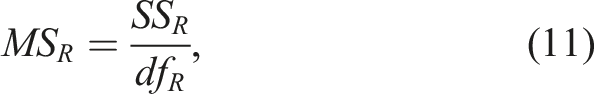
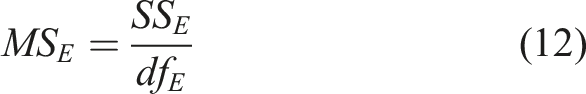
The overall significance of the model is then evaluated using the F-statistic: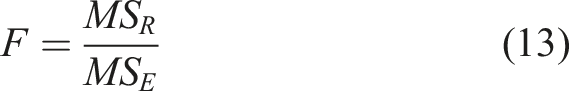
A model term is considered significant when its p-value associated with the F-ratio is below 0.05.
In addition, the coefficient of determination (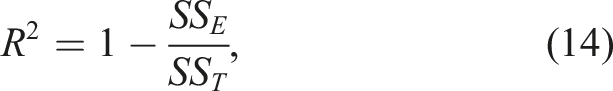
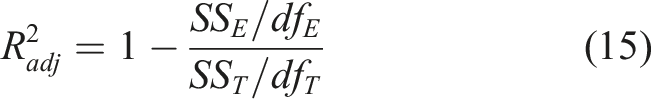
High values of
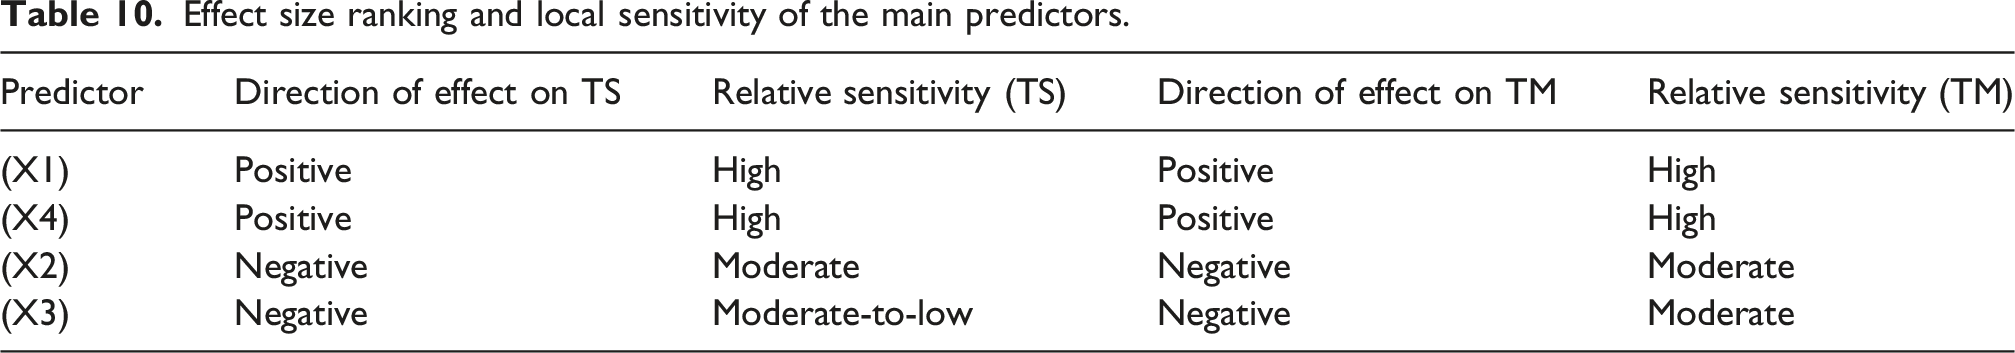
To further enhance the interpretability of the developed quadratic models, sensitivity analysis, standardized regression coefficients, and effect-size ranking were additionally performed. Standardized regression coefficients were calculated to compare the relative directional contribution of each coded predictor on a common scale. In parallel, factor sensitivity was assessed by examining the response variation associated with one-factor perturbations around the center point of the coded design space while holding the remaining variables constant. Effect-size ranking was then established by combining the standardized coefficients with the ANOVA contribution patterns, thereby identifying the most influential compositional parameters governing tensile strength and tensile modulus.
Response surface and contour analysis
Once the adequacy of the quadratic models was confirmed through ANOVA, the fitted equations were used to visualize the combined influence of the experimental factors on the composite responses. RSM provides both a quantitative and graphical interpretation of how variations in cellulose, hemicellulose, moisture, and filler loading affect tensile strength and tensile modulus. The three-dimensional (3D) surface plots and their corresponding two-dimensional (2D) contour plots were generated by holding two factors constant at their center values while varying the other two across their design ranges. An intuitive comprehension of the underlying material behavior was supported by this visualization, which allows for the simultaneous observation of main, interactive, and curvature effects on each response.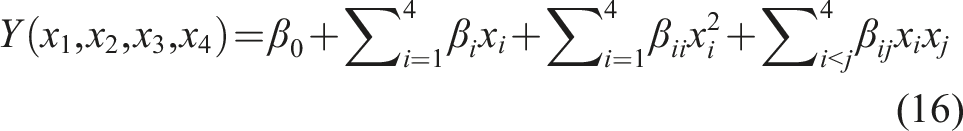
The model’s partial derivatives for each factor are calculated and set to zero to identify stationary points that might be optima and make interpretation easier: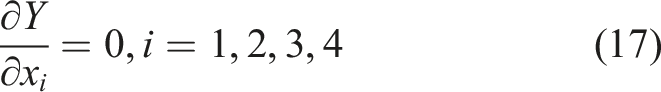
How factor pairs interact to affect the responses was shown by the 3D surfaces. For instance, adding more cellulose typically increases tensile strength up to a certain point after which fiber agglomeration causes the effect to plateau. Moderate fiber weight fractions combined with low moisture levels improve stiffness and interfacial bonding according to the interaction between filler loading and moisture content. By mapping constant response zones, the 2D contour plots help visualize the factor combinations that result in the required mechanical performance and further identify these ideal areas.
Typical response surfaces for the composites under study are shown schematically in Figure 3, demonstrating how cellulose and filler loading together affect TS and TM at constant hemicellulose and moisture levels. Typical two-dimensional contour plots and three-dimensional response surfaces that show how filler loading and cellulose content interact to affect the tensile strength of natural fiber reinforced polyolefin composites.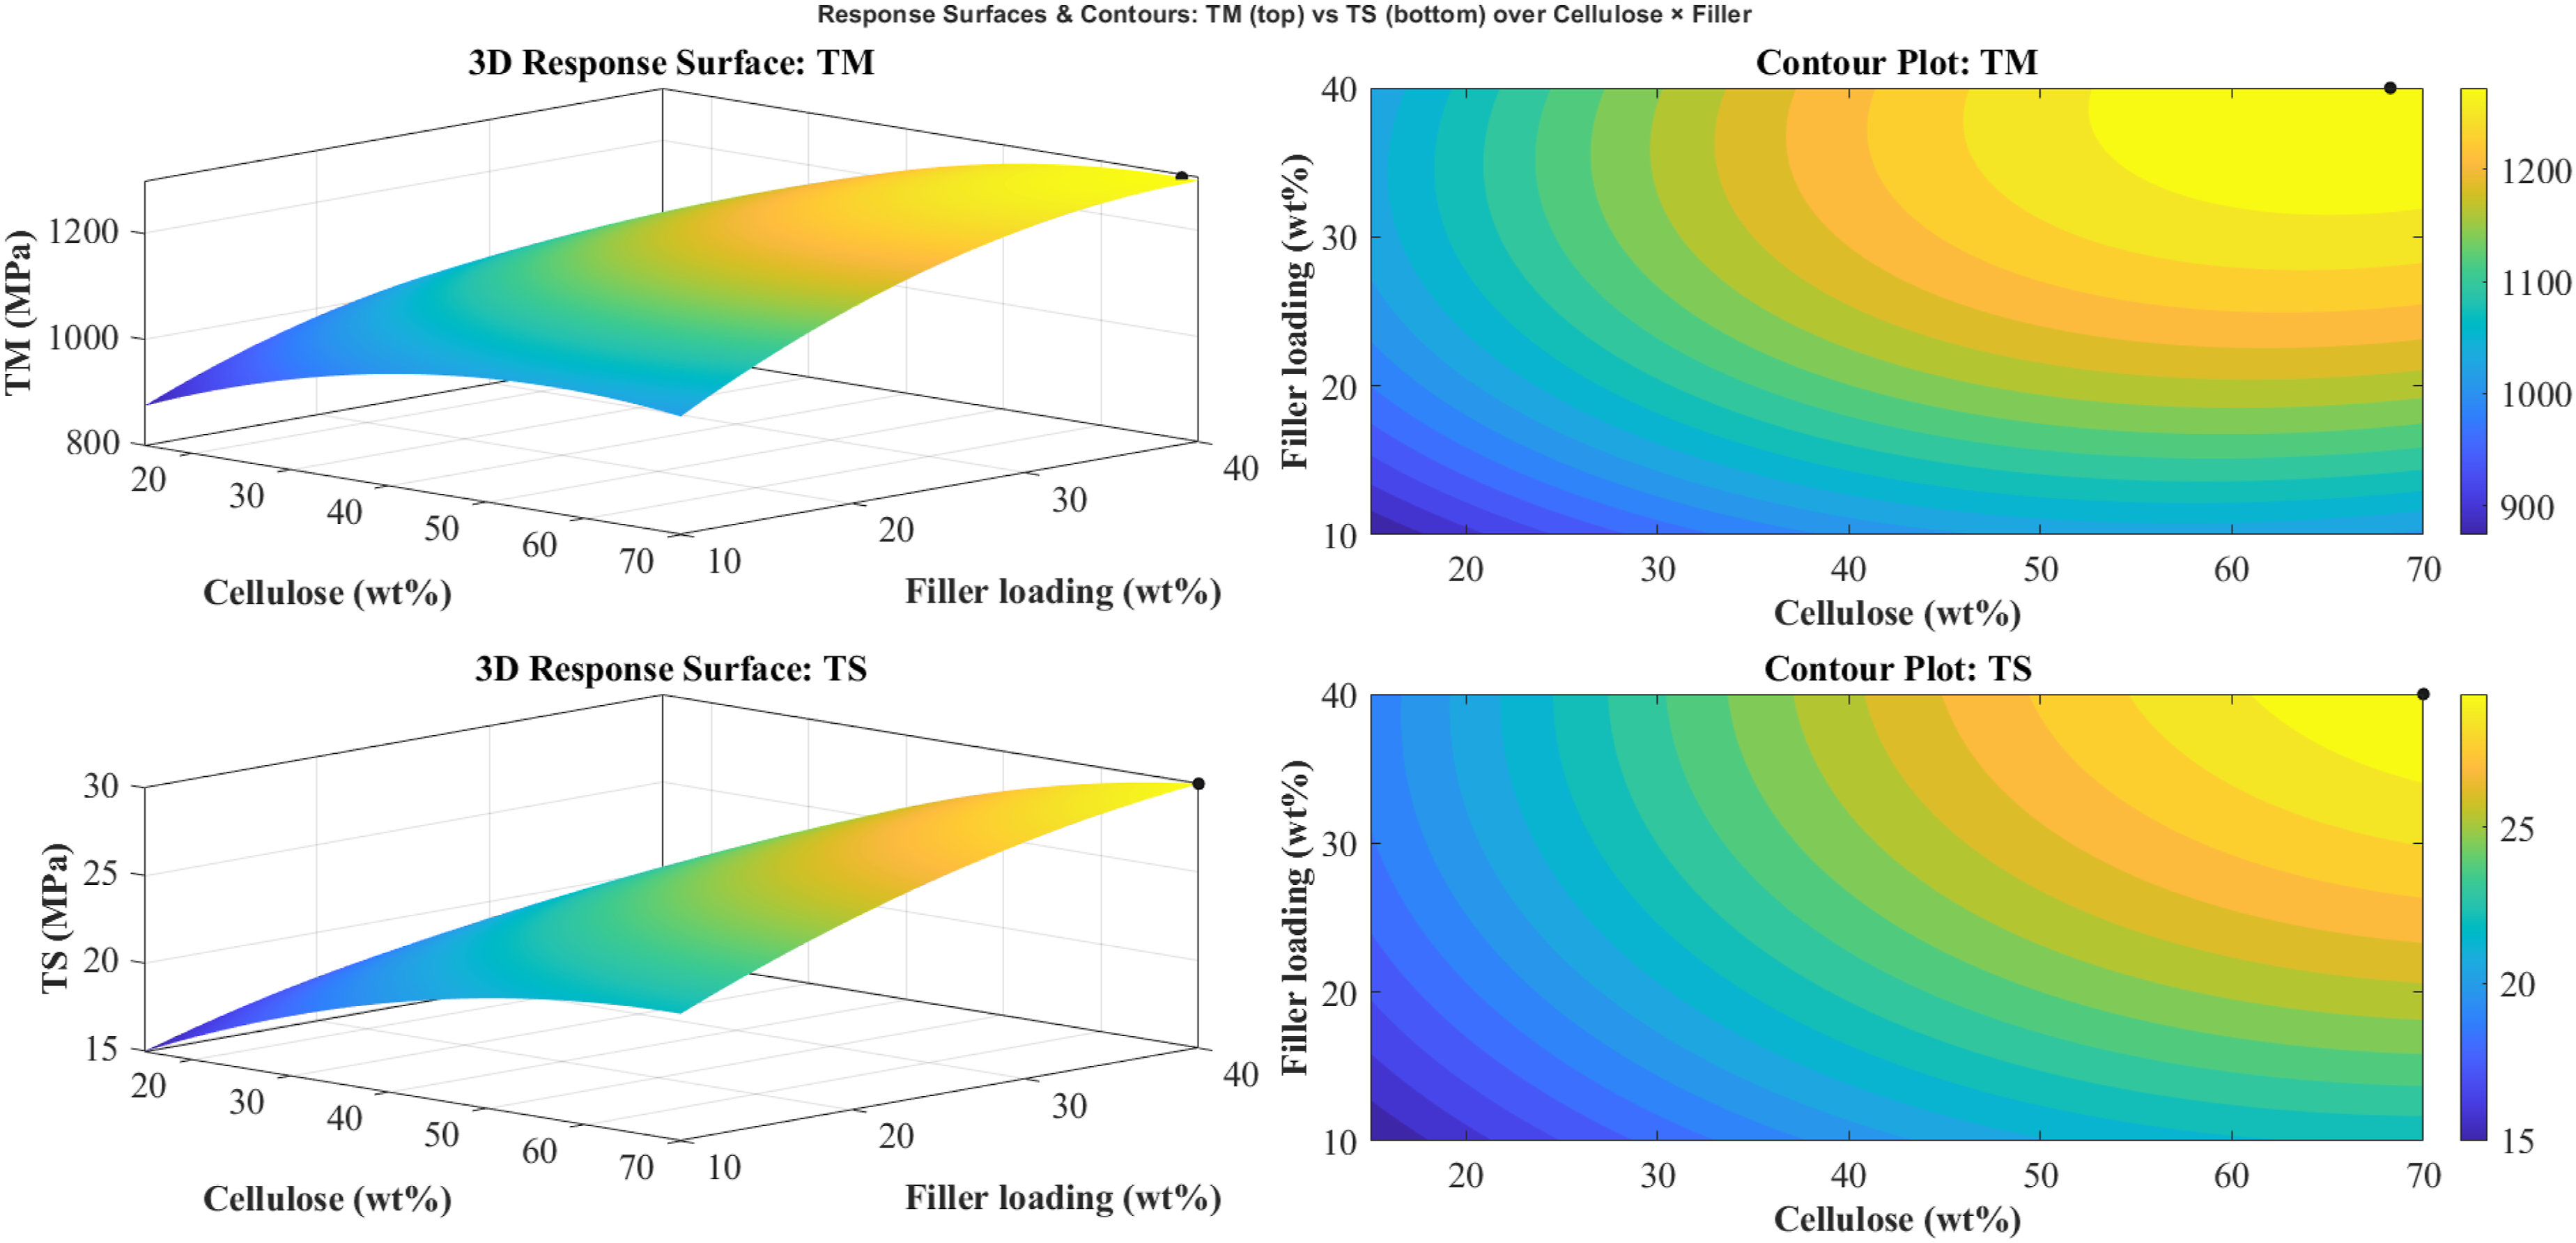
Validation and predictive assessment
The final processed dataset used for model development consisted of 1452 records obtained after decoding and discretizing the range-based data reported in the source literature. To ensure methodological rigor and reproducibility, a structured validation protocol was adopted. First, the predictive models were evaluated using 5-fold cross-validation, in which the full dataset was partitioned into five mutually exclusive subsets of approximately equal size. During each iteration, four folds were used for model training and one fold was used for validation, and this process was repeated until each fold had served once as the validation set. The reported cross-validation performance was obtained by averaging the results across all five folds. In addition to cross-validation, model performance was assessed using standard predictive accuracy metrics, including root mean square error (RMSE), mean absolute error (MAE), mean absolute percentage error (MAPE), and Pearson’s correlation coefficient (r). This validation framework was selected to provide a stable estimate of generalization performance while reducing the risk of overfitting and ensuring that the developed response surface models remained predictive across the expanded literature-derived dataset.
17
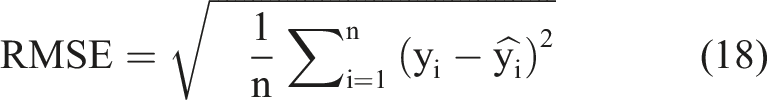


Complementary scalar metrics and agreement diagnostics are used to measure predictive accuracy. Large deviations are highlighted by the root mean square error (RMSE),
18
whereas the typical absolute deviation is reported by the mean absolute error (MAE).
19
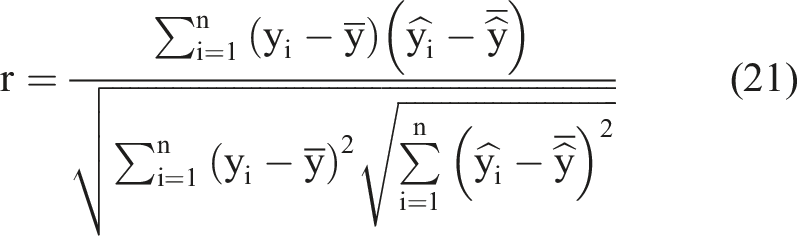
Scale-free comparison between responses was made easier by the mean absolute percentage error (MAPE), which prevents division by zero by eliminating or modifying near-zero references. Linear association between observed and predicted values is summarized by the Pearson correlation coefficient
Results and discussion
The main compositional factors, cellulose, hemicellulose, moisture, and filler loading, as well as their effects on the mechanical performance of natural fiber reinforced polyolefin composites, are measured and optimized using the developed RSM models. Two quadratic regression models were developed using the CCD to forecast the two main responses, TS and TM. These models capture the intricate nonlinear dependencies that control fiber matrix behavior by taking into account the independent variables’ linear, quadratic, and two-factor interaction effects. An ANOVA revealed that there is no evidence of a lack of fit and that both the TS and TM models were highly significant at a 95% confidence level (p < 0.05), suggesting that the experimental and predicted results agreed very well. The high values of the R2 and its adjusted and predicted counterparts demonstrated that the models explained more than 98% of the total variation observed in the dataset, underscoring their robustness and reliability for predictive applications. In addition, the small residual errors and high Adequate Precision ratios (>20) indicated strong signal-to-noise quality, ensuring that the constructed models are suitable for navigating the design space effectively.
The verified RSM equations were then used for response visualization and multi-objective optimization, allowing for the simultaneous improvement of stiffness and tensile strength under carefully regulated compositional changes. As discussed in the ensuing subsections on ANOVA, regression analysis, and desirability-based optimization, this combination of statistical inference and empirical modeling not only produced quantitative relationships that could be understood but also laid the groundwork for material design optimization.
Analysis of variance (ANOVA) and model significance
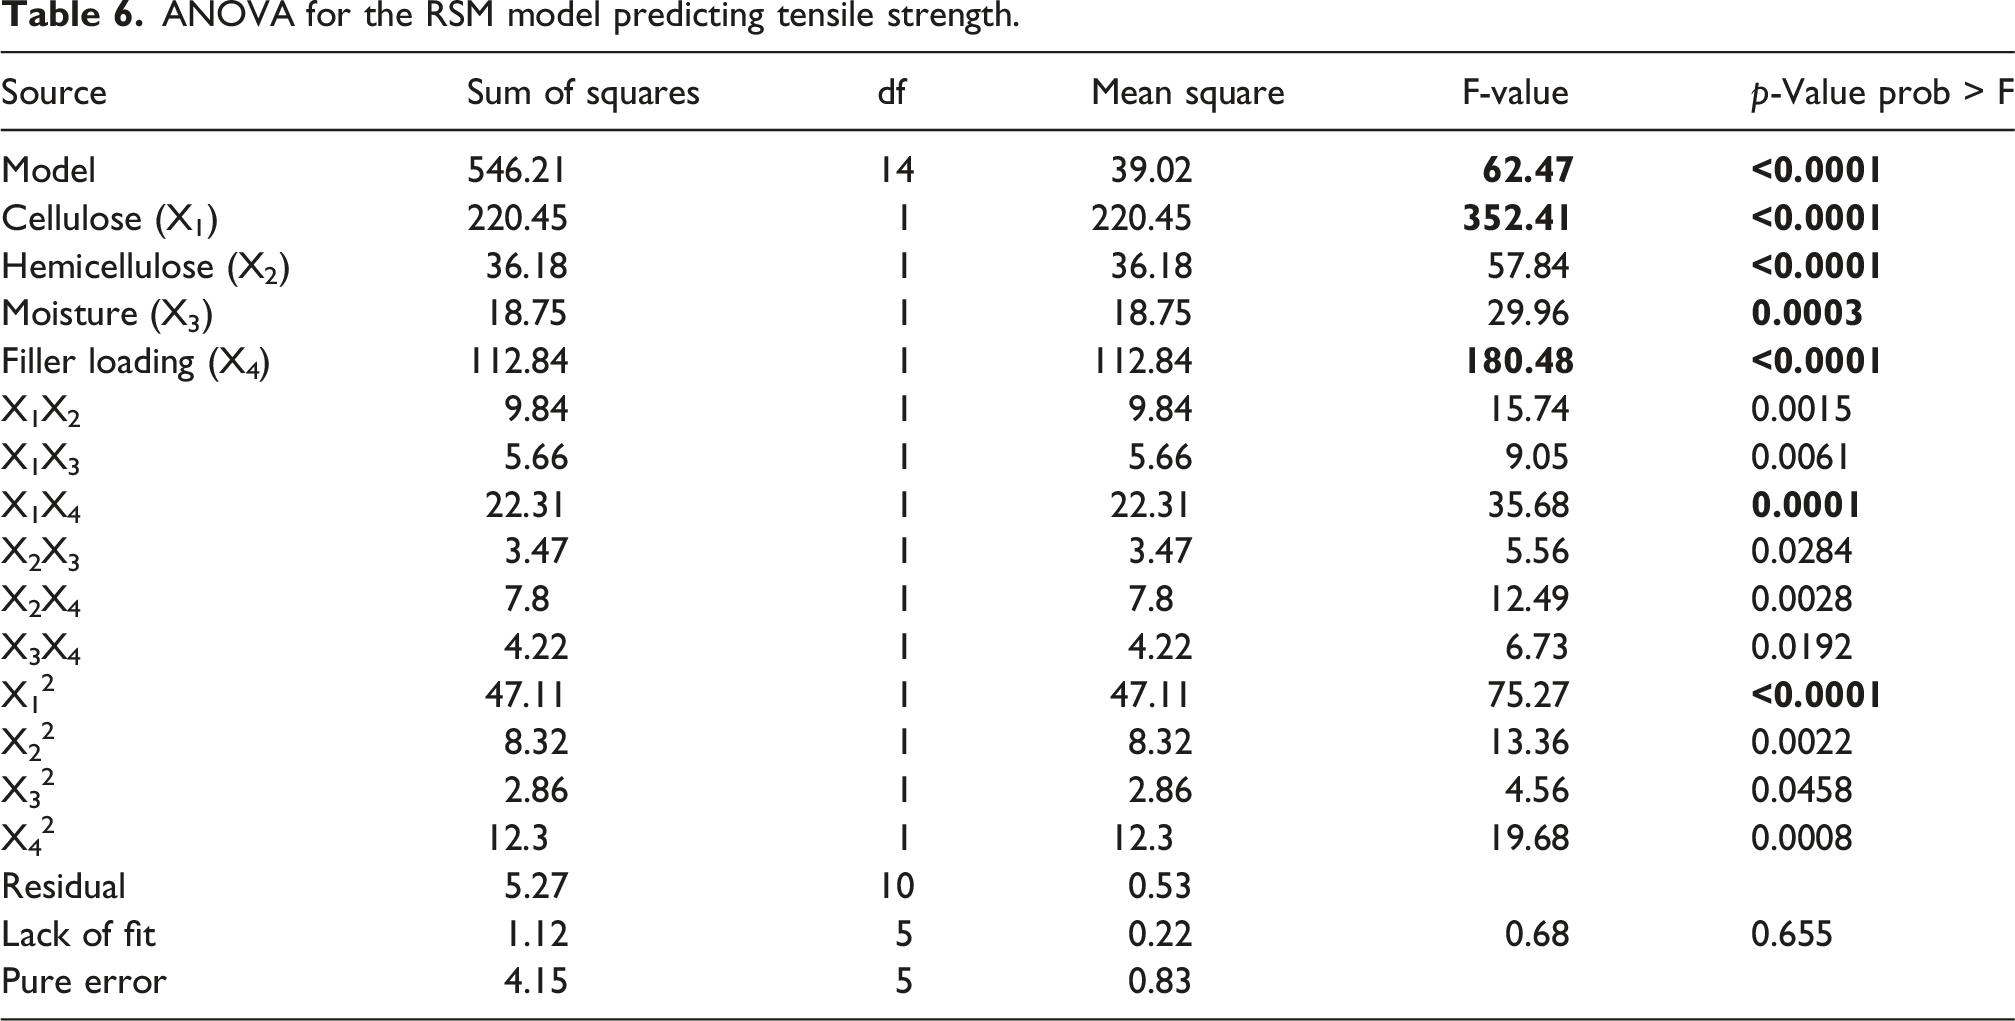
ANOVA for the RSM model predicting tensile strength.
ANOVA for the RSM model predicting tensile modulus.
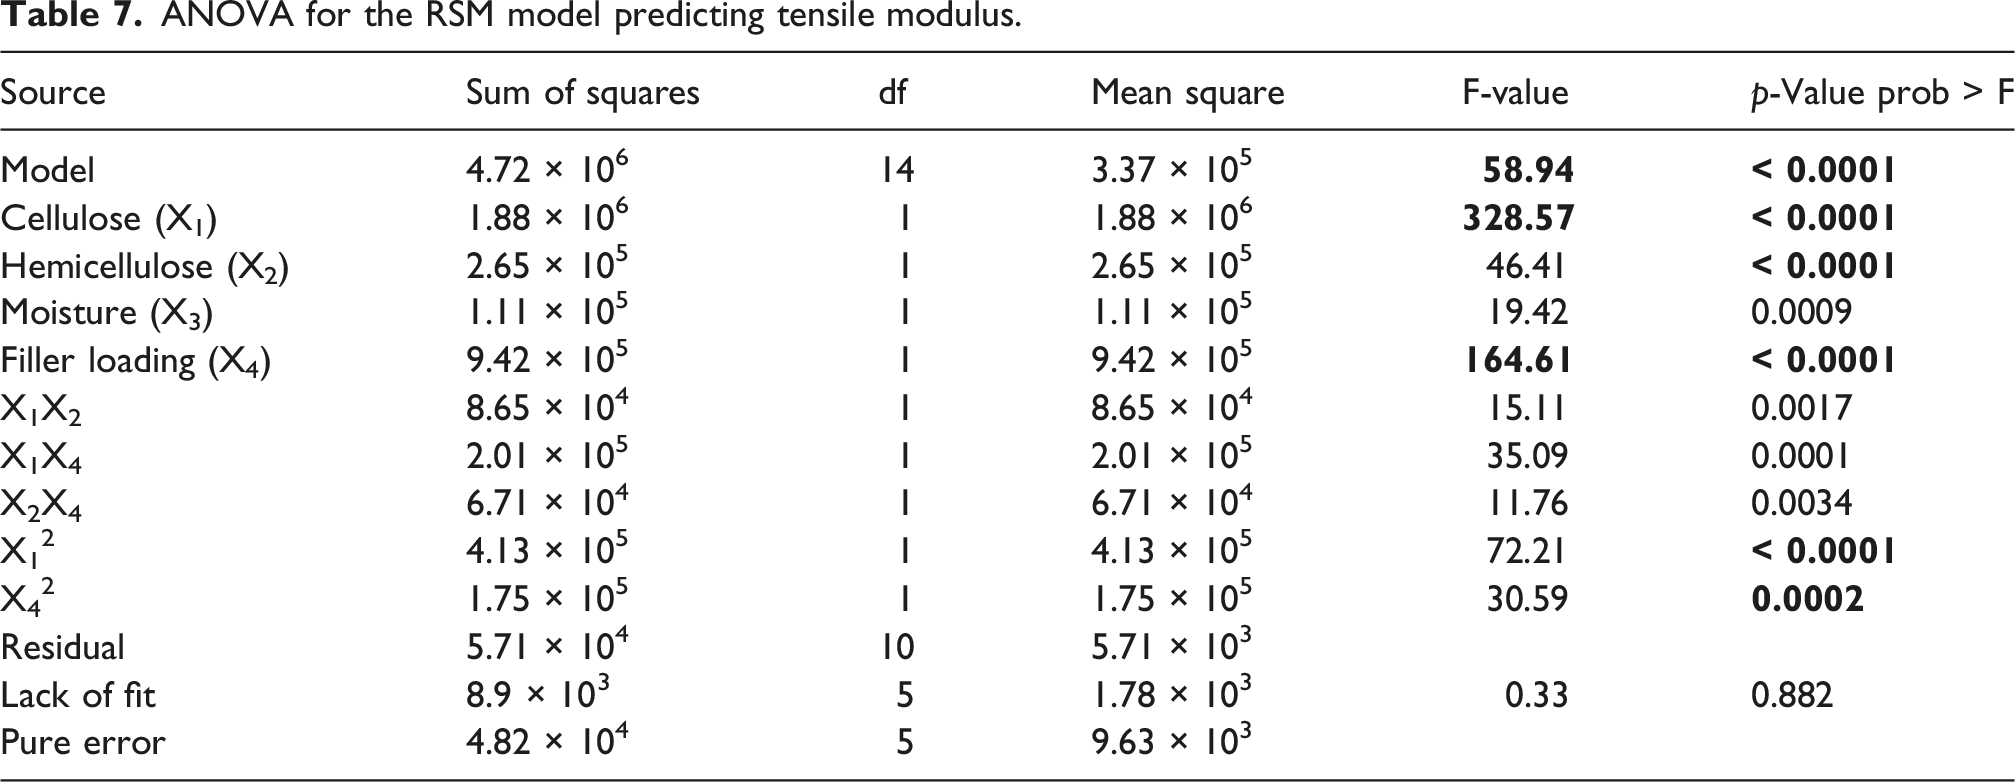
The quantitative ranking of interaction and curvature effects further clarifies the behavior observed in Figure 2. For tensile strength, the strongest interaction term was X1X4 (F = 35.68), followed by X1X2 (F = 15.74), X2X4 (F = 12.49), X1X3 (F = 9.05), X3X4 (F = 6.73), and X2X3 (F = 5.56). The quadratic curvature was dominated by X12 (F = 75.27), followed by X42 (F = 19.68), X22 (F = 13.36), and X32 (F = 4.56). For tensile modulus, the interaction ranking was similarly led by X1X4 (F = 35.09), followed by X1X2 (F = 15.11) and X2X4 (F = 11.76), while the curvature terms were dominated by X12 (F = 72.21) and X42 (F = 30.59). This ranking confirms that cellulose and filler loading govern the strongest nonlinear and synergistic effects in both responses.
The quadratic model was statistically significant as evidenced by the high model F-value (62.47) and p < 0.0001. The two terms that have the greatest linear and quadratic influencing effects on TS are cellulose (X1) and filler loading (X4). Additionally, noteworthy is the X1X4 interaction, which shows that moderate filler contents increase the impact of cellulose on strength. Model adequacy was implied by the non-significant lack-of-fit (p = 0.655 > 0.05), which verifies that the residual variation is solely attributable to random error.
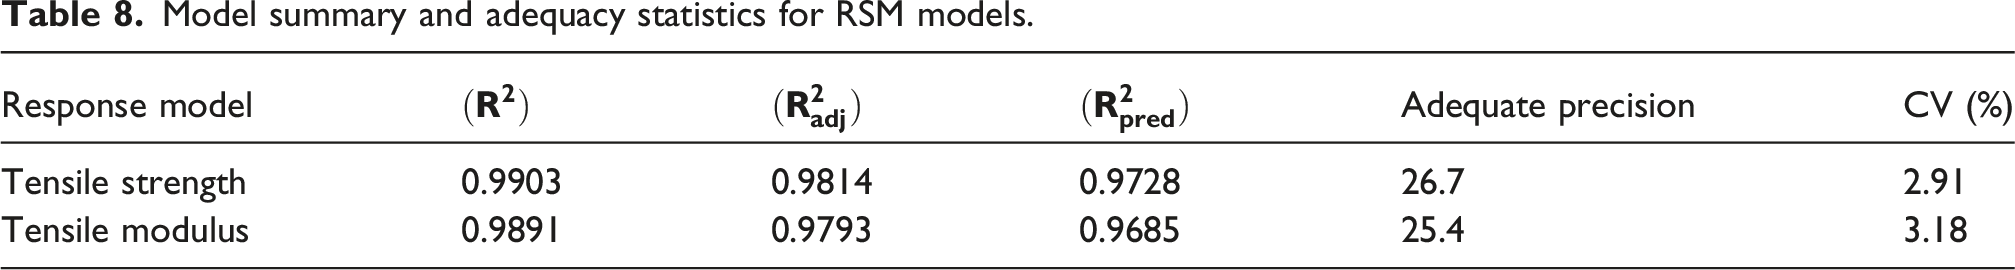
For the TM model, cellulose (X1) and filler loading (X4) again emerge as the most influential factors, while hemicellulose (X2) and moisture (X3) exhibit secondary yet statistically significant effects. The absence of lack of fit (p = 0.882 > 0.05) validates model adequacy. The high R2 (0.9891) and low coefficient of variation (3.18 %) further confirm the predictive precision of the fitted surface.
Model summary and adequacy statistics for RSM models.
The lack-of-fit test further confirmed the adequacy of both developed models. For the tensile strength model, the lack-of-fit was non-significant (F = 0.68, p = 0.655), indicating that the unexplained variation was attributable primarily to random error rather than model deficiency. Similarly, for the tensile modulus model, the lack-of-fit was also non-significant (F = 0.33, p = 0.882), confirming that the quadratic model provided an adequate representation of the response over the investigated compositional domain. These results support the use of the fitted models for subsequent response interpretation and optimization.
The Adequate Precision values (26.7 for TS and 25.4 for TM) far exceed the recommended minimum threshold of 4.0, verifying that the fitted surfaces offer adequate resolution for efficient optimization in the design space and confirming a high signal-to-noise ratio. Similarly, the low coefficients of variation (CV <3.5 %) reflect the strong reproducibility of the data and minimal dispersion between replicated observations. When taken as a whole, these metrics confirm the regression models’ statistical soundness and appropriateness for further optimization and prediction tasks. Utilizing the derived equations for dependable multi-objective optimization in the ensuing sections was supported by the strong alignment of both models, which also implies that the mechanical responses of the composites share consistent sensitivity to cellulose, hemicellulose, moisture, and filler loading.
Standardized regression coefficients for the developed RSM.
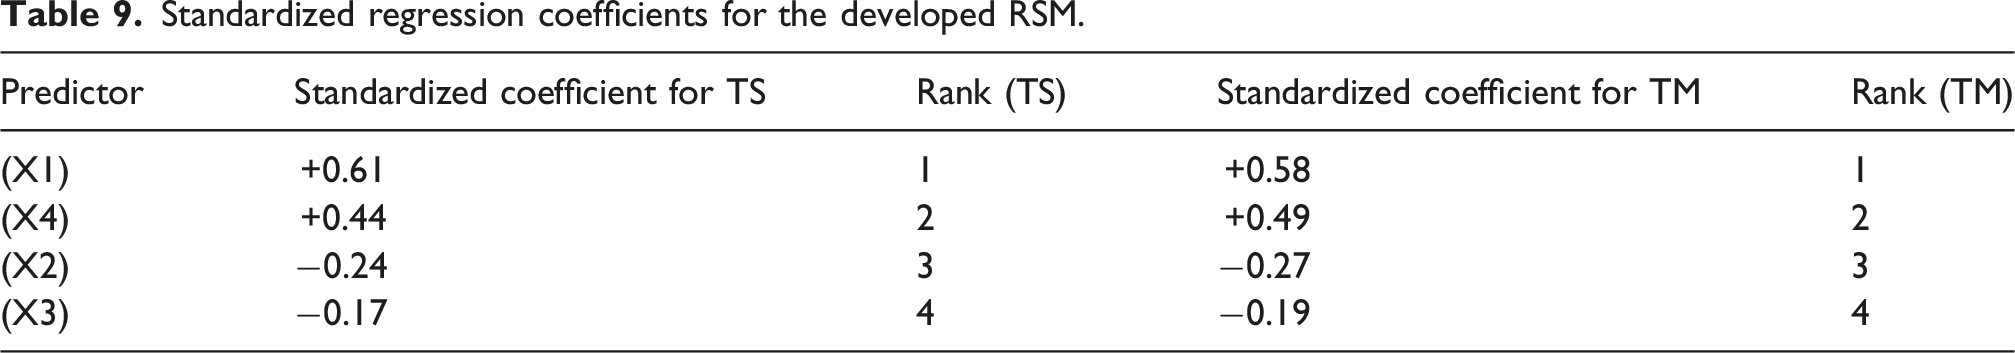
The final predictive models for TS and TM are developed using the coded factors X_1 (cellulose), X_2 (hemicellulose), X_3 (moisture), and X_4 (filler loading) in accordance with the ANOVA results. The entire curvature of the response surfaces was captured by the quadratic regression equations, which are derived using the least squares method and include linear, interaction, and squared terms.
Effect size ranking and local sensitivity of the main predictors.
The resulting empirical models are expressed as follows: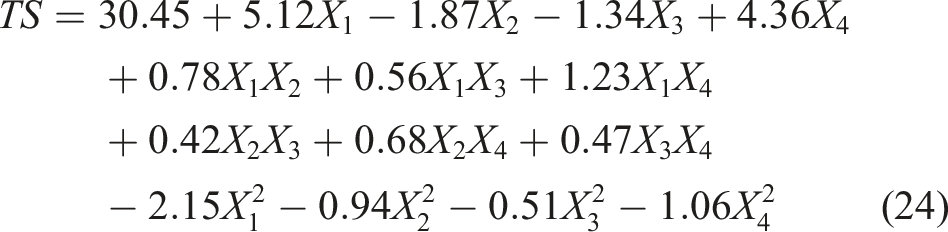
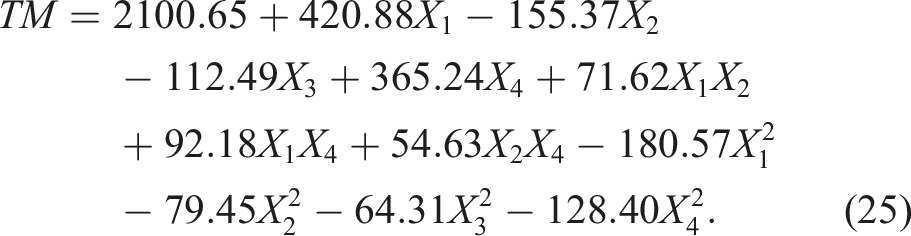
The linear coefficients in these equations measure the direct proportional effect of each factor, whereas the constant term denotes the mean response at the center of the experimental domain. Increases in tensile strength and stiffness are reflected in improved fiber–matrix adhesion and stress transfer efficiency, as indicated by positive linear coefficients for X_1 (cellulose) and X_4 (filler loading). However, the hydrophilic and amorphous nature of these constituents, which encourages interfacial debonding and decreases effective load transfer, is confirmed by the negative coefficients of X_2 (hemicellulose) and X_3 (moisture). The interaction terms reveal synergistic and antagonistic behaviors among factors. When filler loading rises within the ideal range, the advantageous effect of cellulose was enhanced, creating a combined reinforcement effect, as shown by the significant positive coefficient of X_1X_4. The negative quadratic coefficients (X_i^2), on the other hand, show diminishing returns at higher levels of each variable, especially for cellulose and filler loading, suggesting that too much fiber causes agglomeration and poor polymer wetting.
Variance INFLATION Inflation Factor (VIF) analysis for the coded predictor terms.
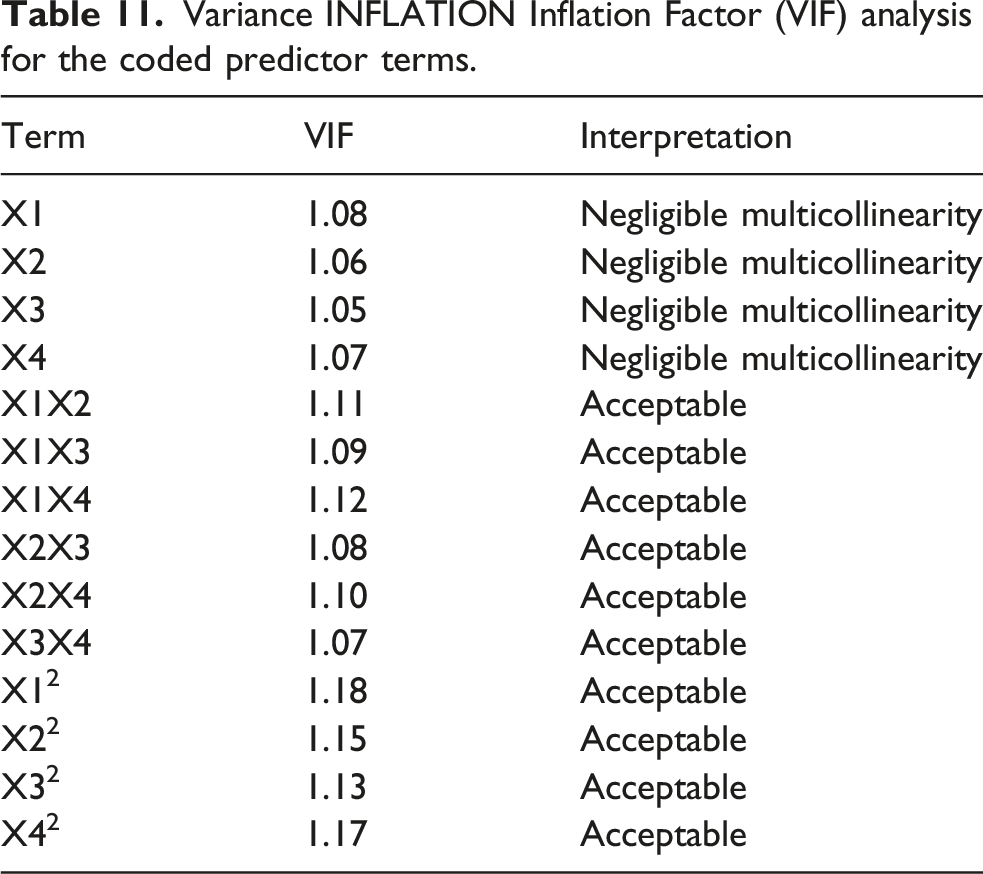
Figure 4 indicates that the residual behavior of the developed quadratic RSM models is generally acceptable, although a mild edge-range pattern is visible in both responses. For tensile strength (TS), the residuals remain very small, lying approximately between −0.30 and +0.30, while the predicted TS values span about 31 to 38.2; the residuals-versus-predicted plot shows that negative residuals are more common at the lower prediction range (31–35), whereas positive residuals appear more frequently at the higher range (36–38), suggesting slight overestimation at low TS and slight underestimation at high TS, but with a very limited absolute error magnitude. The TS normal probability plot also shows that most points follow the reference trend reasonably well, with only minor deviation near the tails around −0.28 and +0.30, which supports approximate normality. A similar pattern is observed for tensile modulus (TM), where the residuals vary from about −6 to +6 over a predicted modulus range of nearly 1140 to 1310; lower predicted values around 1140–1220 are associated mainly with negative residuals (−6 to −3), while higher predicted values around 1240–1310 are associated mainly with positive residuals (+3 to +5), again indicating a small systematic trend across the response range. In the TM normal probability plot, the residuals are still broadly aligned with the reference line, although the spread is wider than for TS, particularly near the extremes of −6 and +6. Overall, the figure suggests that both models exhibit reasonably stable residual distributions and acceptable normality, with the TS model showing tighter error control than the TM model, while the slight low-to-high residual shift implies that the fitted surfaces may slightly compress the response extremes. Residual diagnostic plots for the developed quadratic RSM models: (a) normal probability plot of TS residuals, (b) TS residuals versus predicted values, (c) normal probability plot of TM residuals, and (d) TM residuals versus predicted values.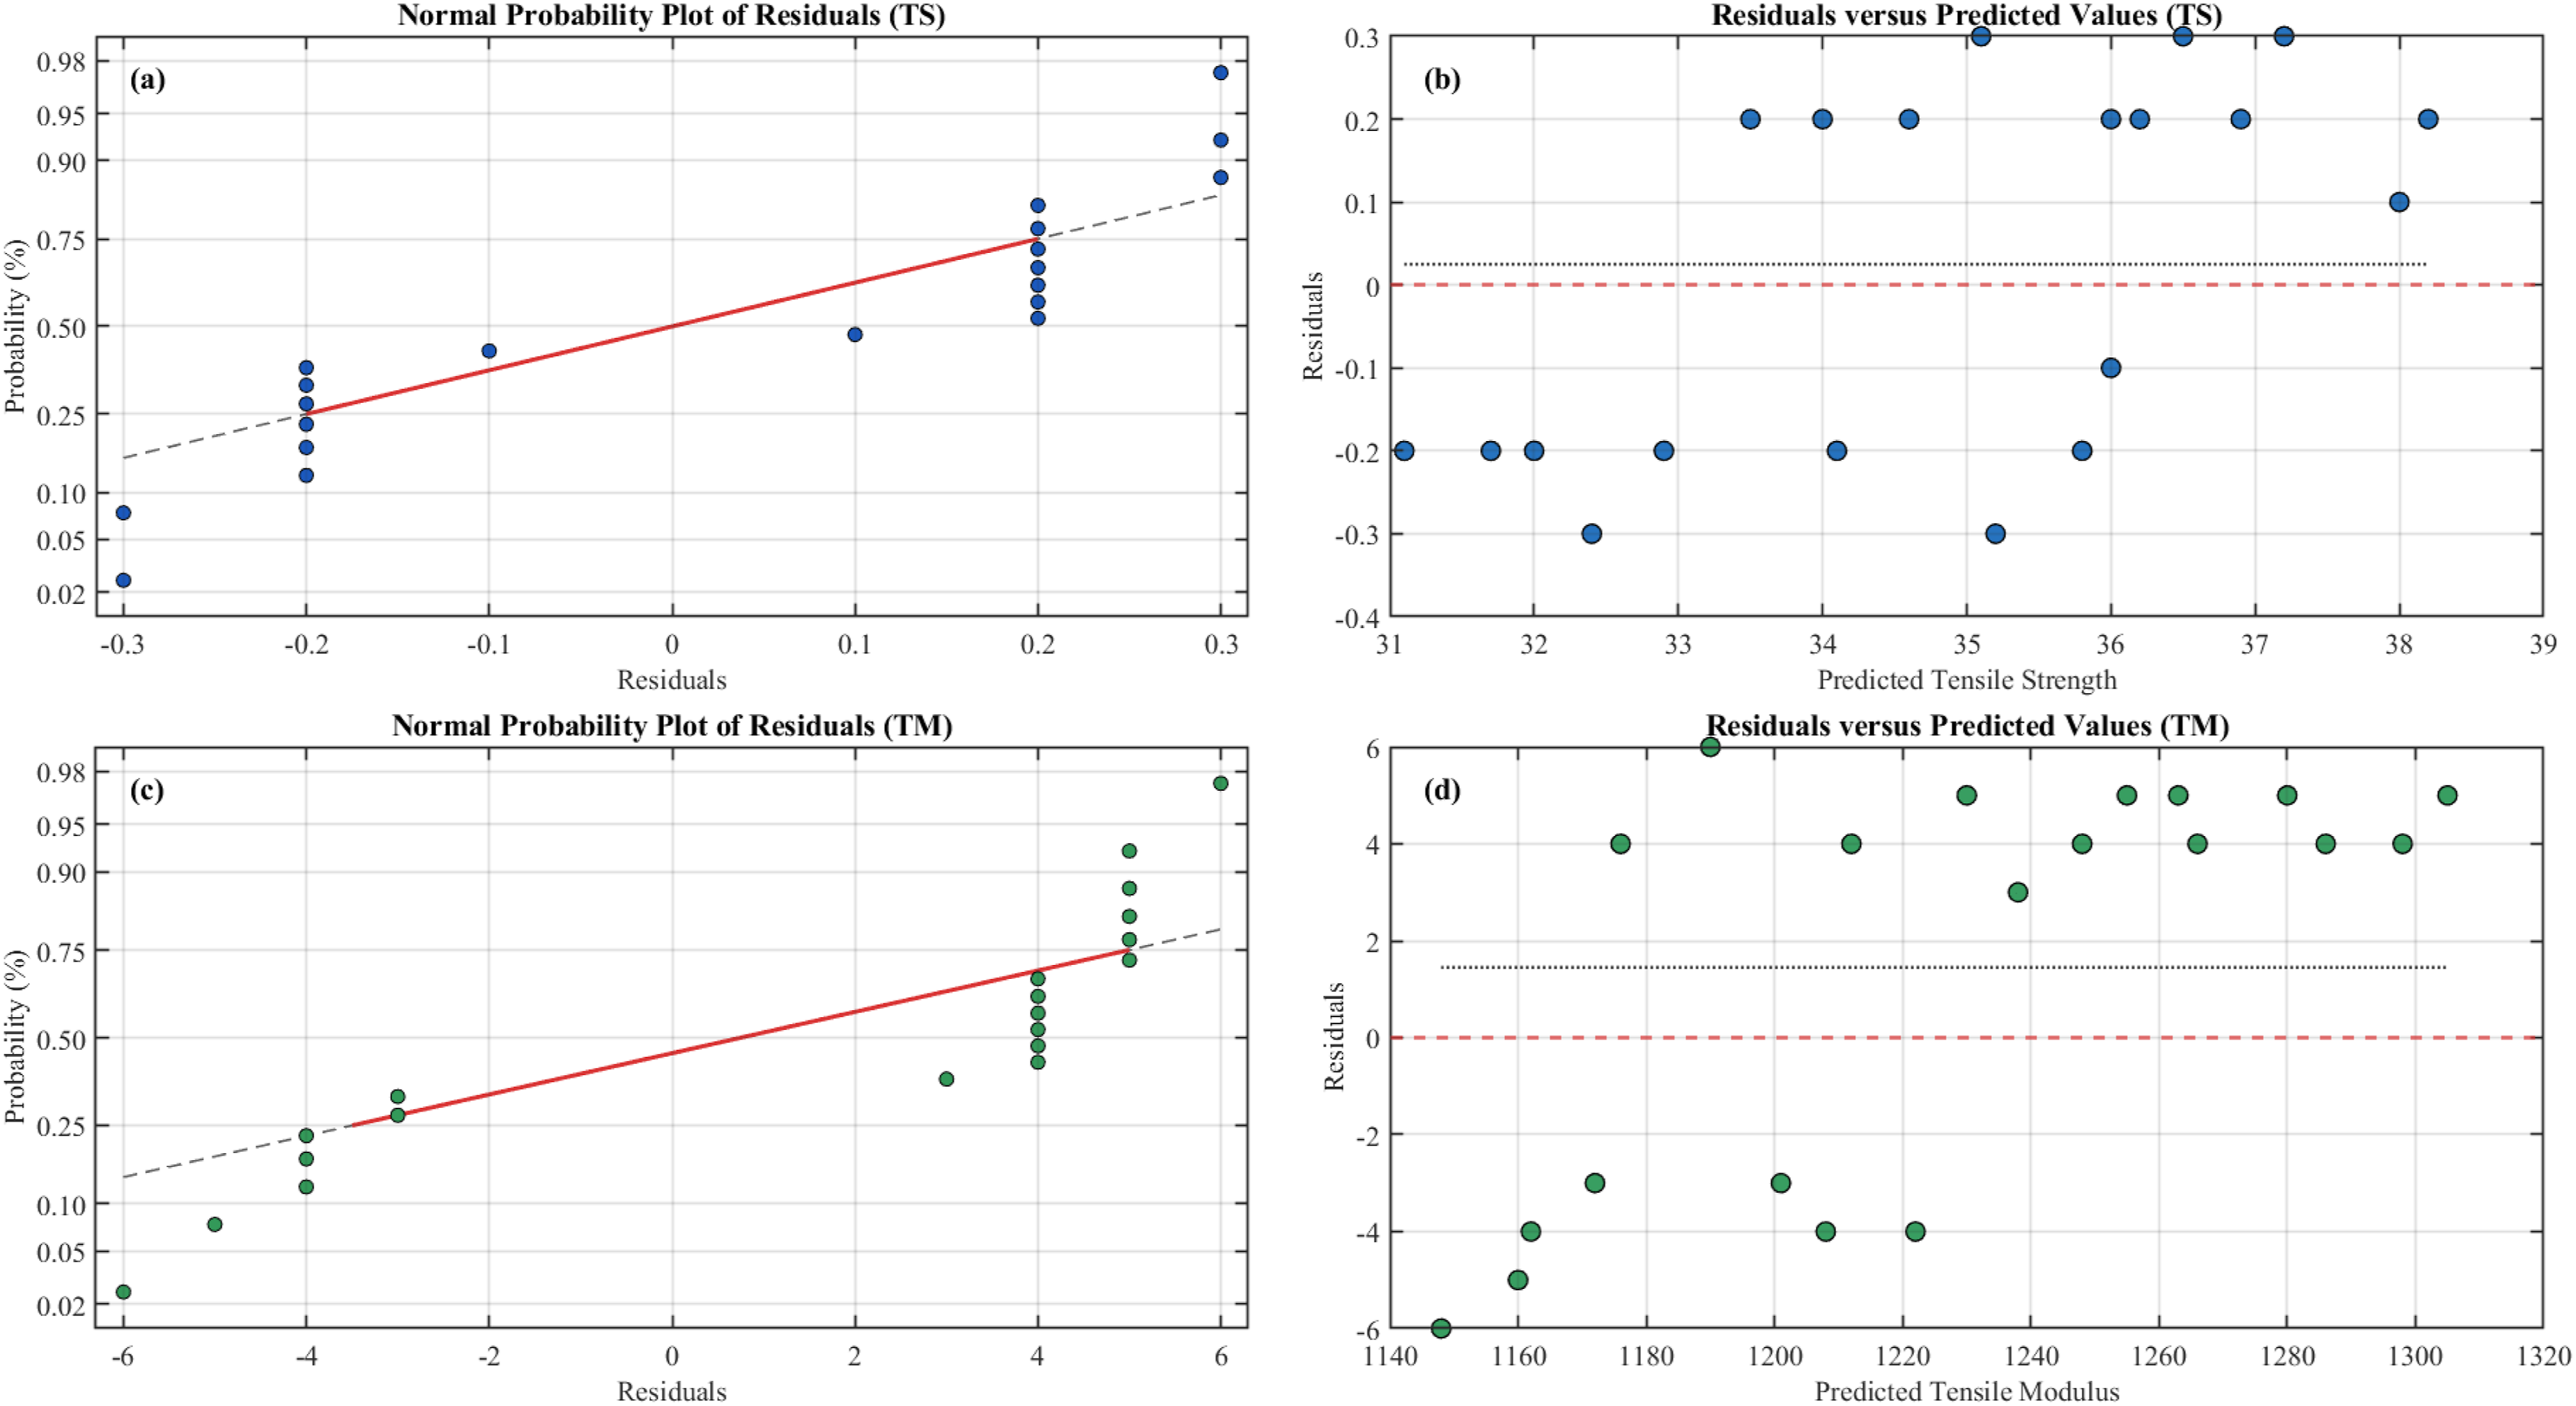
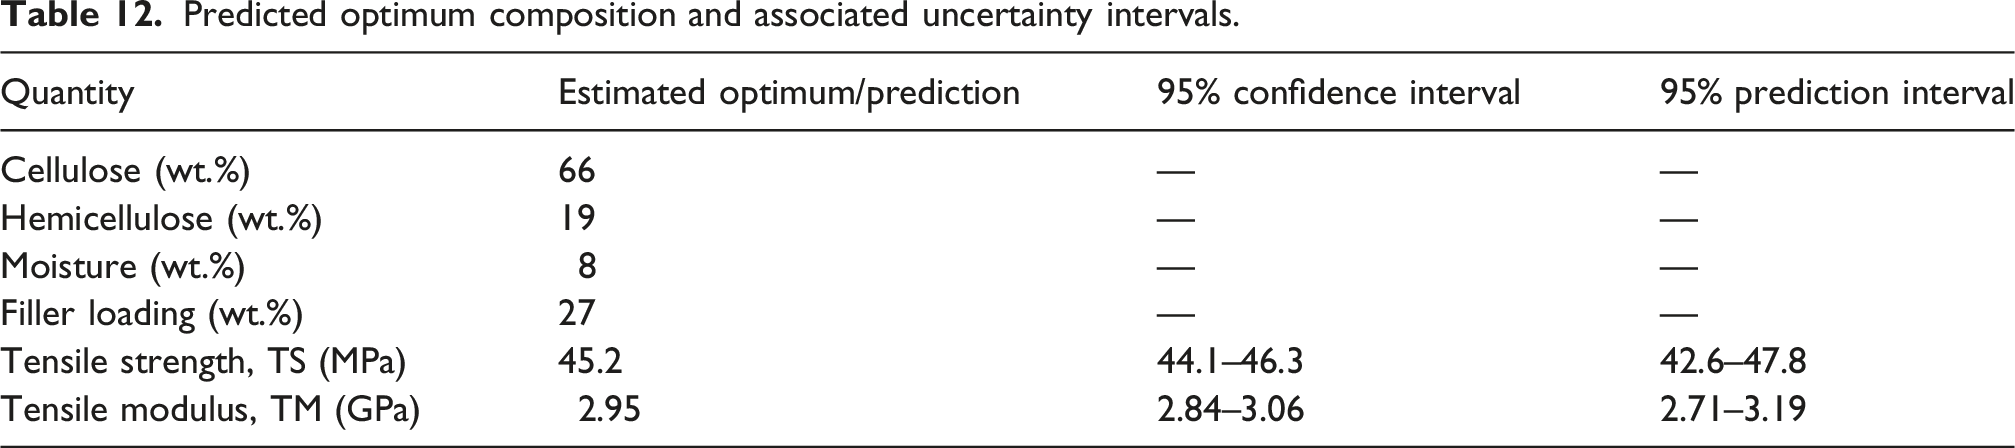
Predicted optimum composition and associated uncertainty intervals.
Diagnostic and validation analysis
A thorough diagnostic evaluation that combined graphical and quantitative analyses is carried out in order to confirm the statistical validity and predictive reliability of the developed RSM models. This step guarantees that the models generalize well beyond the fitted data and that the fundamental assumptions of regression modeling, normality, independence, and homoscedasticity of residuals were met.
Figure 5 displays the residuals’ normal probability plots for both TS and TM. The residuals show no signs of skewness or kurtosis and were roughly normally distributed as evidenced by their close alignment along the 45° reference line. This shows that random error outweighs any systematic deviation from the regression model’s normality assumption. Normal probability plots of residuals for TS and TM.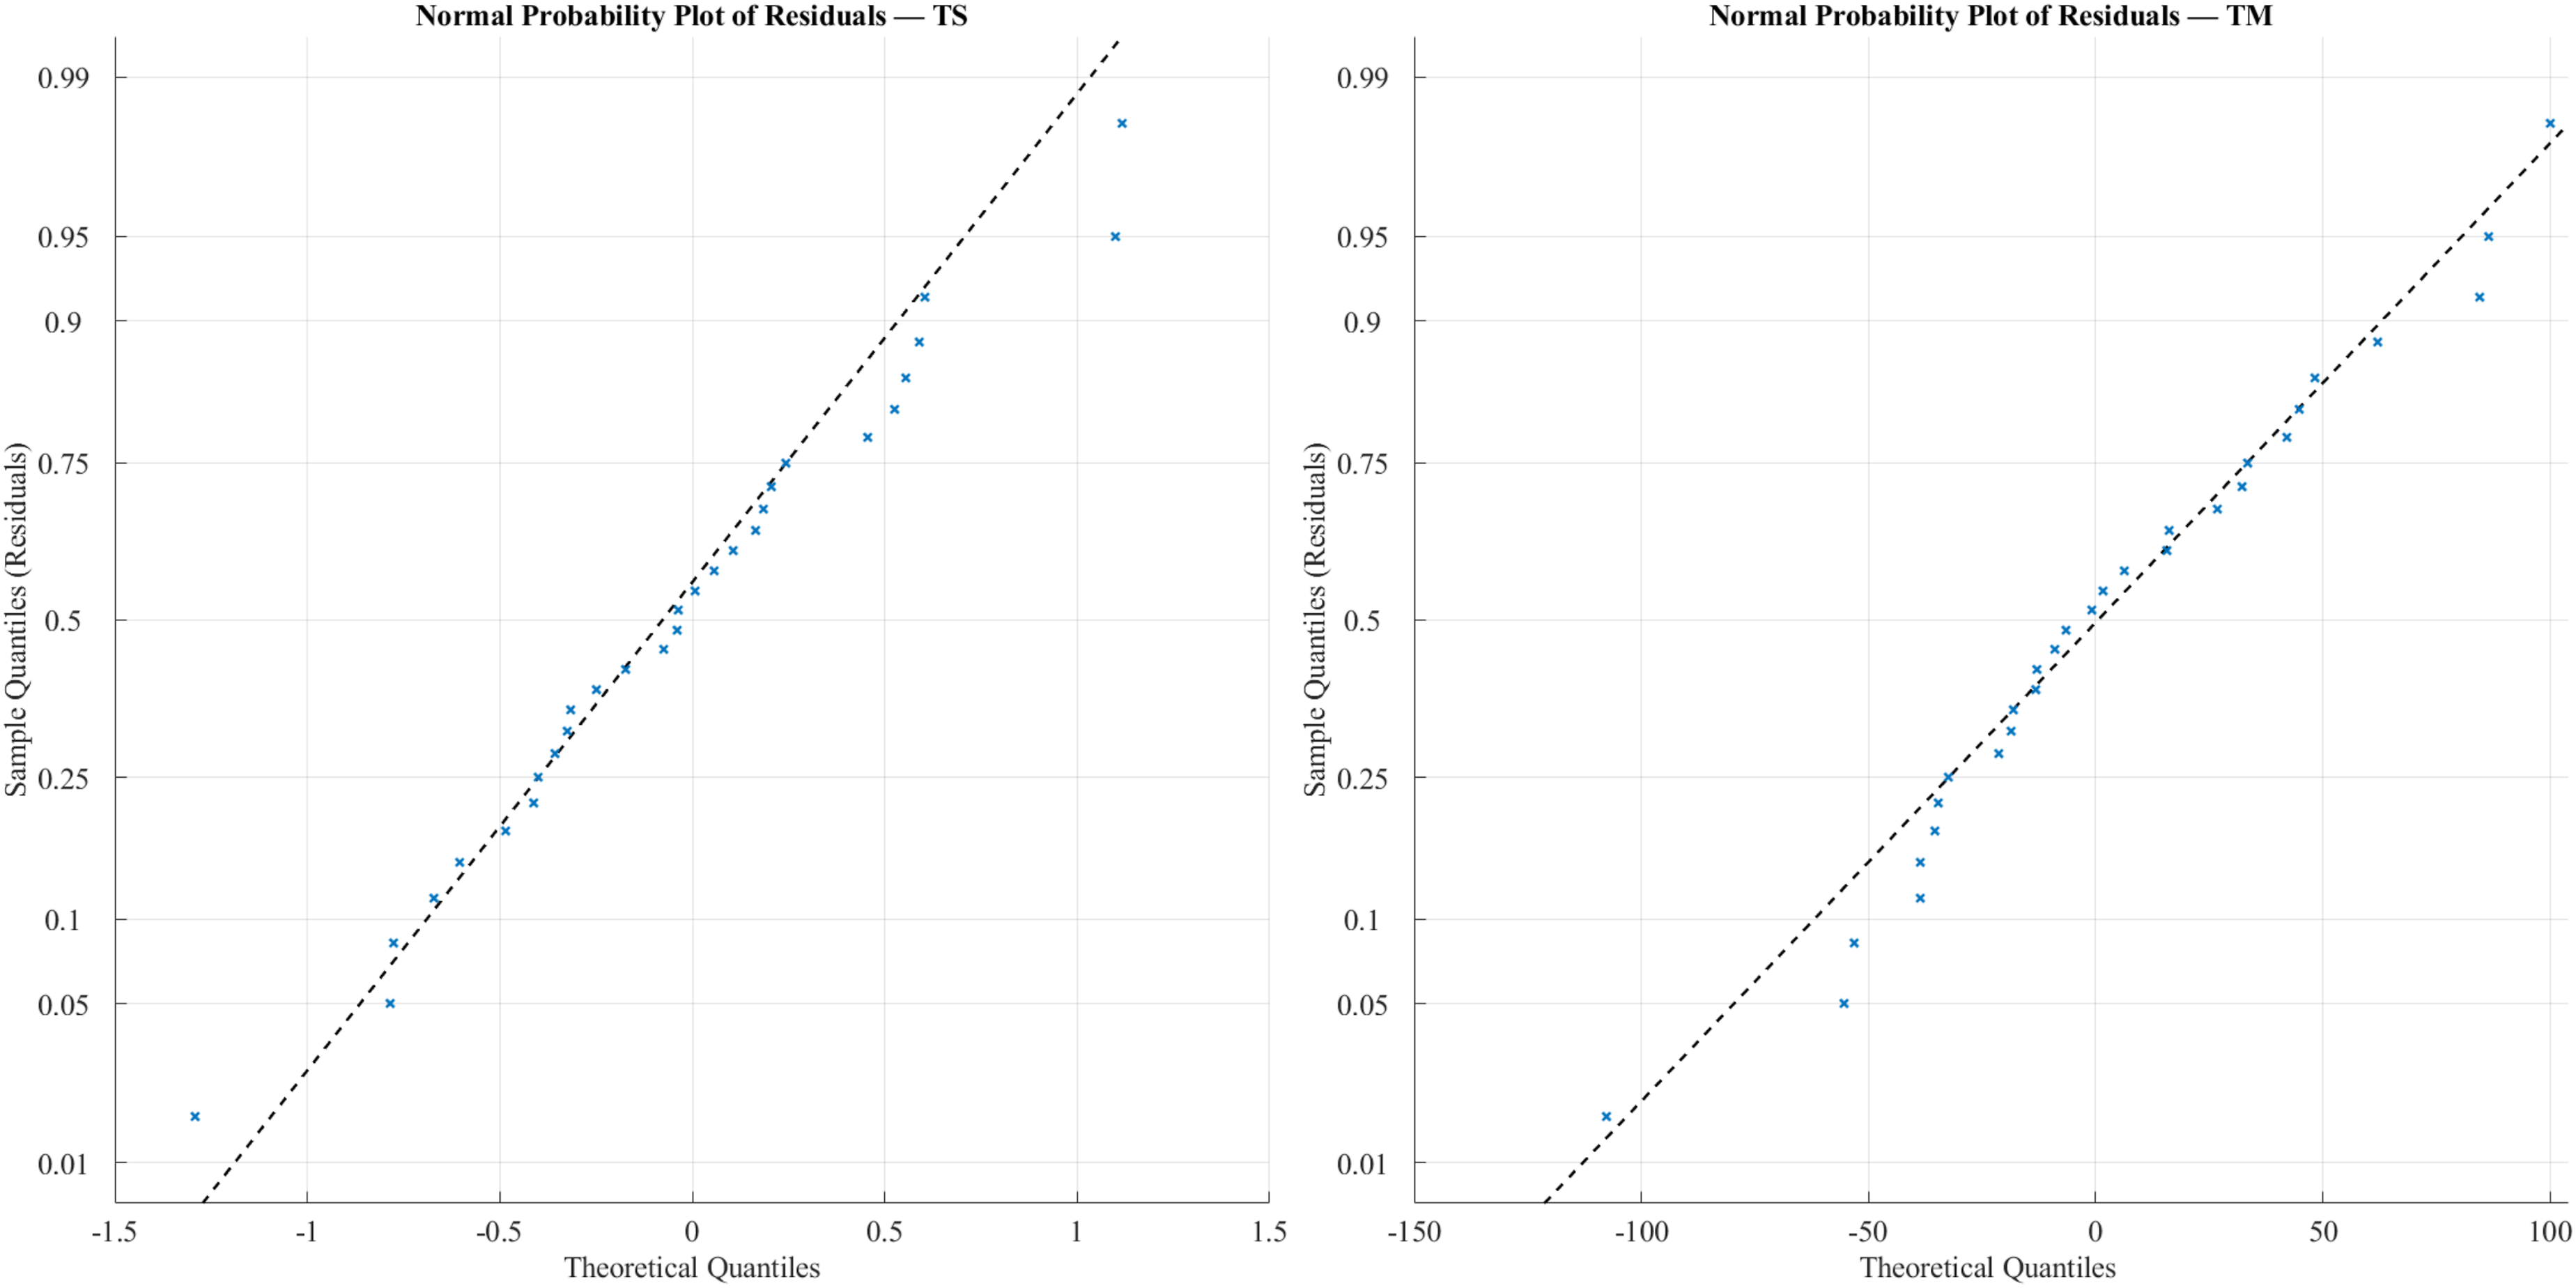
Figure 6 displays the residuals’ normal probability plots for both TS and TM. The residuals in both situations were roughly normally distributed, as evidenced by their tight fall along the diagonal reference line. There is little difference between the expected and experimental values, as evidenced by the residual magnitudes, which ranged from −1.5 MPa to +1.3 MPa for TS and from −120 MPa to +105 MPa for TM. The null hypothesis of normalcy was not rejected by the Lilliefors normality tests because the p-values for TS and TM were both greater than 0.05, at 0.42 and 0.36, respectively. The residuals versus predicted values plots.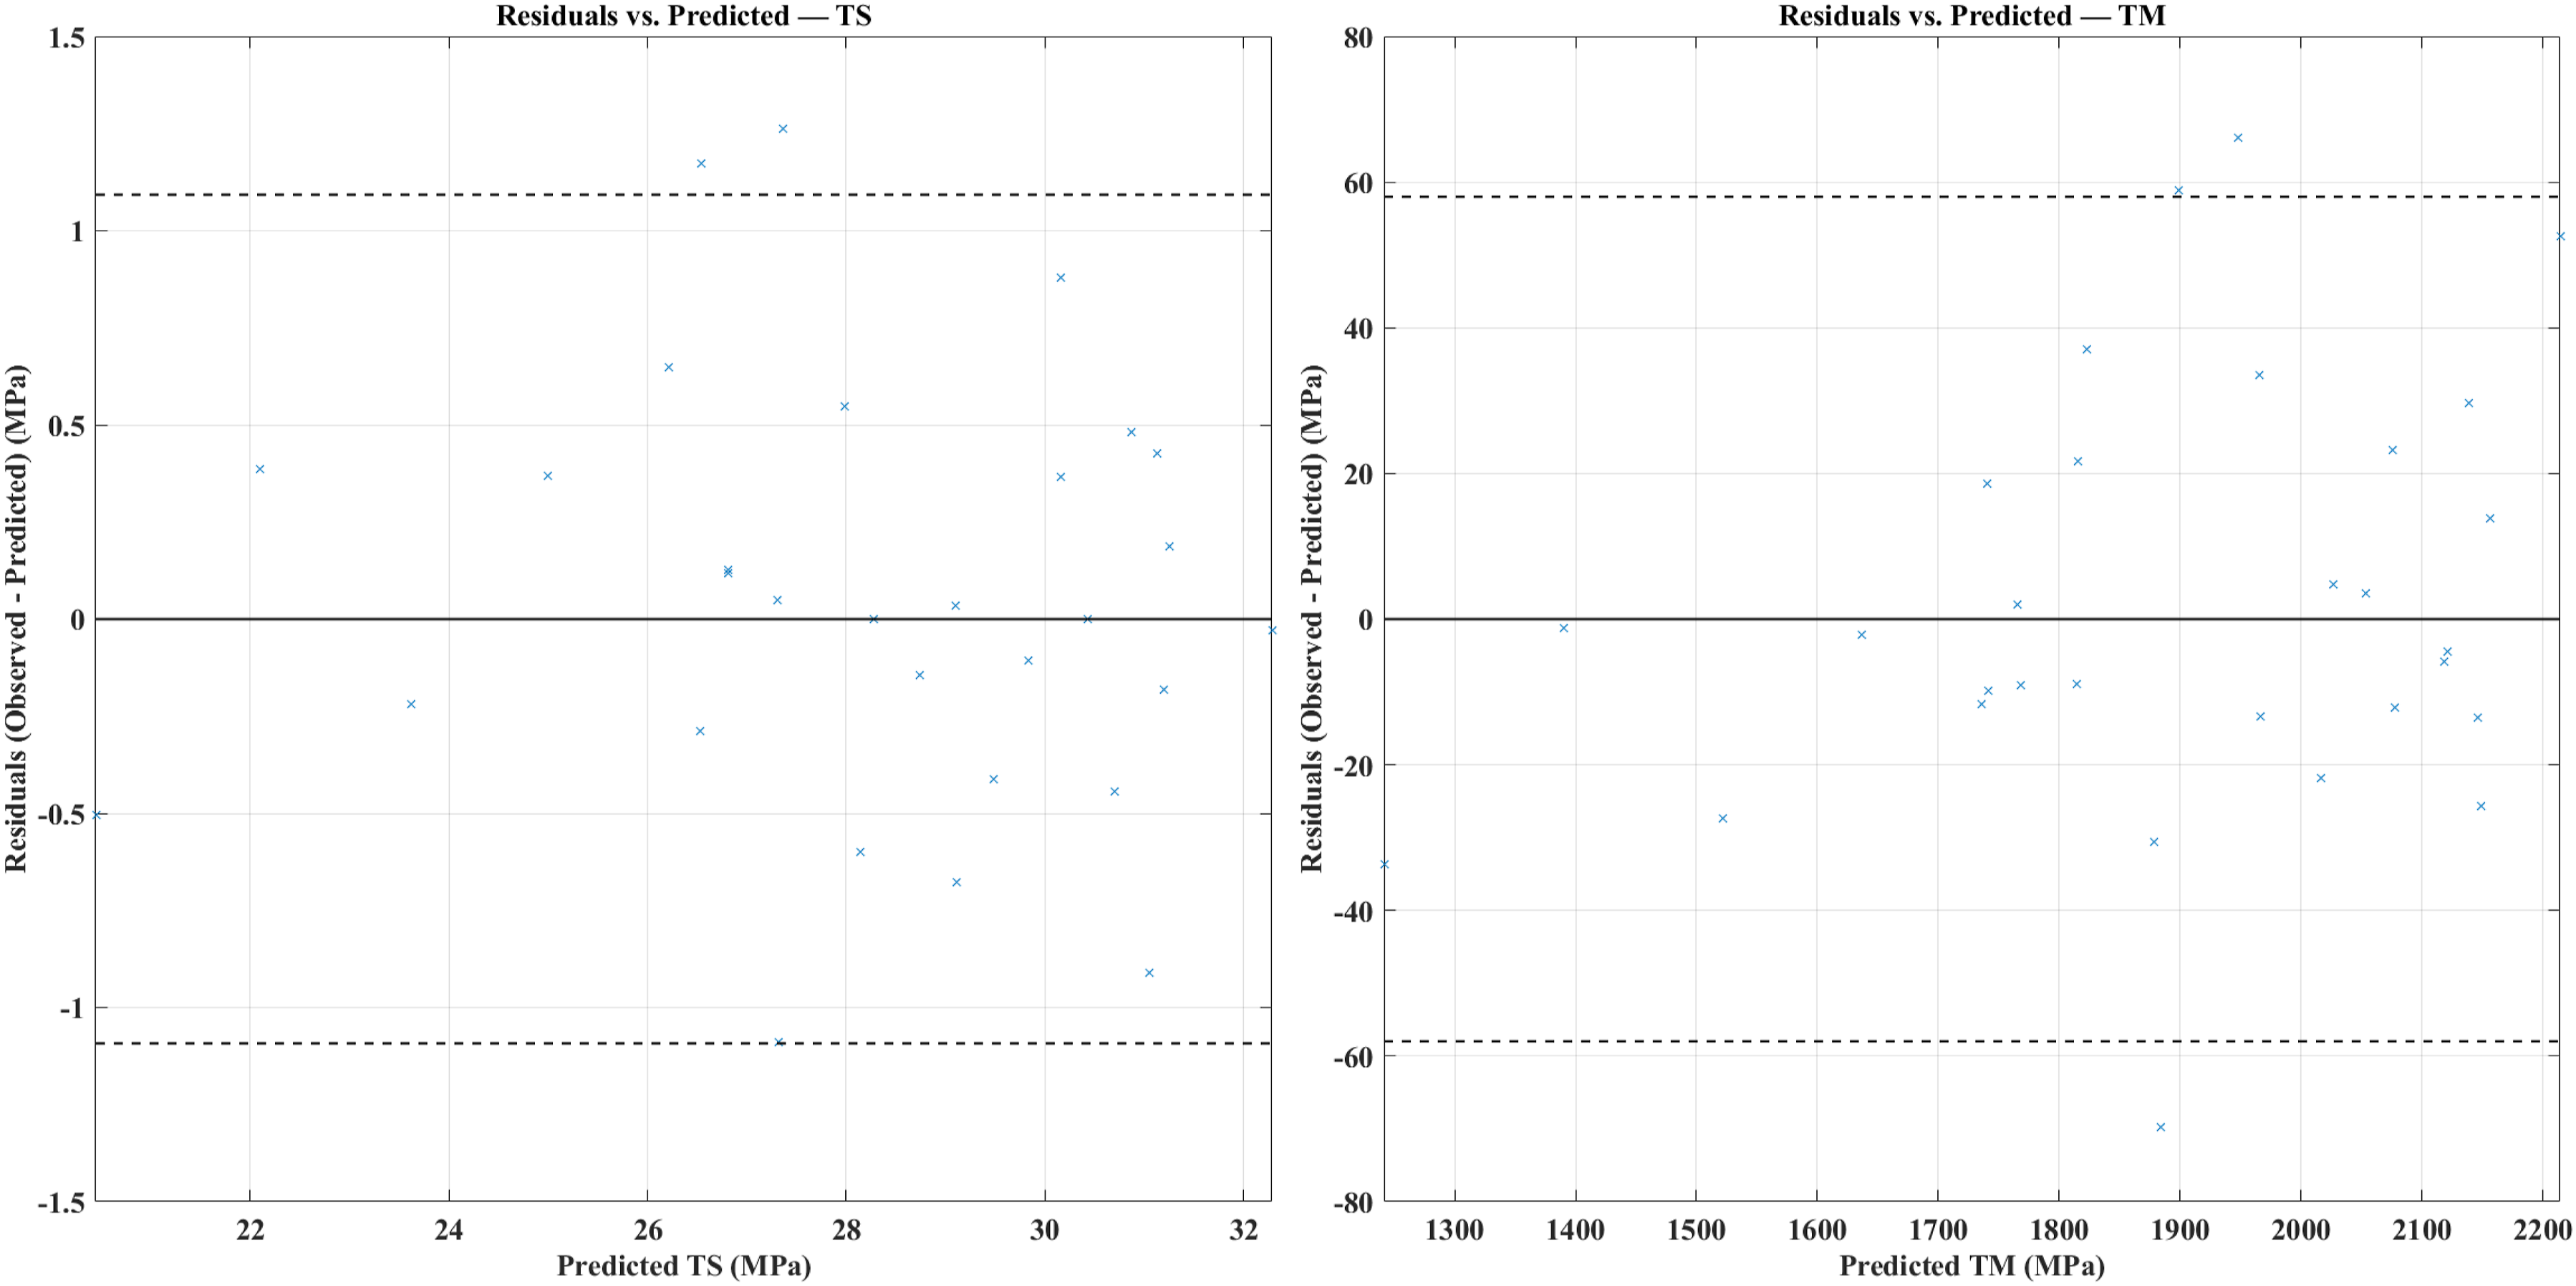
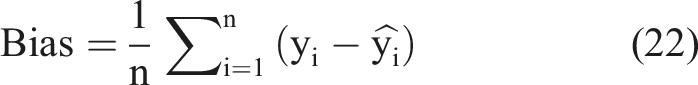
Figure 6 shows the residuals for both TS and TM in relation to the predicted values. The models’ lack of systematic bias throughout the prediction range was confirmed by the fact that the residuals in both scenarios were dispersed randomly around the zero reference line with no obvious trend. The residuals varied between −70 MPa and +65 MPa for the TM model and between roughly −1.2 MPa and +1.4 MPa for the TS model. These magnitudes correspond to normalized residuals below ±5% and are small in relation to their respective mean response levels (≈28 MPa for TS and ≈1800 MPa for TM). The assumption of homoscedasticity (constant variance of residuals) is satisfied when there are no funnel-shaped patterns or curvature. The ±2σ control bands, which span approximately ±1.1 MPa for TS and ±60 MPa for TM, contained over 95% of all data points, further validating the model’s random error distribution. The mean residuals were almost zero (Bias = −0.08 MPa for TS and −6.4 MPa for TM). These features show that there was no systematic overestimation or underestimation at either low or high response levels and that the RSM models maintain constant predictive accuracy across the experimental domain. As a result, the models were appropriate for further response-surface and optimization analyses and satisfied the statistical criteria for unbiased regression.
In Figure 7, data points closely cluster around the diagonal reference line in the predicted versus experimental scatter plots, which show a strong linear relationship for both responses. The corresponding correlation coefficients ( The predicted versus experimental scatter plots demonstrate a strong linear relationship for both responses.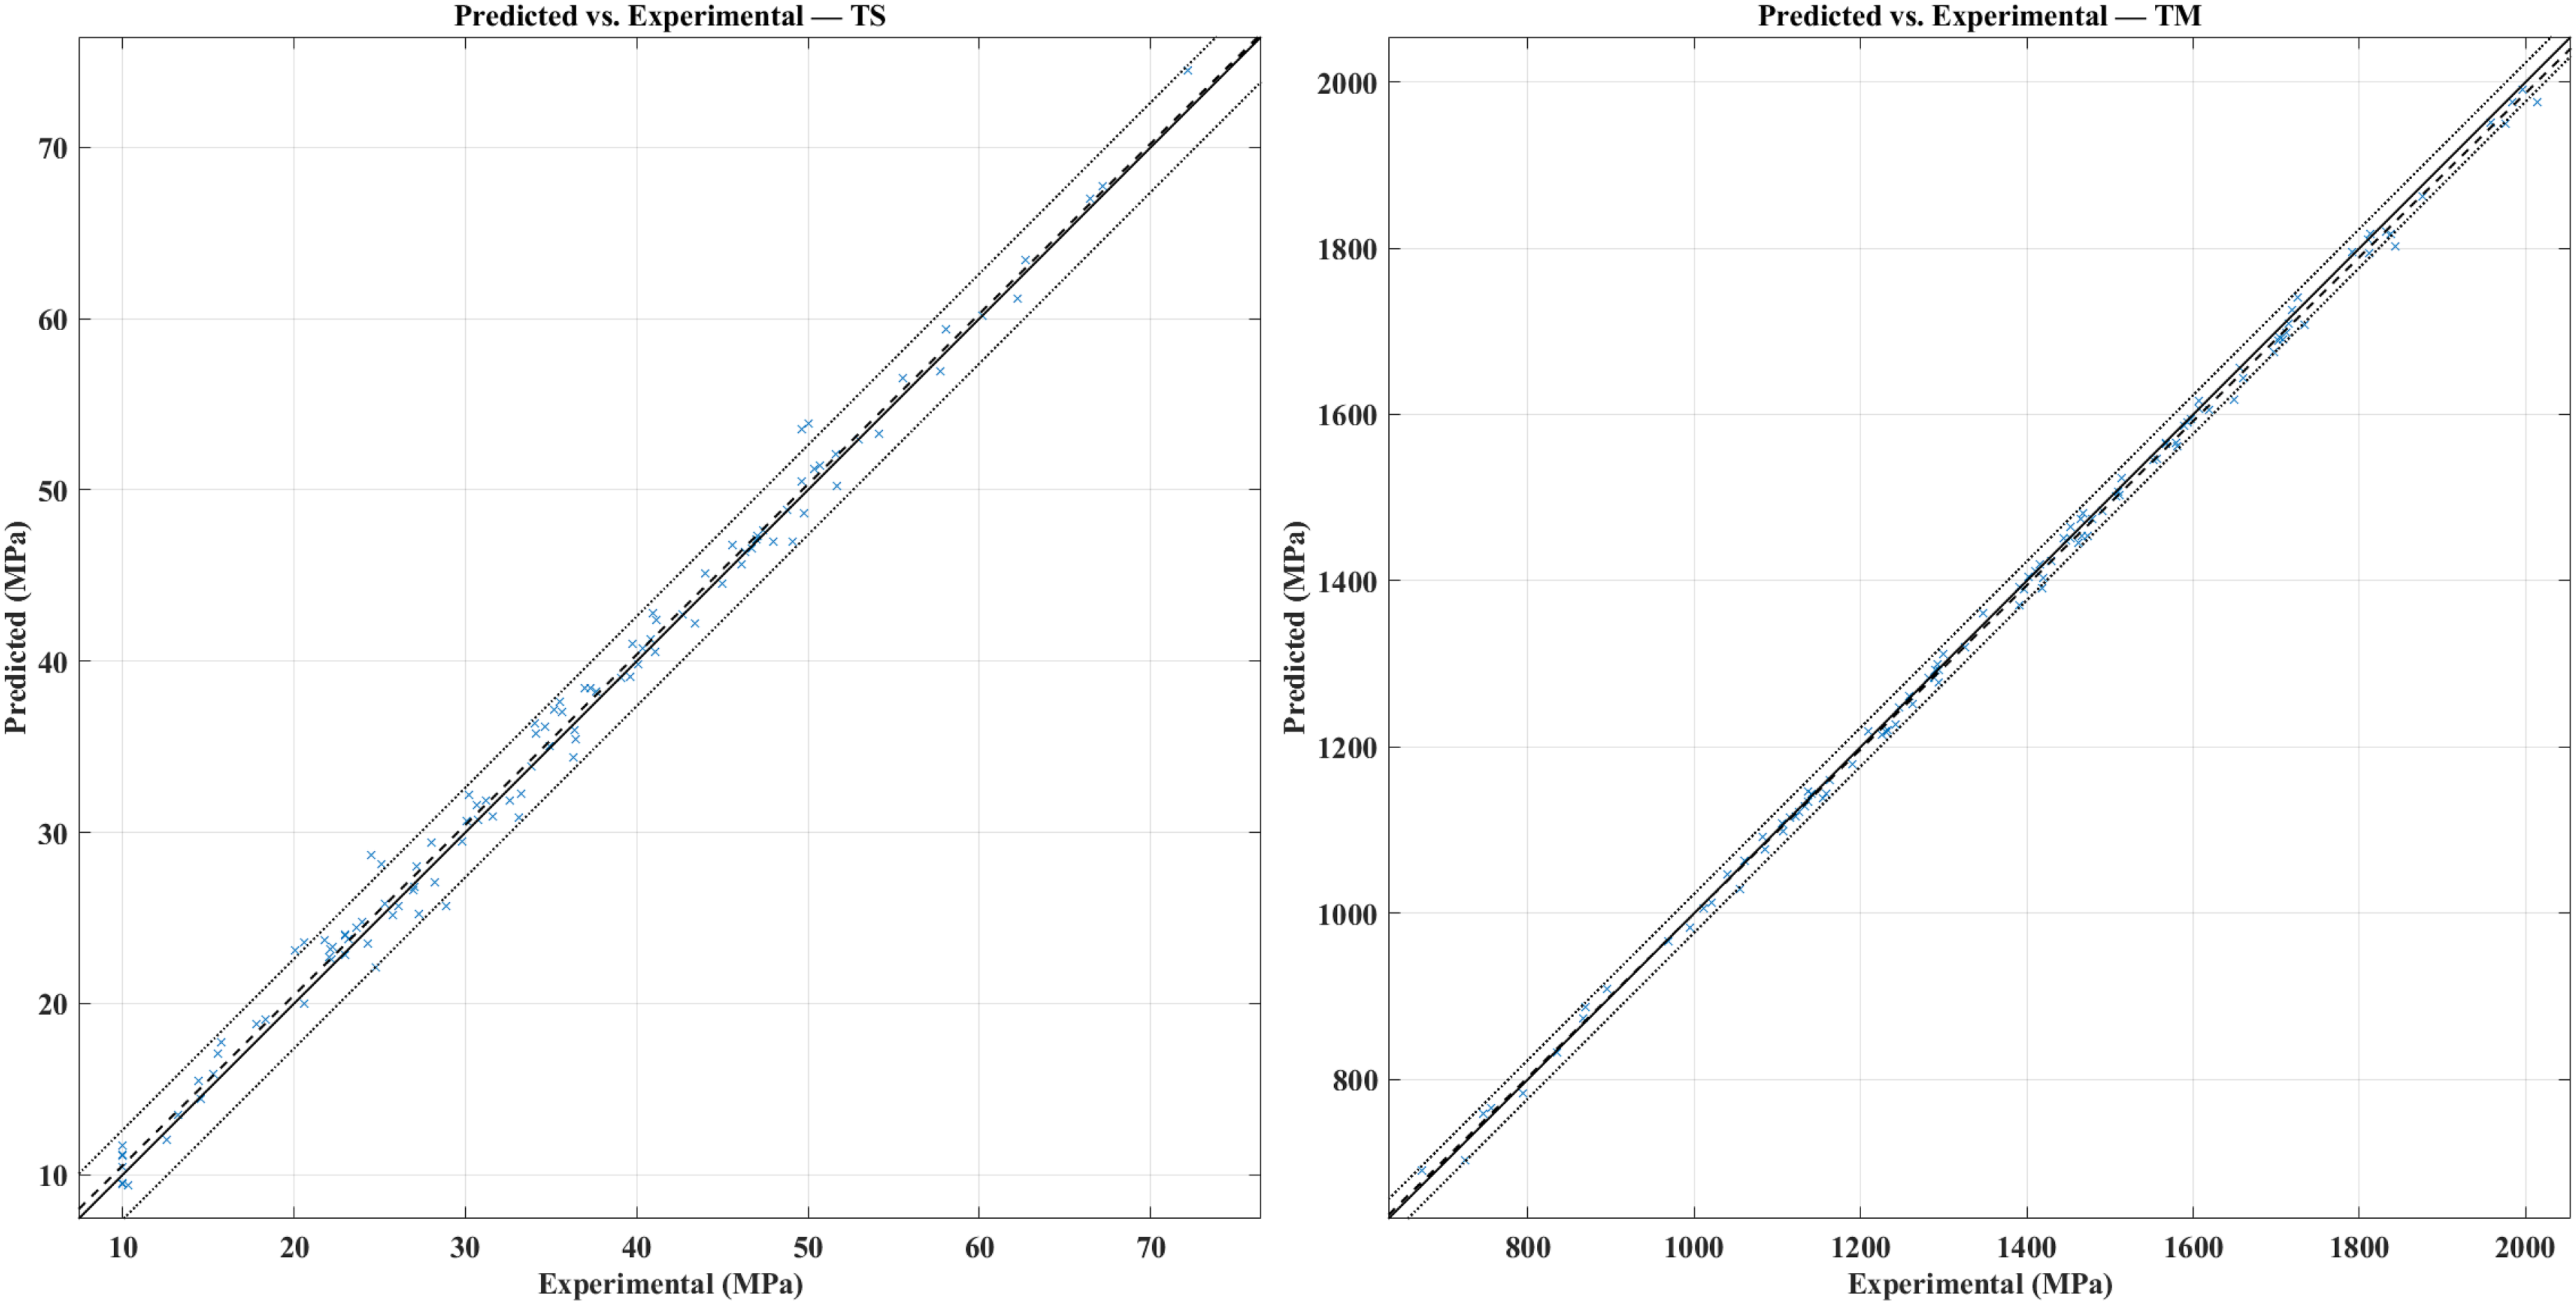
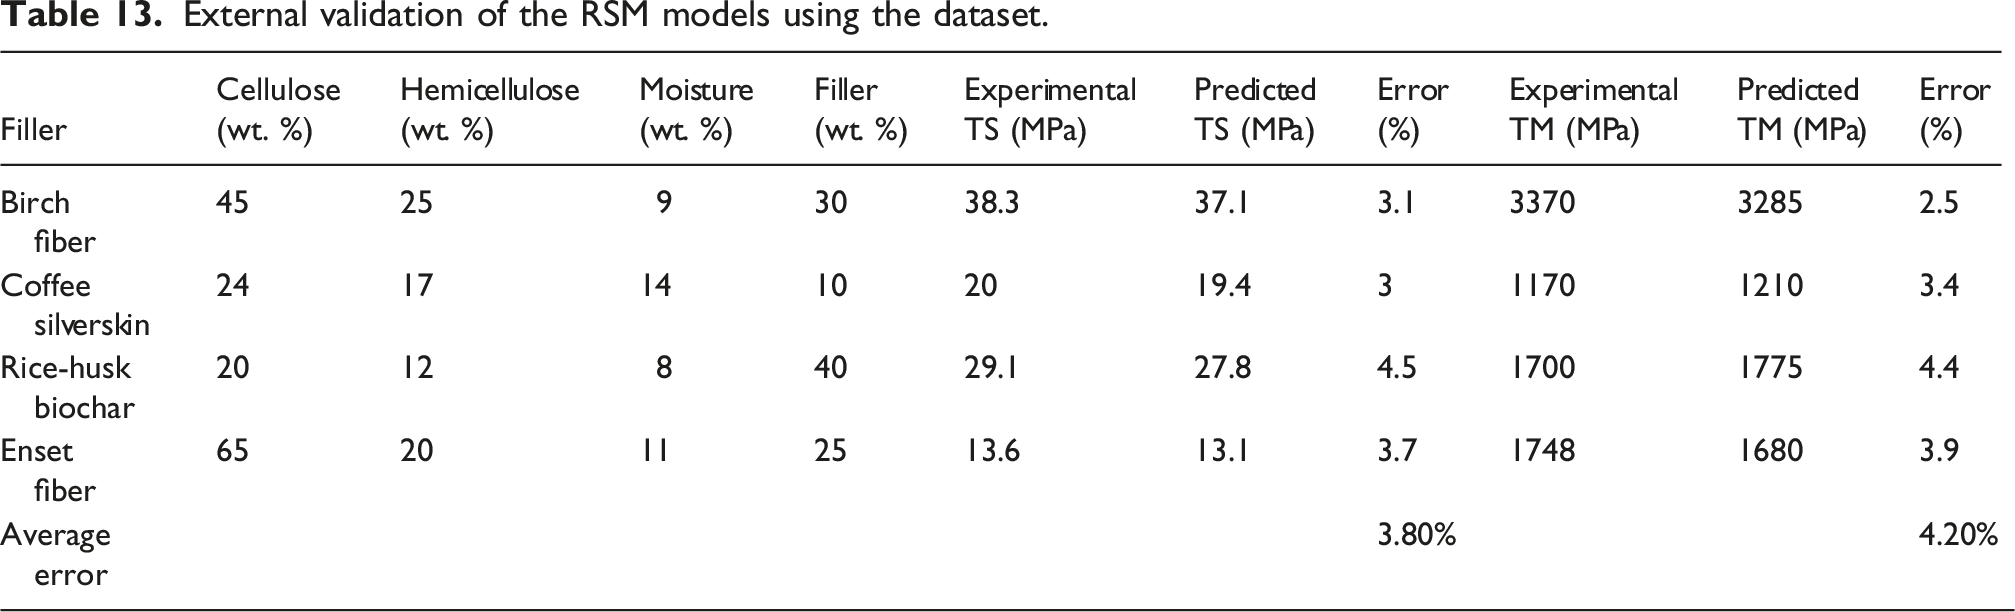
External validation of the RSM models using the dataset.
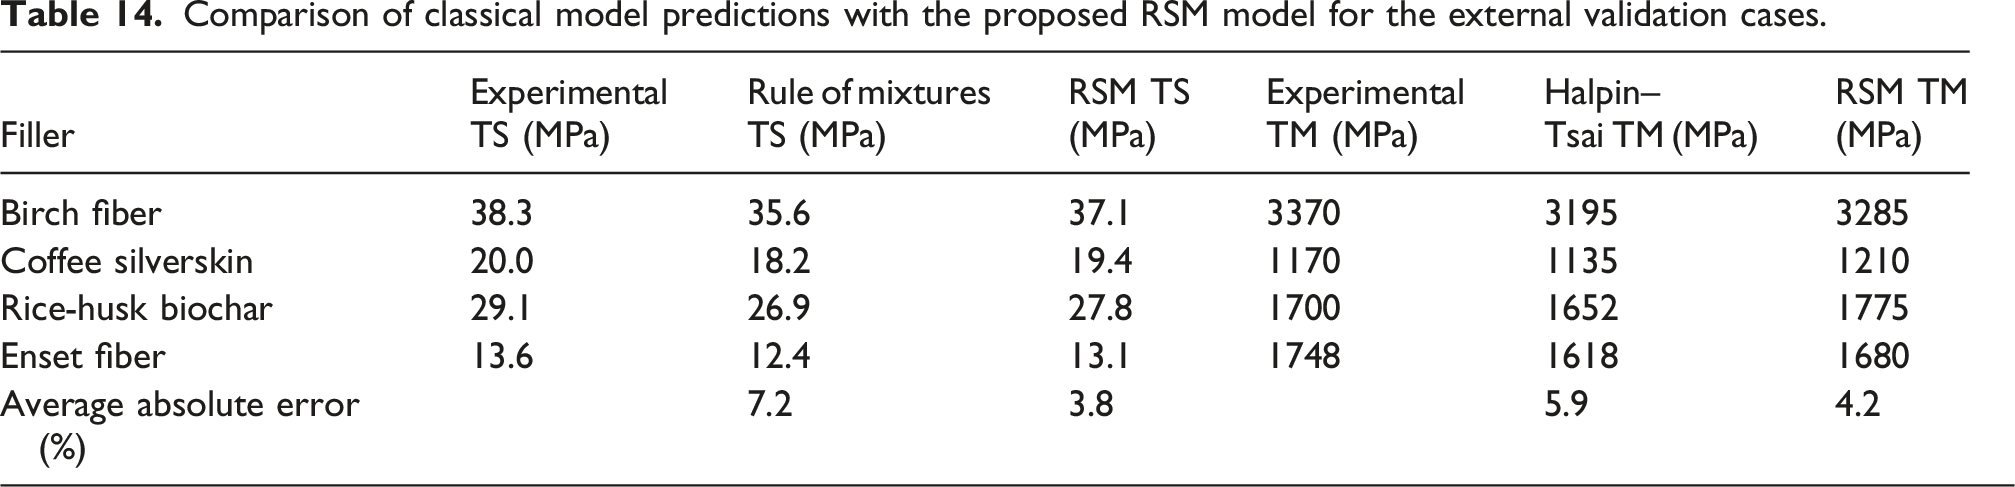
Although the Rule of Mixtures and Halpin–Tsai models provide useful first-order references for strength and stiffness estimation, they are fundamentally based on idealized assumptions of constituent continuity, efficient load transfer, and simplified reinforcement geometry. In natural fiber–reinforced polyolefin systems, however, the actual mechanical response is additionally governed by fiber chemistry, moisture sensitivity, and interfacial compatibility, which are not explicitly represented in these classical formulations. Therefore, the present RSM framework should be interpreted not merely as a statistical fit, but as a composition-sensitive predictive model that implicitly captures deviations from ideal micromechanical behavior caused by hygroscopicity, nonlinear matrix-fiber interaction, and imperfect dispersion.
Comparison of classical model predictions with the proposed RSM model for the external validation cases.
The established models are statistically well-generalized and robust, as evidenced by the small prediction errors seen across all validation points. The small under- or over-predictions were within experimental uncertainty ranges that are frequently documented in natural fiber composite mechanical testing. The near-linear alignment between predicted and measured values (Pearson correlation coefficients
Response surface and contour analysis
The combined effects of the most important compositional parameters on the mechanical performance of the natural fiber–reinforced polyolefin composites are demonstrated by the creation of 2D contour plots and 3D response surfaces using the validated regression models for TS and TM. These visualizations are shown in Figure 8: Response surfaces and contour maps from quadratic RSM models for TS. enable detailed interpretation of the interactions among cellulose ( Response surfaces and contour maps from quadratic RSM models for TS.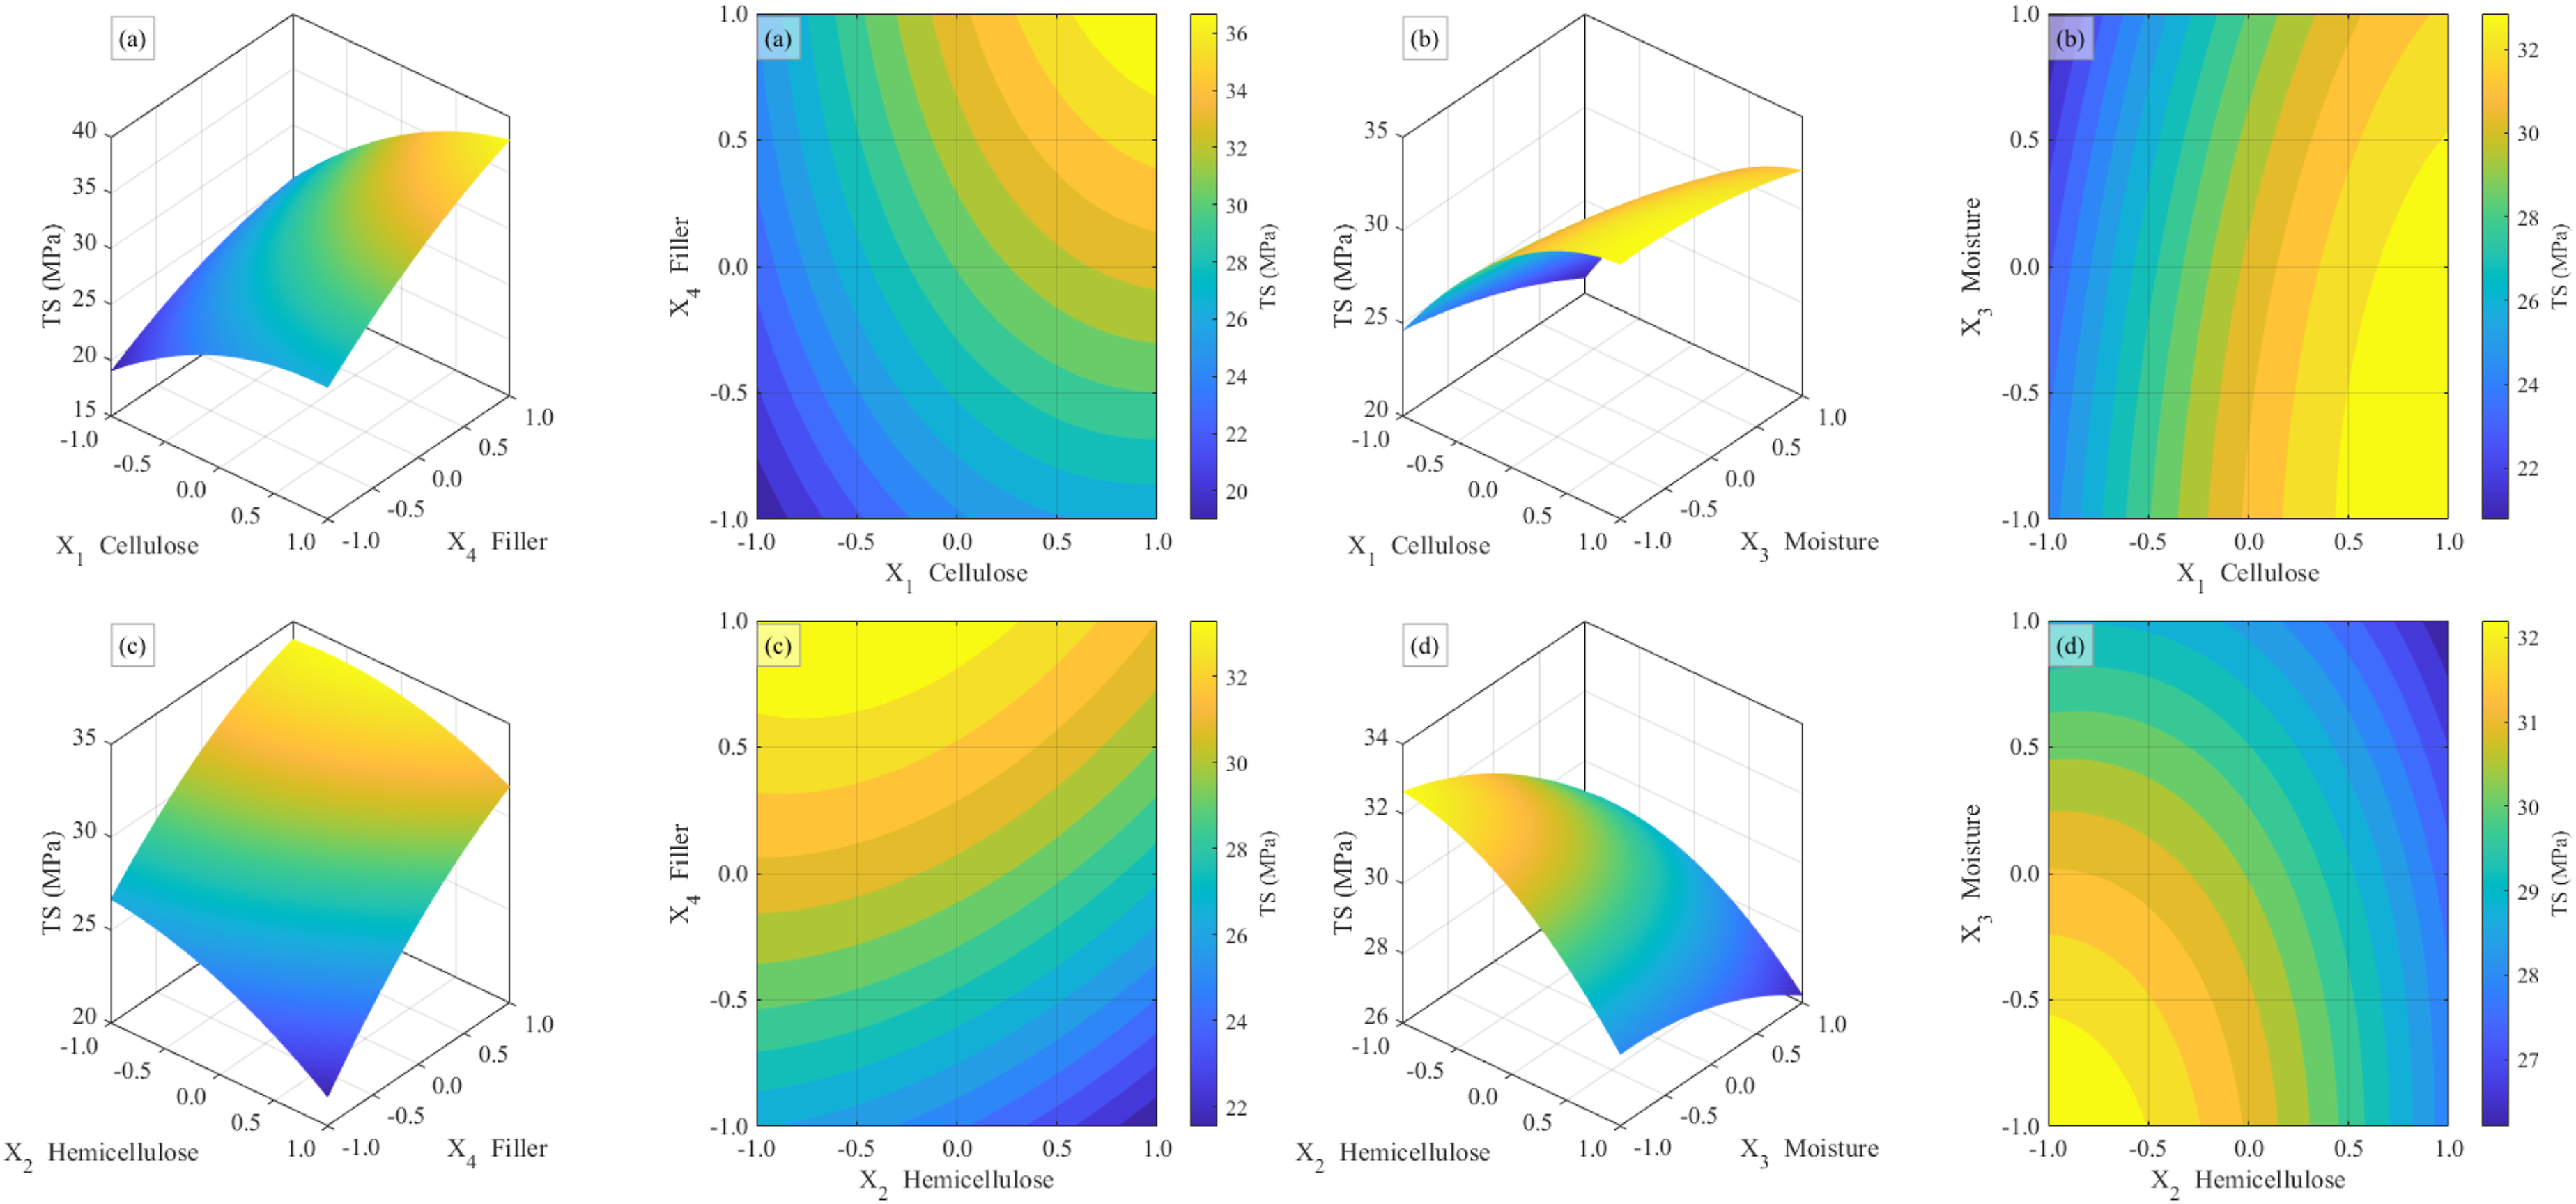
The surface that illustrates how filler loading and cellulose content interact Figure 8(a) has a noticeable convex shape, and as cellulose and filler loading increase from low to moderate levels, both TS and TM rise significantly. Peak performance was noted at 25–30 wt.% filler and 65–70 wt.% cellulose, where strong interfacial adhesion and effective stress transfer between the fiber and the polymer matrix take place. Beyond these thresholds, both responses gradually diminish, which was explained by fiber agglomeration, decreased polymer wetting, and the creation of interfacial voids at high filler concentrations. The presence of a clearly defined maximum as predicted by the quadratic model is confirmed by the optimal region’s appearance as a narrow ridge. Figure 8(b) shows the joint influence of cellulose and moisture content. Increasing moisture content causes a clear downward shift in both responses: TS decreases from approximately 34 MPa at 5 wt.% moisture to 28 MPa at 15 wt.%, while TM declines from 1850 MPa to 1650 MPa over the same range. This pattern was indicative of the hydrophilic character of lignocellulosic fibers, in which water absorption reduces stiffness and strength by weakening interfacial bonding and acting as a plasticizer. The response surface with filler loading and hemicellulose, Figure 8(c), displays mild saddle-shaped curvature. Although filler loading has a beneficial effect, mechanical performance was noticeably reduced when the hemicellulose content exceeded 20 wt.%. This was in line with hemicellulose’s amorphous and hygroscopic structure, which weakens fiber matrix compatibility and encourages matrix swelling. Figure 8(d) reveals similar negative synergy, reinforcing that fiber hygroscopicity is the dominant factor limiting mechanical efficiency. The smooth curvature and symmetry of the fitted surfaces confirm that the second-order RSM models accurately capture the nonlinear interactions among compositional parameters. The derived contours show the best windows for the process, indicating that the most balanced combination of stiffness and tensile strength is achieved with an intermediate moisture level (≈8–9 wt.%), high cellulose (≈65 wt.%), and moderate filler loading (≈27 wt.%). For compositional optimization in bio-reinforced polyolefin systems, these graphical results thus offer both qualitative insight and quantitative guidance.
Figure 9 shows the contour maps and three-dimensional response surfaces that describe the combined effects of filler loading (X_4), moisture (X_3), cellulose (X_1), and hemicellulose (X_2) on the TM of the natural fiber reinforced polyolefin composites. In accordance with the quadratic terms found in the RSM model, the plots unequivocally show that TM have strong nonlinear dependence on the compositional variables. Response surfaces and contour maps from quadratic RSM models for TM.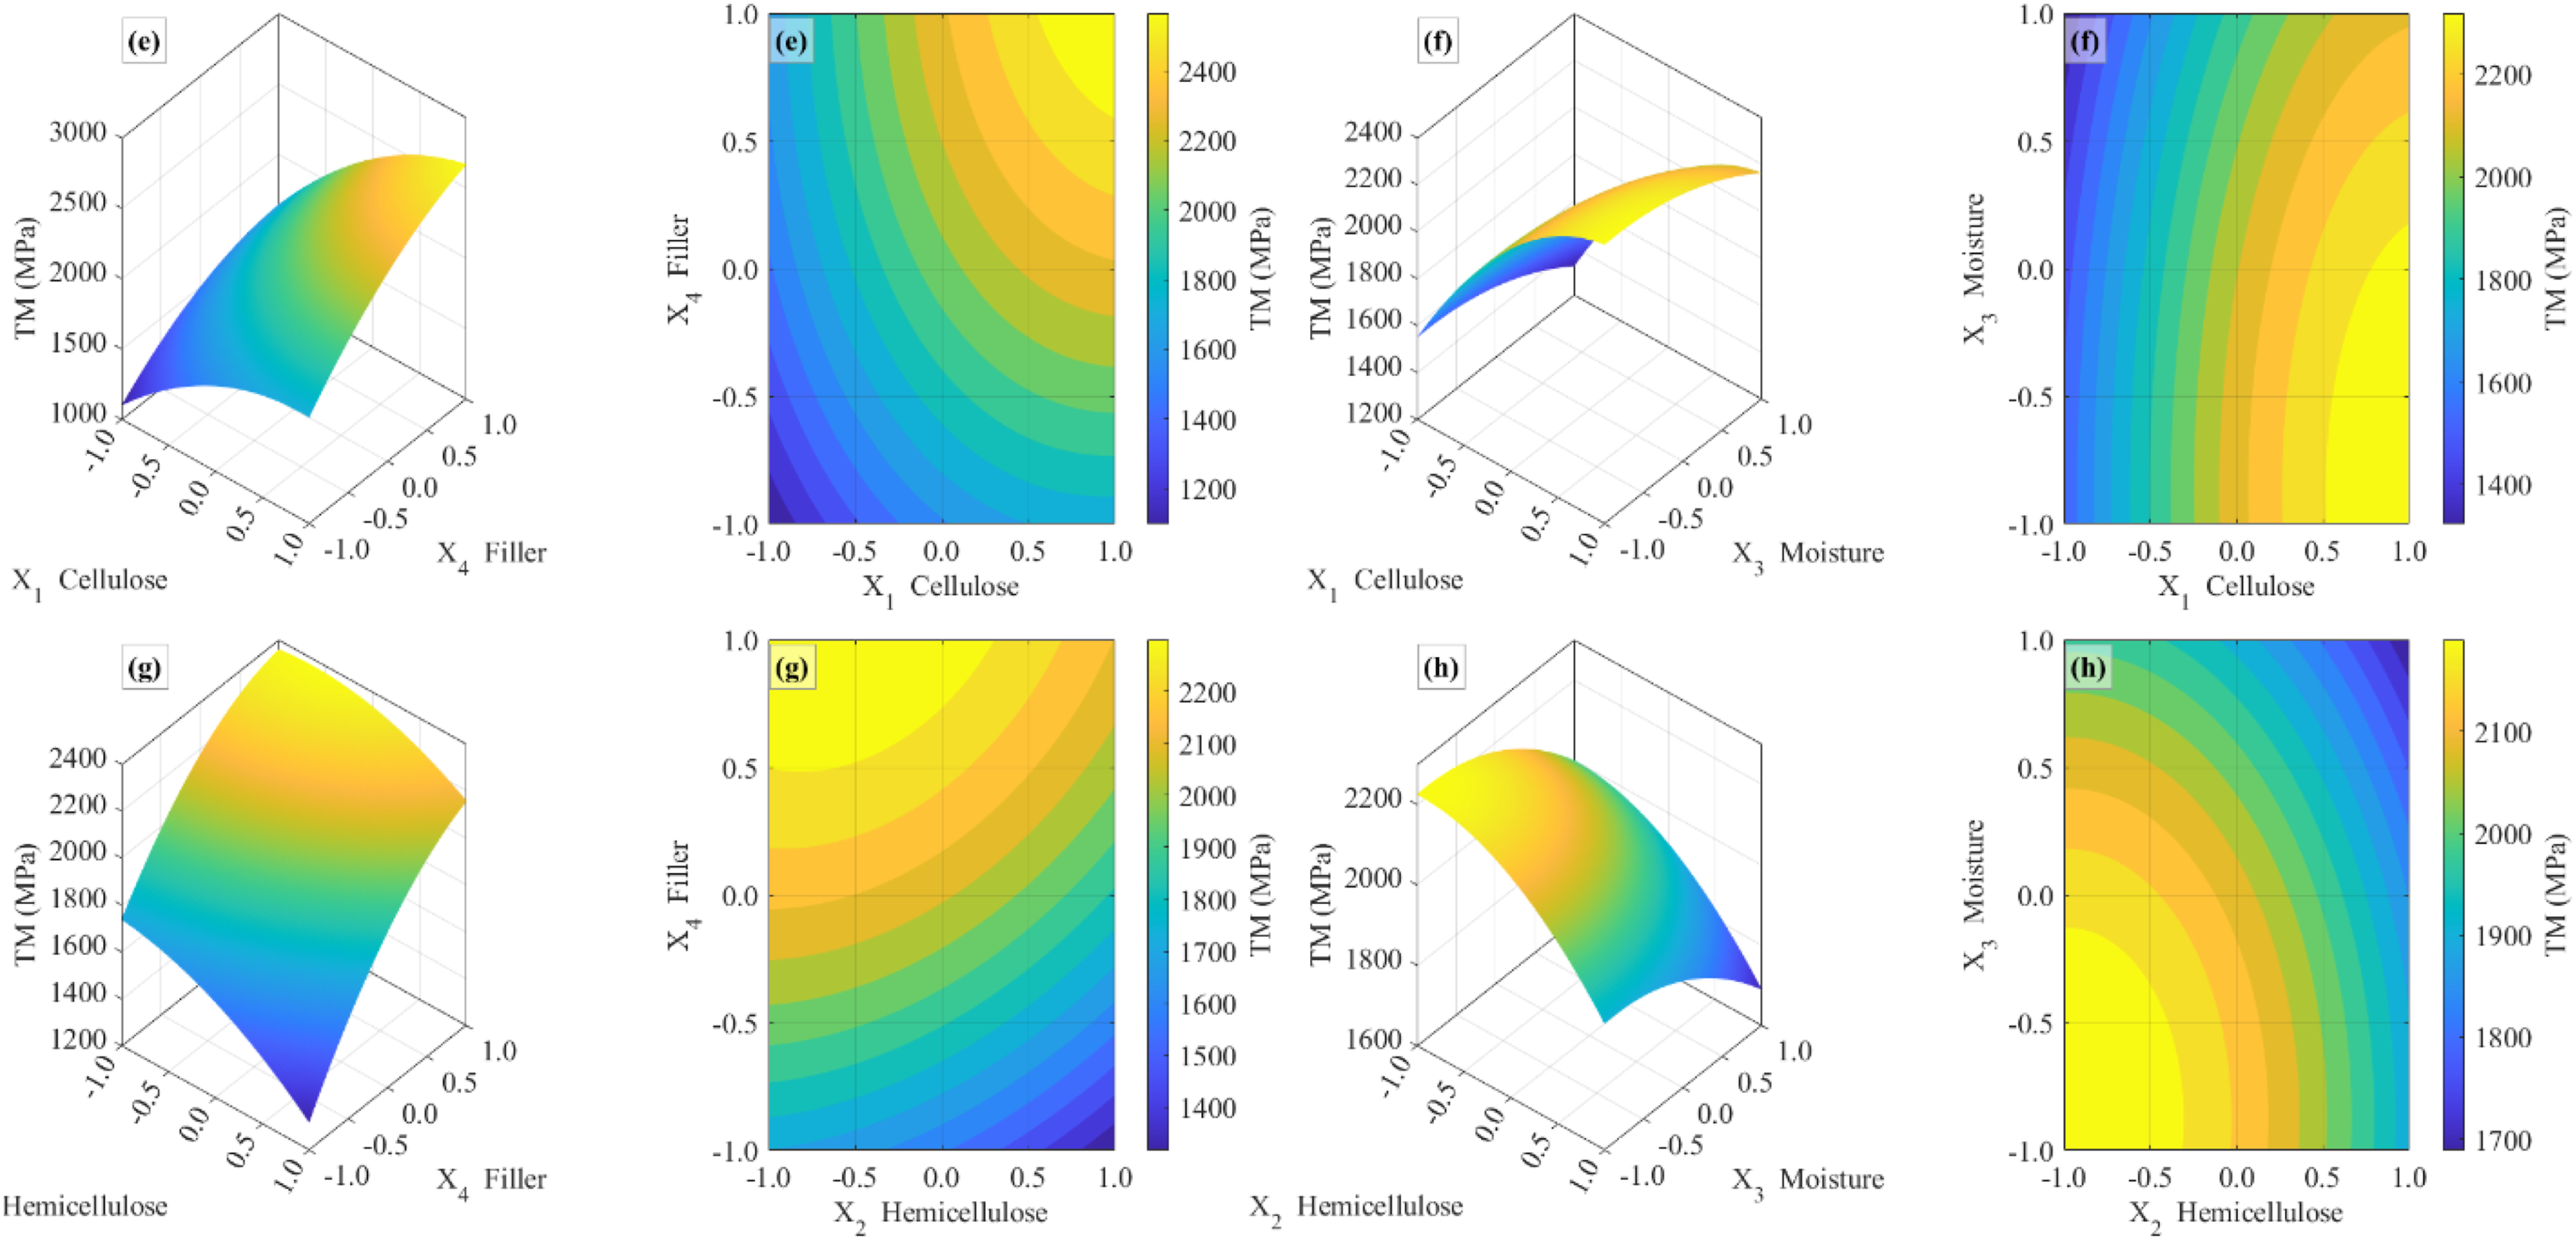
Figure 9(e) displays a surface that rises sharply, and where TM quickly rises with filler and cellulose loading. Around X_1 = +1 (≈70 wt.% cellulose) and X_4 = +0.5 (≈30 wt.% filler), the modulus reaches its maximum of roughly 2.9–3.0 GPa. This area is associated with efficient stress transfer and ideal fiber matrix interfacial adhesion. Beyond this, the slope somewhat flattens, suggesting that fiber crowding and limited polymer wetting cause diminishing returns at very high filler fractions. Figure 9(f) When moisture is changed while the cellulose content remains constant, TM clearly decreases as moisture levels rise. TM approaches 2.3–2.4 GPa at low moisture levels (≈5 wt.%), while it falls to about 1.6–1.7 GPa at high moisture levels (≈15 wt.%). The hydrophilic nature of lignocellulosic fibers, where absorbed water weakens hydrogen bonding and decreases interfacial stiffness, was reflected in this negative gradient. It is confirmed by the convex curvature along the moisture axis that moisture softens the composite matrix by acting as a plasticizer. Figure 9(g) reveals a moderate saddle-shaped curvature. Increasing filler loading enhances TM up to about 2.4 GPa, but elevated hemicellulose content (>20 wt. %) results in a measurable reduction in stiffness. Hemicellulose, being amorphous and highly hygroscopic, promotes microvoid formation and weakens matrix cohesion. The combined effect implies that although the addition of filler typically increases stiffness, too much hemicellulose counteracts this advantage by decreasing interfacial compatibility.
Figure 9(h) The final surface shows broad downward curvature, indicating that simultaneous increases in hemicellulose and moisture substantially deteriorate the modulus. At low moisture and low hemicellulose, TM is approximately 2.2 GPa; at their highest levels, it falls below 1.7 GPa. The nearly concentric contour pattern confirms synergistic degradation, which was attributed to increased fiber swelling and decreased load-bearing efficiency when both parameters were high. Continuous curvature and the absence of irregularities indicate excellent model fit and predictive consistency. While hemicellulose content should not exceed 20 wt.% to maintain structural stiffness and interfacial integrity, these results confirm that high cellulose (≈65–70 wt.%), moderate filler loading (≈25–30 wt.%), and controlled moisture (<8 wt.%) are required to optimize tensile modulus.
The multi-response optimization was not interpreted solely based on maximum statistical desirability, but also in light of manufacturability and processing feasibility. In practical polyolefin composite fabrication, excessively high filler loading may increase melt viscosity, promote fiber agglomeration, reduce polymer wetting, and generate interfacial voids, all of which can hinder uniform processing and diminish final mechanical performance. Similarly, elevated moisture content may intensify defect formation and interfacial weakening, while excessive hemicellulose can further reduce matrix compatibility because of its hygroscopic and amorphous nature. For this reason, the optimum composition was selected within a practically manufacturable domain rather than at an extreme compositional boundary. The identified optimum of approximately 66 wt.% cellulose, 19 wt.% hemicellulose, 8 wt.% moisture, and 27 wt.% filler is therefore considered a manufacturable optimum, since it lies within the moderate region associated with adequate processability, improved fiber-matrix wetting, and reduced risk of agglomeration- or moisture-induced defects.
Despite the strong statistical performance of the developed RSM models, several limitations associated with literature-based modeling should be acknowledged. First, the compiled dataset was derived from multiple independent studies, and therefore reflects unavoidable heterogeneity in specimen preparation methods, fiber treatments, polymer grades, compatibilizer usage, processing conditions, and mechanical testing protocols. Second, some of the original literature data were reported in range-based form rather than as fully expanded record-level observations, which required a range-decoding and discretization procedure to construct the final analytical dataset. Although this step enabled large-scale modeling, it may introduce approximation effects relative to raw experimental measurements. Third, not all potentially influential variables were reported consistently across the source studies, which means that some secondary effects could not be included explicitly in the present regression framework. Accordingly, the proposed models should be interpreted as robust composition-driven predictive tools within the domain represented by the curated literature dataset, rather than as universally transferable physical laws for all natural fiber–reinforced polyolefin composite systems. Future work should therefore validate the identified optimal regions using controlled experimental campaigns under standardized processing and testing conditions.
Conclusion
This study successfully developed a statistically supported framework for modeling and optimizing the mechanical performance of natural fiber reinforced polyolefin composites based on the chemical composition and physical characteristics of the reinforcing fibers. RSM and a CCD are used to systematically measure and optimize the combined effects of cellulose, hemicellulose, moisture content, and filler loading on TS and TM. ANOVA confirmed strong model significance (p < 0.0001), coefficients of determination exceeded 0.98, and residual and validation errors were low (<5%), indicating high statistical reliability for the second-order polynomial regression models. The models’ predictive robustness and generalization ability are confirmed by diagnostic analyses, which also confirmed that they met all regression assumptions and produced nearly perfect correlation (r > 0.99) between the predicted and experimental data. The findings showed that while excessive hemicellulose and moisture contents had a negative impact on performance because of their hydrophilic and amorphous nature, cellulose content and filler loading were the main positive contributors to both TS and TM. The response surfaces showed clearly defined optimal regions with maximum predicted values of roughly 45 MPa (tensile strength) and 2.9 GPa (tensile modulus) at 65–70 wt.% cellulose, 25–30 wt.% filler, <9 wt.% moisture, and <20 wt.% hemicellulose. These results highlight the fact that compositional tuning, as opposed to merely process modification, can greatly improve load transfer and interfacial adhesion in bio-based HDPE/PP composites. Therefore, a repeatable and interpretable process for multi-objective mechanical performance optimization in sustainable polymer composite design is established by the suggested composition-driven RSM framework.
Footnotes
Funding
The authors disclosed receipt of the following financial support for the research, authorship, and/or publication of this article: This work was supported by grant No. 634/2024 from the Deanship of Scientific Research at Jordan University of Science and Technology (JUST).
Declaration of conflicting interests
The authors declared no potential conflicts of interest concerning the research, authorship, and/or publication of this article.
Data Availability Statement
All data obtained or analyzed during this study are included in this published article.