
Abstract
This study investigates the influence of key fused deposition modeling (FDM) parameters—namely infill density. printing speed. and nozzle temperature—on the tensile behavior of 3D-printed PLA–wood composite anti-trichiral structures. Tensile experiments were conducted to evaluate the UTS and elongation at break. highlighting the strong dependence of mechanical response on both processing conditions and architectured geometry. A Taguchi-based experimental design was employed to generate the dataset used for training an artificial neural network (ANN) model. The ANN was applied as a predictive tool to estimate tensile properties and in combination with multi-criteria decision-making (MCDM) methods. to perform a multi-objective optimization balancing ultimate tensile strength (UTS) and elongation at break within the investigated parameter range. The results show that the highest measured UTS (6.12 MPa) was achieved at an infill density of 25% while the maximum elongation at break (19.3%) occurred at a lower infill density of 5%. The ANN predictions exhibited good agreement with experimental results. indicating promising predictive capability rather than definitive accuracy. and demonstrating the potential of data-driven modeling for guiding process optimization. Overall. this work introduces a novel hybrid ANN–MCDM framework applied to bio-based PLA–wood composite anti-trichiral lattices. providing new insights into processing–structure–property relationships and highlighting the relevance of artificial intelligence tools for the design and optimization of architectured materials in additive manufacturing.
Keywords
Introduction
Additive manufacturing, commonly referred to as 3D printing, has emerged as a transformative technology for the fabrication of complex geometries and customized structures, offering significant advantages over conventional manufacturing techniques. 1 Among the materials used in fused deposition modeling (FDM), composite filaments such as wood–PLA have attracted increasing attention due to their bio-based nature, distinctive surface texture and modified mechanical behavior compared to neat PLA. Wood–PLA composites consist of fine wood particles dispersed within a polylactic acid (PLA) matrix, which modifies the mechanical response while maintaining PLA’s the biodegradability and renewability.
The influence of 3D printing parameters on the mechanical performance and quality of additively manufactured parts has been extensively investigated.2–5 In FDM, parameters such as printing speed, nozzle temperature, and infill density play a critical role in determining interlayer bonding, porosity, and load transfer efficiency. For composite filaments, these effects are highly non-linear and strongly coupled, which makes process optimization particularly challenging, as highlighted in recent studies on fiber-reinforced polymer composites. 6
Unlike neat PLA, the presence of wood particles alters melt flow behavior, interlayer diffusion, and fiber–matrix interactions, leading to different dominant printing parameters and narrower optimal processing windows compared to those typically reported for pure PLA.
Beyond material formulation, the mechanical behavior of additively manufactured parts can be further tailored through the use of architected materials, where geometry plays a fundamental role in governing the global response. In this context, anti-trichiral lattices have attracted considerable interest due to their high deformability, energy absorption capability, and favorable strength-to-weight ratio,7–18 making them promising candidates for lightweight structural and functional applications. Although only the anti-trichiral geometry is investigated in this study, it was selected for its auxetic behavior and deformation-controlled failure mechanisms.
Despite the growing body of literature on PLA-based materials and cellular architectures, only limited attention has been devoted to the combined effects of printing parameters and architectured geometry in wood–PLA anti-trichiral structures, particularly under tensile loading conditions.19–21 This reveals a first research gap concerning the processing–structure–property relationships of bio-based composite lattices fabricated by FDM.
To address the complexity associated with FDM process–property relationships, artificial neural networks (ANNs) have been widely used to model the non-linear dependencies between printing parameters and mechanical properties. 22 Recent work has demonstrated the effectiveness of ANN-based approaches for predicting the tensile behavior of PLA under uncertainty 23 and for optimizing printing parameters.24–26 However, most existing studies focus primarily on prediction or single-objective optimization, without explicitly addressing the trade-offs between competing mechanical requirements.
This leads to a second research gap: the lack of studies that integrate predictive ANN models with multi-criteria decision-making (MCDM) methods for multi-objective optimization, particularly for complex architected bio-composite structures, where strength and ductility must be simultaneously considered. The proposed ANN–MCDM methodology can be extended to other infill structures, including solid (100% infill), in future studies.
To address these gaps, the present study investigates the tensile behavior of FDM-printed wood–PLA anti-trichiral structures and examines the influence of key printing parameters known to affect interlayer bonding and mechanical response. UTS and elongation at break are selected as complementary performance indicators, enabling a balanced evaluation of load-bearing capacity and deformation capability. A hybrid ANN–MCDM framework is then proposed to support the multi-objective optimization of printing conditions within the investigated parameter space.
The remainder of this paper is organized as follows: the Materials and Methods section presents the study design, the Results section reports the findings, the Discussion section discusses the results, and the Conclusions section summarizes the main conclusions.
Materials and methods
Materials
PLA–wood is a composite filament produced by combining biodegradable polylactic acid (PLA) with natural wood fibers. PLA. derived from renewable resources such as corn starch or sugarcane. is widely used in fused deposition modeling due to its ease of processing and bio-based origin. The filament used in this study was supplied by Spectrum Filaments. containing approximately 20 wt.% wood fibers dispersed within a PLA matrix. which provides a characteristic wood-like surface texture and aesthetic appearance. while also modifying the mechanical response and fracture behavior compared to neat PLA.
The commercial PLA–wood filament had a nominal diameter of 1.75 mm with a tolerance of ±0.05 mm. ensuring stable and uniform extrusion during 3D printing. The material has a reported density of 1.19 g/cm3 and a nominal Young’s modulus of approximately 3550 MPa. as provided by the manufacturer. It should be noted that these values are indicative and may vary depending on printing conditions. part geometry. and loading direction.
No drying procedure was performed prior to printing. as the filament was opened from its original packaging and printed immediately. To minimize moisture absorption. the filament was stored in a dry environment during the study.
Based on the manufacturer’s recommendations. the nozzle temperature was set within the suitable range of 190–220°C. while the bed temperature was fixed at 60°C. This setting was experimentally validated to prevent adhesion issues and allow proper detachment of the printed specimens.
Specimen preparation
The specimens investigated in this study feature an anti-trichiral honeycomb architecture, selected to tailor the mechanical response through geometric effects rather than material densification. The overall geometry of the lattice structure. together with the configuration of the repeating unit cells. is illustrated in Figure 1. Geometry of the anti-trichiral honeycomb architecture and the unit cell.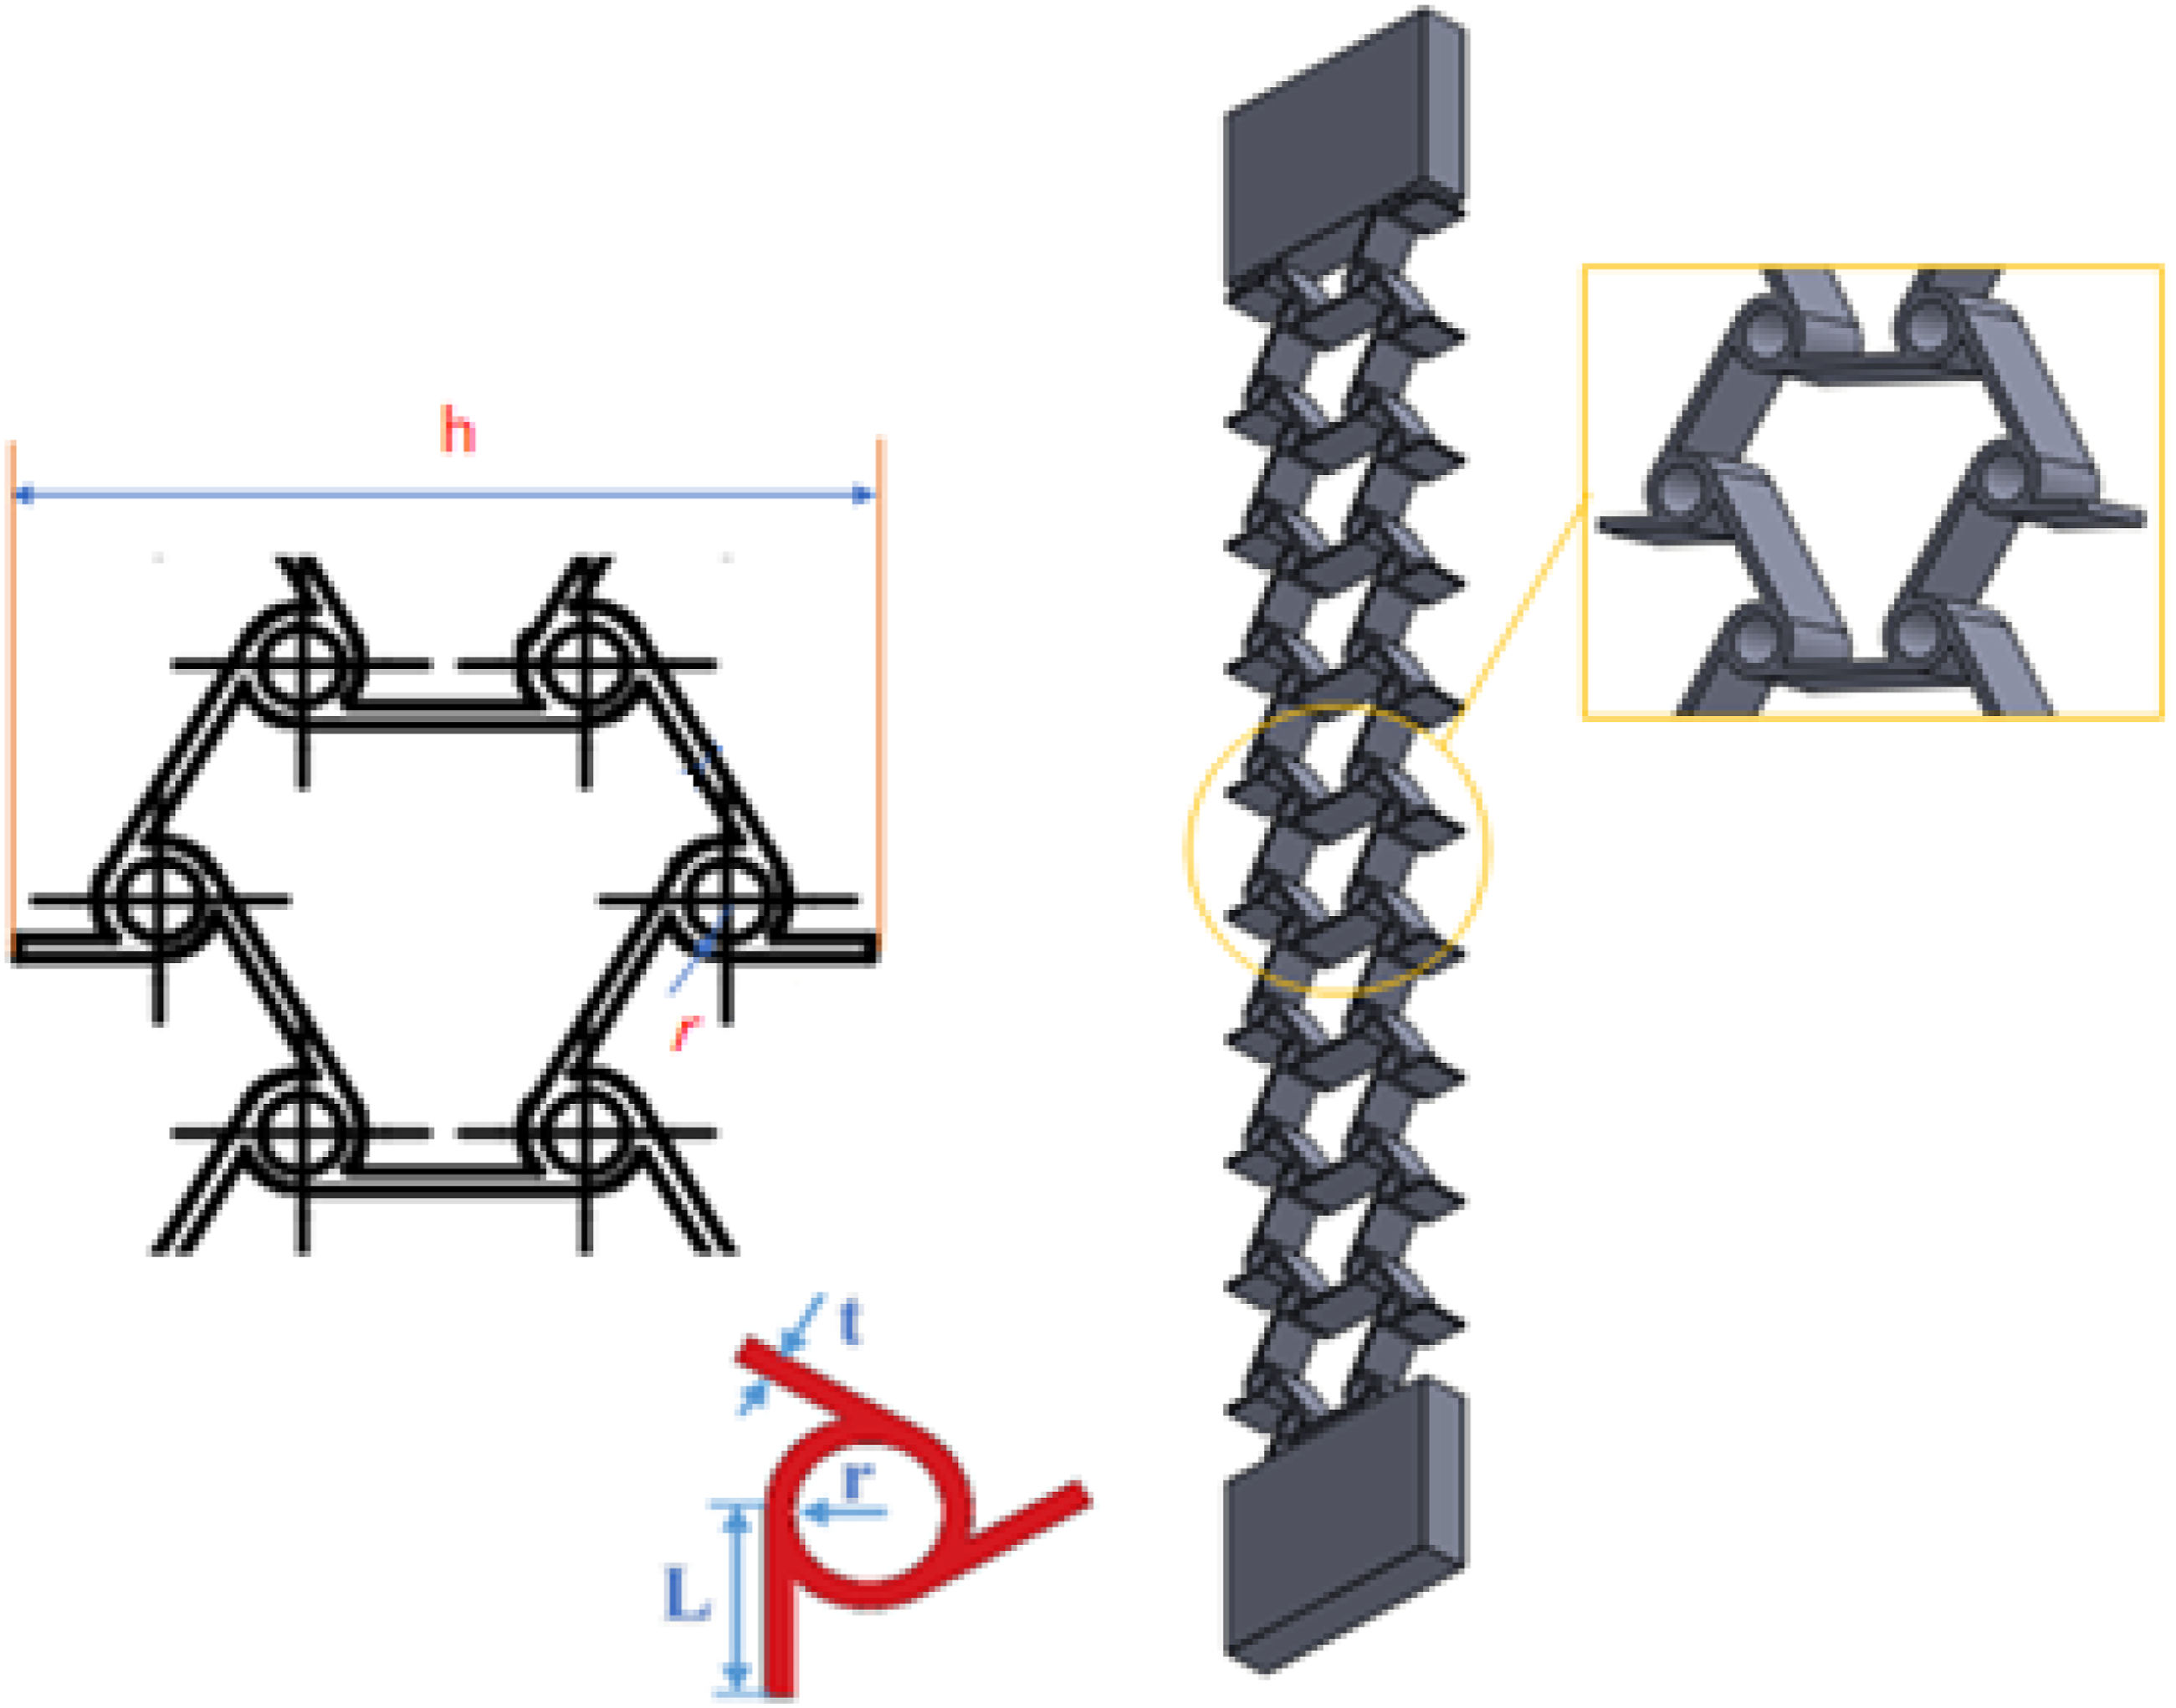
The anti-trichiral honeycomb is composed of a periodic arrangement of identical unit cells forming a lightweight lattice whose deformation behavior is governed by the rotation of circular nodes and the bending of connecting struts. Each unit cell is defined using an equilateral triangle as a geometrical reference for layout and symmetry. rather than as a physical structural component. The geometry of the unit cell is characterized by the following parameters: L. representing the side length of the unit cell; r the radius of the circular nodes; and t the thickness of the connecting struts. The printed specimens had an overall length of 100 mm, a width of 25 mm (h), and an overall thickness of 5 mm (e). The unit cell lies in the X–Y plane. while the specimen thickness extends along the Z direction. consistent with the build direction used in the FDM process.
Geometric parameters of materials 27 .
3D printing
The specimens investigated in this study were designed using SolidWorks CAD software and exported as STL files for fabrication by fused deposition modeling (FDM). The geometry of the tensile specimens was inspired by ASTM D638 recommendations. which were adopted as a reference framework rather than as a strict dimensional standard. given the architectured nature of the anti-trichiral lattice structures.27,28 The STL files were processed using slicing software to generate the corresponding G-code instructions.
The material employed was a commercial PLA–wood composite filament containing natural wood fibers dispersed within a PLA matrix. According to the manufacturer’s datasheet, this wood-filled filament requires an extrusion temperature in the range of 190–220°C. The selection of printing conditions was guided by both manufacturer recommendations and established practices reported in the literature for wood–PLA composites. In particular, previous studies have shown that moderate extrusion temperatures, controlled layer heights, and stable bed temperatures are essential to ensure proper interlayer bonding and to limit thermal degradation of wood particles during FDM processing. 29
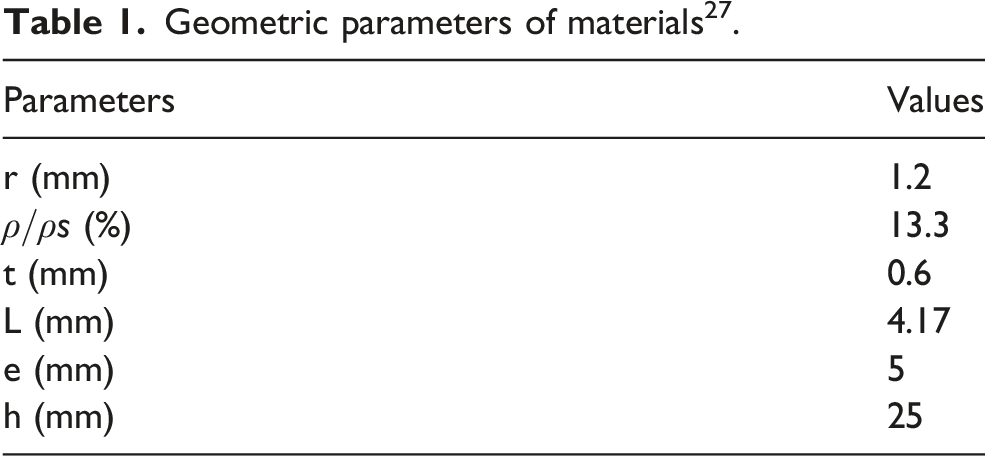
All specimens were fabricated using a Raise3D Pro2 Plus 3D printer equipped with a brass nozzle of 0.4 mm diameter (Figure 2). This nozzle size was selected to reduce the risk of clogging commonly associated with wood-filled filaments. The bed temperature was fixed at 60°C, a value recommended by the filament manufacturer and experimentally validated in the present work to ensure adequate adhesion during printing while allowing easy detachment of the specimens after cooling. No significant clogging or extrusion instabilities were observed during fabrication. To minimize moisture-related defects. the filament was stored in a dry environment throughout the experimental campaign. Test specimen: (a) 3D printer manufactures the test specimen; (b) a sample produced by 3D printer; (c) Close-up view of the printing process of a Wood-PLA specimen.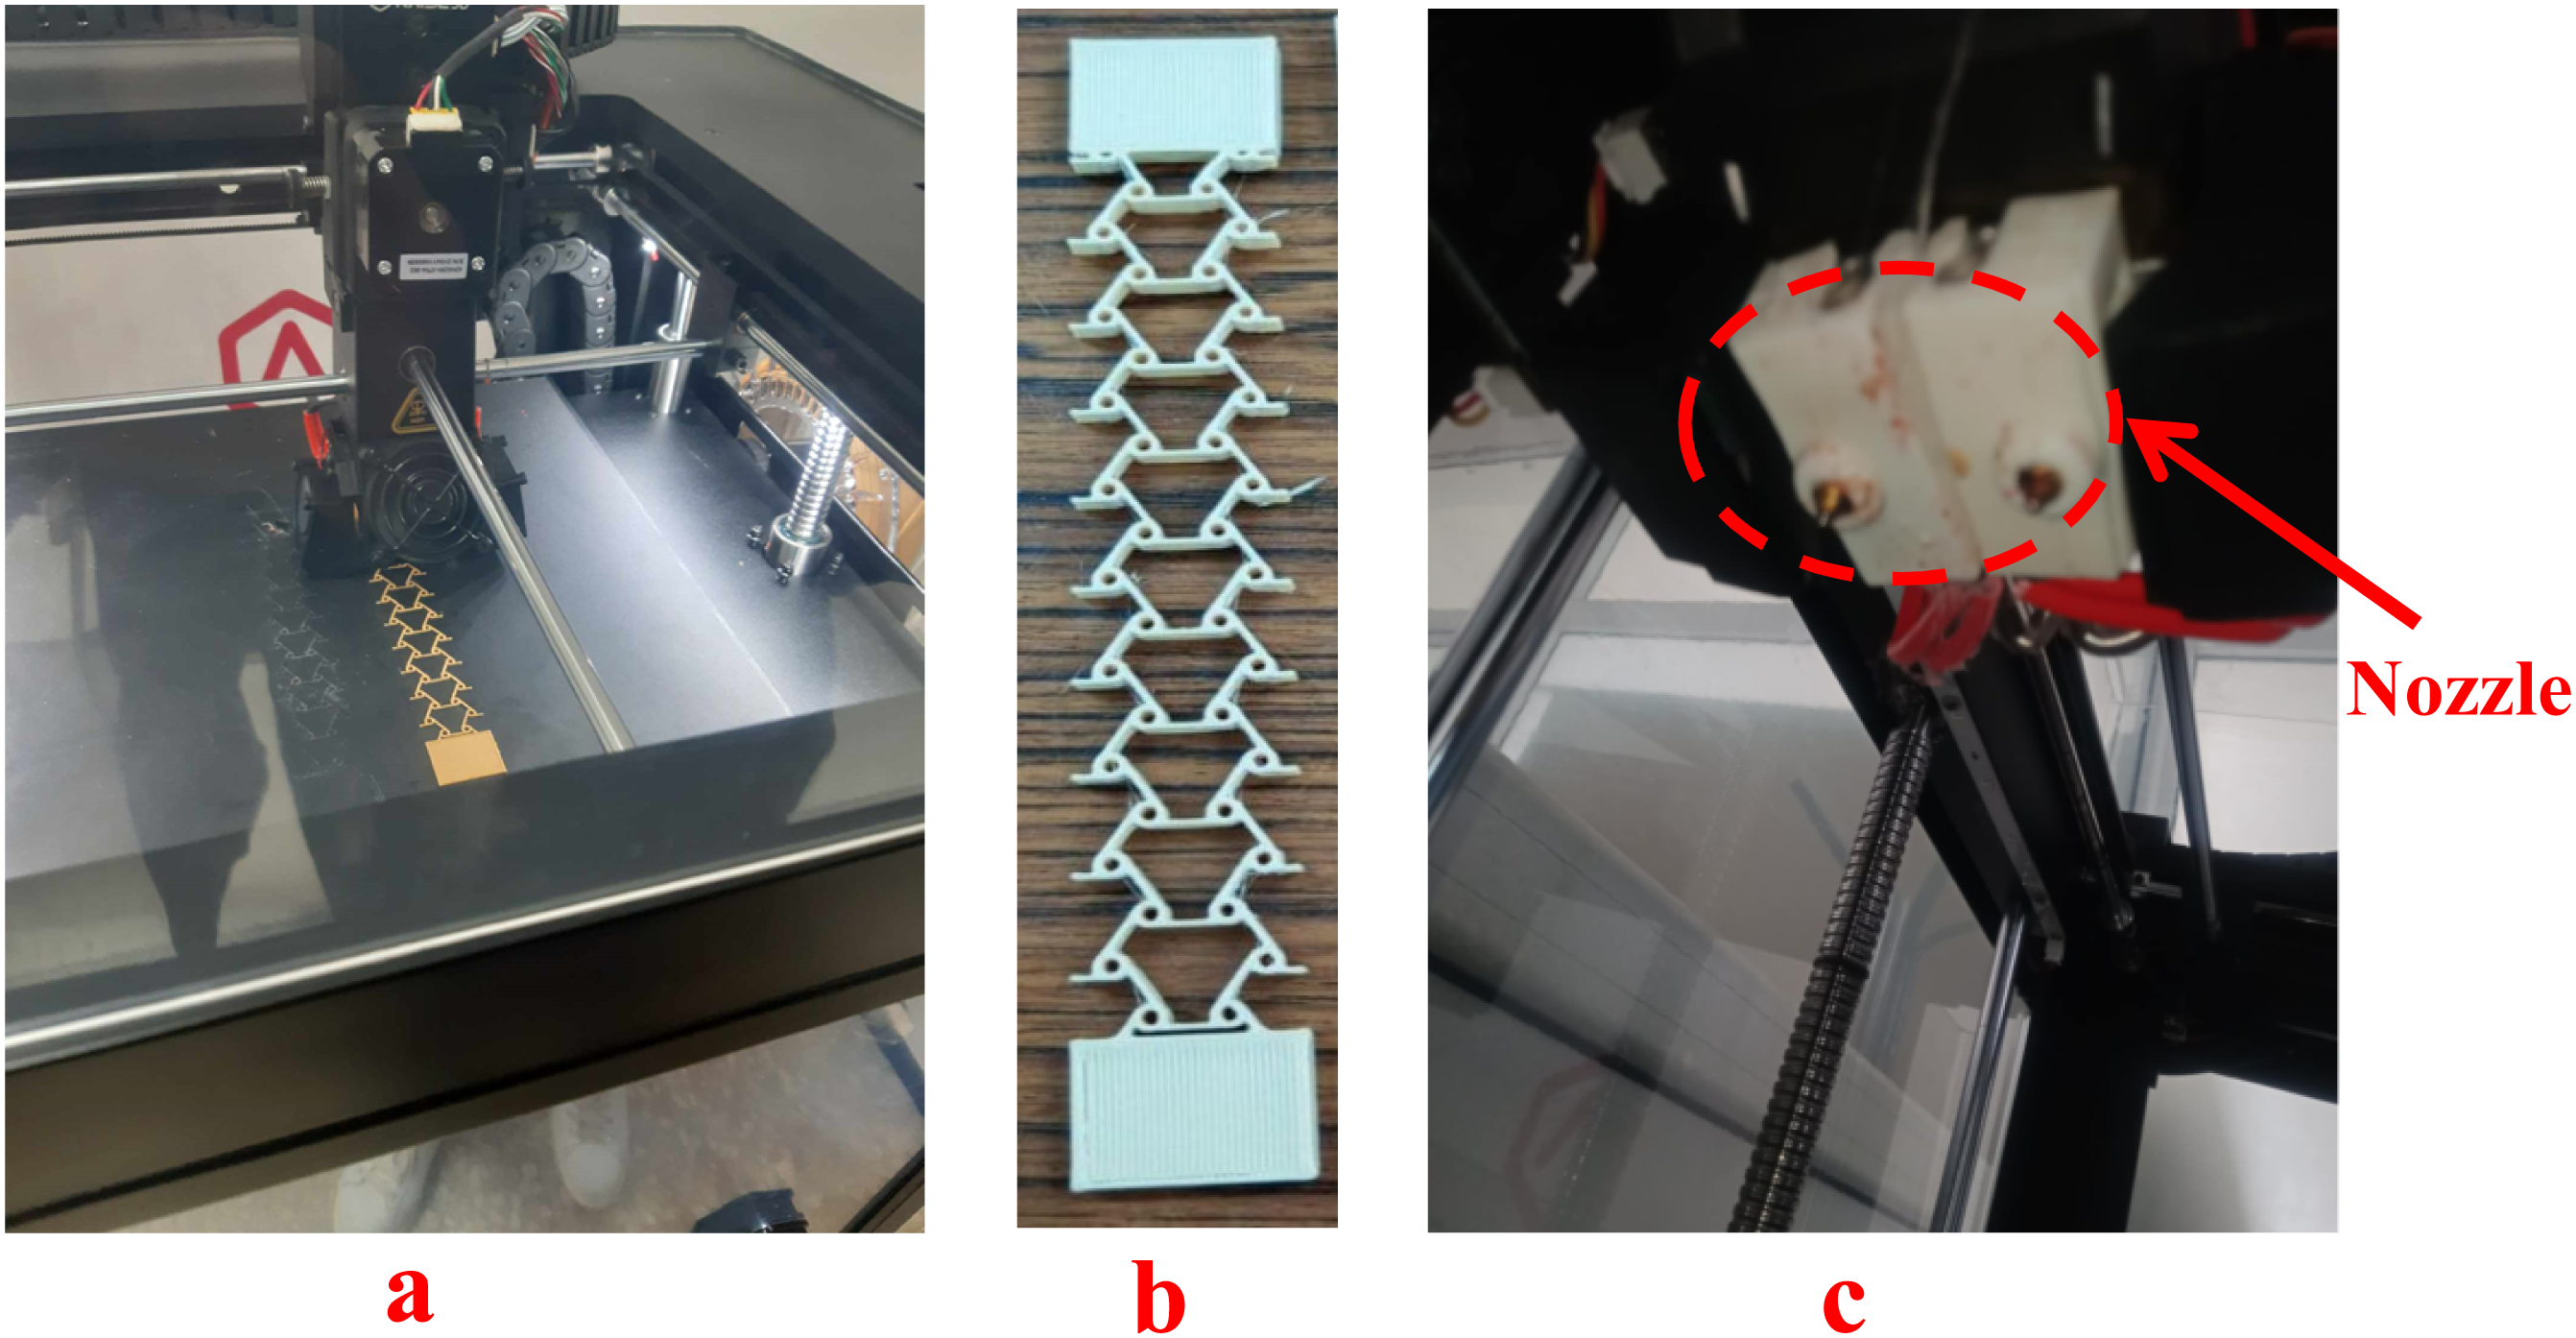
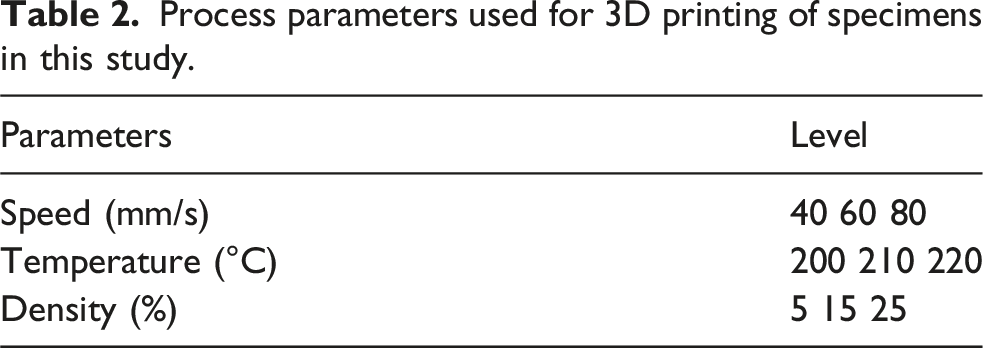
Process parameters used for 3D printing of specimens in this study.
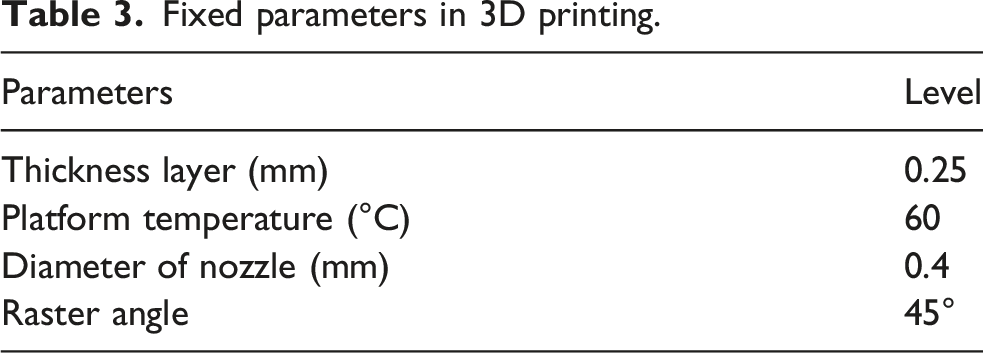
Fixed parameters in 3D printing.
A Taguchi L9 orthogonal array was employed to design the experimental campaign allowing efficient exploration of the main effects of multiple printing parameters while significantly reducing the number of experimental runs. Although Taguchi designs are not intended to capture all higher-order interactions, they are widely used for preliminary screening studies and for generating structured datasets suitable for subsequent data-driven modeling. Similar methodological frameworks, combining designed experiments with machine learning tools for FDM parameter optimization, have been reported in the literature.
30
In the present study, the Taguchi L9 design was therefore used to generate the experimental dataset, which served as the basis for mechanical testing and for the development of the ANN-based predictive and optimization framework. A flowchart illustrating the complete experimental and computational workflow. from design and printing to testing. ANN modeling. and MCDM optimization. is presented in Figure 3. Flowchart illustrating the complete experimental and computational workflow.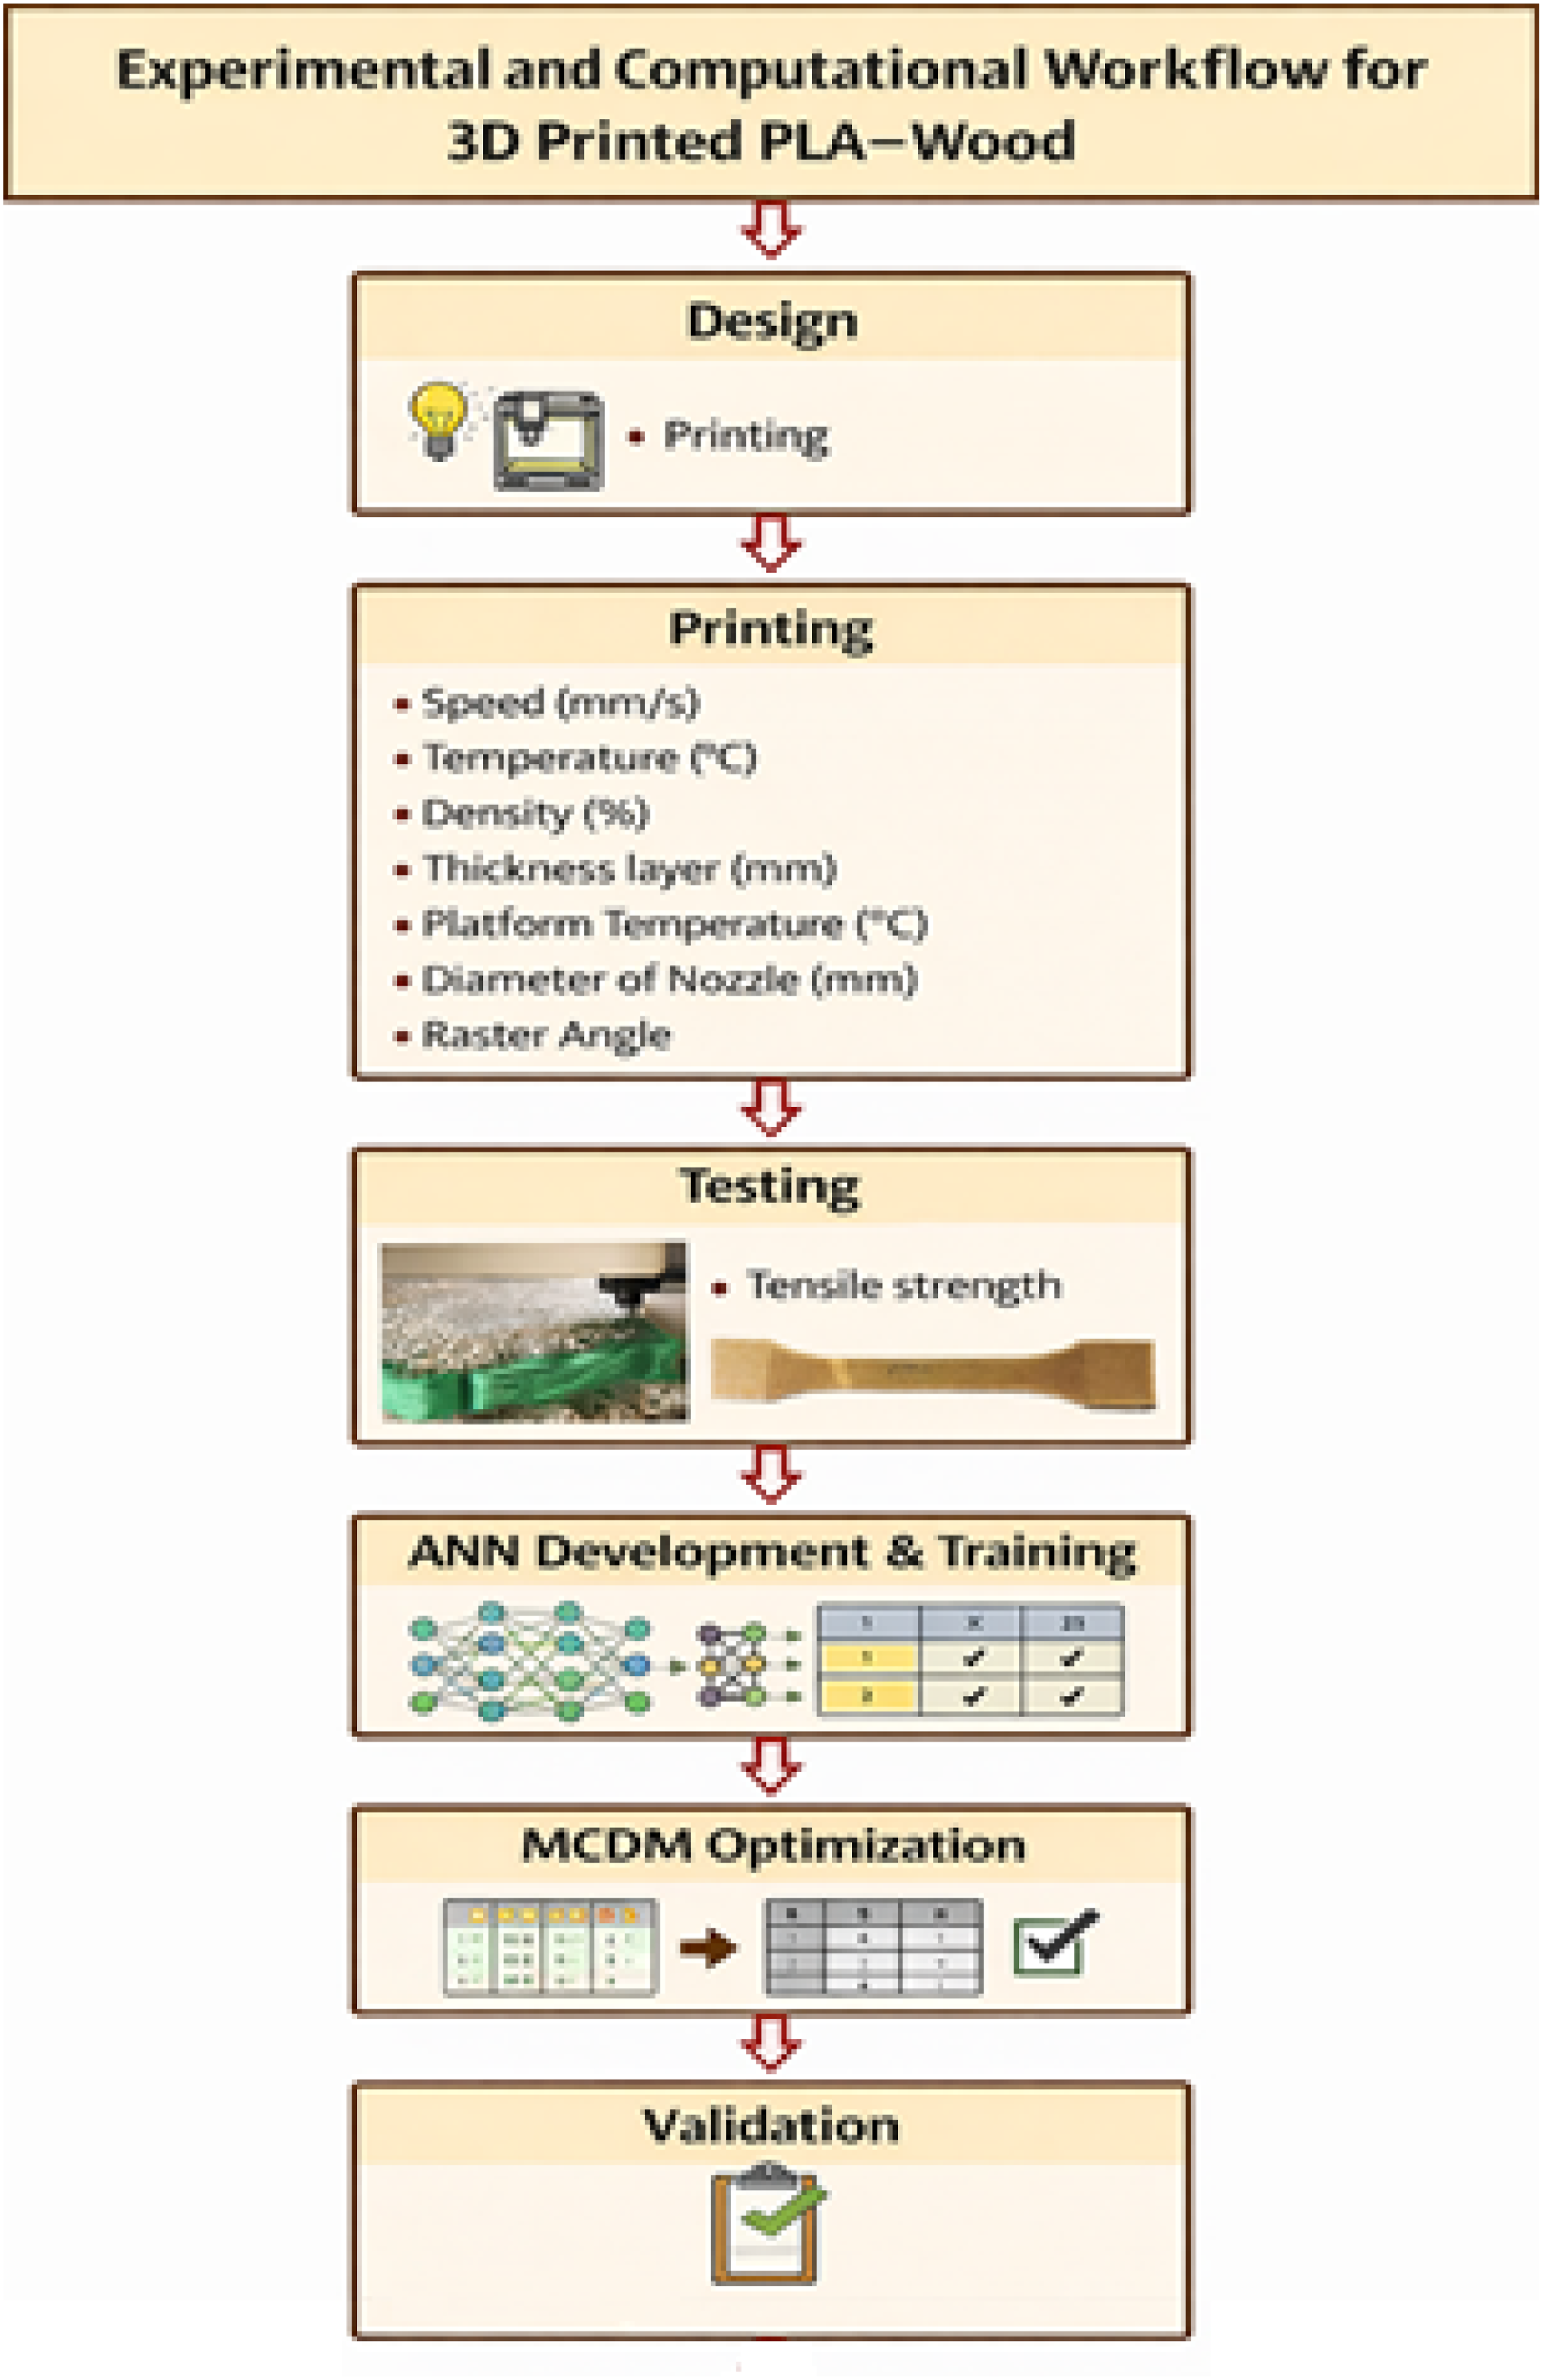
Tensile test
The static mechanical behavior of the investigated specimens, corresponding to their response under quasi-static loading conditions up to failure. was characterized through uniaxial tensile tests. The testing procedure was conducted using ASTM D638 28 as a methodological guide for test setup, loading conditions and data interpretation. Although the anti-trichiral lattice specimens do not strictly conform to the standardized geometry prescribed by ASTM D638, the standard provides a consistent reference framework for tensile characterization and comparative analysis.
All specimens were mounted on a universal testing machine using customized gripping fixtures equipped with clamping blocks on both ends. This configuration was specifically designed to securely hold the fragile and porous lattice structures while minimizing stress concentrations and preventing premature damage at the gripping regions. Careful alignment of the specimens was ensured prior to testing in order to avoid slippage or eccentric loading during the tensile experiments (Figure 4). Equipment for experimental tensile testing.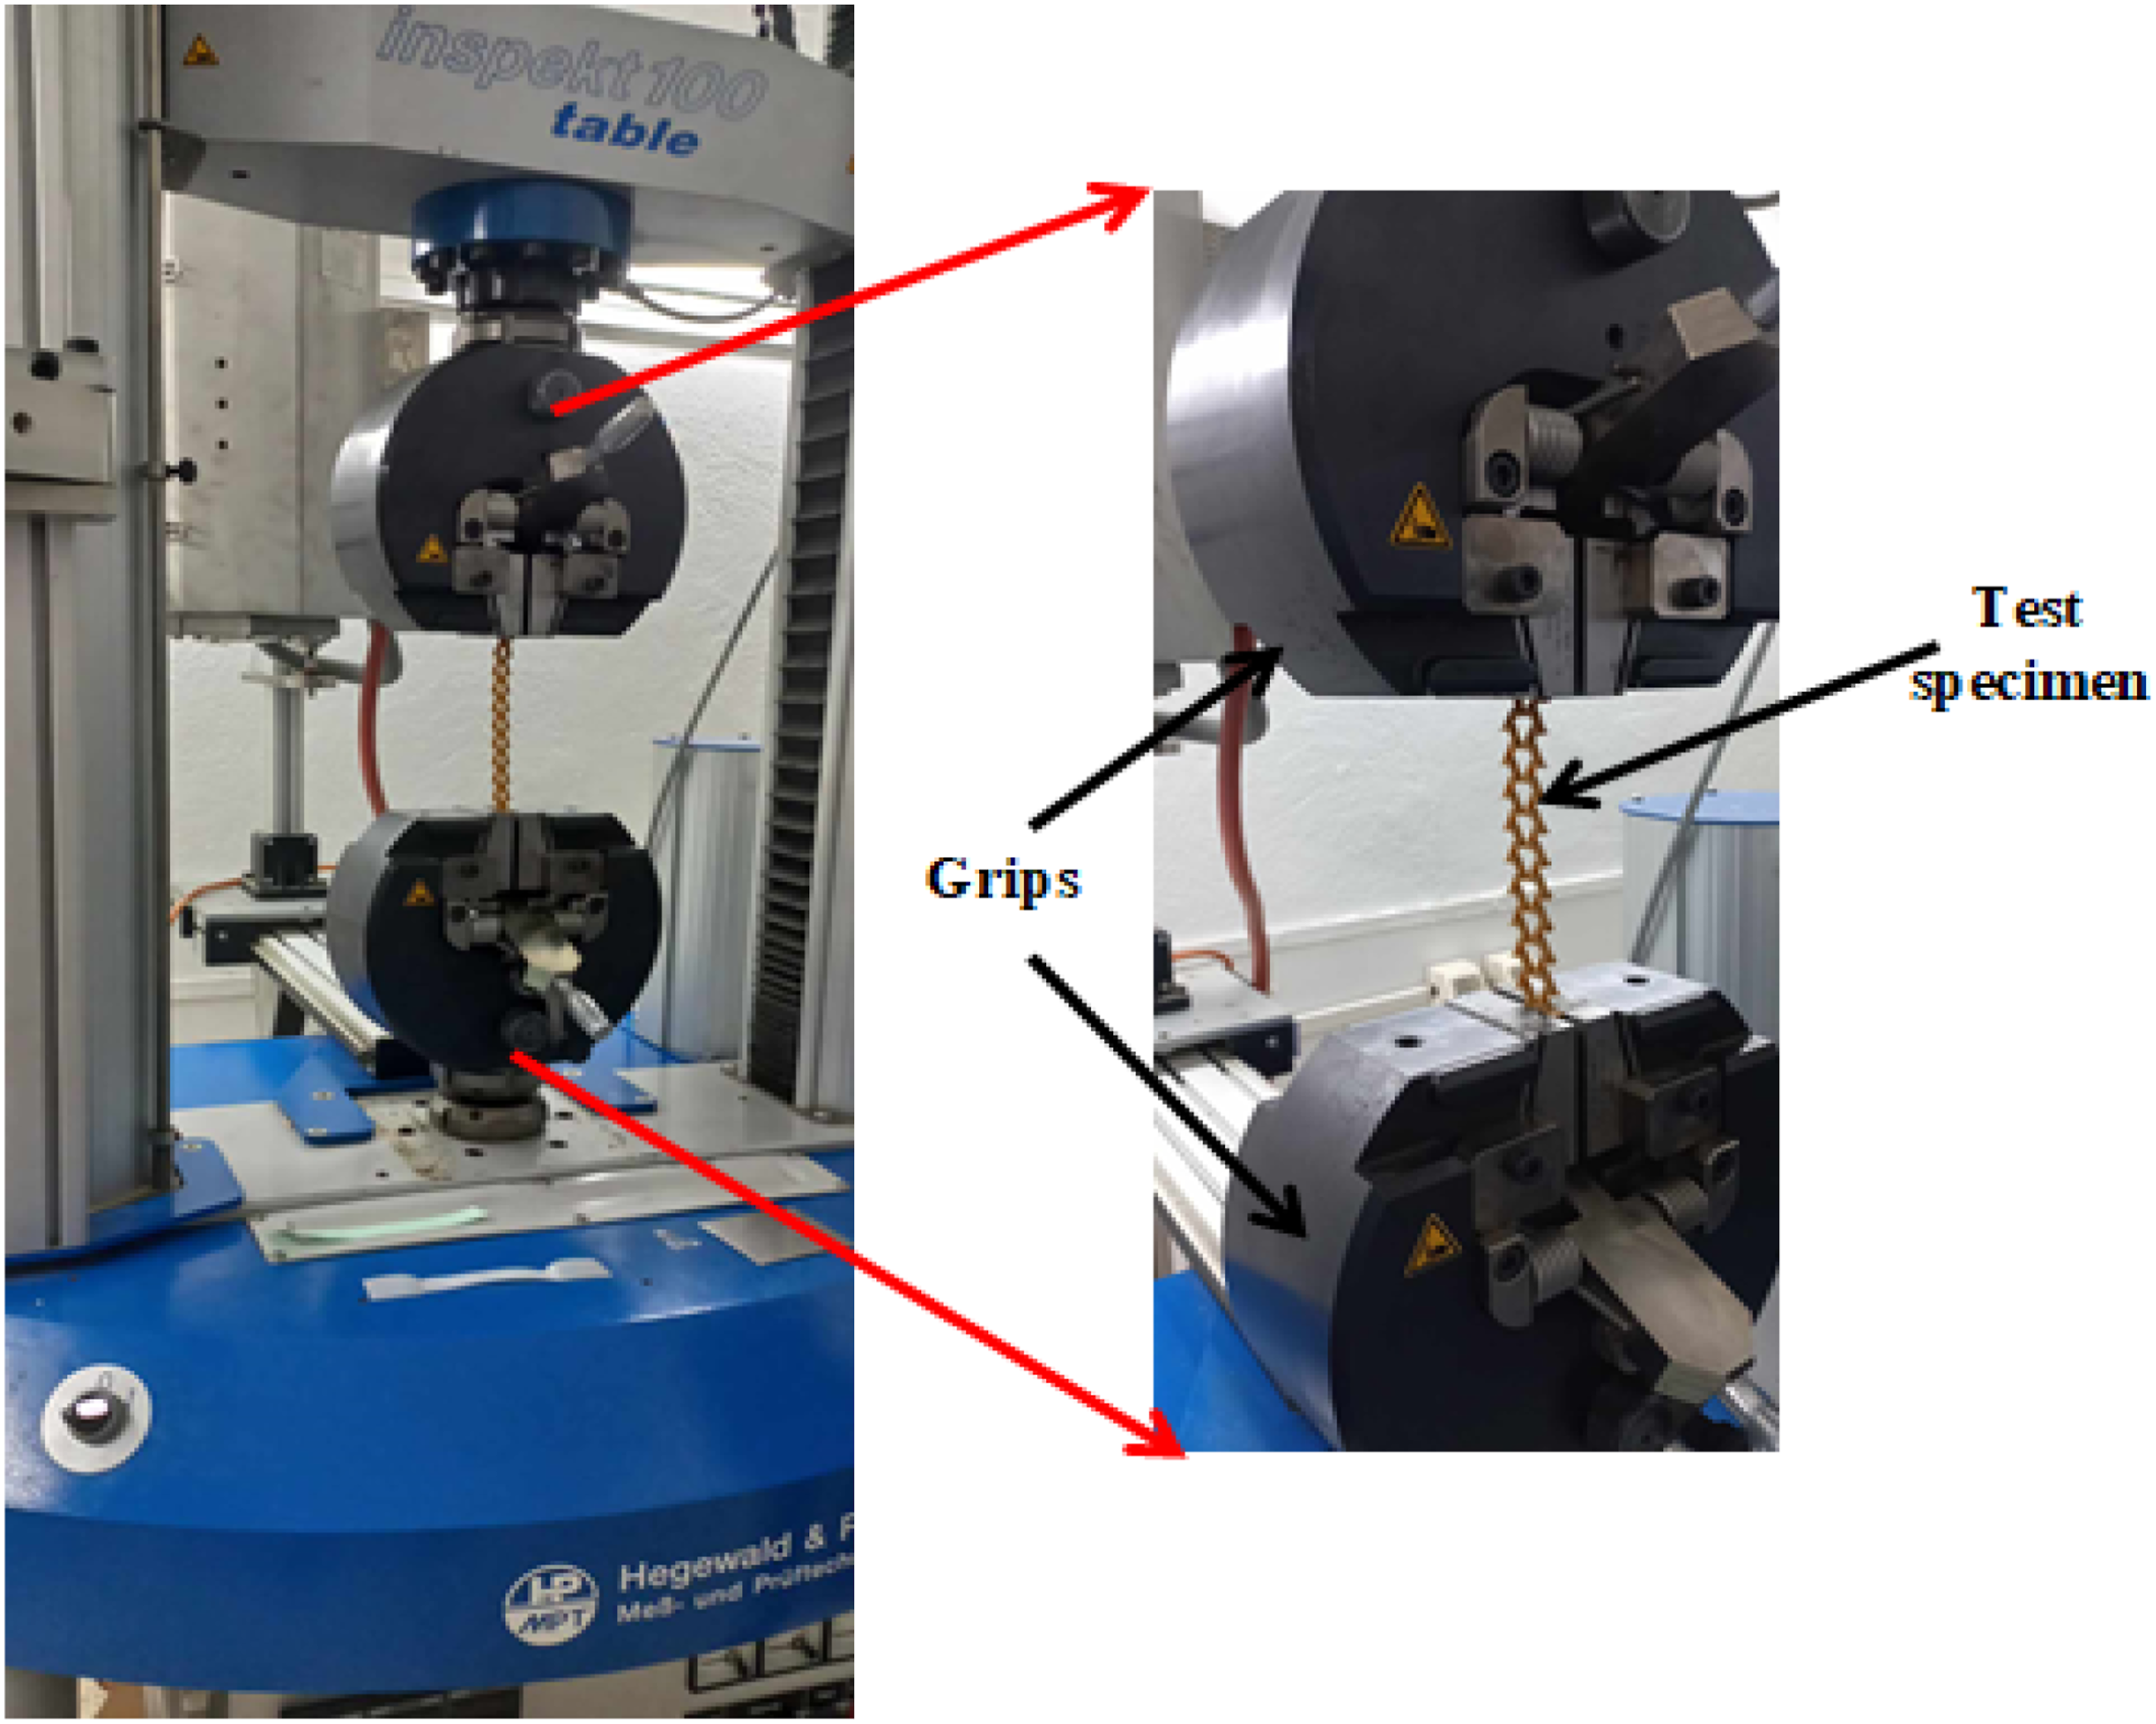
Tensile tests were performed at a constant crosshead speed of 5 mm/min, in line with ASTM D638 recommendations for polymer-based materials. This loading rate was selected to limit time-dependent deformation effects. which are known to be significant in PLA-based and wood-filled polymer composites. During testing. force and displacement data were continuously recorded to generate engineering stress–strain curves. The initial gauge length was defined as the distance between the grips. and the engineering strain was calculated as the ratio of the measured displacement to this reference length.
Owing to the architectured lattice design, the reported Young’s modulus corresponds to an apparent (effective) modulus of the structure rather than the intrinsic elastic modulus of the PLA–wood material itself. From the stress–strain curves, the following mechanical parameters were extracted: UTS, elongation at break and apparent modulus, which together characterize the load-bearing capacity, deformation capability, and structural stiffness of the specimens.
For each set of printing parameters, three specimens were tested to ensure repeatability and to assess experimental variability. The resulting stress–strain responses provide a consistent basis for comparing the influence of printing parameters on the mechanical performance of PLA–wood anti-trichiral structures and for analyzing their tensile deformation and failure mechanisms. The failed test specimen, with the fracture areas indicated, is shown in Figure 5. Failed PLA–wood anti-trichiral specimen under tensile loading, with the fracture area indicated.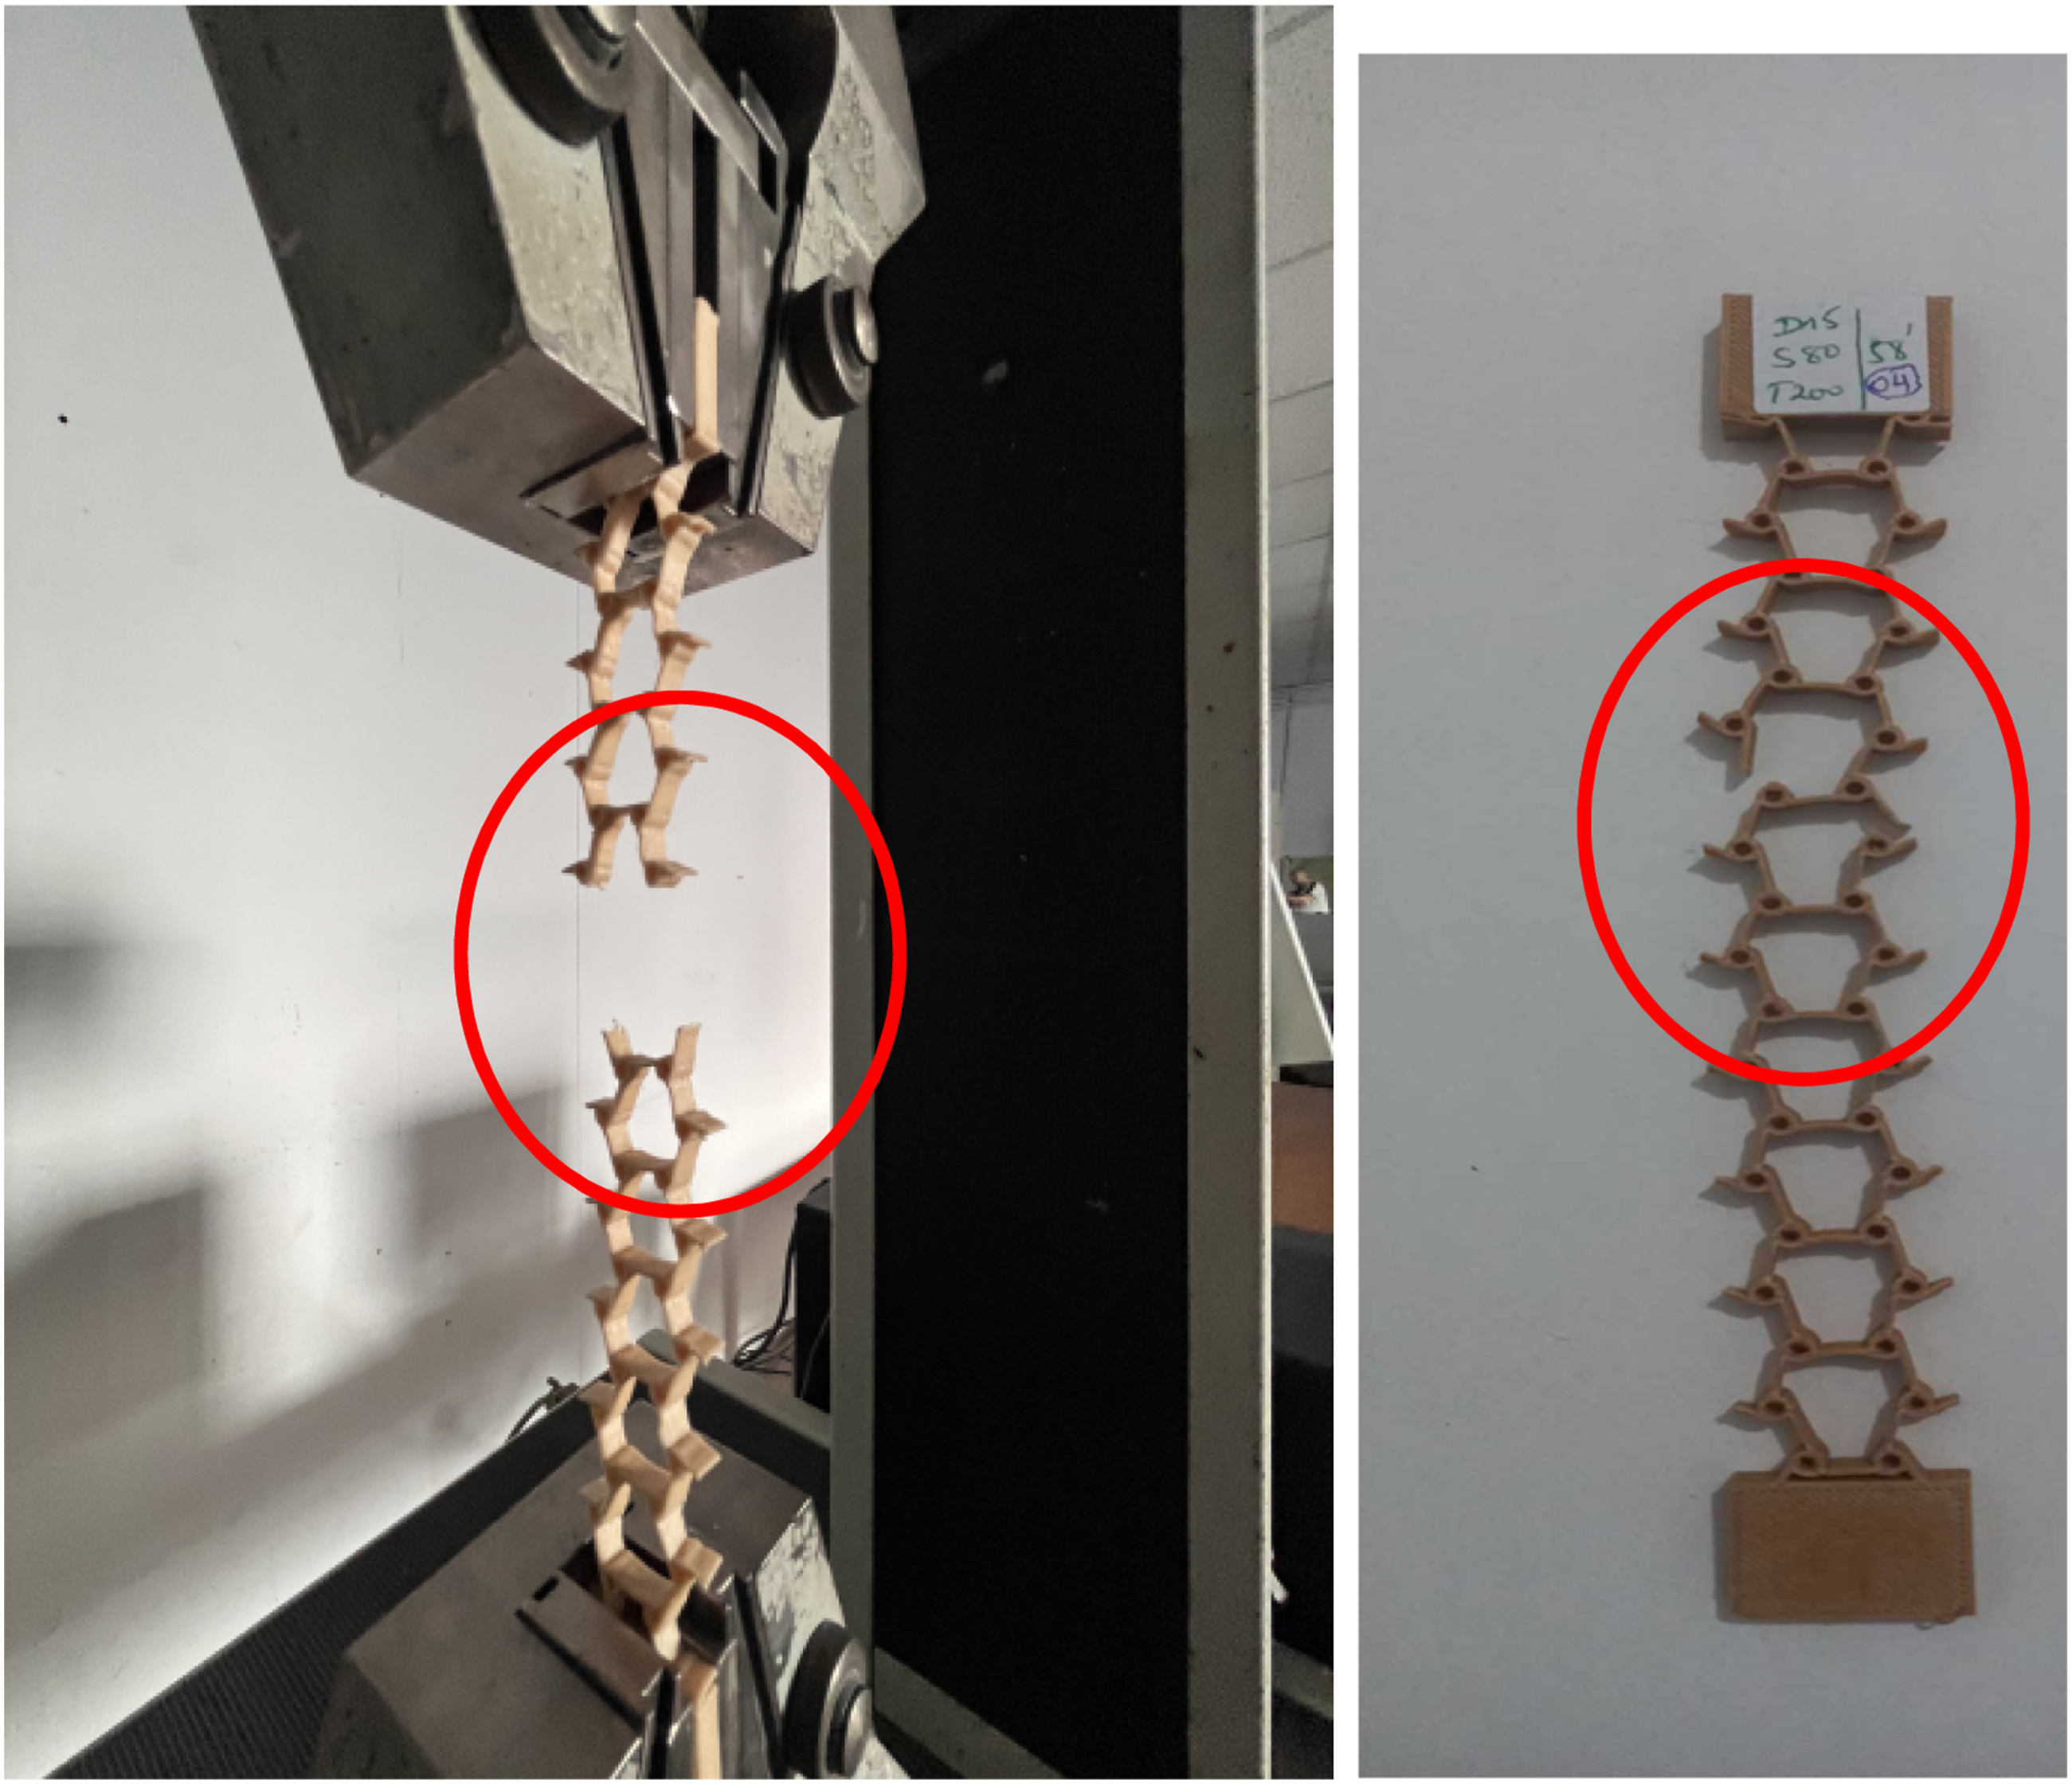
Artificial neural networks
Artificial neural networks (ANNs) are widely employed as data-driven modeling tools for capturing nonlinear relationships between process parameters and material responses. In the context of fused deposition modeling (FDM). ANNs have been applied to predict mechanical properties of PLA-based materials and polymer composites. where complex interactions between processing conditions and structural response are commonly observed.1,5,31–33 The choice of ANN for predicting mechanical behavior is supported by recent work on PLA–wood composites, 6 demonstrating the model’s ability to capture nonlinearities in 3D-printed bio-composite structures. In the present work. the ANN is used as a complementary modeling approach to explore the relationships between printing parameters and tensile behavior of PLA–wood anti-trichiral structures within the investigated parameter space.
An in-house ANN code developed in Fortran was employed for this purpose.34,35 The adopted network architecture consists of an input layer. a single hidden layer. and an output layer. as illustrated in Figure 6. The input layer includes three printing parameters: printing speed (mm/s). nozzle temperature (°C). and infill density (%). The output layer corresponds to one mechanical response variable measured experimentally. namely either the UTS (MPa) or the elongation at break (%). ANN architecture.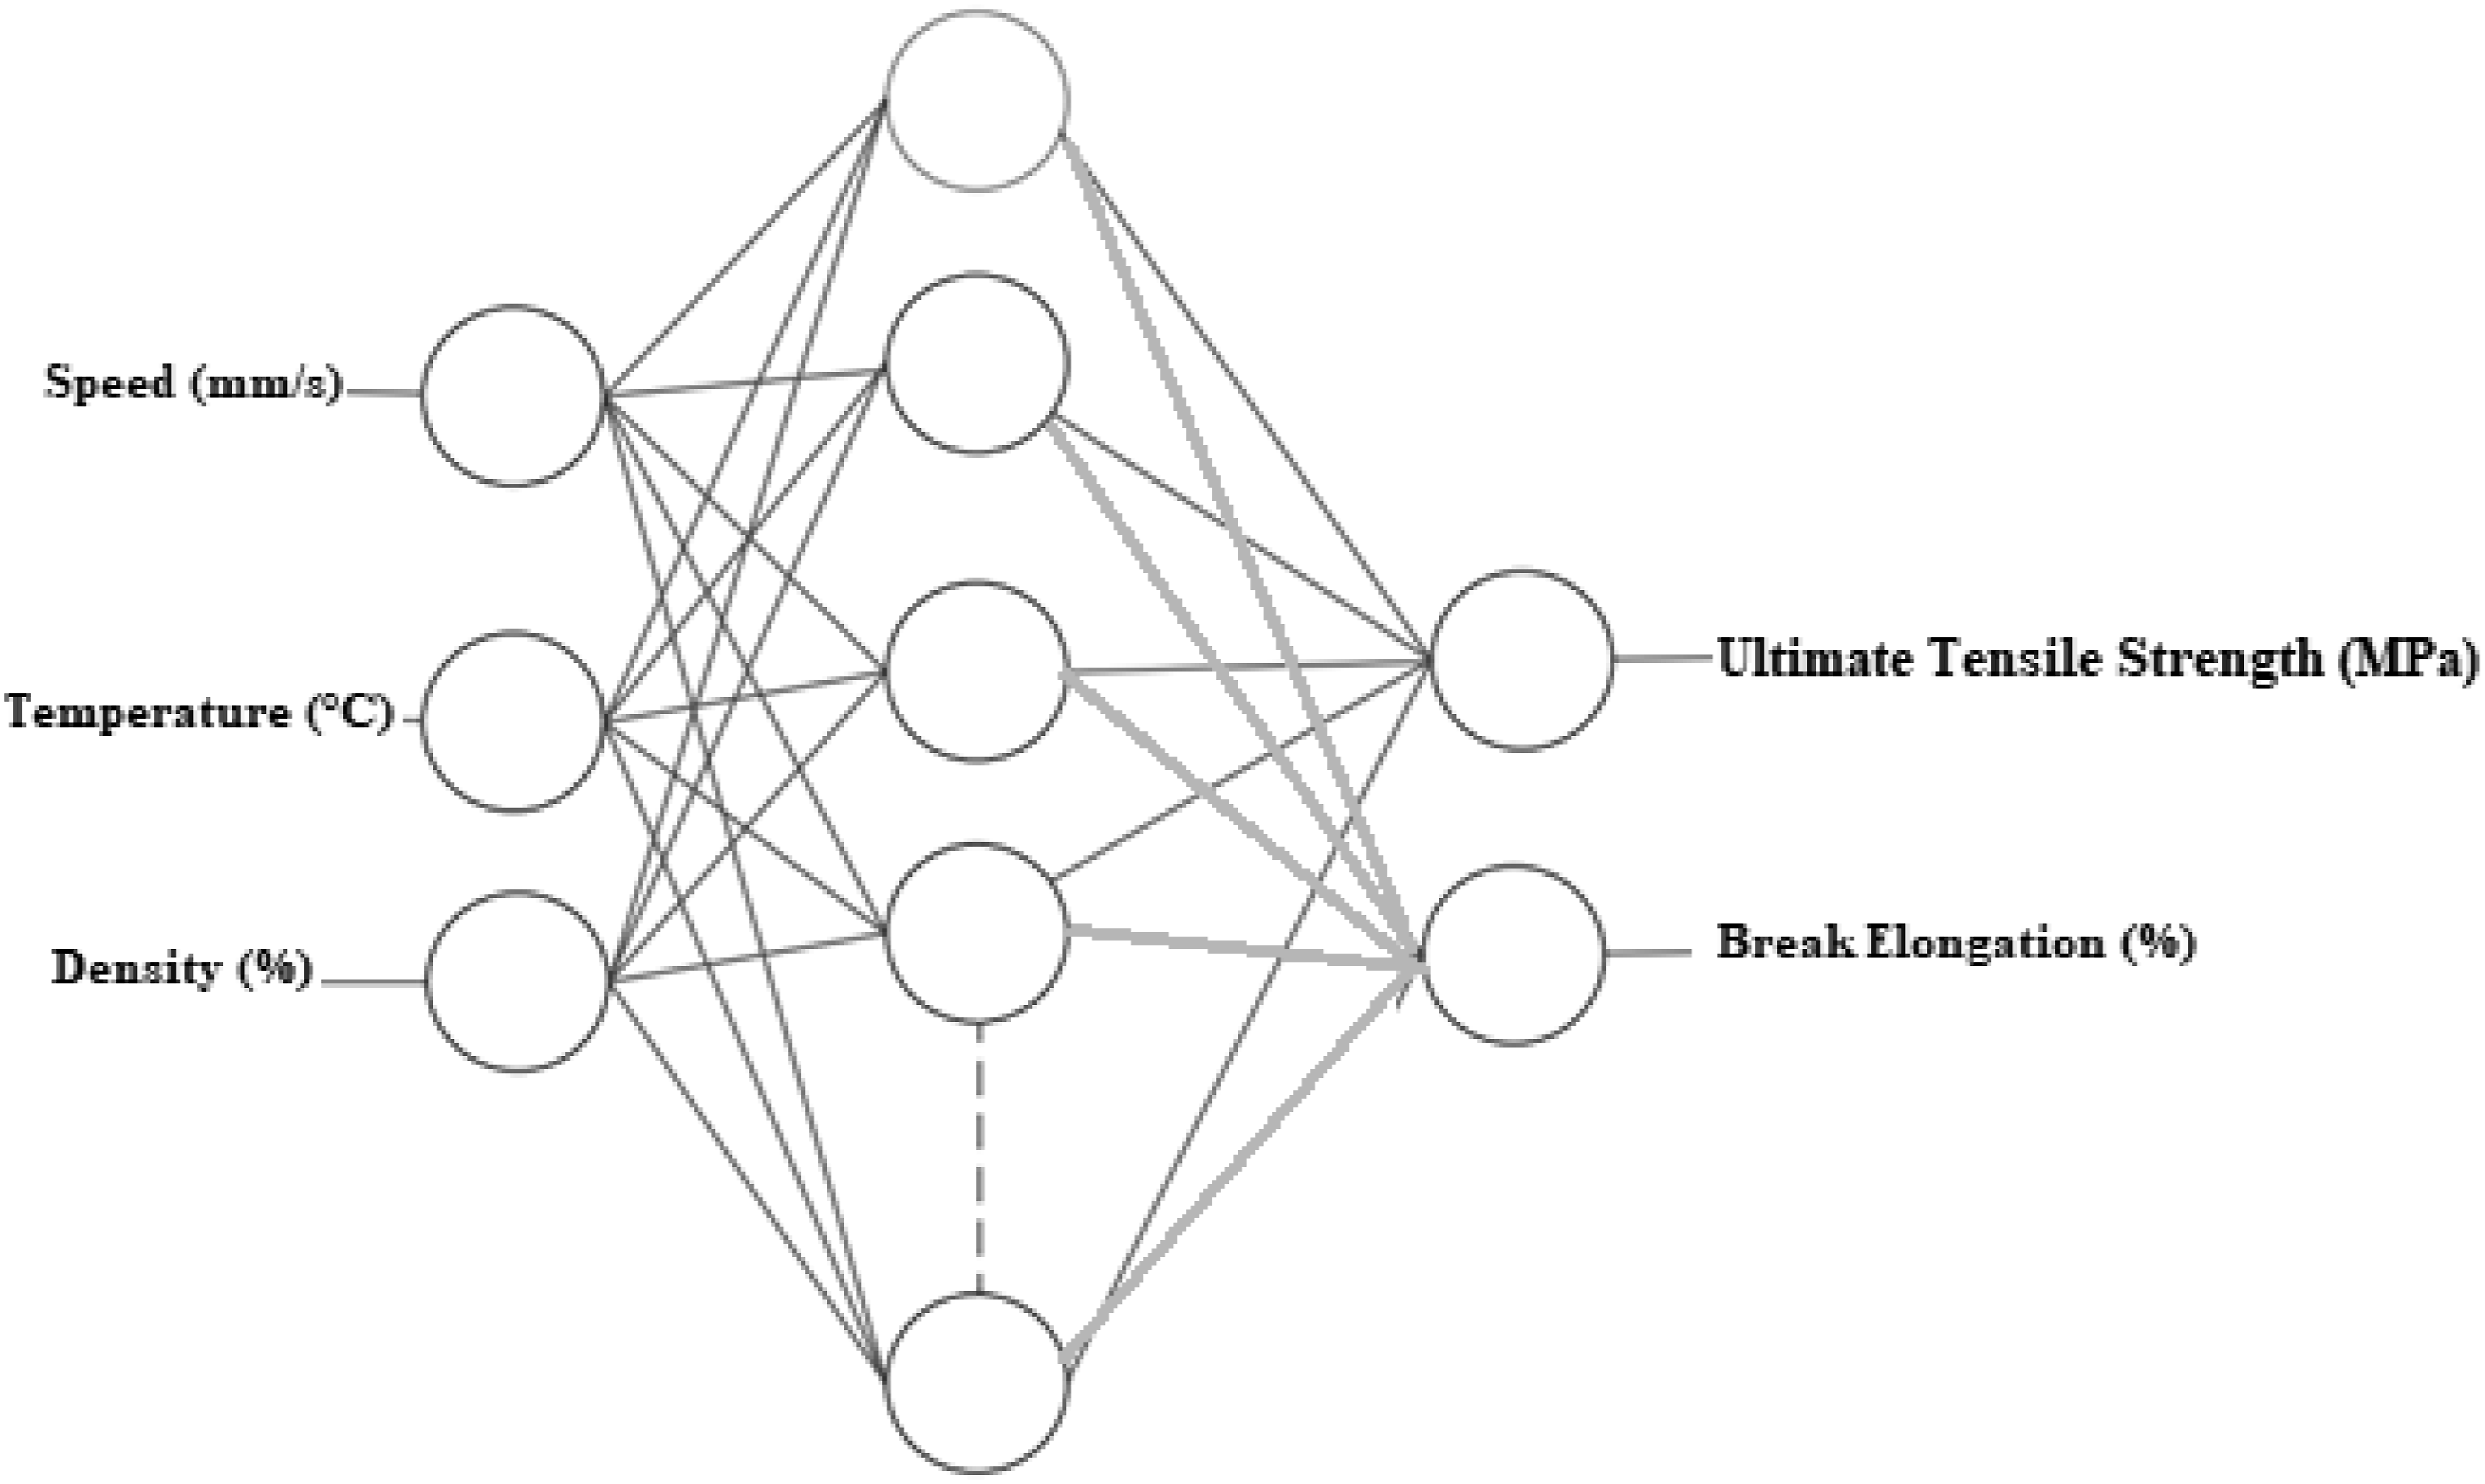
The initial number of neurons in the hidden layer was selected based on commonly used empirical guidelines and subsequently adjusted through an iterative procedure aimed at minimizing the verification error. Given the limited size of the experimental dataset. a single hidden layer with a modest number of neurons was used to avoid over-parameterization. Particular attention was paid to avoiding overfitting through cross-validation and early stopping. with the ANN employed primarily as a proof-of-concept predictive tool rather than a fully generalized machine-learning model.
Within the network. the neurons of the hidden layer compute a weighted sum of the input variables. followed by the addition of a bias term. The resulting value is then processed through a nonlinear activation function to generate the neuron output. This structure enables the ANN to approximate nonlinear relationships between the selected printing parameters and the mechanical responses of the architectured PLA–wood specimens.
The net input to a neuron m in the hidden or output layer is expressed as the weighted sum of the input signals plus a bias term: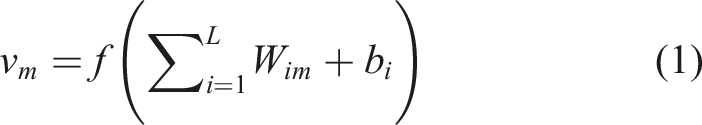
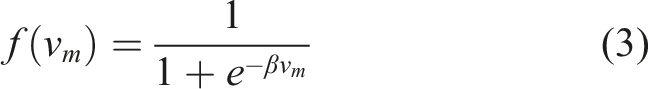
The neuron output is obtained by applying an activation function 
The performance of the ANN during the training process was evaluated using the mean squared error (MSE). defined as: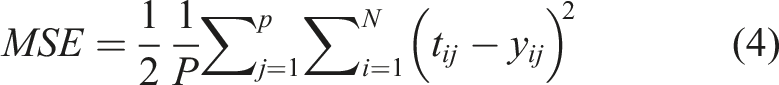
Training was performed using a gradient-based backpropagation algorithm with an initial learning rate of 0.01. 36 Given the small dataset (n = 9). a leave-one-out cross-validation strategy was adopted to limit overfitting. Training was stopped when the verification error stabilized or no further improvement was observed.
Owing to the small dataset size. the ANN is employed in this work as a proof-of-concept modeling tool integrated with a multi-criteria decision-making (MCDM) approach. Given the very limited dataset (n = 9). the predictive capability of the ANN is confined to the explored parameter space. and results should be interpreted with caution. The trained ANN was used to predict the mechanical responses (UTS and elongation at break) for different combinations of printing parameters within the investigated design space. These predicted values were subsequently used as inputs for the MCDM stage. which enables the identification of favorable printing parameter combinations based on multiple mechanical performance indicators.
The objective of this hybrid ANN–MCDM framework is to demonstrate the feasibility of coupling data-driven predictive modeling with decision-making tools to support process parameter selection in additive manufacturing. While the limited dataset restricts the generalization capability of the ANN. the approach provides useful insights into parameter influence and the trade-offs between strength and ductility in PLA–wood anti-trichiral structures.
To quantitatively evaluate the ANN performance. metrics such as the coefficient of determination (R2). the mean squared error (MSE). and comparisons between experimental and predicted values were considered. These indicators allow an objective assessment of the model’s predictive consistency within the scope of the available experimental data.
Results
Mechanical properties analysis
In this section, the stress–strain responses obtained from the tensile tests were analyzed. Although all tested specimens exhibited a qualitatively similar mechanical behavior, a representative stress–strain curve corresponding to a specimen 6 (Speed = 60 mm/s, Temperature = 220°C, Density = 5%) was selected to illustrate the general tensile response of the PLA–wood anti-trichiral structure (Figure 7). This curve is representative of the overall trends observed across the tested configurations. Experimental stress–strain curve of specimen 6 (Speed = 60 mm/s, Temperature = 220°C, Density = 5%) of the anti-trichiral structure.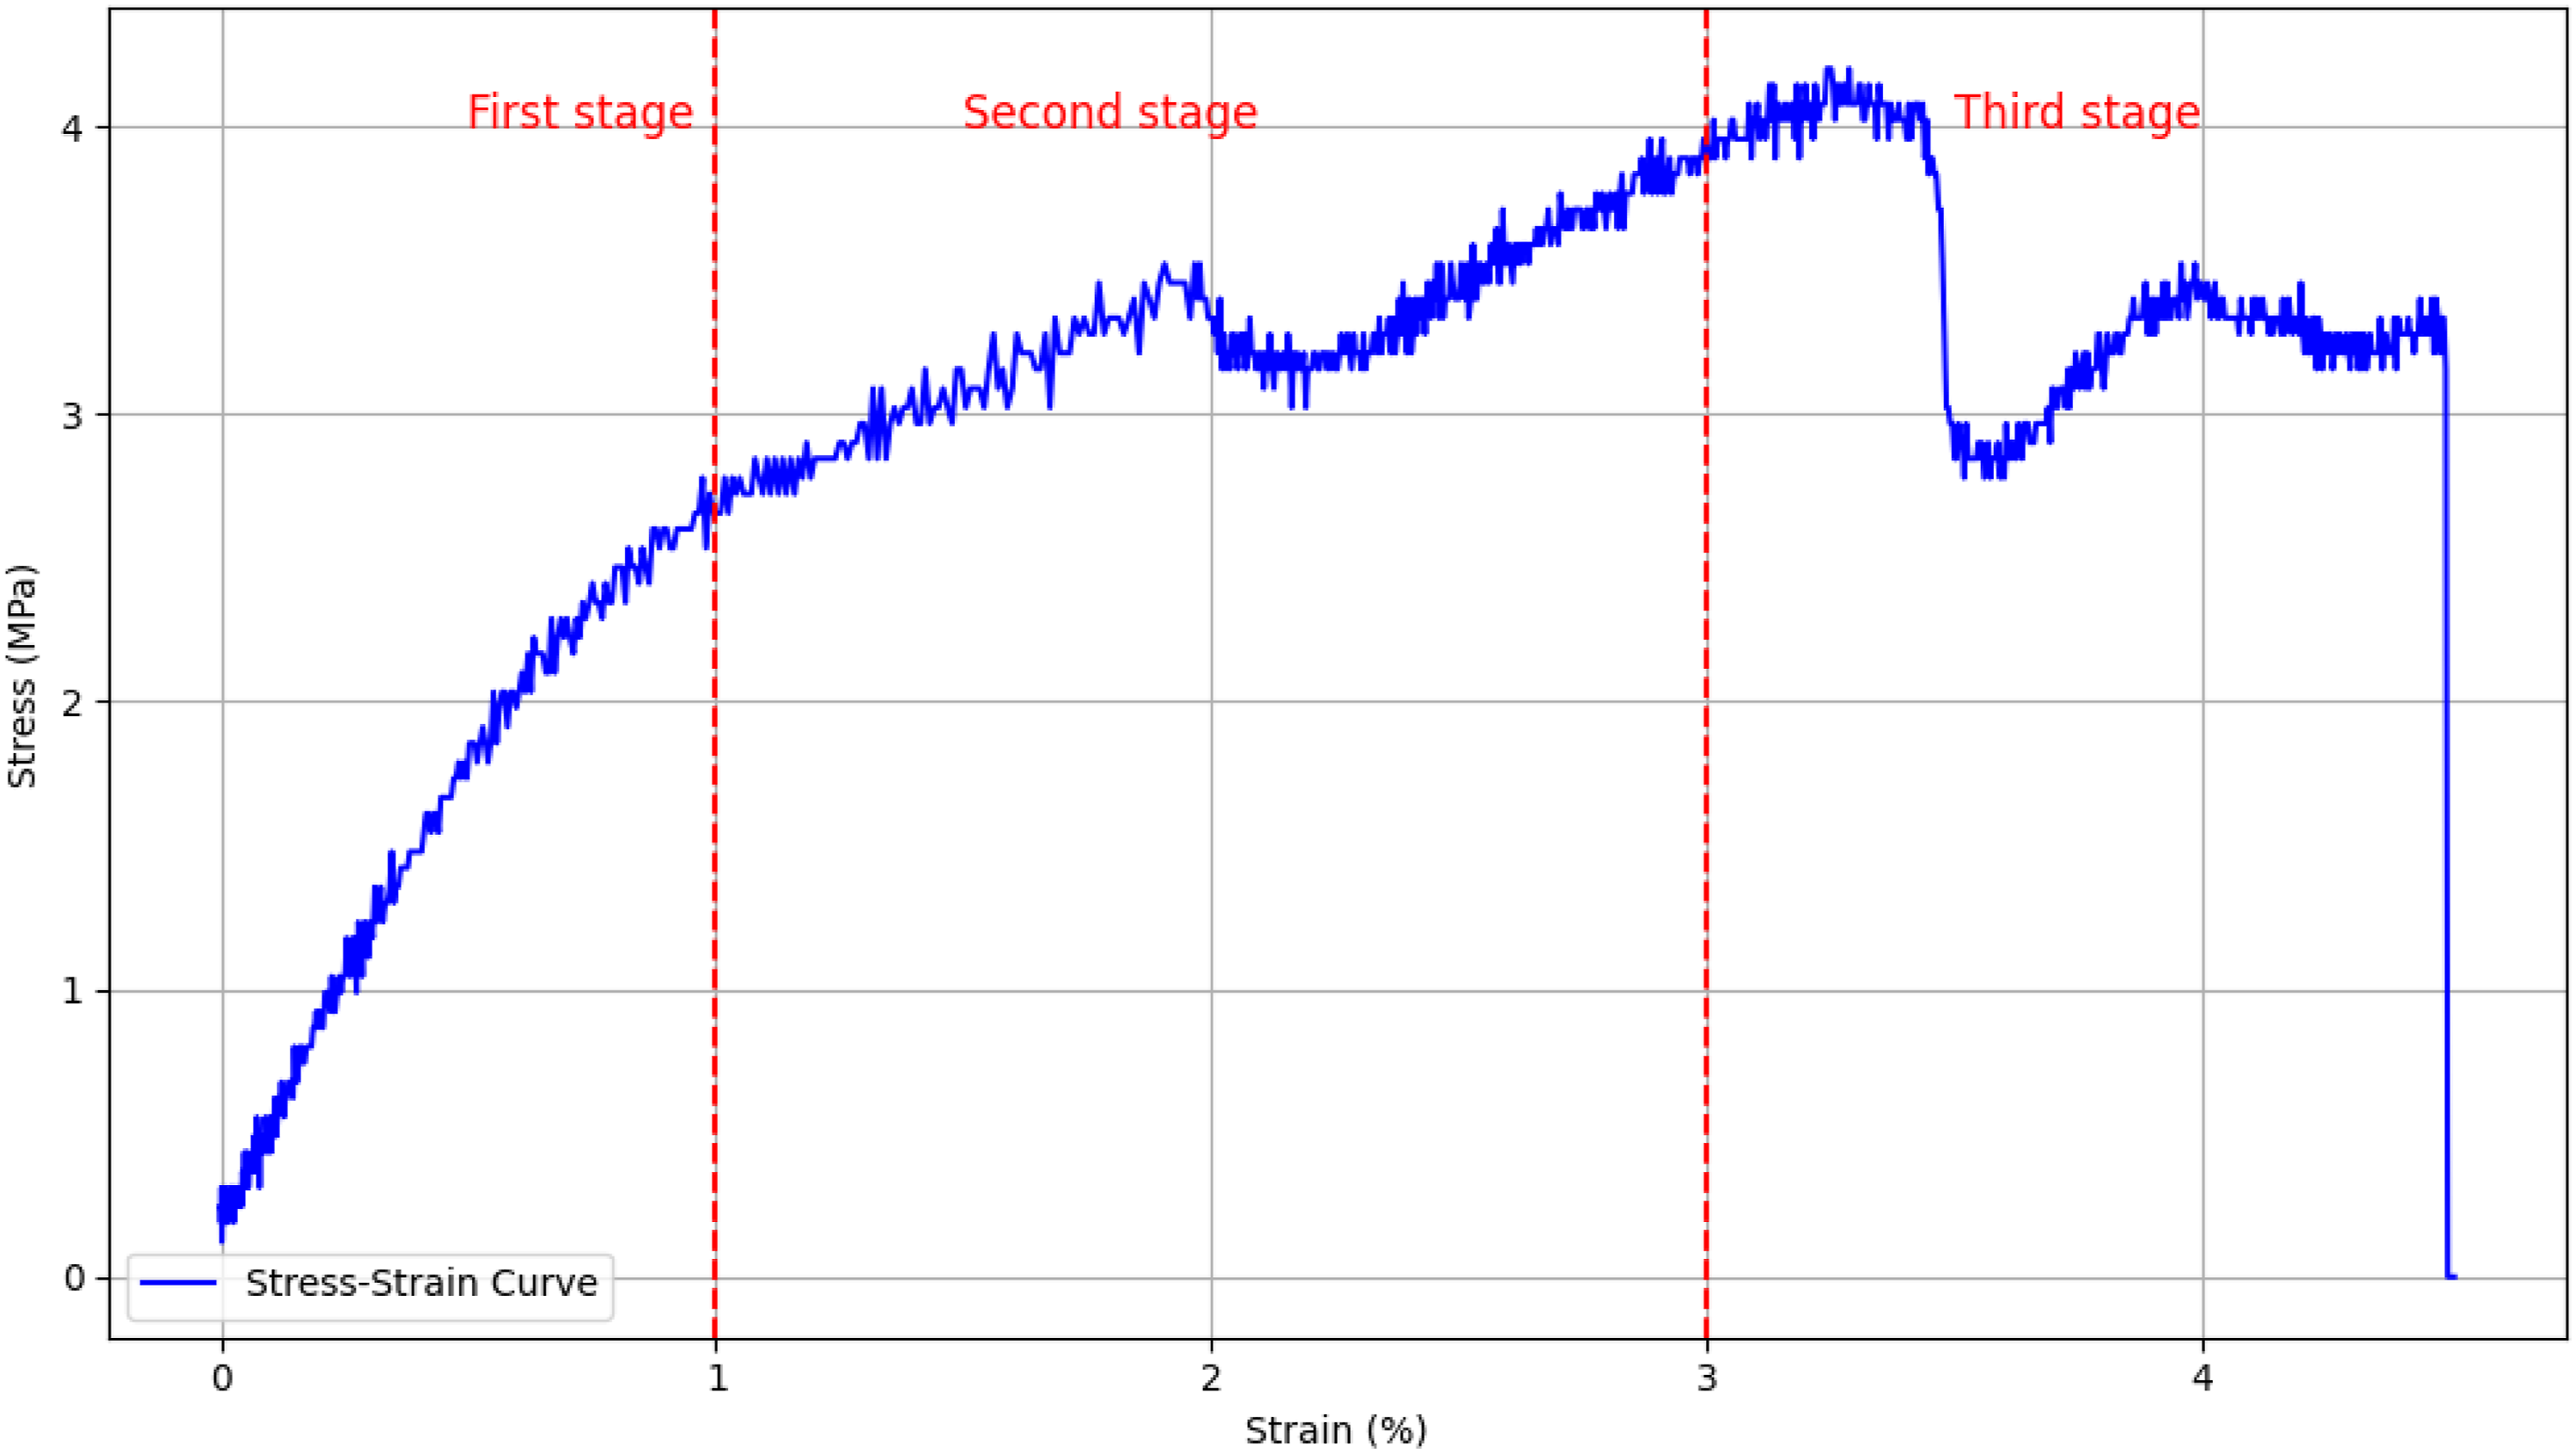
The tensile response can be divided into three characteristic deformation stages. The first stage corresponds to an initial quasi-linear elastic region, in which stress increases proportionally with strain. In this regime, the deformation is primarily reversible and dominated by elastic bending and stretching of the lattice struts, with no visible macroscopic damage to the structure.
The second stage begins with the departure from linear elastic behavior, marking the onset of non-linear deformation. Unlike metallic materials, PLA–wood composites and architectured lattice structures do not exhibit a distinct yield plateau. Instead, the stress continues to increase progressively with strain, reflecting a strain-hardening–like response typical of polymer-based materials and cellular architectures. During this stage. irreversible deformation mechanisms such as strut bending, rotation of circular nodes, and local damage initiation develop within the lattice.
In the third stage, the stress gradually decreases as failure approaches, accompanied by noticeable fluctuations in the stress–strain curve. These fluctuations are primarily attributed to the anti-trichiral geometry of the structure. Owing to its complex cellular architecture, geometrically induced stress concentration regions form within the unit cells, leading to successive local failures of individual struts or nodes. This progressive and sequential damage process gives rise to the oscillatory behavior observed in the stress–strain response. Final failure of the specimen is indicated by a sharp drop in stress, corresponding to the loss of global load-bearing capacity.
Similar stress–strain characteristics, including load fluctuations associated with progressive damage, have been reported in tensile studies of architectured and cellular polymer composites with complex geometries. 18 In such structures, the observed oscillations are intrinsic to the deformation and failure mechanisms of the lattice architecture, rather than being attributed to experimental instability.
Average tensile properties (Mean ± SD) of PLA–wood specimens for different printing conditions.
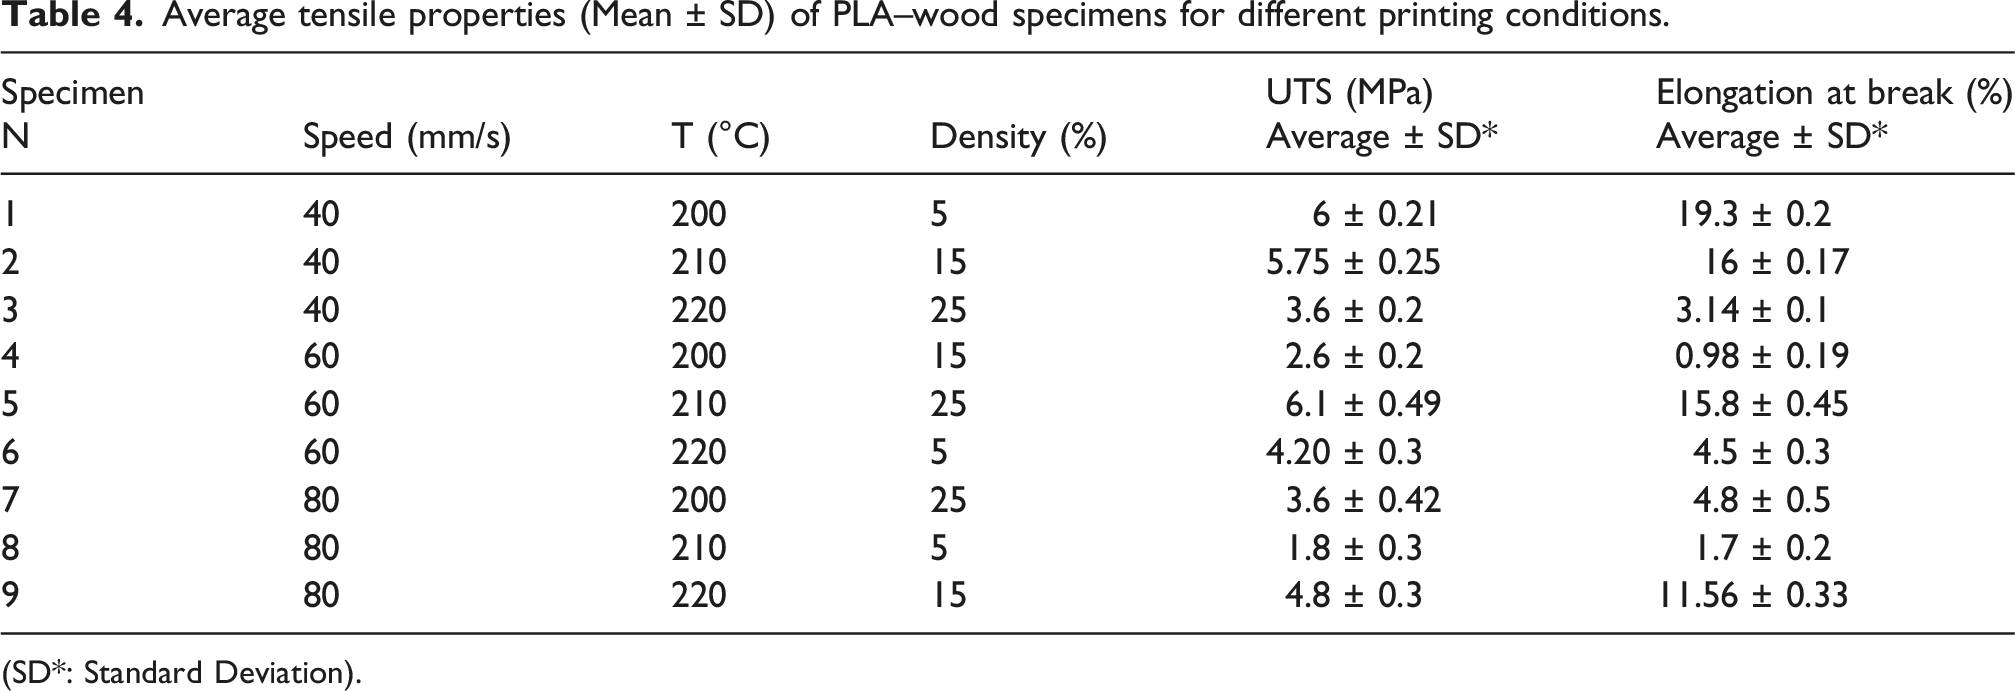
(SD*: Standard Deviation).
Among the tested configurations. specimens 1, 2, 5, and 9 exhibited comparatively higher elongation at break values than the other samples. Within the investigated parameter range. these results suggest that. at low infill densities. lower printing temperatures and printing speeds tend to promote greater ductility of the PLA–wood anti-trichiral structures. In contrast. at intermediate printing temperatures and speeds. an increase in infill density is associated with enhanced elongation at break.
At higher printing temperatures and speeds. the results indicate that a moderate infill density leads to a more balanced mechanical response. providing a compromise between tensile strength and deformation capability. These observed trends highlight the coupled influence of printing parameters and lattice architecture on the tensile behavior of the investigated structures.
From Table 4 variation curves and histograms of UTS and elongation at break were constructed for all specimens. These graphical representations highlight substantial variations in both parameters as a function of the printing process settings. The maximum measured values were 6.1 MPa for UTS and 19.3% for elongation at break (Figure 8). Variation histogram of: (a) UTS (b) break elongation acr oss all specimens.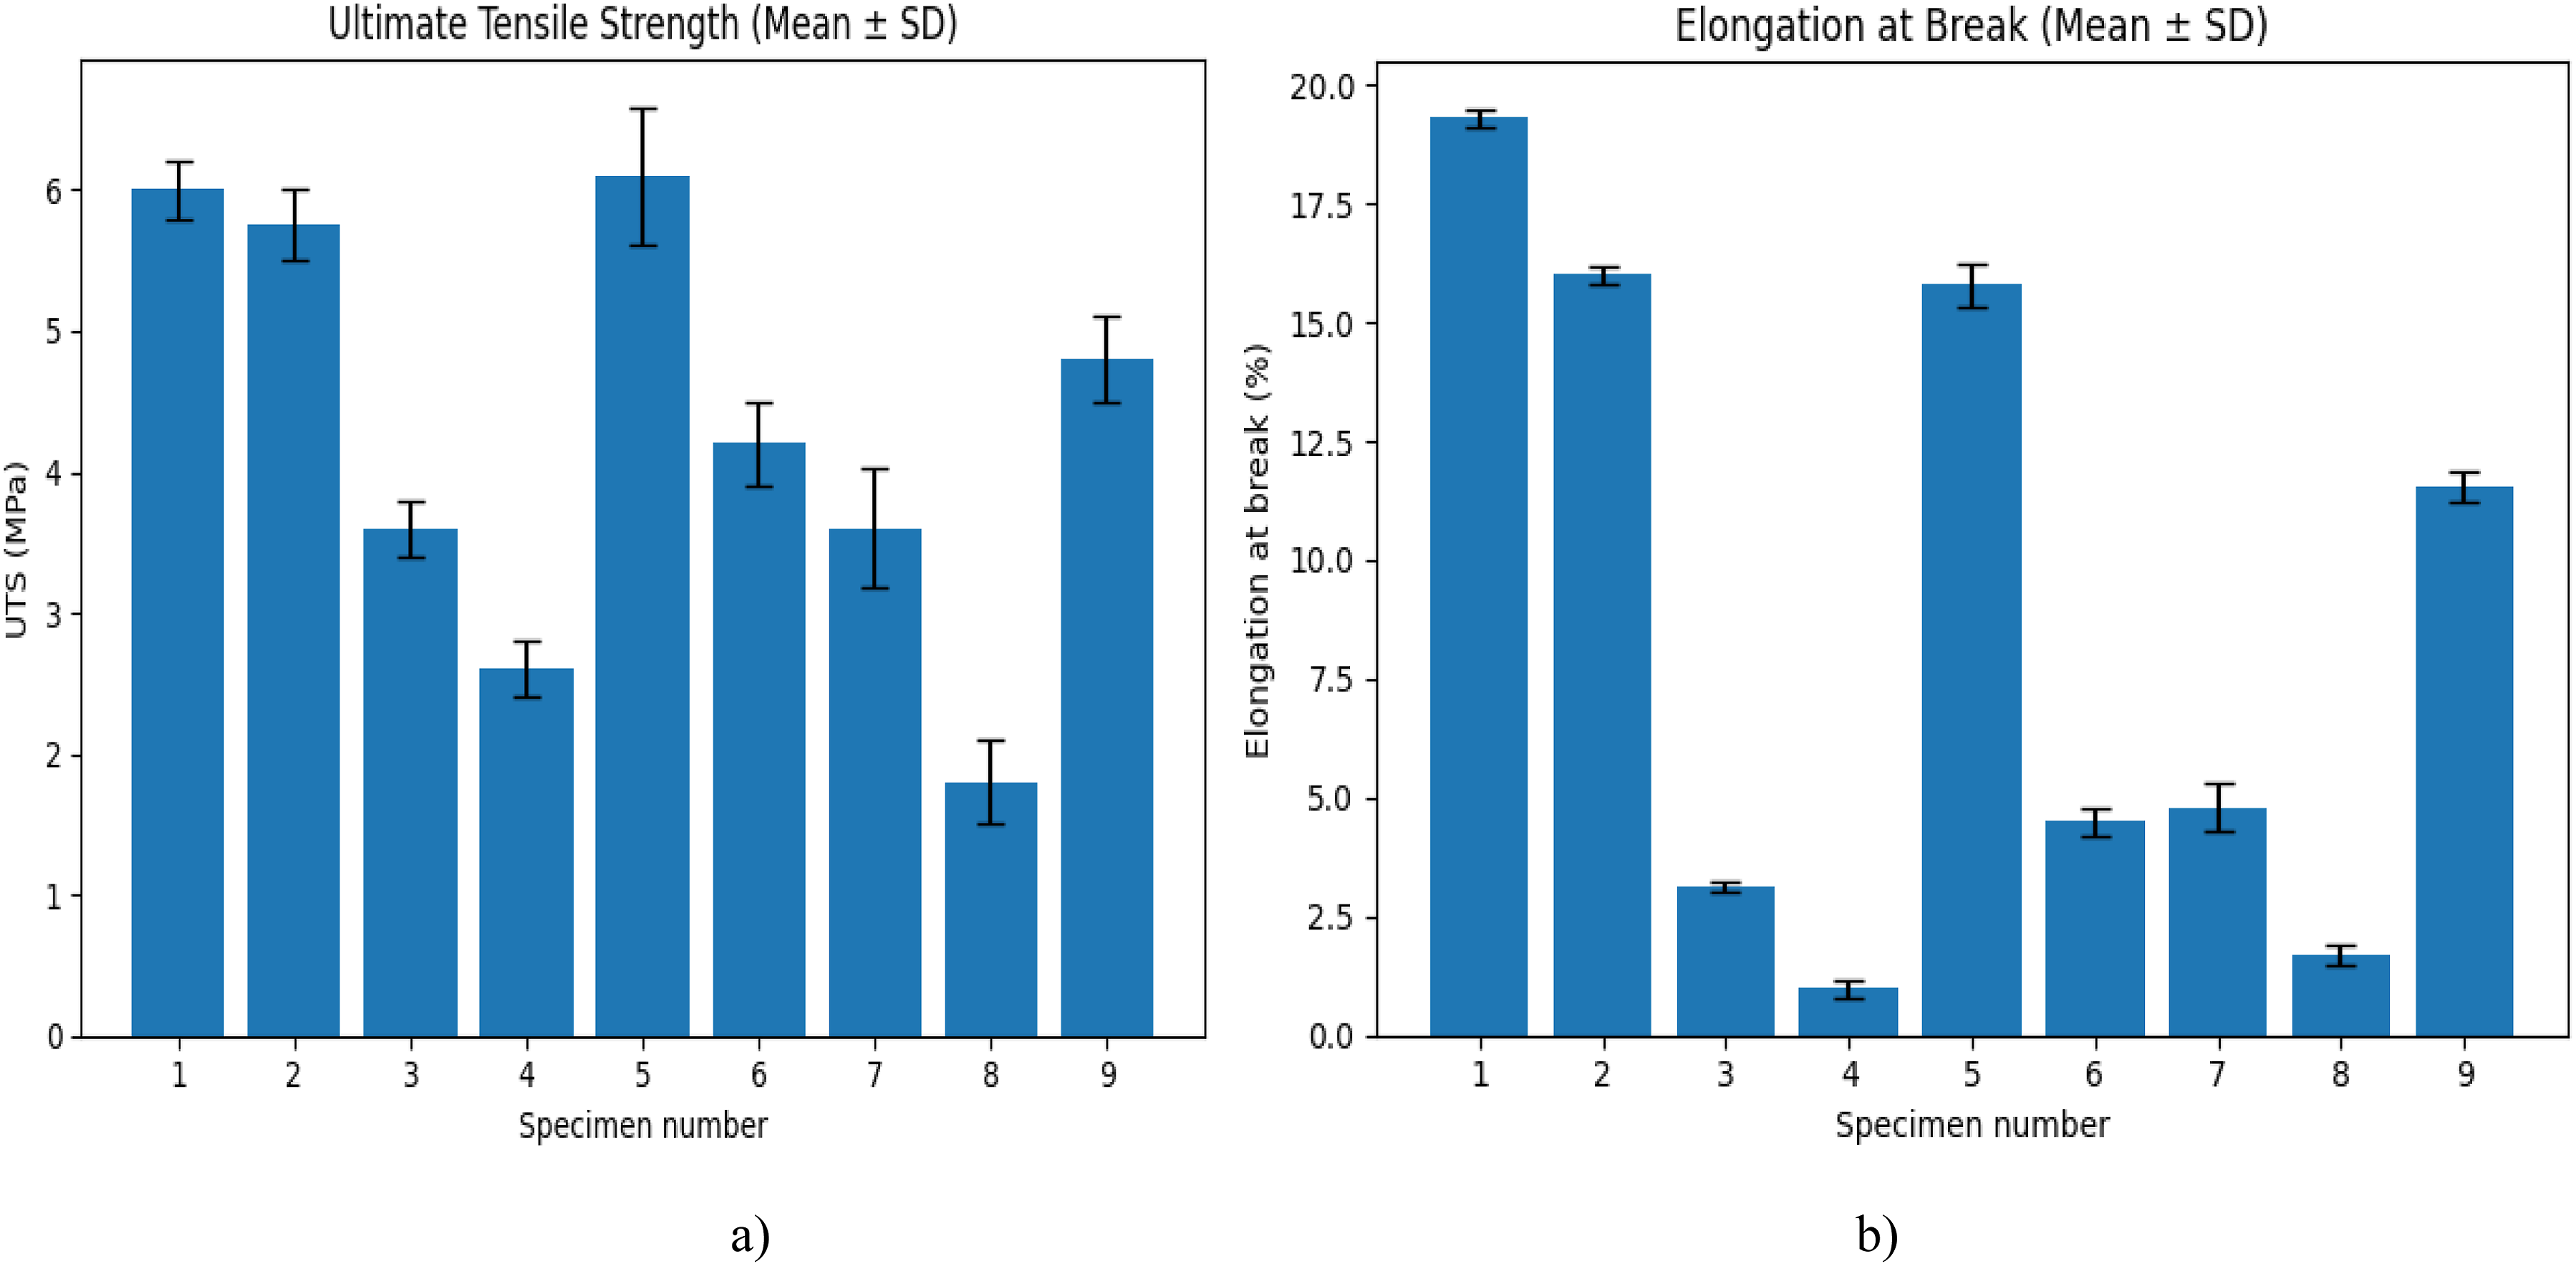
The measured UTS of the PLA–wood anti-trichiral lattice specimens in this study ranges from 1.8 to 6.1 MPa. These values are significantly lower than those reported for standard, non-lattice 3D-printed PLA/wood composites in the literature. For example, 6 reported experimental tensile strength values ranging from approximately 11.7 to 24.3 MPa for solid PLA/wood specimens fabricated by fused deposition modeling and tested according to ISO 527. The pronounced reduction in UTS observed in the present work is primarily attributed to the porous anti-trichiral lattice architecture, which reduces the effective load-bearing cross-section and introduces geometrically induced stress concentration regions within the unit cells. Despite the lower absolute strength, such architectured structures offer advantages in terms of weight reduction, material efficiency, and enhanced deformation capability, making them suitable for lightweight and energy-absorbing applications.
The results obtained in this study are consistent with previous works on PLA.37,38 which indicate that increasing density generally improves UTS. although its impact on elongation is not always clearly established. Conversely. when the printing speed increases. the tensile strength tends to decrease. However. slower printing speeds typically enhance ductility. as they allow greater molecular relaxation and improved interlayer bonding. Therefore. a moderate density and controlled printing speed are recommended to balance both strength and flexibility of the printed part.
These results can be explained by the fact that a low density may lead to a porous. less cohesive structure with lower mechanical strength. while a very high density can restrict deformation. making the material stiffer and more brittle. As for printing speed. higher speeds may cause insufficient interlayer fusion. resulting in internal defects that reduce strength. whereas slower speeds promote better adhesion and bonding between layers. enhancing overall tensile performance.
Process parameter analysis and optimization
Effect of printing parameters on tensile behavior
To better understand how the printing parameters influence the tensile properties of PLA–wood composites, both interaction and main effects plots were analyzed (Figures 9 and 10). The interaction plots reveal that printing speed, infill density, and extrusion temperature are not independent; the effect of each parameter varies according to the others. This observation is consistent with the ANOVA results, which indicate significant two-factor interactions. Interaction plots showing the combined effects of printing speed, infill density, and extrusion temperature on (a) UTS and (b) Elongation at break. The non-parallel and intersecting lines indicate significant interactions among the studied parameters. implying that the influence of one factor depends on the levels of the others. Main effects plots for (a) UTS and (b) elongation at break. The slope of each curve represents the relative influence of the corresponding parameter. Printing speed exhibits the most pronounced effect. followed by extrusion temperature. while infill density shows a smaller but non-negligible contribution.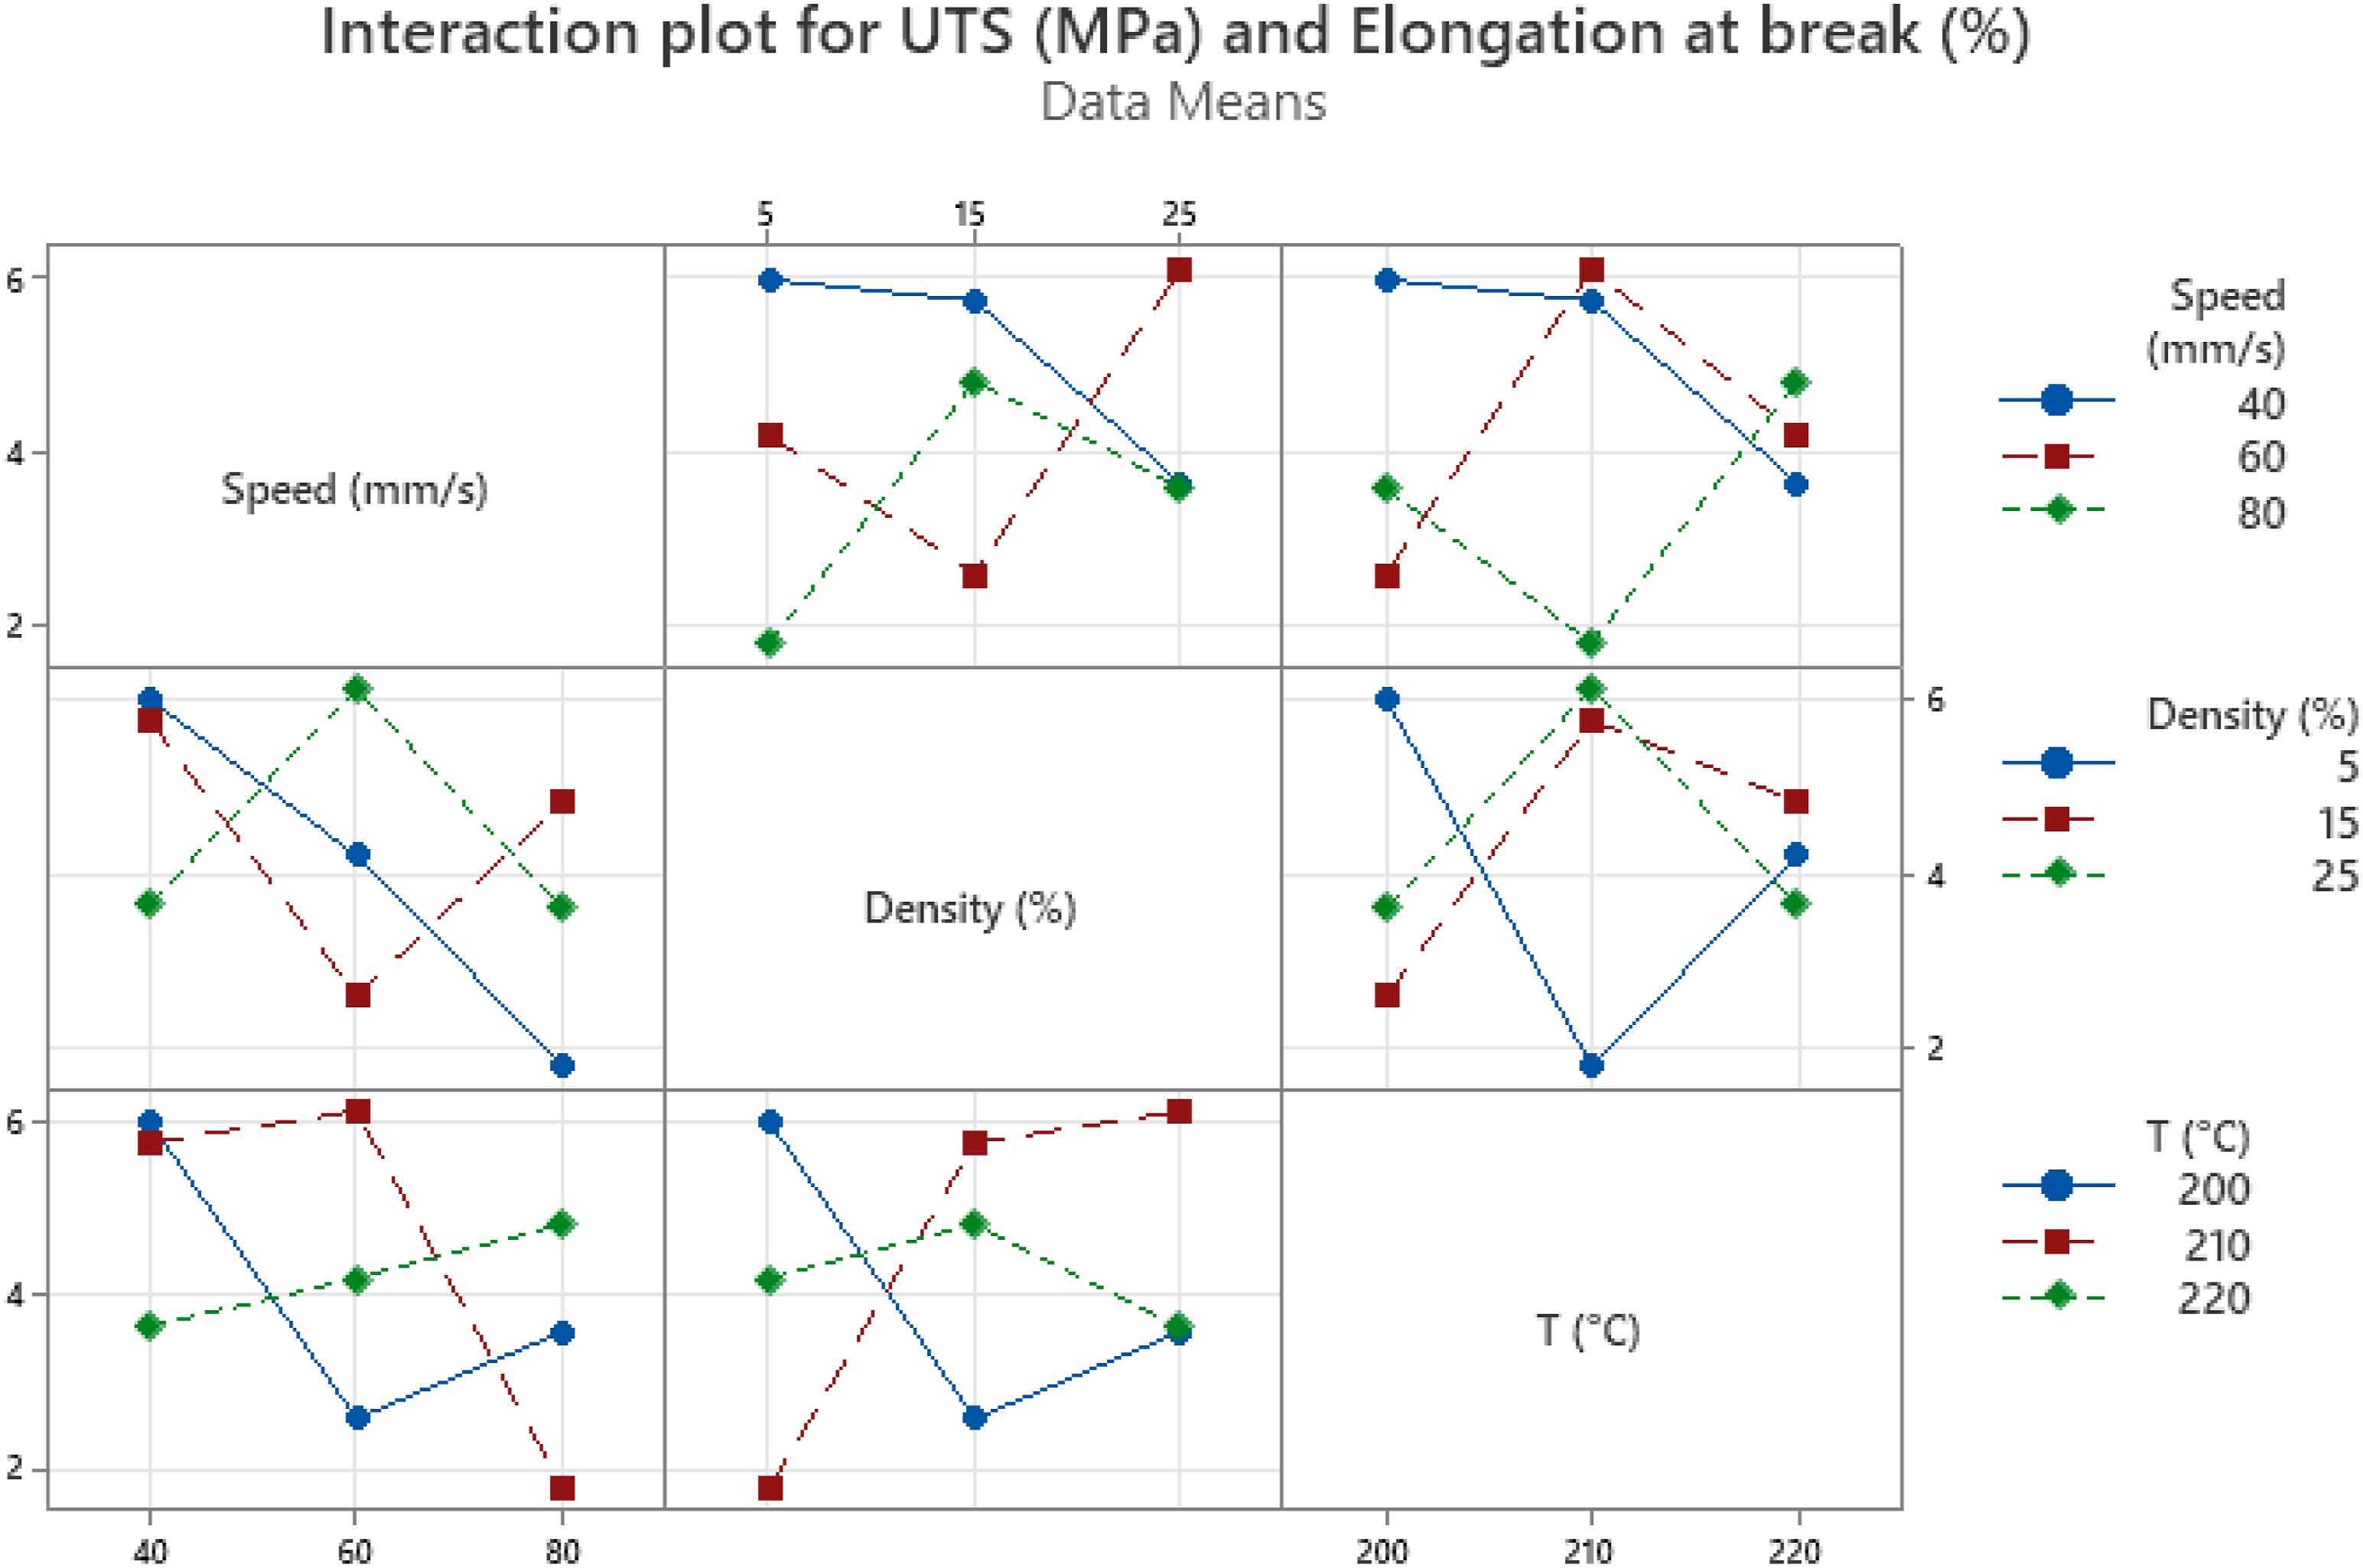
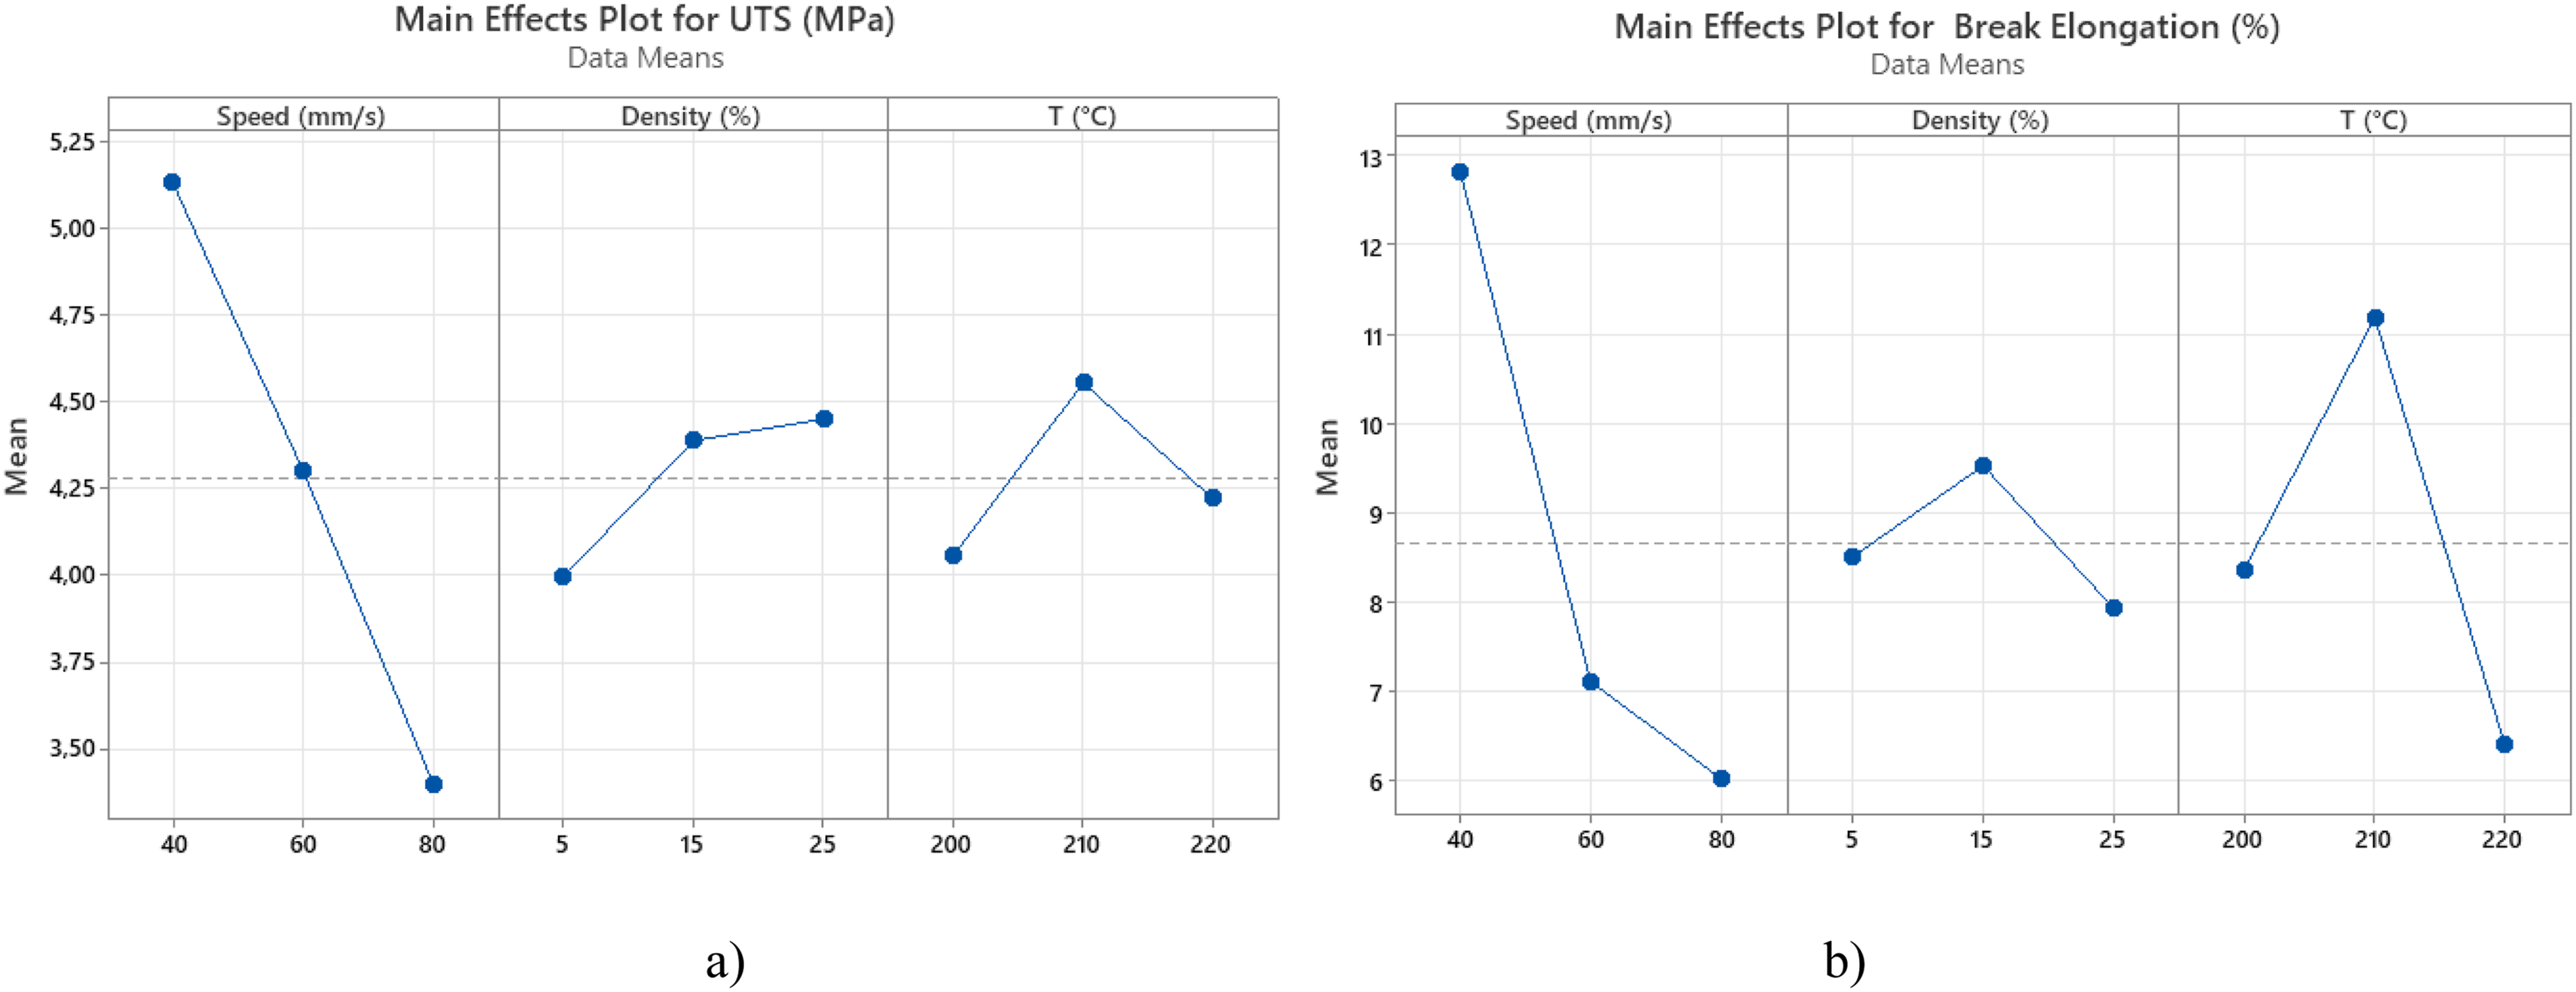
The results confirm that printing speed exerts the strongest influence on both UTS and elongation at break. Increasing the speed from 40 to 80 mm/s significantly reduces tensile performance due to insufficient interlayer bonding. Extrusion temperature shows a non-linear effect, with an optimum around 210°C, beyond which material degradation and poor fusion decrease strength and ductility. Infill density has a smaller individual effect but becomes significant through its interaction with speed and temperature. At low speeds, higher densities improve tensile properties, while at high speeds this trend is reversed. 21 These combined effects highlight that the mechanical performance results from a complex interplay between deposition rate, heat transfer, and material consolidation.
For UTS (Figure 10(a)), printing speed shows the most pronounced negative slope: increasing speed from 40 to 80 mm/s causes a clear reduction in tensile strength due to weaker interlayer bonding. Extrusion temperature presents a non-linear behavior, with a maximum UTS observed near 210°C. corresponding to optimal interlayer fusion before thermal degradation occurs at higher temperatures. Infill density shows a moderate positive effect — higher densities lead to slightly higher UTS values because of reduced internal porosity.
For elongation at break (Figure 10(b)). temperature again exhibits a non-linear trend. with the highest ductility near 210°C. while both excessive heat (≥220°C) and high printing speed (>70 mm/s) reduce elongation due to stiffer layers and insufficient bonding time. In contrast. infill density has a negligible or slightly negative effect on elongation. suggesting that higher densities restrict deformation and reduce flexibility of the printed parts.
Optimization
To find the optimal combination of parameters. we generated 2D contours (Figure 11) representing UTS and elongation at break as functions of speed. temperature. and density. These plots visualize how these variables interact with mechanical properties. identifying regions marked in red where UTS and elongation at break values are maximal. To achieve high UTS and maximum break elongation. it is advisable to use low density. low printing speed. and moderate temperature. While there are several possible combinations. for example. a speed of 40 mm/s. density of 5%. and temperature of 210°C should offer optimal performance in terms of UTS and elongation. Another combination can be identified is speed of 70 mm/s. density of 25%. and temperature of 200°C which can generate the highest UTS and elongation at break. Contour plot of UTS and elongation at break VS Speed. Temperature and Density.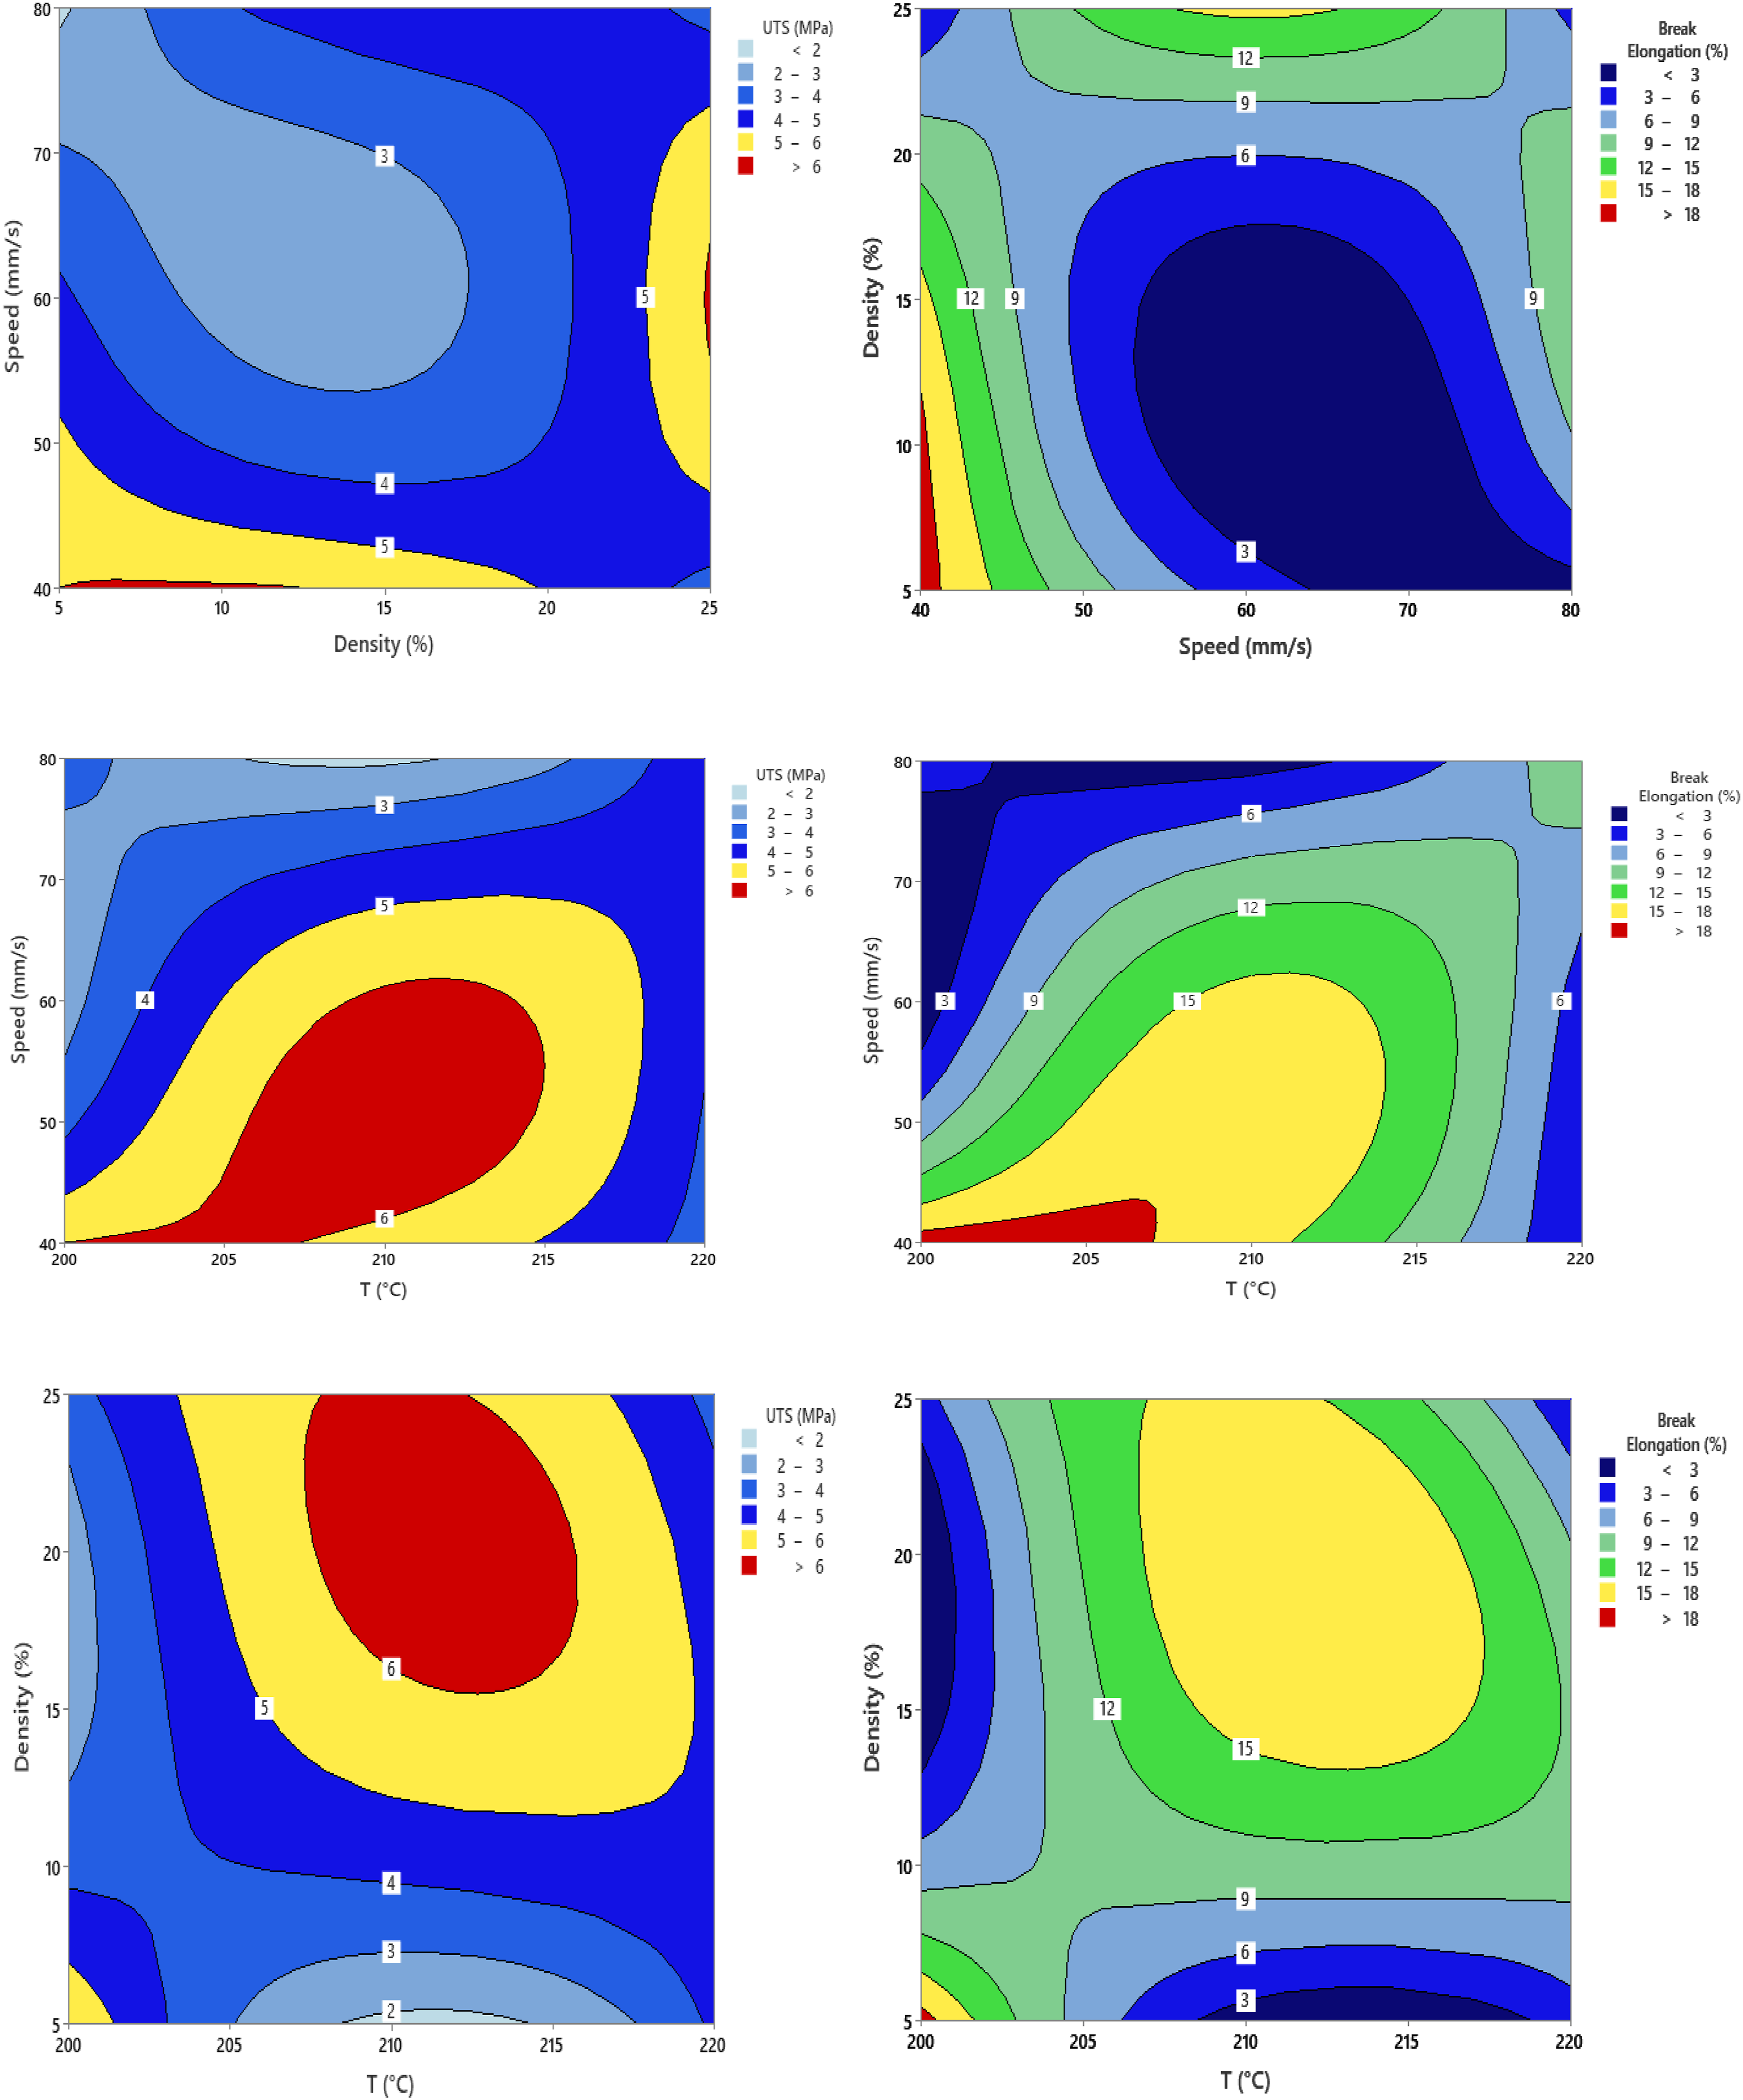
Before manufacturing a specimen with these parameters. it is recommended to test these properties using an artificial neural network. which will accurately predict these characteristics. After that. this ANN model will be combined with Multi-Criteria Decision-Making Methods. such as Grey Relational Analysis (GRA) and Technique for Order Preference by Similarity to Ideal Solution (TOPSIS) to determine the optimal combination of 3D printer parameters [39].
ANN prediction accuracy
Training results
Table 4 served as the dataset for training the neural networks. Several neural network architectures were tested. each with varying numbers of neurons in the hidden layer. and their performance was evaluated using mean squared error (MSE). The network calculated the weighted connections to minimize the overall mean squared error (equation (4)) between its predicted and target outputs. The optimal architecture for the developed ANN model was determined to be 3-14-2 neurons (Figure 6). The ANN’s best predictions for UTS and elongation at break are shown in Figure 12. where the overlapping curves illustrate the network’s predictive accuracy. The validation curve achieves optimal validation performance with a mean squared error (MSE) of 10−7 at 20.000 epochs. Figure 12 displays the linear regression coefficients for the training. validation. and testing phases during the network’s learning process. The R-plots depict the regression analysis and the correlation between the target values and the ANN’s actual outputs. The resulting correlation coefficient (R) is 1. with a minimal mean squared error (MSE). highlighting the effectiveness of the constructed ANN model. Although the training set achieved a perfect correlation coefficient (R2 = 1) and minimal MSE, these metrics only reflect the ANN’s ability to fit the training data and do not indicate generalization to new, unseen parameter combinations. Comparison of Experimental versus ANN Predicted UTS and Break Elongation with Linear Regression Analysis.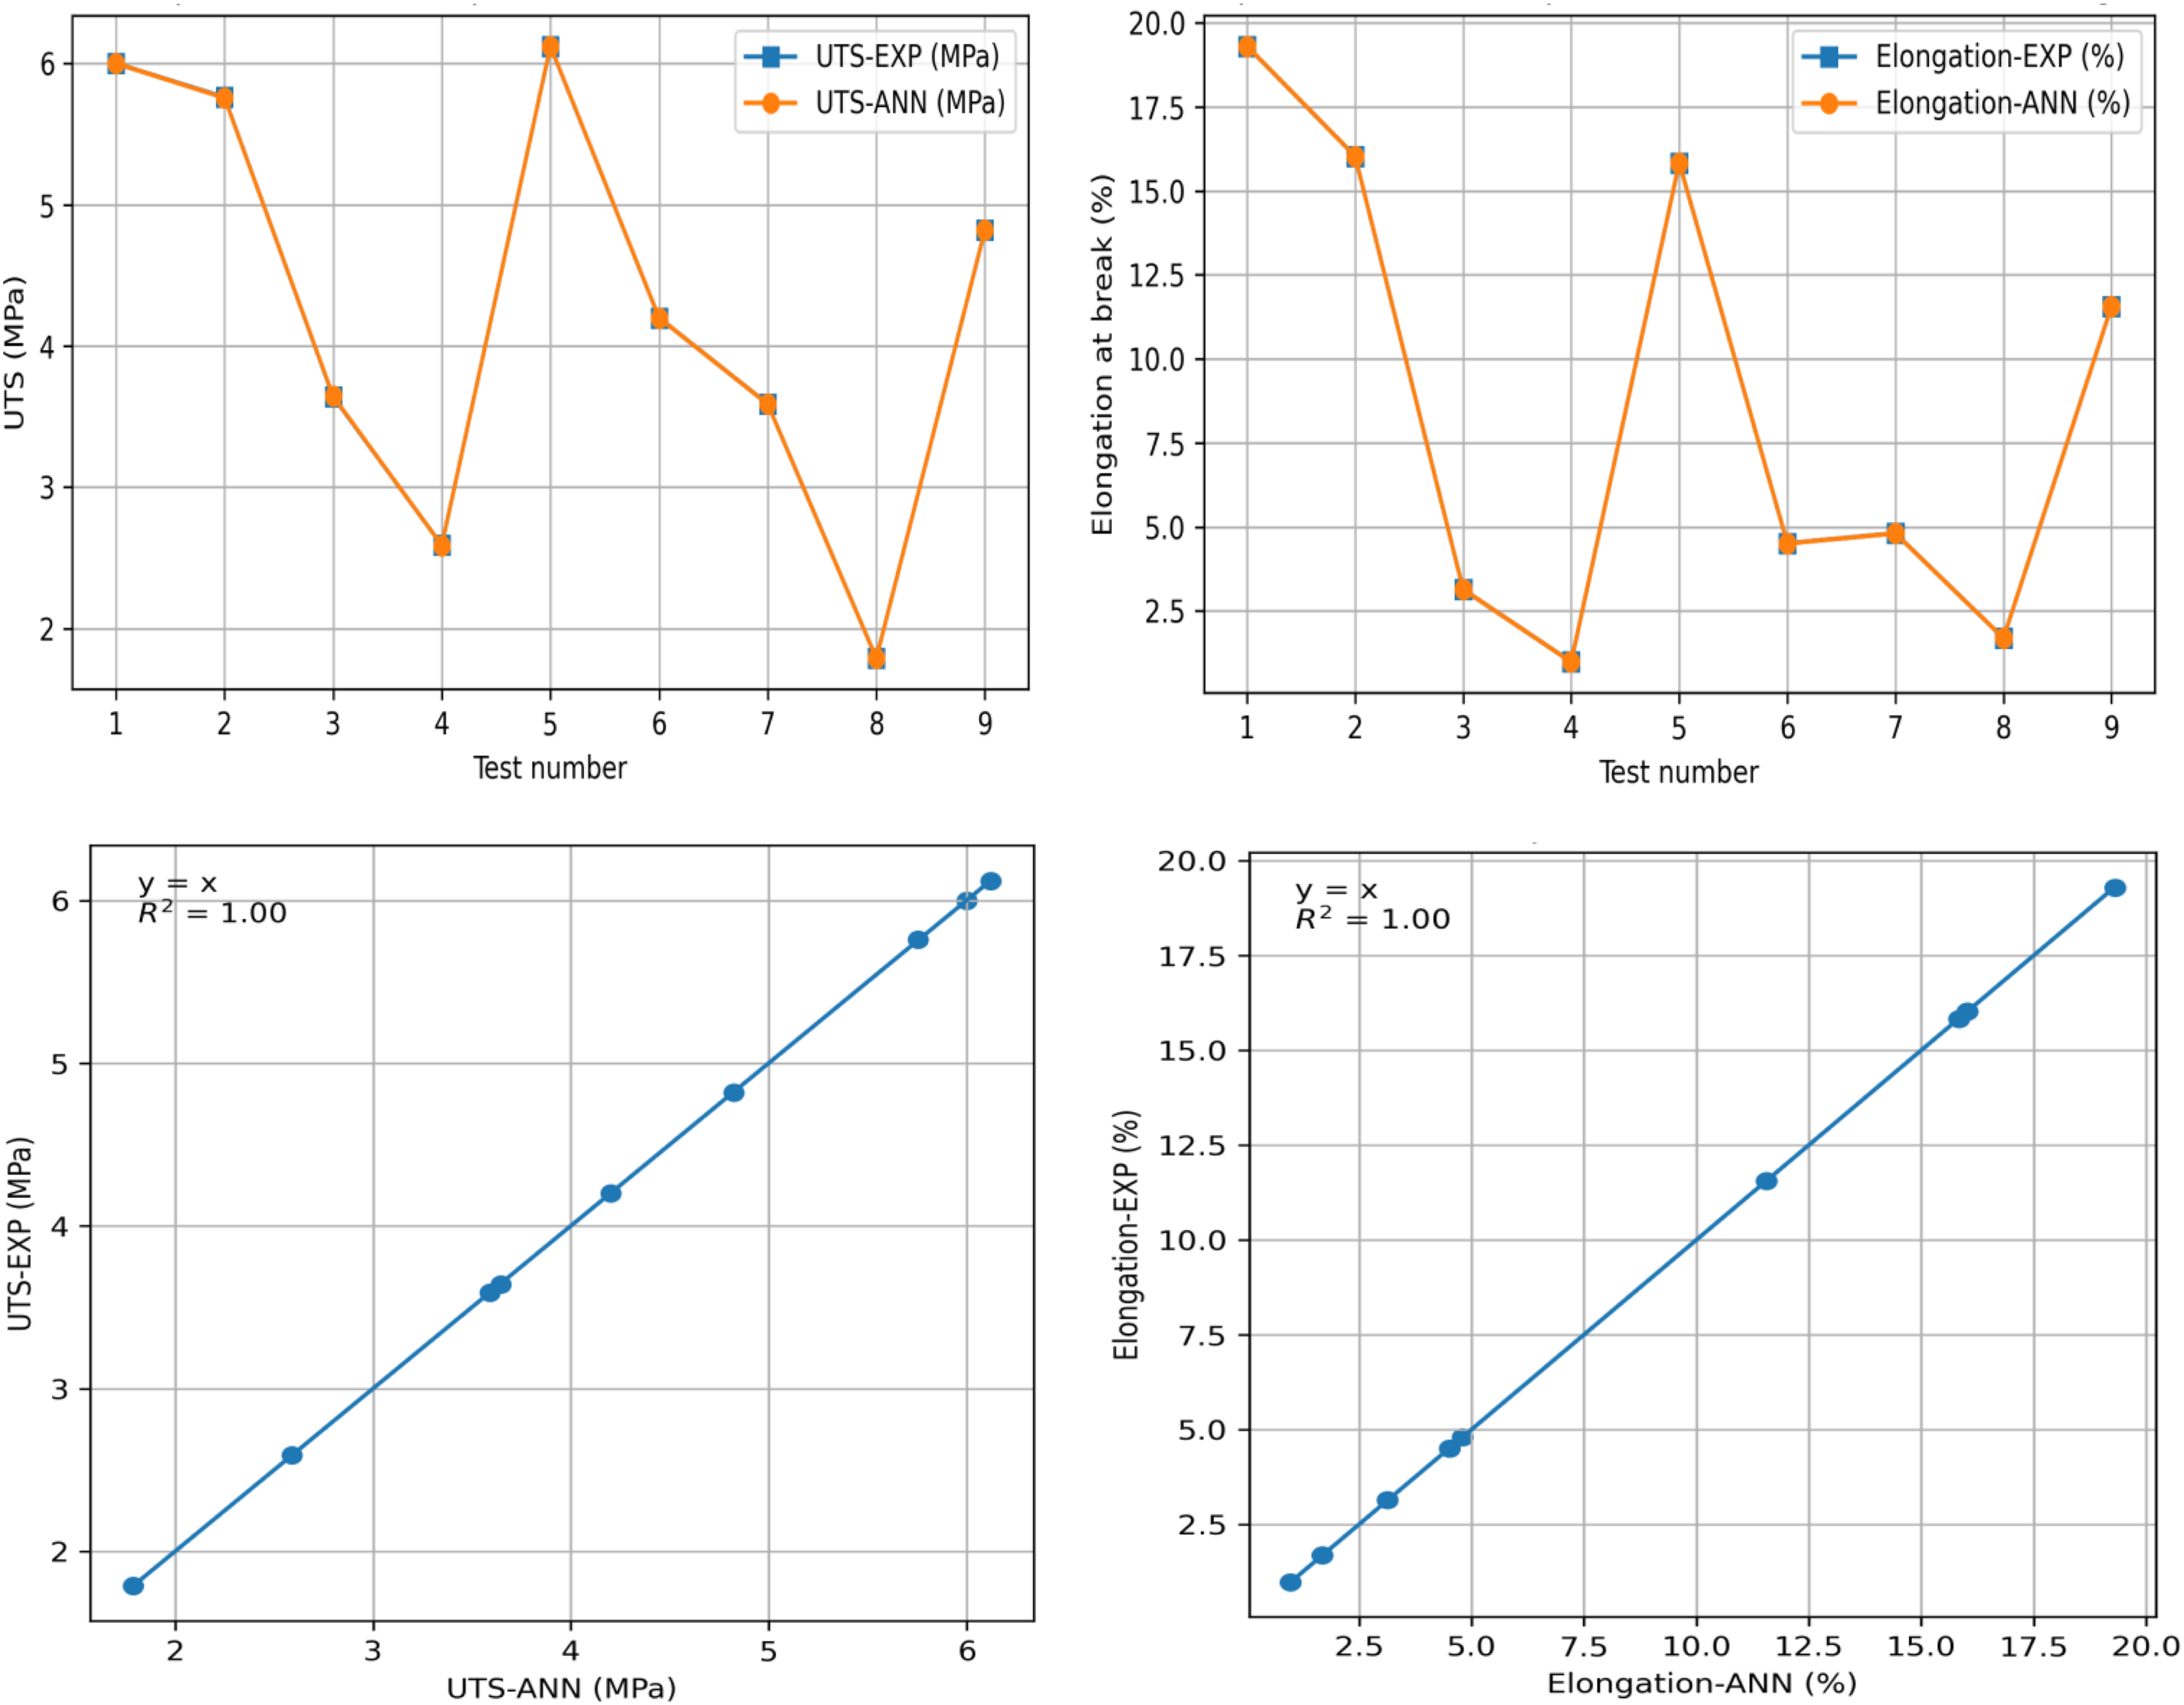
Validation results (ANN results)
Process parameters used for ANN Validation Set.
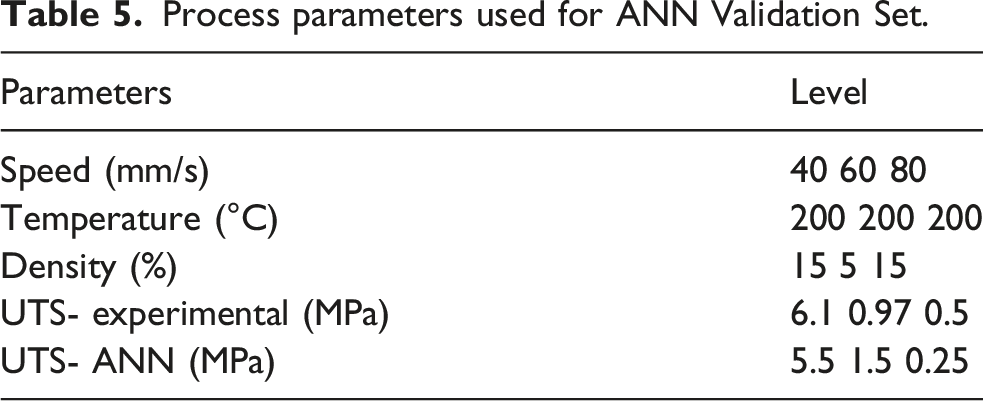
The predicted UTS values from the ANN were then compared with the experimental measurements. Figure 13 presents a scatter plot of predicted versus experimental UTS values for these validation samples, showing good agreement and confirming the predictive accuracy of the model. Despite the limited number of validation samples, this approach provides a representative evaluation of the ANN’s ability to predict tensile strength for previously unseen combinations of process parameters. The performance metrics of the ANN model, including MAE, RMSE, and R2, are summarized in Table 6. The low errors and high R2 values indicate that the model accurately captures the relationship between process parameters and tensile strength. Scatter plot of ANN-predicted versus experimental UTS values for three validation samples, including the regression line (y = x), illustrating predictive accuracy. Performance metrics of the ANN model for tensile strength prediction. MAE: Mean Absolute Error; RMSE: Root Mean Square Error; R2: coefficient of determination.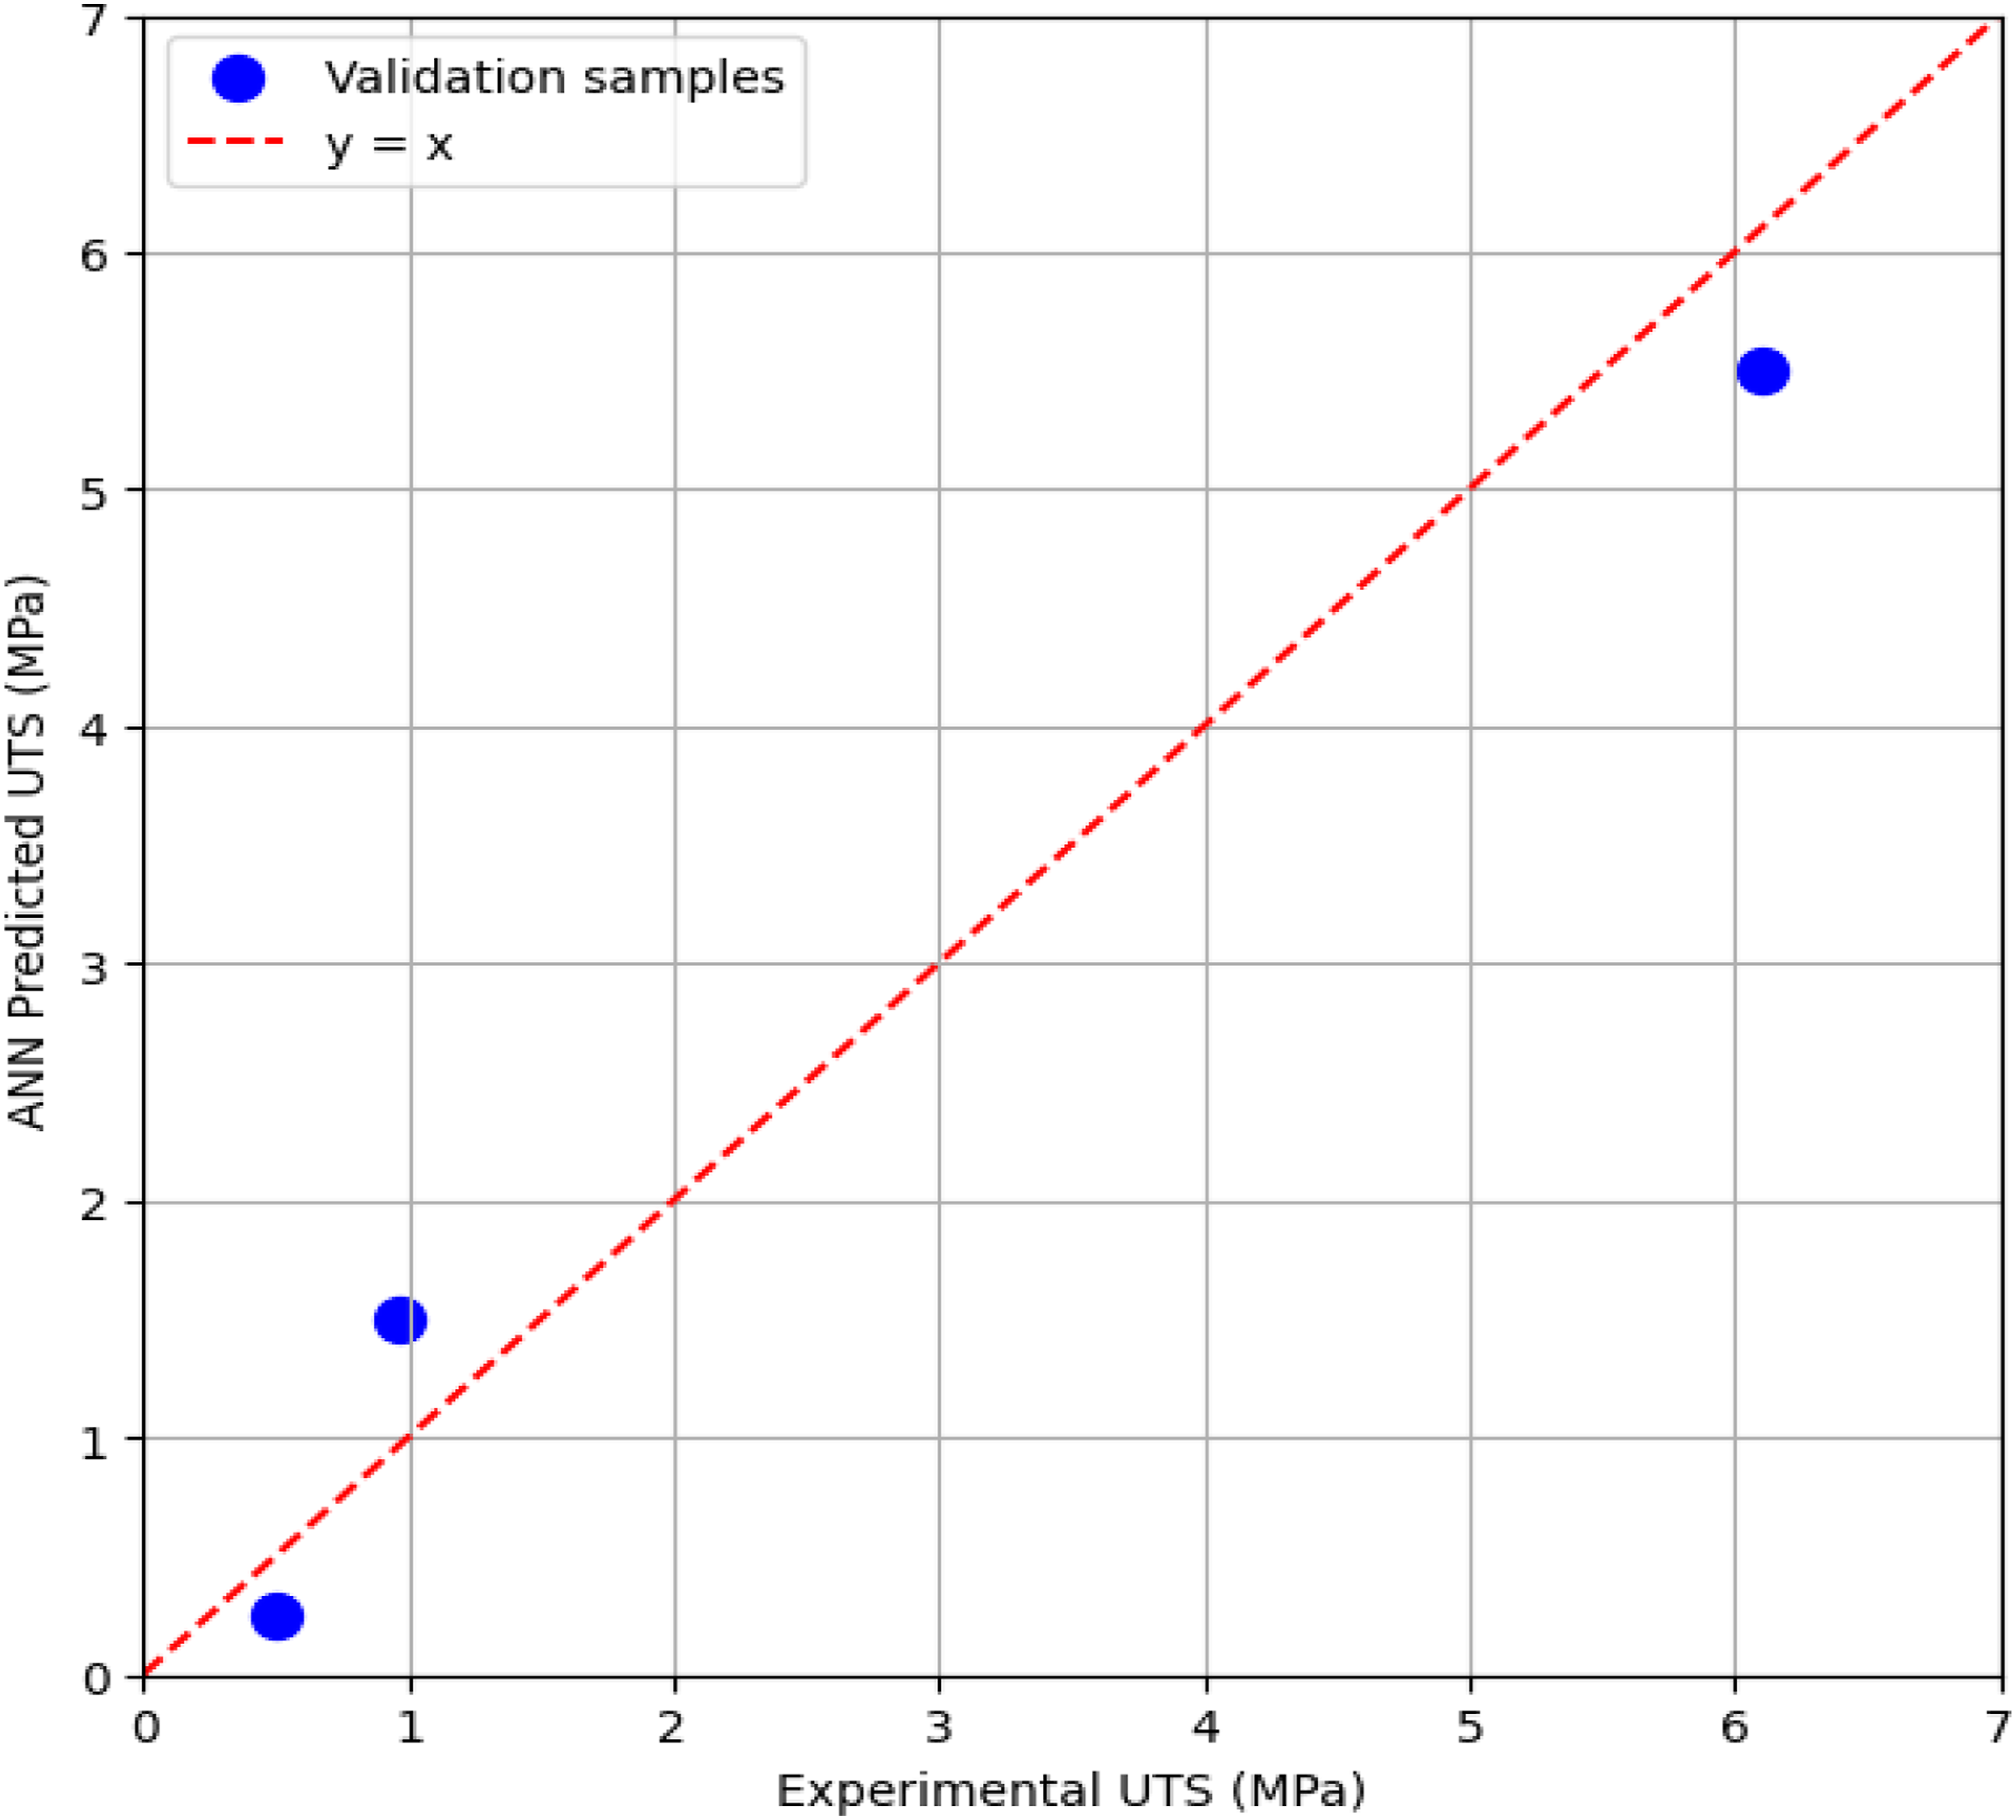
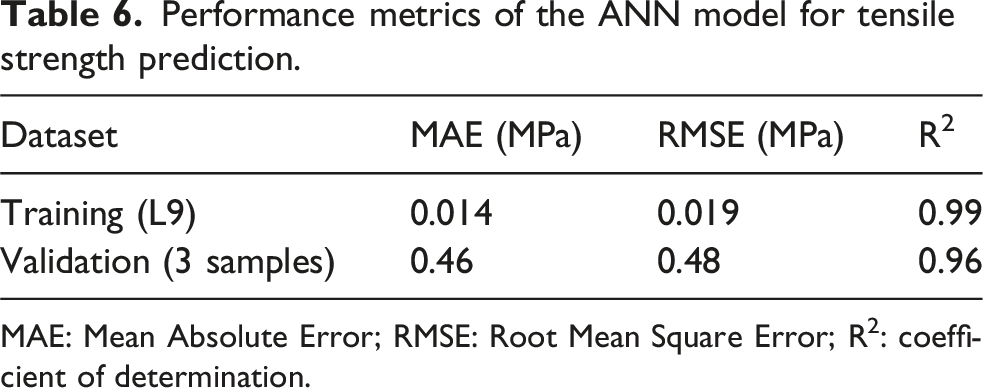
Figure 13 presents a scatter plot of predicted versus experimental UTS values for the three validation samples, including the regression line y = x. The results show good agreement, indicating that the ANN model can reasonably predict tensile strength for previously unseen parameter combinations. Despite the limited number of validation samples, the results demonstrate that the ANN model can reasonably predict UTS for previously unseen combinations of process parameters.
Several factors can explain the minor variations observed between the experimental and predicted values. One possible explanation is the intrinsic variability of experimental testing, where small differences in material properties, printer calibration, or environmental conditions can lead to variations in the final printed samples. Furthermore, the training dataset for the ANN was based on a Taguchi L9 design. Although this approach is effective, it may not fully capture all interactions between process parameters, and a full factorial design could potentially improve prediction accuracy and reduce discrepancies. Despite these minor variations, the experimental and predicted results show a strong correlation, demonstrating the reliability and robustness of the ANN in predicting the mechanical properties of 3D-printed samples.
Using the candidate combination of parameters identified from the contour analysis in Figure 11 — a printing speed of 40 mm/s, a density of 5%, and a temperature of 210°C — the ANN was employed to predict the corresponding UTS and elongation at break. The predicted values were 7.5 MPa and 23.75%, respectively. This step illustrates that the ANN can estimate mechanical responses for promising parameter combinations prior to the final optimization using ANN combined with Multi-Criteria Decision-Making Methods.
Optimization analysis with ANN
After preparing the predictive model. Optimization analysis was employed combining ANN with Multi-Criteria Decision-Making Methods. such as Grey Relational Analysis (GRA) and Technique for Order Preference by Similarity to Ideal Solution (TOPSIS) [39] to determine the optimal combination of 3D printer parameters. As shown in Figure 14. the ANN predict the mechanical properties (UTS and elongation at break) and the optimization methods defines the optimal 3D printing parameters ( speed. density and temperature). The optimization methods were applied to meet this objective: Optimization methodology.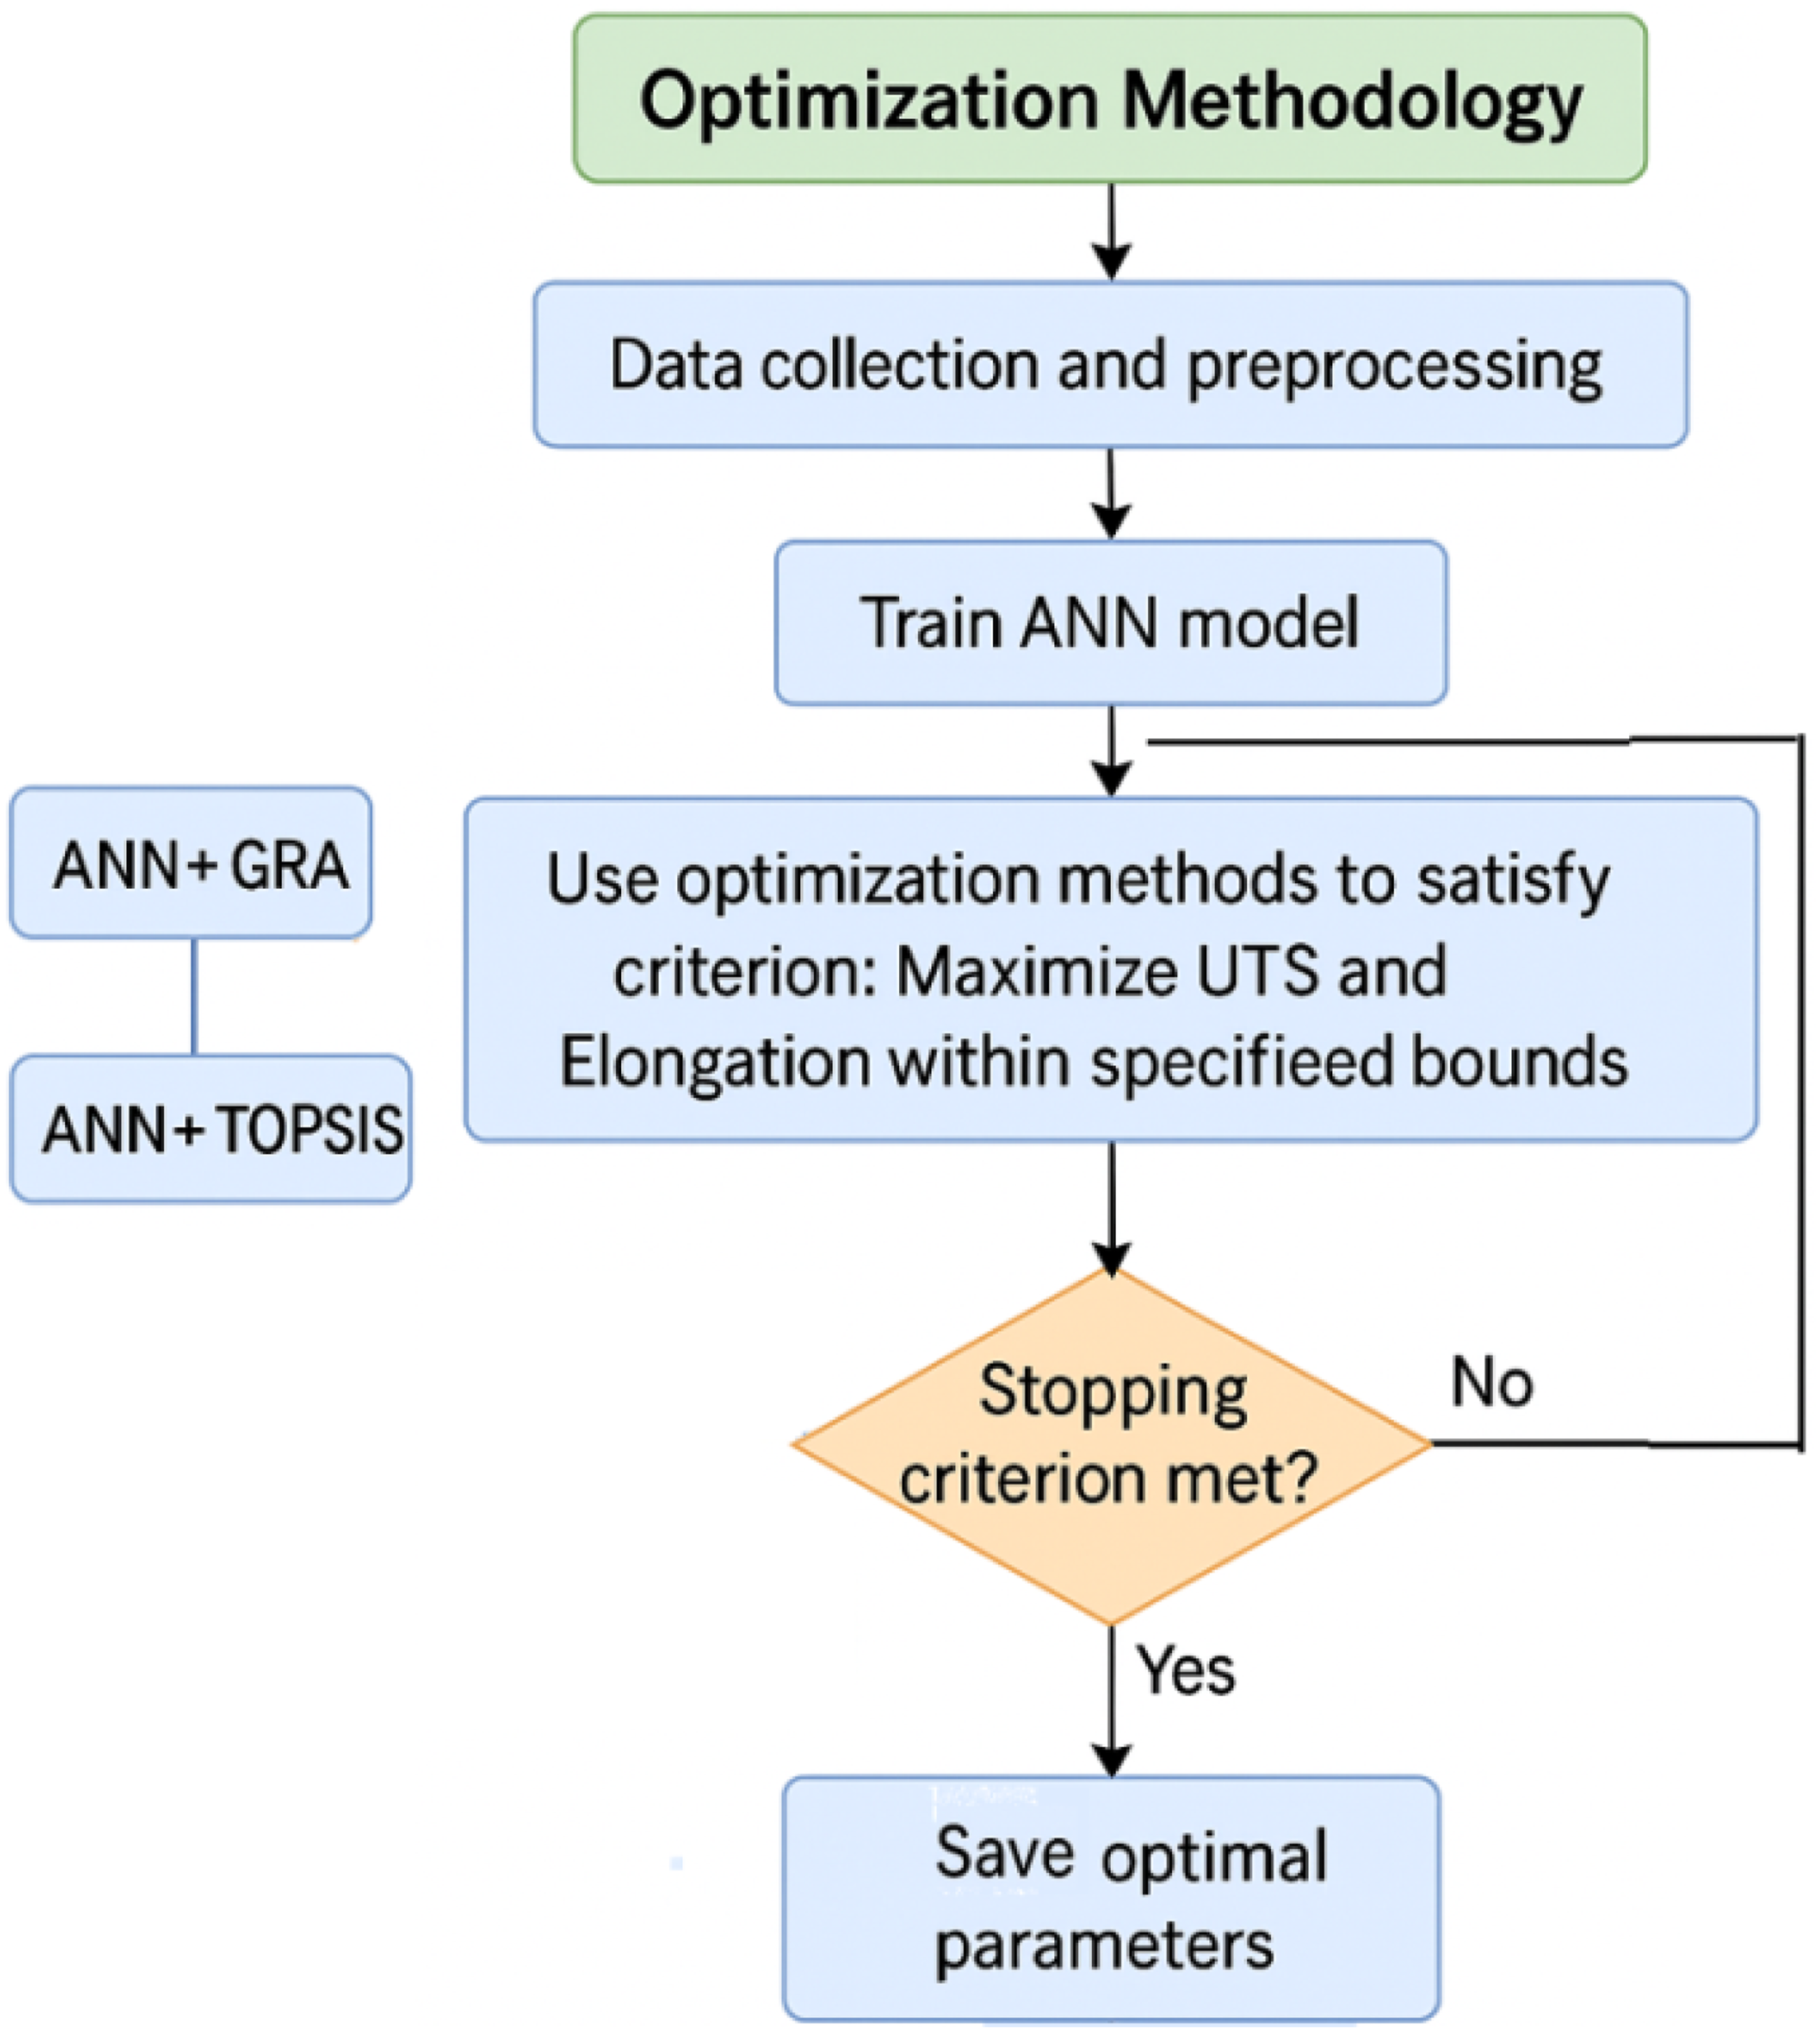
Find X = {V. D. T} that maximize {UTS. Elongation at beak}
Subject to 40 ≤ V ≤ 80 mm/s. 5% ≤ D ≤ 25%. and 200 °C ≤ T ≤ 220°C
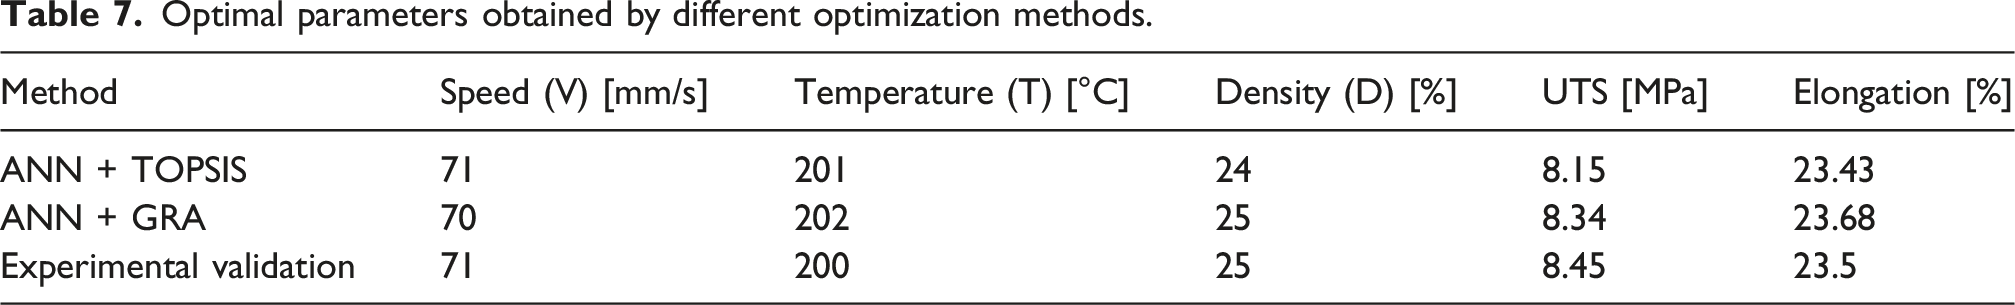
Optimal parameters obtained by different optimization methods.
Discussion
The dominance of printing speed observed in this study is primarily due to its influence on interlayer bonding and thermal diffusion during filament deposition. Lower to moderate speeds allow sufficient time for polymer chain diffusion, enhancing layer adhesion, whereas excessively high speeds reduce tensile performance. The presence of an optimal printing temperature reflects a balance between polymer rheology and fiber–matrix adhesion: low temperatures hinder filament wetting, while high temperatures may cause thermal degradation. Interaction effects between speed and temperature arise from their combined influence on melt flow and cooling, ultimately governing tensile properties.
The trends observed are consistent with previous literature. 6 reported that higher infill densities, thinner layers, and moderate printing speeds improve the mechanical performance of PLA/wood composites, with ANN and fuzzy logic models accurately predicting tensile and compressive strengths. In the present study, the optimal printing speed was 70–71 mm/s, higher than the 40 mm/s reported in that work, due to the narrower speed range explored here. Additionally, this work focuses on anti-trichiral lattice structures, whereas 6 studied solid specimens; differences in cellular architecture affect stress distribution and deformation, explaining discrepancies in absolute strength values. The multi-stage stress–strain responses also resemble those reported by 18 for lattice structures, highlighting the key role of cellular geometry in governing deformation mechanisms.
The ANN–MCDM framework demonstrated satisfactory predictive capability. Optimal parameters obtained with ANN + TOPSIS (V = 71 mm/s, T = 201°C, D = 24%) and ANN + GRA (V = 70 mm/s, T = 202°C, D = 25%) closely matched experimental results (UTS = 8.45 MPa, elongation = 23.5%). Minor differences between GRA and TOPSIS arise from their distinct weighting strategies, and agreement with experimental validation supports the robustness of the optimization within the studied parameter space. Nonetheless, caution is advised when extrapolating beyond the tested ranges.
This study has some limitations. The experimental dataset is small, and the Taguchi L9 design restricts exploration of higher-order interactions. Only a single material (PLA–wood) and one lattice geometry were investigated, and the parameter ranges were limited. Despite these constraints, the study provides valuable insights into the relationship between printing parameters and mechanical performance.
From a practical standpoint, the identified optimal printing parameters provide guidance for fabricating strong and ductile PLA–wood lattice structures. Balancing printing speed and temperature ensures effective interlayer bonding and fiber–matrix adhesion while avoiding thermal degradation. Selecting an appropriate density in combination with these parameters can maximize tensile performance, enabling reliable production of high-performance components without extensive trial-and-error.
Conclusions
The objective of this study was to evaluate the influence of key FDM printing parameters on the tensile behavior of an anti-trichiral auxetic structure manufactured from a PLA–wood composite and to assess the effectiveness of an ANN-based multi-objective optimization framework.
The results showed that printing speed is the dominant parameter affecting UTS and elongation at break, followed by printing temperature and infill density. An optimal processing window was identified within the investigated parameter ranges, and the ANN predictions closely matched the experimental results, confirming the reliability of the developed model.
From a methodological perspective, this work successfully demonstrates the applicability of an integrated ANN–MCDM approach (GRA and TOPSIS) for multi-objective optimization of 3D printing parameters, reducing experimental effort while enabling efficient identification of optimal conditions.
Future work will focus on expanding the experimental dataset, investigating additional auxetic geometries (re-entrant and chiral), incorporating further printing parameters such as layer height and build orientation, comparing ANN with other machine learning models, and performing additional mechanical tests including compression and fatigue.
Footnotes
Acknowledgments
The authors would like to thank their respective institutions for their support throughout this work.
Ethical considerations
Ethical approval and informed consent were not required for this study, as it does not involve human participants, animals, or sensitive data.
Funding
This work was supported and funded by the Deanship of Scientific Research at Imam Mohammad Ibn Saud Islamic University (IMSIU) under grant number IMSIU-RP23029.
Declaration of conflicting interests
The authors declared no potential conflicts of interest with respect to the research, authorship, and/or publication of this article.
Data Availability Statement
Data sharing is not applicable to this article as no new datasets were generated or analyzed during the study.
Additional information
No identifying information related to the authors, their institutions, or funding bodies is included in this version of the manuscript to ensure the integrity of the double-blind review process.