






Abstract
Motivated by the demand for sustainable thermoset matrix systems, this study proposes several approaches; the most effective combines flax fibers, furan resin, and biochar filler into a low-impact material system. Eco-mechanical performance was experimentally assessed at the material level via four-point bending and at the structural level via axial compression tests, using global warming potential as the sustainability metric considering LCA module A1, with estimates extended to cradle-to-gate (A1–A3). Incorporating 19.1 wt% biochar achieved A1 carbon neutrality, with 15.1% and 16.3% reductions in mass-specific flexural modulus and strength, respectively. Up to 27.6 wt% biochar was implemented in (hybrid) coreless filament-wound structures, while maintaining processability and adequate mechanical performance. In flax–epoxy systems, biochar addition improved eco-mechanical performance but could not achieve A1 carbon neutrality. The proposed flax–furan–biochar system offers a fully renewable, carbon-neutral/carbon-negative, mechanically viable solution for fiber-composite lightweight structural applications.
Introduction
Fiber composites combine reinforcing fibers with a binding matrix to create materials with superior structural performance, widely used in sectors such as aerospace, 1 automotive, 2 and construction. 3 Beyond their high strength-to-weight ratios, advanced formability, and excellent corrosion resistance, these materials offer exceptional flexibility in optimizing structural designs through customizable anisotropic material properties. 4 The global demand for fiber composites continues to increase, 5 driven by material innovations that expand fiber composites to new applications and the ongoing pursuit of efficiency through lightweight. In recent years, a pronounced shift 6 in the fiber composite industry has emerged toward more environmentally friendly material systems, both in fiber constituents 7 and resin constituents, 8 to align with international sustainability objectives, 9 which demand the widespread adoption of carbon-neutral materials and processes. These efforts include adopting bio-based materials and low-emission manufacturing processes while integrating reuse strategies and recycling methods.
The construction sector is a major contributor to global warming, accounting for 34% of global CO2 emissions. 10 This challenge is expected to intensify as population growth combined with increased urbanization drives the global demand for additional building floor space, a trend that is not limited to developing countries. 11 Compared to other industries, the construction sector has a productivity deficit 12 and struggles to meet even current demands 13 due to its reliance on conventional and resource-intensive methods that have been shown to be resistant to digitization and automation. 14 To address these challenges, the Cluster of Excellence Integrative Computational Design and Construction for Architecture (IntCDC)15,16 proposes to integrate co-design approaches17–19 through cyber-physical fabrication, 20 digital characterization, 21 integrative design, 22 and architectural implementation 23 to enhance productivity while simultaneously reducing the ecological footprint of buildings.
One key innovation for implementing such technological co-design approaches is coreless filament winding (CFW), an advanced fiber-composite additive manufacturing process that energy-efficiently produces highly customizable, lightweight lattice structures. In conventional filament winding, 24 fibers impregnated with synthetic resin are applied to the surface of a mandrel; after curing, the composite is removed, making the final geometry dependent on the shape of the mandrel. In contrast, CFW eliminates this dependency by winding impregnated fiber bundles around spatially arranged point-like anchors25,26 without intermediate support. Although hardware investment costs27,28 are reduced, this approach comes at the expense of increased design and process complexity.29,30 Variants such as hybrid CFW,31–33 where fibers are partially supported by surfaces; multi-stage CFW,34,35 where winding sessions and curing phases are alternately sequenced; and pultrusion-winding, 36 in which fiber bundles are selectively cured already during winding, demonstrate technical refinements aimed at enhancing control over the resulting composite geometry, especially at meso-scale. 37 In all CFW configurations, fiber placement follows a designer-specified sequence (winding syntax38,39) and incorporates a specific mode (hooking syntax25,40,41) to attach fibers to anchors. These syntaxes guide the layer-by-layer construction of the fiber net42,43 defining the placement trajectory. 44 As such, CFW inherits process characteristics from conventional filament winding,45,46 fiber-reinforced additive manufacturing, 47 and thermoset pultrusion. 48 Current development efforts in CFW aim to improve eco-mechanical performance through the integration of natural fibers,49–52 modifications to matrix systems,53,36 efficient design for material minimization,54–57 reduction of fiber anchoring elements,58,59 and the deployment of hybrid material systems.34,60 Despite these advances, the eco-mechanical performance of current material systems used in CFW remains insufficient to fully address the aforementioned systemic challenges.
This study evaluates the environmental impacts of the investigated material systems focusing on the global warming potential (GWP) of the raw materials utilized, primarily due to the good availability of GWP data. Although GWP is a widely accepted metric and has been suggested to correlate with other sustainability indicators, future research should broaden the analytical scope to incorporate additional metrics 61 such as water consumption, toxicity, impacts on biodiversity and resource depletion. The GWP contribution of the CFW process step (drying, winding, ventilation, and curing) is negligible compared to the raw material sourcing step (fiber and matrix). 62 Moreover, in this study it is assumed that it is constant for all material-level samples produced. At the material level, only the supply of raw materials (A1) is considered. At the structural level, the analysis covers cradle-to-gate (A1 to A3). Due to high uncertainty in later life-cycle and end-of-life stages, they are excluded from this assessment. The energy demand associated with filament winding processes is relatively low compared to other composite manufacturing techniques, 63 further supporting the selection of CFW for this study. The achievement of carbon neutrality (net-zero emissions) or even carbon negativity (net carbon removal) remains a significant challenge in the context of structural fiber composites. 64
General approaches to improving sustainability include the use of bio-based materials derived from renewable resources, 65 more environmentally friendly processing methods, 66 or the implementation of recycling/reuse strategies for materials or products.67,68 For example, replacing virgin carbon fibers with recycled ones largely preserves the high-performance characteristics of the composite while reducing greenhouse gas (GHG) emissions by 33-51%. 69 Similarly, lignin-based carbon fiber production requires approximately 30% less energy than polyacrylonitrile (PAN) based processes. 70 However, such materials currently lack availability in quantities required for architectural-scale applications and are therefore not considered in this study. Although carbon-negative thermoplastic materials are already available, 71 they are not compatible with CFW. As shown in previous research, 72 materials derived from biologically sourced natural resources, despite potential reductions in mechanical performance, represent a promising alternative due to the carbon sequestration capabilities of the originating plants, which positively impact their GWP.
A prior study 51 on epoxy-based wound fiber composites found that replacing carbon or glass fibers with natural fibers, particularly flax, yields significant improvements in eco-mechanical performance at the material level. A subsequent investigation 52 explored fiber substitutions at the structural level, concluding that carbon and natural fiber systems remain viable design options, depending on whether the prioritized objective is weight reduction or improved sustainability. Another study 61 evaluated the use of locally harvested natural fibers and expanded the scope of sustainability metrics, finding that the utilization of many more sustainable plant fibers is limited by the challenges associated with spinning them into usable yarn, so flax currently seems to be the best available fiber material option.
Leaving behind early architectural integrations73–77 that relied on technical reinforcement fibers, recent research involving a full-scale building demonstrator, 60 in which flax/epoxy CFW structures were used to reinforce cross-laminated timber roof panels, revealed that the matrix represents nearly 40% of the total GWP while constituting only 7% of the structural mass of the hybrid system (including steel, excluding timber). This finding substantiates previous studies,51,52 confirming that the matrix system is the dominant contributor to GWP in natural fiber composites, while lower fiber volume ratios (FVRs) disproportionately increase the share of GWP of the matrix, given the already minimized environmental impact of the fiber constituent, thus constraining eco-mechanical performance.
To further reduce matrix GWP in such fiber composites, the following strategies can be used: (a) Developing thermosetting resins 78 with inherently lower GWP. While it remains uncertain if significant progress can be made in the near future, this lies beyond the scope of the paper. (b) Implementing mineral-based matrix systems 53 that are compatible with the CFW process, though these require substantial process adjustments. (c) Increasing the FVR to reduce the proportion of high-GWP matrix material; however, this may compromise interlaminar bonding. 79 (d) Integrating alternative curing methods 80 (ambient temperature, ultraviolet, infrared, microwave) to lower energy consumption in the process, although this addresses aspects with only minimal savings potential.
Instead, this study proposes the integration of a furan resin to maintain similar processing characteristics, while combining it with a partial substitution of the matrix using carbon-negative fillers, such as biochar particles. The application of these materials to CFW is entirely new, but could offer substantial sustainability advantages, as both are derived from plant residue materials through relatively simple extraction processes. In addition, these products are available in quantities relevant for large-scale architectural projects. Although recent building demonstrators49,60 prove the feasibility of building systems using materials with lower mechanical performance, it remains unclear whether material systems following this GWP reduction approach would excessively compromise structural capacity. So, in this study, a complementary approach is also investigated, with the aim of enhancing the mechanical performance of the matrix more rapidly than increasing the GWP. If successful, these high-performance materials can only be added locally 31 to load-bearing zones prone to interlaminar failure. 40
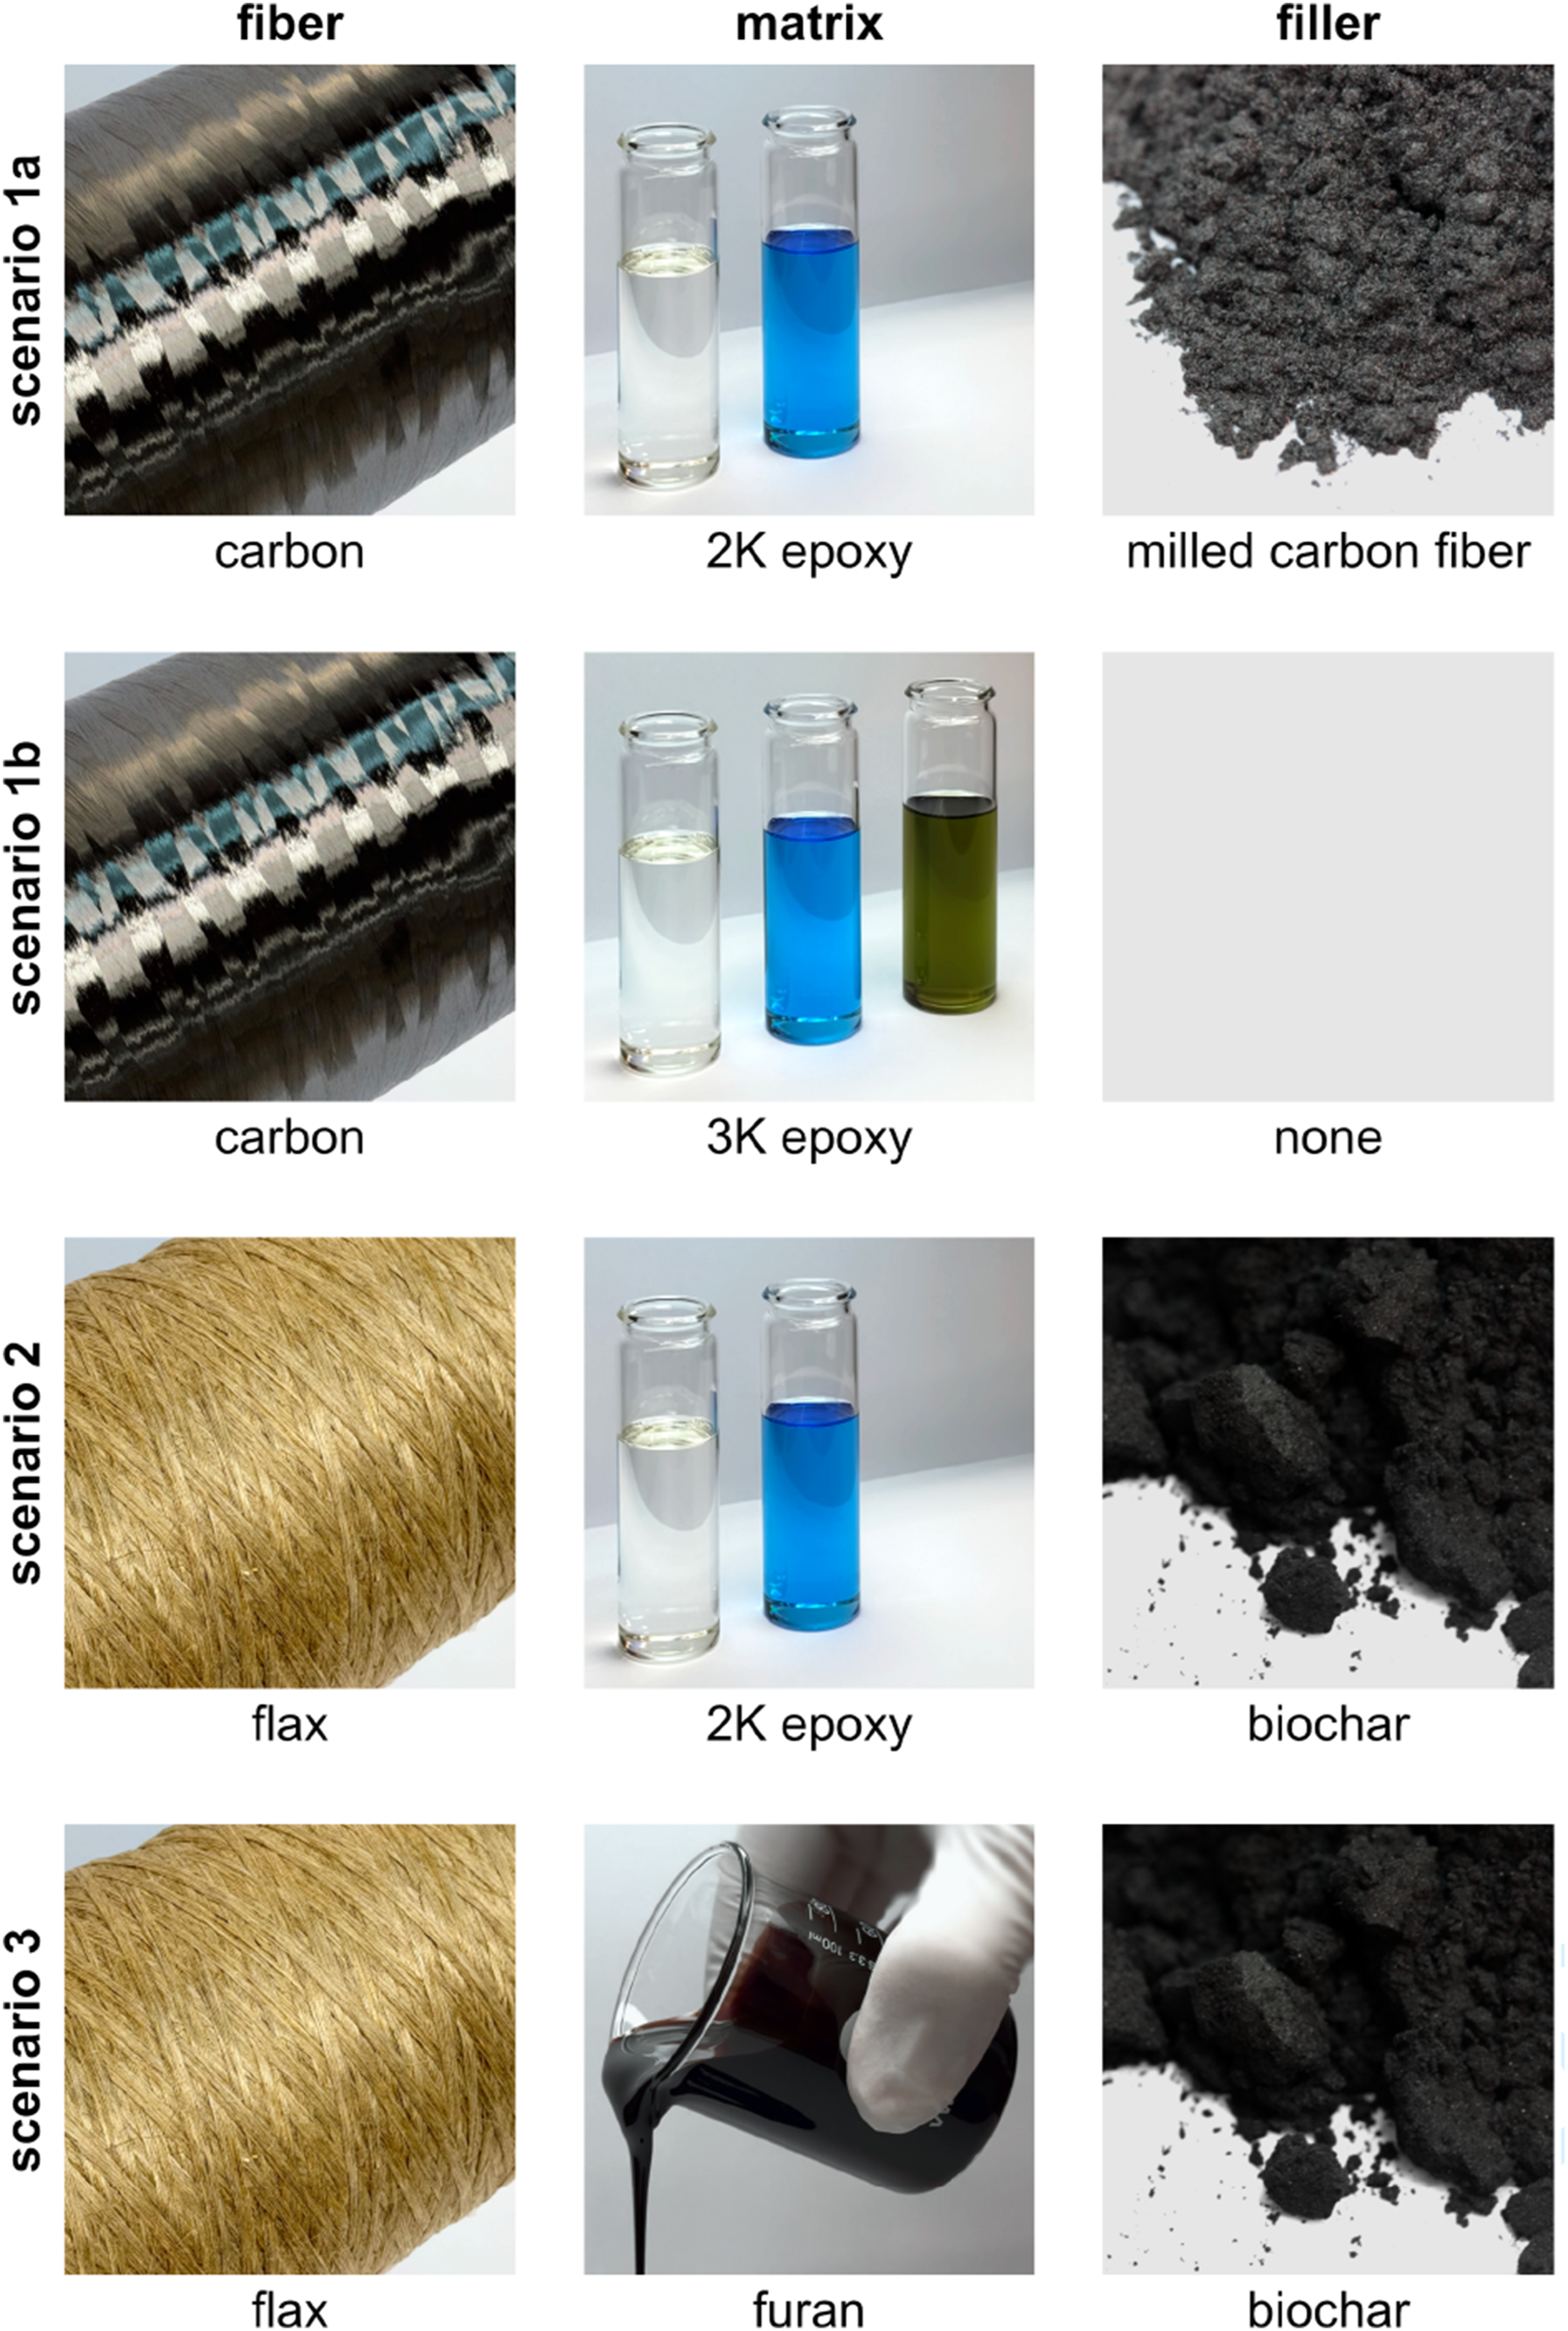
This paper aims to significantly improve the eco-mechanical performance of thermosetting fiber-composite structures by following the aforementioned proposed approaches, while considering the process characteristics of CFW. The study follows these scenarios, see Figure 1: • • • Investigated scenarios. Scenario 1: Increasing mechanical performance. Scenario 2: Reducing global warming potential. Scenario 3: Achieving carbon neutrality.
For all scenarios, eco-mechanical performance is experimentally evaluated at the material level using four-point bending (4PB) testing on samples wound using a mold to minimize geometric uncertainties. Flexural testing was chosen over tensile or compressive testing because it better captures the fiber–matrix interfacial bonding, reduces the dominance of fiber performance on the measured response, and provides more controlled clamping conditions. Finally, generic CFW structures were fabricated to demonstrate processing feasibility on a structural scale. These structures were tested under axial compression to also evaluate their eco-mechanical performance.
Material System
This study investigates material systems made from the following fiber, matrix, and filler materials. This study does not perform a complete life cycle assessment. Instead, GWP values for the deployed materials were collected from different sources. The purpose of the study is not to establish comprehensive sustainability metrics, but to examine how material selection impacts structural performance in relation to the associated GWP. At the material level, module A1 and, at the structural level, modules A1–A3 are considered.
Carbon fibers
For this study, a PAN-based high-tensile carbon fiber with 24K at 1600 tex was selected, as this material, in addition to standard modulus fibers, has already been extensively used in CFW applications. Carbon fibers, in general, offer high mass-specific modulus and strength, enabling structural designs that minimize segment cross-sections and thereby reduce overall material usage. Moreover, carbon fiber shows excellent processing compatibility with the CFW process and its state-of-the-art equipment. Typically, carbon fiber production relies on petroleum-based precursors, which carry the common sustainability drawbacks associated with fossil-derived materials. In addition, the transformation of these precursors into carbon fiber requires energy-intensive, high-temperature carbonization/graphitization processes. For the PAN-based carbon fibers used in this study, a GWP range of 12.55–35.00 g CO2-eq./g will be assumed. This range was derived from the maximum range of reported values in the literature: 12.55–20.5 g CO2-eq./g, 81 13–34.1 g CO2-eq./g, 82 24 g CO2-eq./g, 83 and 35 g CO2-eq./g. 84
Flax fibers
Based on previous research 51 on the selection of materials for CFW, flax fibers were identified as the most favorable option among common natural fibers, offering the best compromise between mechanical performance and material-level A1 GWP in CFW applications. The viability of producing architectural-scale structures with CFW using flax fibers has already been demonstrated several times.49,60 Since other natural fibers currently have no relevance to CFW, they were excluded from this study. A 1000 tex tape-based flax product was chosen, in line with previous CFW research. In addition, the tape configuration of this product is expected to facilitate impregnation with particle-based fillers. The selected fiber product consists of parallel flax fibers bound together by a binder material and does not require any further wrapping. The flax fibers were subjected to an alkali wash treatment by the supplier. A GWP range of 0.35–0.55 g CO2-eq./g will be applied as it is known for the specific fiber product used in this study.
Epoxy resin
The CFW process was developed for the use of epoxy resins due to their favorable characteristics in terms of viscosity, pot life, mechanical performance, and compatibility with both reinforcement fibers and metallic winding pins. This study investigates two different resin systems: a standard two-component epoxy system (2K) designed for laminating applications, and a similar three-component epoxy system (3K), which can potentially achieve higher glass transition temperatures and higher stiffness values under cold-curing conditions. Both resin systems have been successfully employed in previous CFW applications. The viscosity at 25°C of the 2K system is 600 mPa⋅s, while the 3K system exhibits a higher viscosity of 900 mPa⋅s. In this study, the resin system was mixed and cured according to the manufacturers’ specifications.
As no product-specific GWP values were available for either resin system, literature-based values ranging from 4.7 to 8.1 g CO2-eq./g were used. 85 Since previous studies on CFW51,55 have already quantified the influence of bio-based epoxies on eco-mechanical performance and processing, such alternatives are not further examined in the present study. Although current bio-based epoxy systems 51 can reduce GWP by 56% on average, their GWP remains 4.8 times higher than that of the furan resin used. Even bio-based epoxies with the lowest reported GWP values still exhibit a GWP 2.4 times higher than that of the furan resin.
Furan resin
This study presents the first application of a polyfurfuryl alcohol resin system in CFW. In order to achieve a substantial reduction in GWP, furan resins are attractive due to their high bio-based content; while competing bio-based thermosets may offer advantages in toughness or processability, they often involve trade-offs in terms of the maturity of industrial synthesis for novel formulations or in terms of fire resistance 86 or toxicity 87 for more established products. Bio-based epoxies are the main competitors to furan resins in CFW processing, but cannot match their low A1 GWP values, see Section “Epoxy resin”.
The furanic monomers of the resin can be directly obtained from hemicellulose by a simple processing sequence: acid-catalyzed hydrolysis of pentosans followed by dehydration and cyclization. 88 Hemicellulose is abundantly available in wood and arable agricultural residues. Thus, furan resins can be sourced from renewable resources, 89 unlike conventional epoxy systems. The furan resin product used is cured using a combination of two curing agents: phosphoric acid and ammonium nitrate. Processing furan resin poses several challenges, most notably its tendency to clump during mixing when suboptimal blending techniques are used, as well as its relatively elevated viscosity at ambient temperature, approximately 2350 mPa⋅s. Consequently, distilled water was added to facilitate impregnation. The pot life of the resin is approximately 2.5 h, which limits applicability in larger architectural building systems or requires multi-stage winding. Similarly to the epoxy resin systems used, the furan resin also cures at room temperature, a mandatory feature for manufacturing large-scale structures that cannot be accommodated in ovens. Nonetheless, the furan resin samples were directly cured in an oven after winding was completed, enhancing impregnation by temporarily reducing the viscosity prior to gelation. The curing protocol requires a stepwise increase to 110°C and a total duration of 20 h, including post-curing. The selected furan resin shows slightly higher thermal stability than the epoxy resins, while the epoxy resin cures nearly clear, the cured furan system exhibits a dark brown to black coloration, a relevant aspect for architectural design.
The GWP for the furan resin system used in this study was calculated to be 0.583 g CO2-eq./g. This value was inferred from literature-based GWP values for all constituents, weighted according to the mixing ratios while accounting for their individual dilution with water. Specifically, a GWP value of 0.6 g CO2-eq./g was used for furfuryl alcohol, 90 1.378 g CO2-eq./g for phosphoric acid, 91 and a range of 0.89–1.5 g CO2-eq./g for ammonium nitrate. 92 The contribution of water was considered negligible. 93 Due to the relatively small proportion of curing agents, the GWP of the resin system is predominantly determined by the contribution of furfuryl alcohol.
Milled carbon fiber filler
Milled carbon fiber fillers are produced by grinding carbon fiber rovings into a fine powder, allowing their integration into the matrix system. In contrast to chopped fibers, which exhibit lengths in the lower millimeter range, milled fibers are significantly shorter, typically within the micrometer range. Due to their reduced length, milled fibers are primarily employed to enhance electrical and thermal conductivity in thermoplastic and thermosetting matrices, whereas chopped fibers are additionally used to improve mechanical strength. The implementation of chopped fibers into the state-of-the-art CFW impregnation process appeared to be infeasible. Therefore, a milled fiber type was selected, with an average fiber length of 50 μm and a filament diameter of 11 μm. To mitigate the limitations associated with the shorter fiber length, a milled carbon fiber filler manufactured from pitch-based, rather than PAN-based, carbon fibers was chosen. Pitch-based carbon fibers offer substantially higher stiffness and have also been successfully incorporated into the CFW process in the form of rovings. 54
A significant gap exists in the literature on the specific GWP of pitch-based carbon fibers, as PAN-based carbon fibers are used more widely and, consequently, better studied.82,94 The production of pitch-based carbon fibers involves distinct precursor materials and processing steps; thus, GWP estimates can be inferred by comparison with those of PAN-based fibers. In this context, the contribution of the milling process to GWP can be neglected, given the relatively low energy consumption typical of mechanical operations, which is dominated by the energy-intensive thermal steps of carbon fiber production. Specifically, the production of very high modulus pitch-based carbon fibers involves a graphitization step that succeeds the regular carbonization step. The literature
95
reports an energy requirement of 14.7 MJ/kg for the graphitization step alone. The conversion between embodied energy Eemb. and GWP was calculated from data published by Ref. 96, establishing the following correlation:

Consequently, the graphitization energy results, based on equation (1), in an additional GWP contribution of 0.96 g CO2-eq./g of material for the milled CF filler, compared to PAN-based carbon fibers.
Biochar filler
Through photosynthesis, plants sequester carbon from atmospheric CO2 while releasing oxygen, thus building up their biomass and storing carbon. At the end of their life cycle, plant biomass is typically metabolized by microorganisms, resulting in the release of GHG, such as carbon dioxide, nitrous oxide, and methane. Biochar is produced through pyrolytic carbonization, a process in which woody biomass residues are heated to 400–700°C under oxygen-excluded conditions. This thermal decomposition prevents the natural degradation of biomass, thus avoiding microbial metabolism and thus the associated release of GHG. During biochar production, pyrolysis oil and synthesis gas are generated as byproducts. The synthesis gas can be utilized to supply the energy required for the biochar production process itself, while the pyrolysis oils serve as CO2-negative raw materials for the chemical industry. Biochar is a chemically stable and carbon-negative powder. A GWP of −3.67 g CO2-eq./g was applied to the specific product used in this study, which was obtained from wood.
Samples
The sample design intends to reflect the CFW fabrication process while simultaneously enabling comparison across different material systems and allowing controlled geometrical boundary conditions. Although loop samples would more closely replicate the actual characteristics of the fabrication process, they introduce significant uncertainties in geometry. 40 Although these uncertainties could potentially be statistically addressed through larger sample numbers, simple loop samples predominantly allow only axial compression or tension testing. This limitation complicates the comparison of materials with vastly different mechanical performances, such as carbon fibers and natural fibers, particularly in terms of maintaining consistent failure mechanisms. To address these challenges, four-point bending (4PB) samples were utilized. 4PB enables the decoupling of the location of the failure from the introduction of the load, unlike three-point bending. Moreover, bending tests allow for a more comprehensive evaluation of the fiber-matrix interaction, which is central to evaluating composite performance. For each series, 10 samples were produced to allow statistical analysis.
Fabrication
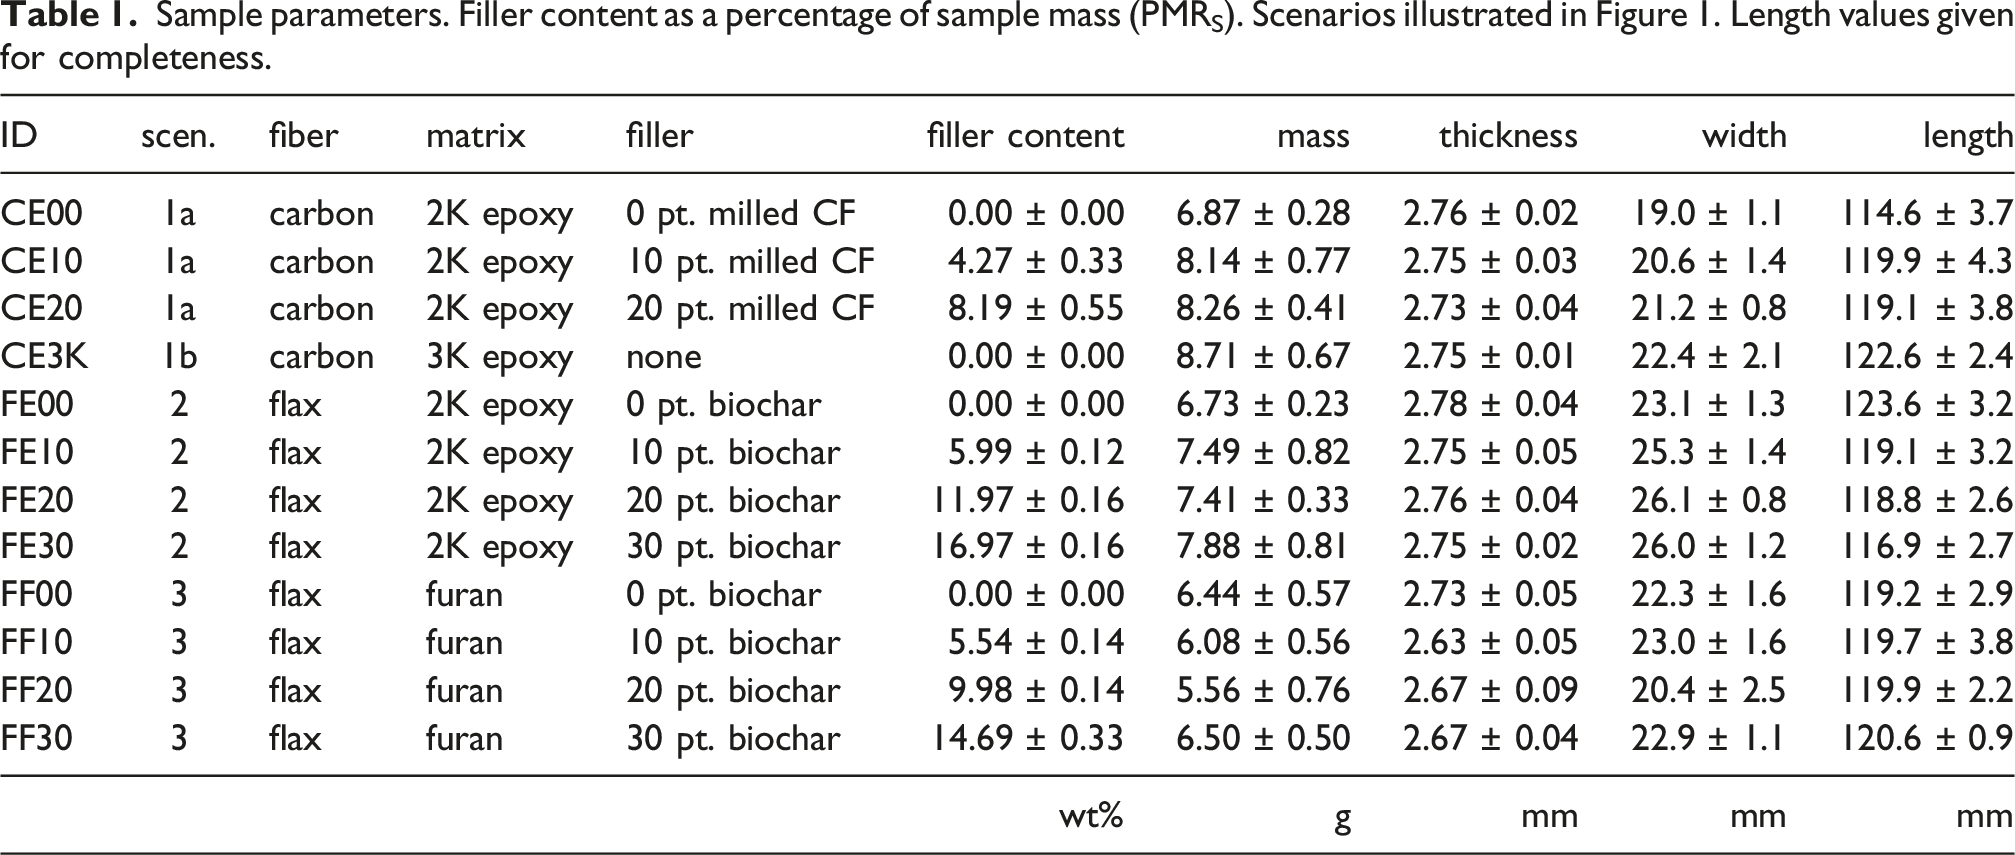
The samples were fabricated using state-of-the-art CFW methods as described in Refs. 51,40 to ensure that the characteristics of the process, such as the distribution of FVR and the quality of the impregnation, are as close as possible to those of CFW when applied to structural samples. Consequently, samples were not cut from prefabricated vacuum-infiltrated woven textiles. The clamp configuration in the 4PB testing requires two flat and parallel surfaces opposed diametrically; therefore, the samples were wound using an aluminum mold with machined cavities, see Figure 2. The orientation of the cavities was specifically chosen to minimize the variation in the thickness of the sample at the expense of the variation in the width, see Table 1. The cavities measure 120 mm × 20 mm × 3 mm, the bolts serve as fiber anchors, and excess resin can flow out of the cavities collected through a cross groove on both sides. A release agent and a polytetrafluoroethylene (PTFE) foil were applied to the mold to facilitate sample demolding, as the cavities could not have a draft angle. CAD model of the mold used for 4PB sample fabrication. Sample parameters. Filler content as a percentage of sample mass (PMRS). Scenarios illustrated in Figure 1. Length values given for completeness.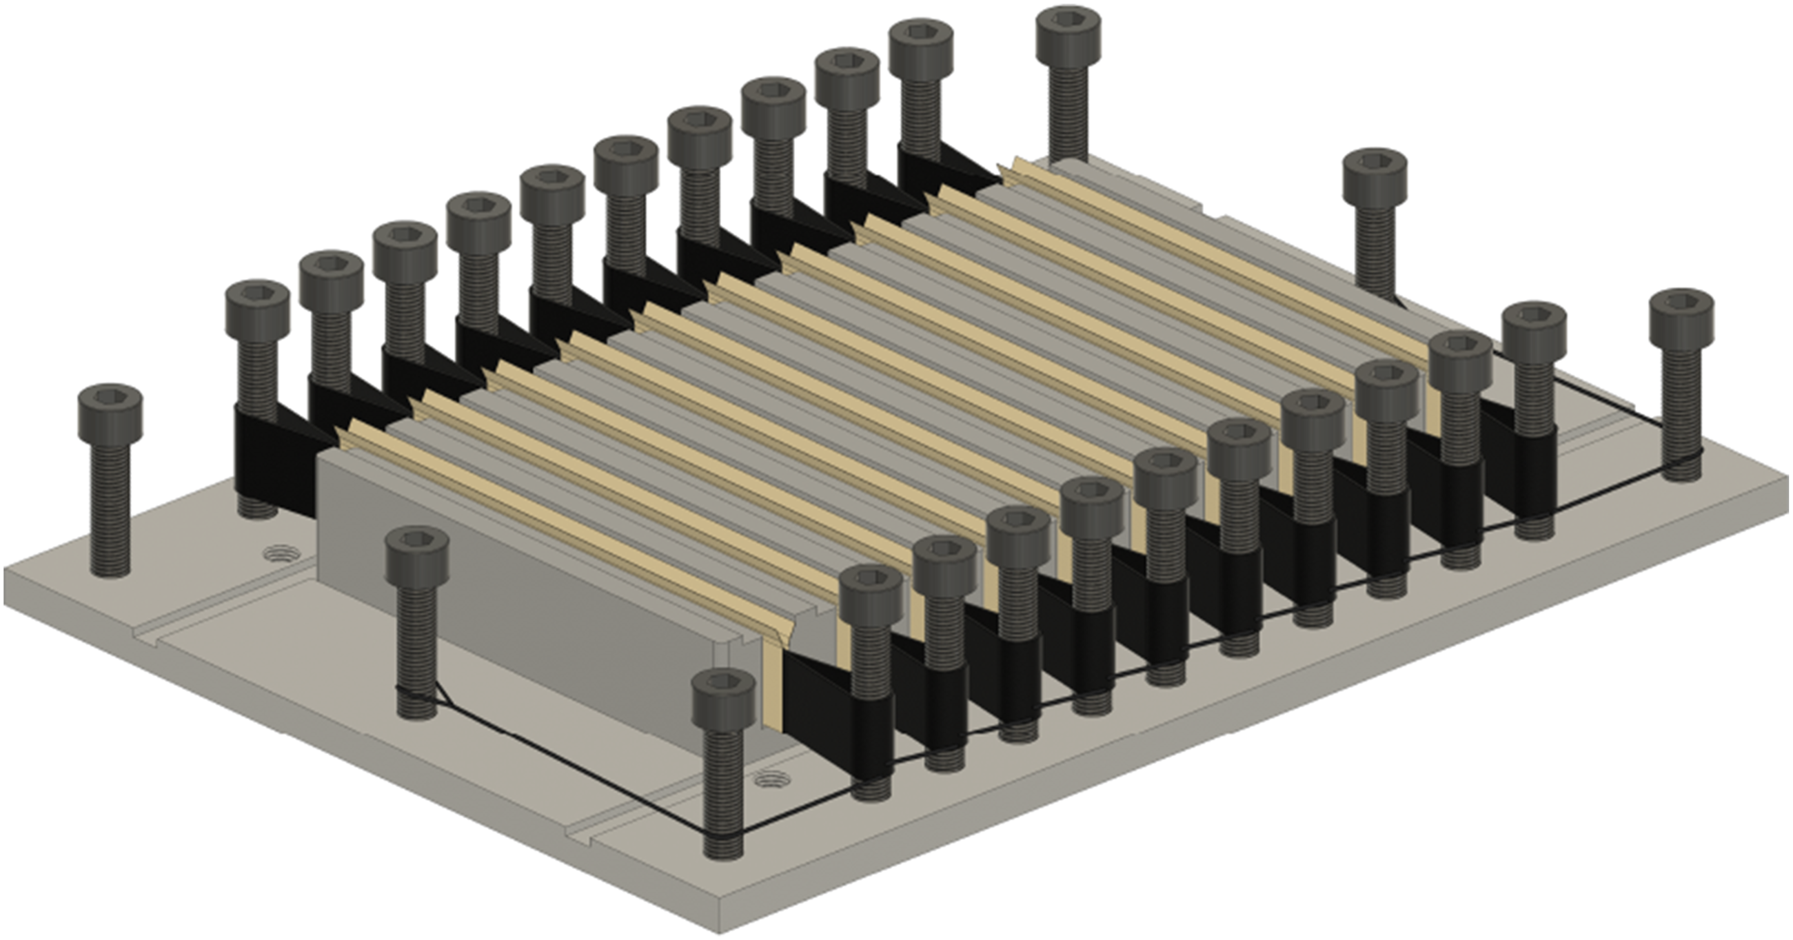
The fibers were not subjected to any additional chemical pretreatment. Before winding, flax fibers were dried in an oven to control moisture content, which is particularly important to avoid adverse interactions with the epoxy resin system. This process step can be conveniently omitted for samples using furan resin. The matrix system formulations are as follows: 2K resin: 100 pt. resin, 40 pt. hardener, 0–30 pt. filler; 3K resin: 100 pt. resin, 20 pt. hardener A, 10 pt. hardener B; furan resin: 100 pt. resin, 3 pt. hardener A, 2 pt. hardener B, 0–30 pt. filler, 0–15 pt. water, with filler and water pt. scaled according to H2O = 0.0115 biochar2 + 5. The distilled water added to reduce the viscosity of the furan resin evaporates during curing. The mixing of the furan resin required particular care, as the constituents had to be incorporated sequentially during stirring to prevent clump formation, which could adversely affect the mixing ratio and consequently the mechanical performance. The mixing of the filled matrix systems was conducted using a bladeless centrifuge mixer in two cycles at 800 rpm for 1 minute each. Higher settings showed a significant heat buildup and, respectively, a substantial shortening of the pot life. No evidence of agglomeration or concentration gradients within the filled matrix mixture was observed. Therefore, it can be inferred that the particles were sufficiently dispersed throughout the matrix as a result of the intensive mixing achieved with the bladeless centrifuge mixer, given that even less-than-ideal state-of-the-art equipment has been shown to provide effective dispersion of biochar in epoxy and furan systems. 97 During winding, the fiber strands were manually placed under high tension and firmly pressed into the bottom of the mold cavities to ensure proper layering, filling the cavities to the brim, while recording the number of layers. After being curing, performed according to the suggestions of the individual matrix manufacturers, the samples were removed from the mold. Both ends were trimmed using a band saw and any accumulated excess pure resin was manually removed.
Parameters
The dimensions of each sample were measured using a caliper, with multiple measurements taken along the height and width of each sample and subsequently averaged; the total mass of the sample was also determined per-sample, see Table 1. Because the filler contents were scaled according to the formulations, this accounts for the differences observed in the measured filler contents between the sample series.
The fiber mass was determined using the linear density of the fiber material, the sample length, and the counted number of layers. The filler mass contents were calculated by subtracting the fiber mass from the total mass to determine the remaining matrix mass, and then applying the known filler proportions based on the formulations of the matrix system, see Section “Fabrication”. Based on fiber, resin, and filler masses, the respective mass ratios were determined, see Figure 3. Macroscopic voids or filler agglomeration were not detected within the 4PB samples, see Figure 4. Average mass composition of the 4PB samples. Filler content as a percentage of sample mass (PMRS). Cross-sectional views of the of the 4PB samples.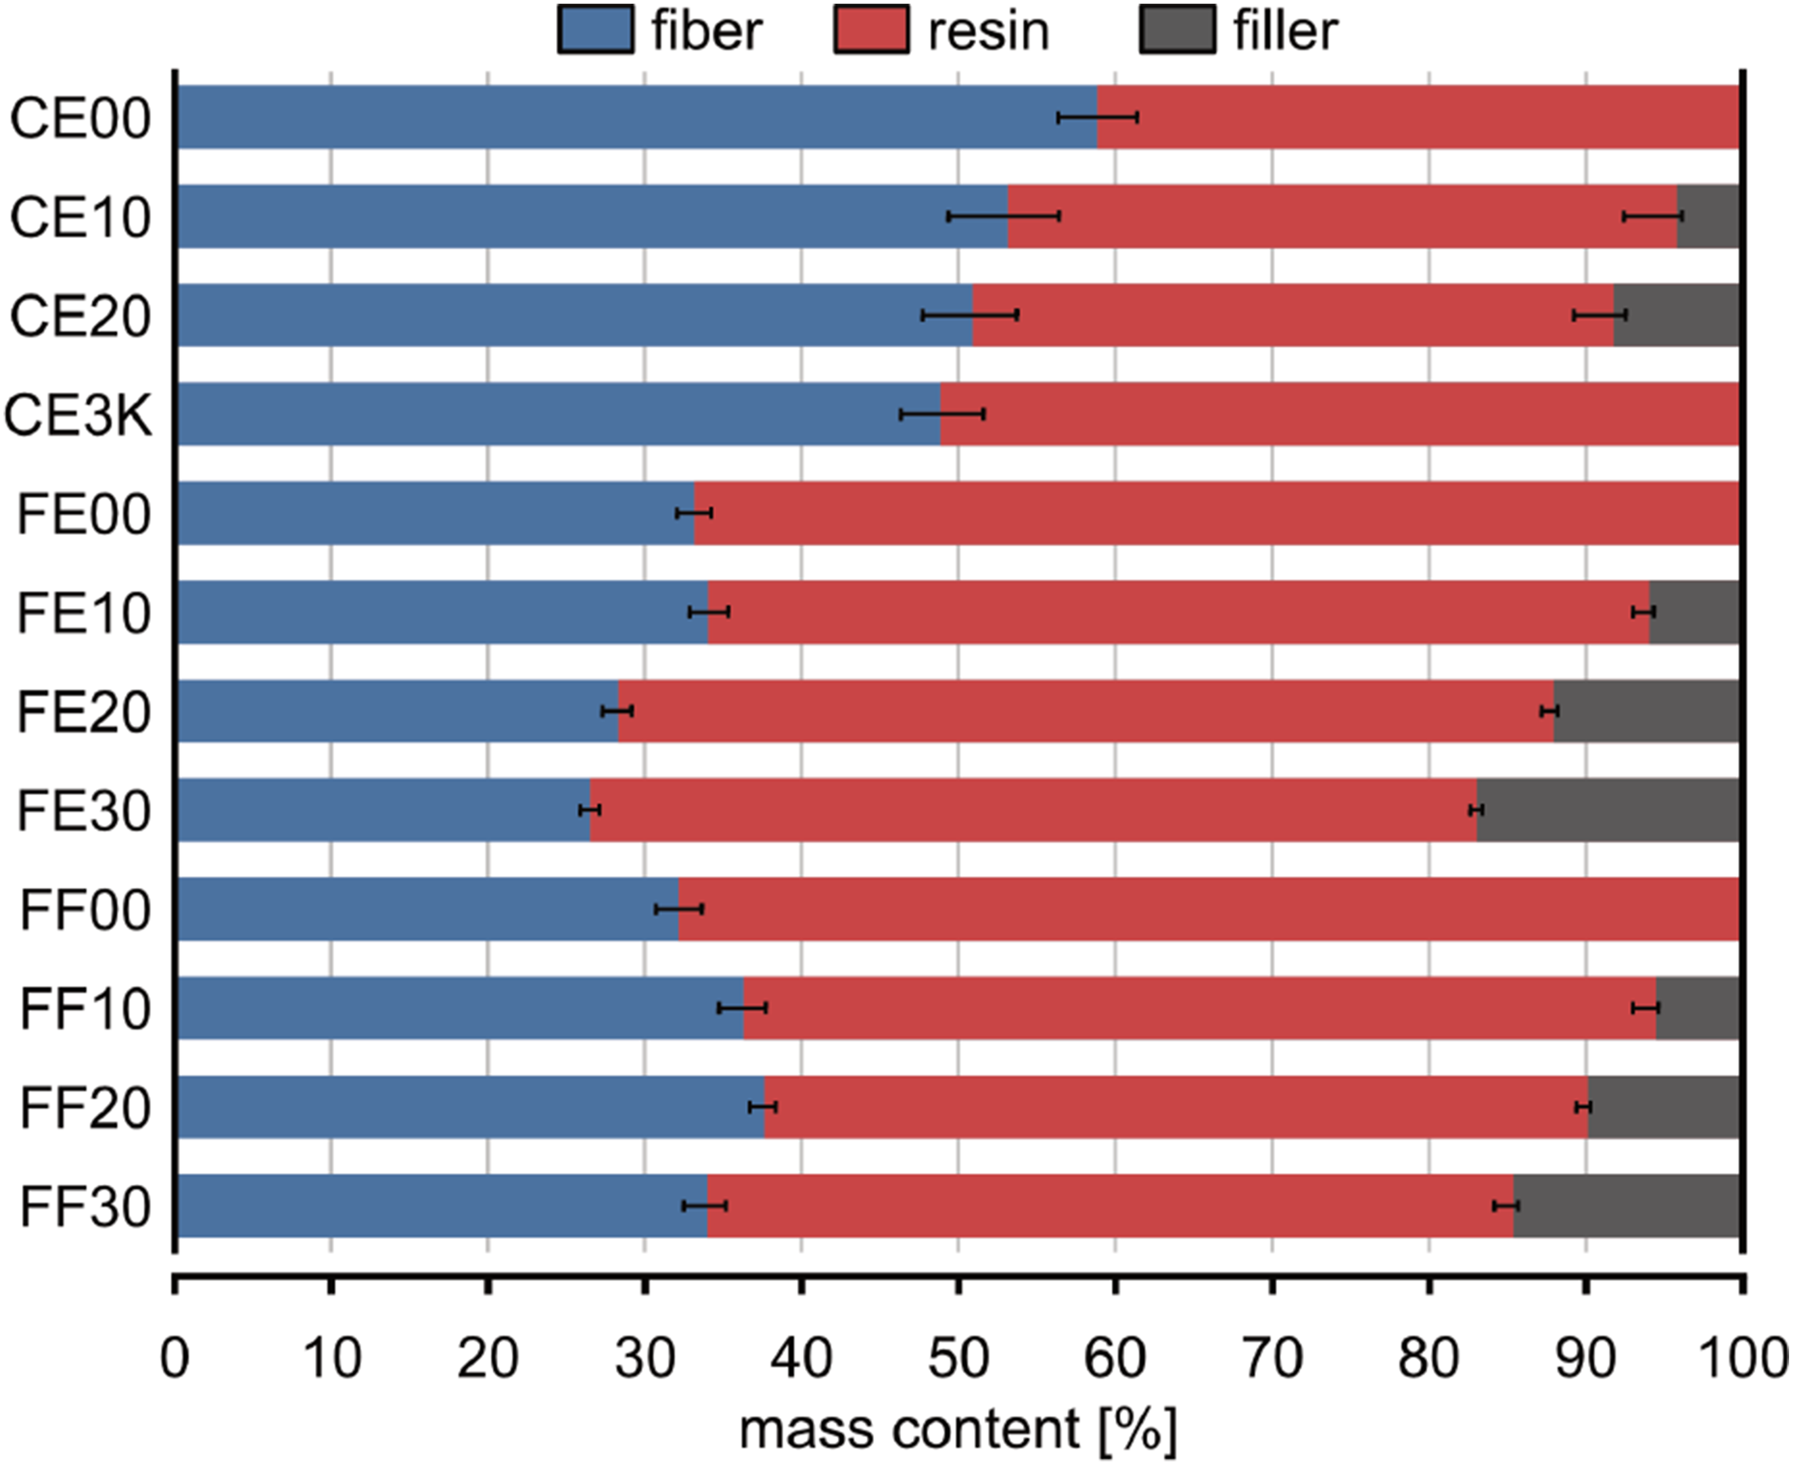
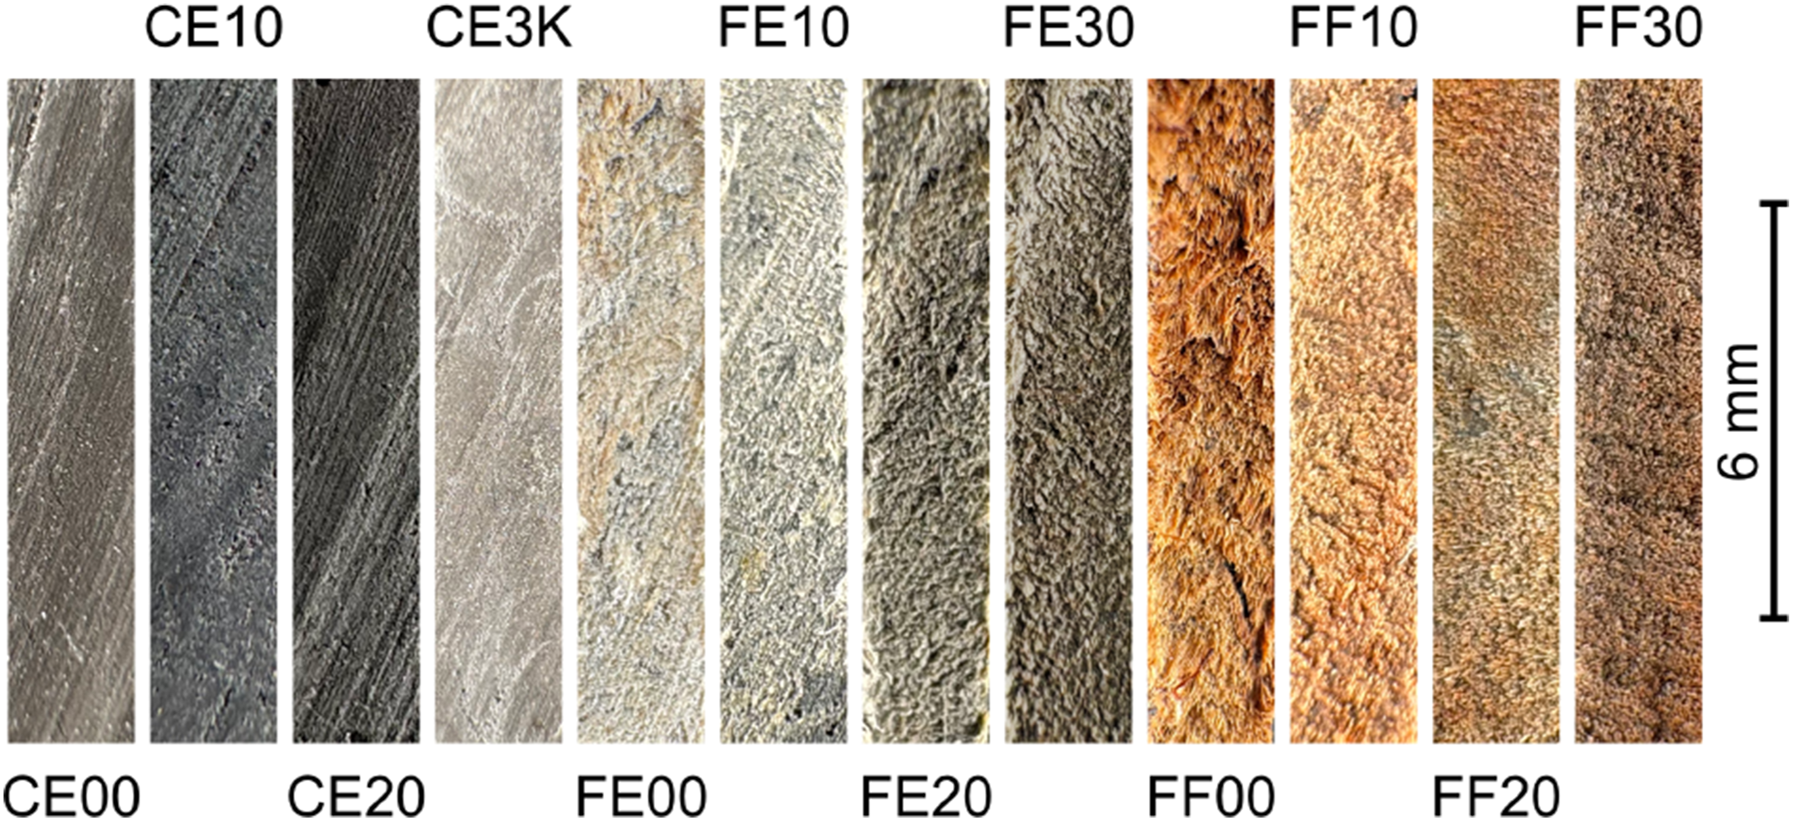
As the thixotropy of the resin mixtures increased significantly with the addition of fillers, particularly with the milled CF filler, the impregnation and processability were affected, resulting in a lower fiber mass ratio (FMR) at higher filler contents. Therefore, the FMRs were analyzed as a function of the filler mass ratios (PMRM, (particle) filler content in relation to the matrix mass), revealing that the relationships could best be approximated by quadratic polynomial fits:


Testing
Before testing, the samples were conditioned under standard climate conditions. Mechanical testing was conducted using a spindle-driven universal testing machine, following the specifications of DIN EN ISO 14125. 98 The support span was set at 81 mm and the loading span at 27 mm, with the load induction cylinders having a radius of 5 mm. A preload of 0.2 MPa was applied and the testing speed was maintained at 5 mm/min to ensure quasi-static conditions. During testing, the force and the midpoint deflection were recorded.
Mechanical performance indicators, flexural strength σflx and flexural modulus Eflx, were calculated per-sample from the load at failure Fmax and the stiffness of the sample ΔF/ΔS. This conversion is based on state-of-the-art equations from Ref. 99, but was extended to include specific methodic aspects required for CFW samples. In this method, the failure load is defined as the load corresponding to the first local maximum before a significant load drop associated with a subsequent reduction in sample stiffness, see equation (6), while sample stiffness is determined by calculating the slope from the force-deflection curve across evenly distributed bins, with the maximum bin slope selected, see second part of equation (7). This approach is required in CFW due to the lack of consolidation and the variation in the outer geometry of the samples, which resulted in disturbances in the experimental data graphs. A higher number of bins N typically returns slightly higher values but is also more sensitive to local disturbances of the graph.
For the analysis of the 4PB data sets, N = 20 bins between zero deflection and failure deflection were used to extract the stiffness of the sample. Identifying failure loads requires much higher bin numbers (N = 100) as slope changes between peaks need to be resolved. Furthermore, all bin borders falling within a segment of negative slope were removed to simplify the computation.
The flexural strength σflx is given by


Results
Material-level flexural analysis
In the following, the experimental 4PB test data are analyzed. No variation in the primary failure mechanism (fiber fracture) was observed between samples or series. The addition of fillers did not alter the failure mechanisms. The lower region of the sample cross-section experienced fiber tearing and fracture. The carbon-fiber samples were the only ones that exhibited complete separation into two distinct fragments, with the upper region of the cross-section displaying matrix cracking as a secondary mechanism.
First, mechanical performance is evaluated in terms of (mass-specific) strength and modulus. Using mass-specific values instead of volume- or density-specific values avoids introducing uncertainties from the conversion of mass to volume ratios based on uncertain material densities. It also does not require neglect of porosity or voids, which are inherent to the CFW process and should not be fully suppressed by process adjustments during sample fabrication. Therefore, mass-specific comparisons are considered more robust for this study.
A nominal cross-sectional normalization was performed and it yields trends that are qualitatively consistent with the reported mass-specific values. However, for the CE series, a cross-sectional normalization overestimates mechanical performance, especially modulus, compared to mass-specific results.
In the next step, based on the composition of the samples, their ecological performance in terms of GWP is determined, considering only module A1. Next, both performance indicators are integrated into an eco-mechanical analysis.
Mechanical analysis
The values for flexural strengt σflx [MPa], see equation (5), and flexural modulus Eflx [GPa], see equation (7), were both divided by the sample mass [g], see Table 1, to obtain mass-specific values [MPa/g and GPa/g], which better reflect lightweight performance, see Figure 5. Overall, the switch to mass-specific values narrows the performance gap between the CE and FE series as well as between the FE and FF series, highlighting the influence of the sample density. According to their datasheet, flax fibers (1.45 g/cm3) show a lower density compared to carbon fibers (1.77 g/cm3), while furan resin (1.2 g/cm3) exhibits a similar density compared to 2K or 3K epoxy resins (1.18–1.20 g/cm3 or 1.15–1.20 g/cm3). The relative rankings within each series remain approximately consistent, except for CE3K. Experimental mechanical performance. Flexural strength (red, left axis), flexural modulus (gray, left axis), and their mass-specific (blue, right axis) values. Ordinates are truncated to enhance comparability, causing the standard deviation bars to appear overly large.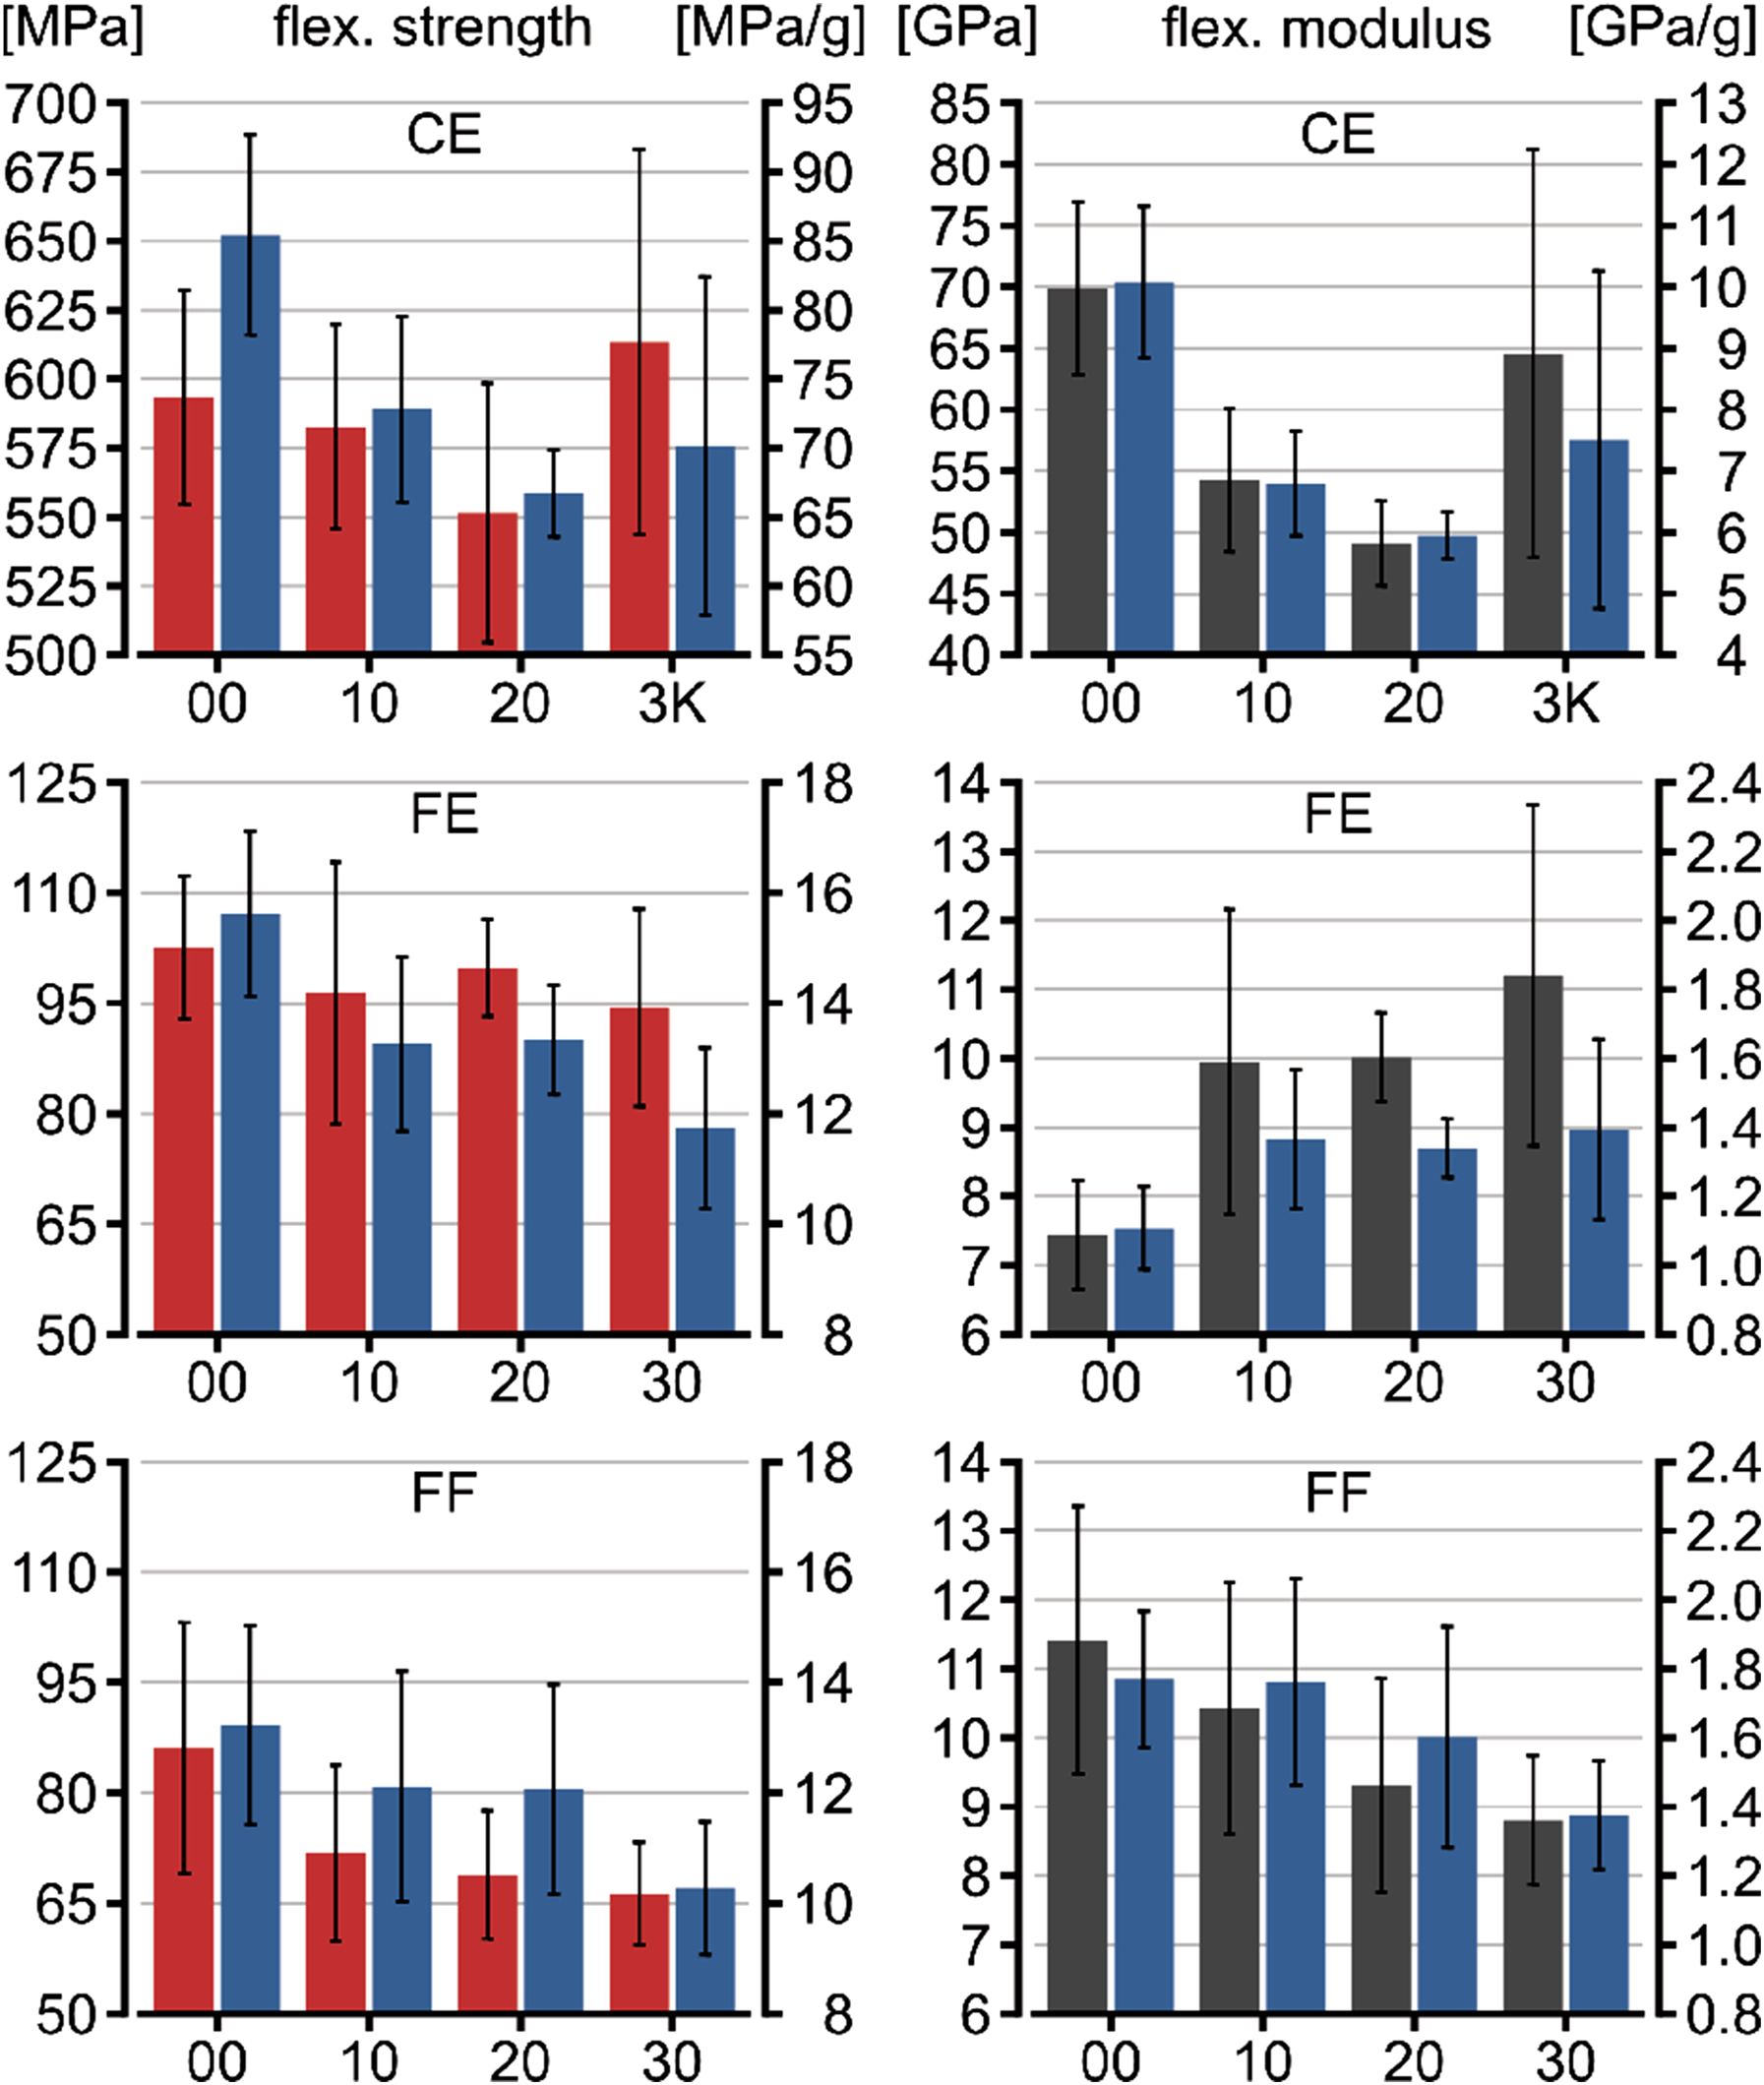
Comparing all samples series, the CE series demonstrated superior performance in mass-specific flexural strength, ranging from approximately 65 to 85 MPa/g, compared to 11 to 16 MPa/g for the FE series and 10 to 14 MPa/g for the FF series. This global disparity between the CE and FE series reflects the differences in material properties between carbon and flax fibers, whereas the discrepancy between the FE and FF series arises from the change in the matrix system. In general, error bars indicate consistent reproducibility between samples, suggesting sufficient manufacturing control.
Within the CE series, CE00 exhibits the highest mass-specific strength, with a steady decrease as filler content increases. However, it was expected that the mechanical performance would improve with a higher milled CF content. The possible reason might be that the milled CF particles were below the critical fiber length or filler content required for efficient load transfer. 100 Outside this range, they would have introduced additional interfaces weakening the fiber composite. CE3K and CE10 showed comparable mass-specific strengths, with a mean difference of −2.7 MPa/g, 95% CI [−15.9, 10.6], and a negligible effect size, Hedges’ g = −0.26, 95% CI [−1.37, 0.85], although CE3K exhibited greater variability. CE3K was anticipated to outperform CE10 and even CE00. The lower performance in mass-specific strength can be attributed to differences in sample mass and FMR, as CE3K outperforms CE00 in absolute strength, while being 27% heavier than CE00 samples and their FMR is 17% lower than in CE00, on average. So, compared with CE00, CE3K showed lower mass-specific strength, with a mean difference of −15.4 MPa/g, 95% CI [−29.0, −1.8]. This corresponded to a large negative effect size, Hedges’ g = −1.44, 95% CI [−2.77, −0.12].
The FE series exhibits a greater spread between FE00 and FE30, with performance decreasing as filler content increases. However, FE10 and FE20 showed comparable mass-specific strengths, with a mean difference of 0.1 MPa/g, 95% CI [−1.5, 1.6], and a negligible effect size, Hedges’ g = 0.04, 95% CI [−1.10, 1.18]. The wide confidence intervals may reflect the larger standard deviation observed in the FE10 samples.
In the FF series, the spread is comparable to that of the FE series, and the mass-specific strength also decreases with increasing filler content. FF10 and FF20 showed comparable mass-specific strengths, with a mean difference of −0.1 MPa/g, 95% CI [−2.1, 2.0], and a negligible effect size, Hedges’ g = −0.03, 95% CI [−1.01, 0.96]. In contrast, FF30 showed a more pronounced decrease, with a mean difference of −2.9 MPa/g, 95% CI [−4.6, −1.3], corresponding to a large negative effect size, Hedges’ g = −1.78, 95% CI [−3.09, −0.47]. The standard deviations in the FF series were slightly larger than those observed in the FE series.
The CE series also displays significantly higher mass-specific flexural moduli, ranging from 6 to 10 GPa/g, compared to 1.1 to 1.4 GPa/g for the FE series and 1.3 to 1.8 GPa/g for the FF series. Again, the discrepancy between the CE series and the natural-fiber series (FE and FF) reflects the substantial difference in modulus between carbon fibers and natural fibers. The FF series outperforms the FE series in the mass-specific modulus, which was anticipated due to the higher modulus of the furan resin. Deviations are modest and error bars indicate sufficient processing consistency.
Within the CE series, CE00 stands out with the highest modulus, which declines as the filler content increases. However, it was again expected that the addition of milled CF would enhance the composite modulus. In addition to the potential explanations discussed above with respect to their strength, a further factor specific to the modulus may be that the milled CF are particles and therefore can be understood as poorly aligned, so that the adverse effects associated with stress concentrations outweigh the potential benefits of the high tensile performance of the pitch-based milled CF fillers. Relative standard deviations are acceptable and remain constant with a higher filler content. Similarly to the strength values, CE3K exhibits the highest standard deviations and slightly higher mass-specific modulus than CE10, with a mean difference of 0.72 GPa/g, 95% CI [−2.28, 3.71], and a small-to-negligible effect size, Hedges’ g = 0.35, 95% CI [−0.76, 1.47]. CE3K shows lower values than CE00, with a mean difference of −2.58 GPa/g, 95% CI [−5.55, 0.40]. This corresponded to a large, but rather uncertain, negative effect size, Hedges’ g = −1.16, 95% CI [−2.42, 0.10]. A similar trend was observed for the absolute modulus. Based on the datasheet values, only a marginal improvement was expected for CE3K, which is, however, not reflected in the experimental data.
The FE series shows more pronounced differences compared to other series, with the mass-specific modulus slightly increasing alongside biochar filler content. Compared with FE00, FE30 shows increased mass-specific modulus, with a mean difference of 0.28 GPa/g, 95% CI [0.03, 0.54], corresponding to a large positive effect size, Hedges’ g = 1.38, 95% CI [0.22, 2.55]. One possible explanation for this could be that filler positively affects the polymerization process, leading to an increase in the degree of cross-linking, similar to Ref. 101. The increase in absolute modulus values is more pronounced.
In the FF series, the mass-specific modulus decreases with increasing biochar filler content, in contrast to the FE series. FF00 and FF10 perform at nearly the same level with a mean difference of −0.01 GPa/g, 95% CI [0.26, 0.25] at Hedges’ g = −0.02, 95% CI [-0.97, 0.93], while FF20 and FF30 exhibit progressive declines with a mean difference of −0.23 GPa/g, 95% CI [-0.51, 0.06] at Hedges’ g = −0.80, 95% CI [-1.96, 0.36]. In terms of absolute values, this trend appears more uniform. The standard deviations within the FF series are similar to those observed in the FE series.
Ecological analysis
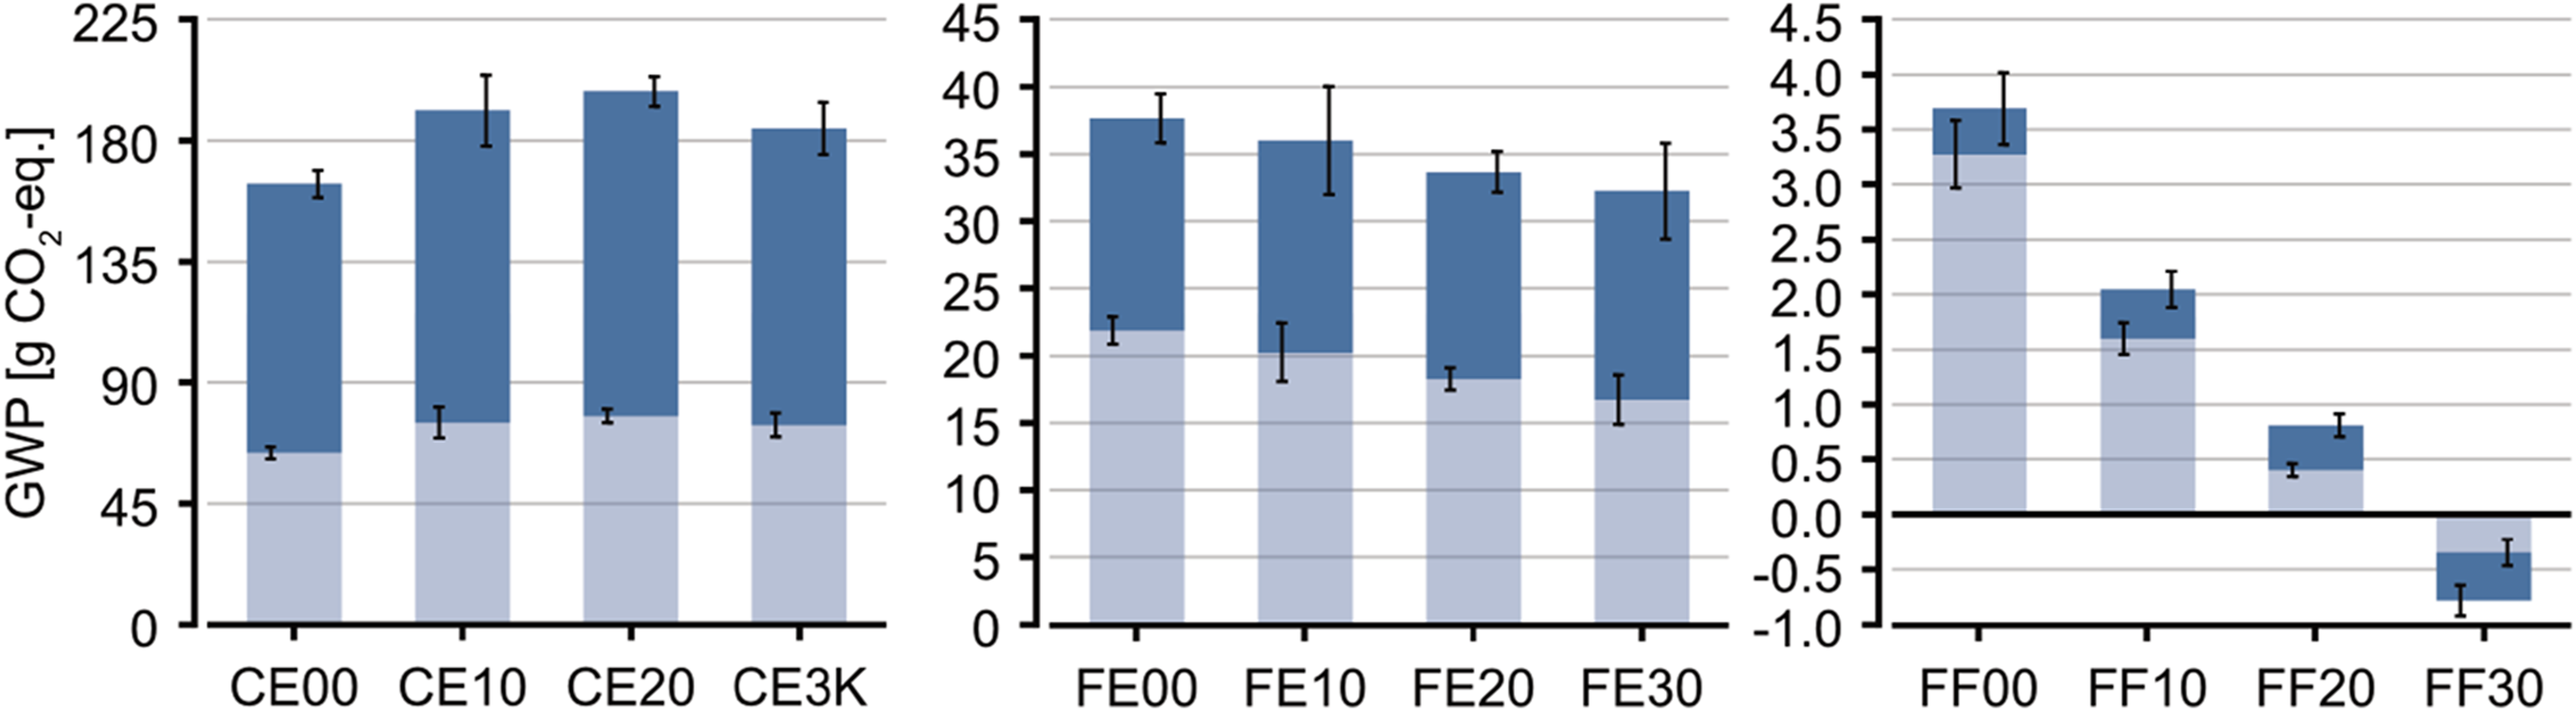
Given the strong correlation between GWP and embodied energy, see equation (1), this study considers only GWP values. Due to the minimal energy consumption during CFW fabrication,60,62 the analysis focuses on the GWP arising from the production of raw materials (A1). During manufacturing, the masses of fiber, resin, and filler were recorded, enabling the calculation of the GWP per sample and for each constituent material. The material-specific GWP values, see Section “Material System”, employed are either extracted from the literature, representing the general category of material, or, when available, provided specifically for the utilized product. Figure 6 shows the GWP of each material individually, while Figure 7 illustrates the accumulated GWP per sample. Ecological performance as GWP per constituent, calculated from the measured material composition and the mass-specific GWP factors for each material. Ranges indicate uncertainty in material-specific GWP values, compare Section “Material System”, while error bars result from variability between samples. Ecological performance as GWP per sample. Ranges indicate uncertainty in material-specific GWP values, compare Section “Material System”, while error bars result from variability between samples.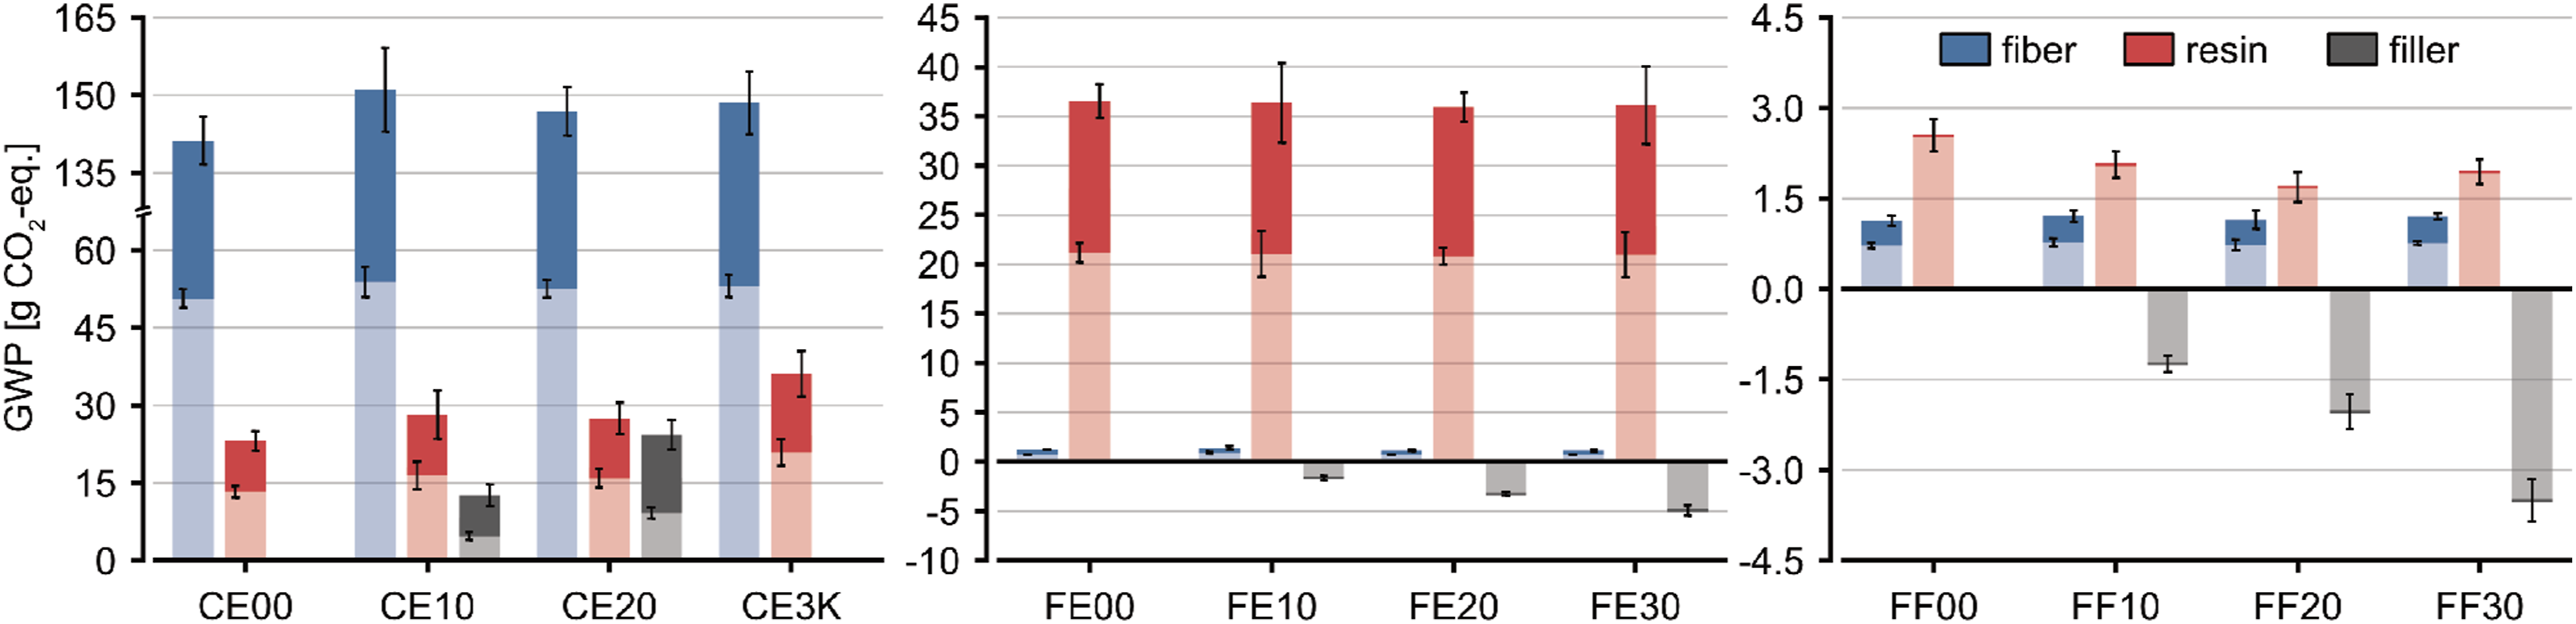
The decomposition into individual components allows identification of which constituents contribute the most to the total GWP in the respective samples, see Figure 6. In the CE series, the GWP contribution from carbon fibers is dominant. The GWP of the resin in both the CE and FE series is at a comparable level as the same epoxy resin is used. However, because the GWP contribution of the fibers is significantly reduced when switching from carbon to flax, the resin’s GWP contribution becomes the dominant part of the material system in the FE series. The resin GWP contribution is slightly higher as a result of a lower FMR in the FE series, resulting from the substitution of filament to staple fibers. By further replacing the epoxy with furan resin, the GWP contribution of the matrix system is also substantially reduced. Consequently, in the FF series, the carbon-negative impact of the biochar filler is comparable to that of the combined fiber and resin contributions and becomes the dominant constituent of the material system at higher filler contents.
Across all three series groups, there are only minor variations between the individual GWP contributions of the same fiber or resin systems between series, resulting from manufacturing-related fluctuations. An exception is observed in the CE group, where the samples of the CE3K series exhibit higher GWP values for the resin. This increase results from a lower FMR and a higher sample mass. Regarding the standard deviations, no outliers were recorded across series.
Within the CE series, the GWP range for the fiber system is notably large due to the high uncertainty in the literature-based GWP values associated with carbon fibers. The milled CF filler in CE20 contributes a GWP similar to that of the epoxy system, although its mass ratio is much lower than that of the resin. At the lower end of the carbon fiber GWP range, the fiber contribution is still twice that of the epoxy resin.
In the FE series, the GWP range for the resin remains more constant across sample series compared to that of the CE series, indicating less challenging blending during fabrication with the biochar filler relative to the milled CF filler. In the FE samples, the biochar at each stage compensates more CO2-eq. than in the corresponding FF samples, a result attributed to slightly higher filler content caused by variations in the matrix formulation.
In the FF series, the GWP contribution of the resin system is further reduced compared to the FE series, remaining on average three times higher than that of the fiber contribution. However, since the GWP contribution of the resin is now at a magnitude similar to that of the filler, a rough trend of decreasing the GWP of the resin with increasing filler content can be observed. Since the fiber and resin GWPs are of similar magnitude, it is evident that the amount of fiber can be determined more precisely during fabrication (linear density and mass difference), while the resin consumption remains more uncertain due to leakages, resulting in larger error bars for the resin system.
By combining the individual contributions of fiber, matrix, and filler, the total contribution of GWP of each sample can be analyzed across series, see Figure 7, which is more relevant than the individual contributions to improve the sustainability of the material system. The ranges were determined by combining the extreme values of the individual ranges.
When comparing the accumulated GWP across sample series, each series exhibits distinct value ranges, clearly separating the three series from each other without overlapping. The CE series exhibit the highest values, with an average of 130 g CO2-eq. (ranging from 60 to 200 g CO2-eq.), the FE series average around 27 g CO2-eq. (16 to 38 g CO2-eq.), and the FF series have the lowest average at 1.3 g CO2-eq. (−0.8 to 3.7 g CO2-eq.). In the CE series, the accumulated GWP increases with the filler content, while the CE3K samples are between CE00 and CE10. For the FE series, the GWP decreases with increasing filler content but remains positive across all filler levels. In the FF series, as filler content increases, combined GWP contributions notably decrease, resulting in a carbon-neutral or even carbon-negative fiber-composite material system at higher filler contents.
Eco-mechanical analysis
In the subsequent stage of the analysis, the mechanical and ecological assessments presented in the previous sections are integrated to evaluate the eco-mechanical behavior of the material systems. Unlike other studies,102,52 where eco-mechanical performance is evaluated using GWP- and mass-specific mechanical performance indicators, this approach is not adopted here, as negative GWP values in the current dataset would lead to misleading results. Instead, a stepwise analysis is performed.
Data comparison
First, the mass-specific mechanical performance indicators and GWP contributions are plotted for each sample series as a function of their filler content per sample mass (PMRS), see Figure 8. Eco-mechanical performance. Filler content as a percentage of sample mass (PMRS). For the GWP values, compare Section “Material System”, the midpoint is shown with averaged standard deviations from the min and max range sample distributions as error bars. For the experimental mechanical performance indicators, the mean is shown with error bars representing the standard deviation. Within the measured range, the error bars indicate experimental reproducibility and should not be interpreted as predictive uncertainty of the fitted trend.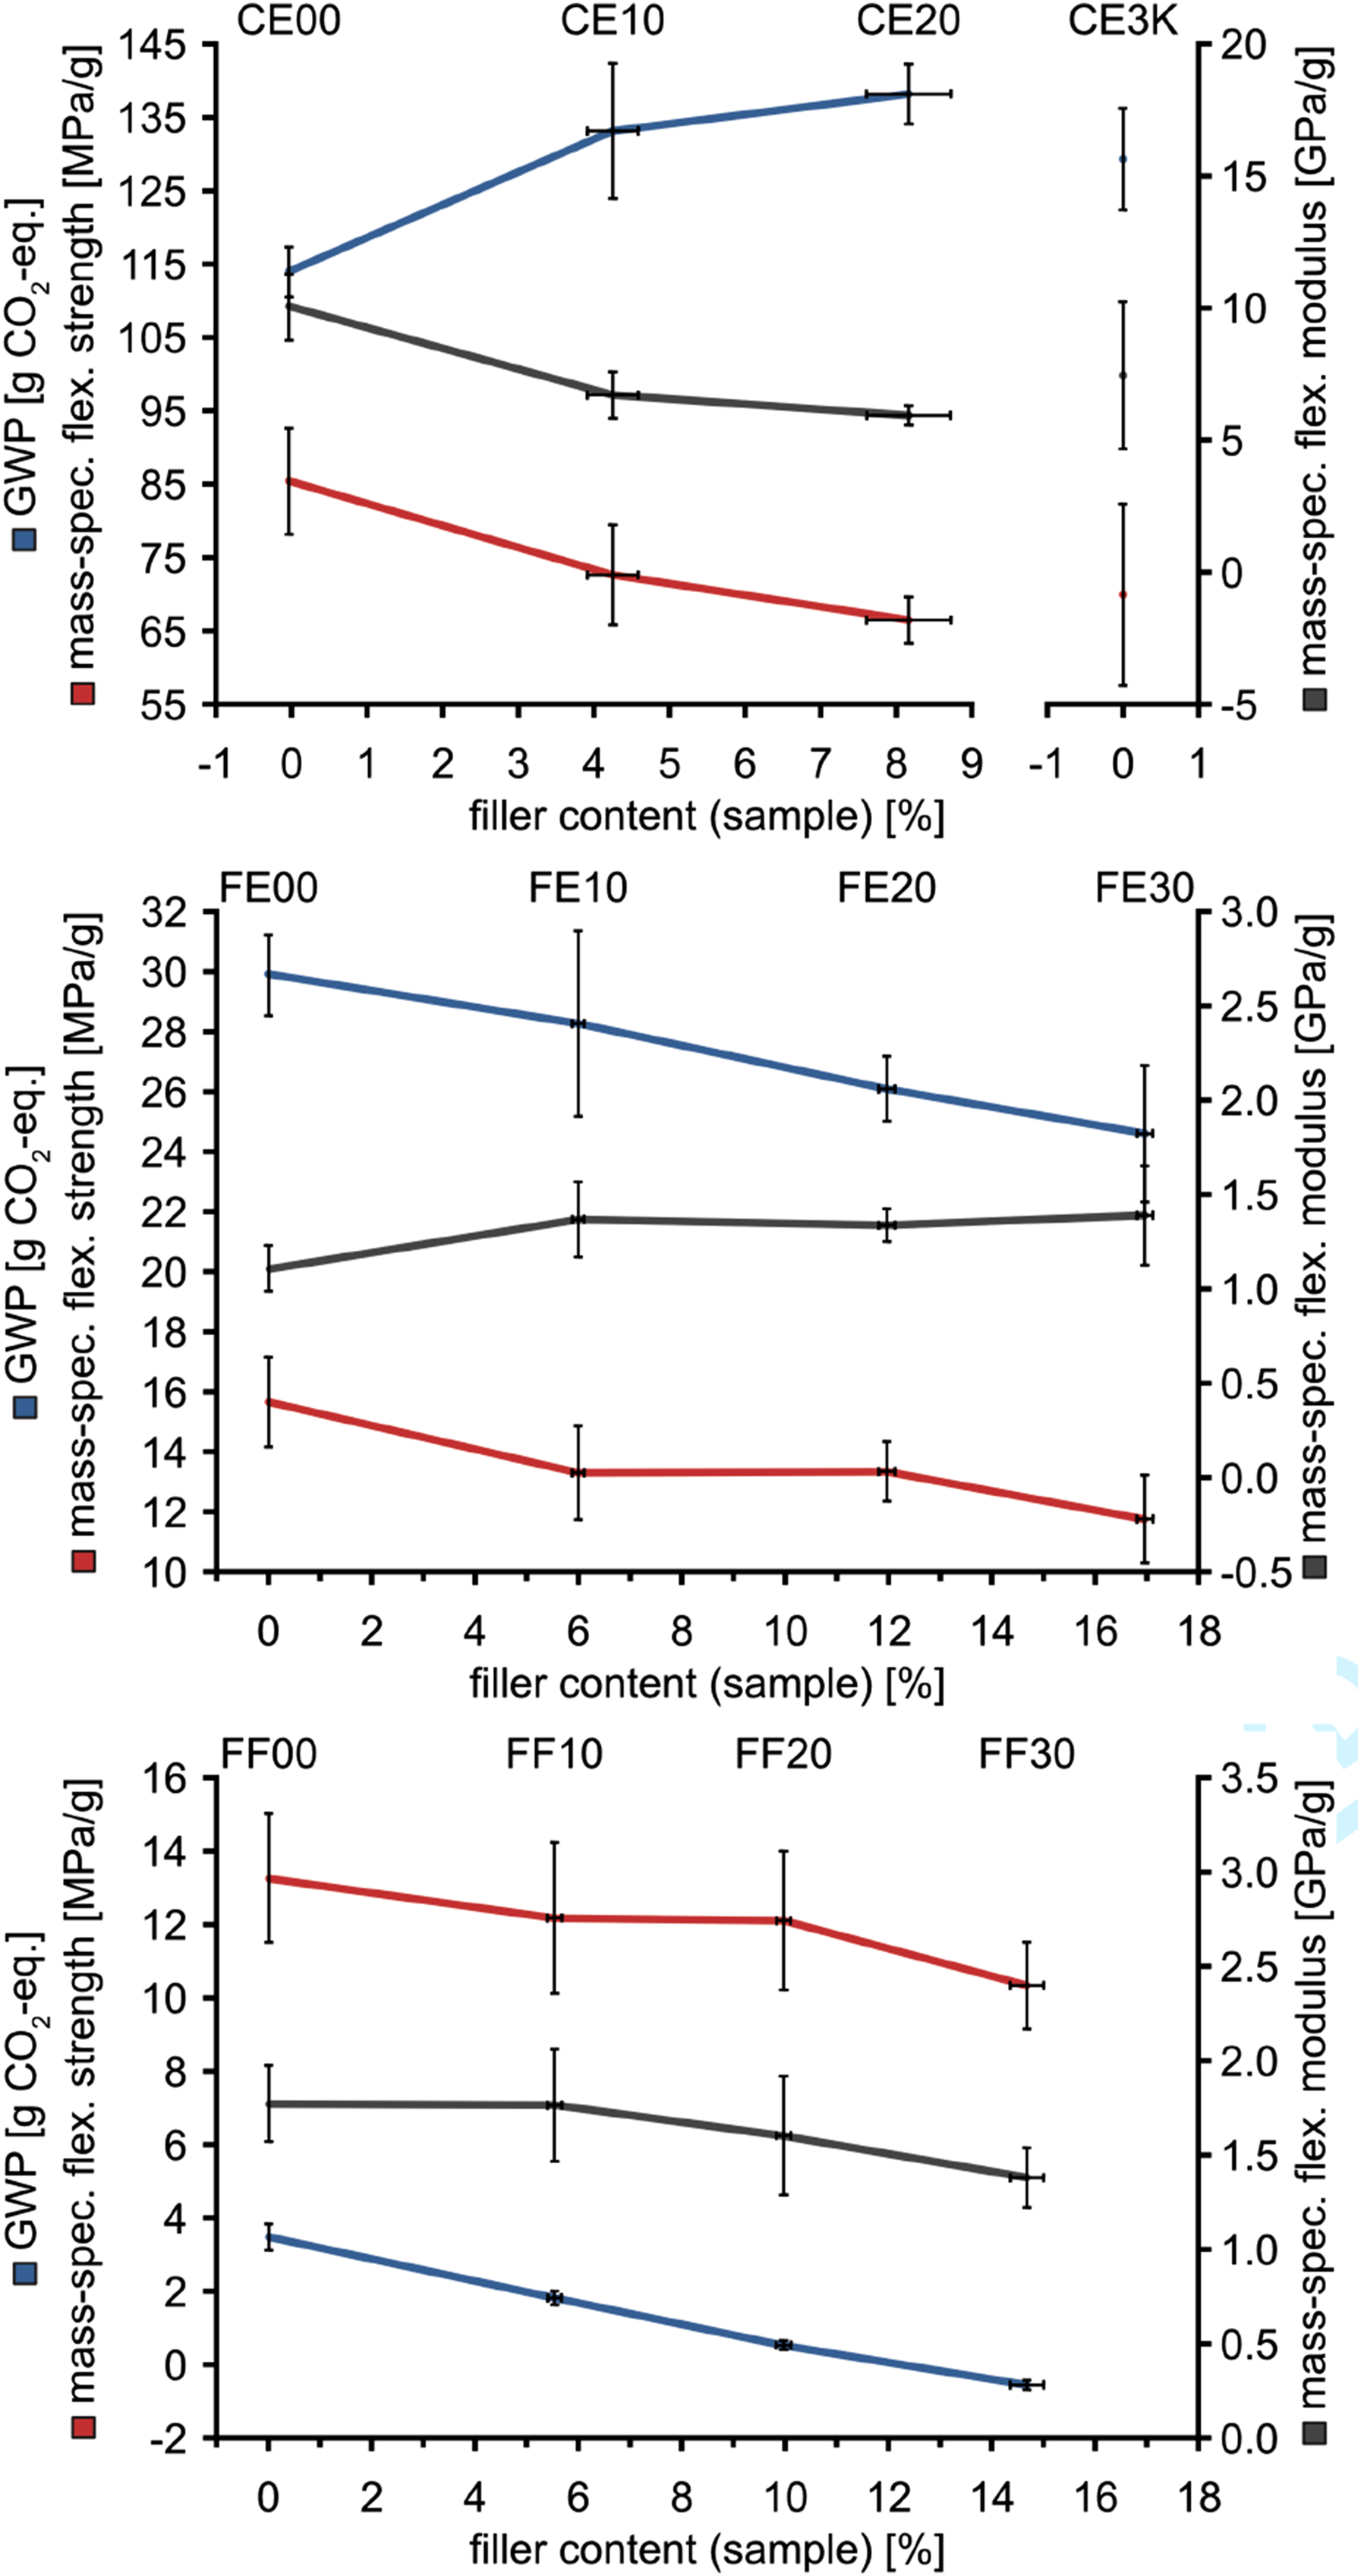
For the CE series, the eco-mechanical analysis indicates that the approaches outlined in Scenario 1 are ineffective. Increasing the filler content results in higher GWP values, with a mean difference of 24.1 g CO2-eq., 95% CI [20.2, 28.0] at Hedges’ g = 6.00, 95% CI [3.46, 8.54], while simultaneously degrading mechanical performance by −4.13 GPa/g, 95% CI [−5.28, −2.97] at Hedges’ g = −4.78, 95% CI [−6.89, −2.67] and −18.9 MPa/g, 95% CI [−25.7, −12.0] at Hedges’ g = −3.45, 95% CI [−5.12, −1.78]. Consequently, the CE00 series offers the most favorable eco-mechanical performance. Furthermore, the CE3K variant is less eco-mechanically efficient than CE00: It exhibits 13.4% higher GWP at 7.4% lower mass-specific flexural modulus and only 3.5% higher mass-specific flexural strength. When comparing via GWP-specific mass-specific mechanical performance indicators, 52 CE3K shows a loss of −29.4 MPa/g2, 95% CI [-56.7, −2.1] at Hedges’ g = −1.39, 95% CI [−2.70, −0.08] in modulus and −0.20 MPa/g2, 95% CI [−0.34, −0.06] at Hedges’ g = −1.81, 95% CI [−3.23, −0.39] in strength.
In the FE samples, the strategy corresponding to Scenario 2 is potentially effective as both the GWP per sample and the mass-specific flexural strength decrease with increasing filler content, while the mass-specific flexural modulus improves, resulting in a mean difference of 18.1 MPa/g2, 95% CI [9.6, 26.6] at Hedges’ g = 2.52, 95% CI [1.08, 3.97] in GWP- and mass-specific modulus and −0.06 MPa/g2, 95% CI [−0.119, 0.004] at Hedges’ g = −0.94, 95% CI [−2.03, 0.15] in GWP- and mass-specific strength, when comparing FE30 and FE00. Consequently, the addition of biochar fillers in FE systems can enhance eco-mechanical performance, depending on the rate of change in individual parameters, see Section “Carbon neutrality”.
In the FF samples evaluated under Scenario 3, the approach is effective. The GWP reaches zero before the mechanical performance indicators, enabling the development of carbon-neutral (A1) fiber composite structural materials at the cost of reduced mechanical performance. Compared with FF00, FF30 shows reductions in A1 GWP per sample, with a mean difference of −4.0 g CO2-eq., 95% CI [−4.3, −3.8], and a very large negative effect size, Hedges’ g = −14.52, 95% CI [−20.77, −8.28]. FF30 also showed reductions in mass-specific flexural modulus, with a mean difference of −0.39 GPa/g, 95% CI [0.59, −0.19], and a large negative effect size, Hedges’ g = −2.02, 95% CI [−3.40, −0.65], as well as in mass-specific flexural strength, with a mean difference of −2.9 MPa/g, 95% CI [−4.6, −1.3], and a large negative effect size, Hedges’ g = −1.78, 95% CI [−3.09, −0.47]. The reduction in strength can be mitigated by deploying more material, resulting in larger fiber net cross-sections, meeting performance requirements. Although increasing material volume is ineffective in restoring stiffness, losses in flexural modulus can be addressed through structural design modifications. Such adjustments have been successfully demonstrated in transitions from carbon fibers to flax fibers. 103
Carbon neutrality
In the next step of the analysis, the rate of change in the indicators of eco-mechanical performance and the potential to achieve carbon neutrality in the series FE and FF are examined, see Figure 9. The filler contents were converted from sample-specific PMRS to matrix-specific PMRM. The uncertainty of the model associated with the extrapolation was limited to the expected processing range in this analysis because it has limited significance beyond processing or even physically feasible boundaries. Carbon neutrality analysis. Mathematical extrapolation (left) and interpolation (right) based on measurements. Experimentally measured data points shown with standard deviation error bars indicating fabrication reproducibility uncertainty. Model uncertainty of the extrapolation shown with band. Filler content as a percentage of matrix mass (PMRM). A1 GWP per sample with carbon neutrality indicated by a black circle. Although higher filler contents exceed feasible processing limits, the full extrapolated range is illustrated, as the threshold is unknown. Based on equation (3), a filler content of 45.7 wt% for FE corresponds to zero FMR. This distinction is unnecessary for the FF series as only interpolations were applied.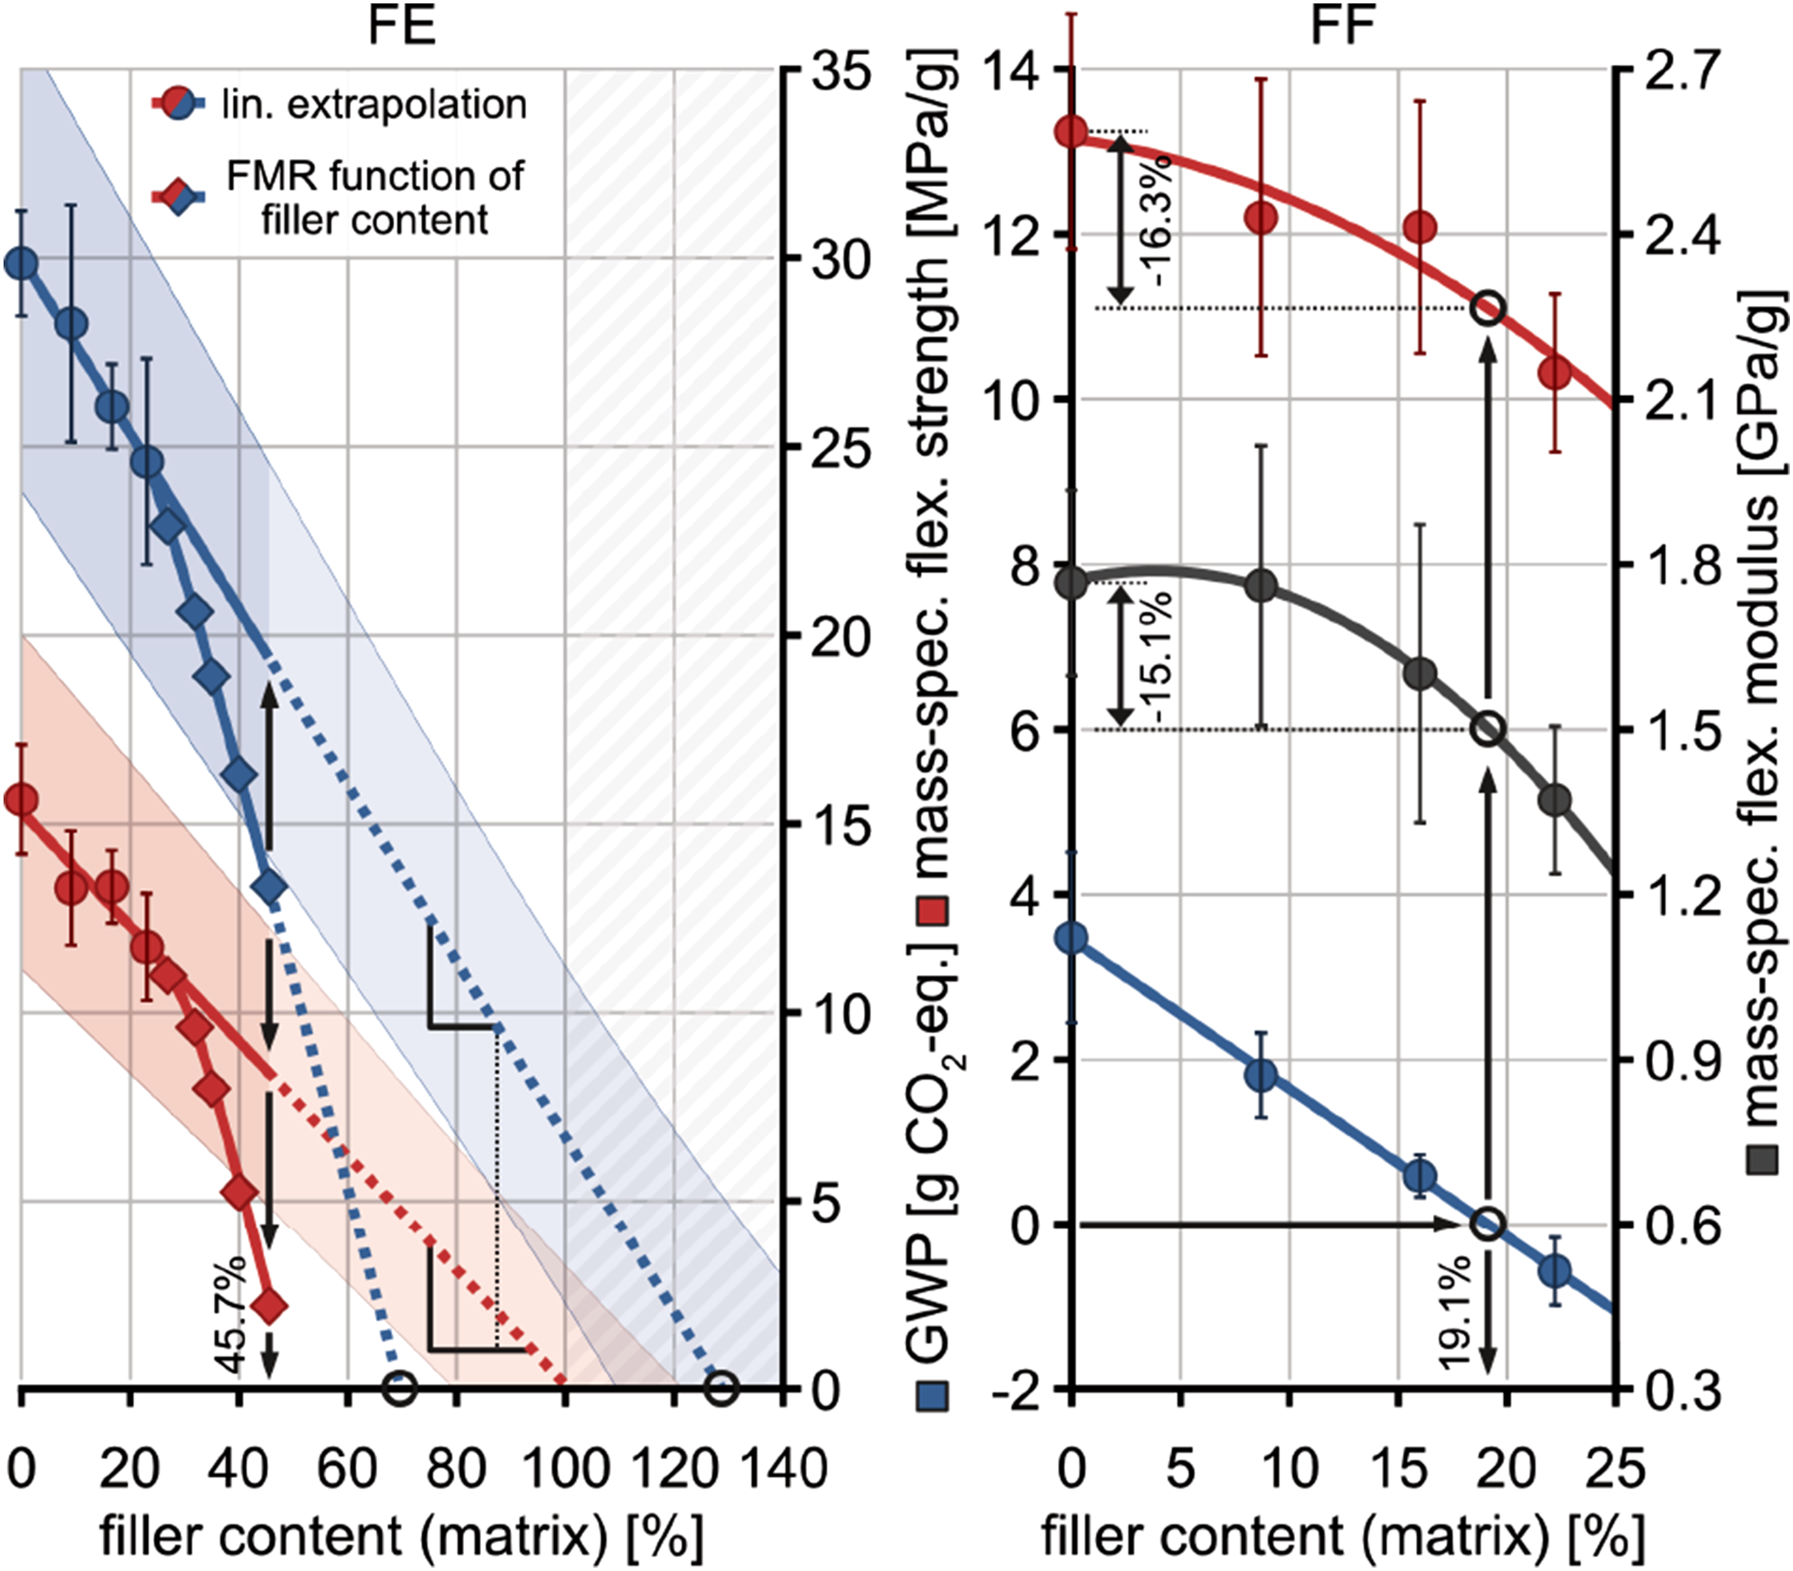
For the FE samples, trends in mass-specific flexural strength and GWP per sample were linearly extrapolated on the basis of the experimental data. GWP decreases 53% more strongly than flexural strength with increasing filler content, proving that the approach of scenario two is effective. However, carbon neutrality is not obtainable with this material system, as the flexural strength drops to zero before the linear extrapolation reaches carbon neutrality at a theoretical 128.8 wt% PMRM. Moreover, the linear extrapolation of the mass-specific strength reaches zero at 100 wt% PMRM, which is theoretically expected for a sample composed only of fiber and filler. Such a sample would still entail 6.72 g CO2-eq. based on the extrapolation. A calculation of the A1 GWP at 100 wt% with averaged samples’ FMR yields a slightly negative value; this deviation from the linear extrapolation is expected since the FMR is not constant over the filler content range. Substituting the deployed epoxy resin with a bio-based variant would also not enable the achievement of carbon neutrality, as this would yield only a 56% reduction 55 in the GWP of the resin, far below the tenfold decrease required at realistic PMRM values, see Figure 6.
Furthermore, the FMR decreases with increasing filler content, see equation (3). Incorporating this trend into the extrapolation accelerates the decline of both GWP and mass-specific flexural strength relative to the linear model. Although a significant simplification, FMR reaches zero at 45.7 wt% PMRM, according to equation (3). The residual mass-specific flexural strength for this sample, composed of resin and filler, was estimated using the rule of mixtures (σcomp = FVR σfiber + MVR σresin + PVRS σfiller) and the datasheet tensile properties of the involved materials, with the mass and particle volume ratio (MVR and PVR). For the biochar filler, no mechanical performance was assumed. The calculated ratio between 30 and 45.7 wt% PMRM was then applied to the experimental data of FE30. In this extrapolation, any potential changes in total sample mass with filler content were neglected due to the lack of identifiable trends in the experimental data.
In the FF series, A1 carbon neutrality is achieved within the tested filler range, making extrapolation unnecessary. Here, mechanical performance indicators were interpolated with quadratic polynomials and GWP with a linear function, yielding the highest coefficients of determination absent further constraints. The interpolation indicates that A1 carbon neutrality is reached in the FF series at PMRM = 19.1 wt%. At this point, the composite exhibits losses of 15.1% in mass-specific flexural modulus and 16.3% in mass-specific flexural strength. Thus, both indicators are similarly affected by the addition of biochar.
GWP trade-offs in structural design
In the final step of the analysis, the mass-specific GWP is plotted against the mass-specific mechanical performance, see Figure 10. The filler content is expressed relative to the mass of the matrix (PMRM) rather than the mass of the sample (PMRS). Here, model uncertainty was addressed by a sensitivity analysis, see Figure 10. Extrapolation of mass-specific A1 GWP as a function of mass-specific mechanical performance. Model-predicted values based on mathematical approximation, model uncertainty of ±10% from a sensitivity analysis shown as bands. Labels follow sample ID convention but indicate PMRM. Although higher filler contents exceed feasible processing limits, the full extrapolated range is illustrated, as the threshold is unknown. Based on equation (3), a filler content of 45.7 wt% for FE corresponds to zero FMR. This distinction is unnecessary for FF series as zero mechanical performance precedes zero FMR, see equation (4).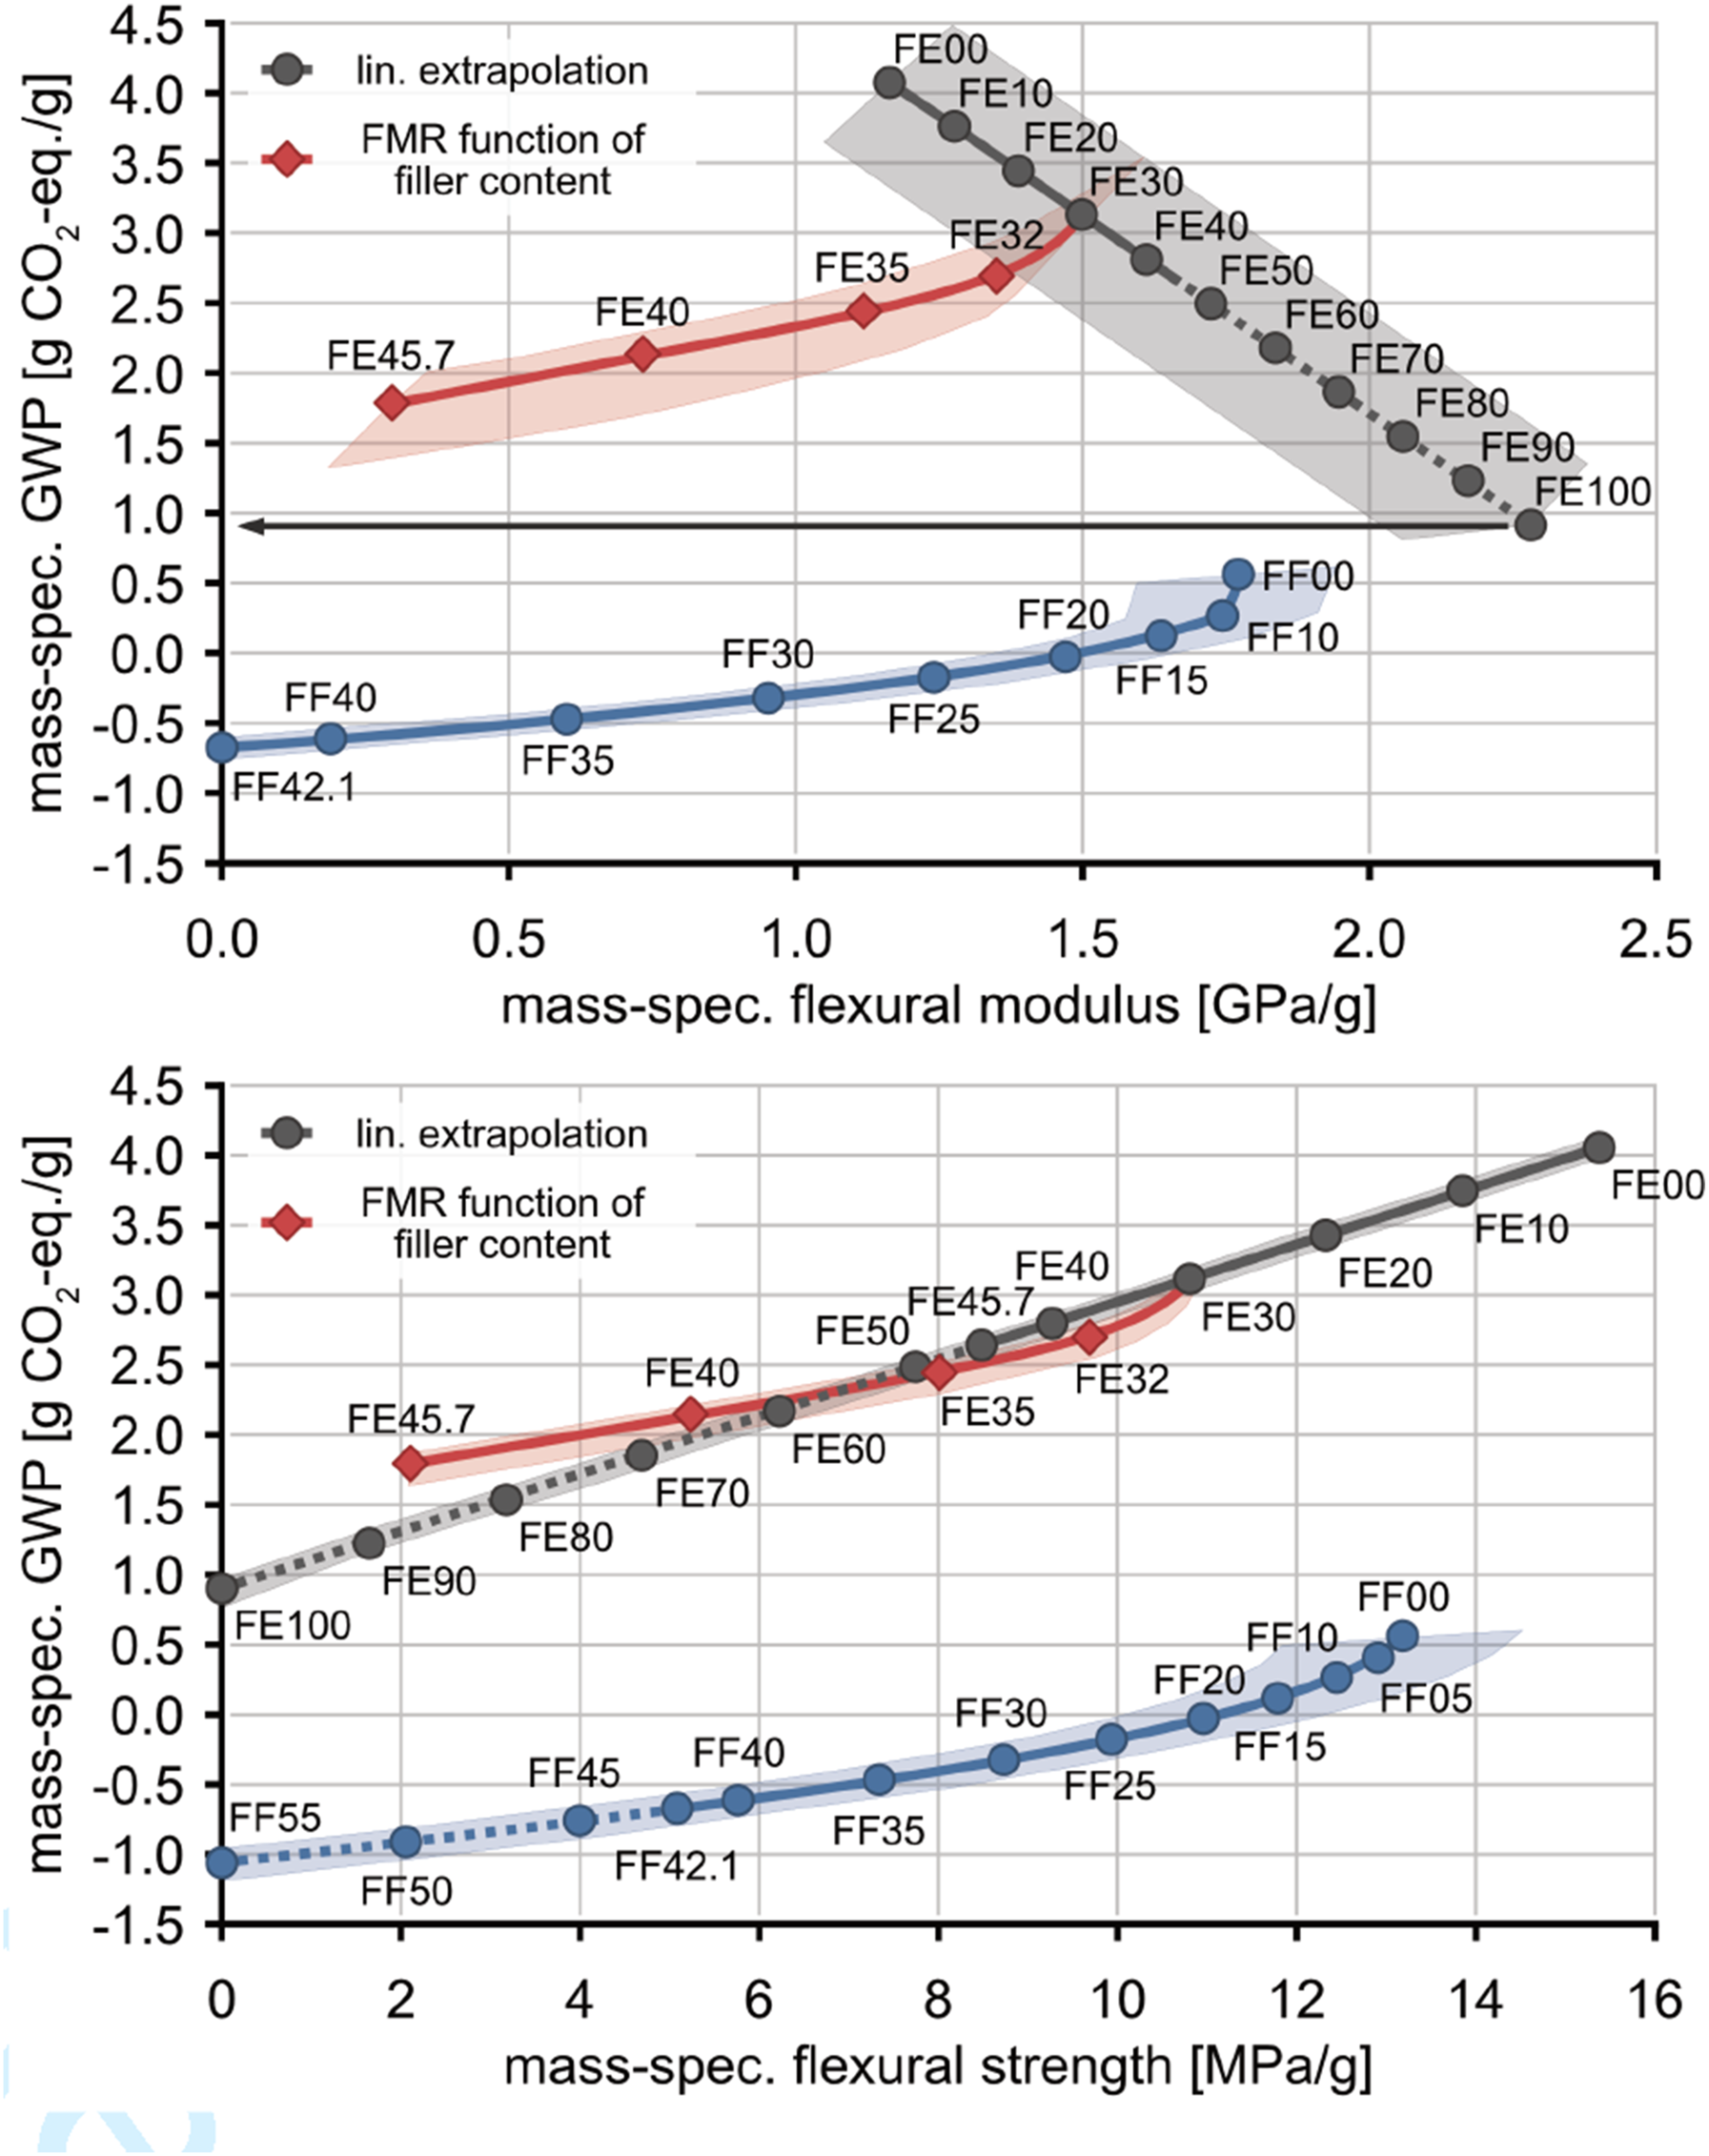
The measured data were extrapolated for filler contents between 0 and 100 wt% PMRM using a linear function for the FE series and a quadratic polynomial for the FF series. Next, the ranges were reduced (dashed lines) based on known limits, such as mechanical performance and FMR, while processability limits are unknown and thus ignored. The extrapolated mass-specific strength for the FF series is indicated by a dashed line beyond 42.1 wt% PMRM, where the mass-specific flexural modulus has already reached zero. Similarly, FE series values beyond 45.7 wt% PMRM are dashed, as equation (3) predicts a negative FMR past that point. This distinction is irrelevant for FF as zero FMR is only predicted at a higher PMRM of 45.6 wt%.
Although experimental data from FE00 to FE30 show an increase in mass-specific flexural modulus with filler addition, it is expected that the modulus declines sharply to zero at an undetermined threshold due to insufficient fiber–matrix bonding. At FE100, comprising only dry fiber and filler, both flexural modulus and strength must be zero.
Furthermore, following the approach as in Figure 9, the influence of FMR variation with increasing filler content was incorporated into the FE extrapolation. This graph ends at 45.7 wt% PMRM, maintaining some residual mechanical performance, exhibits more realistic behavior than the linear projection. It predicts a pronounced decline in the flexural modulus and a more gradual reduction in the GWP relative to the flexural strength than the linear extrapolation.
Figure 10 illustrates the relationship between mass-specific GWP and mass-specific mechanical performance, providing relevant parameters for the early phases of structural design. The plots show a clear separation in the GWP ranges between the FE and FF series, with only FF showing negative GWP values. Based on the extrapolation involving the variable FMRs, both materials systems, FE and FF, show a similar trend between mass-specific mechanical performance and mass-specific GWP, a result of both systems relying on the same filler.
Structural-level feasibility demonstration
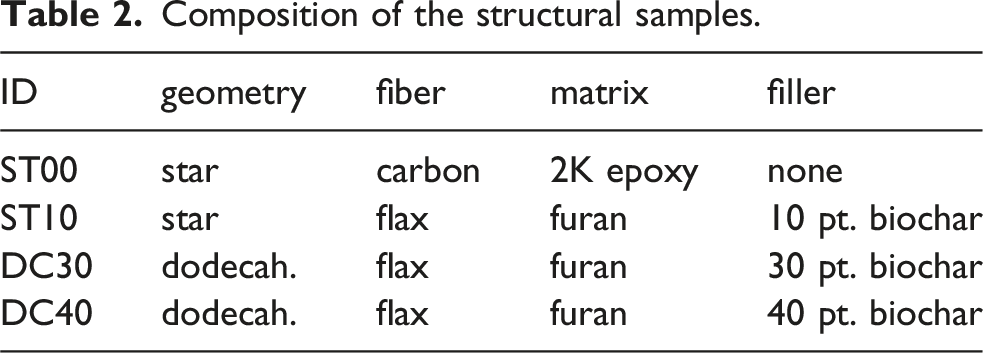
Composition of the structural samples.
Star-shaped sample
The star-shaped sample, originally introduced by Ref. 104 to CFW research to investigate the load induction and structural behavior of an architectural building system, 56 was selected for this study as a generic structural sample type, as its fabrication and testing characteristics are well established in previous studies.53,105,50,57,106 As the design of the star-shaped sample has been extensively discussed in the previous literature, its geometry is not illustrated in detail here. However, the sample employs sleeve/washer winding pins, the standard fiber anchors in CFW, arranged in two identical anchoring clusters positioned at opposite ends of the sample. The fibers are spanned exclusively between the winding pins, with no intermediate contact.
The winding sequence follows an Eulerian circle that travels around the sample in one direction while alternately connecting the top and bottom anchoring clusters. Hooking is performed at each winding pin using a full wrap (H = 1, as defined in Figure 7 of 25). This syntax produces multiple crossing points with alternating layering near the center of the structure. Consequently, the sample incorporates all fundamental structural primitives of CFW structures: straight segments, crossing points, and wrapped anchoring areas.
In this study, the ST10 sample, see Figure 11, was manufactured and compared to the ST00 sample previously reported from Ref. 53. The winding frame is designed to be disassembled and reusable. The winding pins are bolted to the frame at an angle. The sample fabrication followed the state-of-the-art CFW method, employing flax fibers and a furan resin matrix containing 10 pt. biochar. At this low filler content, no limitations in processability were observed. The curing was performed in a conventional oven according to the temperature and duration specification recommended by the resin supplier. Star-shaped structural sample (ST10). Nominal height between the winding sleeve centroids is 236 mm. Bolts and washers were removed before testing.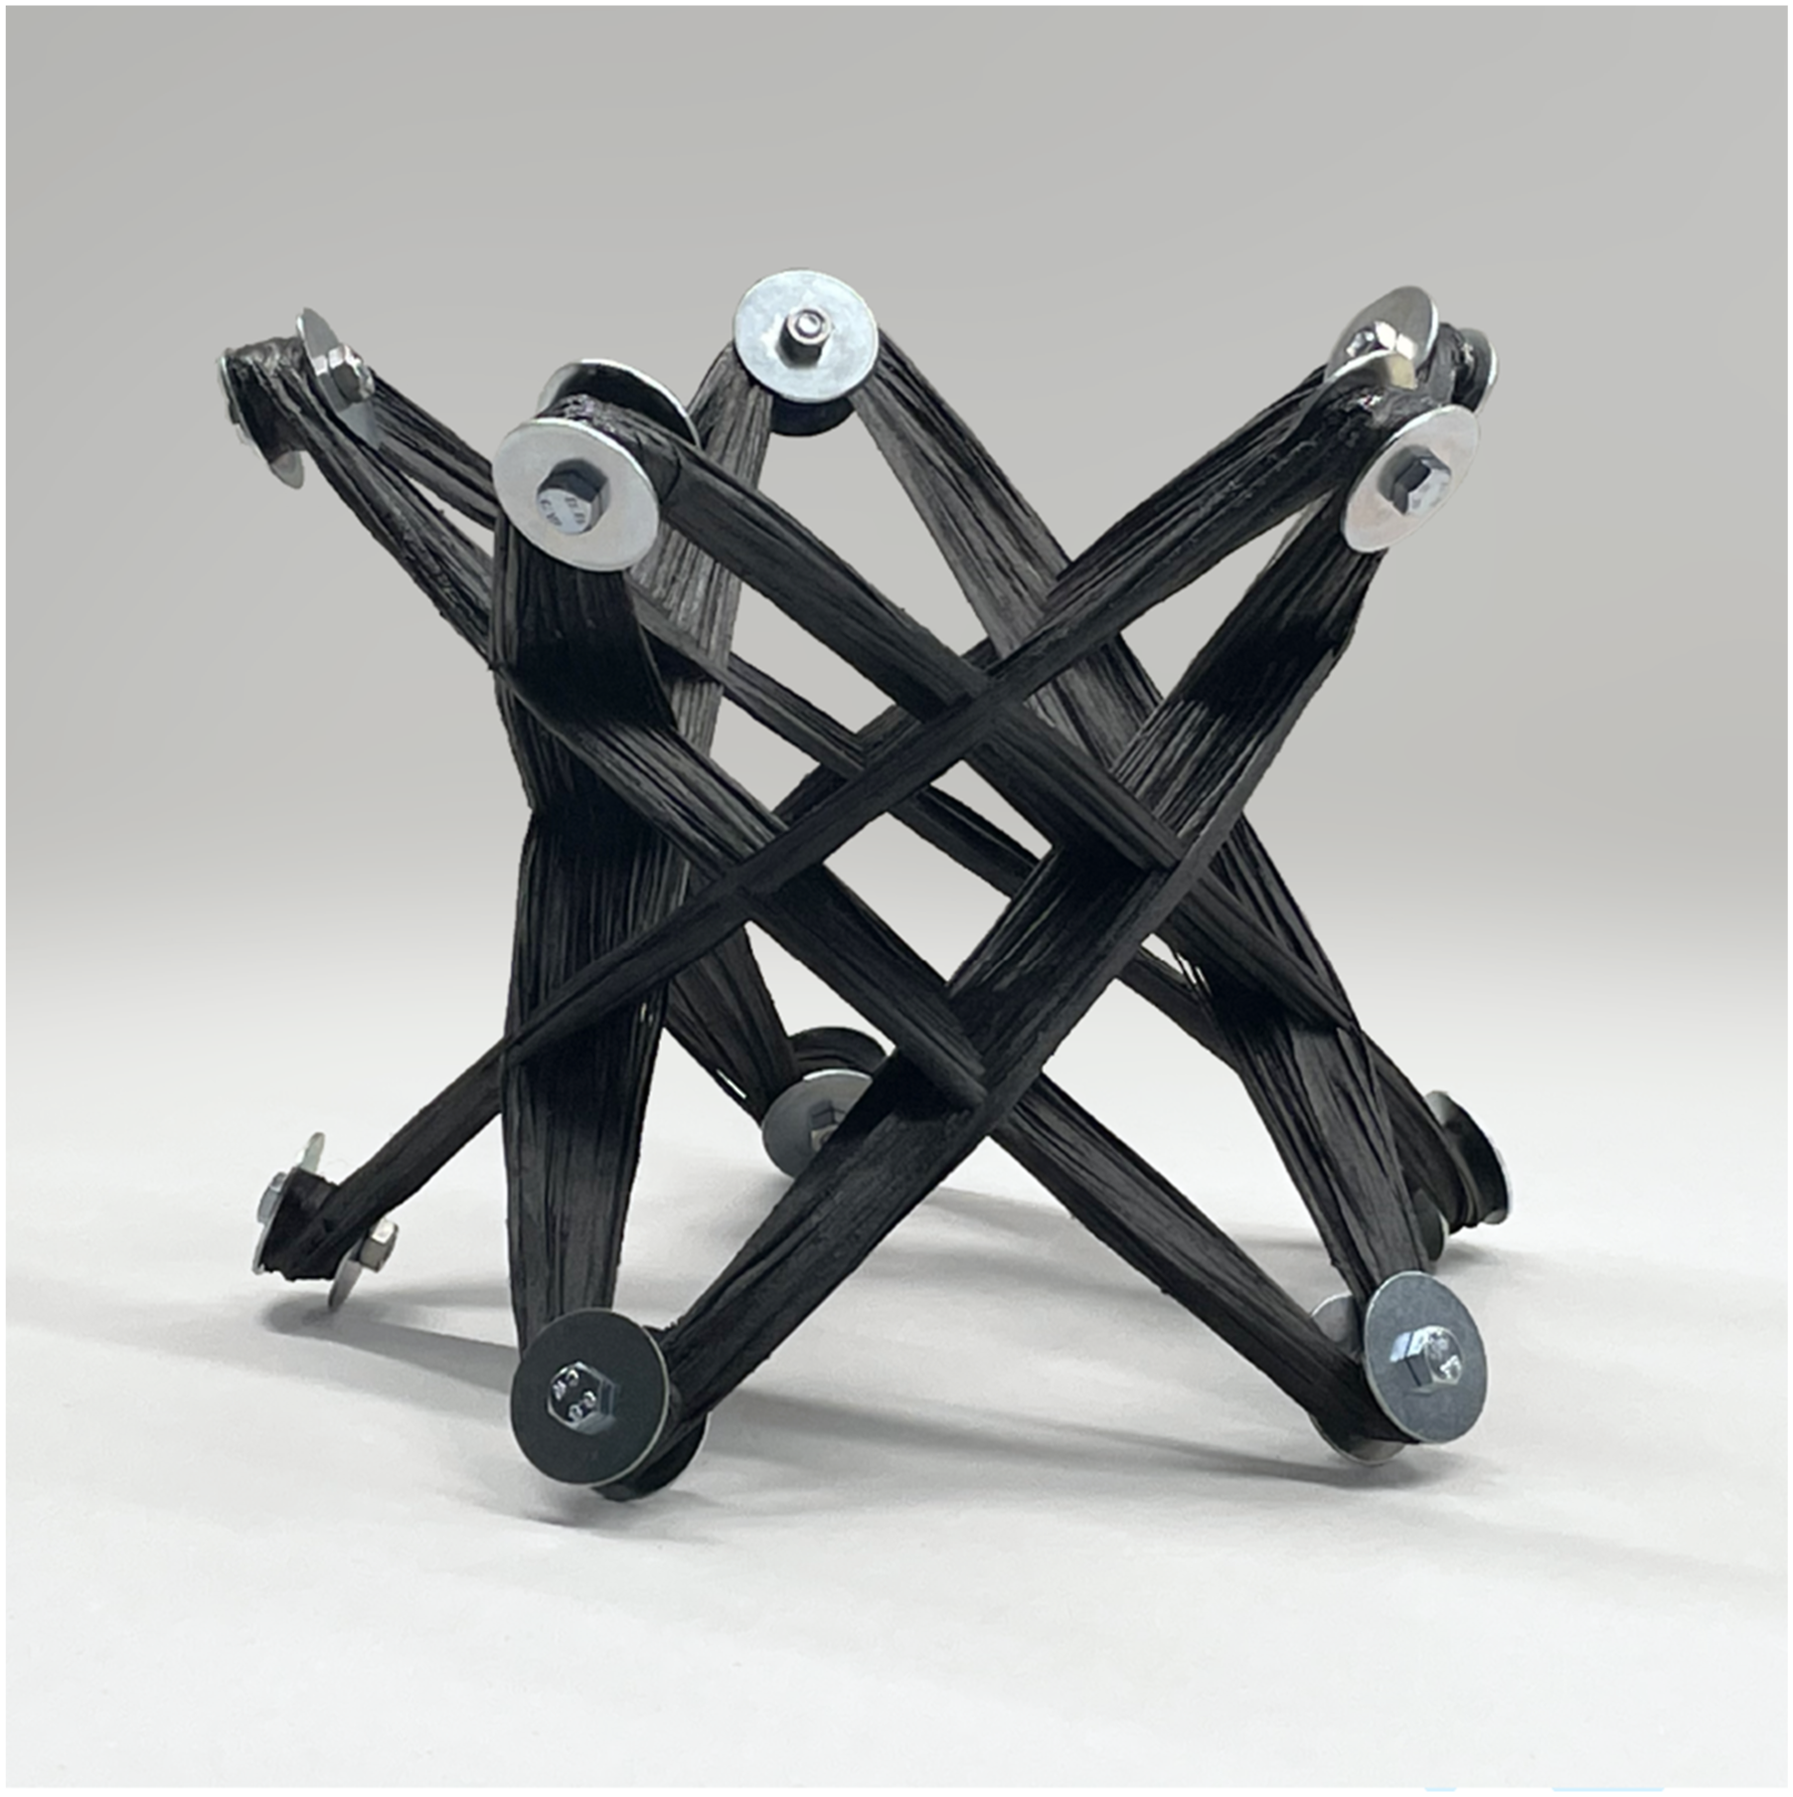
The structures were subjected to destructive axial compression tests, conducted according to the same procedure described in Section 3.4 of Ref. 53, thus ensuring comparability with ST00. The sample was tested without additional fixation, positioned between two steel plates, at a testing speed of 10 mm/min. ST10 exhibited the expected failure behavior, which is expansion of the anchor cluster on one side, followed by buckling close to a crossing point.
Dodecahedron-shaped sample
The Dodecahedron-shaped sample is introduced in this study as a novel generic sample type, based on the geometry of a convex regular dodecahedron. This new design was motivated by the aim of reducing testing efforts and material consumption in comparison to that of the star-shaped sample. It adopts similar design principles as the rotated hexahedron sample type previously introduced in Ref. 52, but is expected to exhibit simpler failure progression due to the absence of nesting different subsyntaxes. Furthermore, it utilizes only a single geometry for its winding frame segment, reducing the variety of parts.
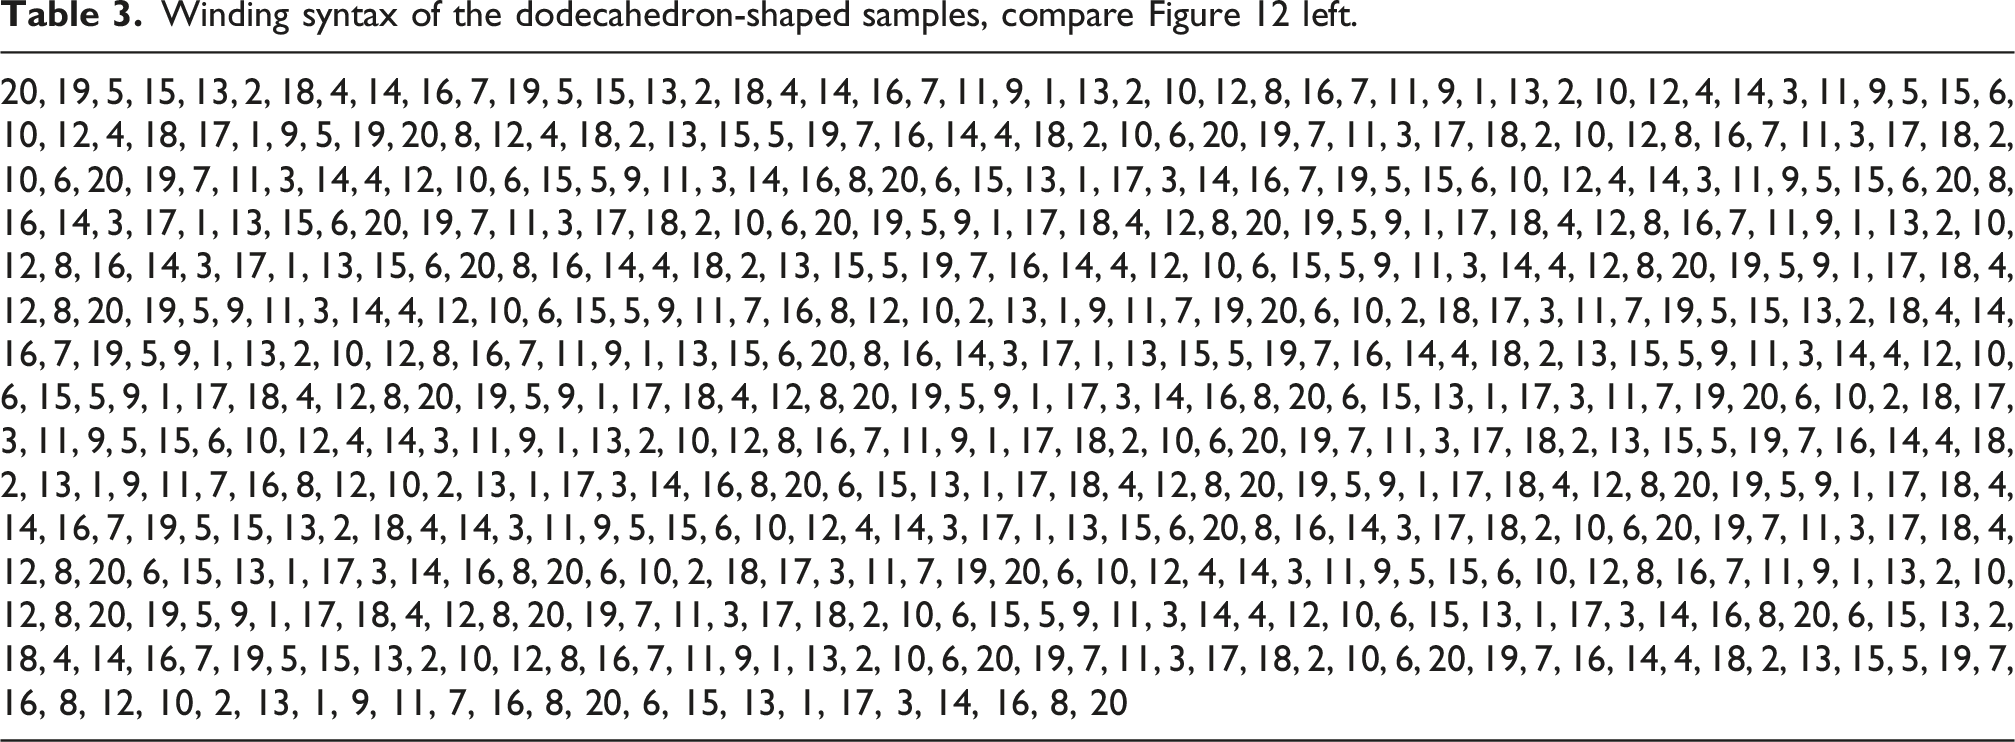
For the design of the winding syntax, a graph-theoretical approach was used, see Figure 12 left. Designing a fabricatable winding sequence that ensures a homogeneous material distribution is inherently complex due to the 20 nodes of the dodecahedron each having a degree of 3, and thus no Eulerian paths exist. Further complicating matters is the fact that only secondary pins are used for fiber redirection, see Figure 12 right. Although these pins prevent lateral fiber slippage, they do not provide anchoring on both sides (H = 0), which significantly restricts the selection of accessible nodes by impeding backtracking. To enable the application of existing winding syntax generation algorithms,
34
which operate solely on undirected graphs, the secondary pins were explicitly modeled. As a result, the number of nodes increased from 20 to 60 and the number of edges from 30 to 120. Graph (left) and winding frame (right) of the dodecahedron-shaped structural sample. Blue edges have 10 layers and gray edges have 1 layer. Secondary pin labels not shown. The edge length of the 3D-printed pentagonal segments is 52 mm.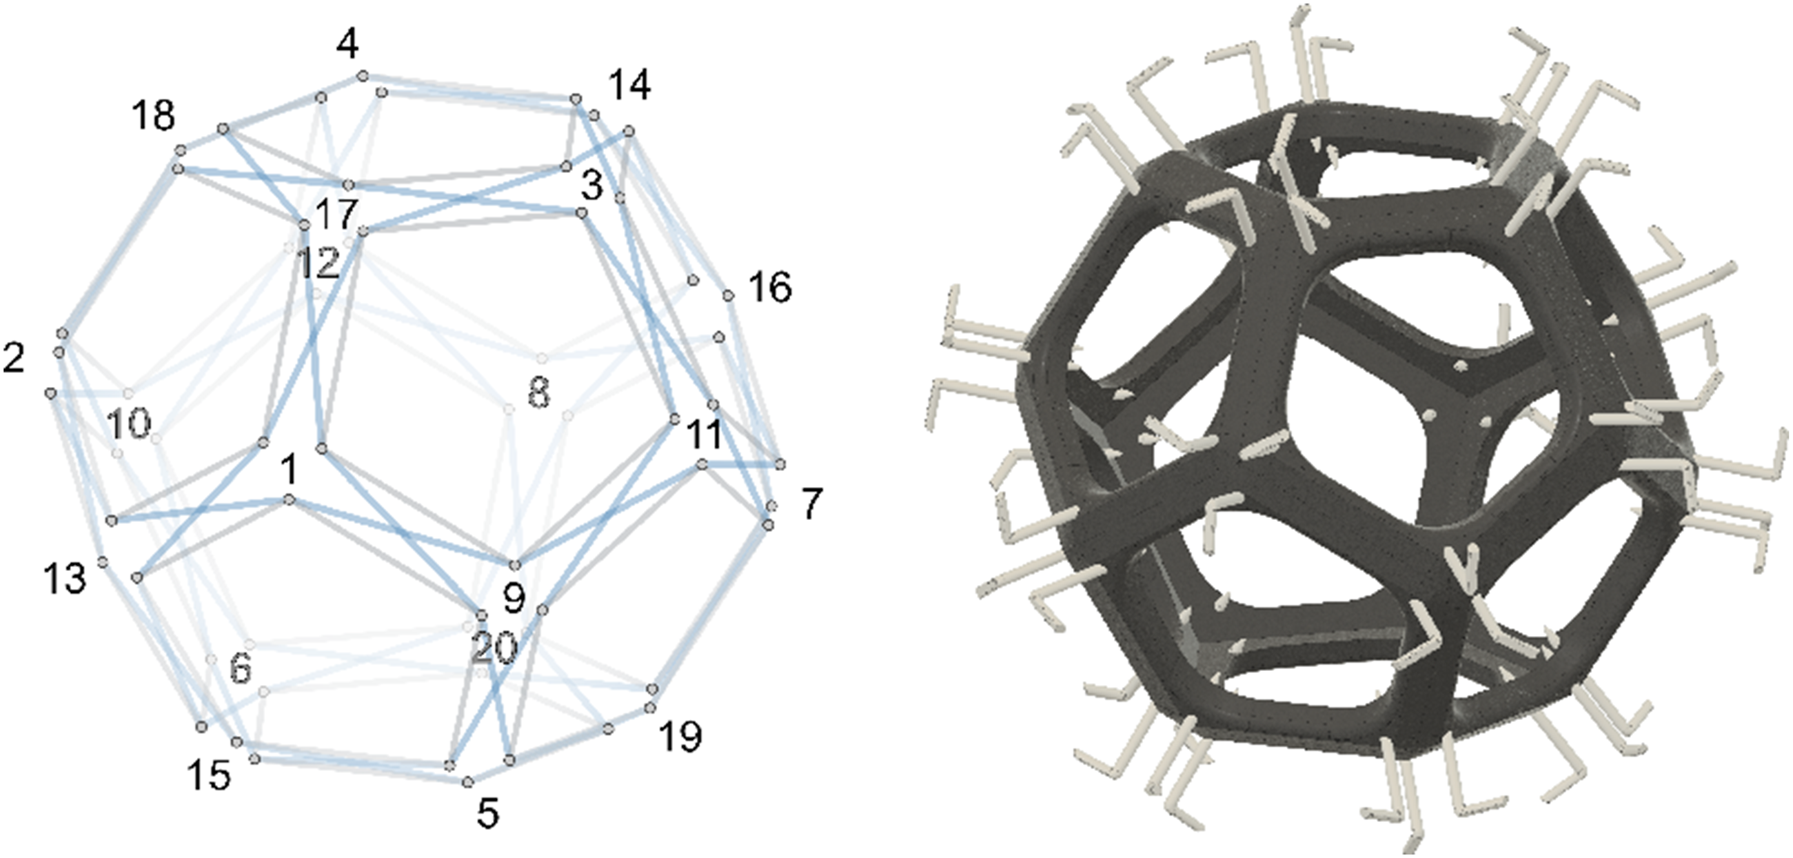
Winding syntax of the dodecahedron-shaped samples, compare Figure 12 left.
Another syntax that favors connection to the nearest node, thus traversing the dodecahedron pentagon by pentagon, was also developed. This approach alters the material distribution between the blue and gray edges from 10:1 to a 1:5 ratio, see Figure 12 left. Therefore, it was not implemented in fabrication due to the potential structural disadvantages resulting from the minimal material connecting the individual pentagons.
The winding frame concept is similar to the one introduced in Ref. 52, a 3D-printed frame made from ABS, see Figure 12 right, consisting of 12 identical pentagonal segments welded together at their inner edges using a soldering iron. This design does not employ sleeve/washer winding pins but uses secondary winding pins exclusively. Specifically, hook nails with a diameter of 2.5 mm and a length of 30 mm were used, as their bent segment prevents incorrect fiber placement. Using the hybrid CFW process, the fibers were placed directly onto the frame between the secondary pins (H = 0, as defined in Figure 7 in Ref. 25), allowing improved control over the mesoscopic fiber-bundle geometry compared to CFW. The material system used for the two fabricated samples, see Figure 13, consists of flax fibers embedded in a furan resin matrix containing 30 pt. or 40 pt. biochar filler, to explore filler contents that are higher than those investigated on the material level. No significant challenges were encountered during the fabrication, although the impregnation performance did not match that of synthetic fiber precessed with synthetic resins. The impregnation process required more time and fiber soaking to achieve complete penetration. A higher filler content resulted in a visibly more matte appearance compared to epoxy-based systems. Regarding fiber-guiding elements, no notable differences were observed in terms of fiber damage due to particles or the tendency for eyelets to clog. The addition of the particle-based biochar introduced a noticeable thixotropy, less pronounced than in ceramic matrix systems but still leading to undesirable accumulation of matrix material in the dead volumes of the impregnation system. In combination with furan resin, the increased viscosity due to biochar content necessitates the addition of water to reduce the viscosity to a processable range, avoiding the need for specialized equipment. For the DC30 sample, 15.8 pt. of water was added and for the DC40 sample, 24.2 pt. of water was added, which evaporates during the curing process. Even the furan resin system with 40 pt. biochar could be processed using state-of-the-art equipment. Dodecahedron-shaped structural samples. DC30 (left) and DC40 (right).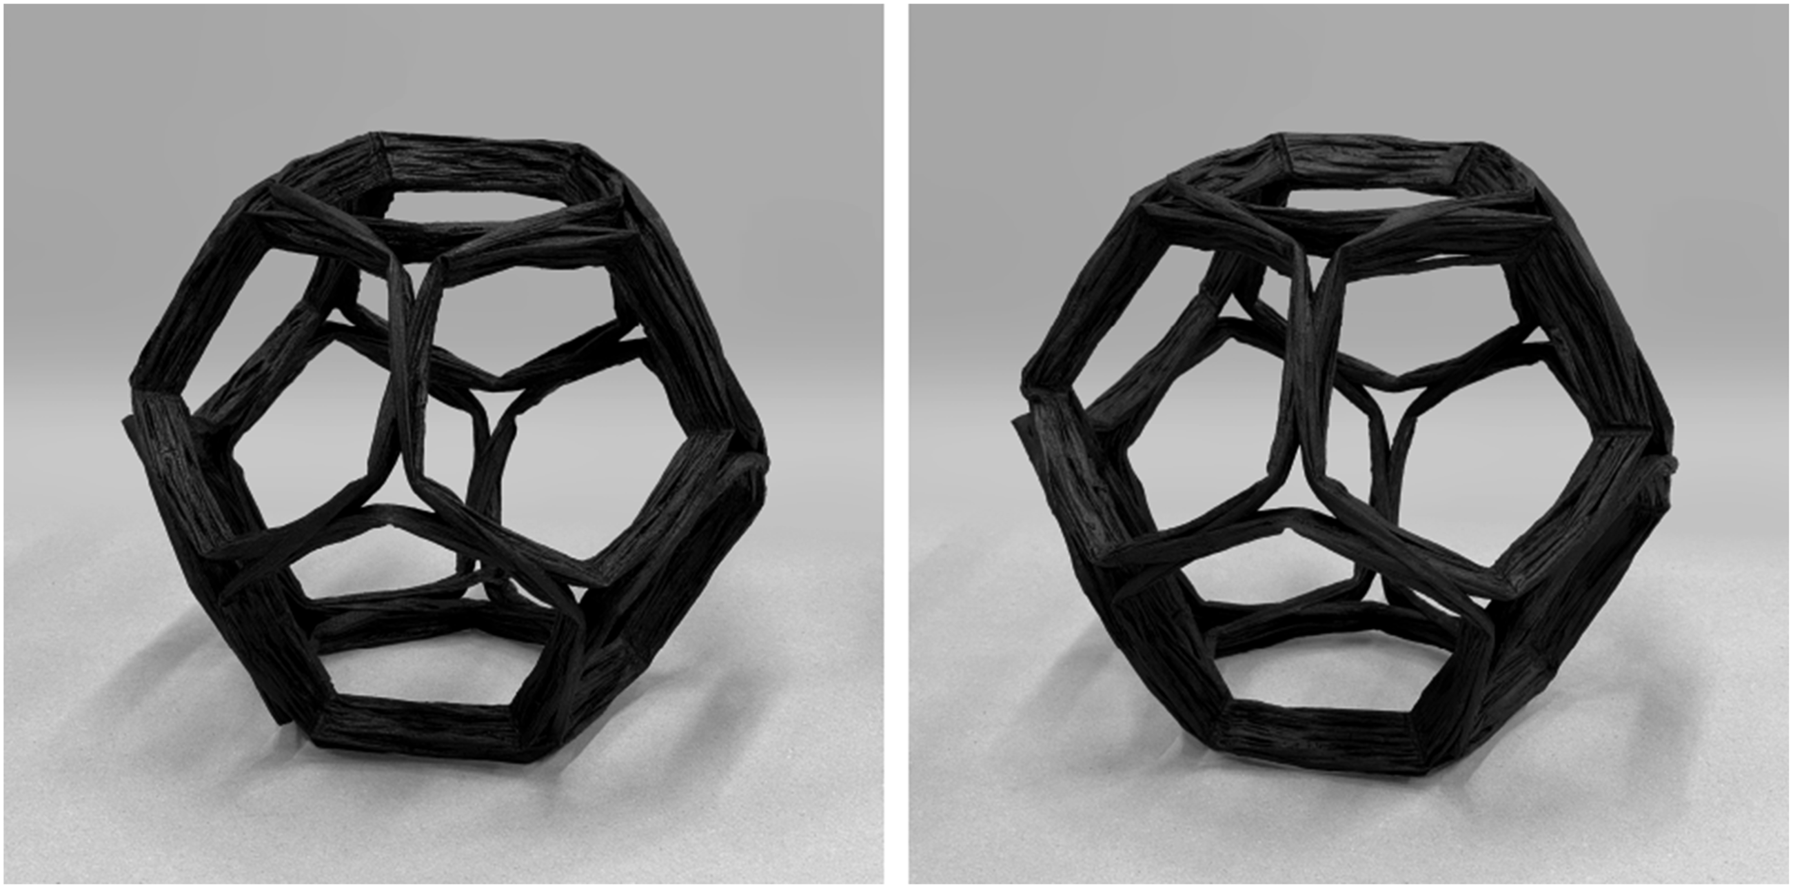
Unlike 4PB samples, an alternative curing method was explored for the dodecahedron samples to reduce the energy demand associated with furan resin, which requires higher temperatures and longer curing times than epoxy systems. Infrared (IR) curing was applied for the first time to CFW structures in this study, see Figure 14 left. This method is potentially attractive, as CFW structures are often lattice-like and thin-walled. Conventional ovens are energy inefficient compared to IR curing due to the need to heat the entire chamber volume.
107
Following an initial room-temperature cure, intended to allow gradual evaporation of the higher water content, the samples were placed on a turntable inside an IR curing chamber lined with aluminum. The orientation of the sample was systematically adjusted at regular intervals to homogenize the radiation exposure. During IR curing, only the sample itself was heated; neither the air nor the chamber walls reached elevated temperatures. IR curing was conducted in two sessions, totaling 120 min of exposure. As the IR radiation setup used alone cannot achieve the temperatures required for post-curing, a final tempering step was performed in a conventional oven at 110°C for 16 h. The total mass of the samples was recorded only after curing to exclude the water content. Dodecahedron-shaped structural sample during infrared-curing (left) and structural testing (right).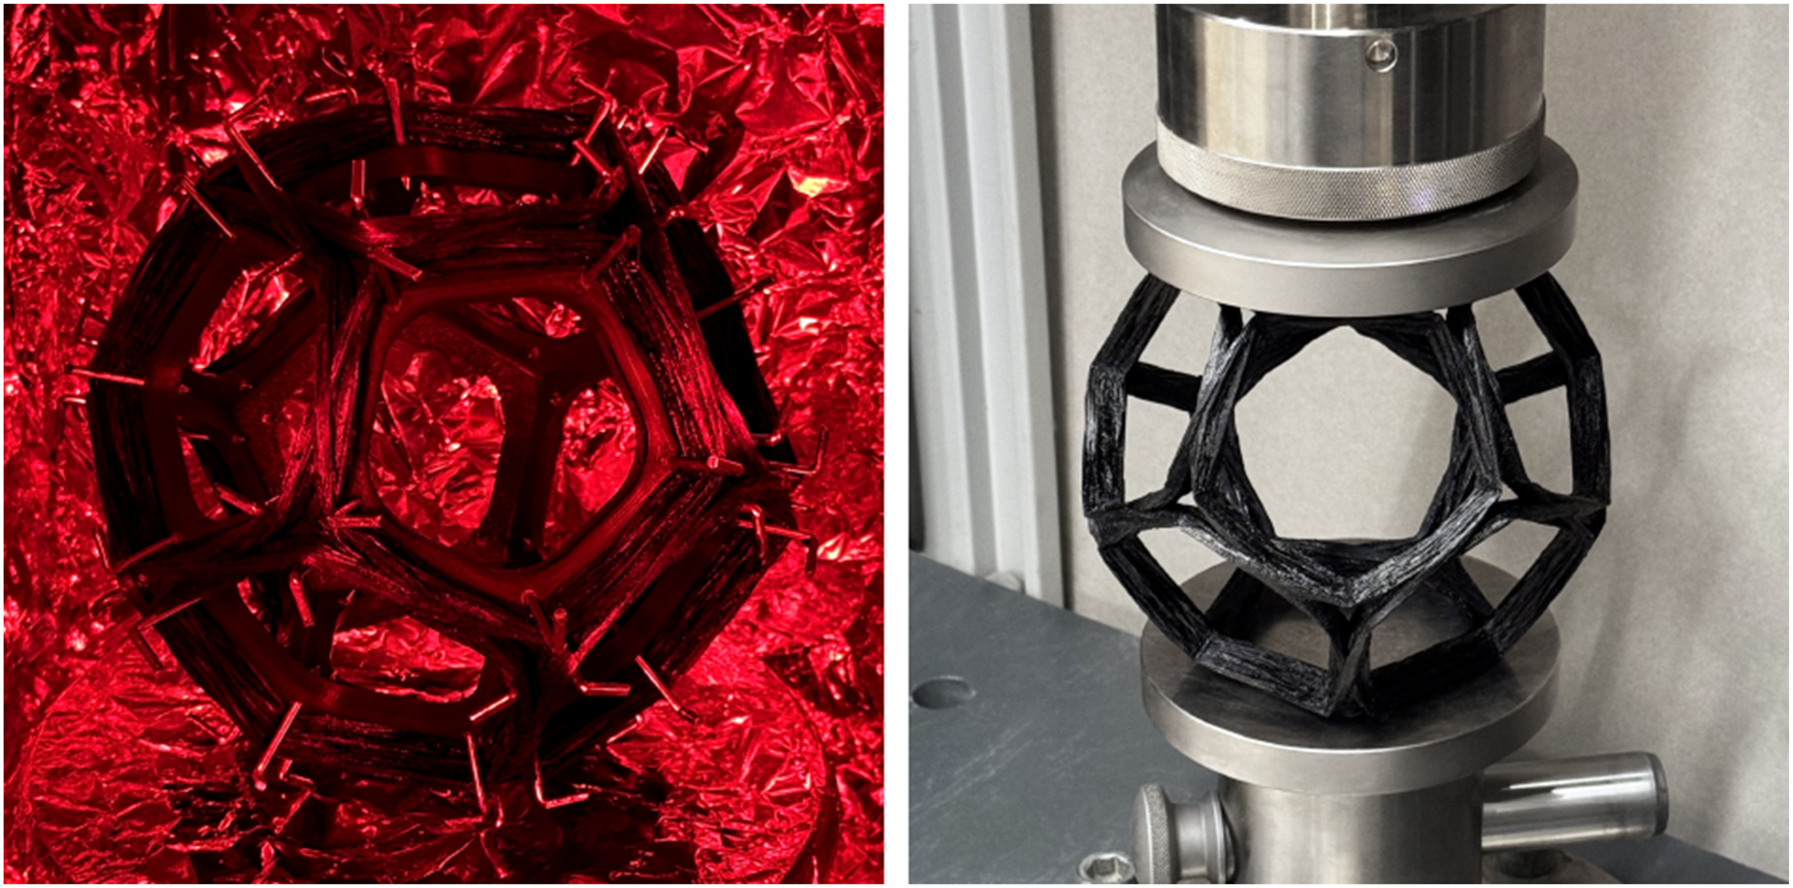
The dodecahedron samples were also destructively tested under quasi-static axial compression at a loading rate of 1 mm/min, see Figure 14 right. The testing protocol followed the one described in Ref. 52, with the exception that no silicone rubber sponge sheets were used and a pre-load of 5 N was applied. All samples exhibited the same failure behavior. Initially, the central region (nodes 1, 9, 11, 7, 16, 8, 12, 10, 2, 13, 1, see Figure 12 left) of the fiber net widened and flattened, followed by fiber breakage in the outer layers at the midpoints of the edges connecting the central region to the top or bottom pentagons. Subsequent fiber rupture was observed at the former positions of the secondary pins in the central region, leading to complete failure of the fiber bundles. The dodecahedron samples exhibited a failure mode predominantly governed by fiber fracture, rather than delamination or buckling, both of which are more commonly observed in CFW structures.
Eco-mechanical analysis
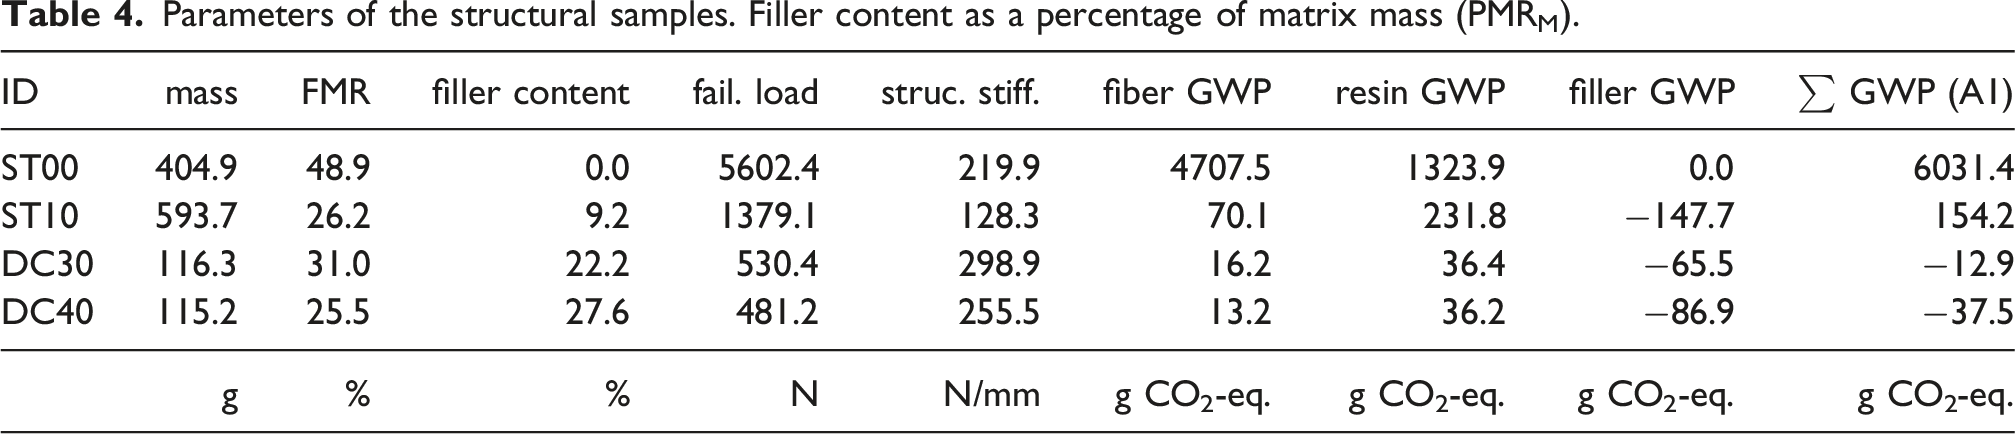
Parameters of the structural samples. Filler content as a percentage of matrix mass (PMRM).
Similarly to the material-level analysis of the proposed material systems presented in Section “GWP trade-offs in structural design”, the eco-mechanical performance of the structural samples is compared in Figure 15. Eco-mechanical analysis of the experimental structural testing. The carbon-negative region is indicated by stripes. Mass-specific A1 GWP values used as reported in Section “Material System”.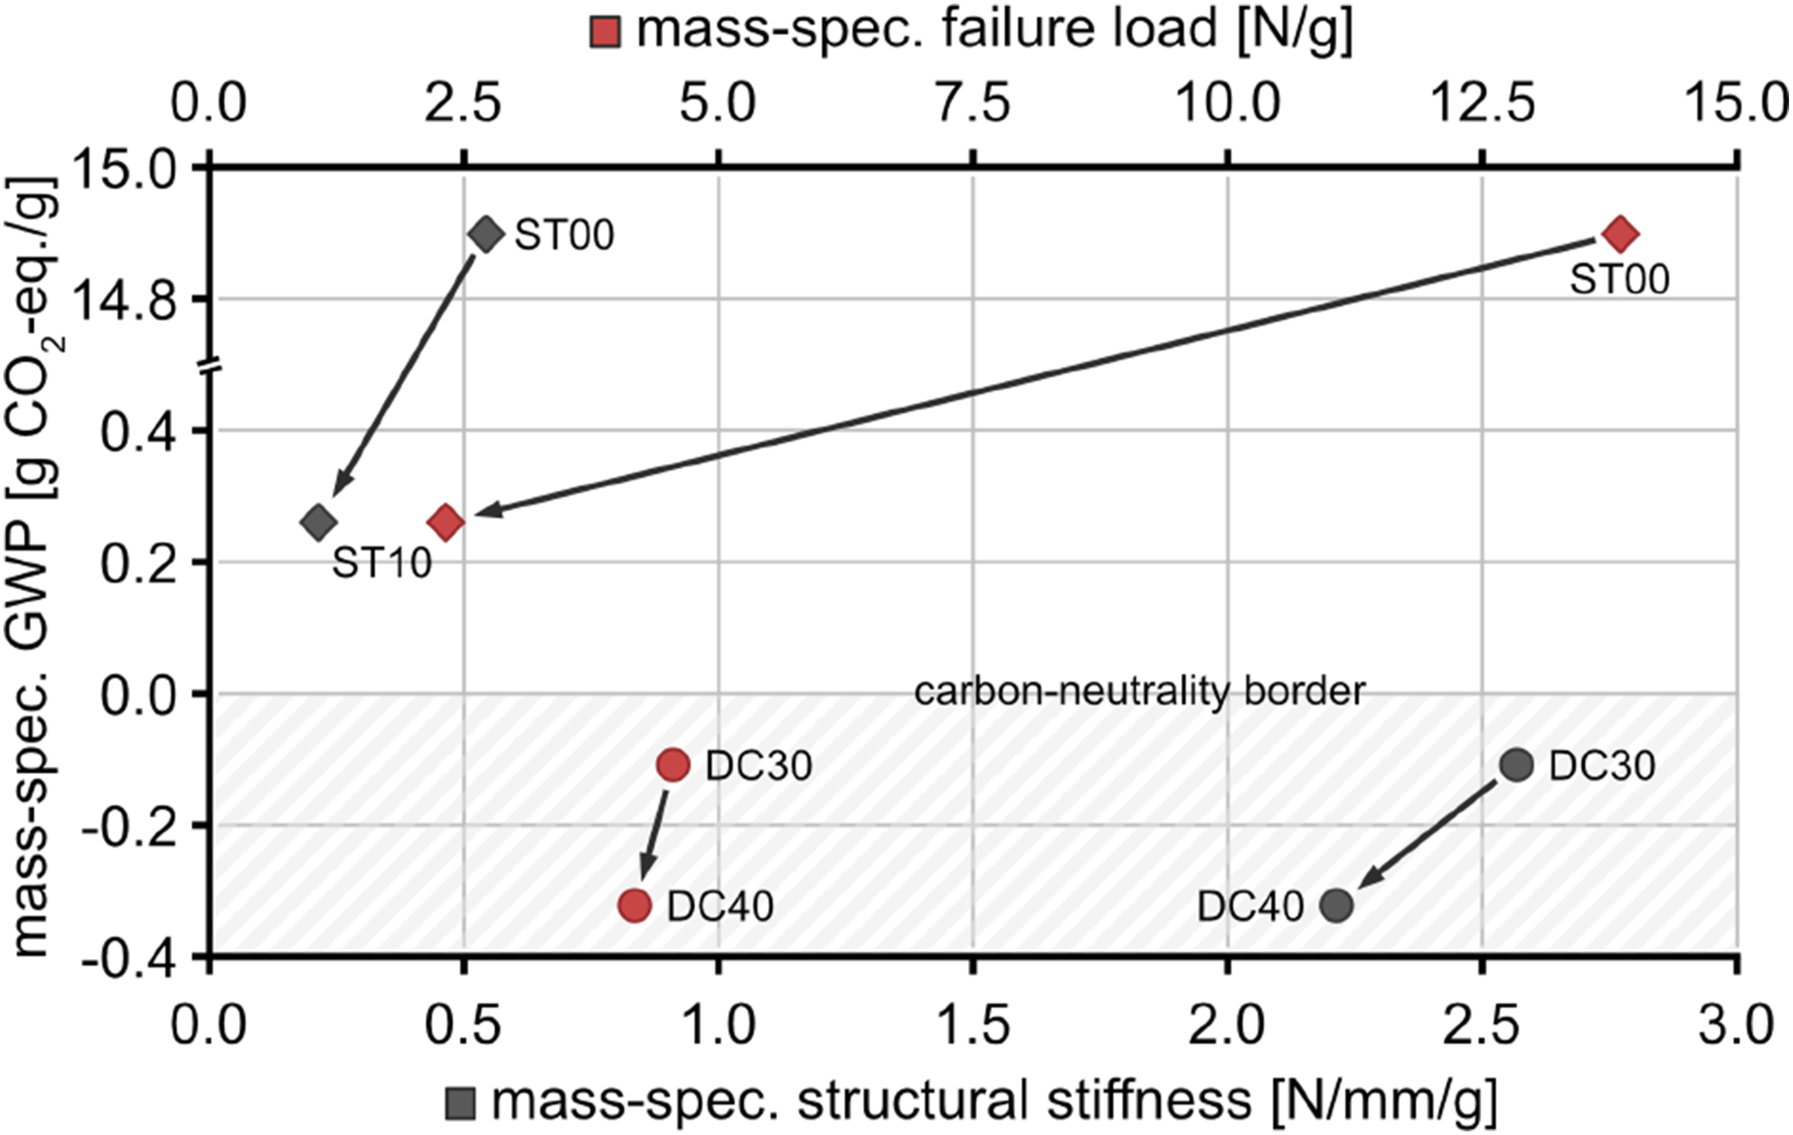
By switching from the carbon–epoxy material system to the flax–furan–biochar material system, significant losses in structural performance must be accepted. However, this change results in a drastic reduction in mass-specific GWP, as indicated by the axis break in Figure 15. Nevertheless, a 10 pt. biochar filler content is not sufficient to achieve carbon neutrality.
As expected, a further increase in the biochar content by 10 pt. in the dodecahedron samples leads to an additional reduction in mechanical performance. However, even at 40 pt. filler content, no critical degradation of mechanical properties approaching zero was observed. Due to the negative contribution of the biochar filler, both structures, DC30 with −12.9 g CO2-eq. and DC40 with −37.5 g CO2-eq., are carbon-negative (A1), see Table 4.
The mass-specific structural stiffness of the DC samples is significantly higher than that of the ST samples, which is a result of the different failure mechanisms and sample masses of the two sample types. The mass-specific failure load of ST10 is lower than that of the DC samples due to its higher structural mass. In comparison of changes (arrows in Figure 15) between ST and DC, ST samples show greater absolute reductions in mechanical performance. However, when evaluated relatively (mass-specific mechanical performance lost per unit of mass-specific GWP saved) the DC samples exhibit a slightly greater decline in mass-specific failure load and a substantially greater decline in mass-specific structural stiffness. This suggests that DC samples may be approaching a threshold at which mechanical performance could begin to decrease rapidly with further increases in filler content.
Cradle-to-gate estimation
To determine how much carbon negativity of material (A1) remains after transport (A2) and processing (A3), a preliminary estimate is provided for sample DC40 based on the results of the study, 62 which assessed the GWP from cradle-to-gate of robotically wound fiber composites made of flax and epoxy, with specific reference to the livMatS Pavilion in Freiburg, Germany. 50
For A2, the estimation neglects that lighter 3D-printed plastic single-use winding frames were used instead of reusable metallic frames. An A2 value of 11.1 g CO2-eq. is expected for DC40. For A3, fiber placement, ventilation, and curing are considered, while potential differences in the curing profile/equipment and the advantages of infrared curing are neglected. This results in an estimated value of 18.2 g CO2-eq. for A3.
Consequently, for the cradle-to-gate balance of a flax–furan–biochar material system with a PMRM of 27.6% and a FMR of 25.5% (sample DC40) a A1-A3 GWP value of −8.2 g CO2-eq. is estimated. Therefore, even when expanding the scope of the ecological analysis from A1 to cradle-to-gate, the material system can still be expected to be carbon-negative. This is a preliminary outlook rather than a definitive assessment.
Discussion
The flax–furan–biochar material system proposed in this study should not be viewed as a direct substitute for state-of-the-art designs. A materials-adapted redesign of the structural system is necessary, as the new material system requires more material to achieve comparable mechanical performance relative to, for example, carbon–epoxy material systems. Current technical solutions employing CFW lattice structures typically incorporate elevated safety factors to compensate for uncertainties in material properties. As these uncertainties become better characterized and controlled in the future, an expanded performance window will emerge that enables a more effective exploitation of the comparatively sustainable material system proposed here. Nevertheless, material selection will continue to depend on the individual valuation of the decision-maker on sustainability performance relative to other criteria, including cost and mechanical performance. However, the proposed material is suitable for structural applications. For example, replacing steel with timber leads to a reduction in mass-specific stiffness, while simultaneously increasing mass-specific strength. Analogously, a redesign employing the proposed material system may be advantageous when substituting flax–epoxy systems, given that the flax–furan–biochar configuration exhibits superior stiffness at the material level. In addition, this system can be integrated with high-performance materials in different layers within the same structure, allowing for the exploration of hybrid composite structures that balance high mechanical performance with reduced environmental impact.
GWP represents only one metric of sustainability assessment. It is also important to distinguish between the prevention or minimization of CO2 emissions and their compensation through carbon sequestration. This study is limited to analyzing the GWP of LCA module A1. In addition, it provides an outlook for one structural sample, estimating the GWP of modules A1–A3. Therefore, a more holistic future evaluation should include more modules and additional sustainability parameters, with particular attention to end-of-life considerations. 108 Mechanical recycling or pyrolysis are likely the most favorable end-of-life pathways currently available for the flax–furan–biochar material. Mechanical recycling 109 is preferred because it preserves the functional properties of the material for secondary use, while pyrolysis can allow recovery of carbon-rich fractions. Future experimental investigations should focus on improving the physicochemical characterization of the proposed flax–furan–biochar material system, which should also include performance after weathering and micro-structural analysis. The inclusion of biochar is expected to significantly enhance the aging behavior of the material. 110 Furthermore, the implementation of fiber–matrix modification strategies in CFW remains underexplored.111,112 The proposed flax–furan–biochar material system should be characterized in terms of processing parameters throughout the entire process window. It is also of interest to further investigate technical solutions that enable the variation of matrix systems during winding, following the approach outlined in Ref. 31. This would allow for spatial control of matrix composition along the fiber bundle to locally reinforce specific structurally relevant fiber net regions. Regarding the winding frame for hybrid CFW, 3D-printed single-use winding frames should be replaced by reusable versions for later application. These reusable frames should have collapsible individual segments that fit through the (pentagonal) openings of the structures.
Conclusion
The purpose of this study was to investigate several proposed strategies to significantly reduce the global warming potential of thermoset matrix systems used in fiber-composite lightweight structures. It was demonstrated that, based on the calculated GWP values of the individual material constituents, the incorporation of 19.1 wt% biochar into the matrix can reduce the A1 (raw material supply) GWP of flax fiber and furan resin material to the extent that it becomes carbon-neutral or, at higher filler contents, even carbon-negative. The proposed flax–furan–biochar material system is entirely based on renewable resources. Its residual mechanical performance was experimentally tested at the material level using four-point bending tests, showing a reduction of 15.1%–16.3% compared to the unfilled matrix system. Also, at the structural level, the retained mechanical performance was experimentally quantified in (hybrid) coreless filament-wound samples under axial compression, with a filler content up to 27.6% in the matrix. At such elevated filler contents, the cradle-to-gate GWP was estimated to remain negative, because CFW is an energy efficient process. The processability of the novel material system was successfully demonstrated using (hybrid) CFW, while it is anticipated that comparable processing performance can be achieved in other manufacturing techniques exhibiting similar impregnation characteristics. On the structural scale, infrared curing was successfully implemented in CFW for the first time, potentially contributing to reduced energy requirements.
Moreover, the study showed that achieving carbon neutrality in A1 using current petroleum-based epoxy resins in combination with flax fibers is not feasible, as this would require unrealistically high biochar filler contents (
This study establishes that the proposed renewable flax–furan–biochar material system enables the development of carbon-neutral and even carbon-negative thermoset fiber-reinforced composites within the A1 life-cycle stage. When processed using CFW, the system achieves carbon-neutral or carbon-negative performance on a cradle-to-gate basis, while delivering mechanical properties suitable for lightweight structural applications.
Footnotes
Acknowledgments
The author thanks Denis Acker for his help in the fabrication of the four-point bending sample, as well as Tzu-Ying Chen, Yanan Guo, and Quentin Chef for providing access to their institute’s universal testing machine for the structural samples, see Section “Structural-level feasibility demonstration”. Furthermore, the author would like to thank Götz T. Gresser for providing some lab space and Martin-Uwe Witt for assistance during the photography for  .
.
Author contributions
PM: Conceptualization, Methodology, Software, Formal analysis, Investigation, Data Curation, Writing - Original Draft, Writing - Review & Editing, Visualization, Supervision, Project administration, Funding acquisition
Funding
The author disclosed receipt of the following financial support for the research, authorship, and/or publication of this article: This research was partially supported by the Deutsche Forschungsgemeinschaft (DFG; German Research Foundation) under Germany’s Excellence Strategy – EXC 2120/1–390831618.
Declaration of conflicting interests
The author declared no potential conflicts of interest with respect to the research, authorship, and/or publication of this article.
Data Availability Statement
The datasets used and/or analyzed during the study are available from the corresponding author upon request.