
Abstract
This work combines acoustic emission (AE) testing and finite element (FE) simulation to explore damage evolution and failure mechanisms of carbon/glass interlayer hybrid laminates under low-velocity impact (LVI). In the experimental part, variational mode decomposition (VMD) were adopted to process the AE signals during the impact process, which preliminarily assigned to and identified the AE characteristics corresponding to four typical damage modes (matrix cracking, fiber-matrix debonding, delamination and fiber fracture), and further analyzed their evolutionary sequence and synergistic effect in the impact process. In the numerical part, a refined three-dimensional FE model integrated with the progressive damage model and cohesive elements was established to simulate the damage initiation and propagation behavior under impact load. At 40J and 60J impact energies, matrix cracking initiates first and dominates damage; fiber/matrix debonding and delamination follow sequentially, and fiber fracture appears last. The increase in impact energy significantly aggravates the propagation of delamination damage. The results of numerical simulation and AE analysis mutually verify each other, revealing the core mechanism of low-energy impact damage: the initiation and propagation of intralaminar damage dominated by fiber/matrix in the early stage further induce and dominate the macroscopic failure process dominated by delamination in the later stage.
Keywords
Introduction
Fibre-reinforced polymer (FRP) composite laminates have been widely adopted as primary structural components in automotive, aerospace and marine industries, attributed to their prominent advantages including light weight, high specific strength, cost-effectiveness, and excellent moldability. 1 Low through-thickness strength makes these laminates susceptible to invisible internal damage under out-of-plane impact.2,3 Such complex impact damage is a synergistic result of multiple damage mechanisms, such as matrix cracking, delamination, fiber breakage, and fiber-matrix interface debonding. Notably, the extent of damage induced by these mechanisms is challenging to identify and quantify through visual inspection alone, 4 which may subsequently lead to degradation in the stiffness and load-bearing capacity of the laminated structure, thereby posing potential safety risks to the overall system. Consequently, accurate assessment of the initiation, propagation, and evolutionary mechanisms of damage modes in composite laminates under impact loads serves as the fundamental basis for structural integrity evaluation and damage tolerance analysis of composite structures.
A diverse range of non-destructive testing (NDT) techniques has been employed for the detection of impact-induced damage in FRP laminates, including thermal imaging, terahertz imaging, ultrasonic imaging, and X-ray-based inspection methods.5,6,7,8 However, the majority of these investigations focus primarily on characterizing the final post-impact damage state of laminated plates, rather than capturing the dynamic evolutionary process of the various underlying damage modes. References 9–11 have respectively adopted electronic speckle pattern interferometry, fiber Bragg grating (FBG) sensors, and high-speed optical imaging techniques to in-situ capture the impact damage evolution process of composite laminates. Nevertheless, these investigations primarily focused on describing the initiation and propagation characteristics of delamination damage, while lacking the capability to monitor the dynamic evolutionary behaviors of other coexisting damage mechanisms in the composite laminates.
LVI tests are typically characterized by a short duration, and multiple damage modes tend to occur concurrently during the impact process. Mutual interactions among multiple damage modes complicate the quantitative analysis of individual damage evolution. Under such circumstances, AE, as a NDT technique, demonstrates high sensitivity to the initiation and propagation of various internal damage modes in composite materials. Consequently, it holds the potential to realize real-time characterization of these damage modes under in-service monitoring scenarios. In most instances, diverse AE parameters are directly utilized to depict damage mechanisms. Nevertheless, identifying the damage characteristics of composite materials subjected to instantaneous impulsive impact loads remains a challenging task, accompanied by inherent uncertainties. Due to the extremely short duration of impact events, capturing AE signal data is rather challenging. Consequently, numerous researchers have employed quasi-static indentation (QSI) tests on composite materials as a substitute to simulate low-velocity impact behaviors.12,13,14,15,16,17,18 By conducting post-processing and analysis on the AE signals collected during quasi-static indentation tests, the evolutionary patterns of damage mechanisms in composite materials, which are comparable to those observed under transient impact responses, can be obtained. Strain-rate differences between QSI and LVI lead to minor discrepancies in damage evolution data from QSI tests. Consequently, leveraging the collected AE data to further assess the damage status of composite materials under impact loading is of crucial significance for gaining in-depth insights into their failure mechanisms and behavioral characteristics.
In recent years, numerous scholars have conducted extensive research on the real-time monitoring of impact-induced damage in composite materials via AE techniques. For instance, Mahdian A. 19 employed the Wavelet Packet Transform (WPT) method to analyze AE signals acquired during the impact process of composite materials. Through this approach, the energy distribution of each component within the AE signals under impact loading was derived, and a linear correlation between AE energy and impact energy was established. Based on these findings, the damage degree of the composite laminates was ultimately determined. James R. 20 proposed a methodology to identify the occurrence of internal damage during the impact process by analyzing the high-frequency information embedded in the AE signal characteristics extracted via modal decomposition. On this basis, the severity of damage in the laminated panels was further determined. Ai L. 21 employed a single AE sensor to monitor the evolutionary process of impact damage, and utilized a neural network to identify impact energy, thereby evaluating the damage degree of composite material components. Cuomo S. 22 employed the Hilbert-Huang Transform (HHT) to decompose the AE signal into high-frequency components (corresponding to extensional) and medium-to-low-frequency components (corresponding to bending). This approach enabled the qualitative determination of whether an impact caused indentation, penetration, or perforation in the laminate, as well as the real-time identification of different damage levels induced by the impact. Cai H et al. 23 systematically investigated the damage evolution law of carbon fiber composite materials during low-velocity impact by adopting a combined monitoring method integrating AE, infrared thermography (IRT), and digital image correlation (DIC). All the aforementioned studies have utilized AE technology to determine the impact damage degree of composite materials, yet they have not analyzed the underlying causes of such damage degrees—specifically, the damage degrees induced by the damage mechanisms. Therefore, it is necessary to employ advanced signal processing methods to analyze the AE signals generated during the impact process, so as to obtain the initiation and development of various damage mechanisms.
In view of the need to supplement experimental tests for impact damage, many researchers have resorted to FE simulation to investigate the impact damage evolution of composite laminates. 24 Among the well-established numerical simulation methodologies, the progressive damage model (PDM) has emerged as one of the preferred schemes for characterizing the evolution of various damage modes in composite materials. 25 Notably, PDM identifies the initiation of different damage modes through failure criteria and quantifies the damage accumulation of each mode via stiffness degradation. 26 To comprehensively assess the impact damage characteristics of laminated composites, several studies23,27,28 have adopted a hybrid approach combining experimental techniques (i.e., AE, DIC, IRT, and phased array ultrasonic testing) with numerical methods. X. Li 29 evaluated the applicability of five distinct failure criteria for predicting LVI damage in laminates, revealing that the predicted distributions and developmental trends of matrix compression damage exhibited significant discrepancies across the different criteria. Furthermore, Huang L. 30 simulated the impact damage evolution of laminated panels by adopting different failure criteria (Hou/Hashin/Puck), damage evolution laws (sudden/linear/exponential), and interface models (zero-thickness cohesive element/finite-thickness cohesive element/cohesive contact), respectively. Their results demonstrated that the combination of the Puck criterion, linear evolution law, and finite-thickness cohesive element yields reliable predictions of impact damage.
In recent years, AE monitoring and FE simulation have been integrated to analyze impact damage in composite materials. However, existing hybrid approaches still exhibit notable limitations. Conventional signal processing techniques struggle to accurately decouple highly overlapping AE signals under transient impact loads, hindering real-time and quantitative differentiation of characteristic information for matrix cracking, fiber-matrix debonding, delamination, and fiber fracture. Moreover, most studies focused on the final post-impact damage state or the evolution of a single damage mode, lacking systematic characterization of the temporal correlation, synergistic interaction, and energy contribution of multiple damage modes. Additionally, numerical models often simplify interlaminar interfacial properties, failing to precisely reproduce the preferential delamination propagation induced by interlaminar modulus mismatch in hybrid composites, with insufficient depth of dynamic cross-validation between experimental and numerical results.
To address these gaps, this study investigates carbon fiber/glass fiber interlayer hybrid laminates and proposes an integrated analytical method combining VMD-enhanced real-time AE monitoring with refined 3D FE simulation. By decoupling impact-induced AE signals via VMD combined with the HHT, four types of damage are accurately identified and their evolution laws are quantitatively characterized. A 3D numerical model coupled with a progressive damage model and cohesive elements is constructed to dynamically track the entire process of intralaminar and interlaminar damage initiation and propagation. Through the quantitative characterization of cumulative energy via AE combined with the dynamic tracking of 3D damage fields using FE analysis, a multi-dimensional cross-validation covering “temporal sequence - failure mode - spatial distribution” is achieved.
This study aims to achieve dynamic decoupling and correlative analysis of multiple damage modes from experimental signals (temporal) to numerical simulations (spatio-temporal evolution) during the LVI of composite materials, through a research framework that integrates advanced signal processing technology with high-fidelity 3D damage simulation, thereby systematically and quantitatively revealing the core physical mechanisms underlying their damage evolution and failure.
Experimental setup
Manufacturing of composite laminates
Composite laminates were made by interlaminar hybridization of unidirectional carbon fiber prepregs and unidirectional glass fiber prepregs. The prepregs were supplied by Shandong Weihai Guangwei Group Co., Ltd. Specifically, the thickness of the unidirectional carbon fiber prepreg is 0.2 mm, and the thickness of the unidirectional glass fiber prepreg is 0.125 mm. The laminate adopts a symmetric cross-ply lay-up configuration of [0/90/(0/90)/0/90/(0/90)/0/90/(0/90)]s, where the bracketed (0/90) denotes the lay-up direction of carbon fibers, and the unbracketed 0/90 represents the lay-up direction of glass fibers. The laminate was cured in an XLBD400 × 400 × 2/0.50 MN column-type plate vulcanizing press under a pressure of 0.7 MPa. Initially, the vulcanizing press was heated from ambient temperature up to 120°C, and this temperature was maintained for 60 min. After the isothermal holding stage, the heating system was shut down to let the temperature drop to 80°C, following which the pressure was relieved and the laminate was allowed to cool naturally to room temperature. Then, plates with dimensions of 330 mm × 330 mm × 3.7 mm3 were fabricated. Subsequently, a composite material engraving and milling machine was used to cut the plates, so as to produce standard impact specimens with sizes of 150 mm × 100 mm.
LVI test with AE monitoring
LVI tests were performed on the impact specimens via a drop weight impact testing machine (Model: FIT7522-1), as illustrated in Figure 1. The clamping device and anti-secondary impact device of this test platform were set up in accordance with the ASTM D7136 standard, so as to prevent specimen movement, uncertainties in boundary conditions, and the occurrence of repeated impact issues. A hemispherical steel impactor with a mass of 14.853 kg and a diameter of 13 mm was employed for the tests. The desired impact energy was achieved by adjusting the drop height of the impactor, and AE technology was used to conduct real-time monitoring of damage evolution in the composite laminates throughout the entire impact process. Impact testing was systematically conducted at two discrete energy levels, 40J and 60J, to characterize the material’s response to abrupt dynamic loading. At each impact energy level, three specimens were tested to verify the repeatability and reliability of the results. 40J represents a low-energy condition that induces early-stage microdamage (e.g., matrix cracking and slight fiber–matrix debonding) without obvious macroscopic delamination. 60J corresponds to a high-energy state triggering severe interlaminar delamination and aggravated intralaminar damage, covering the transition from microdamage to macroscopic failure. The 20 J energy interval is moderate, avoiding redundant testing or missed key damage stages. This two-level design spans the typical low-velocity impact failure range, enabling a clear comparison of damage evolution under different impact severities. Drop weight impact testing setup.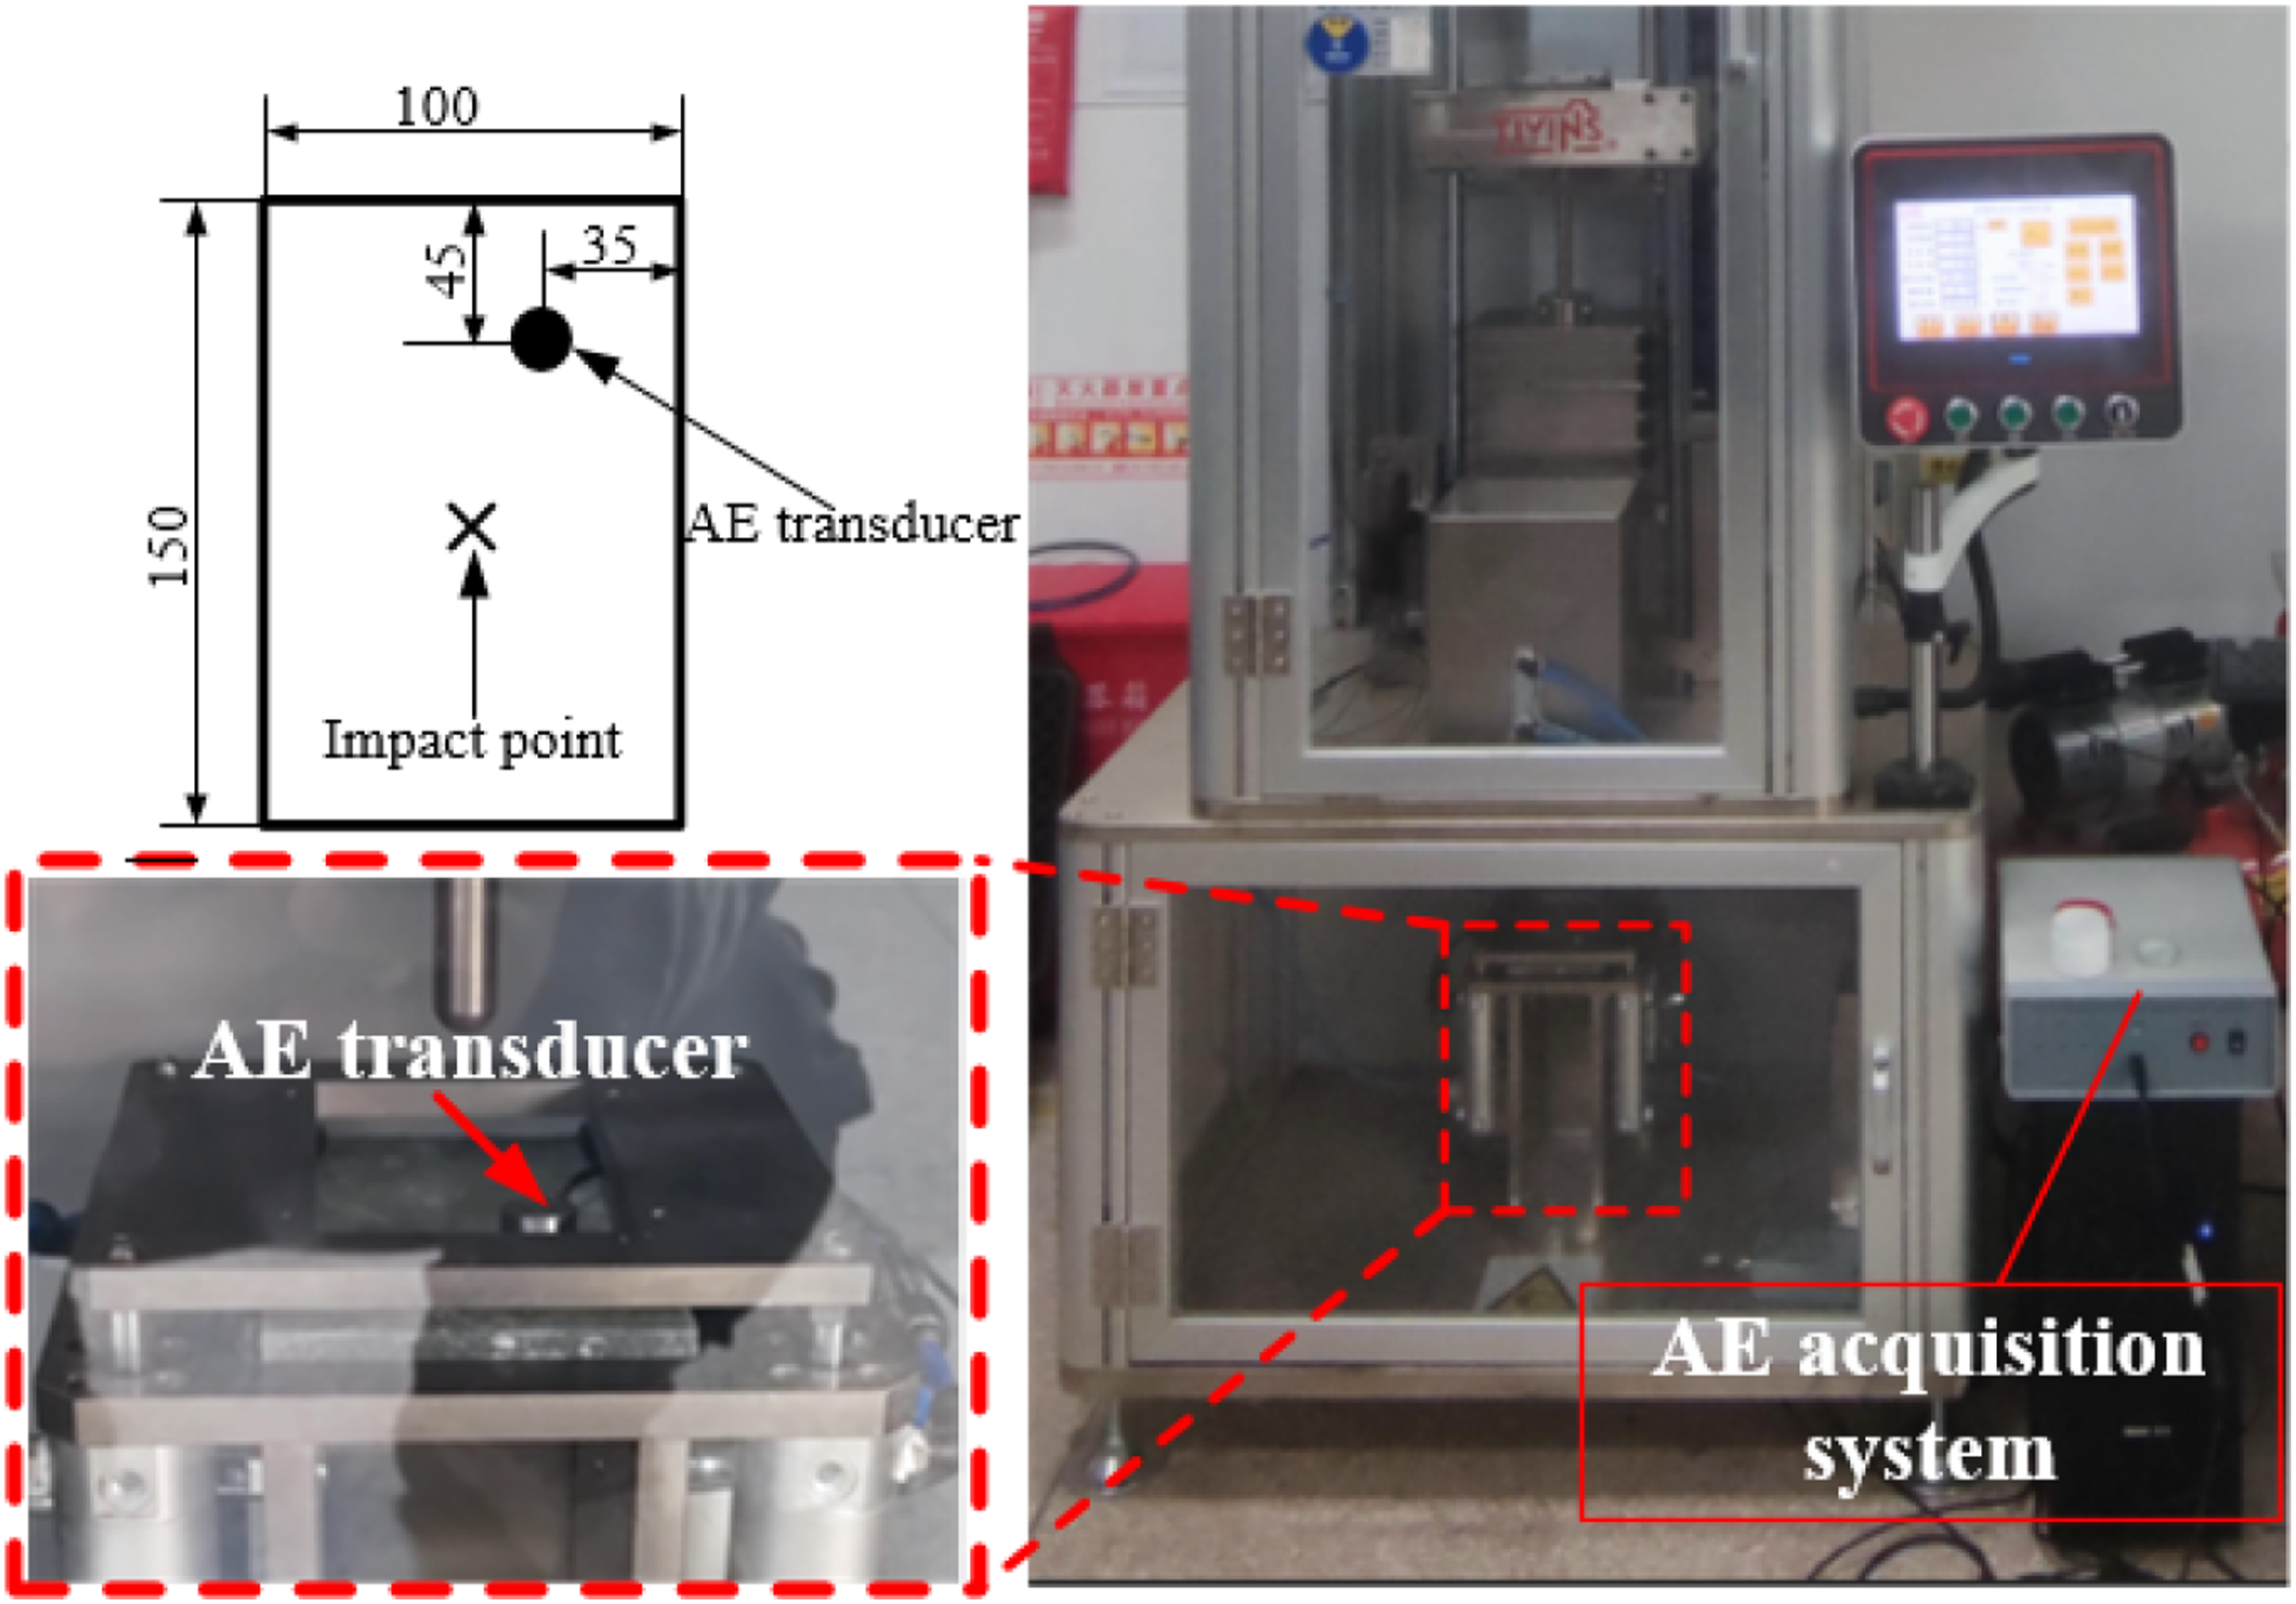
One AE sensor was surface-mounted on the impact specimen (see Figure 1), featuring a frequency response range of 100–750 kHz. To ensure the accurate transmission of stress waves generated by material damage to the AE sensor, vacuum grease was applied as a coupling agent between the sensor and the specimen surface. A full-information AE signal analyzer (Beijing Soft Island Times Technology Co., Ltd) was employed to comprehensively record various AE parameters (e.g., amplitude, rise time, count) and raw waveform data. A 20/40/60 preamplifier was used with a selected gain of 40 dB, and the sampling rate was set to 3 MHz to capture high-frequency AE signals without information loss. Prior to the formal impact tests, the pencil lead breakage method was utilized to verify the AE sampling system, evaluating the sensor response sensitivity and connection integrity.
Evolutionary characterization of impact damage mechanisms via VMD of AE signals
VMD method
VMD3
31
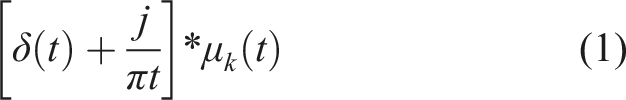
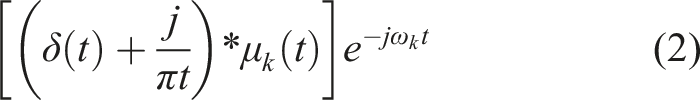
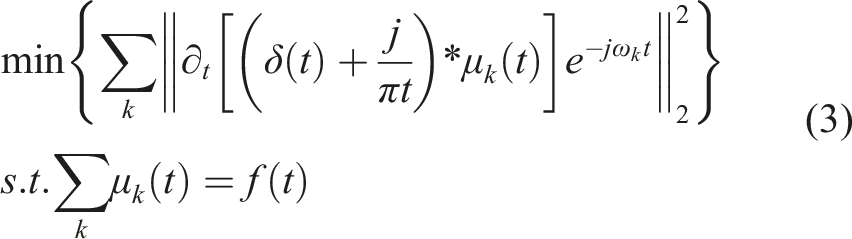
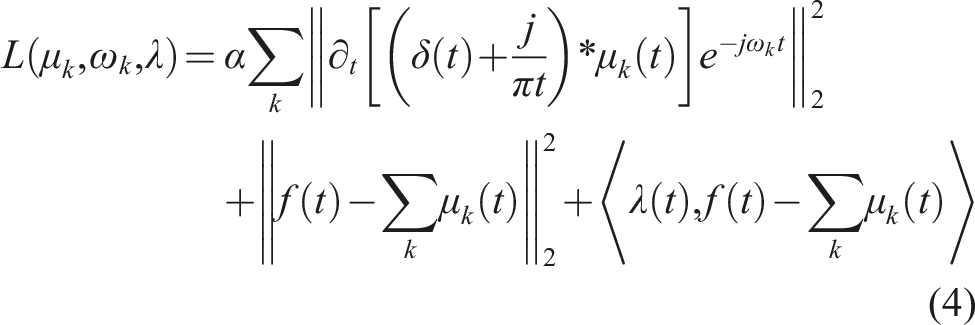
incorporates the decomposed signal into a variational model by constructing a constrained variational optimization framework, and seeks the optimal solution of this variational model to decompose the input signal into a set of intrinsic mode functions (IMFs). Specifically, VMD decomposes the input signal f(t) into k narrowband IMFs (1) For each narrowband IMF (2) Drawing on the principles of modulation and demodulation, exponential terms (3) To minimize the sum of the bandwidths of all IMF components, a constrained variational equation with equality constraints is formulated as follows: (4) In this particular variational problem, the introduction of Lagrange multipliers, denoted by λ(t), serves to eliminate equality constraints. Additionally, the incorporation of a quadratic penalty term, designated as α, is integral to ensure the convergence of the variational problem. It can thus be concluded that the original constrained extremum problem is transformed into an unconstrained and convergent extremum problem:
Subsequently, an iterative convergent solution approach is adopted for the transformed unconstrained extremum problem. Specifically, the Alternating Direction Method of Multipliers (ADMM) is employed to solve equation (4). Once the iterative convergence criterion is satisfied, the respective decomposed components of the input signal via VMD are obtained.
In the present study, the integrated VMD algorithm in MATLAB was utilized for adaptive decomposition of vibration signals from composite materials. The core parameters were configured as follows: number of modal components (K), penalty factor (α) = 1000, convergence tolerance (τ) = 10−7, and maximum number of iterations = 500. Sensitivity analysis demonstrates that the number of modal components (K) exerts the most pronounced influence on the decomposition outcomes: an insufficiently small K is prone to inducing mode mixing, whereas an excessively large K results in the generation of redundant components. Furthermore, the penalty factor (α) regulates the frequency bandwidth of the decomposed components, while the convergence tolerance (τ) dictates the decomposition precision. A dual stopping criterion is adopted: the iteration terminates when either the error between consecutive iterations falls below 10-7 or the maximum iteration count is reached.
40J impact
Figure 2 illustrates the AE signals acquired under an impact energy of 40J. The captured signals feature low frequency and large vibration amplitude, with a peak voltage of 0.15 V. This signal may be generated by two factors acting together: first, the initial impact pulse triggered when the punch strikes the laminate; second, surface waves caused by free vibrations generated by the structure. Notably, numerous low-amplitude signals are superimposed on the main signal curve. From the locally amplified signal view, it can be identified that these low-amplitude signals attached to the curve correspond to internal damage signals generated when the laminate was subjected to impact loads. These signals are consistent with the characteristic features of AE signals caused by material damage, specifically high frequency and rapid decay. Therefore, it is essential to separate the damage-induced AE signals from the background vibration signals, followed by targeted signal processing of the damage-related AE signals. Subsequently, these processed signals can be utilized to investigate the damage mechanism of the laminated plates. AE signals acquired under 40J impact.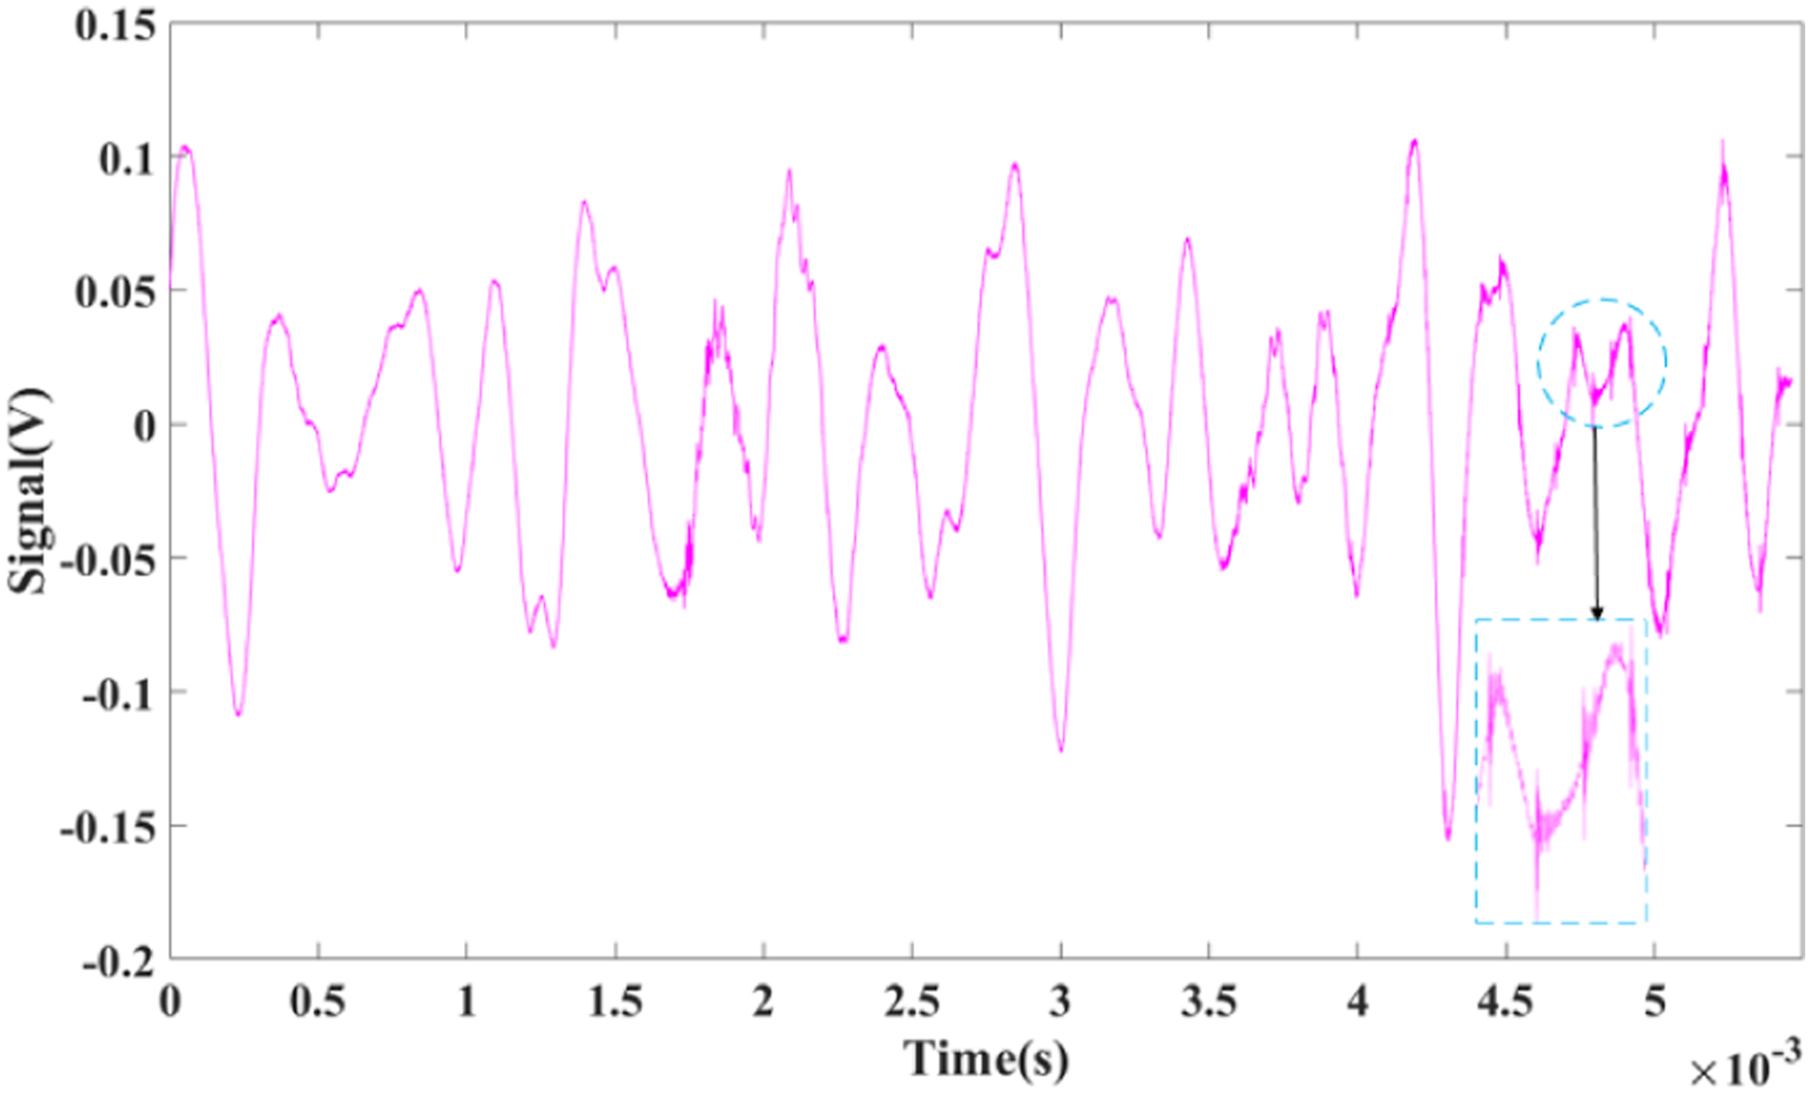
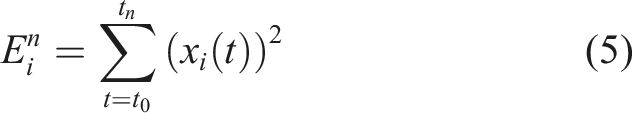
Figure 3 illustrates the VMD results of the AE signal acquired under an impact load of 40 J. Specifically, the original AE signal is decomposed into five IMFs via the VMD algorithm. Notably, IMF 1 to IMF 4 predominantly contain a large number of AE signals characterized by low amplitude, high frequency, and short duration. The waveform characteristics of these individual short-duration AE signals are consistent with those of AE signals generated by damage mechanisms in composite materials (e.g., matrix cracking, fiber-matrix debonding). The amplitude of each short-duration signal contained in the IMF differs by an order of magnitude from the amplitude of the signal generated by structural vibration. Due to the small amplitude of the signal caused by material damage, it can only be attached to the vibration waveform signal and collected as a single AE signal under a high sampling rate. AE signals from different IMFs differ in instantaneous amplitude and damage-event evolution trends. However, the specific composite material damage modes responsible for the first four IMFs remain unclear. To address this research gap, further spectral analysis of each individual IMF is required to identify the corresponding damage mechanism associated with each IMF component. The amplitude and shape of the IMF5 waveform are almost identical to those of the original signal; therefore, it can be concluded that the IMF5 waveform is generated by the structural vibration induced when the punch impacts the laminate. VMD for AE signals collected under 40J impact.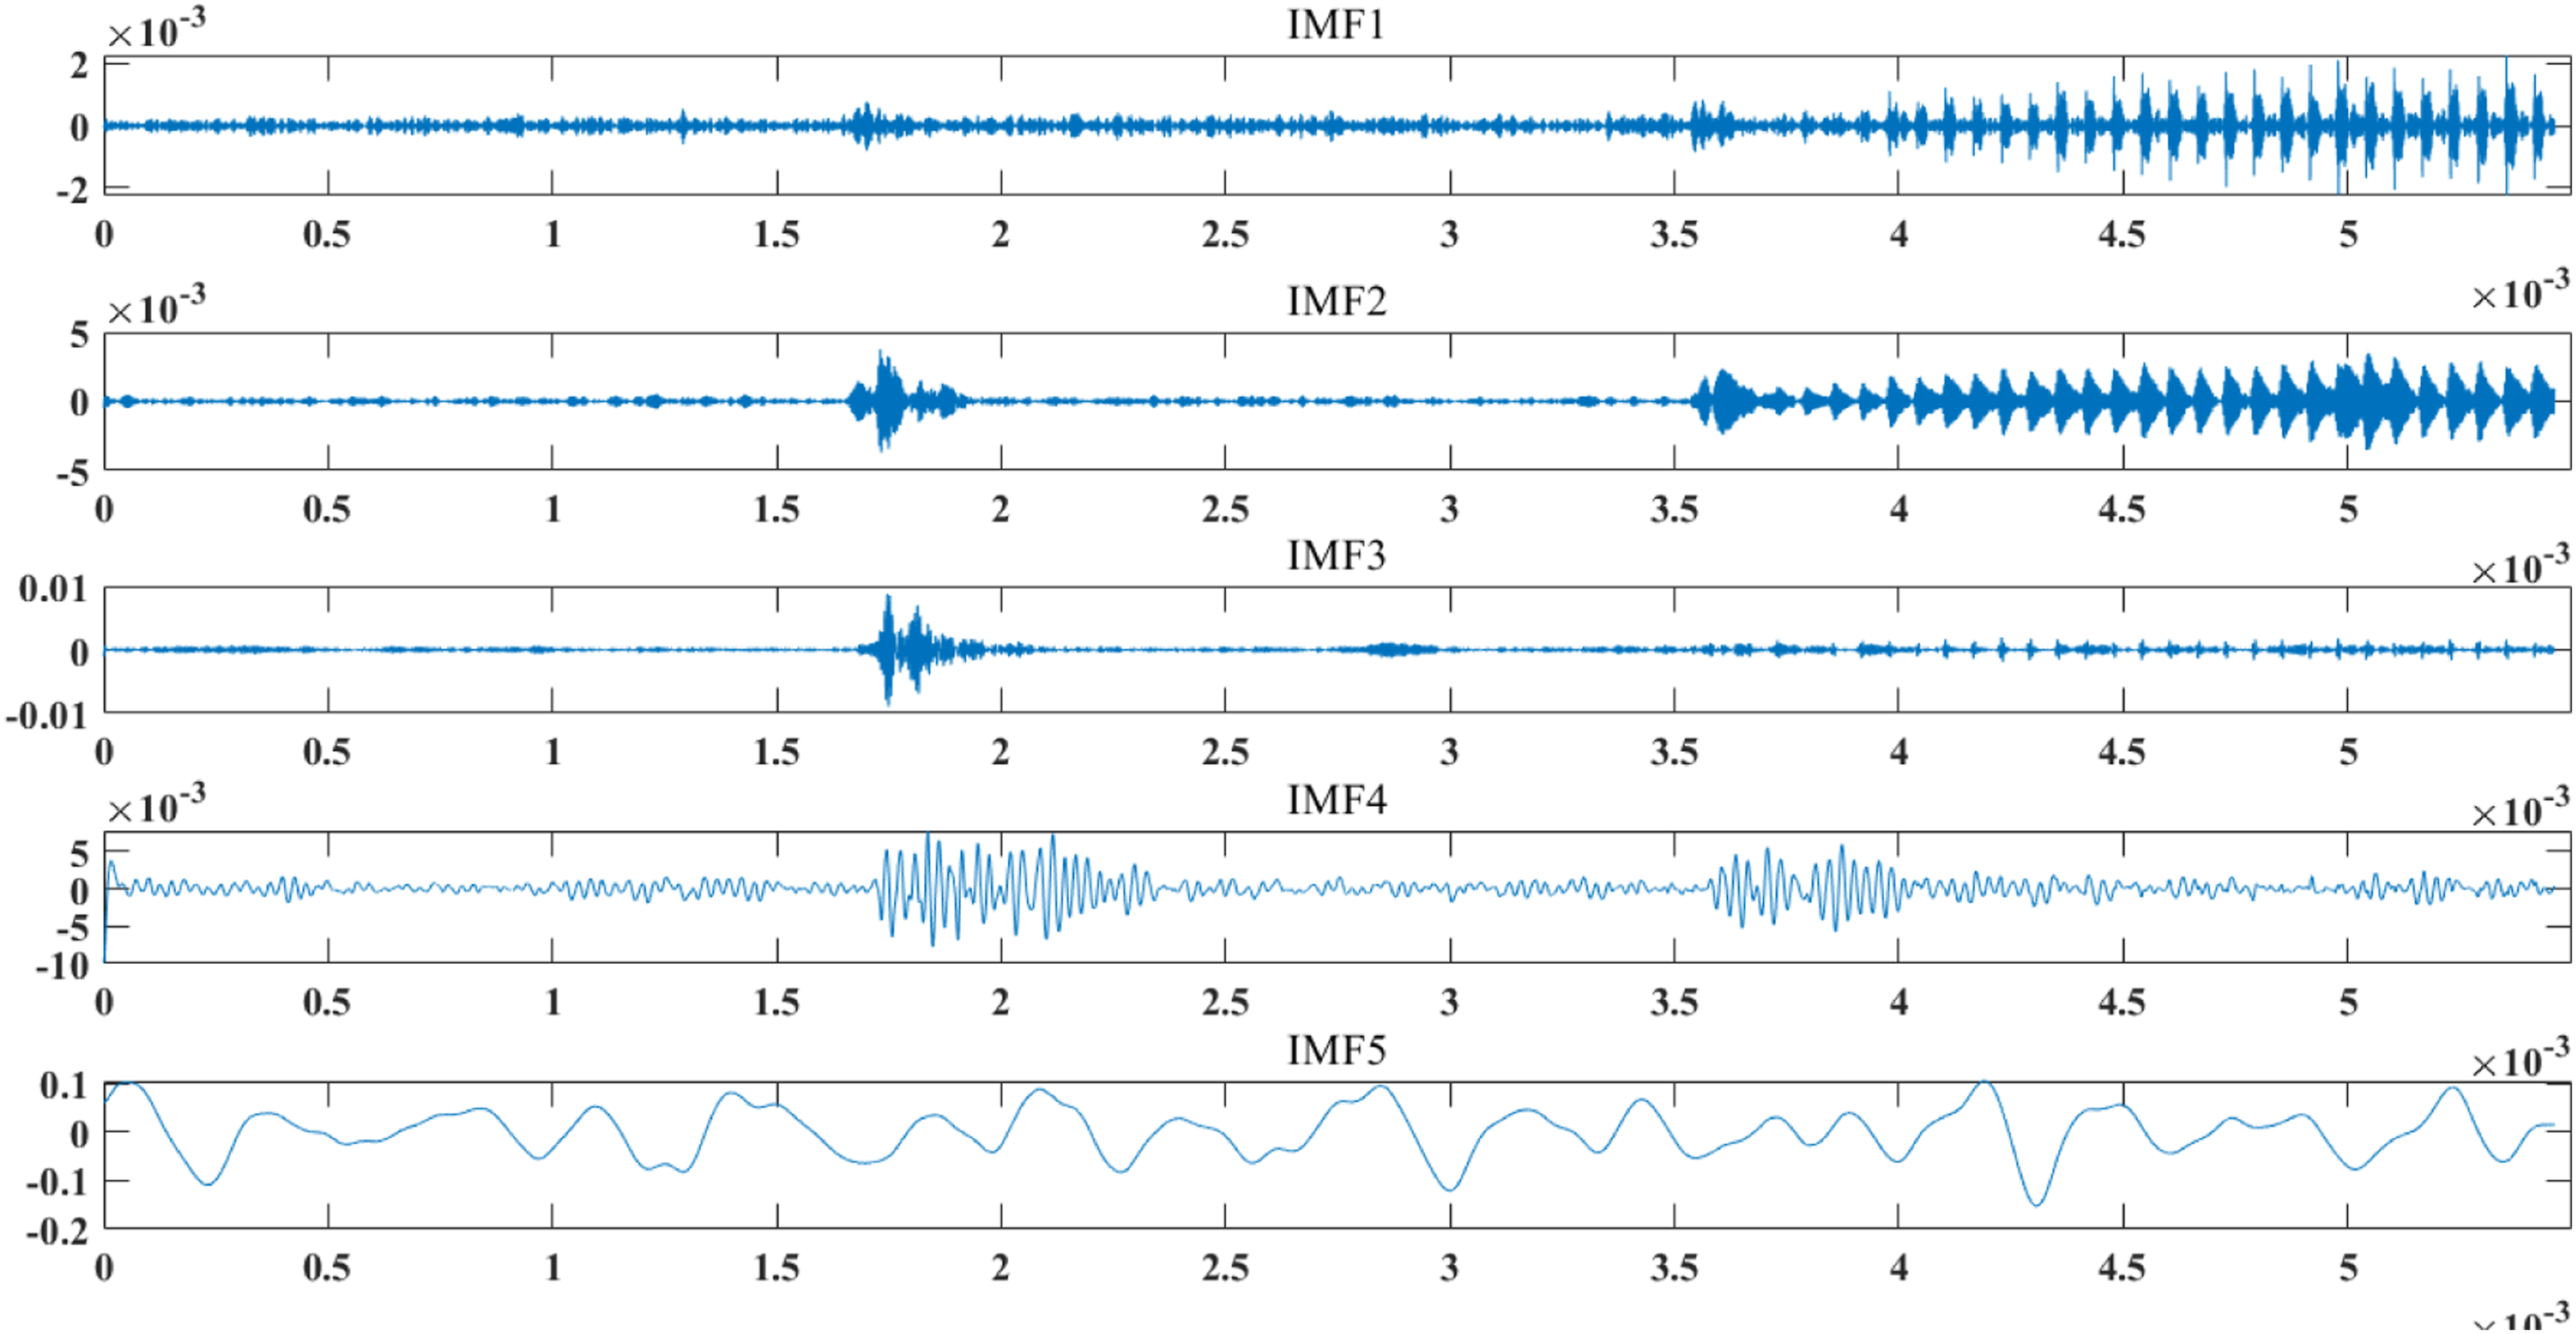
Hilbert transform spectral analysis was performed on IMF1–IMF4 to extract the instantaneous frequency and instantaneous power spectral energy of each IMF in the local time domain. This approach enables the localized analysis of complex AE signals, facilitating the differentiation of damage-induced signal features from AE signal. Figure 4 displays a three-dimensional time-frequency plot showing the variation of instantaneous frequency and instantaneous energy with impact time for each IMF. The frequency range of IMF1 is 300-500 kHz, that of IMF2 is 200-300 kHz, that of IMF3 is 100-200 kHz, and that of IMF4 is 10-100 kHz. Although significant discrepancies exist in the reported frequency ranges corresponding to different damage mechanisms of composite materials in the existing literature, a consensus has been reached in most studies: the frequency range associated with fiber breakage is the largest, while that corresponding to matrix cracking is relatively lower. In contrast, the frequency ranges for fiber-matrix debonding and delamination fall between these two damage types. Based on published frequency statistics from existing literature,32,33,34 each IMF component is tentatively correlated with a specific damage mode by dominant frequency band: IMF1 (300–500 kHz) is preliminarily attributed to fiber fracture, IMF2 (200–300 kHz) to delamination, IMF3 (100–200 kHz) to fiber–matrix debonding and IMF4 (10–100 kHz) to matrix cracking. It should be emphasized that such frequency-based damage partitioning is an empirical statistical classification rather than a rigorous exclusive mapping; mixed-frequency signals induced by coupled multi-damage coexistence cannot be fully separated via the present VMD decomposition. HHT for IMFs: (a) IMF1; (b) IMF2; (c) IMF3; (d) IMF4 under 40J impact.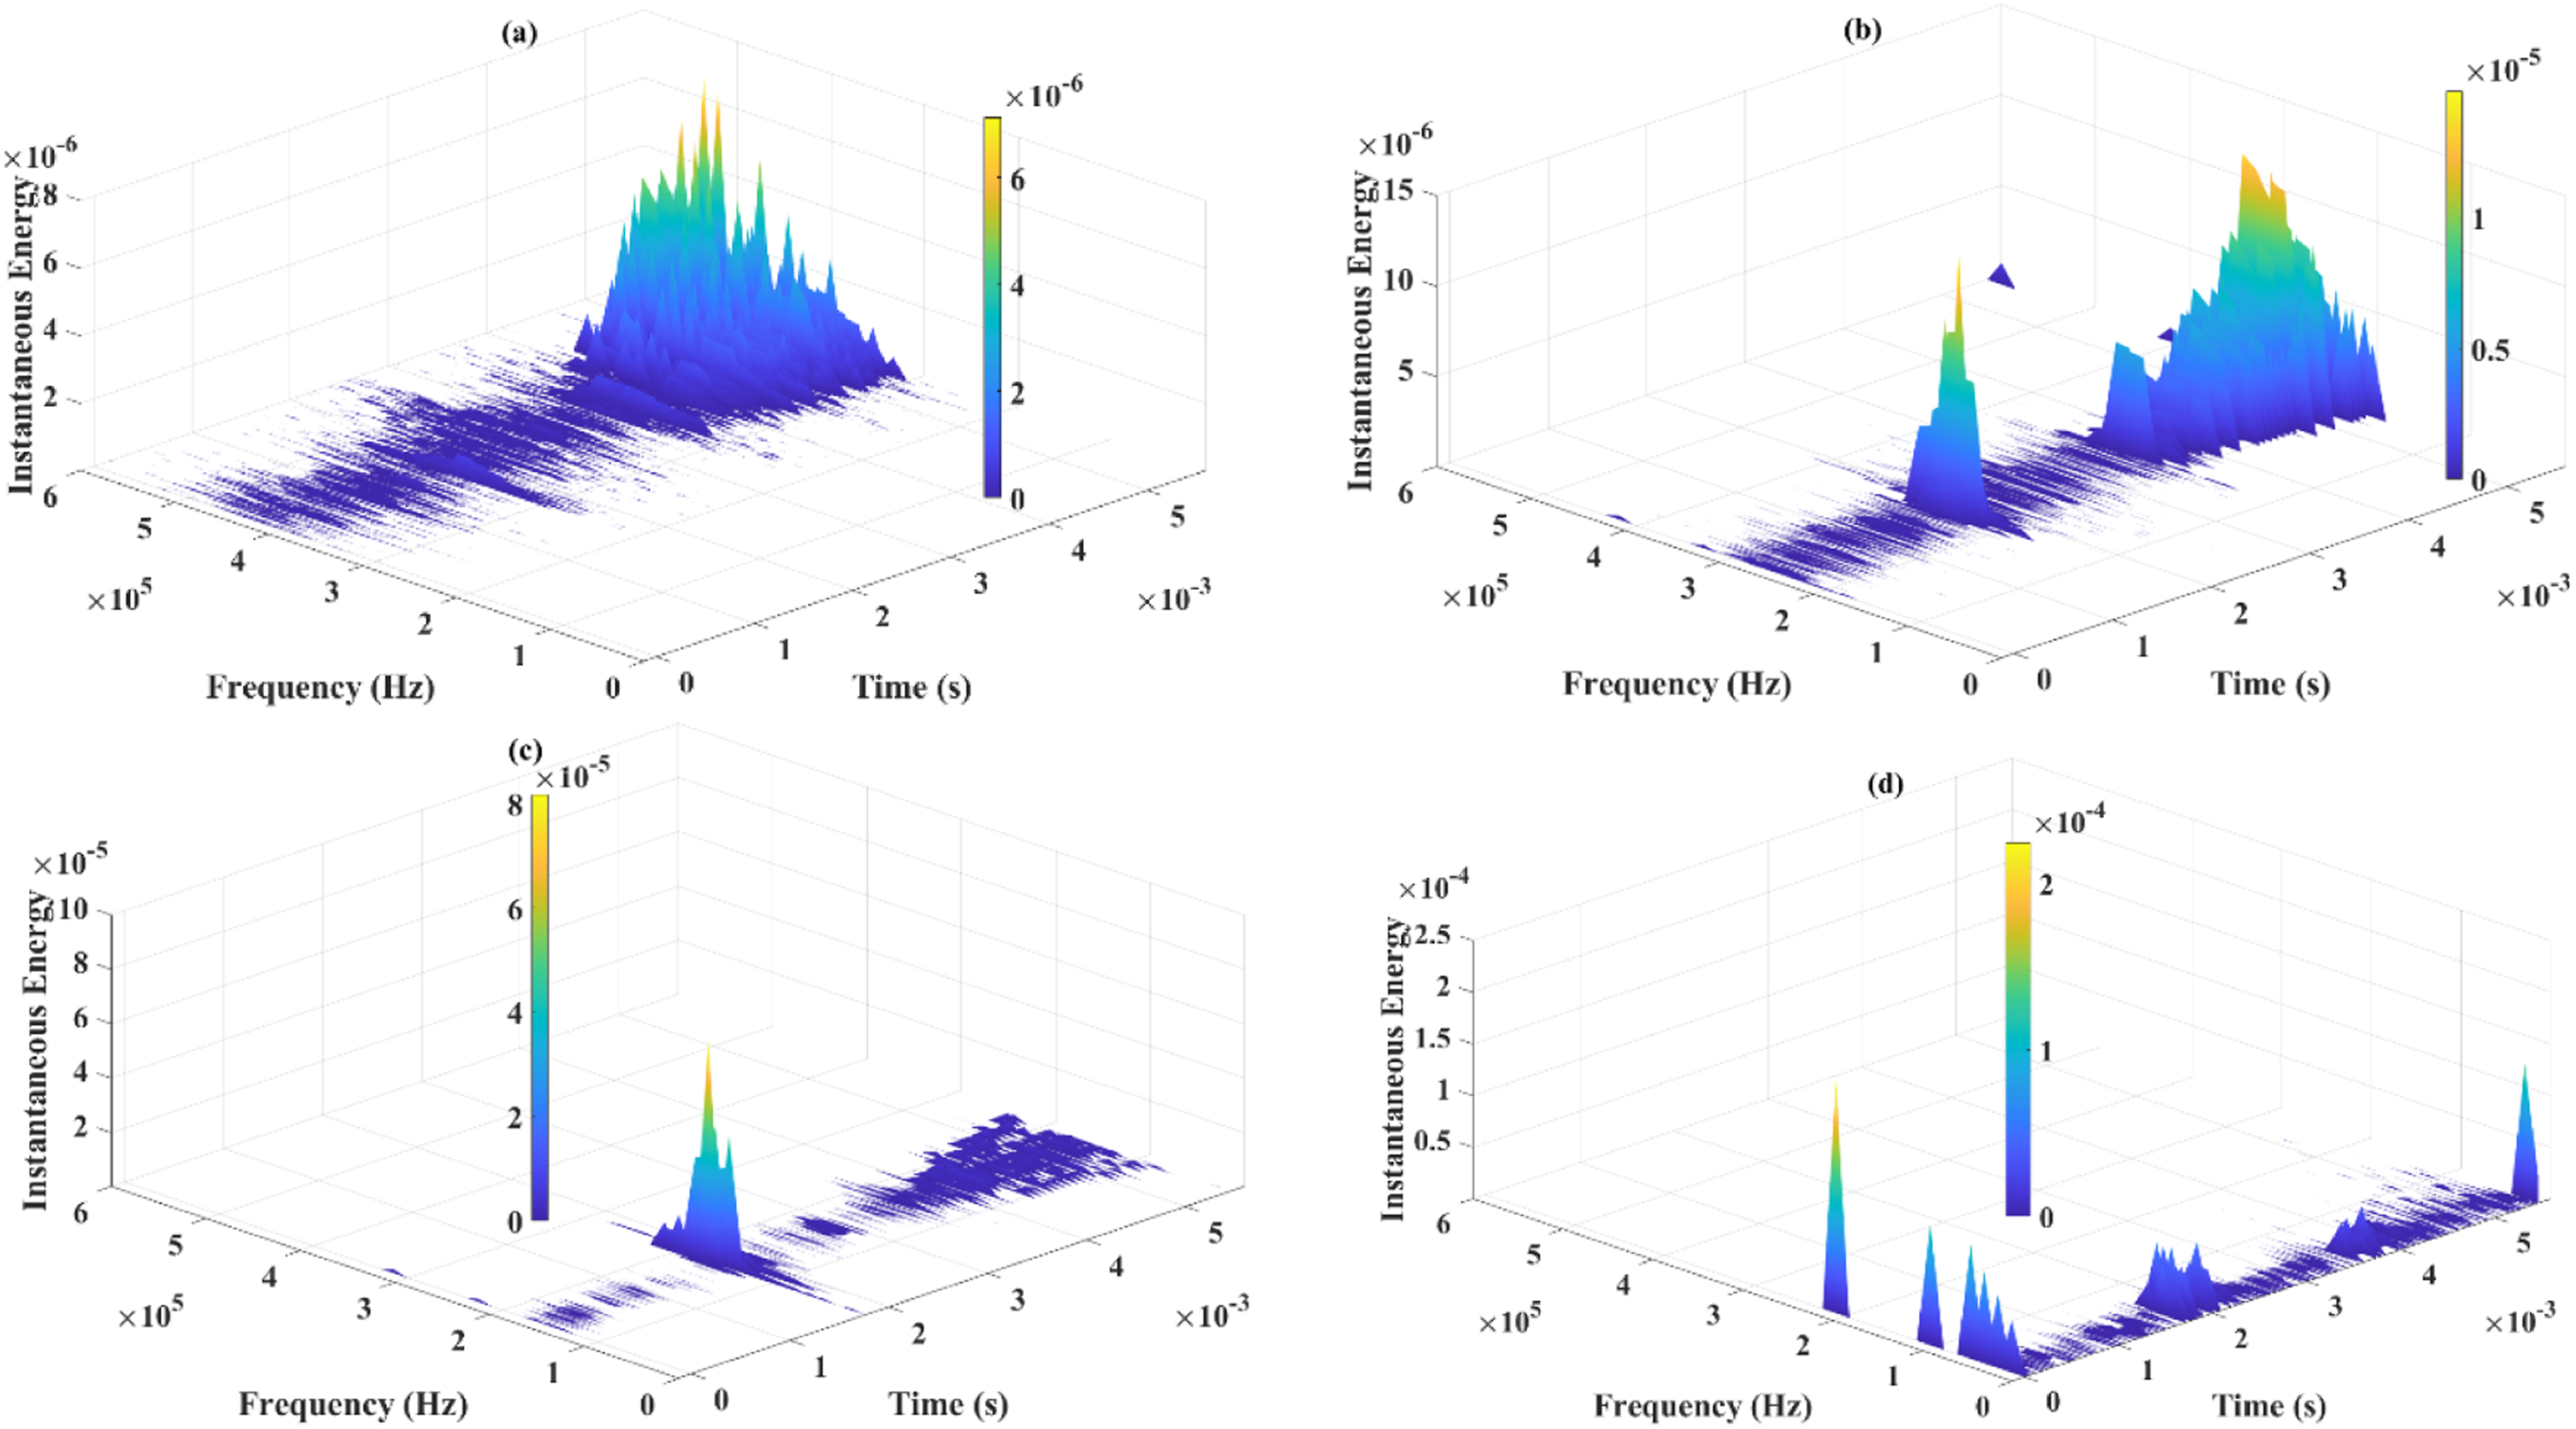
Combined with Figures 3 and 4, it can be observed that matrix damage (corresponding to IMF4) occurs earlier than other types of damage. Matrix cracking is initiated at the initial moment of impact, and its instantaneous energy value is also higher than that of other damage modes (reaching the order of magnitude of 10−4). The most severe matrix damage is formed in two time intervals: 1.75 ms–2.3 ms and 3.6 ms–4 ms. At the initial stage of impact, the degrees of fiber-matrix debonding (corresponding to IMF3) and delamination damage (corresponding to IMF2) are relatively slight. The damage that occurs during the time period of 1.7 ms to 1.96 ms is relatively severe. After the time point of 3.58 ms, the degrees of damage in both damage modes become severe again. The degree of fiber fracture damage is relatively slight at the initial stage of impact, and it begins to increase gradually only after the time of 3.58 ms. Matrix cracking exhibits the highest damage severity among the four failure types. In terms of the occurrence timing of the four damage modes, matrix damage occurs the earliest and persists throughout almost the entire impact process (from the initiation to the maximum impact displacement). This is followed by the successive occurrences of fiber-matrix debonding and delamination damage, while fiber breakage occurs the latest.
To compare the evolutionary trends of four distinct damage modes during the impact process and their corresponding damage severities, the cumulative energy of IMF component signals was adopted as a quantitative indicator to characterize the severity of each damage mode. Specifically, the cumulative damage energy generated prior to a given moment is defined as the sum of the squared amplitudes of the signals up to that moment, which is mathematically expressed in equation (5): Force-time curve and cumulative energy curves of four damage modes under 40J impact.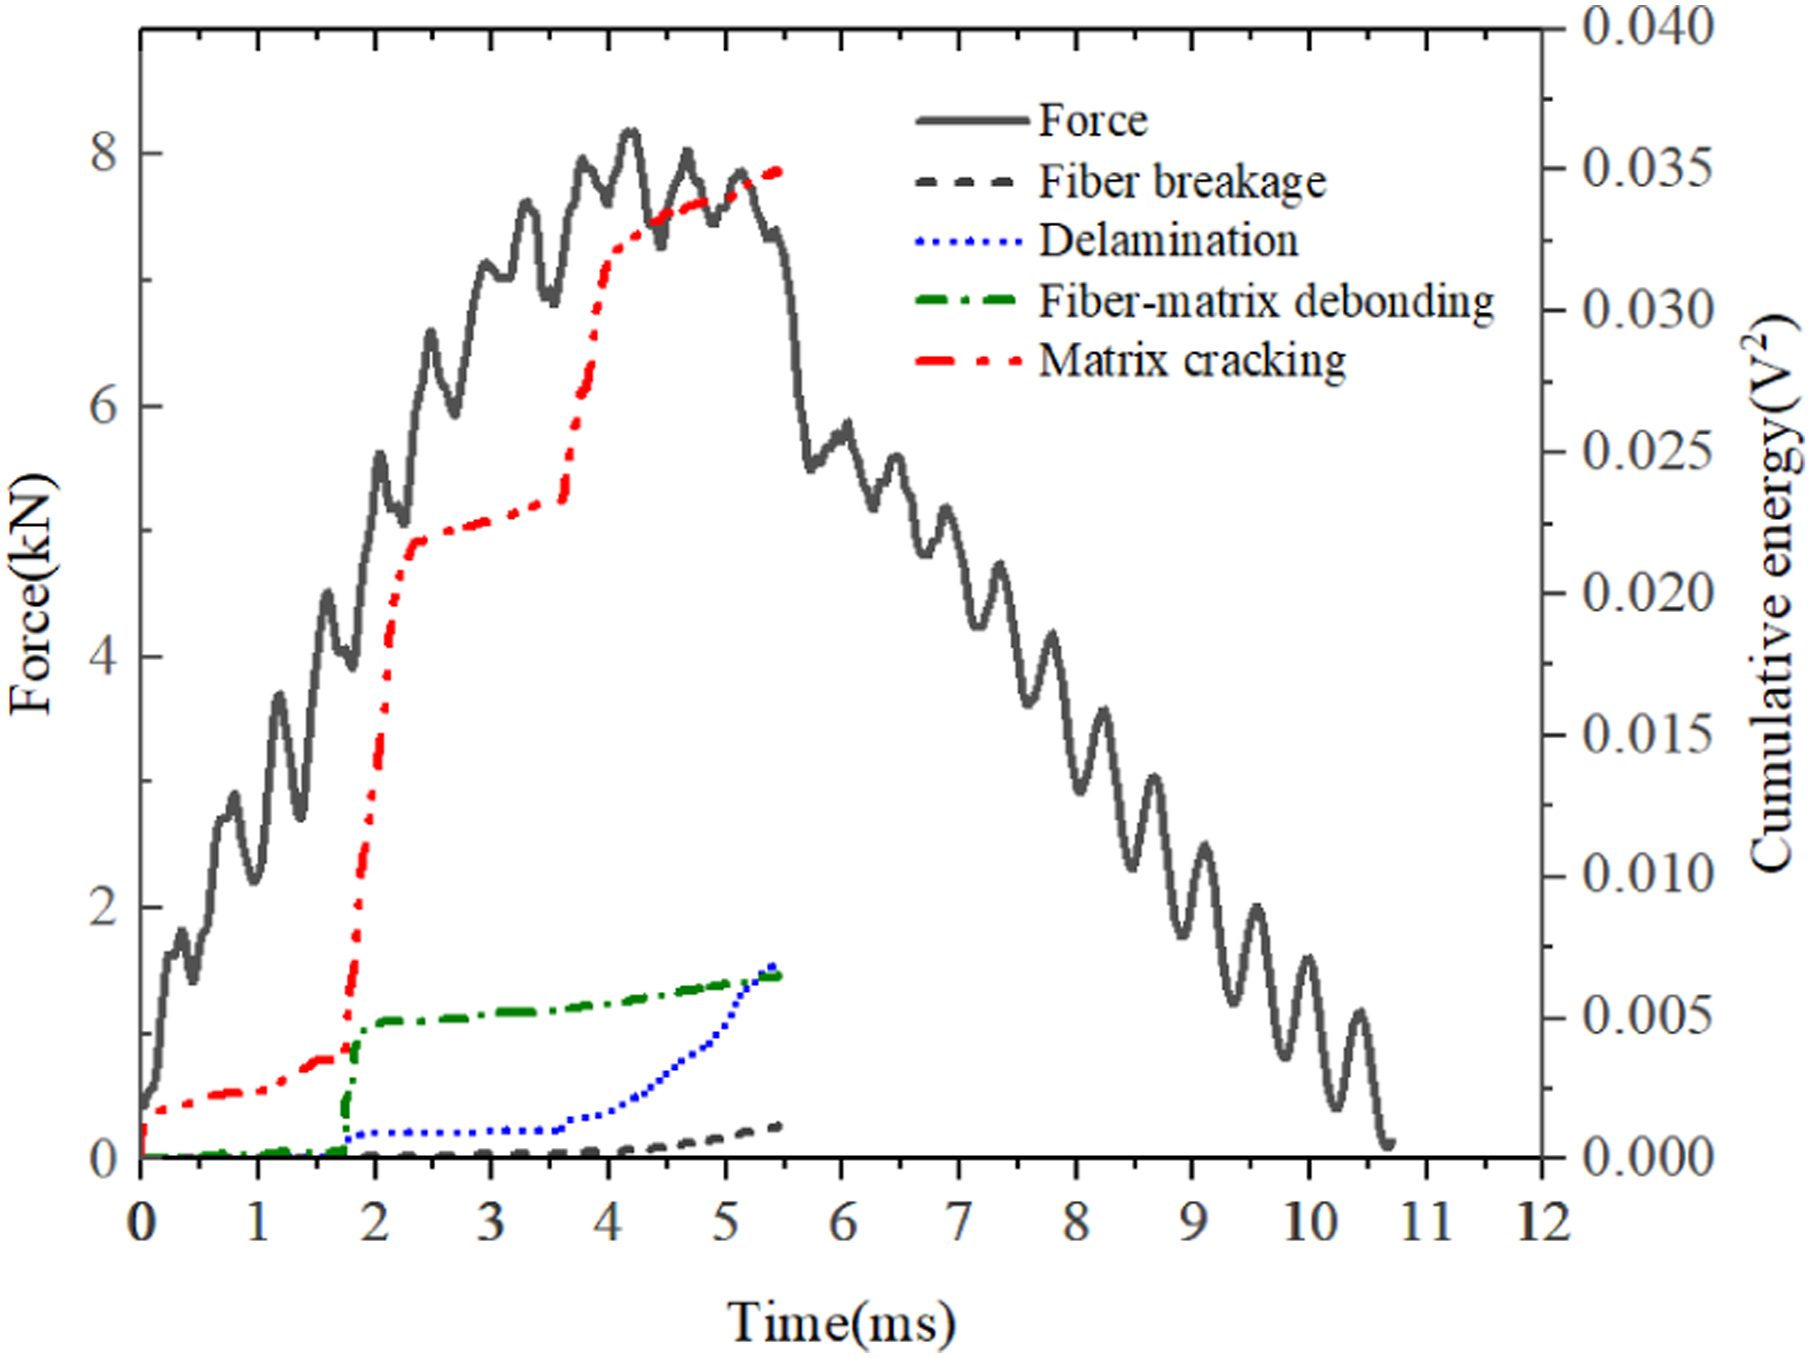
60J impact
Figure 6 presents the VMD results of the AE signal acquired under a 60J impact load. Consistent with the decomposition behavior observed for the 40J impact case, the AE signal is decomposed into five IMFs. Notably, the separated low-amplitude and high-frequency signal components are retained within IMF1 to IMF4, which exhibit characteristics consistent with those of AE signals generated by impact-induced damage in composite materials. In contrast, the waveform of IMF5 displays amplitude and frequency characteristics identical to those of the original AE signal, which can be attributed to the primary impact pulse and subsequent free vibration induced by the punch impacting the composite laminate. To identify the specific damage modes of composite materials associated with IMF1–IMF4, a spectral analysis approach based on the Hilbert transform was conducted for each IMF component, as illustrated in Figure 7. The frequency domain distribution of each IMF is consistent with that under the 40J impact. Specifically, IMF1 (with a frequency range of 300–500 kHz) corresponds to fiber breakage; IMF2 (with a frequency range of 200–300 kHz) is associated with delamination damage; IMF3 (with a frequency range of 100–200 kHz) corresponds to fiber-matrix debonding; and IMF4 (with a frequency range of 10–100 kHz) is related to matrix cracking damage. The AE events caused by matrix damage and fiber-matrix debonding occur continuously throughout the entire loading process (from the initiation of impact to the achievement of maximum displacement), whereas the AE events induced by delamination and fiber fracture generate intermittently during the loading process. When comparing the instantaneous energy magnitudes across the four damage modes, the matrix damage remains the most severe, reaching an order of magnitude of 10−4. VMD for AE signals collected under 60J impact. HHT for IMFs: (a) IMF1; (b) IMF2; (c) IMF3 under 60J impact.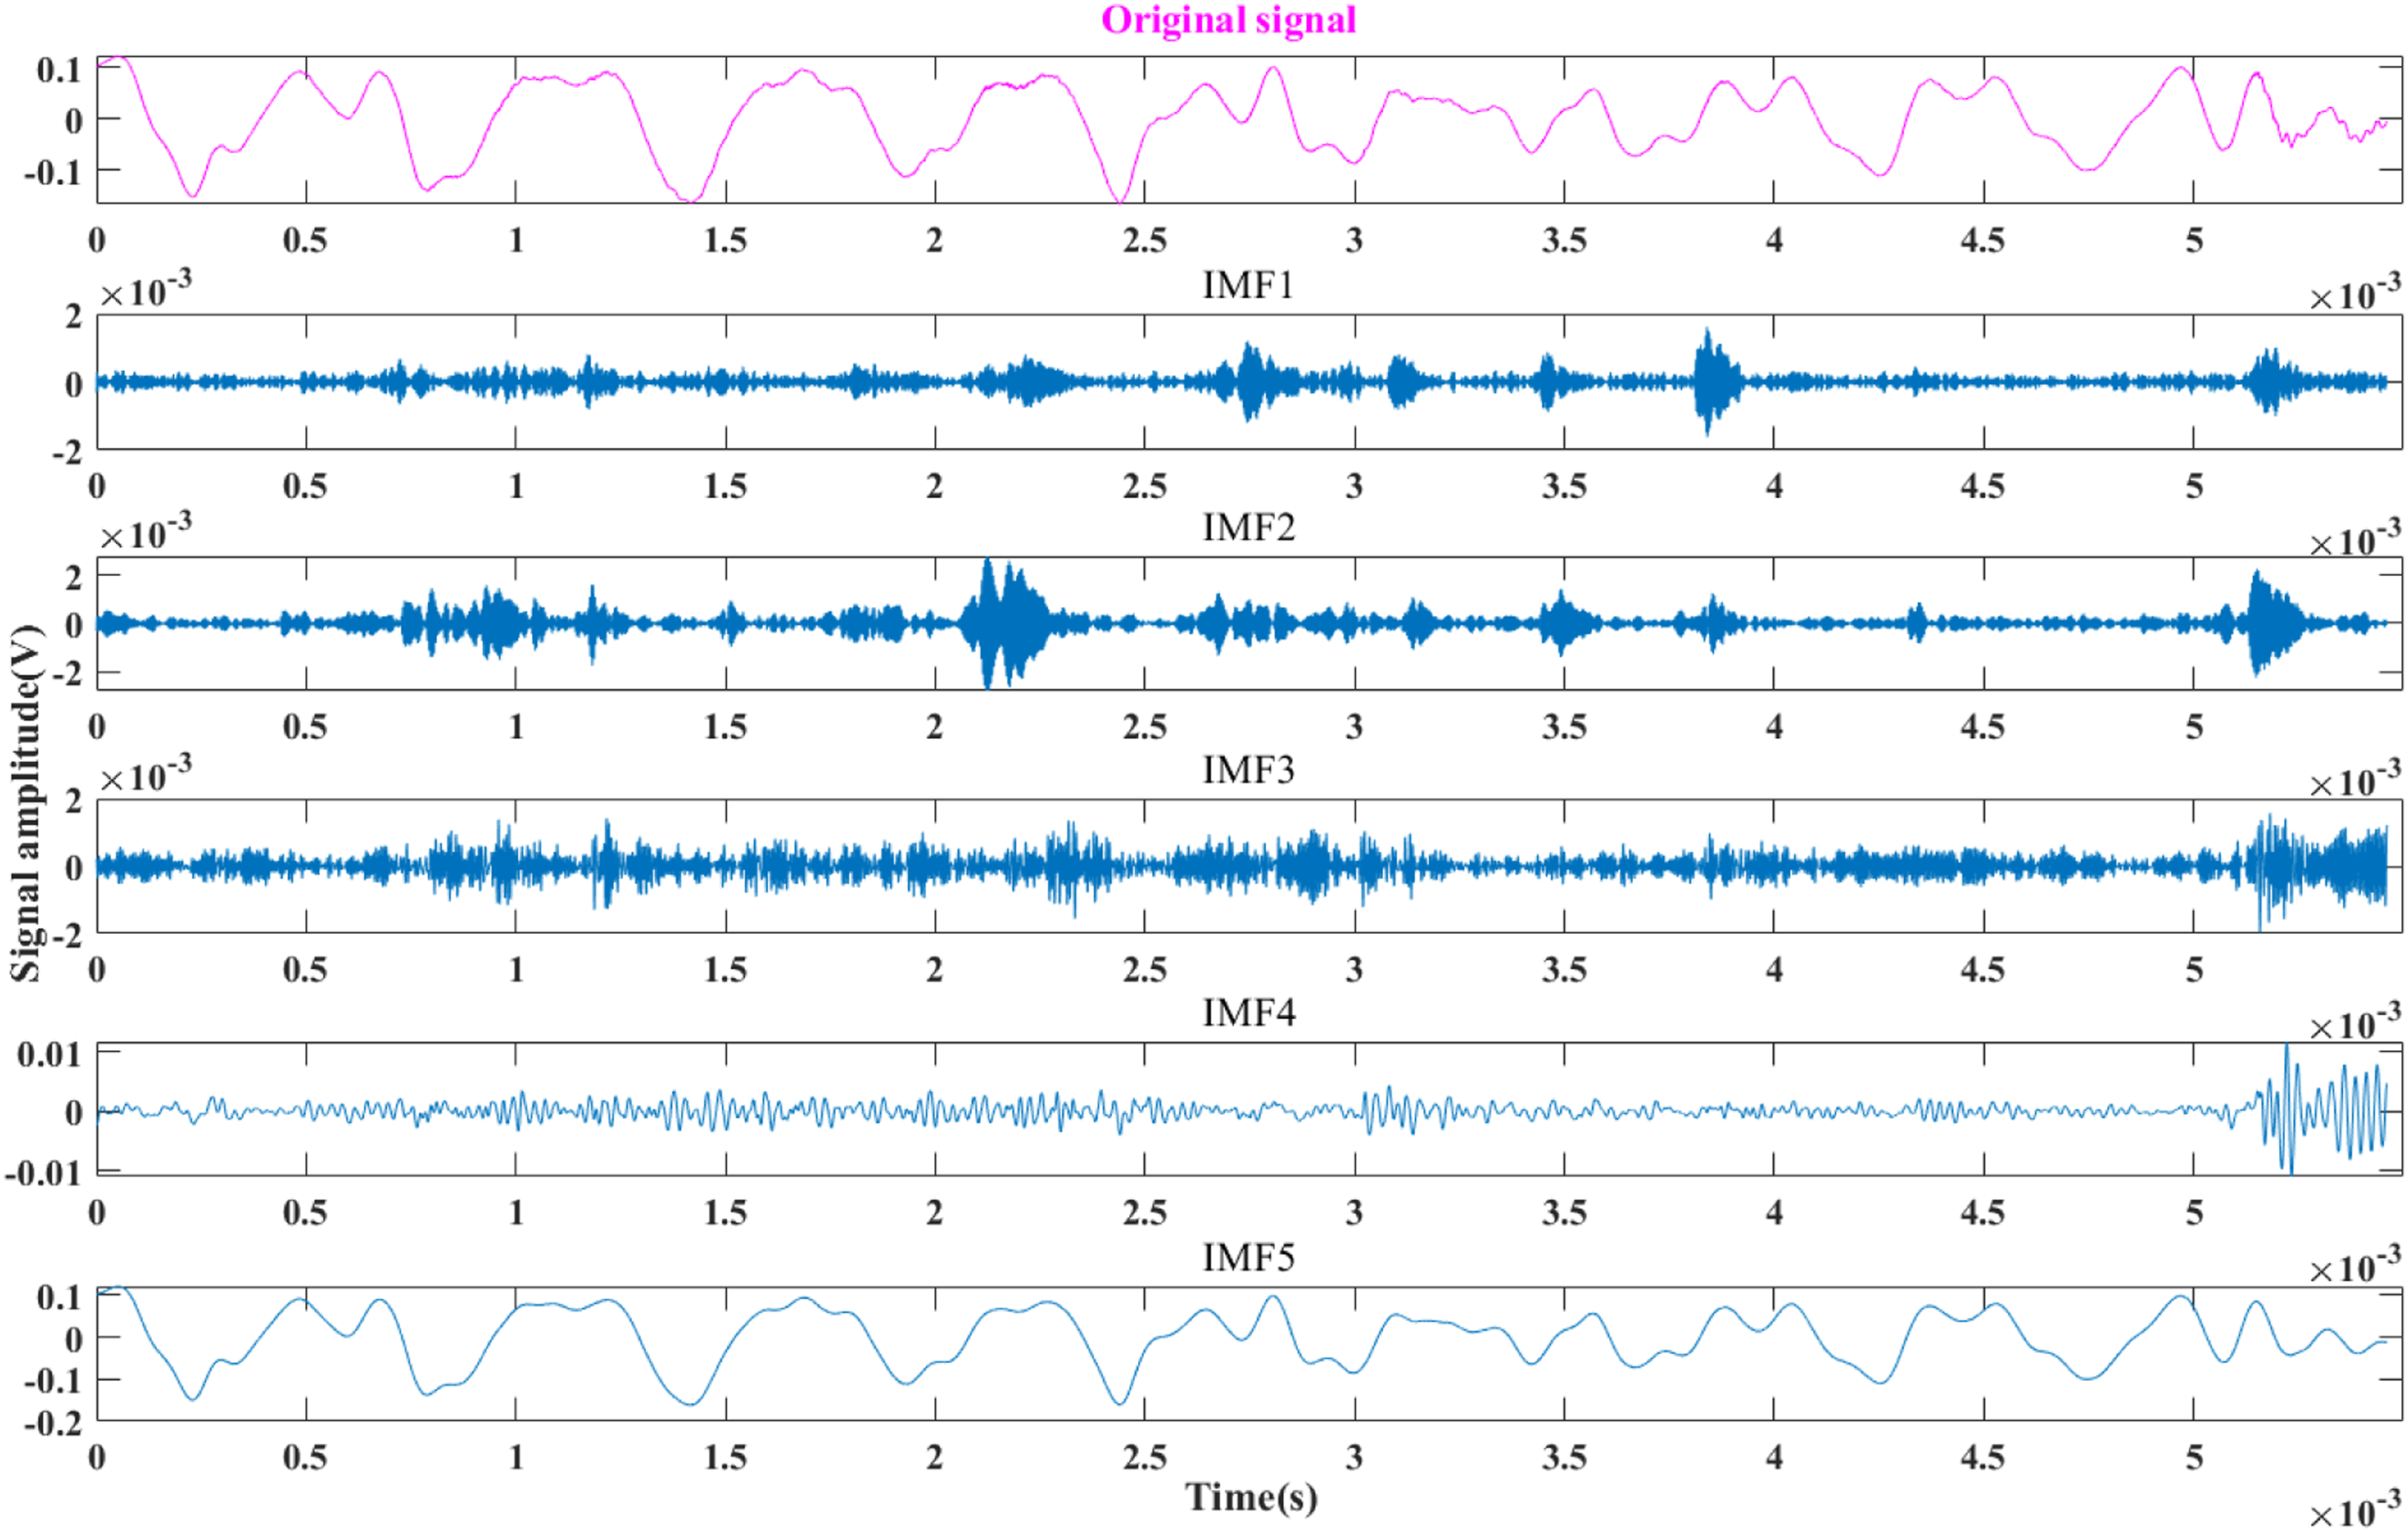
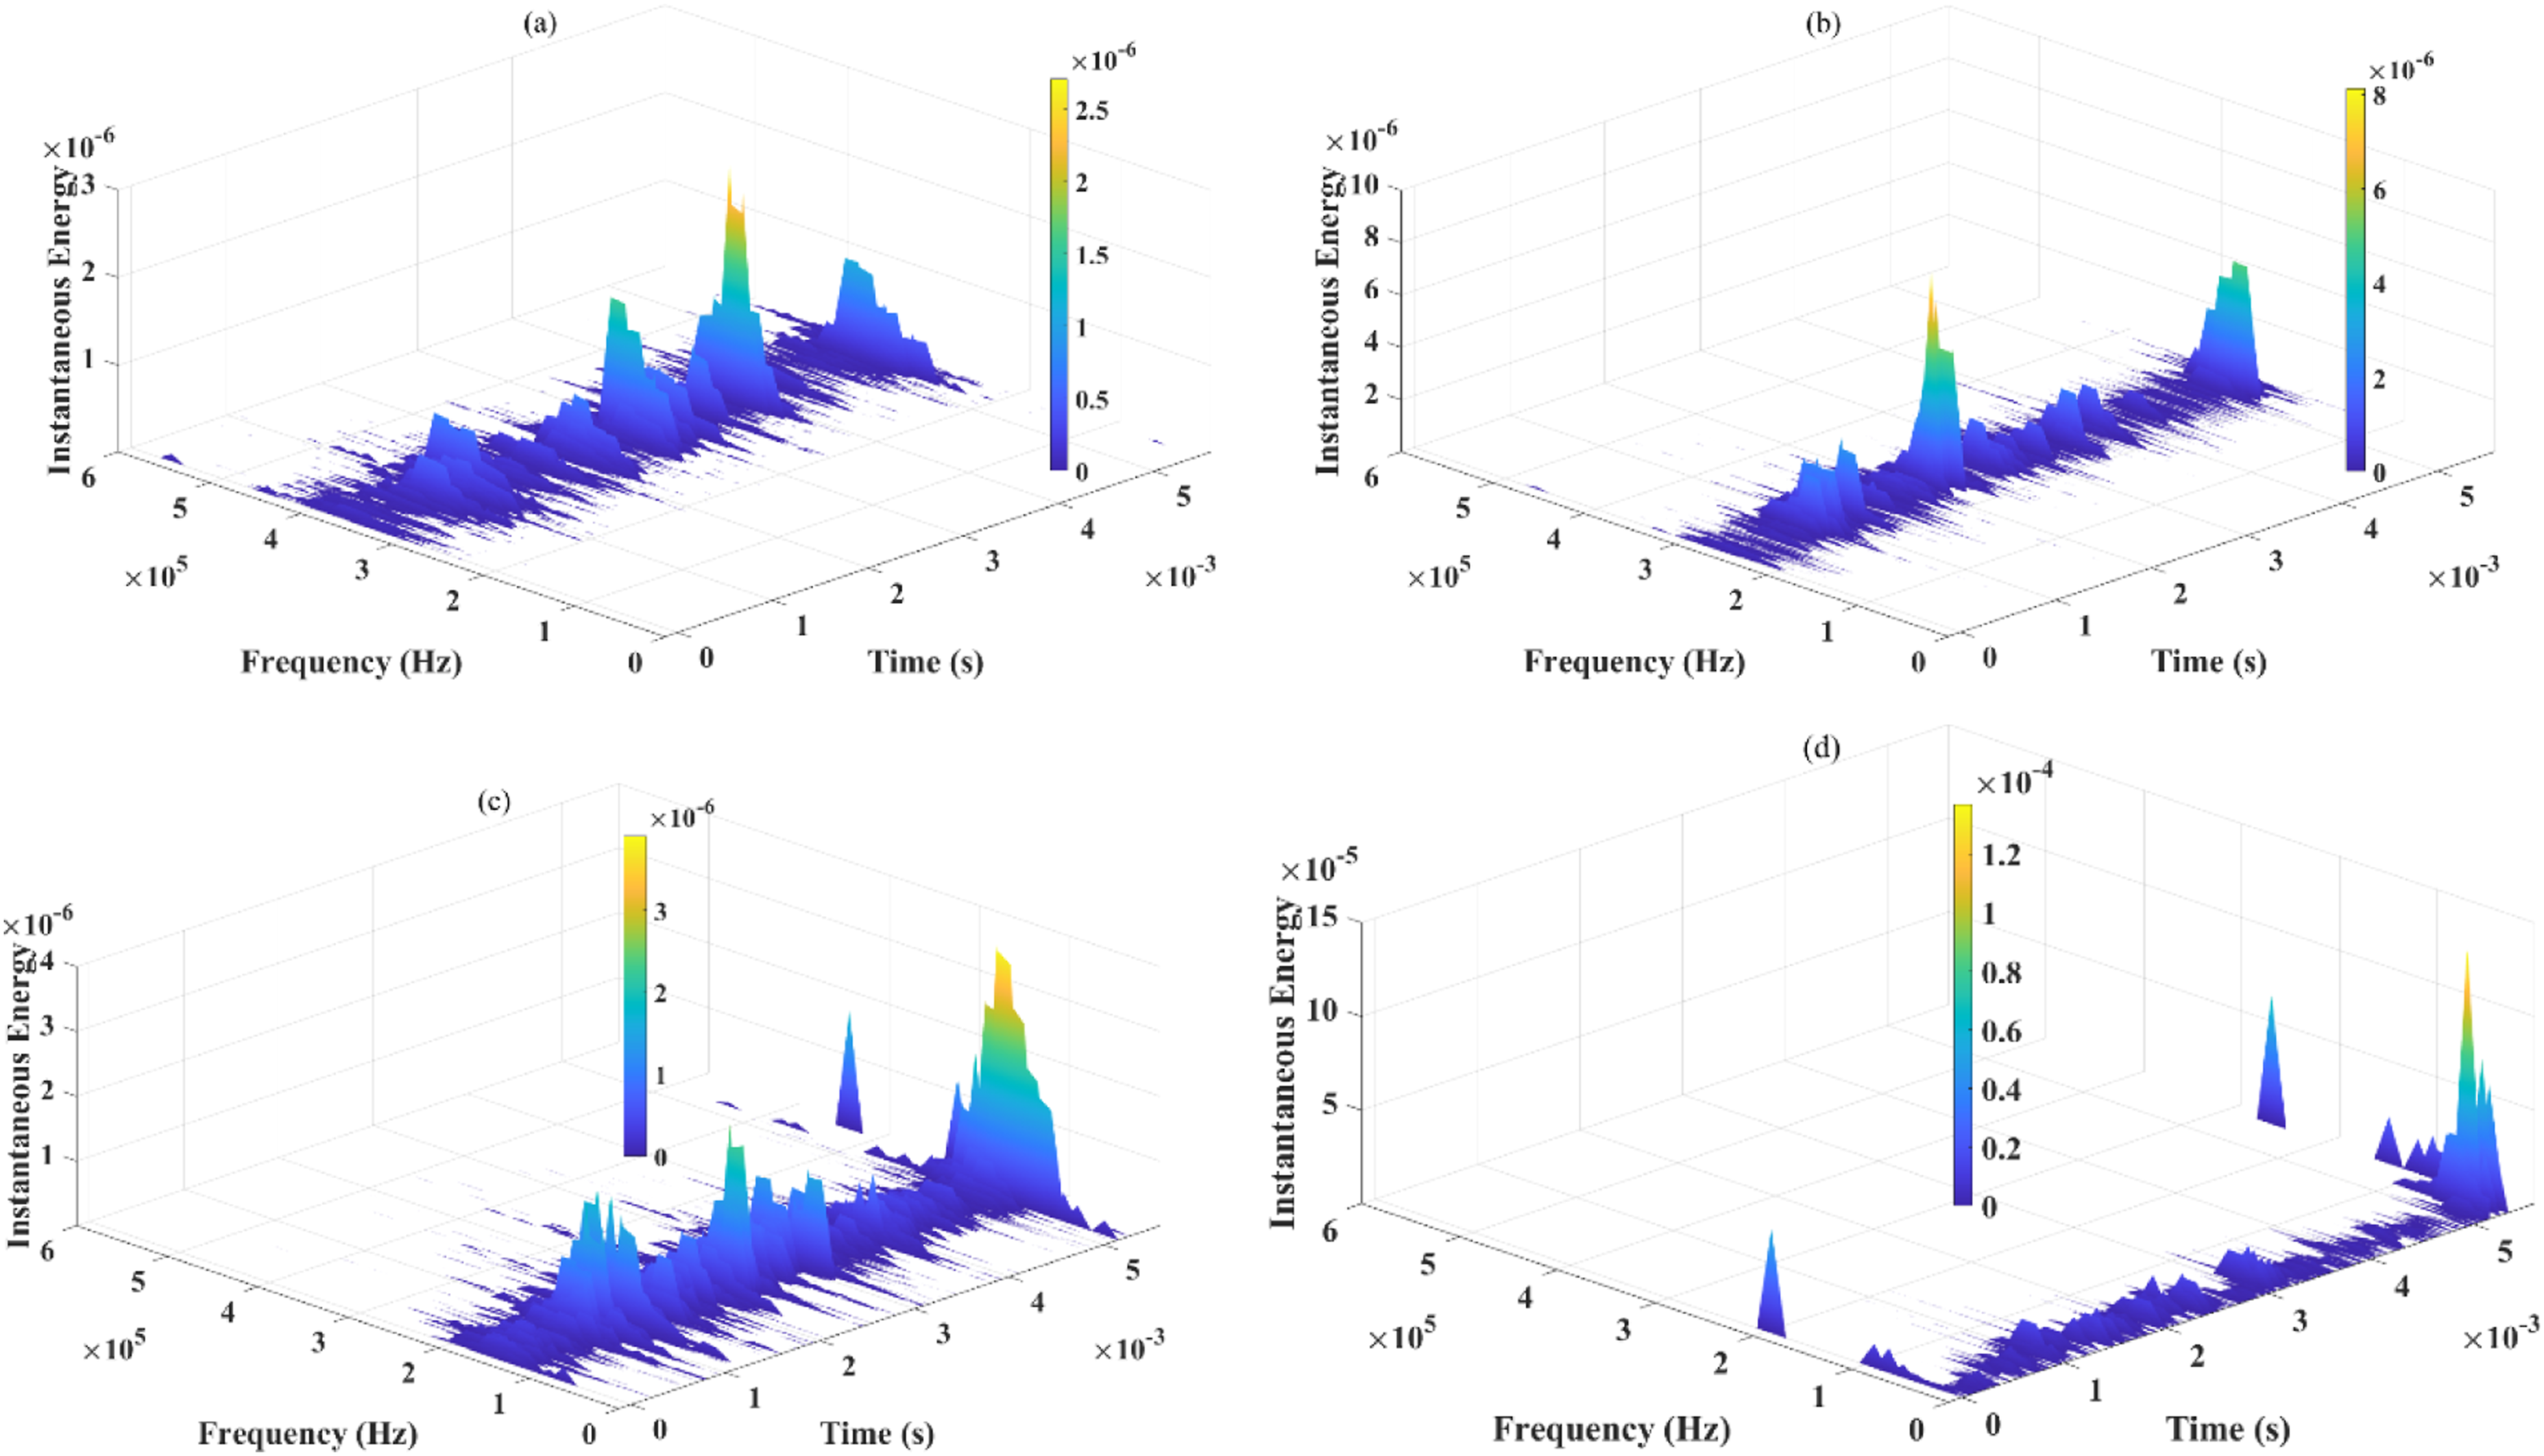
Figure 8 illustrates the time-dependent cumulative energy distributions of the IMF components associated with the four distinct damage modes (i.e., matrix cracking, fiber-matrix debonding, delamination, and fiber breakage) in composite materials, alongside the impact force-time curve. Similar to the 40J impact condition, the matrix damage is the most severe, while the damage degrees of the other three damage modes are far lower than that of the matrix damage. When the impact force reaches the peak load, a sudden drop in the impact force occurs, indicating that significant internal damage has been generated in the laminate. At this point, the growth rate of matrix damage is lower than that in the previous stage, while the occurrences of delamination damage, fiber-matrix debonding, and fiber breakage begin to increase. For a certain period (2.1-5.8 ms) after the impact force reaches the peak load, the load fluctuates multiple times; this indicates that continuous damage events occur inside the material. During this stage, the propagation of delamination damage is more significant than that of fiber-matrix debonding and fiber breakage. Force-time curve and cumulative energy curves of four damage modes under 60J impact.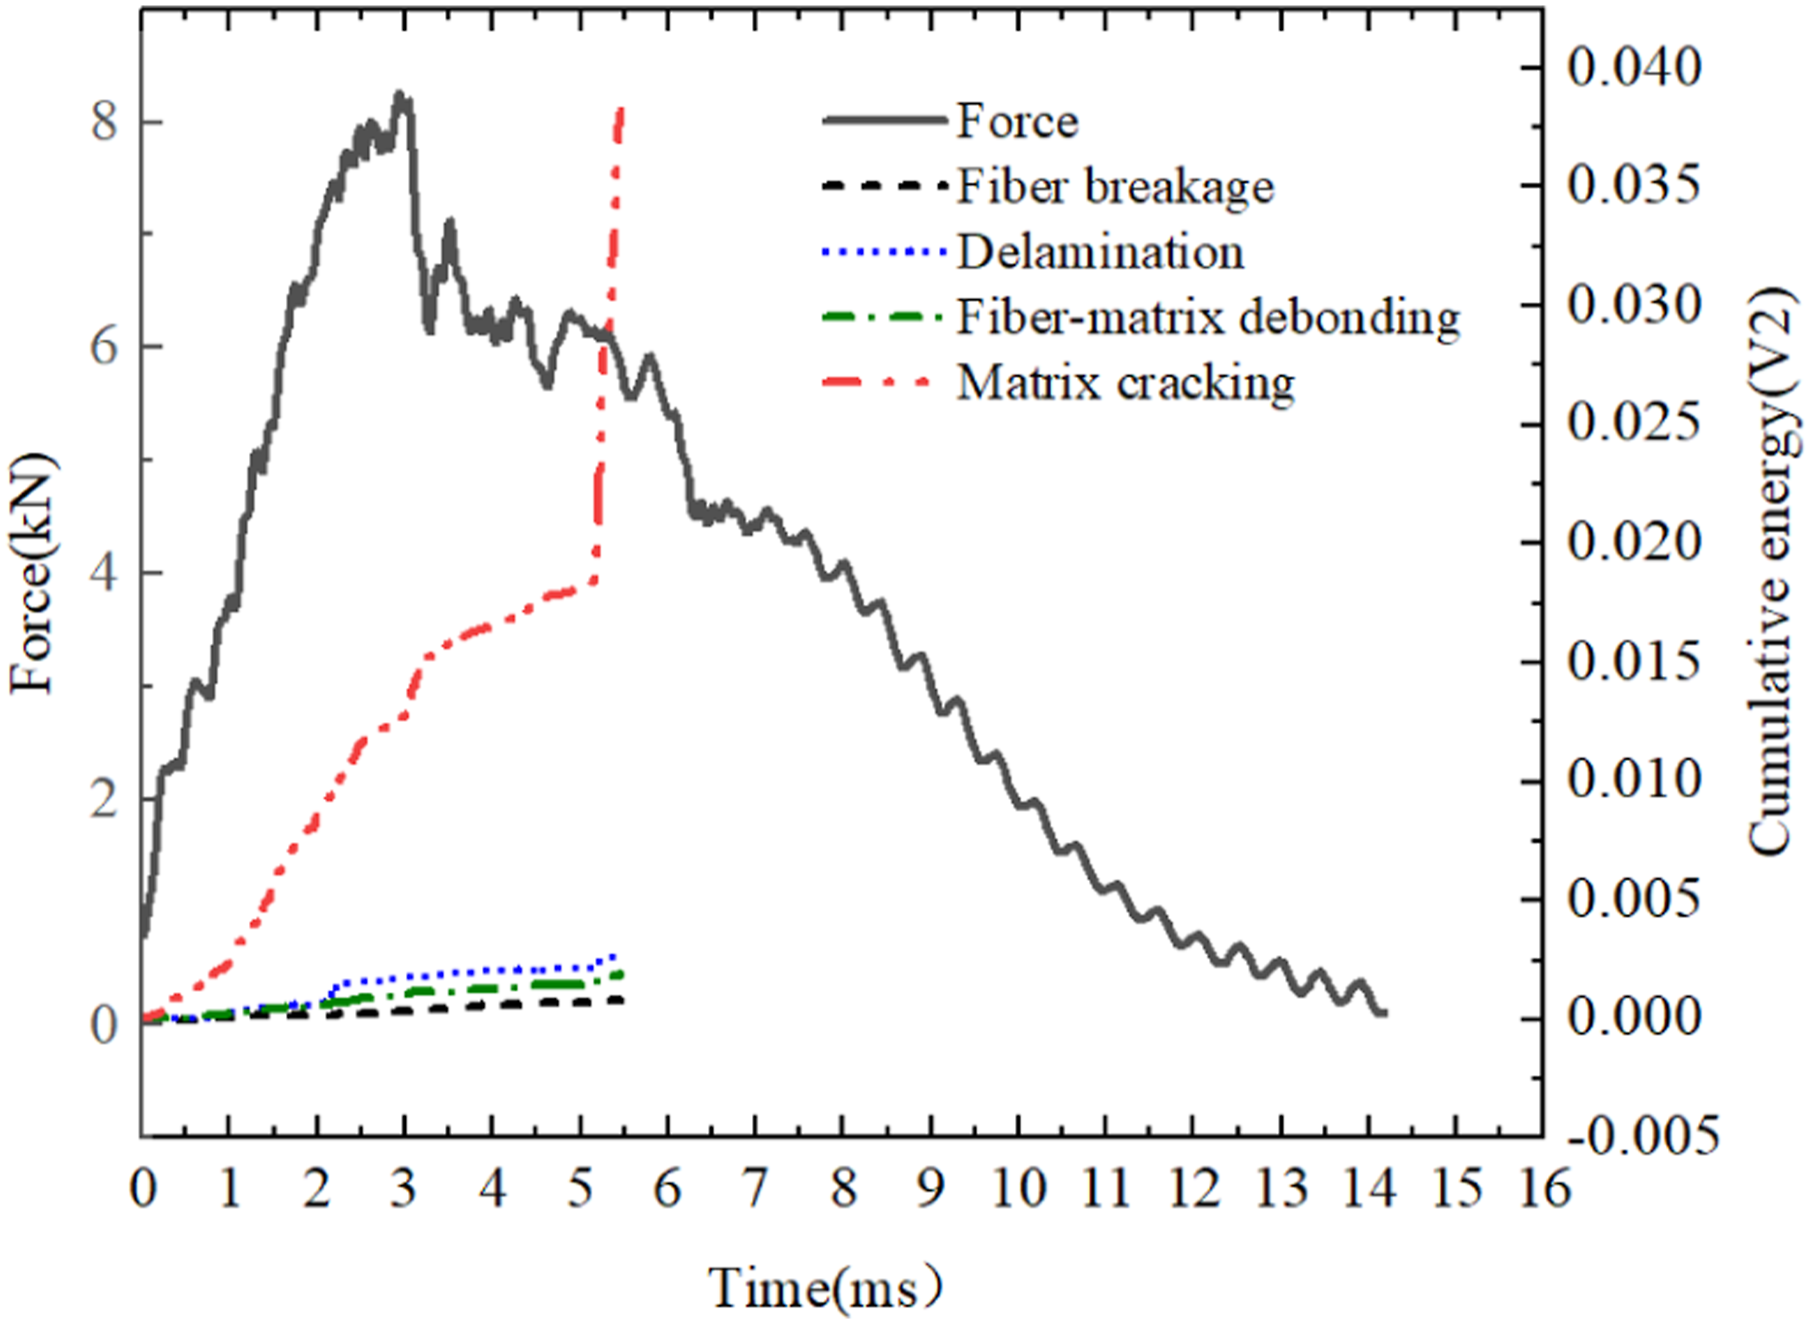
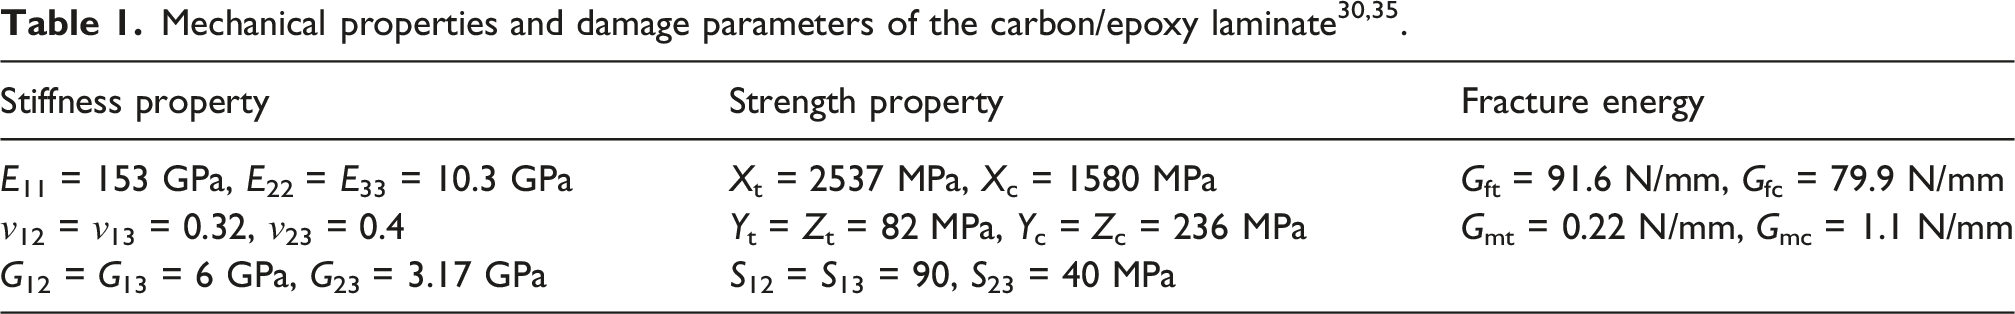
Impact damage mechanism: A finite element simulation-based investigation
Finite element model
A LVI FE model of the composite laminate was established via the explicit dynamics module of ABAQUS (ABAQUS/Explicit), as schematically illustrated in Figure 9. In accordance with the ASTM D7136 standard, the laminate was designed with a planar dimension of 150 mm × 100 mm and a nominal thickness of 3.6 mm. A rectangular opening with dimensions of 125 mm × 75 mm was machined at the center of the lower supporting plate. Both the impact punch and supporting plate were treated as rigid bodies and discretized using R3D4 rigid elements. The diameter of the punch is 13 mm. The supporting plate was subjected to a fully fixed boundary condition, while the four lateral surfaces of the composite laminate were constrained with a fixed support. The punch was assigned a mass of 14.853 kg and a predefined initial velocity, which was determined based on the target impact energy specified in the experimental setup. FE model for LVI analysis.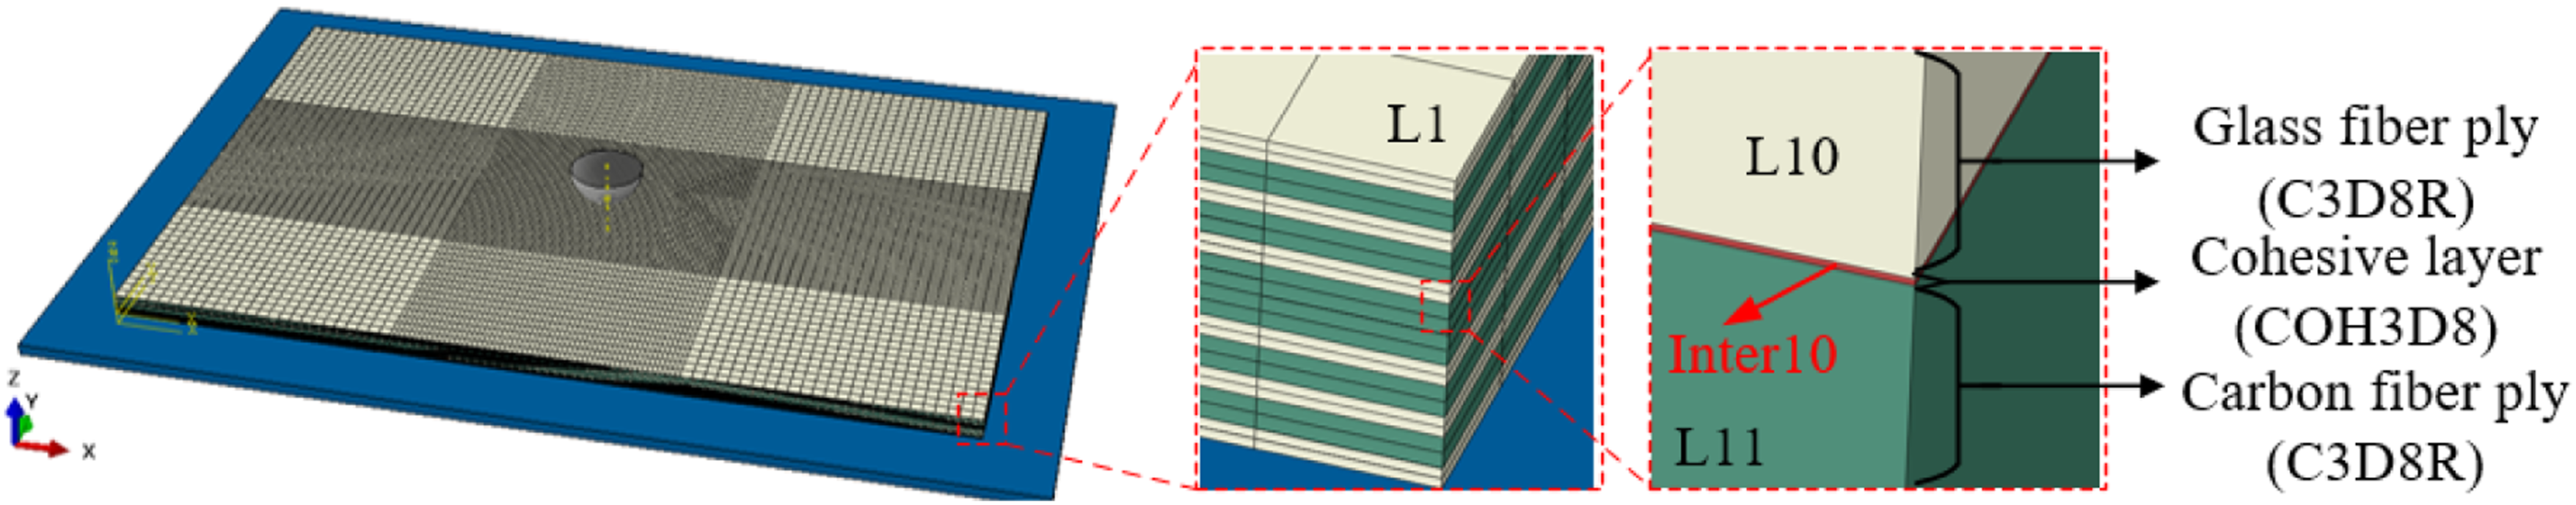
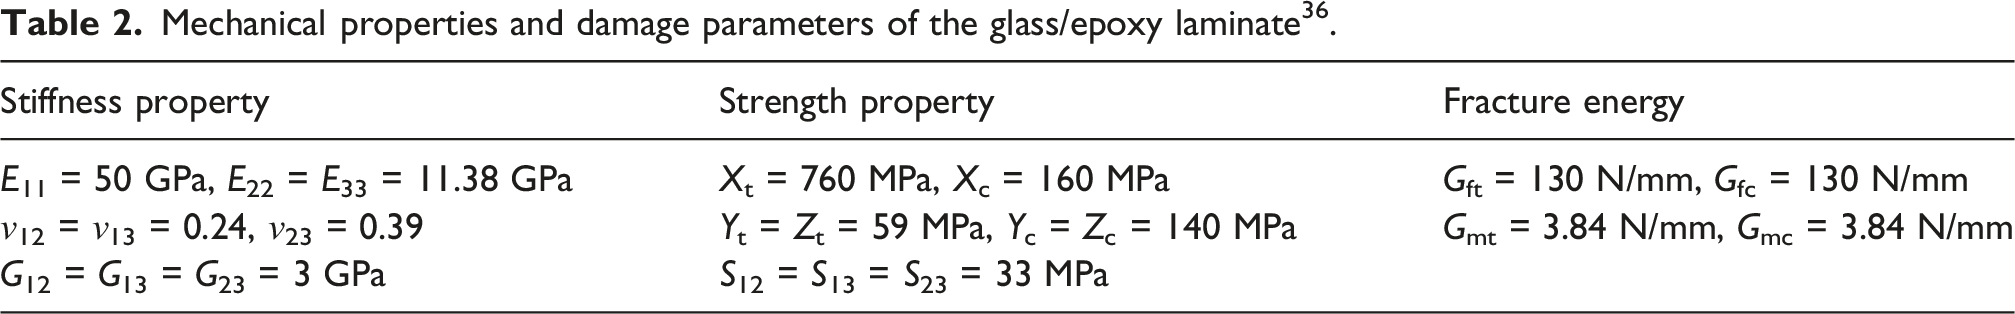
Mechanical properties and damage parameters of the glass/epoxy laminate 36 .
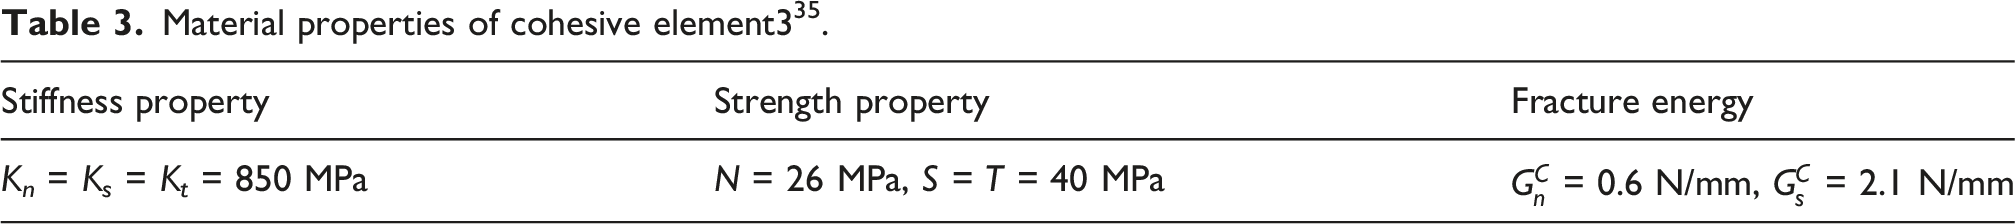
Material properties of cohesive element3 35 .
The established FE model comprises a total of 216960 solid elements and 207920 cohesive elements. A general contact algorithm was adopted to model the contact interactions between the punch and the upper surface of the laminate, as well as between the supporting base and the lower surface of the laminate. Furthermore, the general contact approach was extended to the interfaces between adjacent composite plies within the laminate to account for interlaminar contact behavior. For the contact mechanics, the normal contact behavior was defined as “hard” contact, whereas the tangential contact behavior was characterized using a penalty function with a specified friction coefficient of 0.3. To account for the potential occurrence of full interlaminar delamination, the cohesive elements (COH3D8) were set to be automatically removed from the FE model once their damage variables reached 1, corresponding to a state of complete damage.
The damage constitutive model of composites
Intralaminar damage modeling
Fiber damage
In the present study, the maximum strain criterion was adopted to characterize the initiation of fiber damage. 28
Fiber tensile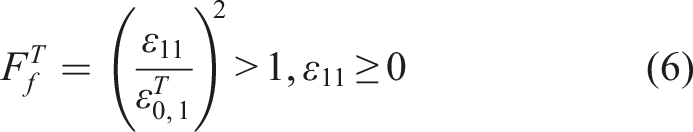
Fiber compression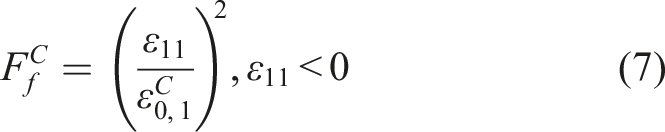
Following the initiation of fiber damage, a linear degradation-based damage evolution model incorporating fracture energy was employed to quantify the tensile and compressive damage factors of the fibers, which are expressed as follows: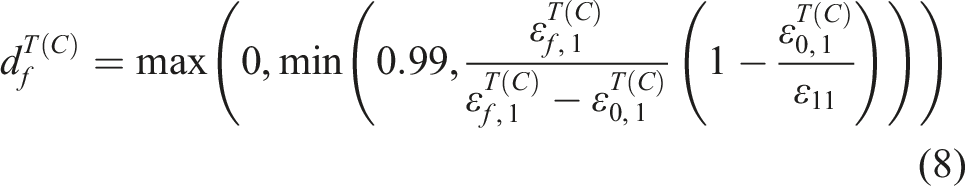
Matrix damage
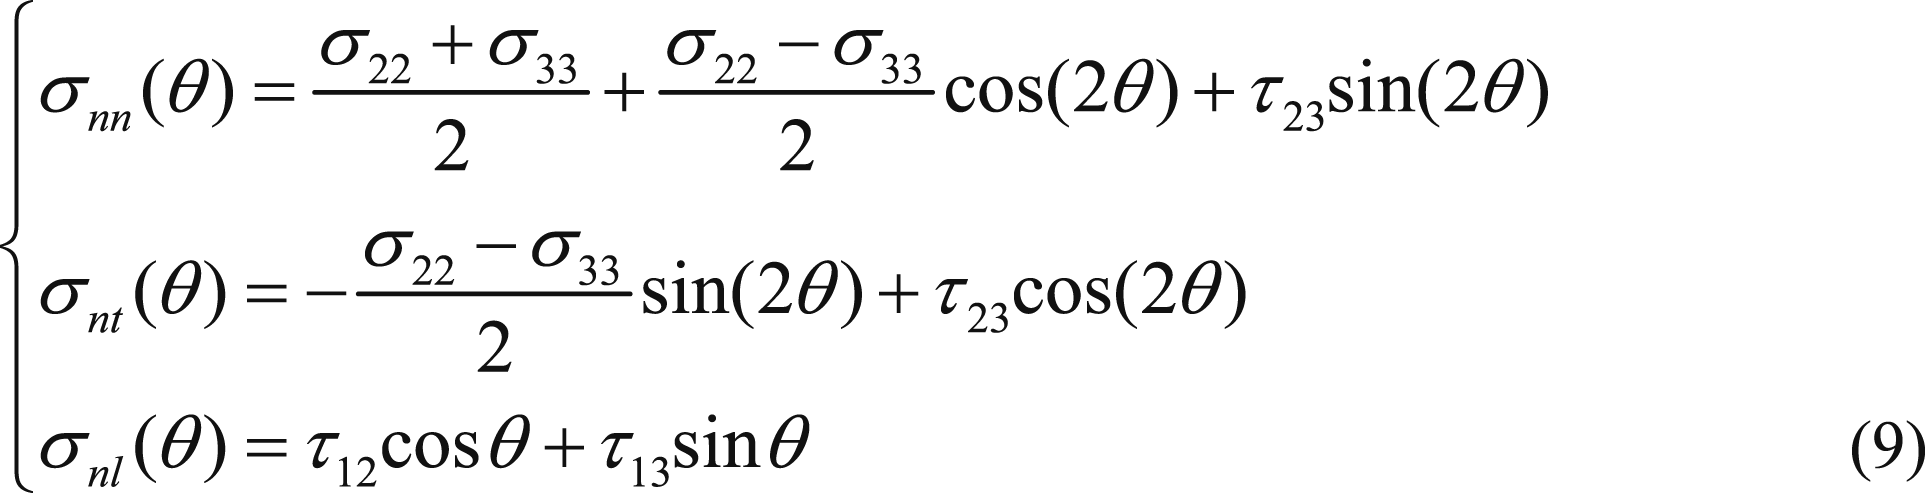
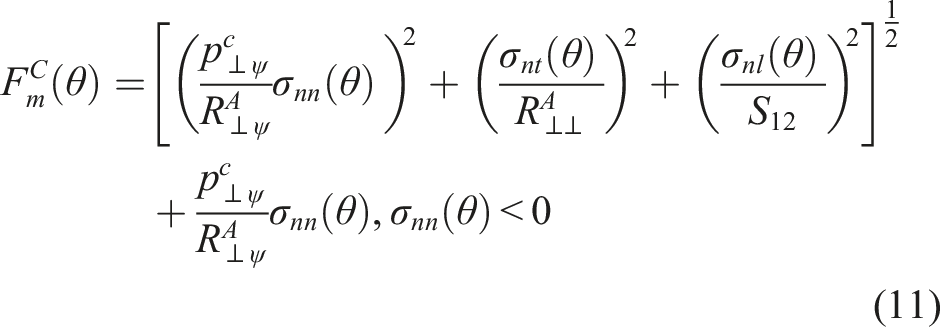
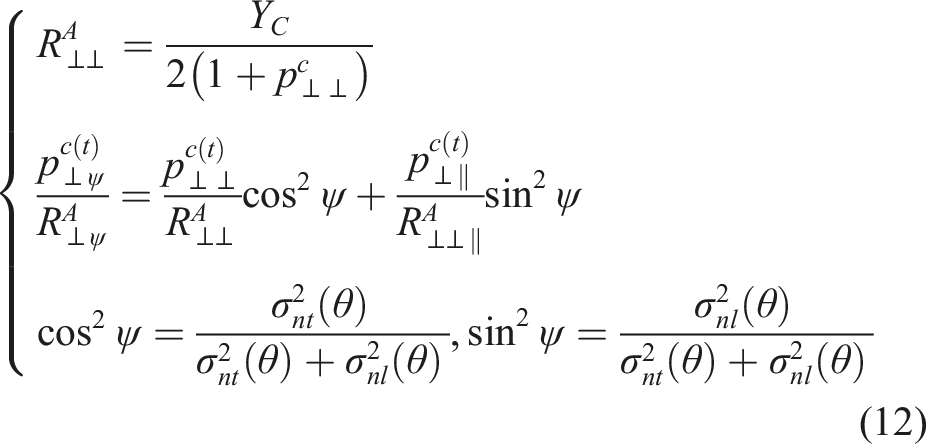
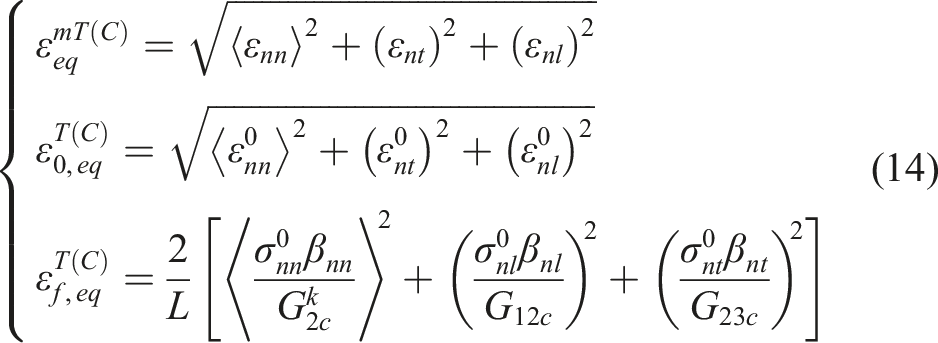
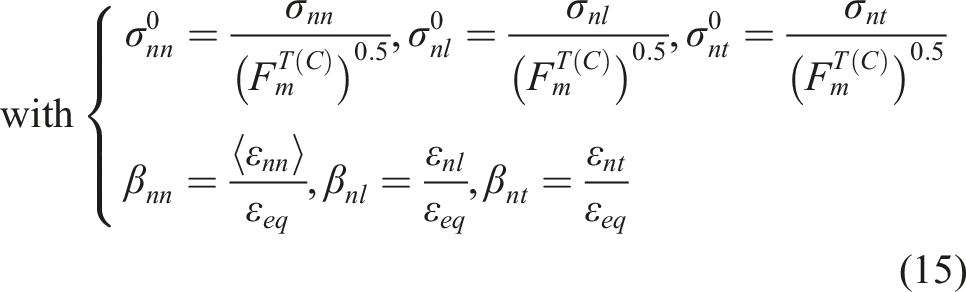
The three-dimensional inter-fiber fracture (IFF) criterion proposed by Puck et al.3 39 was adopted to characterize the initiation of matrix damage in the composite laminate. A key feature of this failure model is the determination of a critical angle θ corresponding to the potential fracture surface. Matrix fracture is triggered by the stress components acting on the aforementioned fracture surface, where the normal stress and shear stress are computed in accordance with equation (9).
Matrix tensile failure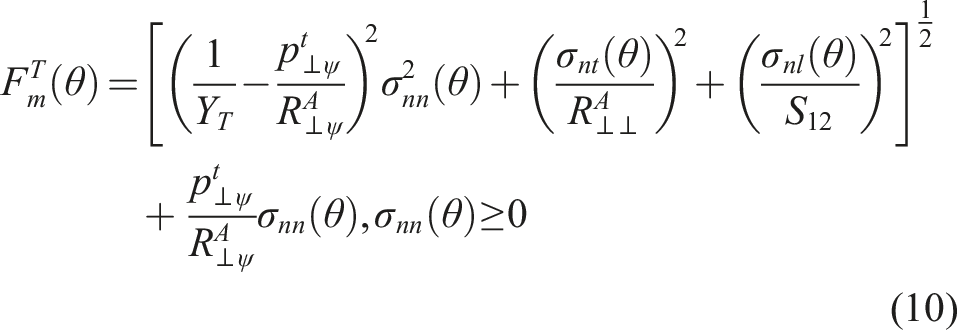
Recommended values for the inclination parameter.
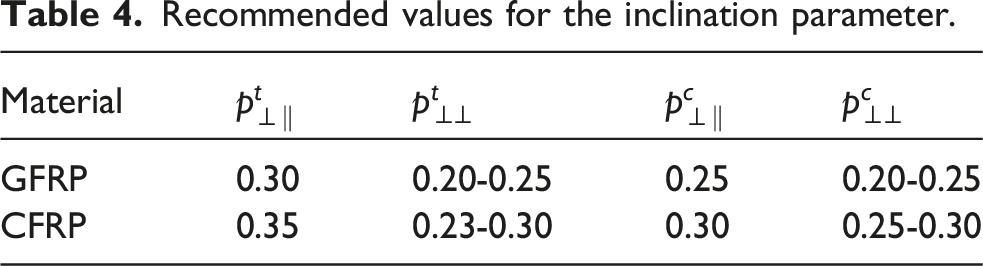
The intralaminar damage variable corresponding to matrix damage is also computed using equation (13), which is based on the linear degradation model.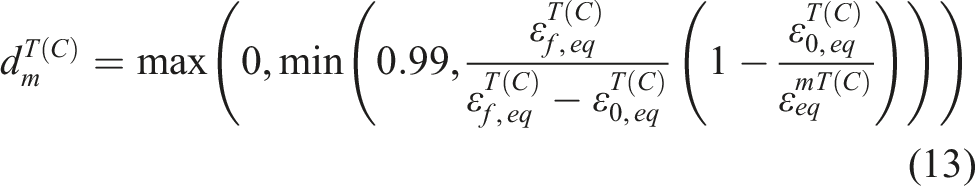
Once each failure mode meets the damage initiation criteria, the performance degradation of the single-layer plate is realized by incorporating damage variables corresponding to distinct failure modes into the element stiffness. The damaged stress-strain relationship of the laminates can be derived using the degraded compliance matrix 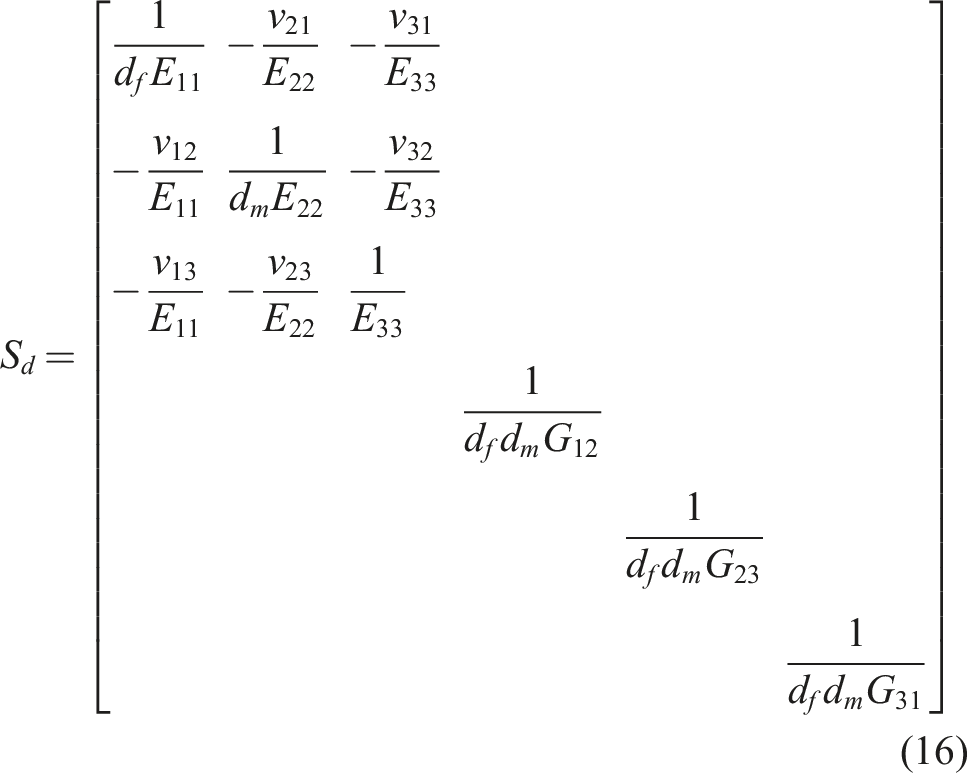
Interlaminar damage modeling
In the present study, cohesive elements implemented in ABAQUS, which are based on a bilinear traction-separation law, were adopted to simulate interfacial delamination. The quadratic failure criterion was utilized to predict the onset of delamination damage, as expressed in equation (17)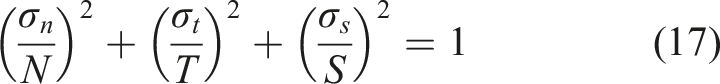
The Benzeggagh and Kenane (B-K) criterion
40
was utilized to simulate the propagation of delamination damage, as expressed in equation (18)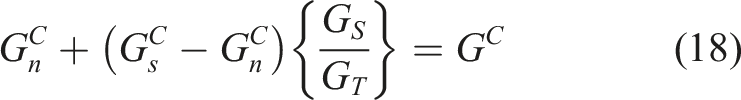
Simulation results and discussion
40J impact
The dynamic response of the impact process was simulated using the established FE model, as illustrated in Figure 10. Simulated energy–time curves match experiments better than force–time curves; the model slightly underpredicts peak impact force and delays peak occurrence time. In contrast, the time at which the load drops sharply in the finite element simulation is earlier than that observed in the experiment. The discrepancies between these experimental results and the simulation-predicted values may be attributed to the following factors: (1) The finite element model adopts an ideal rigid clamping method with full fixed support. However, in actual tests, there is slight slippage between the specimen and the fixture, which leads to a reduction in the actual stiffness of the structure. (2) All layup parameters and cohesive parameters are calibrated and obtained through quasi-static standard tests. Under low-velocity dynamic impact conditions, the matrix and interlaminar interfaces exhibit strain rate-dependent softening behavior. This phenomenon results in a decrease in the actual load-bearing capacity of the test specimen and an earlier initiation of damage. (3) The numerical simulation does not include energy-dissipating items such as the viscoplastic deformation of the epoxy resin matrix, friction between microcrack surfaces, and structural vibration damping. Consequently, the energy absorption of the simulated specimen is insufficient, and the moment of sudden load drop occurs earlier than that observed in the experimental results. (4) In the simulation, the steel indenter is set as a rigid body, while the slight elastic deformation and surface wear of the indenter that occur in the actual test are neglected. Comparisons between simulation results and experimental data under 40 J impact.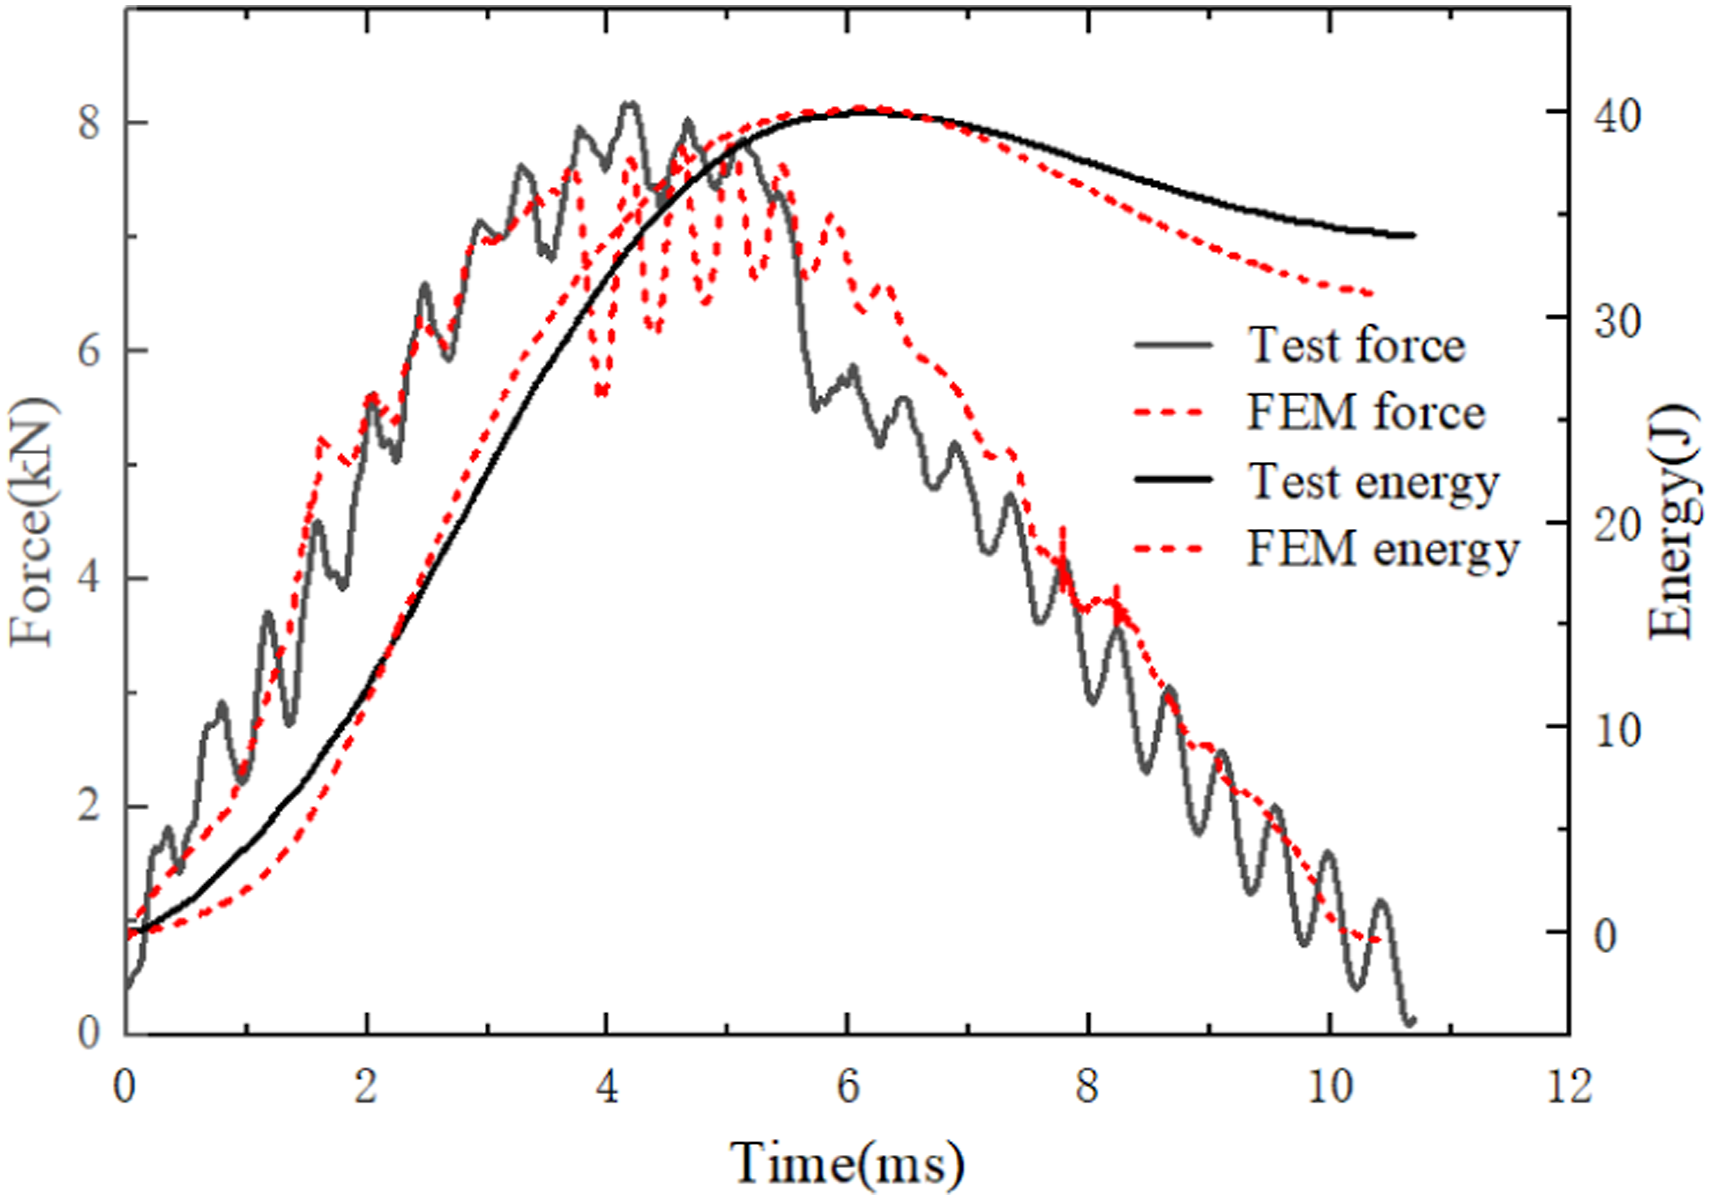
For the energy-time curve, the total kinetic energy is fully transferred to the laminated plate upon impact. A fraction of this impact-induced energy is converted into elastic strain energy, which is subsequently retransmitted to the impactor. In contrast, the remaining portion is absorbed by the specimen, specifically through energy dissipation mechanisms including material damage initiation and propagation, permanent plastic deformation, and interfacial friction that occur throughout the entire impact process. The energy absorption obtained from the finite element simulation is lower than that from the experimental results. This discrepancy may be attributed to the fact that the degree of impact damage to the laminated plate in the finite element simulation is less than that observed in the experiments.
Through the calculation of each time step in the ABAQUS VUMAT user subroutine, the three-dimensional coordinates of the centroid and the damage state variables for each element of the damaged material can be obtained. Furthermore, this enables the generation of three-dimensional damage envelopes for the centroid of each element, which are utilized to analyze the distribution characteristics and evolution mechanisms of various damage modes within the laminate. Figures 11 and 12 present the three-dimensional (3D) damage distributions of the damage variables corresponding to fiber tension, fiber compression, matrix tension, and matrix compression within the glass fiber layers and carbon fiber layers of the laminate, all captured at the maximum impact displacement under an impact energy of 40J. Herein, the X, Y, and Z directions correspond to the 0° layup direction, 90° layup direction, and thickness direction of the laminate, respectively. Different colors indicate the different positions of damage along the thickness direction of the laminate. 3D envelope of intralaminar damage in glass fiber layers under 40J impact: (a) fiber tensile; (b) fiber compression; (c) matrix tensile; (d) matrix compression. 3D envelope of intralaminar damage in carbon fiber layers under 40J impact: (a) fiber tensile; (b) matrix tensile; (c) matrix compression.
Figure 11 presents the distribution profiles of the four damage modes within the glass fiber layers of the laminate at the maximum impact displacement. Herein, only the distribution of damaged elements with various damage variables ≥0.5 is counted. In (a) and (c) of Figure 11, from the upper layer (impact side) to the bottom layer of the laminate, the area of fiber tensile damage and matrix tensile damage regions in each layer gradually increases. Conversely, the area of fiber compressive damage and matrix compressive damage regions decreases gradually from top to bottom (Figure 11(b) and 11(d)). In Figure 11(a), the tensile damage contour plots of several glass fiber layers are presented, the regions depicted in the given contour maps correspond to the areas of the refined mesh, with a dimension of 50 mm × 40 mm. Each layer exhibits a relatively large tensile damage area; however, the number of fiber fracture elements is small (element deletion occurs when the value of SDV7 reaches 0.99). In contrast, in Figure 12(a), each carbon fiber layer has a smaller damage area compared to the glass fiber layers, while the number of fiber fracture elements is greater than that of the glass fiber layers. Furthermore, fiber fractures occur in every carbon fiber layer (no fiber fractures occur in the upper glass fiber layers). This phenomenon is attributed to the fact that glass fibers have a lower modulus and better toughness than carbon fibers. The compressive damage of glass fibers occurs only within the upper 4 layers of the laminate (see Figure 11(b)), and the damaged area is relatively small. No fiber compressive damage is observed in the carbon fiber layers, which may be attributed to the relatively high compressive strength of carbon fibers. The area of the matrix tensile damage zone within the glass fiber layer (see Figure 11(c)) is smaller than that within the carbon fiber layer (see Figure 12(b)). This is because the carbon fibers can withstand greater stress before fracture compared to the glass fibers, which in turn causes the matrix inside the carbon fiber layer to also bear higher stress. The matrix compression damage within the glass fiber layer (see Figure 11(d)) and that within the carbon fiber layer (see Figure 12(c)) are roughly identical in both damage location and damage area morphology. This consistent damage behavior arises from the identical mechanical properties of the matrixes in the two types of layers.
Figure 13 illustrates the evolution process of damage volumes corresponding to fiber tension, fiber compression, matrix tension, and matrix compression that occur in the glass fiber layers and carbon fiber layers. For all damage modes, the damage growth rate is relatively high before the first occurrence of load drop (at 4 ms). After that, until the maximum impact displacement is reached, the damage growth rate is slower than that in the previous stage. During the impact process, the tensile damage volume of fibers in the glass fiber layer is greater than that of the matrix; in contrast, the tensile damage volume of fibers in the carbon fiber layer is far smaller than that of the matrix. These phenomena can be observed at the moment when the maximum impact displacement occurs, as illustrated in Figures 11 and 12. The volume of matrix tensile damage and matrix compressive damage occurring in the carbon fiber layer is almost three times that of the glass fiber layer, while the volume of fiber tensile damage in the carbon fiber layer is smaller than that in the glass fiber layer. Evolution of intralaminar damage modes under 40J impact: (a) glass fibers; (b) carbon fibers.
Figure 14(a) presents the three-dimensional (3D) envelope diagram illustrating the delamination damage of all 21 interlaminar cohesive elements at the maximum impact displacement. In this figure, the delamination damage state corresponds to complete interlaminar damage, with the damage variable QUADSCRT set to 1. Figure 14(b) provides the ultrasonic C-scan image showing the damage morphology of the laminate after impact. The figure also presents the contour plots of delamination damage between all pairs of carbon fiber layers, the regions depicted in the given contour maps correspond to the areas of the refined mesh, with a dimension of 50 mm × 40 mm. As can be observed from the figure, the delamination damage area between the two carbon fiber layers is larger than that between the adjacent carbon fiber layer and glass fiber layer, as well as that between the two glass fiber layers. From the previous analysis, it is known that the matrix damage (including tension and compression) within the carbon fiber layers is more severe than that within the glass fiber layers. Severe matrix cracking can induce fiber-matrix debonding, and the continuous accumulation of these two types of damage will lead to the initiation of interlaminar delamination. The elastic modulus of carbon fibers is much higher than that of glass fibers, leading to a larger modulus mismatch with the resin matrix. In addition, the carbon fiber plies are laid in the 90°/0° directions, which results in poor deformation compatibility and more significant interlaminar shear and tensile stress concentrations. Consequently, delamination preferentially occurs between carbon fiber plies rather than glass fiber plies.41,42 The delamination propagation area between the two carbon fiber layers is relatively large. The delamination damage areas of the 7th and 13th interface layers (Inter7 and Inter13) are the largest, which may be related to the high shear stress at the middle layers of the laminate. The morphology of the damaged area obtained by ultrasonic C-scan is similar to that of the damaged areas caused by fiber tension, matrix tension (see Figures 11 and 12), and delamination damage in some interface layers. (a) 3D envelope of interlaminar damage under 40J impact; (b) C-scan.
As widely recognized in the literature,43,44,45,46 the ply stacking sequence and hybrid structure are critical factors that determine the damage distribution, energy absorption, and overall structural response of hybrid composite laminates. Compared with existing studies, this paper applies the established 3D progressive damage simulation, which clearly demonstrates that the carbon-glass modulus mismatch induces significant interlaminar shear stress under impact loading. This stress leads to preferential delamination between carbon layers, as well as more severe fiber breakage in the 90° plies and more severe matrix cracking in the 0° plies. These findings expand the current understanding of the structure-property relationship in hybrid composite materials and provide practical guidance for optimizing ply design to enhance impact resistance.
60J impact
The dynamic response under a 60J impact was simulated using the established finite element model, as shown in Figure 15. The predicted occurrence time of the load drop is earlier than the experimental result, and two load drops appear in the numerical results. From the moment when the sudden load drop occurs until the time of the maximum impact displacement (6.23 ms), both the experimental results and numerical results exhibit load fluctuations on their respective force-time curves. Additionally, the impact force obtained from the experimental results is smaller than that derived from the numerical results. The energy absorption obtained from the FE simulation is lower than that from the experimental results, and the degree of impact damage in the simulation is less severe than that observed in the experiments. As can also be seen from the force-time curve, the impact force in the experiment decreases continuously before reaching the maximum impact displacement. Based on the load variations observed in the force-time curve obtained from numerical simulations, four key time points (i.e., 2.45 ms, 2.94 ms, 4.06 ms, and 6.23 ms) were selected. The causes underlying the load variations were analyzed by investigating the evolution of the damage mechanism at these four time points. Comparisons between simulation results and experimental data under 60J impact.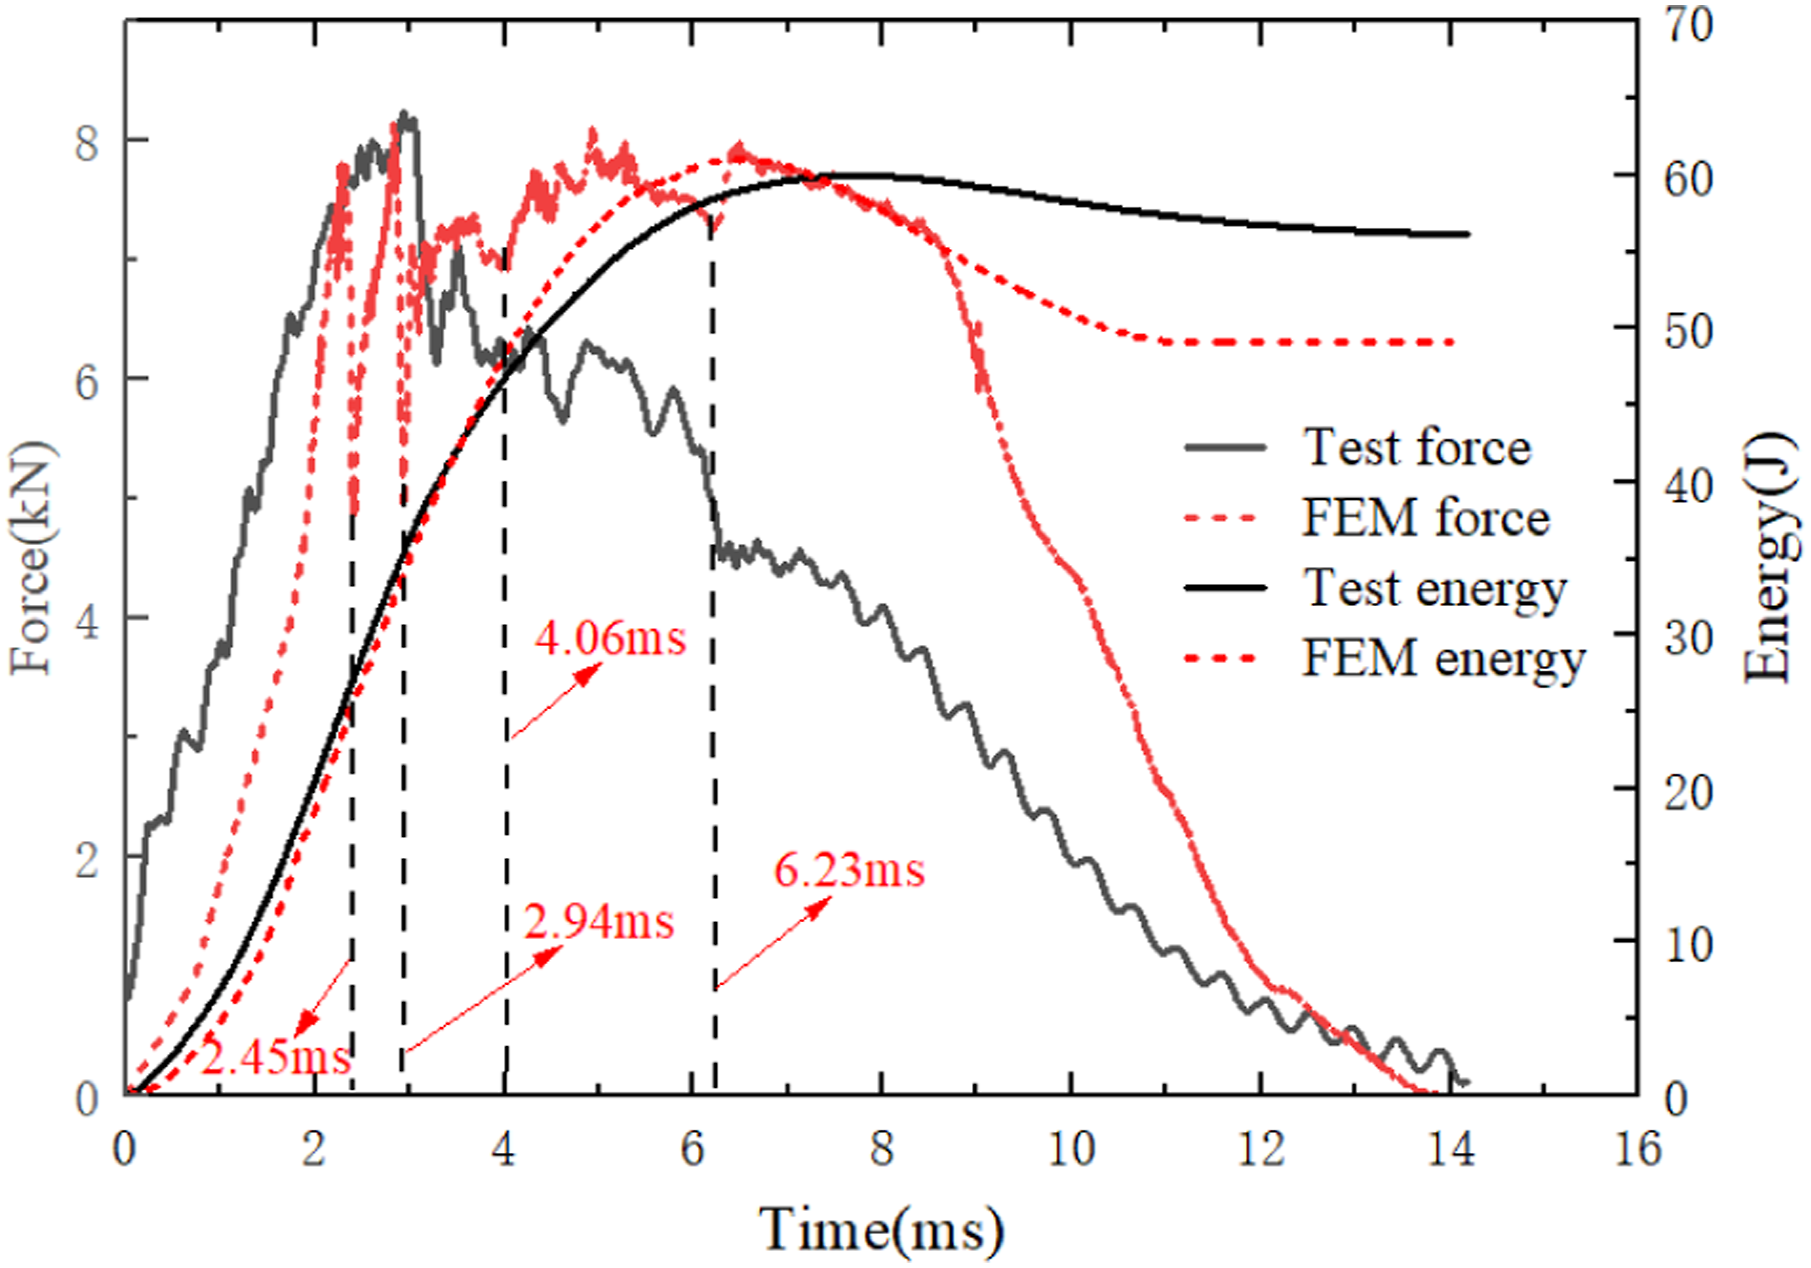
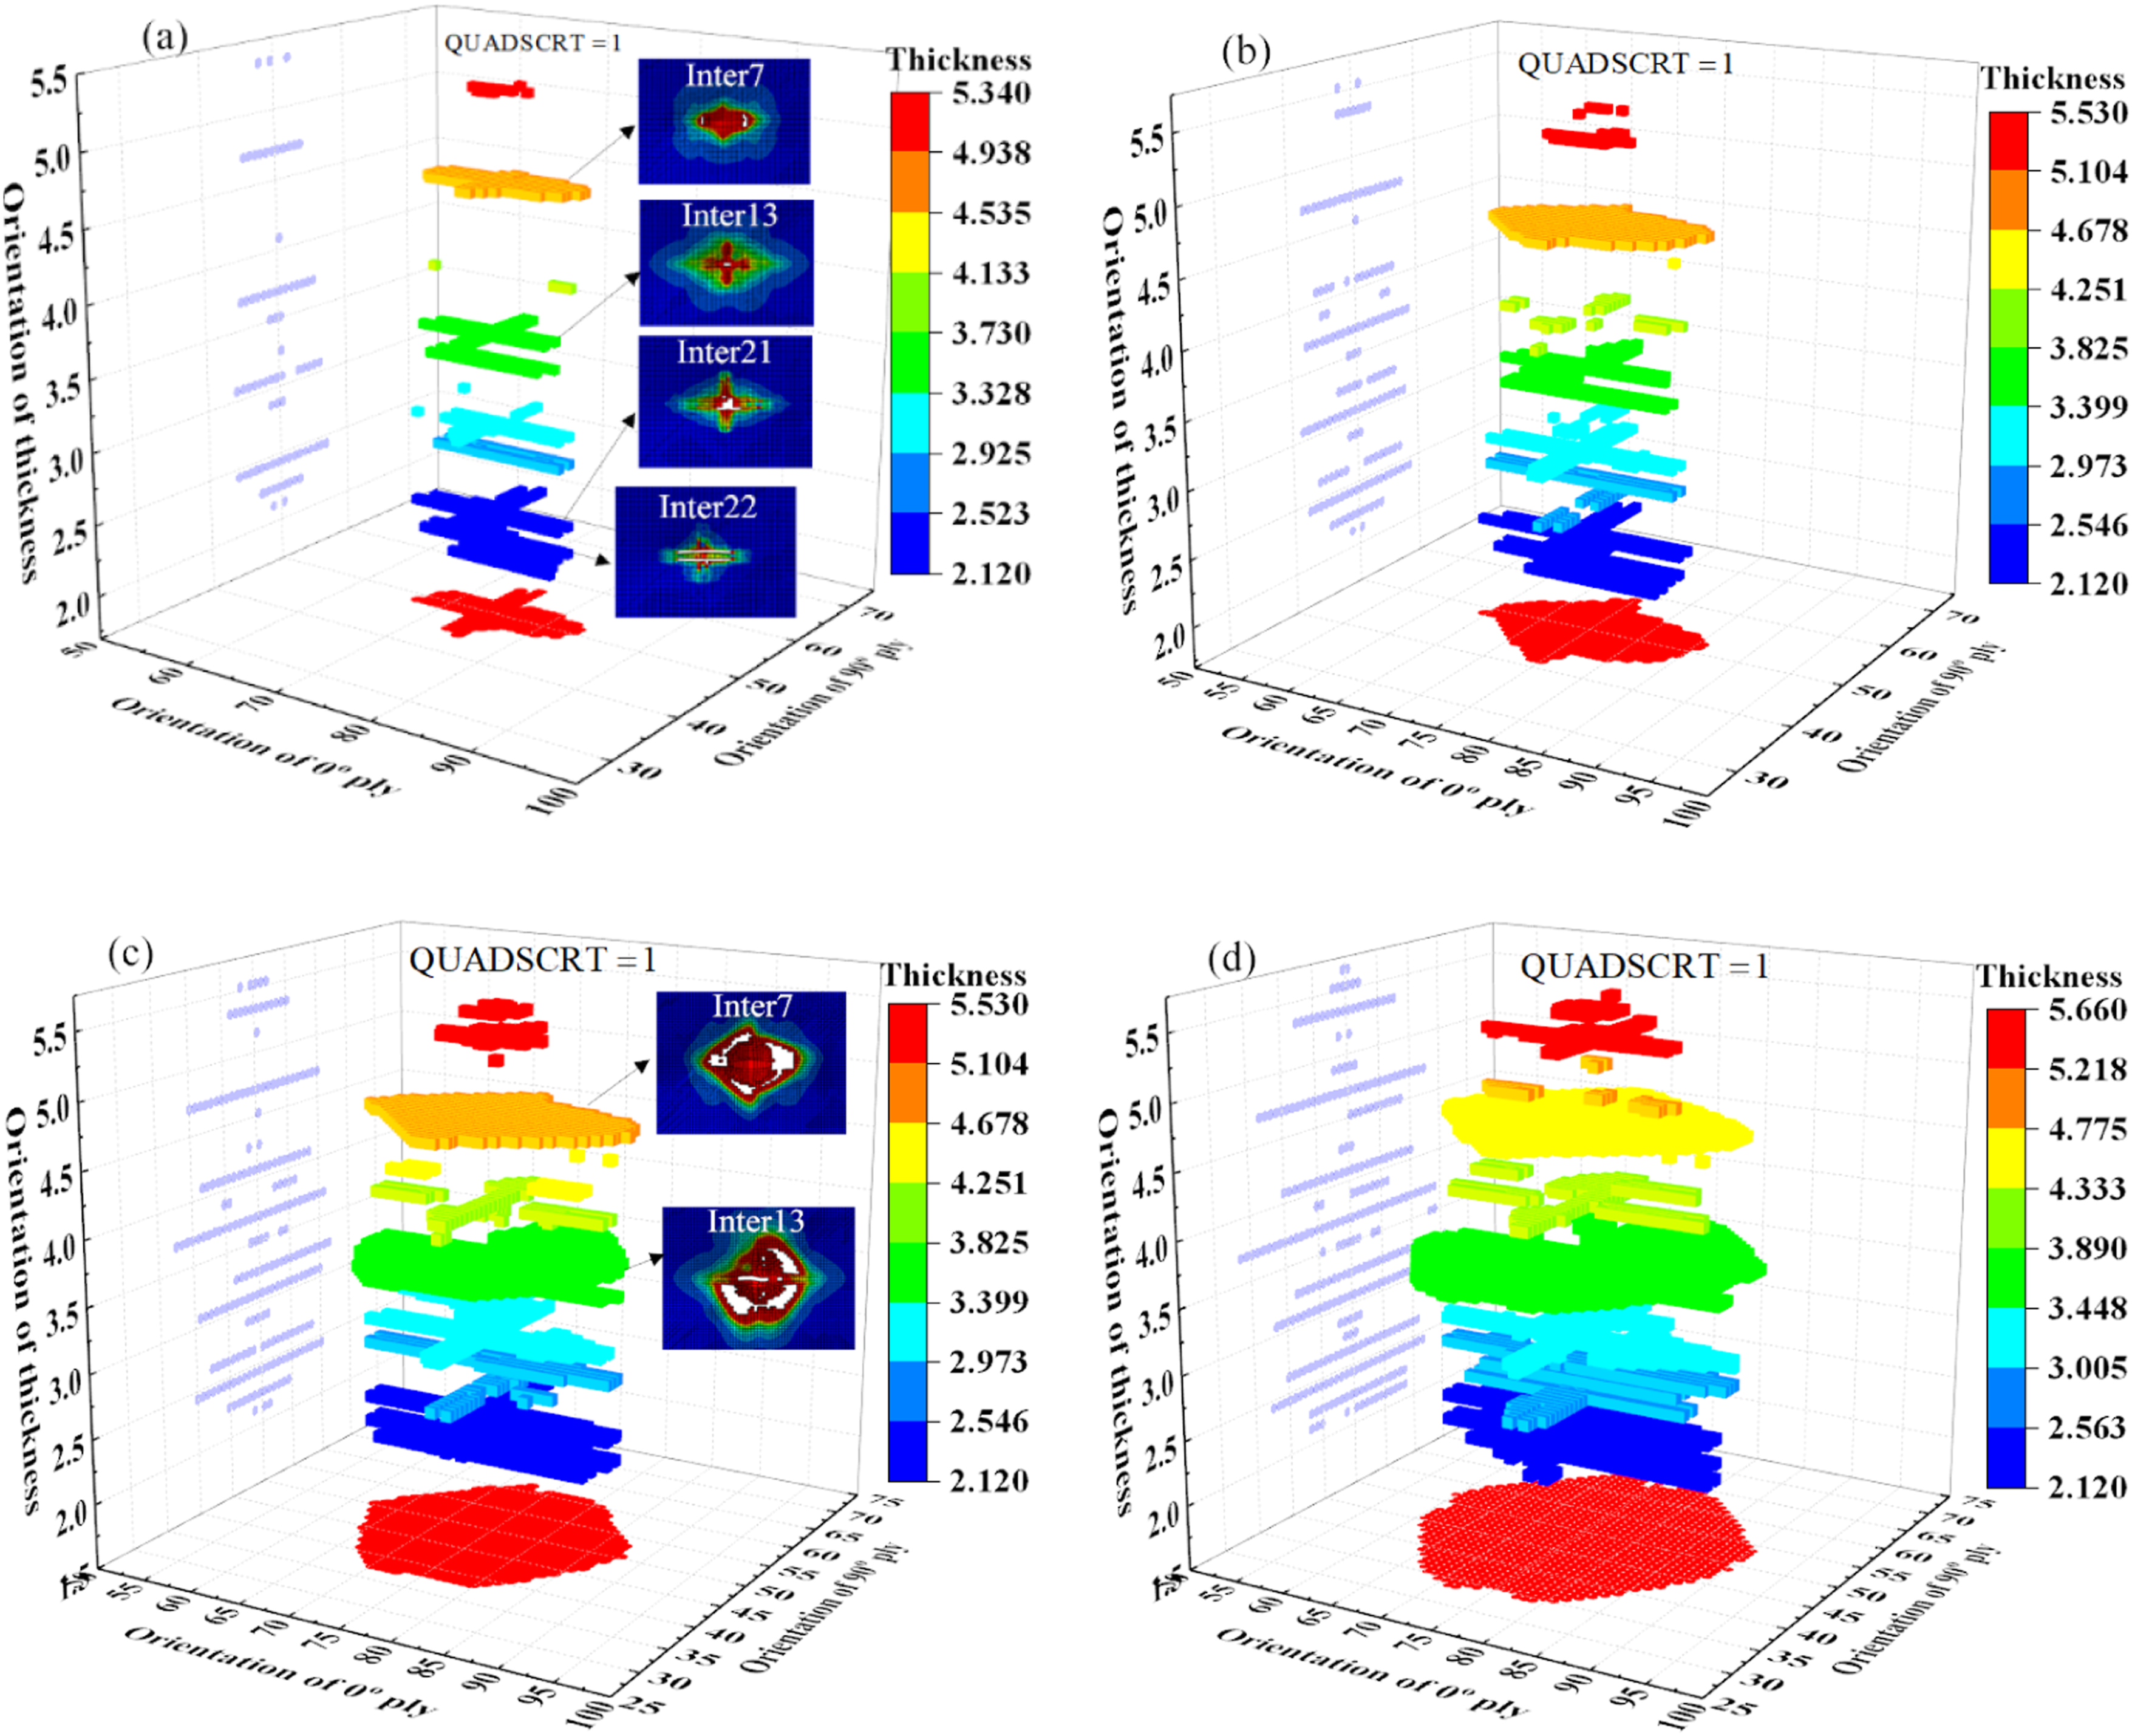
From the preceding damage analysis under an impact load of 40J, it can be concluded that fiber tension damage, matrix tension damage, and delamination damage are the primary damage modes generated in the laminate during the impact process. Accordingly, Figures 16–18 present the three-dimensional (3D) failure envelope diagrams of fiber tension failure, matrix tension failure, and delamination failure, respectively, at the four selected time instants. The three figures illustrate the distribution of the number of failed elements in each layer of the laminated plate. Specifically, fiber tensile fracture occurs when the damage variable SDV7 = 0.99; matrix tensile fracture occurs when the damage variable SDV9 = 0.99; and delamination failure occurs when the QUADSCRT value of an element in the adhesive layer equals 1. The load experienced its first sharp drop at 2.45 ms (see Figure 15). Under low-velocity impact, the laminate is dominated by bending deformation, with the impact side under compression and the back side under tension. Given that the dimension of the impact specimen is 150 mm × 100 mm, within the plies below the neutral axis of the laminate, the tensile stress along the 100 mm width direction is greater than that along the 150 mm length direction. Consequently, the 90° plies (where fibers are aligned along the 100 mm width direction) bear higher tensile stress in the fiber alignment direction, resulting in a significantly larger number of elements (and longer crack length) with fiber fracture in the 90° plies compared to the 0° plies (see Figure 16(a)). Similarly, the 0° ply experiences greater tensile stress in the direction perpendicular to the fibers (the fiber-perpendicular direction aligns with the 100 mm width). This results in a significantly larger number of elements undergoing matrix tensile fracture in the 0° ply compared to the 90° ply (see Figure 17(a)). Furthermore, the majority of matrix tensile fractures occur in the 0° ply of the carbon fiber. Delamination failure (QUADSCRT = 1) in Figure 18(a) occurred primarily between the two carbon fiber plies, with very few fully failed elements undergoing element deletion. In the early stage of impact (before 2.45 ms), microdeformation first occurs in the resin interphase within the interlaminar stress concentration regions. When the stress reaches the cohesive strength of the resin, nanoscale/micronoscale interfacial microcracks (microdebonding) are initiated. At this stage, no obvious separation takes place between the plies, the area of delamination damage is small, and its influence on the overall load is negligible. From the above analysis, it can be concluded that the first sharp load drop at 2.45 ms is mainly caused by extensive and severe fiber tensile fractures (particularly in the 90° glass fiber plies) and matrix tensile fractures (particularly in the 0° carbon fiber plies), while the effect of early delamination on the load is negligible. 3D envelope of fiber tensile failure under 60J impact: (a) 2.45 ms; (b) 2.94 ms; (c) 4.06 ms; (d) 6.23 ms. 3D envelope of matrix tensile failure under 60J impact: (a) 2.45 ms; (b) 2.94 ms; (c) 4.06 ms; (d) 6.23 ms. 3D envelope of delamination failure under 60J impact: (a) 2.45 ms; (b) 2.94 ms; (c) 4.06 ms; (d) 6.23 ms.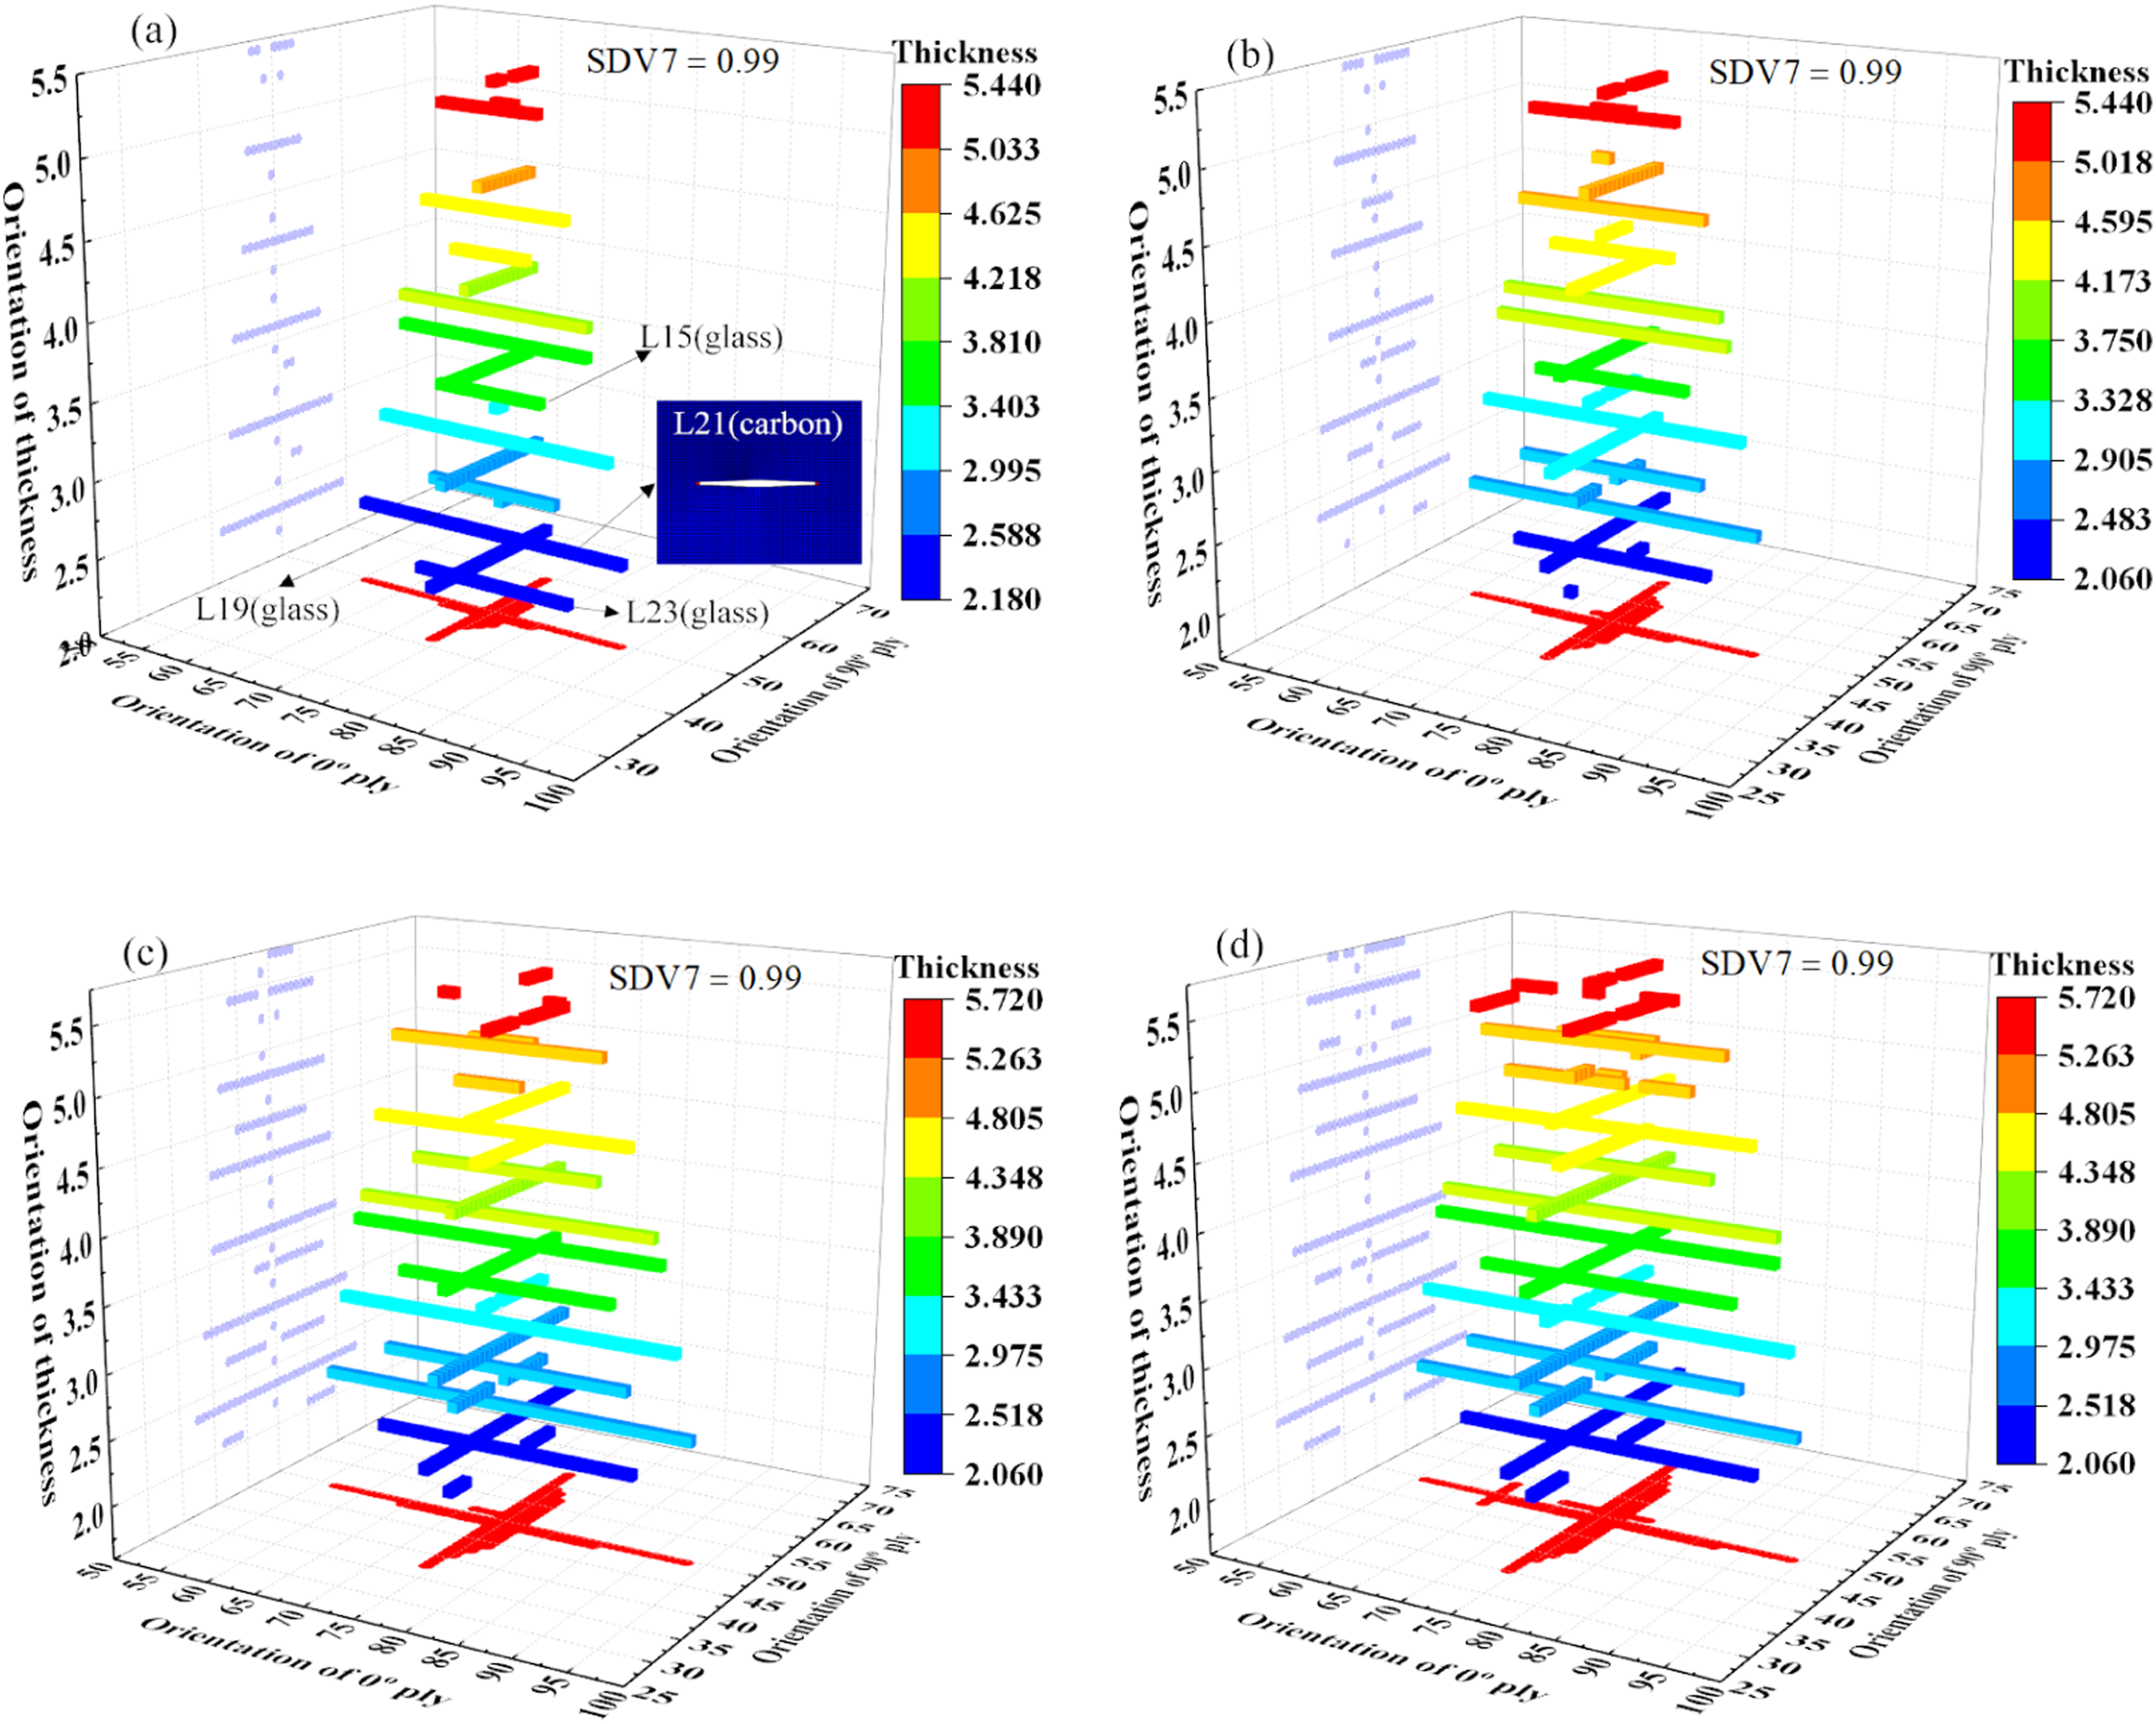
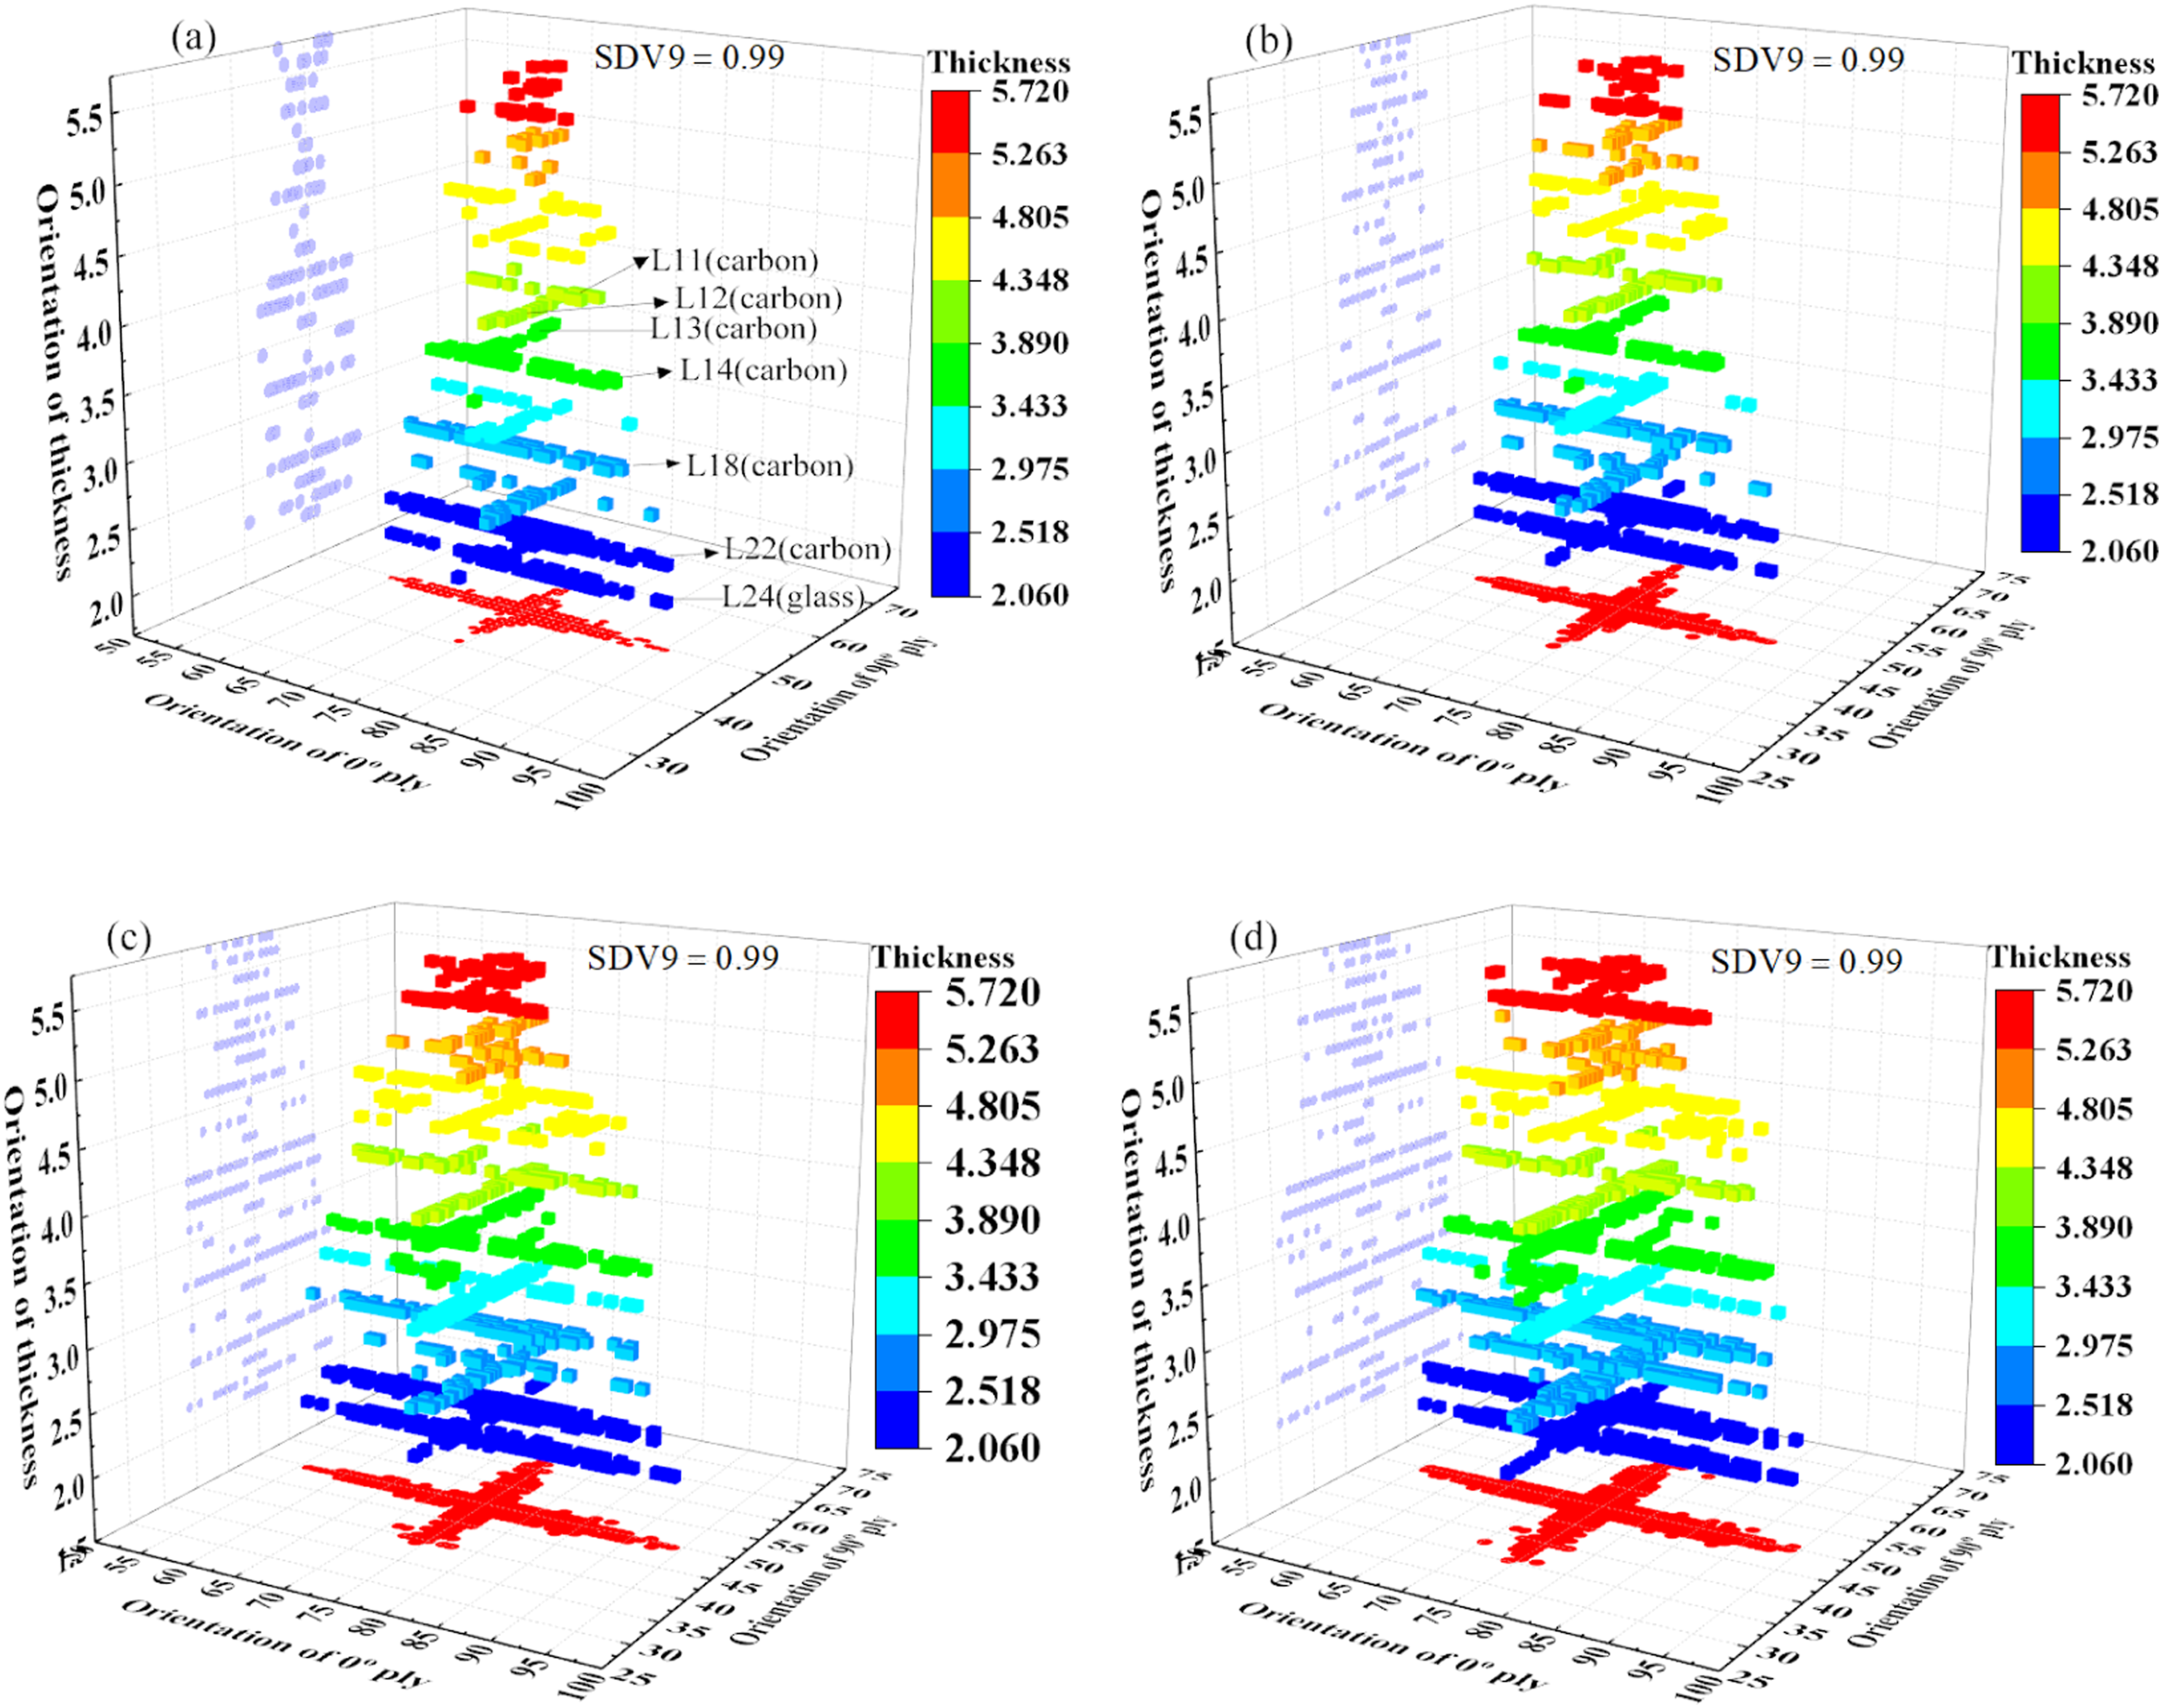
At which point fiber tensile damage occurred in all plies (SDV7 ≥ 0.5) as shown in Figure 16(a). Specifically, fiber fracture was observed in the 21st ply (L21, carbon fiber ply) with a value of SDV9 = 0.99, and the fibers of this ply were laid in the 90° direction. Meanwhile, fiber fracture took place in every carbon fiber ply, while such damage was only present in the glass fiber plies in the lower half. In addition, fiber fracture was more severe in the plies laid in the 90° direction than in those oriented at 0°. The area of matrix tensile damage (SDV9 ≥ 0.5) increased gradually from the impact side to the bottom surface (see Figure 17(a)). The contour plot of matrix damage for Ply L21 is presented in the figure; only some carbon fiber plies had an SDV9 value reaching 0.99, while the SDV9 values of all glass fiber plies were below 0.99, indicating that the number of matrix tensile failure elements was relatively small at this moment. Delamination failure (QUADSCRT = 1) in Figure 18(a) occurred primarily between the two carbon fiber plies, with very few fully failed elements undergoing element deletion. In the early stage of impact (before 2.45 ms), microdeformation first occurs in the resin interphase within the interlaminar stress concentration regions. When the stress reaches the cohesive strength of the resin, nanoscale/micronoscale interfacial microcracks (microdebonding) are initiated. At this stage, no obvious separation takes place between the plies, the area of delamination damage is small, and its influence on the overall load is negligible. From the above analysis, the first sharp load drop at 2.45 ms is dominated by widespread and severe fiber tensile fracture (especially in 90° carbon fiber plies), while matrix damage is limited and early-stage delamination has negligible load impact.
At 2.94 ms, the number of elements with fiber tensile failure (see Figure 16(b)) and matrix tensile failure (see Figure 17(b)) increased slightly compared with those at 2.45 ms, while the area of delamination failure (see Figure 18(b)) rose significantly over that at 2.45 ms. Thus, the load drop occurring at 2.94 ms was primarily induced by delamination failure. A slight load drop occurred at 4.06 ms. Compared with the state at 2.94 ms, the propagation of fiber tensile failure and matrix tensile failure increased steadily as shown in Figures 16(c), 17(c) and 18(c), while delamination failure (element deletion) became more severe. Delamination failure was the dominant failure factor during this stage. At 6.23 ms, the load dropped after a fluctuating rise in the preceding period. The development of the three damage modes was similar to that observed at 4.06 ms, with delamination failure remaining the dominant factor for structural damage. Figure 19(a) shows the matrix damage and surface delamination contours of the bottom ply (L24, a glass fiber ply laid in the 0° direction), whose area is evidently smaller than that of the delamination damage contours obtained via ultrasonic C-scanning (Figure 19(b)). (a) Back (non-impact side); (b) C-scan.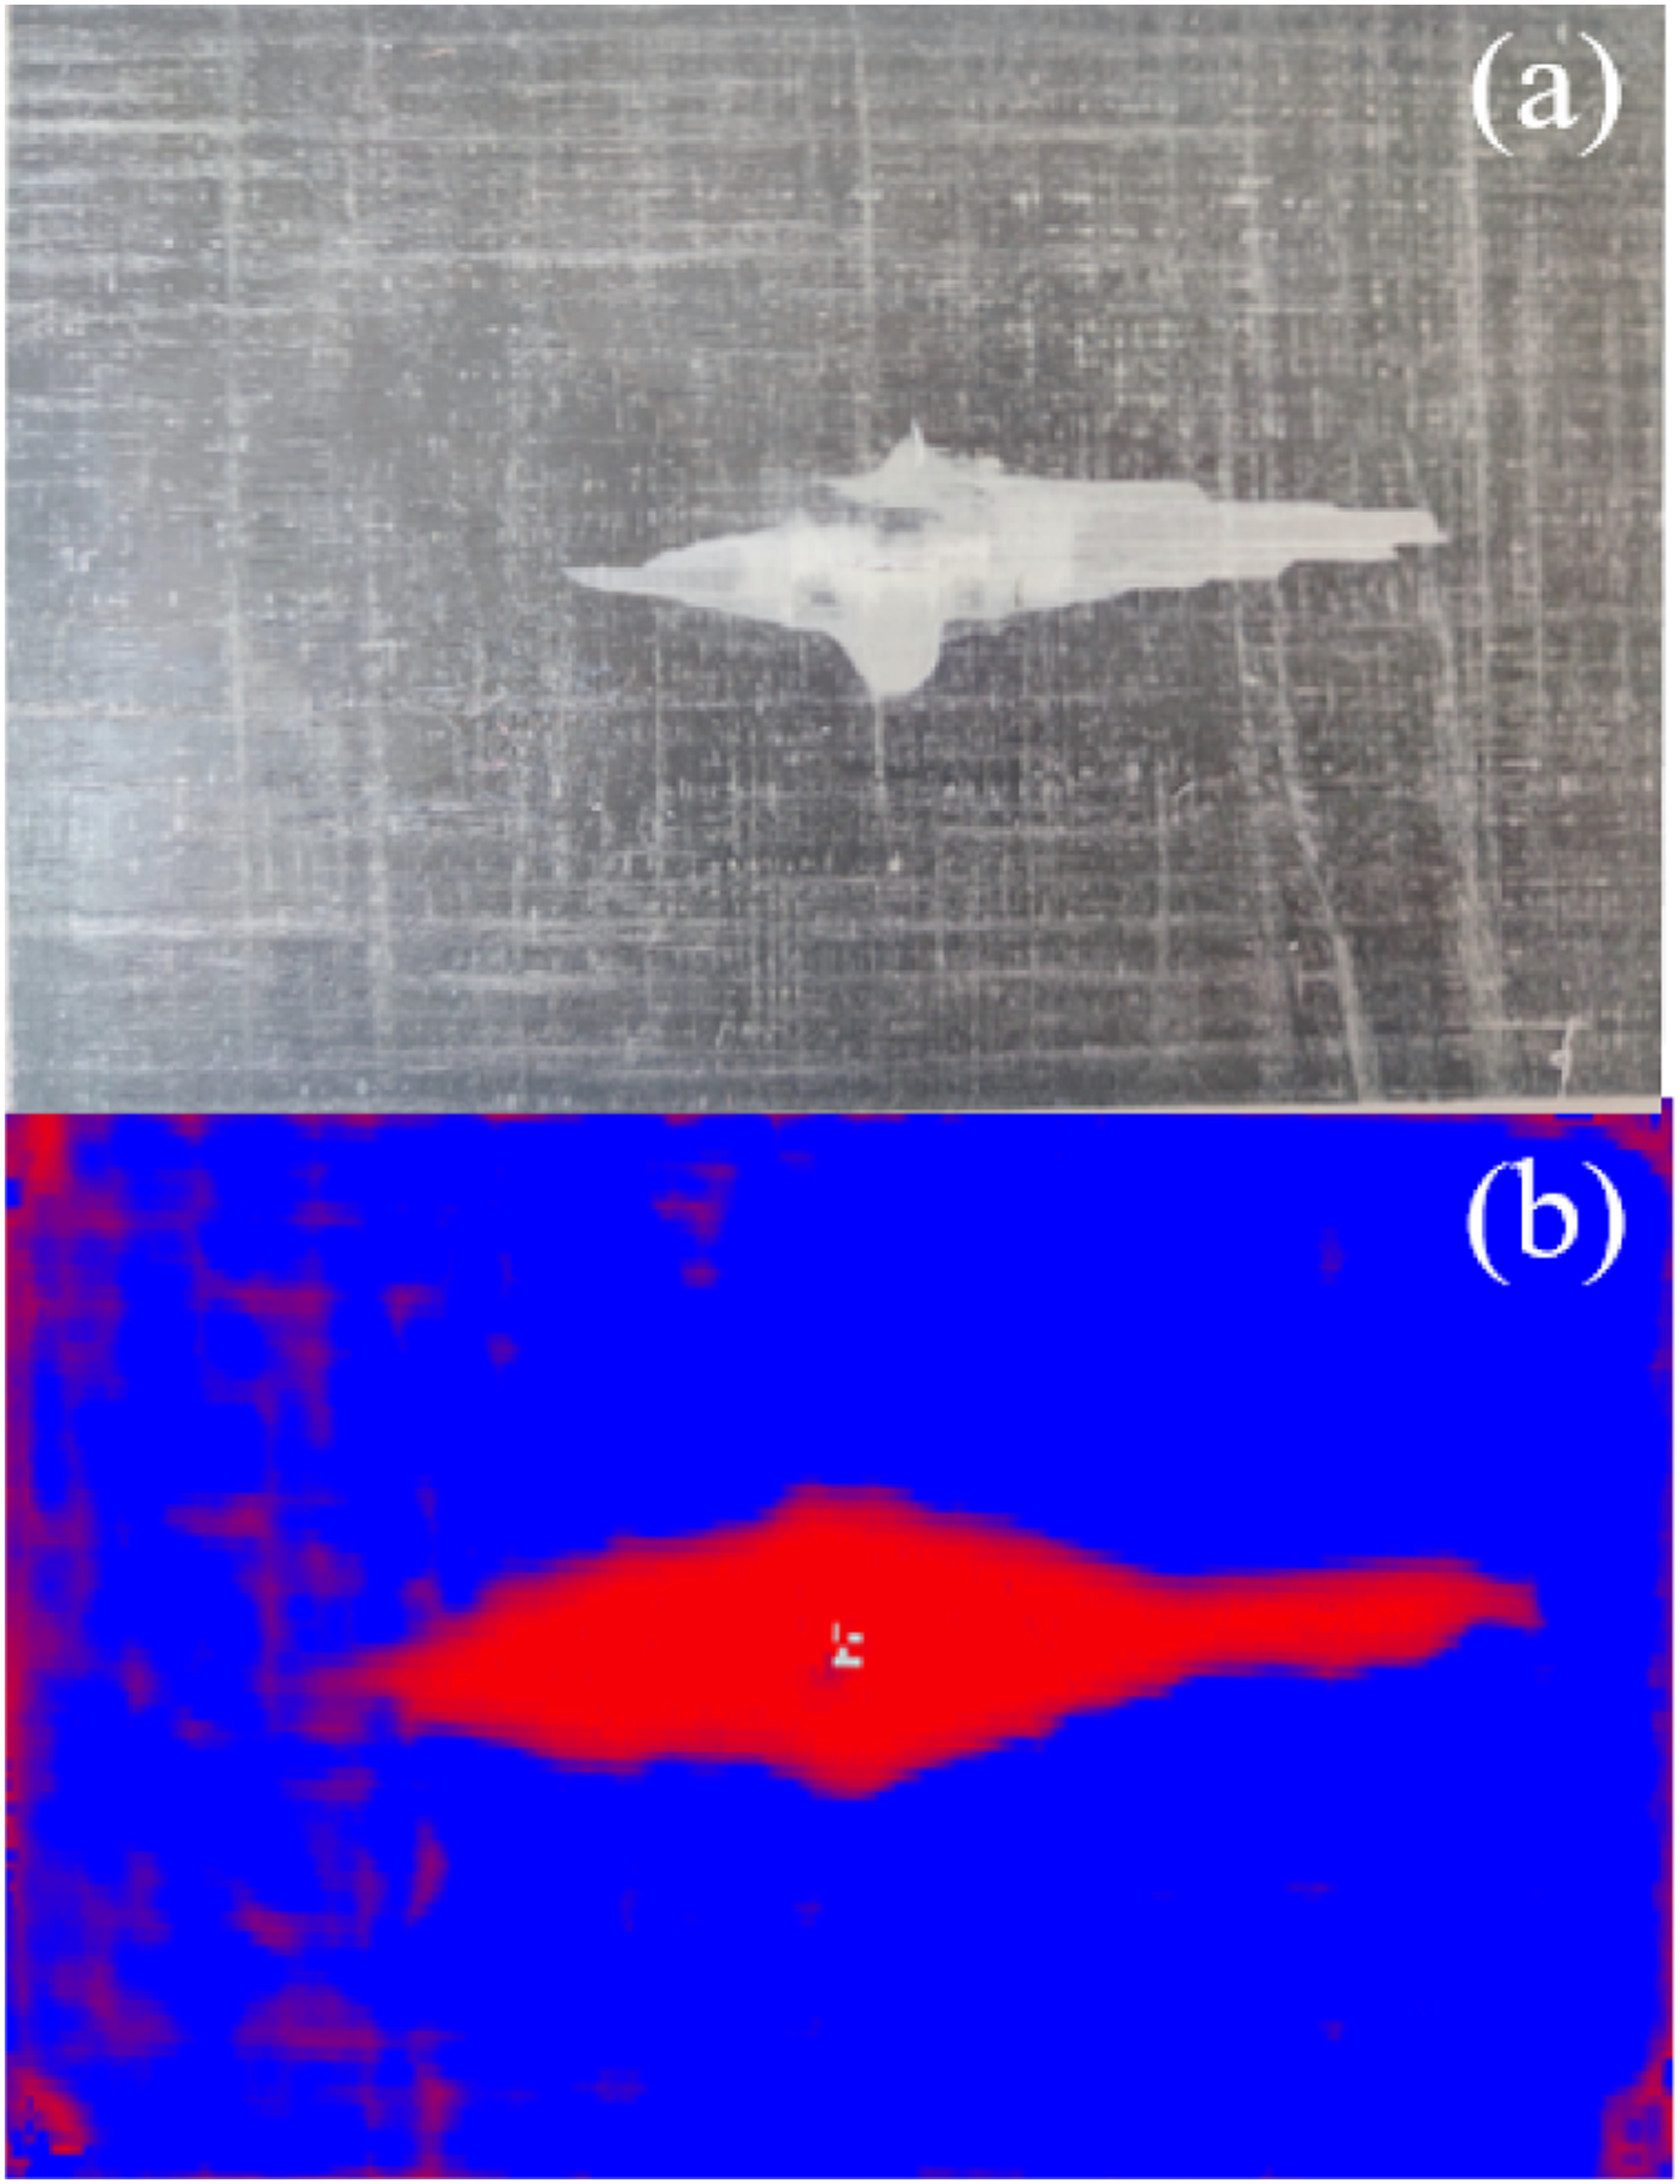
In summary, at the early stage of impact (2.45 ms), in-plane stress initially triggered fiber tension/fracture, which led to the loss of in-plane load-bearing capacity and thus the first sharp load drop. At this moment, out-of-plane stress had not accumulated to overcome the interfacial bonding strength, and delamination was only in the form of microdamage. During the middle and late stages of impact (2.94 ms/4.06 ms/6.23 ms), the in-plane fiber/matrix failure developed progressively, the out-of-plane effects of impact superposed continuously, and interlaminar stress accumulated steadily. As a result, delamination failure evolved from microdamage to macrodamage, and the coupling effect of its out-of-plane damage exerted a more significant influence on the structural load-bearing capacity than the in-plane fiber/matrix failure, thus becoming the core factor dominating the load drop.
Combining the results of AE monitoring and FE analysis, it can be concluded that under LVI, the composite exhibits a dynamically coupled evolutionary characteristic among matrix cracking, fiber-matrix debonding, and delamination damage, which is consistent with the fundamental understanding of composite damage mechanics. At the initial stage of impact, in-plane shear and bending stresses preferentially induce matrix cracking (see Figure 17). This type of damage represents the dominant failure mode, characterized by the earliest initiation and the widest distribution. Matrix cracking disrupts the continuity of the fiber-matrix interface, leading to interface stress concentration, which in turn triggers fiber-matrix debonding (see Figure 5). These two damage modes form a positive synergistic coupling effect and collectively constitute the core of in-plane damage. With the accumulation of in-plane damage, the interlaminar stress transfer path is interrupted, resulting in a significant increase in interlaminar stress, which further induces delamination damage (see Figure 18). However, the propagation of delamination severs the mechanical connection between adjacent plies and causes stress redistribution, which in turn exacerbates matrix cracking and fiber-matrix debonding in neighboring layers. This forms a closed-loop coupling mechanism of “in-plane damage - delamination”. Under high impact energy (60J), the interlaminar stress level is higher, leading to a significant increase in the propagation rate and range of delamination. Consequently, the dominant coupling mechanism shifts from in-plane damage to delamination damage. In the later stage of impact, large-area delamination causes uneven stress distribution in fibers, ultimately resulting in fiber breakage (see Figure 16). This process completes the full-range coupled evolution of the composite from micro-damage initiation to global failure.
Table 5 presents the experimental values, simulated values, and relative errors between simulated and experimental values of peak force, dissipated energy, and delamination area under an impact energy of 60J. Additionally, it provides the average values (Avg) and coefficients of variation (CV) of the experimental data. All characteristic parameters predicted by the numerical model, including peak force, dissipated energy, and delamination area, are lower than the corresponding experimental values, with errors increasing with the sensitivity of the parameter to damage evolution (reaching −67.8% for delamination area). This trend arises from combined simplifications in the numerical modeling framework, as detailed below: (1) The clamping boundary conditions in the simulation are assumed to be perfectly rigid, while minor slippage between the fixture and specimen occurs in experiments. This results in lower effective constraint stiffness in tests, leading to greater bending deformation, enhanced damage evolution, and increased energy dissipation. Additionally, the impactor-specimen contact model assumes a perfectly rigid impactor, ignoring the elastic deformation and surface wear of the actual impactor, which may introduce small deviations in contact force transfer and result in slightly lower predicted peak forces. (2) In experiments, impact energy is dissipated through multiple pathways: matrix cracking, fiber fracture, interlaminar delamination, resin viscoplastic deformation, impactor-specimen friction, and structural vibration damping. However, the numerical model primarily accounts for fiber/matrix damage and delamination, neglecting secondary dissipation mechanisms such as resin viscoplasticity, friction between microcrack surfaces, and interlaminar friction. This omission underestimates the total dissipated energy in the simulation. (3) Delamination initiation and propagation are highly sensitive to interfacial mechanical behavior. In the simulation, cohesive zone model parameters (e.g., interfacial strength, fracture toughness) are typically obtained from static DCB/ENF tests, neglecting the strain-rate-dependent reduction in interfacial fracture toughness under impact loads. Under transient impact conditions, the actual fracture toughness of the interface is lower than static values, facilitating delamination growth; however, the use of static parameters in the simulation overestimates the interfacial resistance to delamination, suppressing crack initiation and propagation and leading to a significant underprediction of delamination area. Furthermore, the model does not incorporate initial interlaminar defects (e.g., interface voids, uneven resin layer thickness) common in real laminates. These defects lower the delamination initiation threshold in experiments, further exacerbating the discrepancy in delamination area. Predicted and test values of characteristic parameters for Laminates under 60J.
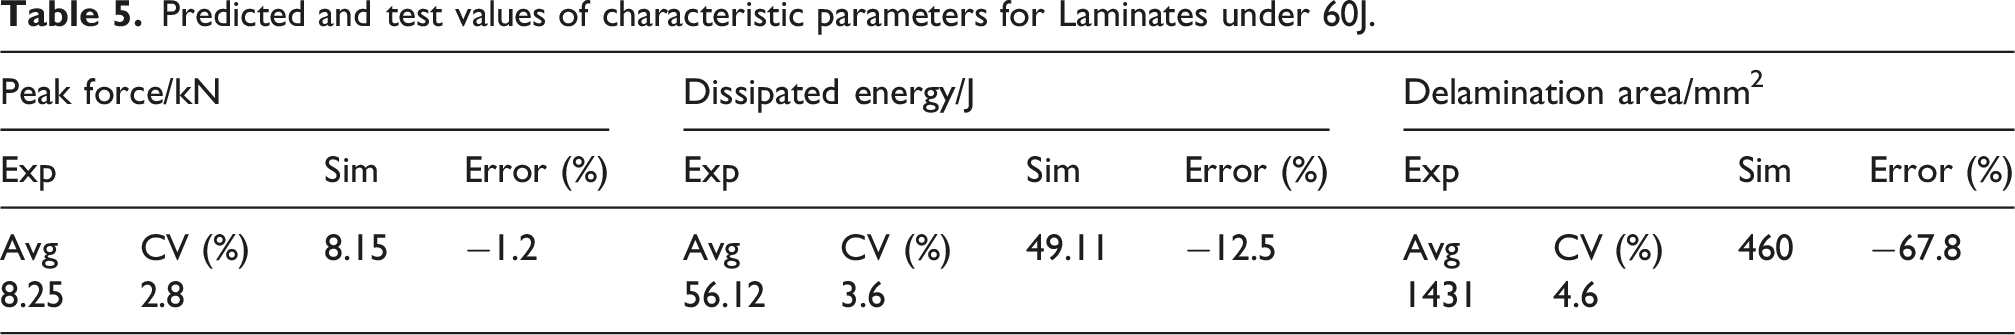
Overall, the numerical predictions of impact damage are generally conservative, with the absence of dynamic interfacial behavior and initial defects identified as the primary cause for the significant underprediction of delamination area. Nevertheless, the model accurately captures the overall trend of impact response, with errors in peak force and time to peak force less than 4%, validating its ability to predict the main mechanical characteristics of the laminate under low-velocity impact. However, the deviation of the numerical values from the experimental results (especially the significant underestimation of the stratified area) reflects the core limitations of the current modeling method. The discrepancies between numerical predictions and experimental results stem from inherent simplifications in the current model. First, static material and cohesive parameters are adopted without considering strain-rate softening under dynamic impact, overestimating interfacial fracture resistance and suppressing delamination growth. Second, manufacturing-induced defects (e.g., voids, fiber waviness) are omitted, which act as damage initiation sites and accelerate crack propagation in experiments. Third, idealized rigid boundary and contact conditions cannot fully replicate minor fixture slippage and dynamic contact effects. Finally, secondary energy dissipation mechanisms (e.g., resin viscoplasticity, microcrack friction) are neglected. These factors lead to conservative predictions, while the model still reliably captures global mechanical responses. In addition to the numerical simplifications summarized above, the experimental AE measurements are further constrained by the single-sensor configuration. This limitation makes it difficult to further couple the temporal evolution characteristics of AE signals with the spatial distribution information of damage, thereby precluding the achievement of direct point-to-point spatial matching between the AE-based damage information obtained from experiments and the spatial damage field derived from FE analysis. This constitutes another non-negligible experimental limitation of the present work.
Conclusions
This study systematically investigated the LVI damage evolution and failure mechanisms of interlaminar hybrid (carbon/glass fiber) composite laminates by integrating experimental AE monitoring with FE simulation. The key findings and conclusions are summarized as follows: • With VMD-HHT processing, impact AE signals are separated from structural vibration. Four IMFs are tentatively correlated with matrix cracking (10–100 kHz), fiber–matrix debonding (100–200 kHz), delamination (200–300 kHz) and fiber fracture (300–500 kHz) by frequency features. Damage initiates sequentially: matrix cracking appears first and dominates damage, followed by interface debonding and delamination, while fiber fracture occurs latest. Higher impact energy markedly accelerates delamination expansion. • The 3D FE model well reproduces the overall damage evolution trend. Matrix damage concentrates more severely in carbon fiber plies, and modulus mismatch triggers preferential delamination between carbon fiber layers. At 60J, early load drop arises from massive fiber tensile rupture, whereas subsequent structural deterioration is controlled by large-scale delamination propagation. • Mutual comparison between test and simulation verifies the damage coupling mechanism: early intralaminar matrix/fiber damage accumulates to induce interlayer delamination, and expanded delamination reversely aggravates ply internal failure. In conclusion, this work presents a synergistic experimental-numerical framework for unraveling the complex multi-damage progression in composite laminates under LVI. • Key study limitations are clarified: frequency-based AE damage classification is empirical and single-sensor setup cannot realize damage spatial localization; simplified FE assumptions including static material parameters and ideal boundaries cause quantitative deviations on force–time curves and underestimated delamination area. Future work will adopt multi-point AE arrays and strain-rate-dependent constitutive models to improve prediction accuracy.
Footnotes
Funding
The authors disclosed receipt of the following financial support for the research, authorship, and/or publication of this article: This research was supported by National Natural Science Foundation of China under Contracts Nos. (12102156 and 52205157).
Declaration of conflicting interests
The authors declared no potential conflicts of interest with respect to the research, authorship, and/or publication of this article.
Data Availability Statement
The supporting data for this study’s findings are available from the corresponding author on reasonable request.