






Abstract
Composite laminates with scratches and holes are common in aerospace structures, while comparative studies on their compressive failure remain limited. This study experimentally and numerically investigates compressive failure using a three-dimensional progressive damage model with an improved Hashin criterion and Camanho degradation implemented via a UMAT subroutine. Compression tests were conducted on two layups with various scratch depths and locations, and hole diameters. Numerical predictions agree well with experiments, with errors below 10.20% for scratches and within 14.04% for holes. Shallower scratches have little effect on ultimate load, while deeper scratches cause significant reductions. Increasing hole diameter also reduces ultimate load, with greater reductions observed in thicker laminates. The results validate the proposed method for predicting compressive failure of damaged composite laminates.
Keywords
Introduction
Composite materials are widely used in the aerospace field due to their excellent properties, such as high specific strength, stiffness, corrosion resistance, and design flexibility. They have become indispensable in modern aerospace engineering.1,2 Carbon fiber reinforced polymer (CFRP) is particularly favored for its lightweight and high-strength characteristics and has become a key candidate to replace traditional metals in aircraft and spacecraft structural components.3,4 In aircraft like the Boeing 787 and Airbus A350, composites account for over 50% of the airframe weight, significantly reducing fuel consumption and emissions while improving flight performance.5,6
During service, composite structures inevitably sustain various forms of damage, including scratches, holes, and impact damage, which significantly reduce load-bearing capacity and alter failure modes.7,8 Scratches — common surface damage arising from handling, maintenance, or foreign object contact — can substantially degrade compressive strength depending on their depth and location. Holes, by contrast, primarily introduce stress concentrations that lead to significant strength reductions.9–11 Understanding the effects of different damage types on compressive performance is therefore essential for optimizing structural design, improving safety, and extending service life.
Experimental studies on compressive failure of damaged laminates
The compressive failure behavior of composite laminates has been extensively investigated through experimental approaches. Ekvall and Griffin demonstrated that open-hole compressive strength can decrease by up to 30% compared to intact laminates, with hole size and location significantly influencing structural performance.12,13 For scratch-type damage, Tang et al. found that shallow scratches (e.g., 0.4 mm) have minimal impact on load-bearing capacity, while deeper scratches (e.g., 1.2 mm) induce severe bending and delamination, substantially reducing compressive strength. 14 Wysmulski 15 investigated the effect of open holes on the buckling of compressed composite plates through combined experimental and numerical analyses, revealing that hole geometry plays a critical role in stability loss. Zhang et al. 16 conducted a comparative study on the failure mechanisms of open-hole and filled-hole composite laminates, demonstrating that the presence of a hole significantly alters the damage initiation and propagation sequence. Liu et al. 17 performed progressive damage analysis and experiments on open-hole composite laminates under compression, further elucidating the interplay between damage initiation and ultimate failure. Despite these advances, systematic experimental comparisons of multiple damage types—particularly scratches with controlled depths and locations alongside holes—within a unified framework remain scarce.
Progressive damage modeling of composite laminates
Numerical simulation has become an indispensable tool for studying damage behavior in composite materials. Failure criteria such as the Hashin criterion and the Puck criterion have been widely adopted in progressive damage analysis. Hashin’s criterion 18 distinguishes fiber-dominated and matrix-dominated failure modes on a physically meaningful basis, while Puck and Schürmann’s criterion 19 provides a more detailed treatment of matrix failure under compression. Camanho et al.20,21 developed degradation models based on the Hashin criterion that significantly improved the accuracy of progressive damage predictions. The original 2D Hashin formulation, however, cannot capture through-thickness failure modes such as delamination and matrix-fiber shear. To address this limitation, Tserpes et al. extended the criterion to three dimensions by explicitly including through-thickness normal and shear stress components. 22 This 3D Hashin-type criterion has been increasingly adopted in recent studies. Yu et al. 23 applied the Hashin-Puck criterion to predict failure behavior in composite countersunk bolt connections. Zhang et al. 24 conducted multiscale compressive failure analysis of wrinkled laminates using a multiaxial damage model based on the 3D Hashin criterion. Chen and Hwu 25 employed the 3D Hashin criterion for strength and progressive failure predictions of T-joint laminated composites. Higuchi et al. 26 developed a consistent anisotropic damage model for laminated fiber-reinforced composites using the 3D version of the Puck failure criterion. An enhanced progressive damage model based on the 3D Hashin criterion within the ABAQUS/Explicit framework has also been developed. 27 However, the application of 3D Hashin-type progressive damage models to prefabricated scratches with controlled depths and locations—combined with detailed validation against full-field experimental data including failure morphologies—remains limited.
Research gaps and contributions
Despite significant progress, several critical gaps remain. First, most existing studies focus on a single damage type — typically open holes or impact damage — in isolation, while systematic comparisons of multiple damage forms within a unified experimental and numerical framework are scarce. In particular, the effects of scratches with controlled depths and locations on compressive failure have received limited attention. Second, although 3D Hashin-type progressive damage models have been developed, their application to prefabricated scratches — combined with detailed validation against full-field experimental data — remains insufficient. Third, despite extensive experimental and numerical work, the coupling effect between scratch depth and location, as well as the mechanism underlying the sensitivity of thicker laminates to open holes, has not been fully elucidated.
To address these gaps, the present study establishes a systematic framework for investigating the compressive failure behavior of composite laminates with prefabricated scratches and open holes. The main contributions are threefold: (1) A systematic experimental investigation into the effects of scratch depth (0.4, 0.8 and 1.2 mm), scratch location (center vs left side), and hole diameter (20, 50 and 80 mm) on compressive failure, providing a comprehensive dataset for model validation. (2) The development and validation of a 3D Hashin-Tserpes-Camanho progressive damage model, implemented via a UMAT (User-defined Material subroutine) subroutine, specifically for simulating the compressive failure of pre-damaged laminates. (3) An analysis of the coupling effects between scratch depth and location, and the mechanism underlying the thickness-dependent sensitivity of holed laminates, providing new insights into the failure mechanisms of damaged composite structures.
Compression testing analysis of damaged composite laminates
This chapter verifies the mechanical properties and failure mechanisms of damaged composite laminates under compression through experiments. The experimental subjects include laminates with pre-manufactured scratches and laminates with holes. The effects of scratch depth, location, and hole diameter on the compressive performance of the laminate structure are investigated. The experimental results directly support the load-bearing capacity and failure modes of damaged composite materials. The flowchart of this chapter is shown in Figure 1. Flowchart of the test process and pre-test preparation for laminates with holes.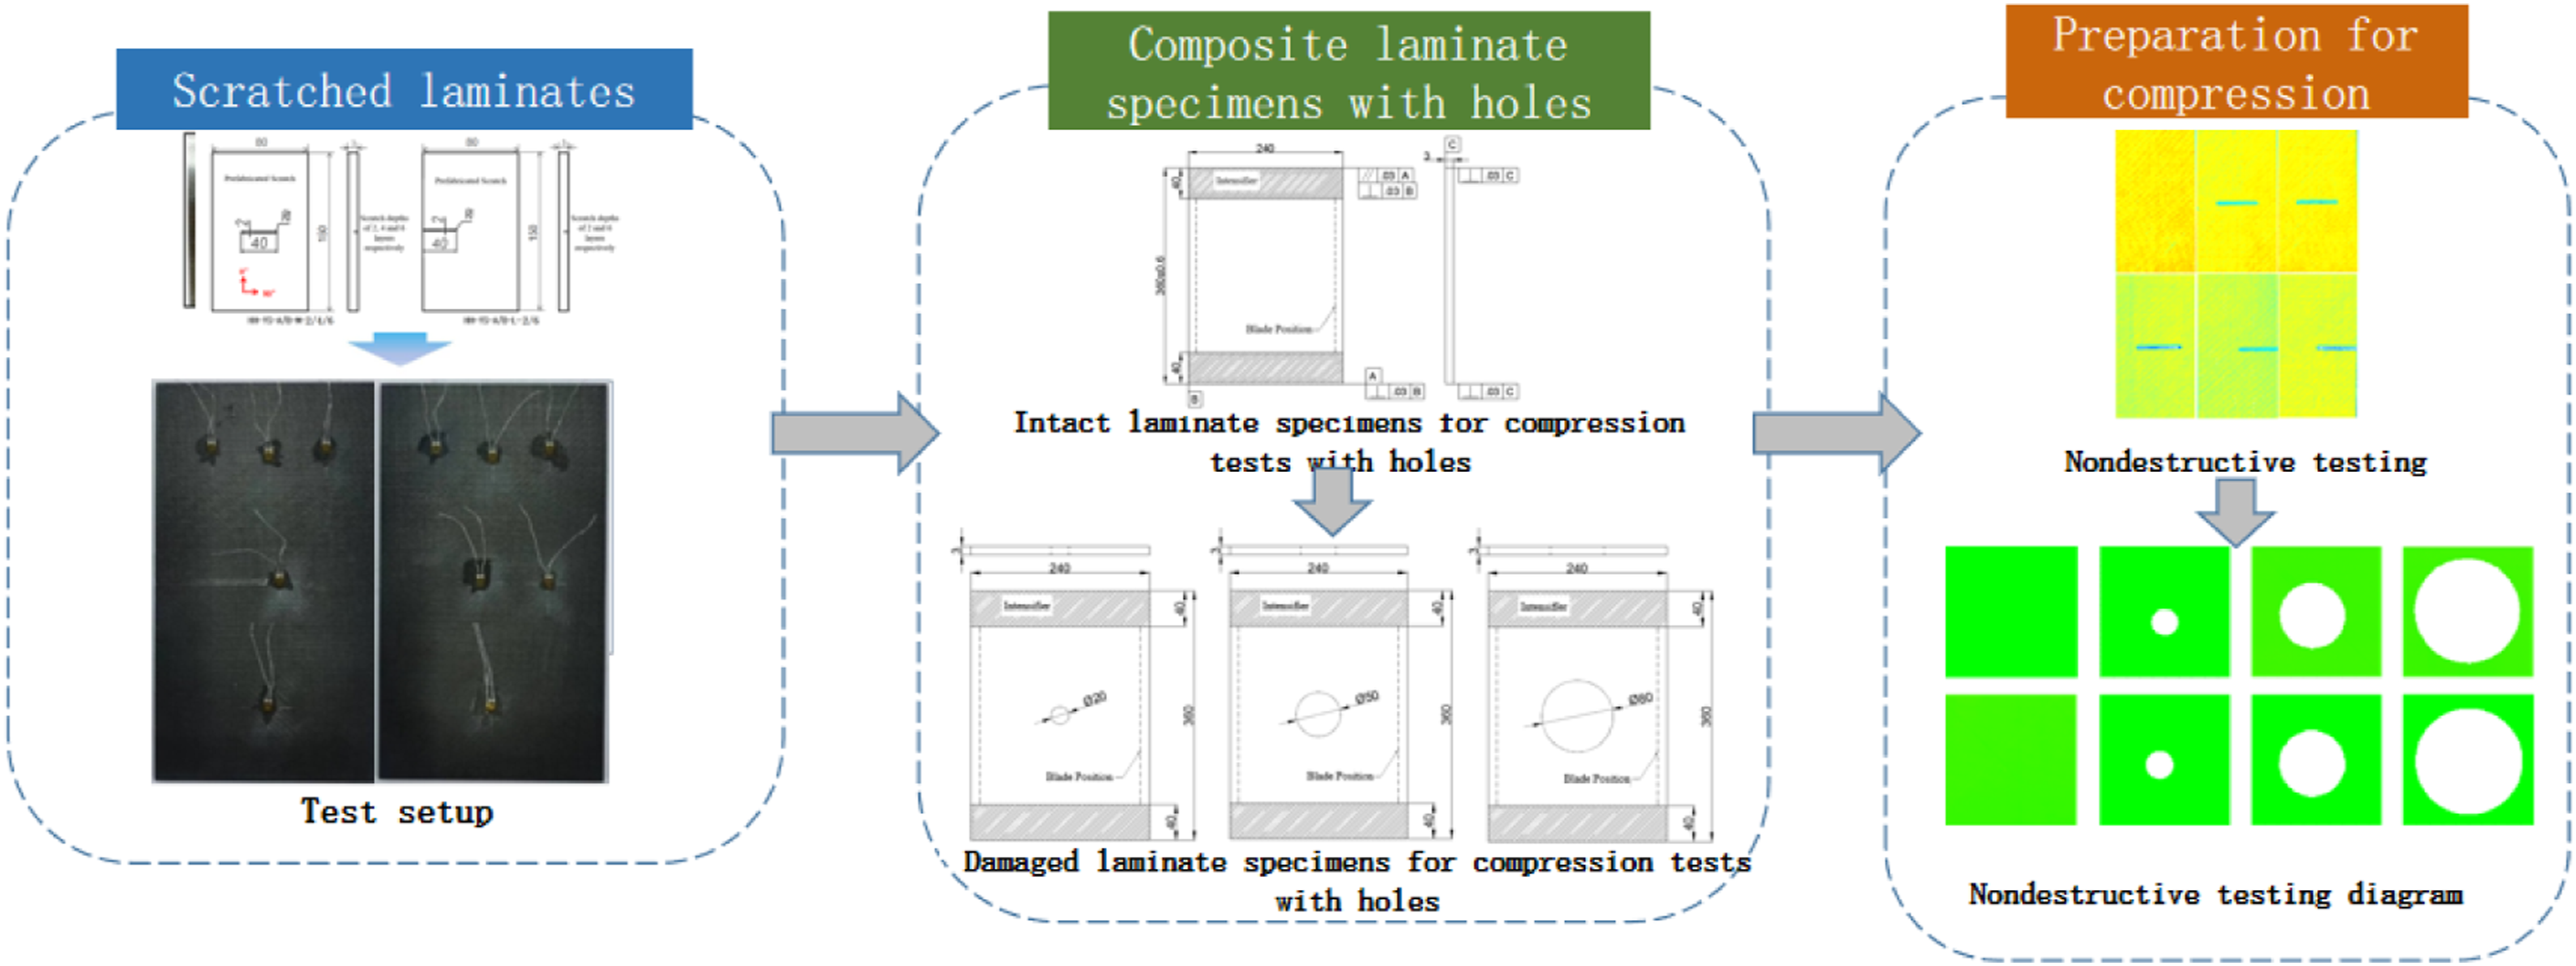
Static compression test and failure analysis of scratched laminates
Scratched composite laminate specimens
The experimental material is ZT7H3194U/QY9512 carbon fiber-reinforced composite laminate, with a fiber volume fraction of 55% and a single-layer thickness of 0.2 mm. The scratch locations include the center of the specimen and areas near the edge. The scratch depths are 0.4 mm, 0.8 mm, and 1.2 mm. The specimen width is 80 mm, and the length is 150 mm. The scratch distribution and morphology are shown in Figure 2. Table 1 summarizes the ply information of all scratched specimens to provide testing standards. Damaged specimens from scratched laminate compression tests. Ply layup of laminate specimens.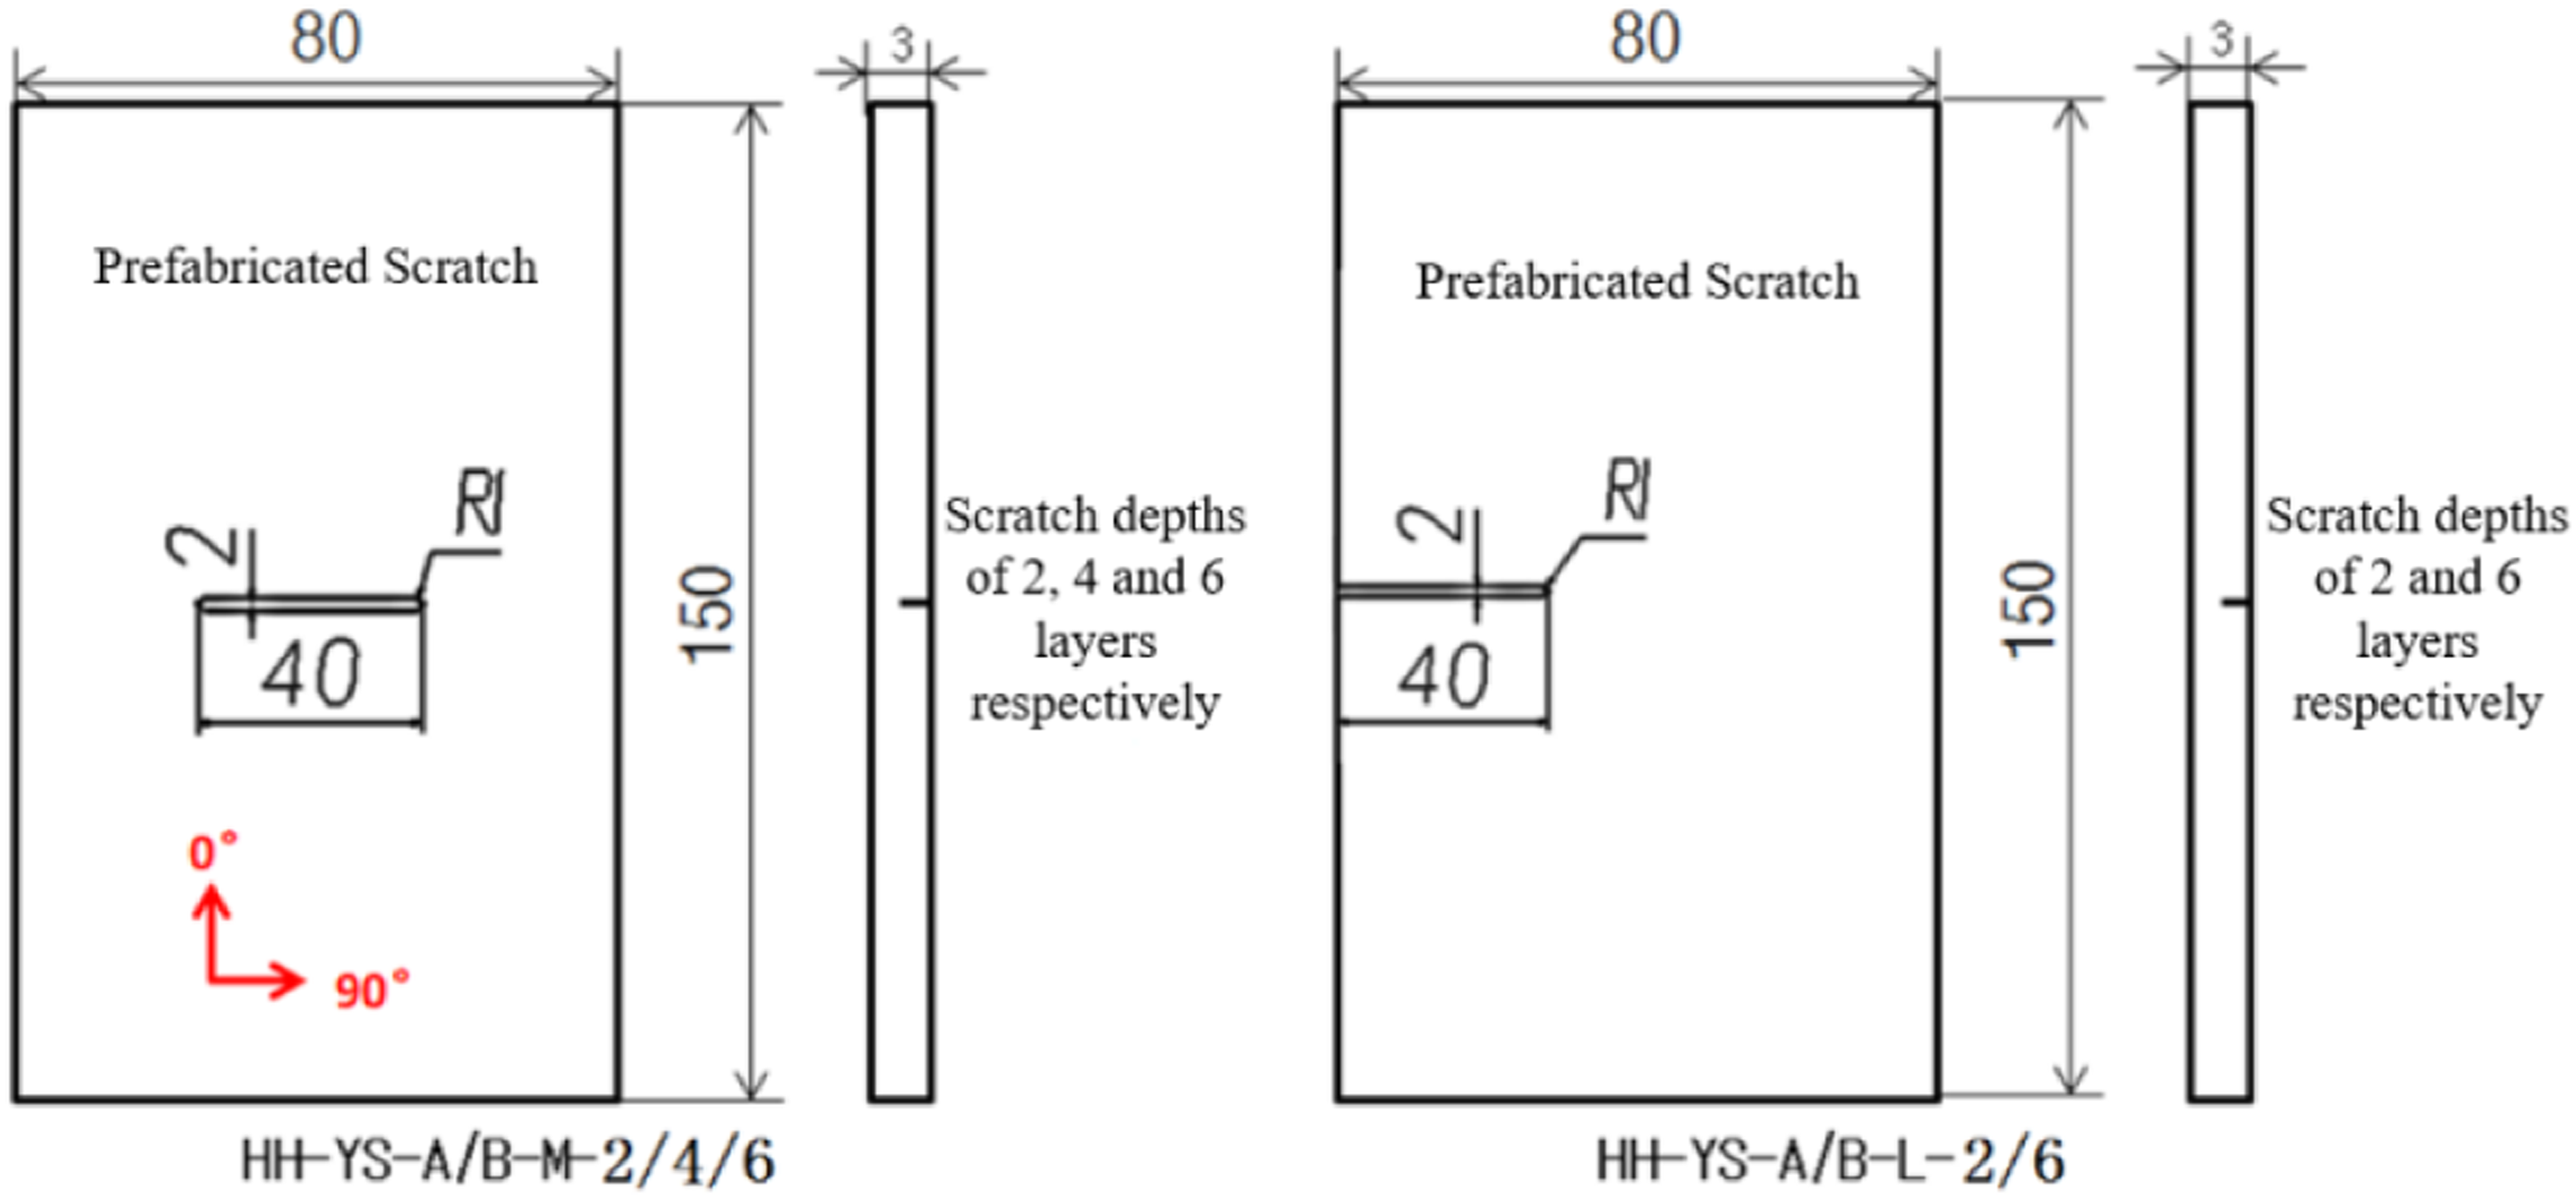

Preparation for compression testing of scratched composite laminates
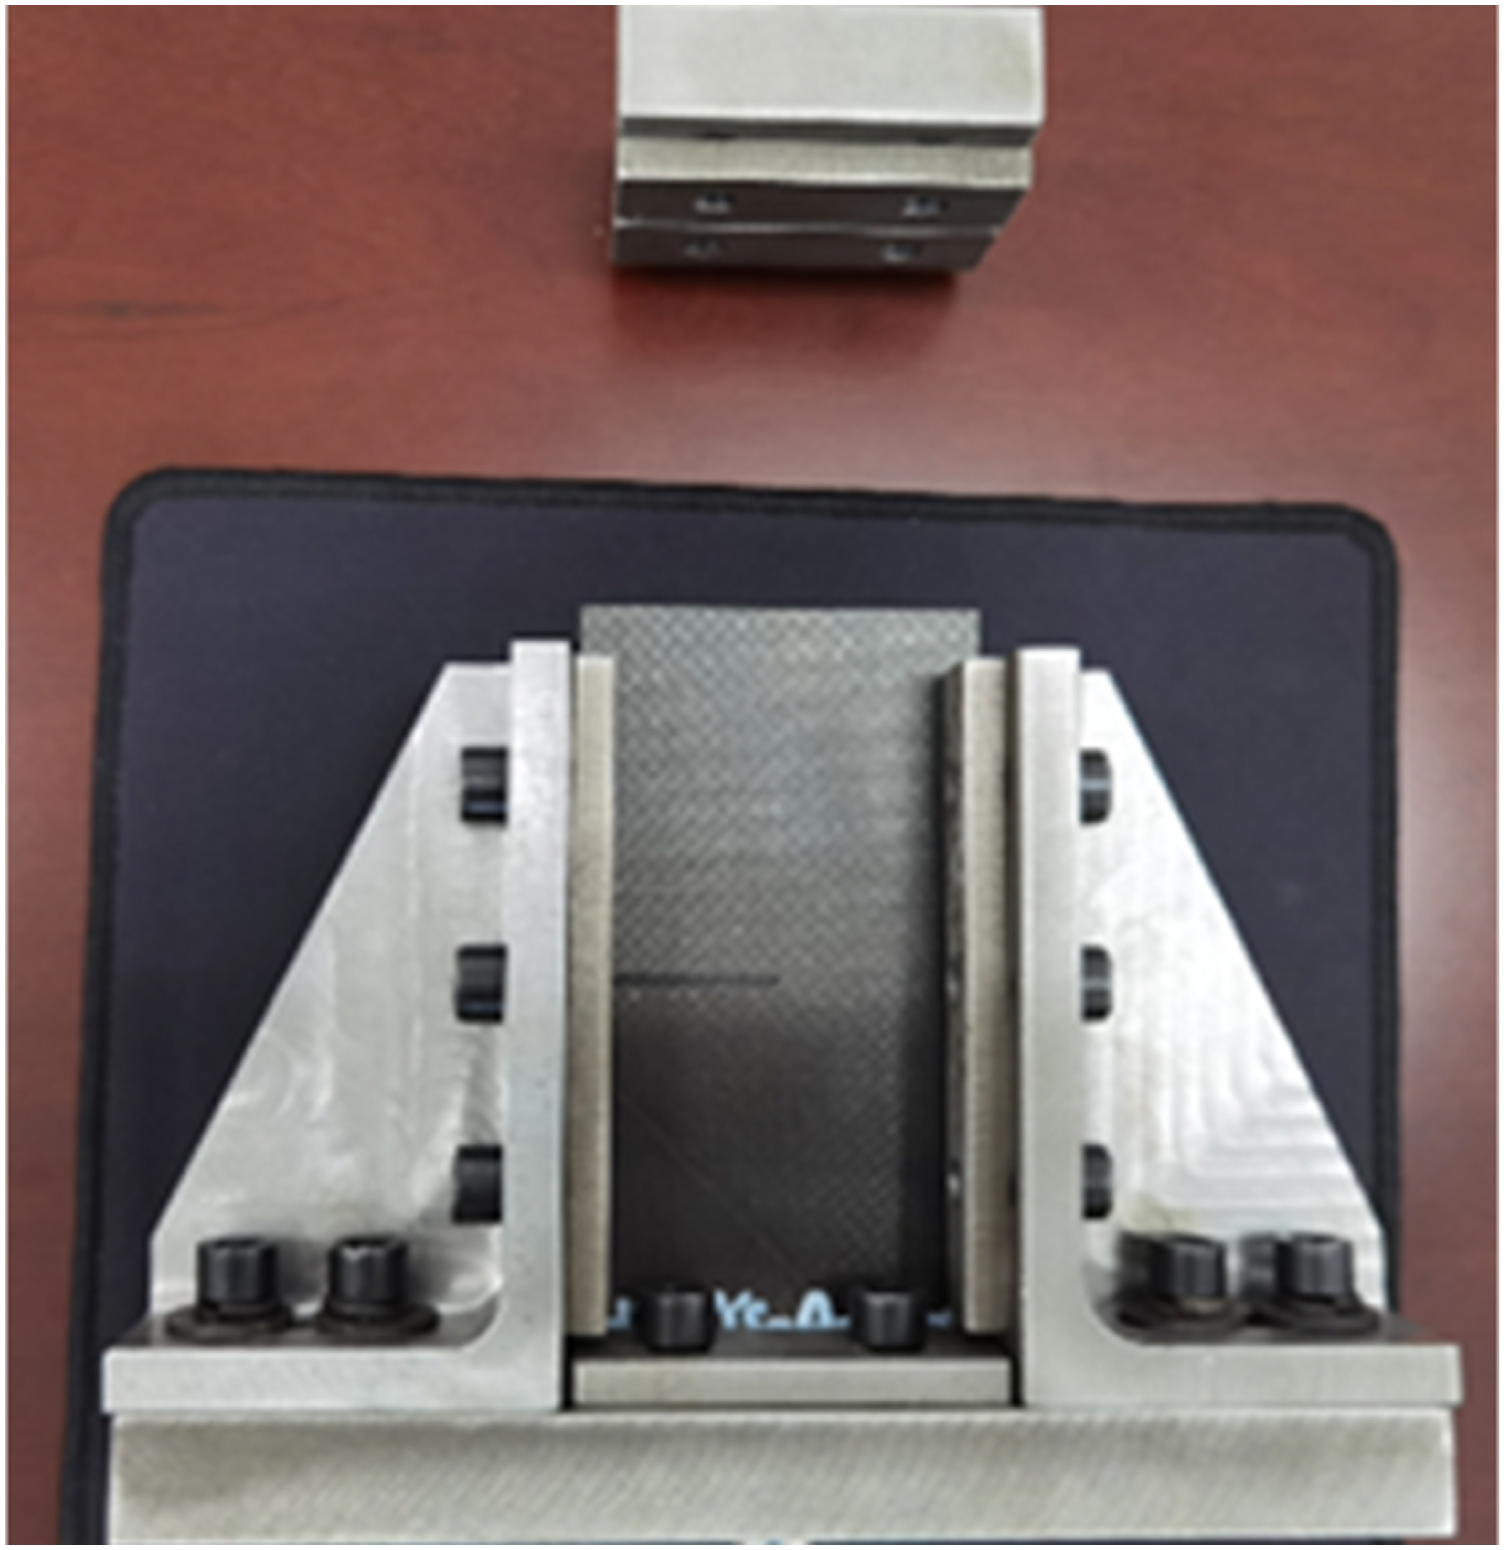
The specimens were inspected using ultrasonic nondestructive testing before the experiments to confirm that the internal structure was free of defects. Figure 3 shows the inspection results of different specimens. Compression tests were conducted according to the ASTM (American Society for Testing and Materials) D7137 standard. A standard compression fixture was used (Figure 4). It was ensured that the tab positions on scratched specimens did not cause stress concentration during the test. In addition to considering the changes in compressive loading applied to the specimens, the compressive failure process of the laminates also required obtaining strain data at different positions. This was used to plot the load-strain curve. The specimen width of 80 mm was selected to accommodate the 40 mm scratch length while providing a 20 mm margin on each side for fixture gripping. Although this width does not strictly conform to the 100–150 mm range recommended by ASTM D7137, the standard itself acknowledges that results depend on specimen geometry and damage configuration. The repeatability of the test results (Table 6) confirms that the 80 mm width provided adequate lateral support, and no global buckling occurred prior to failure. A similar non-standard specimen width (75 mm) was successfully used by Sun et al.
28
in compressive testing of scratched composite laminates, supporting the validity of this design. Nondestructive testing results of scratched laminate specimens. Physical Diagram of the Compression Test Fixture for Scratched laminate specimens.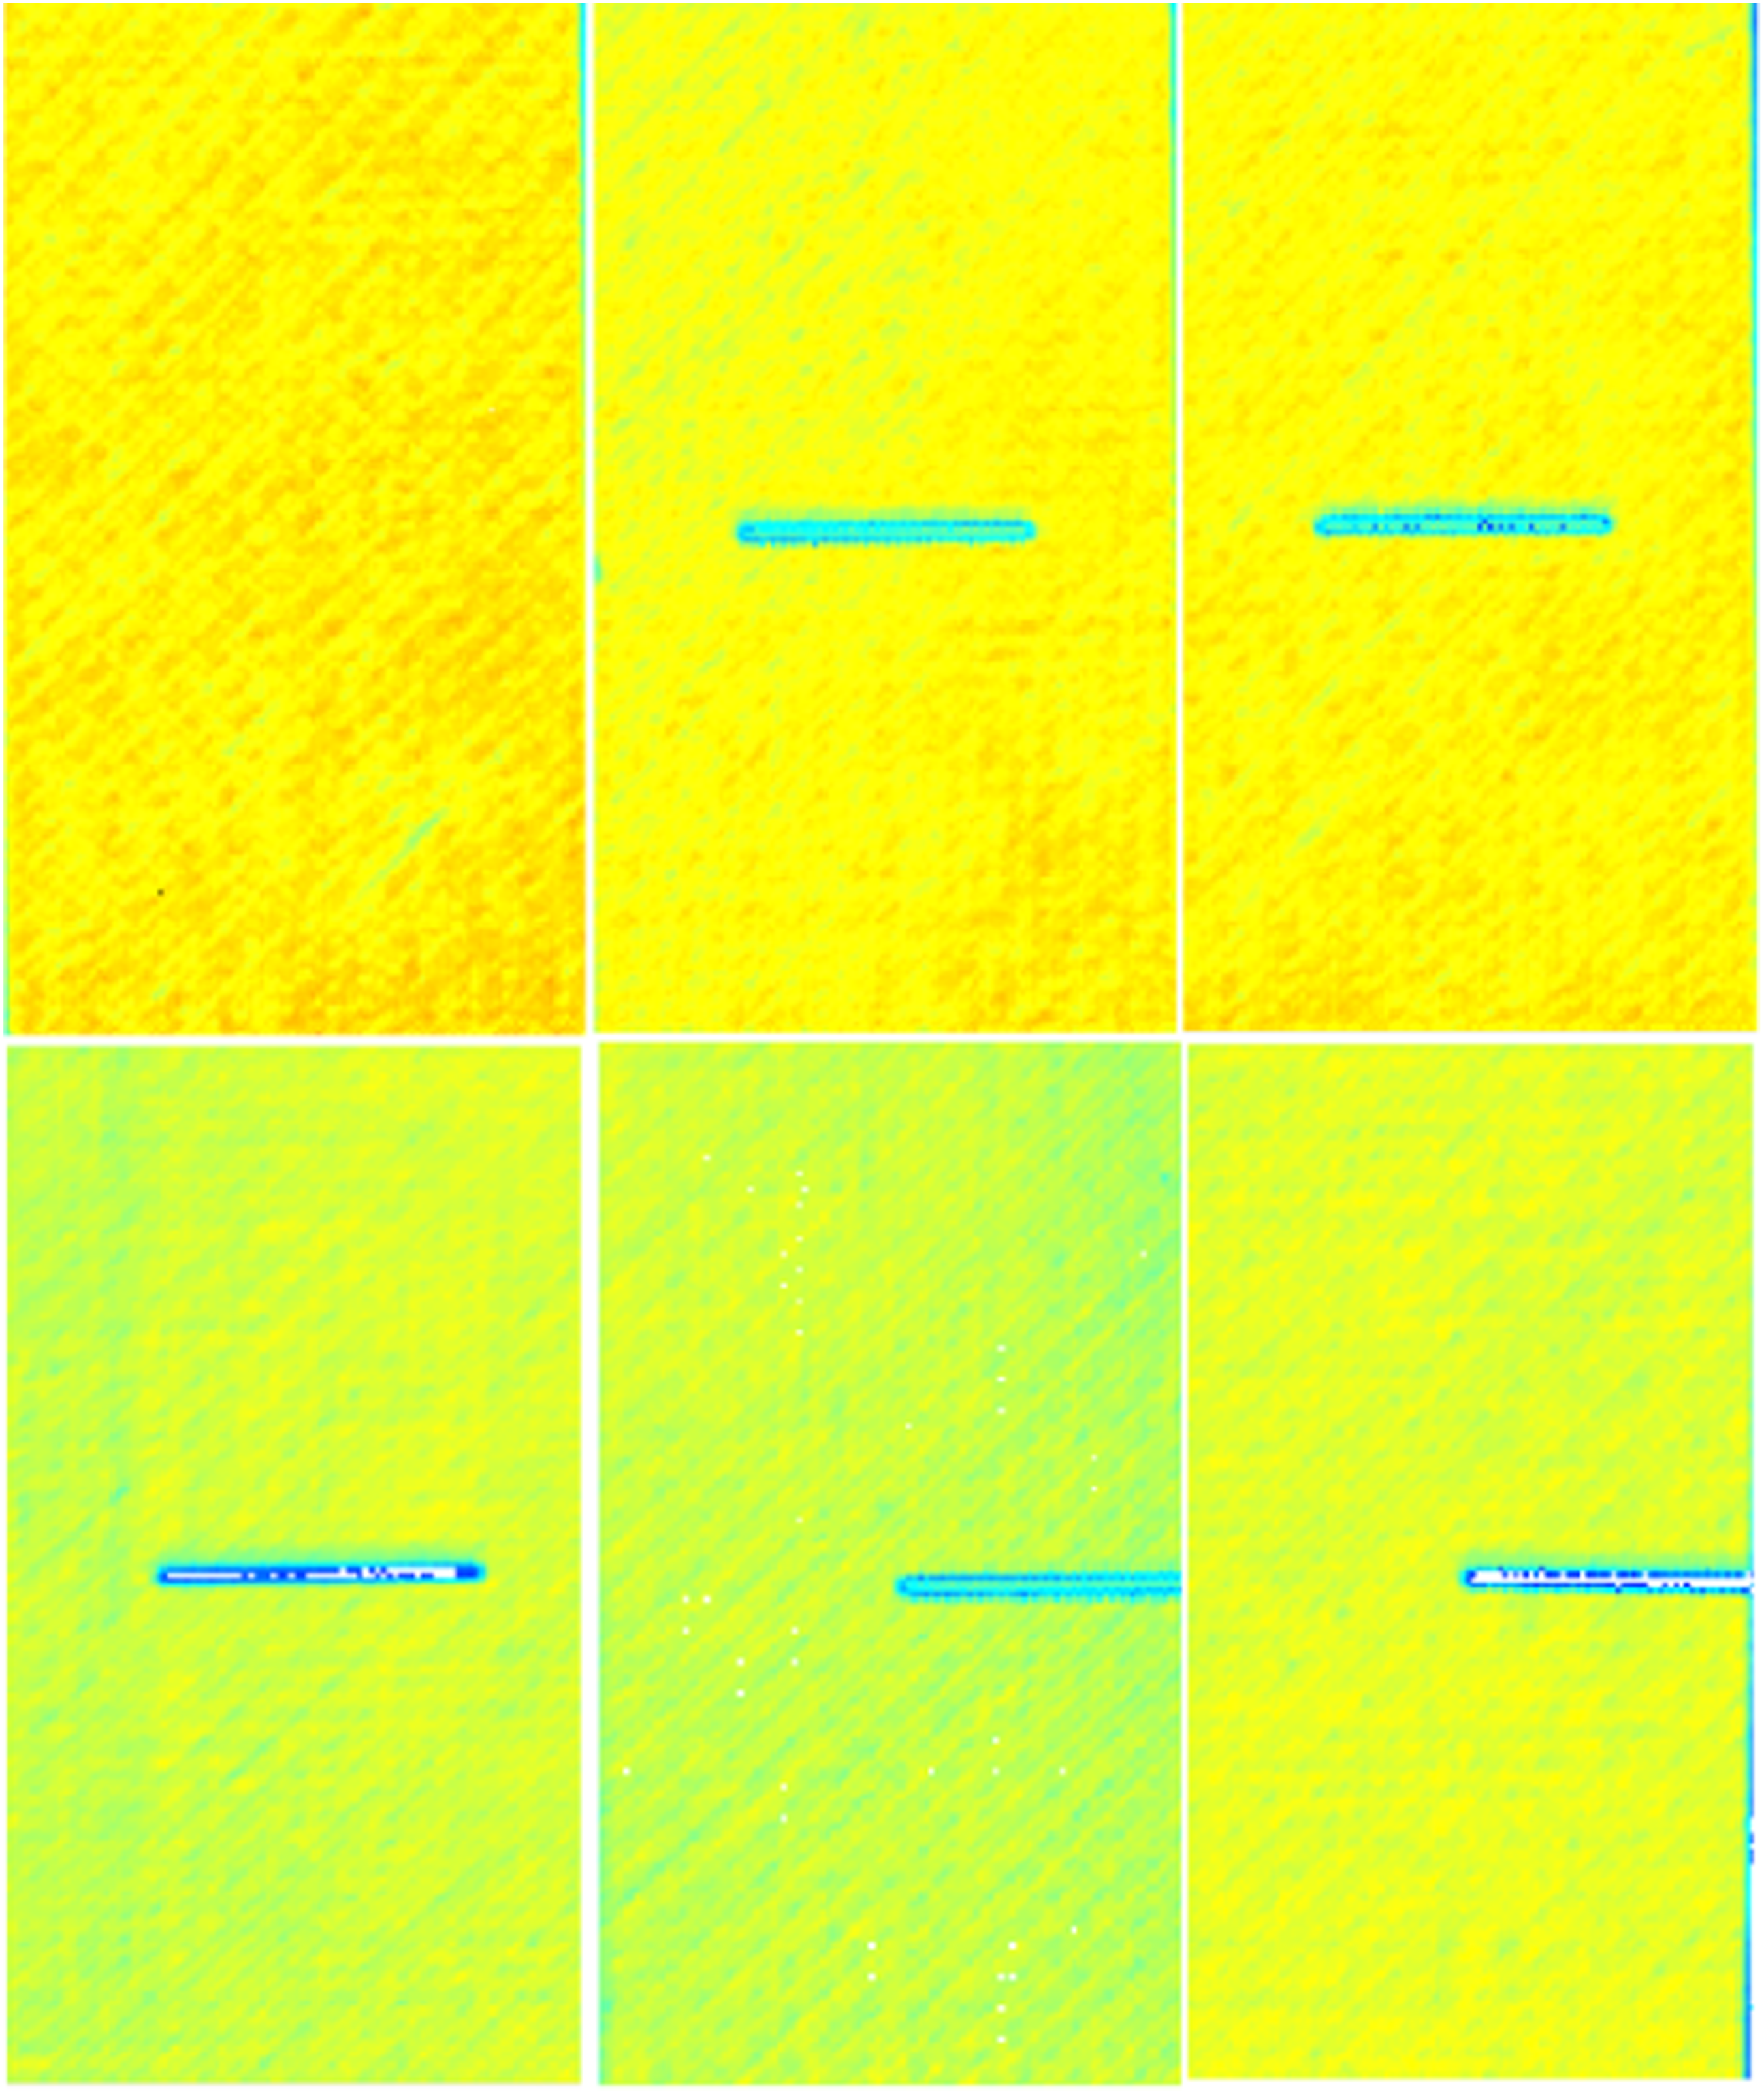
For scratched specimens, several key locations on the specimen surface were selected for strain measurements. Strain gauges were placed on both the front and back surfaces, as shown in Figure 5. The figure only marks the front surface strain gauge positions, with the back surface having the same layout. The gauge model used was BX350-3AA, with a resistance of 350 Ω ± 0.2. The strain gauge signal conditioner model was LAS-400. Strain gauge placement on scratched laminate specimens.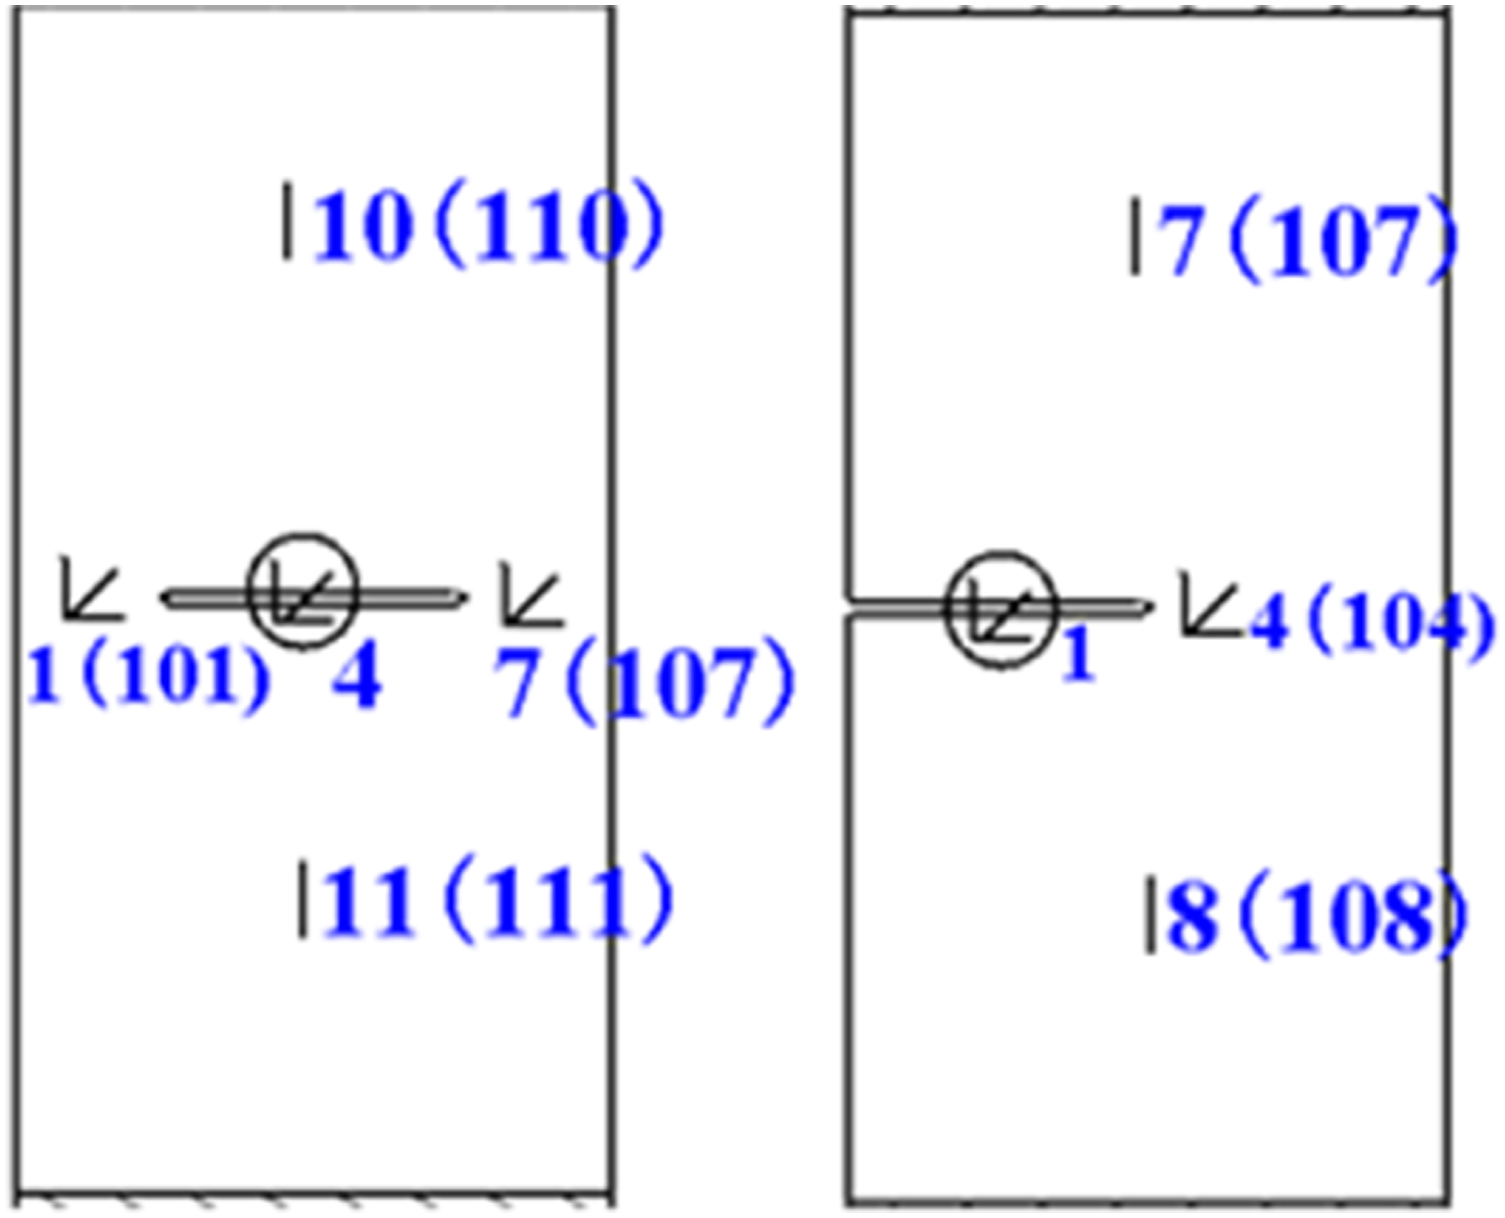
To ensure that the specimen fails primarily under compressive loading, the fixture alignment on the testing machine must be verified to meet the required curvature conditions. According to the ASTM D7137 standard, the curvature is defined as shown in equation (2.1).
In the formula,
The experimental machine used for the compression test of the scratched laminate in this study is the Instron 5984, with a load capacity of ±150 kN and a load measurement accuracy of 0.5% of the displayed value. The displacement range is 1430 mm, with a displacement measurement accuracy of 0.05% of the displayed value. The strain gauge model is BX350-3AA, with a resistance value of 350 Ω ± 0.2. Figure 6 shows the actual image of the scratched compression specimen with strain gauges attached to both the front and back sides. The strain instrument model is LAS-400. Physical image of strain gauge application on scratched laminate compression specimens.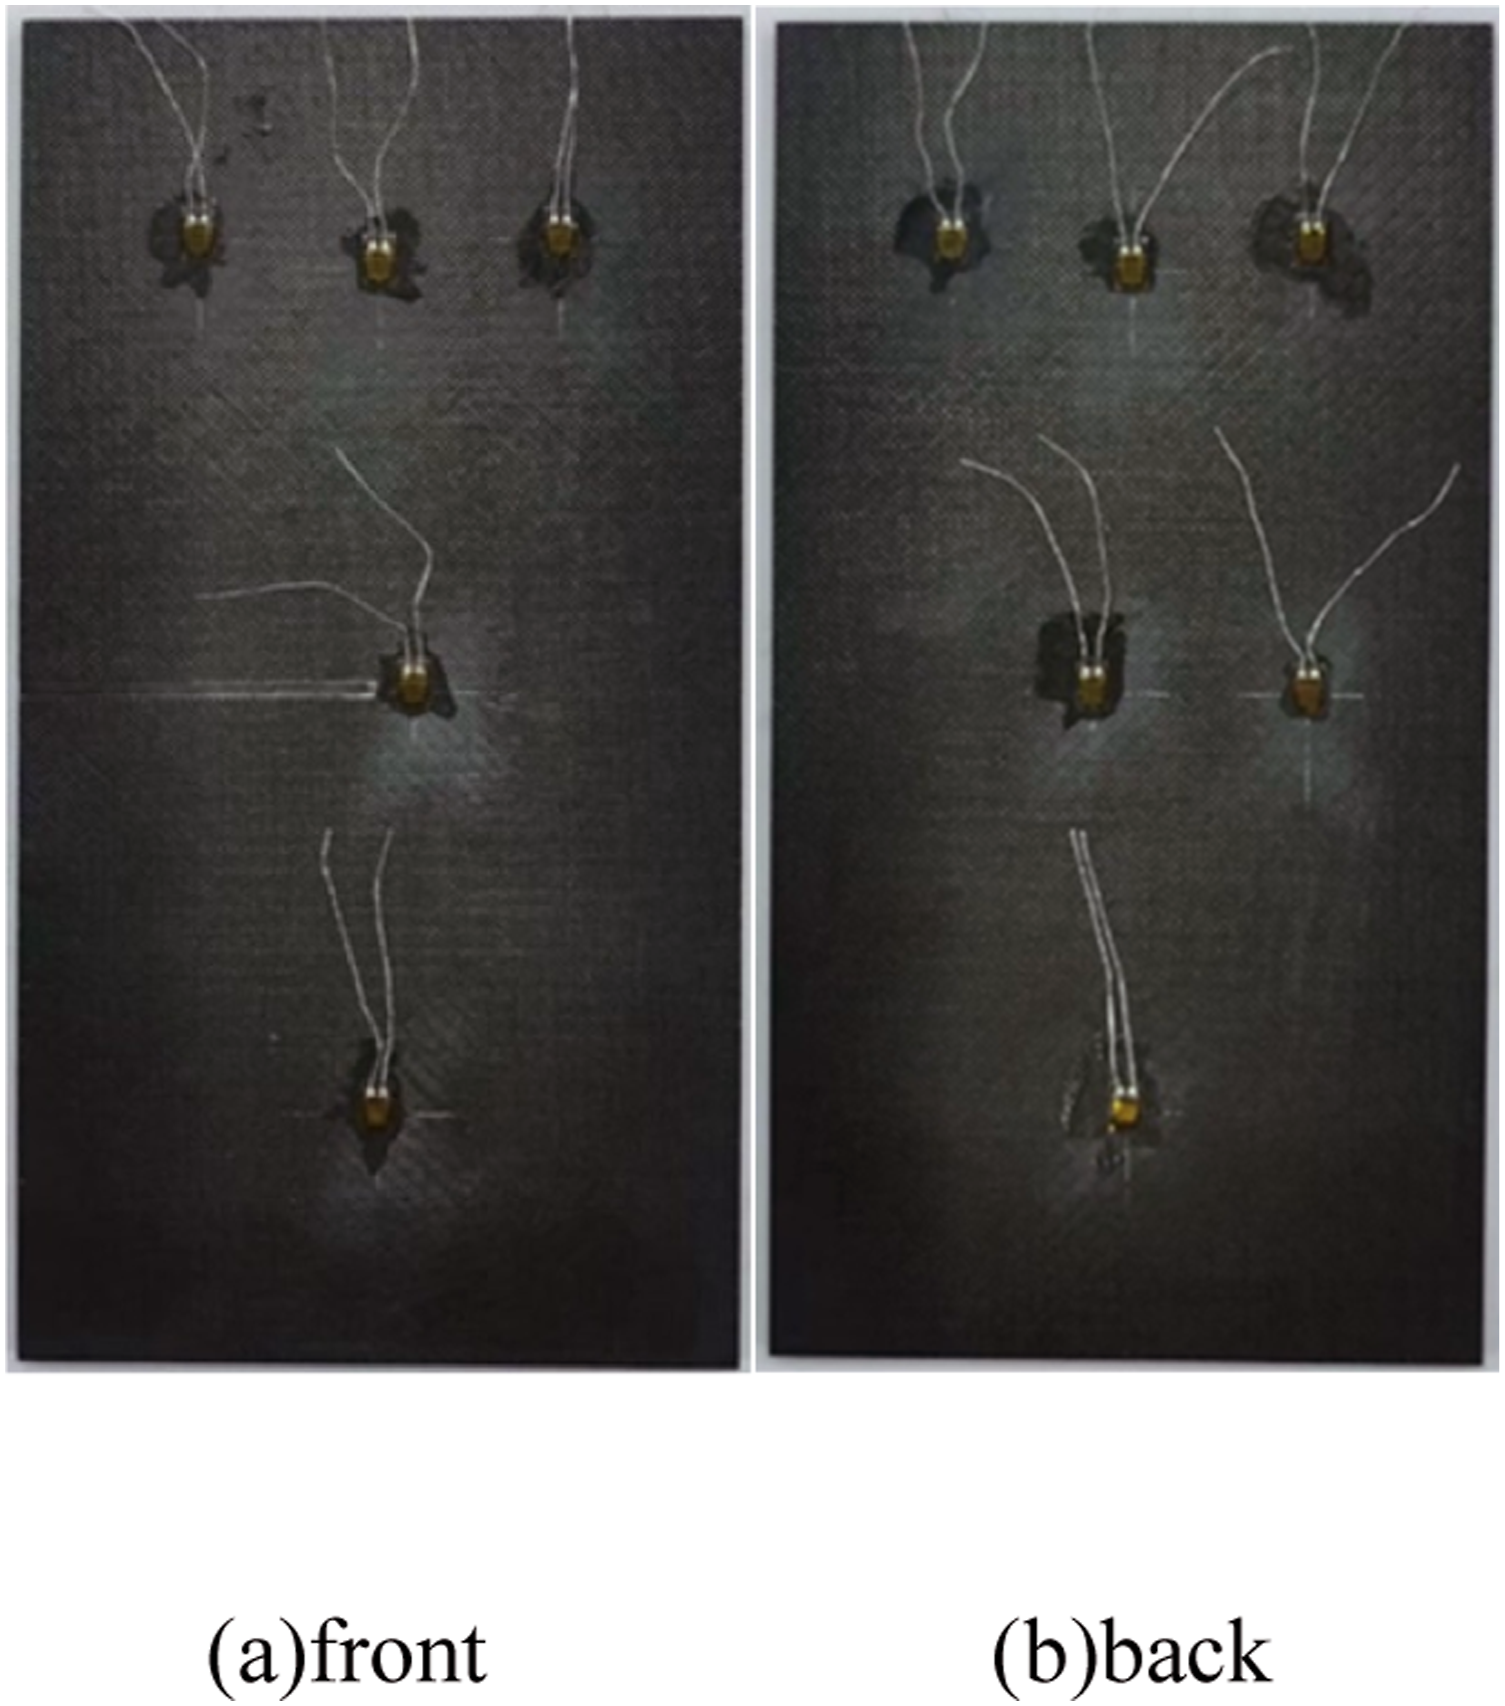
The tests were conducted under RTD (Room Temperature Dry) conditions, with a temperature of 21°C ± 5.5°C and moisture absorption in the manufacturing state. A loading rate of 1.25 mm/min was applied. The compression load was increased until the maximum force was reached, followed by a decrease of approximately 30%, or until failure occurred.
Static compression test and failure analysis of laminates with holes
Composite laminate specimens with holes
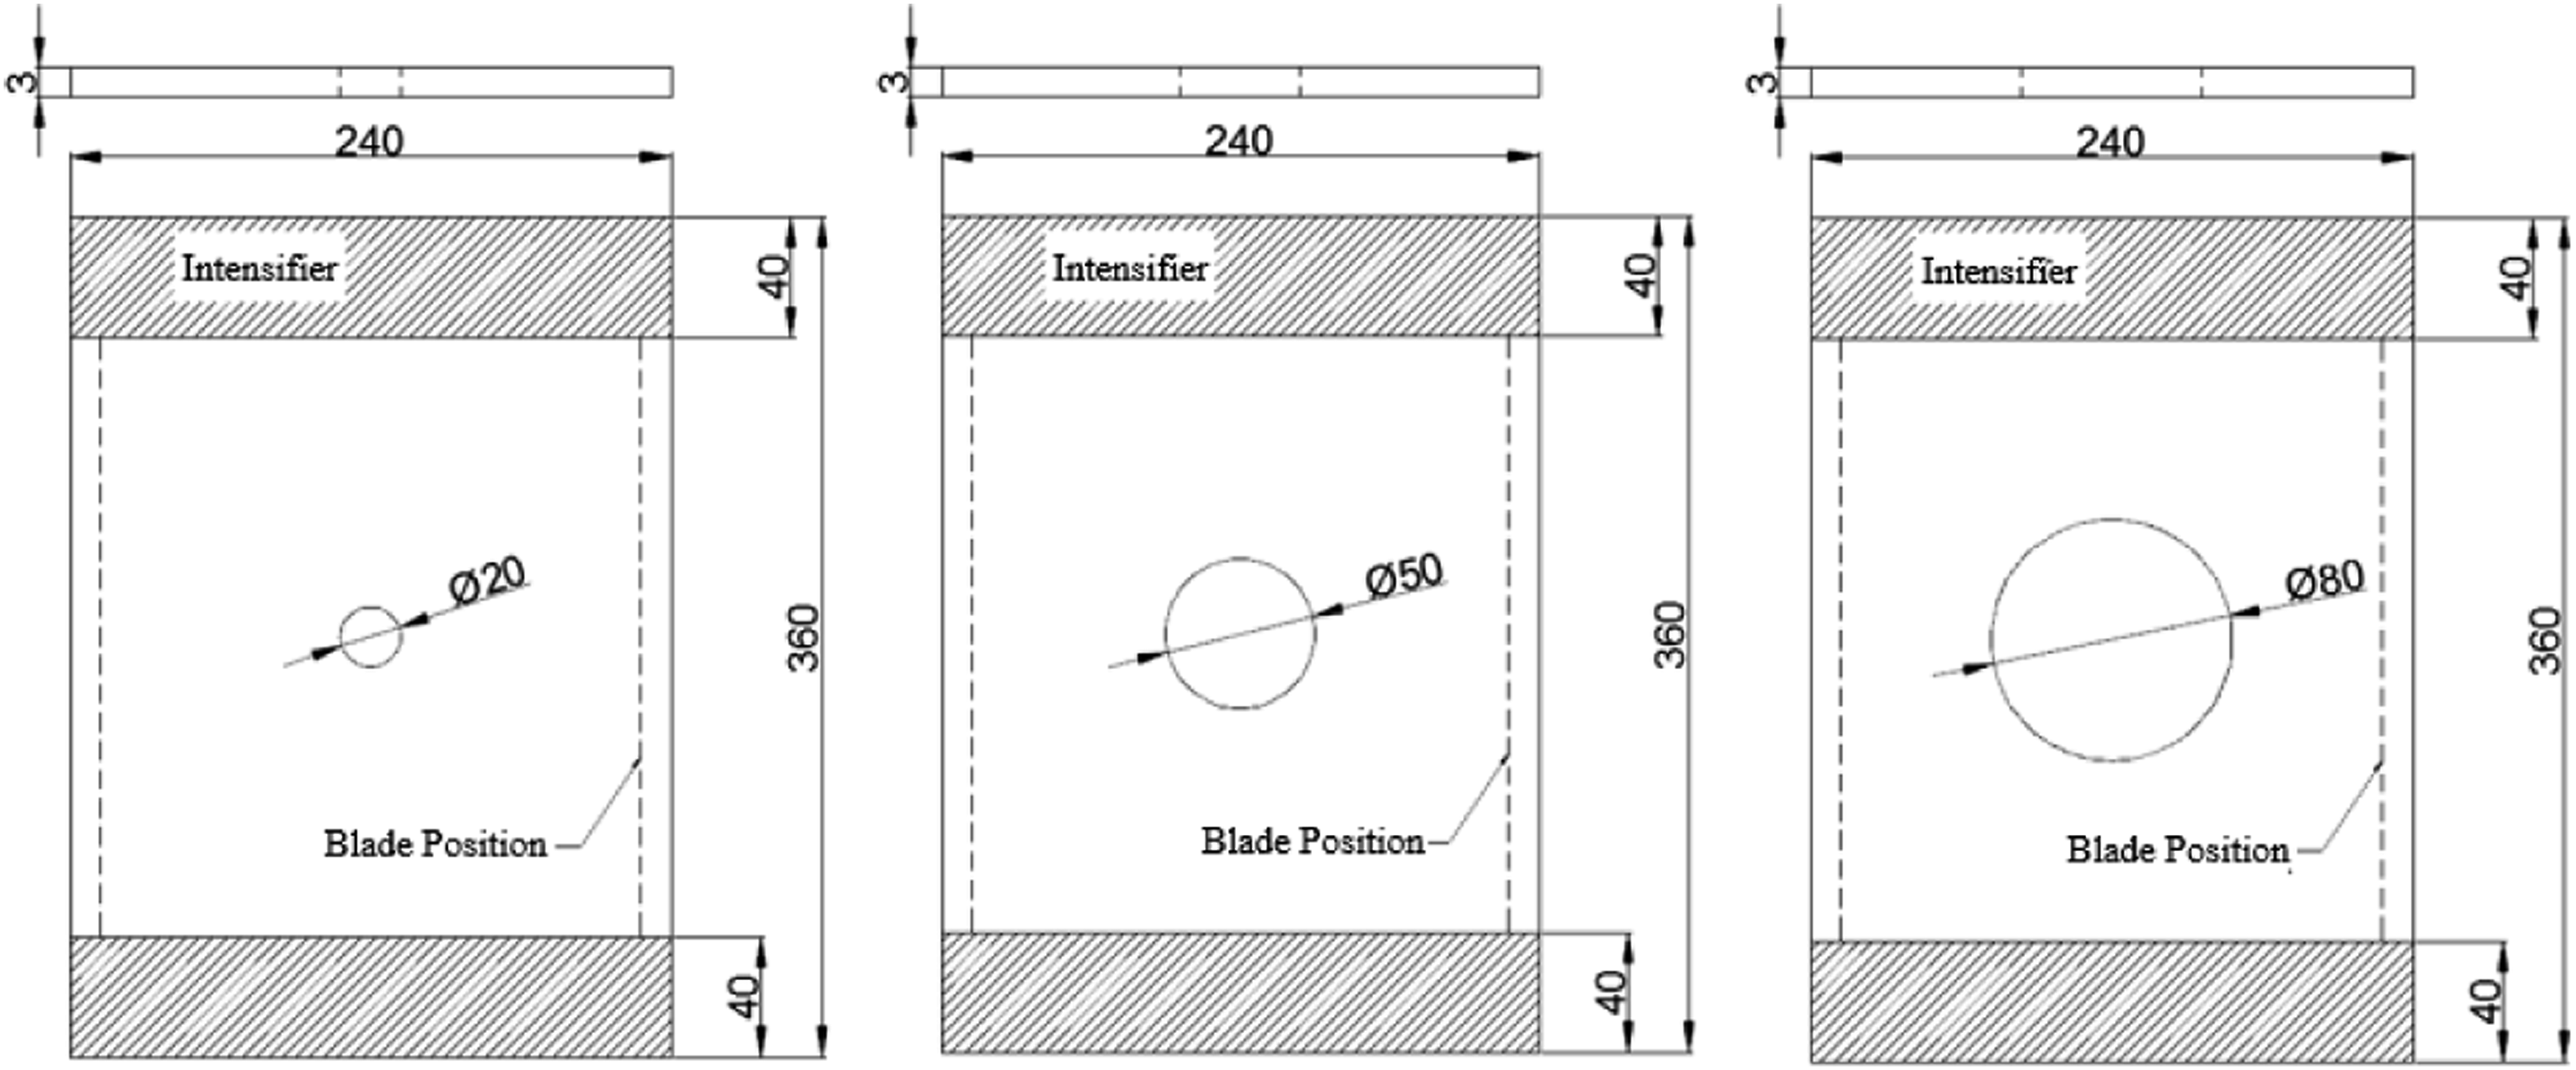
The dimensions of the composite laminate specimens with holes for compression testing are shown in Figure 7. The specimens have a length of 360 mm and a width of 240 mm. Based on the different ply configurations, there are two thicknesses: the thickness of specimens with Ply A is 3 mm, and the thickness of specimens with Ply B is 5 mm. The hole diameters are 20 mm, 50 mm, and 80 mm. The specimens are shown in Figures 7 and 8. The holes are located in the central region of the specimens to ensure uniform stress distribution during compression. Intact laminate specimens for compression tests with holes. Damaged laminate specimens for compression tests with holes.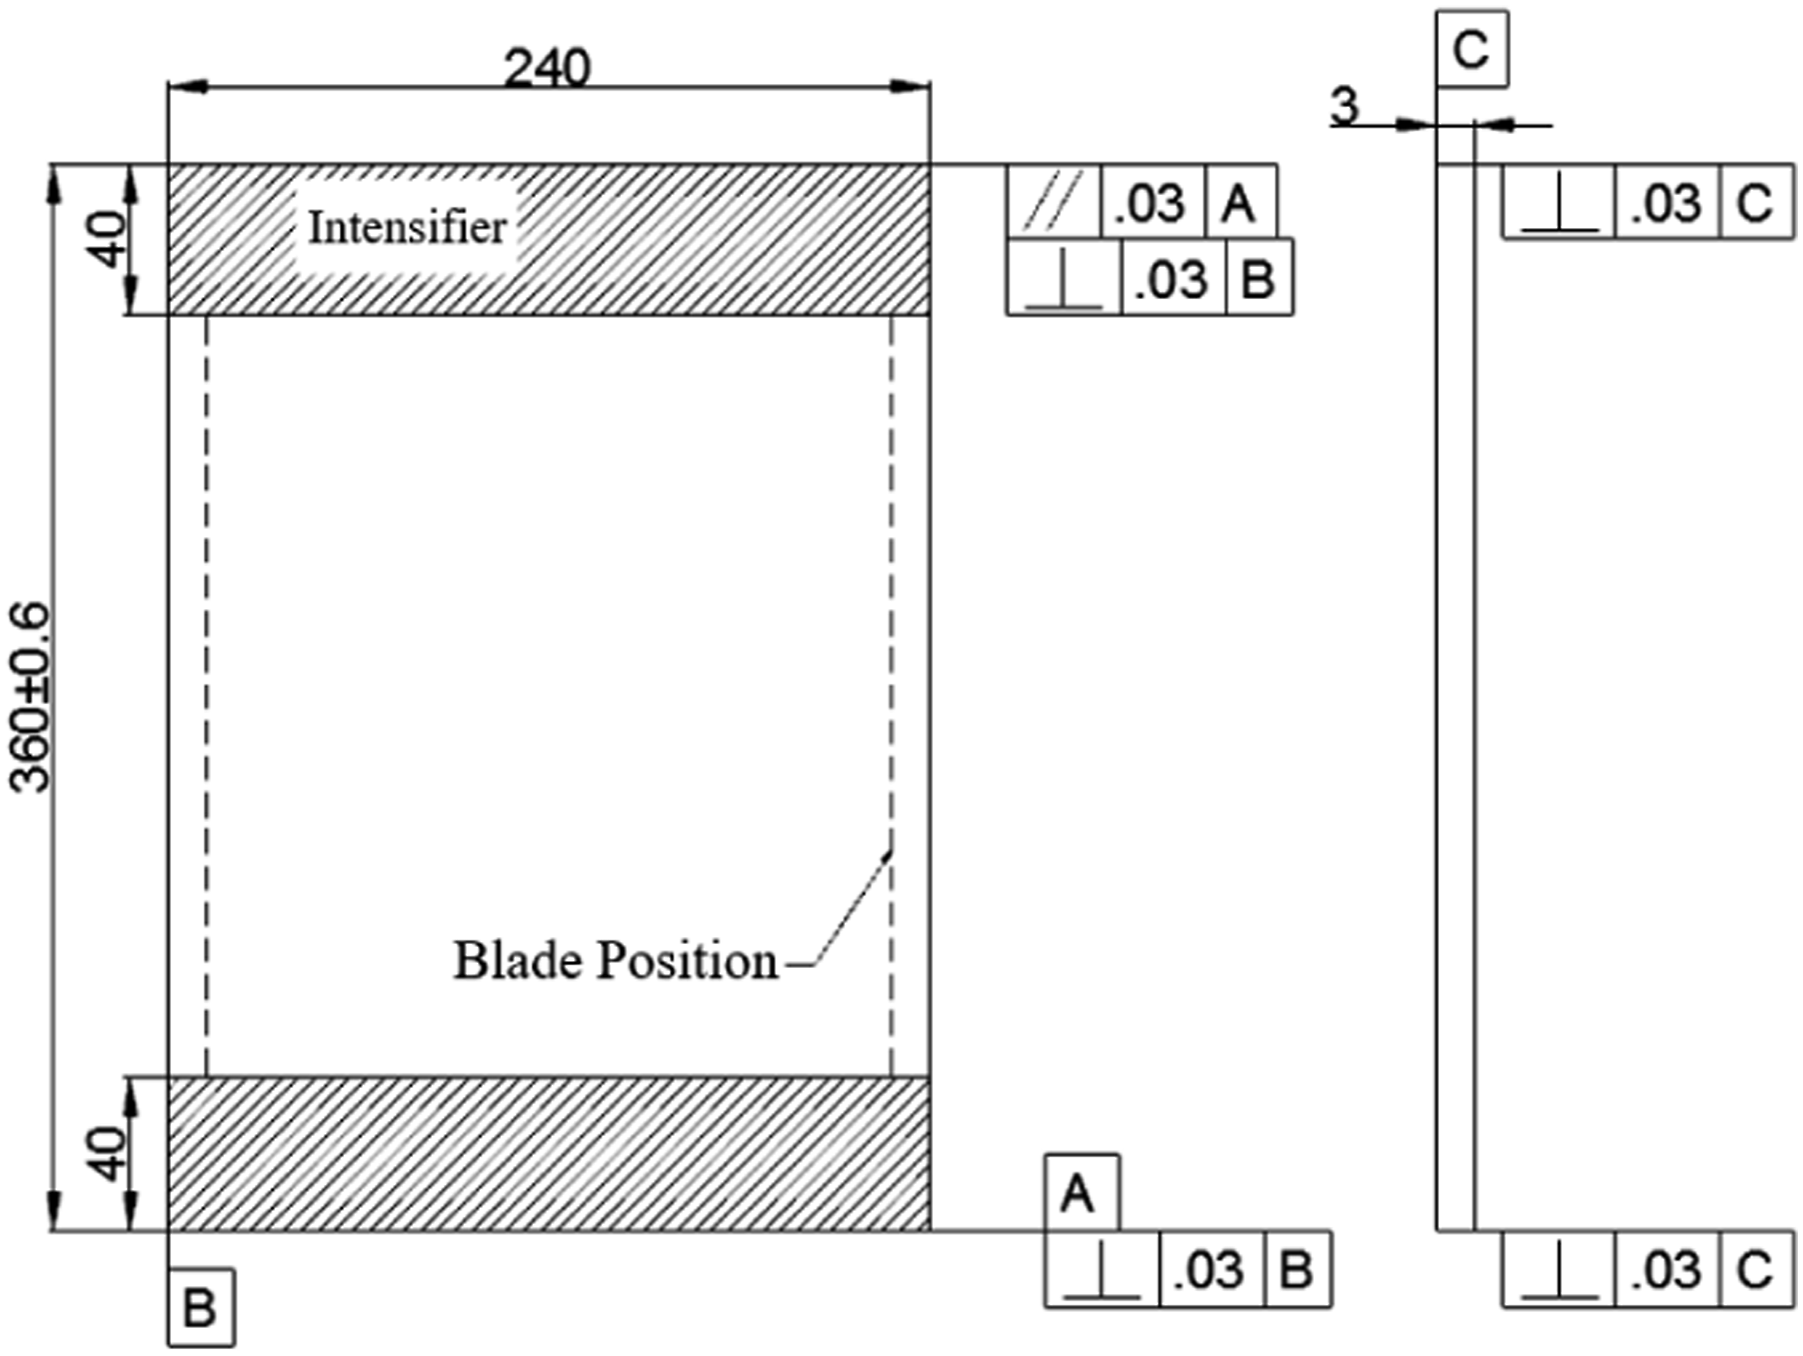
Preparation for compression testing of composite laminates with holes
To eliminate the potential impact of defects on the test results of laminate specimens, all specimens were inspected using ultrasonic scanning before testing to ensure that the structure around the holes was free from other defects. Due to the relatively large size of the specimens with holes, inspecting the entire laminate would be too time-consuming and costly. Furthermore, compression testing primarily focuses on the effect of structural weakening caused by circular holes on the compressive performance of laminates. Therefore, the defect inspection area was reduced to a smaller region of 100 mm × 100 mm around the holes to improve testing efficiency. The open-hole specimens (360 mm × 240 mm) are larger than standard CAI specimens to accommodate the 80 mm diameter hole while maintaining a ligament width of 80 mm on each side, avoiding premature edge failure. This larger size also provides results that are more representative of large-scale engineering structures, as discussed by Czarnocki.
29
Furthermore, the recently published ISO 12817:2025
30
standard for open-hole compression testing explicitly includes multiple test configurations, recognizing that specimen geometry may need to be adapted to specific practical requirements. The inspection results are shown in Figure 9. Nondestructive testing diagram of laminate specimens with holes.
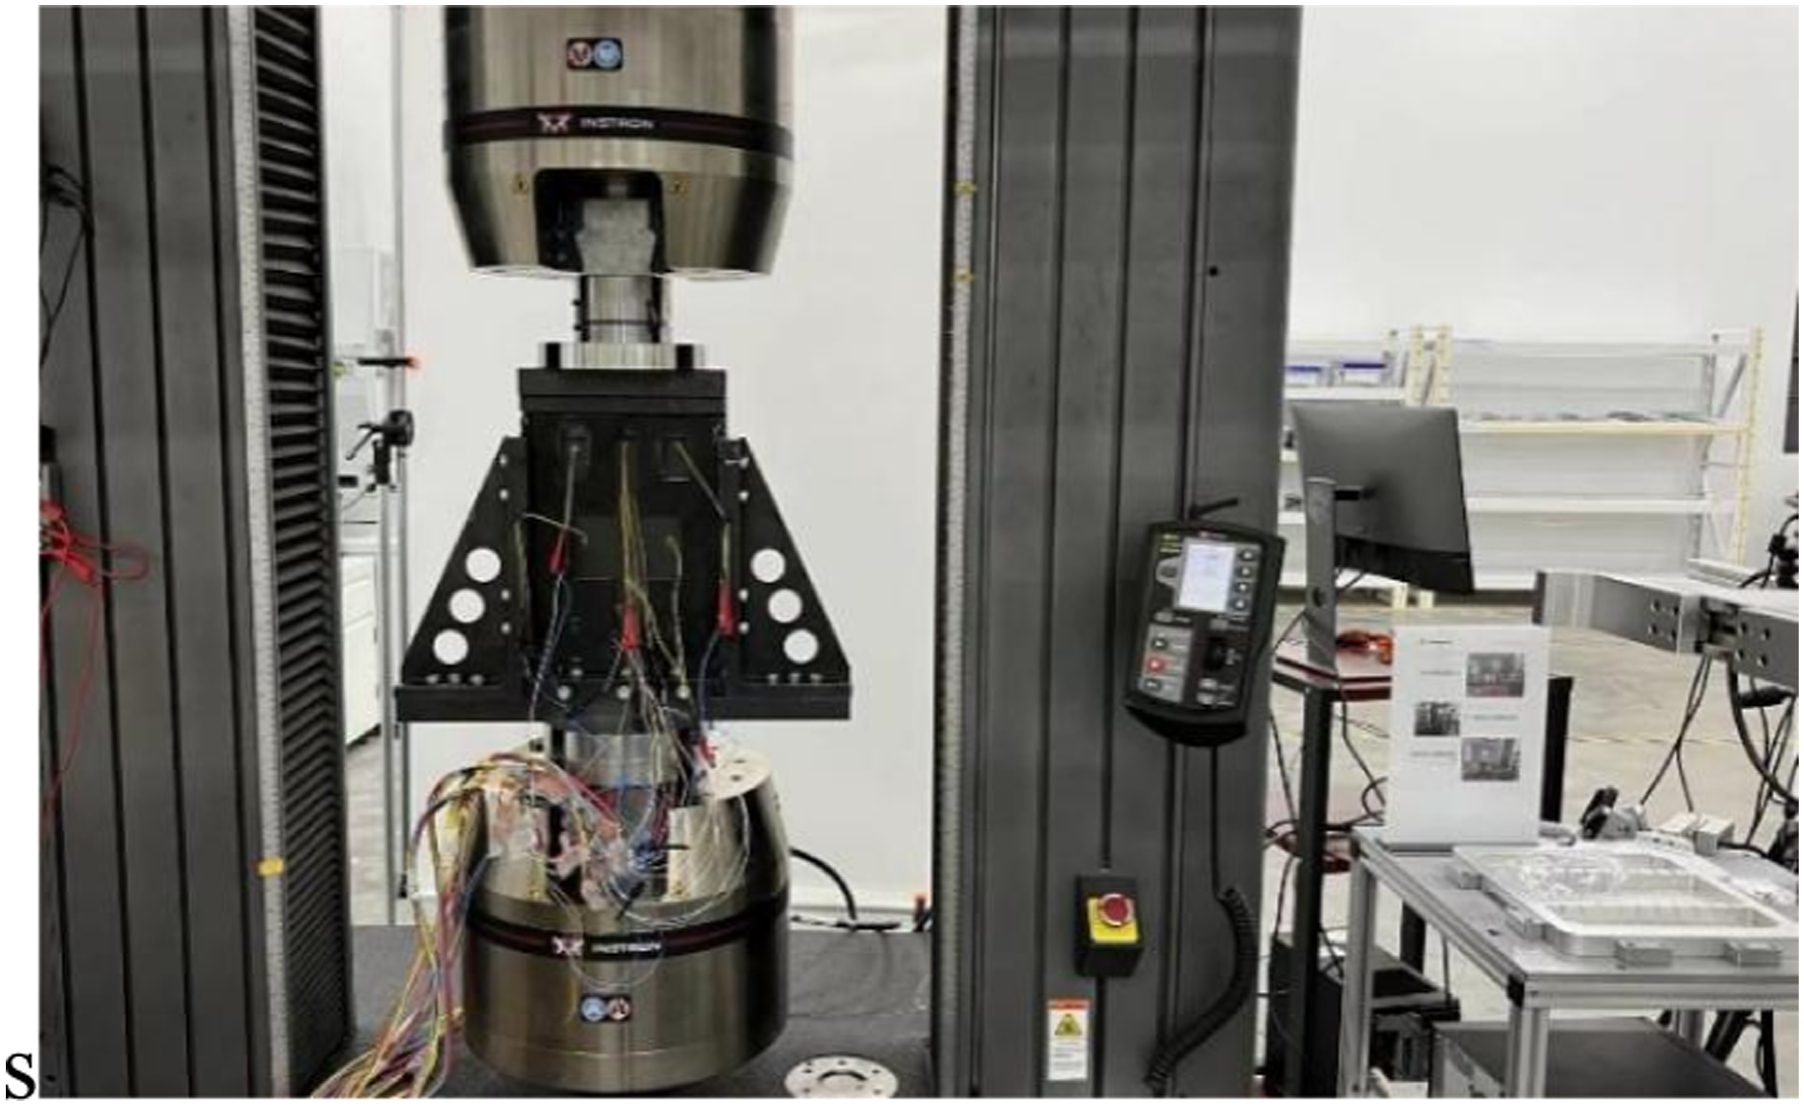
To verify that the holes did not cause local compressive performance variations, strain data around the holes were recorded during testing to analyze stress concentration. Preloading was applied to each specimen to ensure the assembly process met the standard requirements (Figures 10 and 11). Physical diagram of the compression test fixture for laminate specimens with hole. Physical diagram of the compression testing machine for laminate specimens with holes.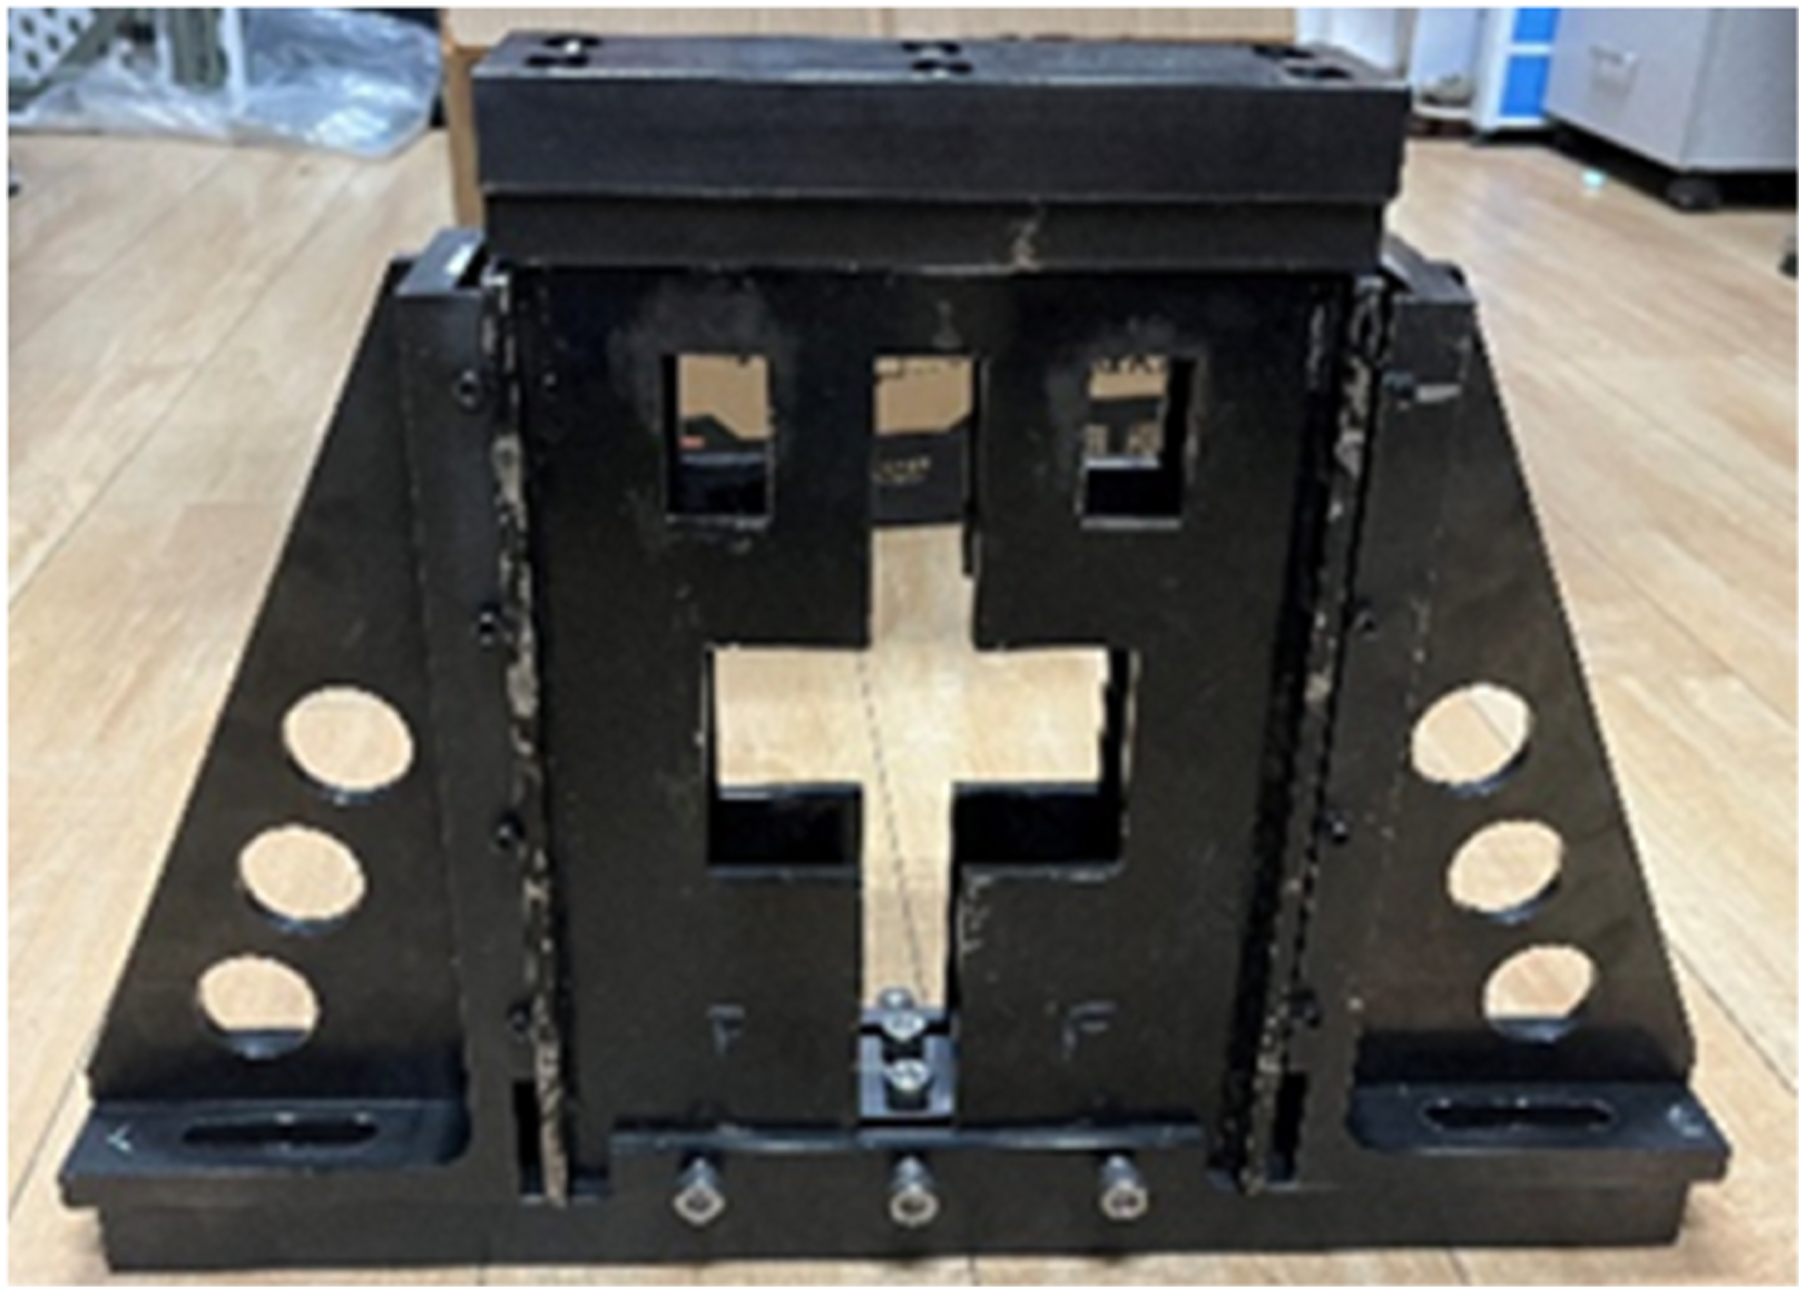
Simulation of compression failure of damaged composite laminates
To deeply analyze the failure mechanisms of damaged composite laminates and investigate the effects of damage size and location on the compressive performance, numerical simulation methods were used to study the compressive failure of damaged composite laminates. This chapter develops finite element models for two types of damaged composite laminate specimens, including three-dimensional finite element models of scratched laminates and laminates with holes of different sizes. Based on the ABAQUS finite element software, progressive damage analysis was conducted by combining the Hashin failure criteria and the Camanho degradation model. Fiber breakage, matrix damage, delamination, and other failure modes under compressive loading were obtained. The ultimate compressive loads were calculated for various damage scenarios. The numerical results were compared with experimental data to analyze the influence of damage parameters on the compressive performance of laminates.
Progressive damage analysis methods for composite materials
To provide a clear overview of the workflow from numerical modelling to result analysis, Figure 12 presents a flowchart of the present chapter and the subsequent chapter. As shown in the figure, this chapter focuses on the establishment of finite element models for scratched laminates and laminates with holes, including mesh generation, boundary conditions, and the implementation of the progressive damage model via a UMAT subroutine. The corresponding results, such as failure modes and ultimate loads, are then compared with experimental data in Chapter 4 to validate the numerical approach. The flowchart thus serves as a roadmap for the simulation and validation process described in the following sections. Flowchart of the numerical simulation and validation procedure for damaged composite laminates.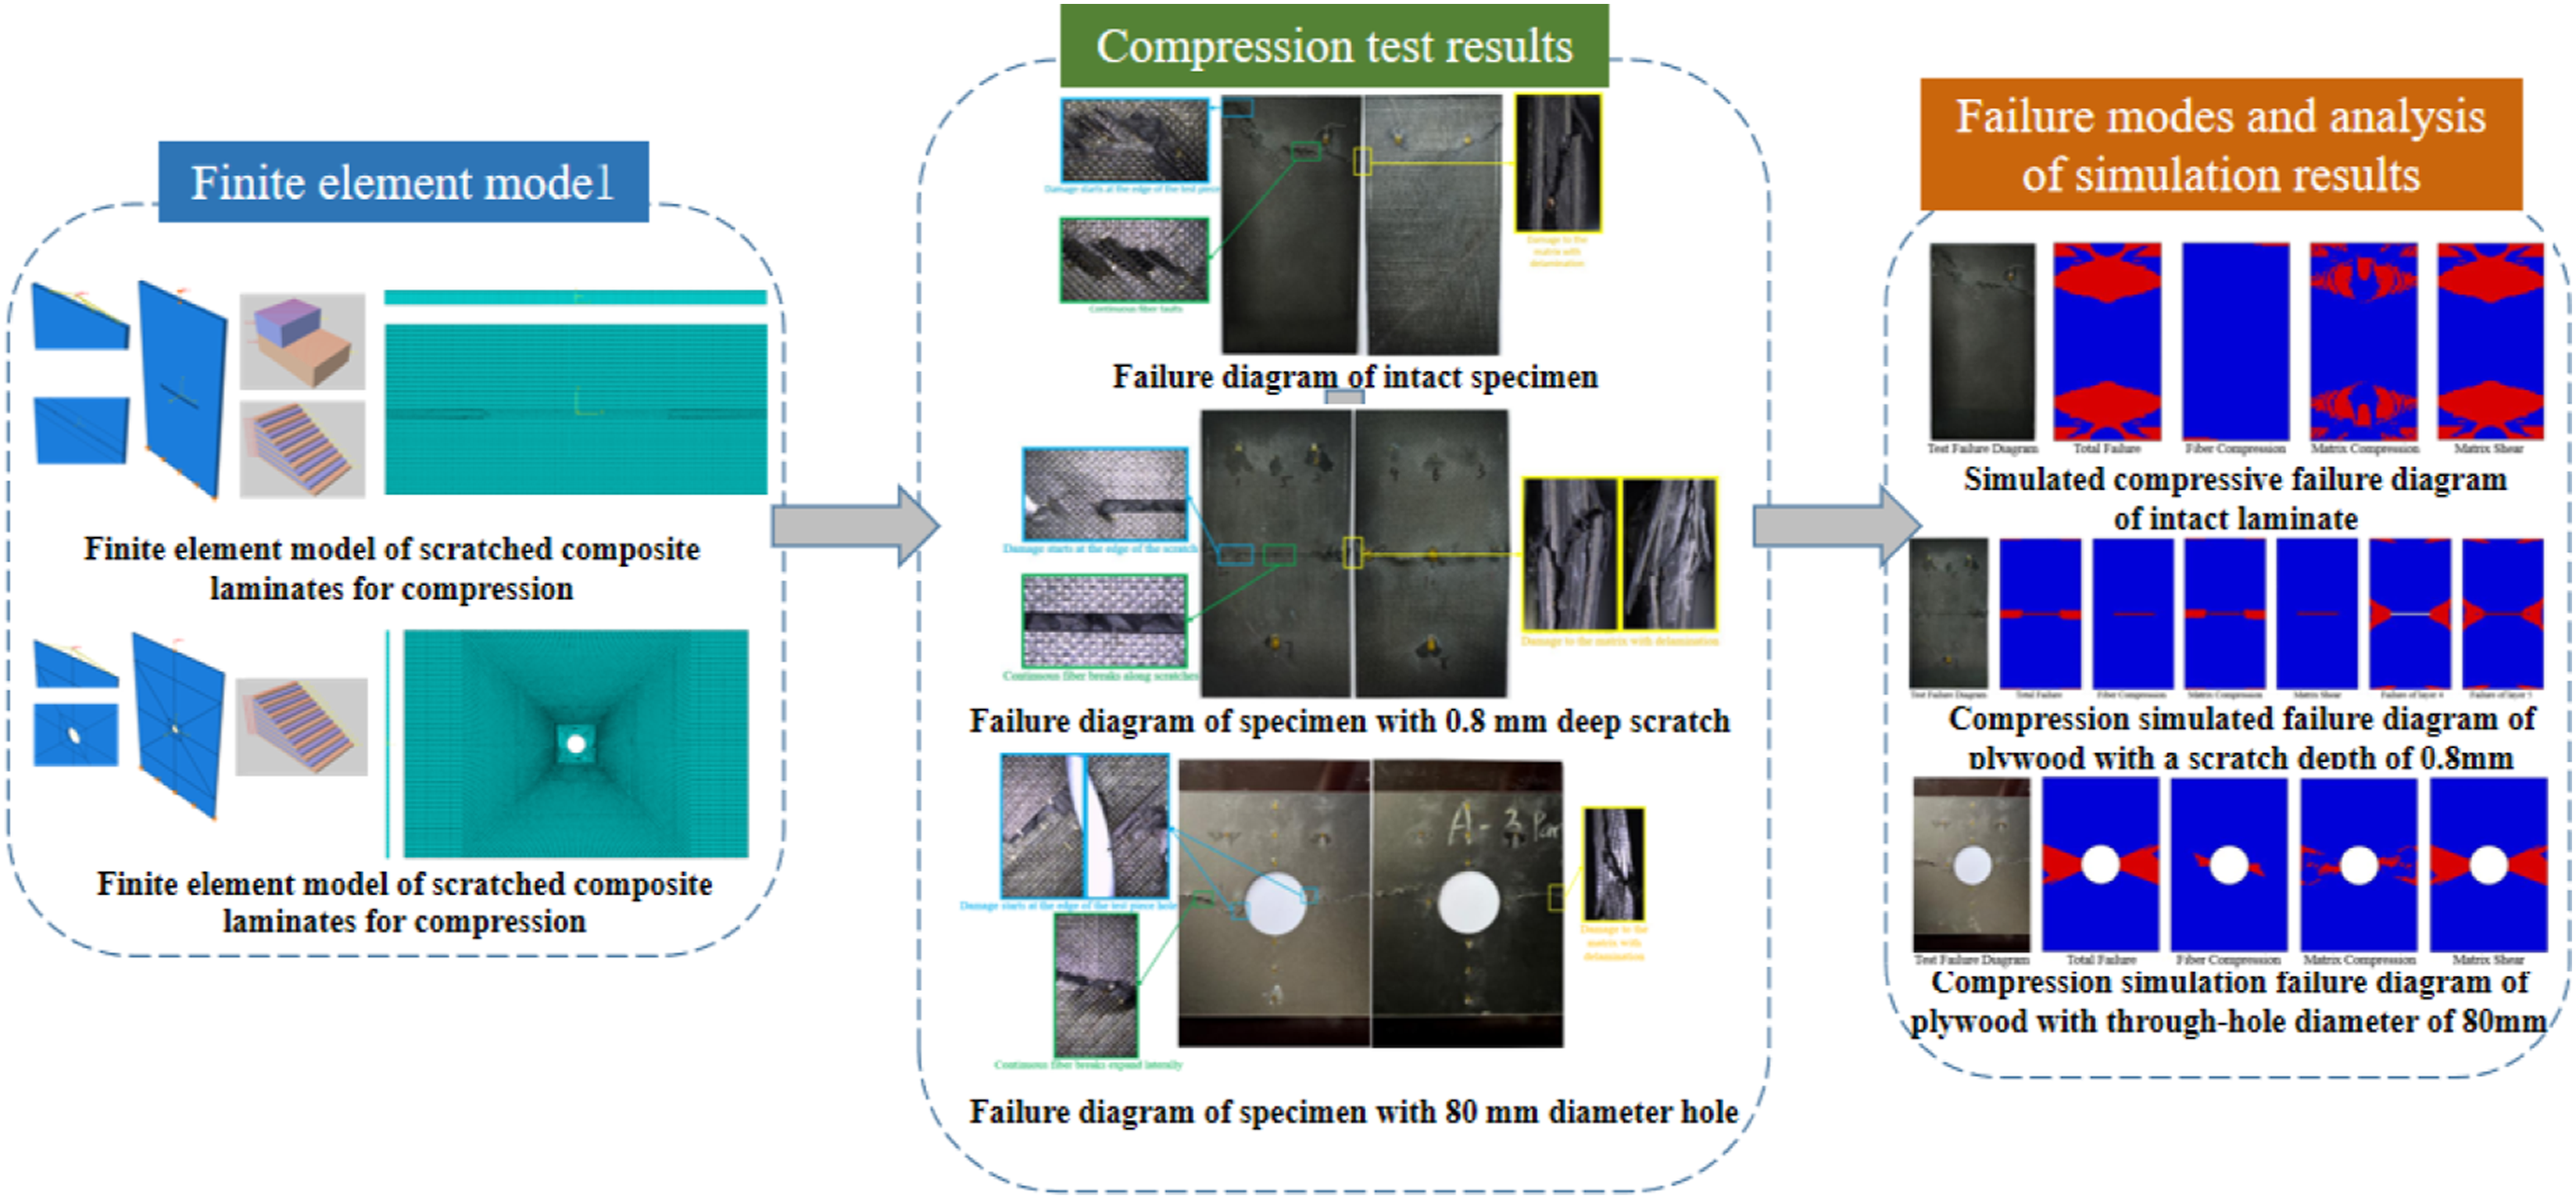
Failure criteria
The failure process of composite materials under compressive loading is complex. It may involve fiber breakage, matrix damage, and delamination. The Hashin failure criteria can accurately determine different failure modes. The failure process of composite materials is highly nonlinear. It is simulated step by step to reflect stress distribution and material degradation during failure.31–33
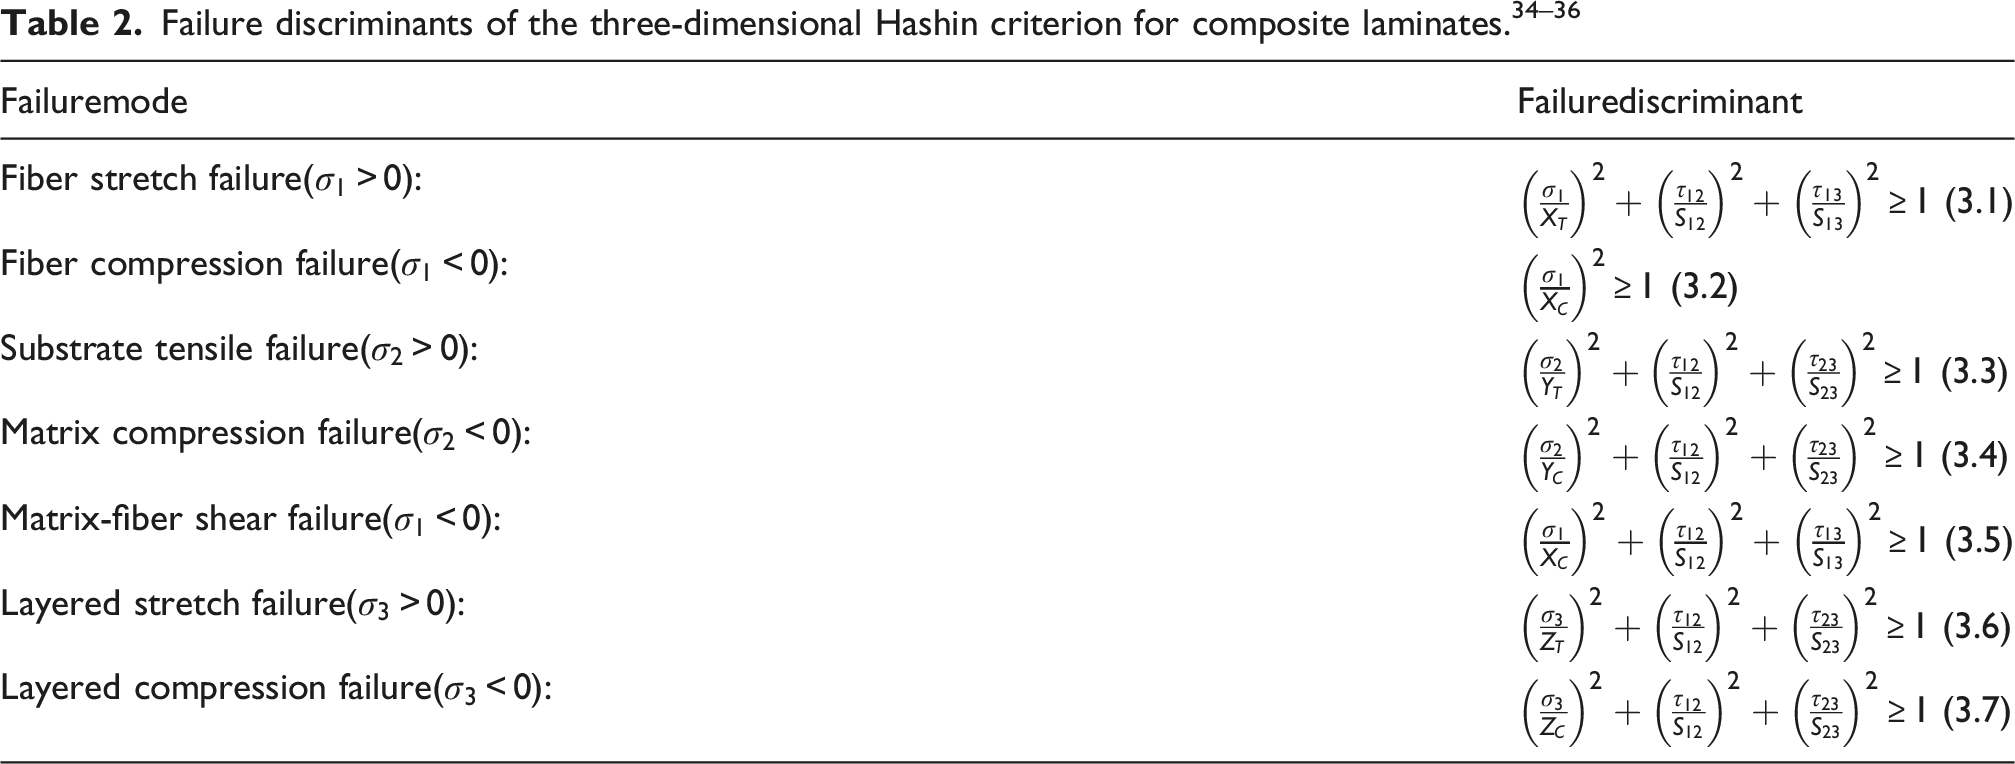
In Equations (3.1) to (3.7),
In practical applications, there also exists a certain stress distribution in the thickness direction of the laminate. This through-thickness stress distribution can also cause damage such as delamination. However, the two-dimensional form of the failure criterion cannot predict the initiation and propagation of such damage. Therefore, based on the two-dimensional failure criterion, Tserpes et al. introduced expressions for delamination and matrix-fiber shear failure by considering the stresses in the thickness direction, thereby further improving the Hashin criterion. The present study further refines the Hashin criterion on this basis. This set of well-established three-dimensional criteria is applied to the specific subject of scratched and holed laminates, accompanied by a complete and rigorous experimental validation.
These equations divide the stress distribution in different regions of the composite material. Failure modes are determined based on the actual internal stress state of the material. The validity and accuracy of this modified criterion are demonstrated in the Results and discussion section, where the simulated ultimate loads and failure modes are compared with experimental results (Tables 10 and 11; Figures 16–27). Figure 13 illustrates the flowchart for failure analysis based on the Hashin criteria. Computational flowchart using UMAT.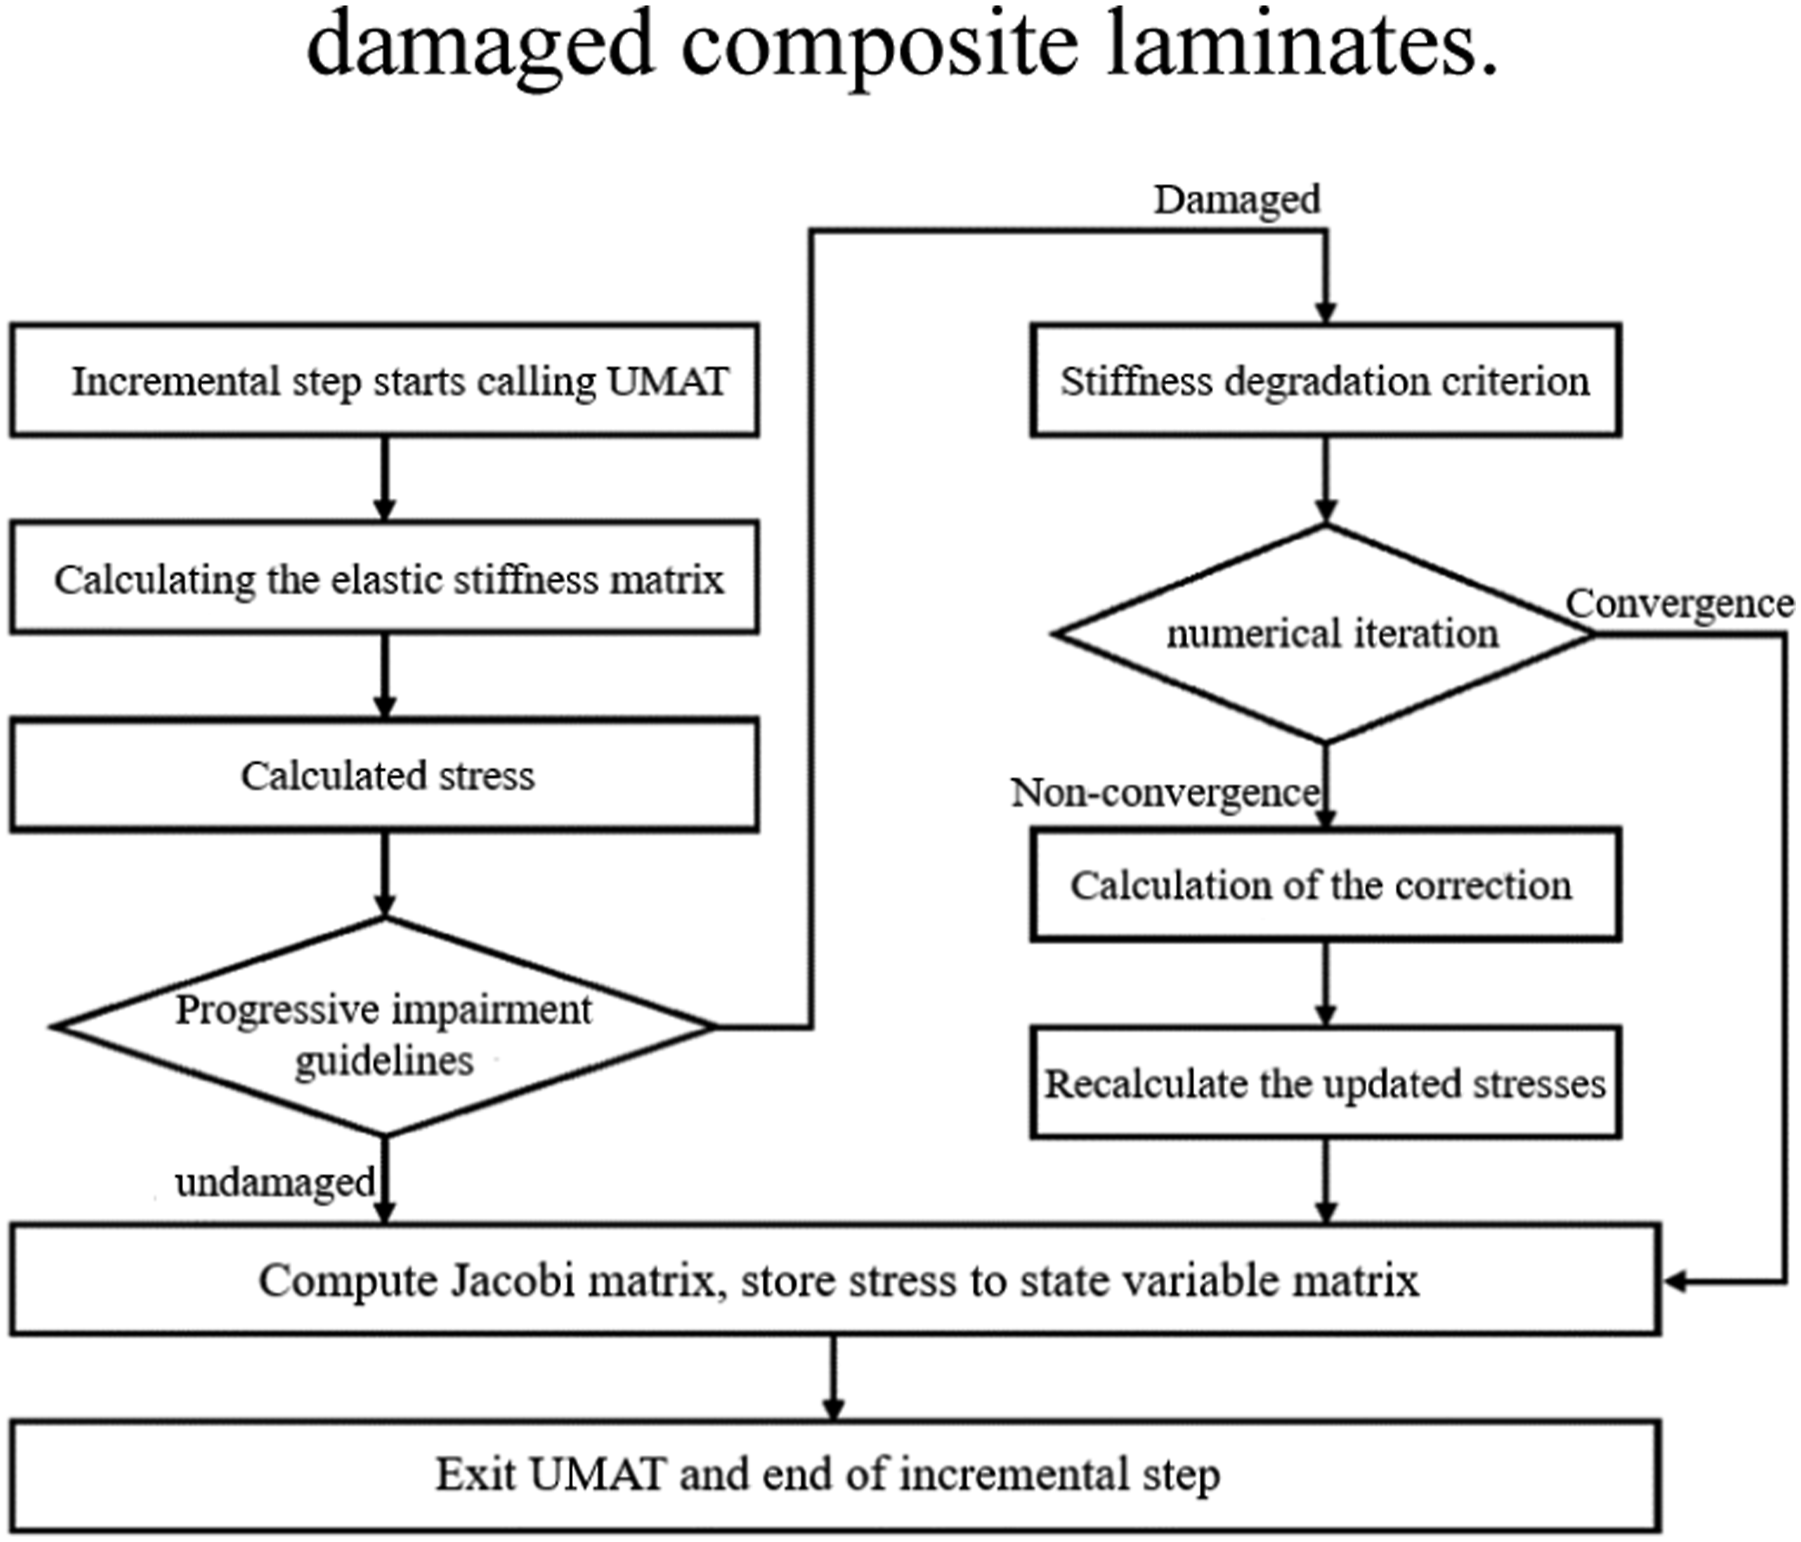
Material degradation model
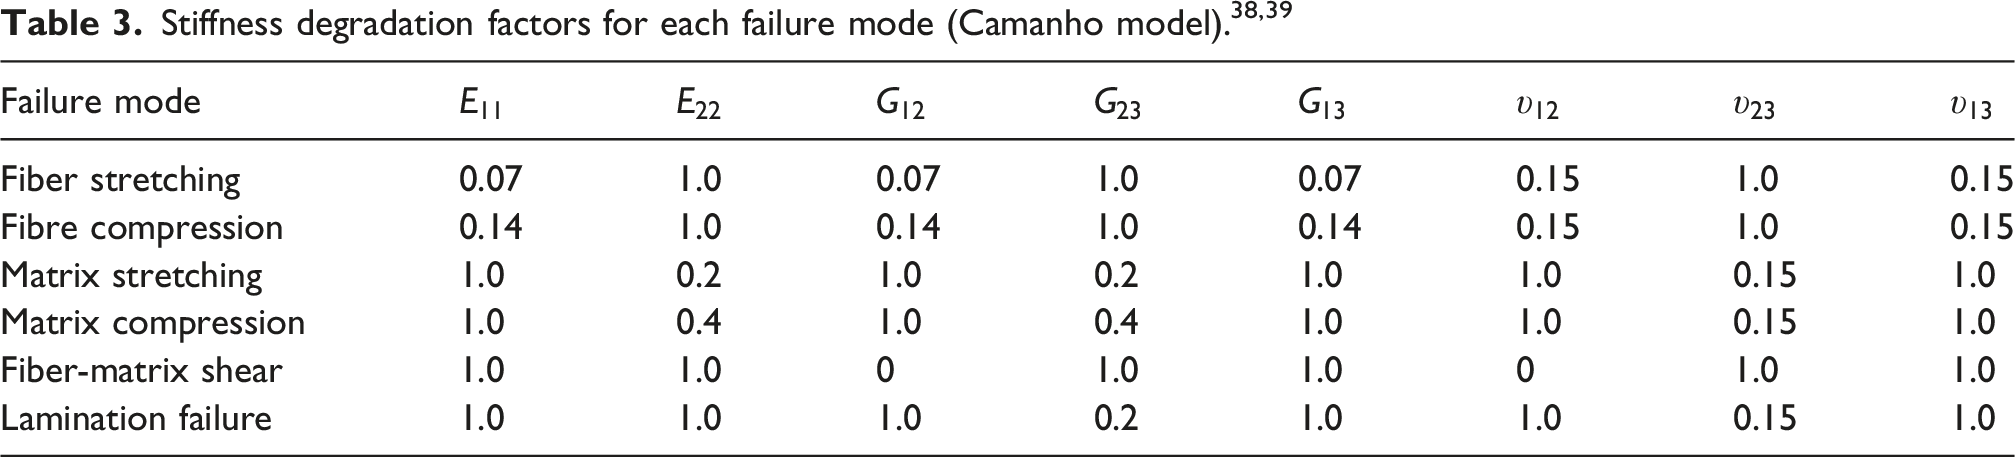
During the calculation process, to prevent the stiffness matrix from becoming singular, cases where material properties degrade to zero are replaced with a very small value. In this study, the value is set to
Simulation of compressive failure in scratched laminates
Finite element model of scratched laminates
A geometric model corresponding to the scratched composite laminate specimens in Chapter 2 was established. This model is shown in Figure 14(a). Compression loads were applied by coupling a reference point to the loading end face. Fixed boundary conditions were imposed on the opposite end. Non-uniform thickness of the laminate caused issues in directly applying composite layups to the component model. Errors in layup compression were observed near the pre-existing scratch, which did not reflect actual conditions. To address this issue, the laminate was divided into two sections along the thickness direction at the scratch depth. The upper section consisted of 2, 4, or 6 plies containing the scratch. The lower section was a scratch-free region with an equal thickness of 13, 11, or 9 plies. Material parameters were defined as ZT7H3194U/QY9512. The layup angles were specified according to the A-layup configuration. Finite element model and mesh of scratched composite laminate.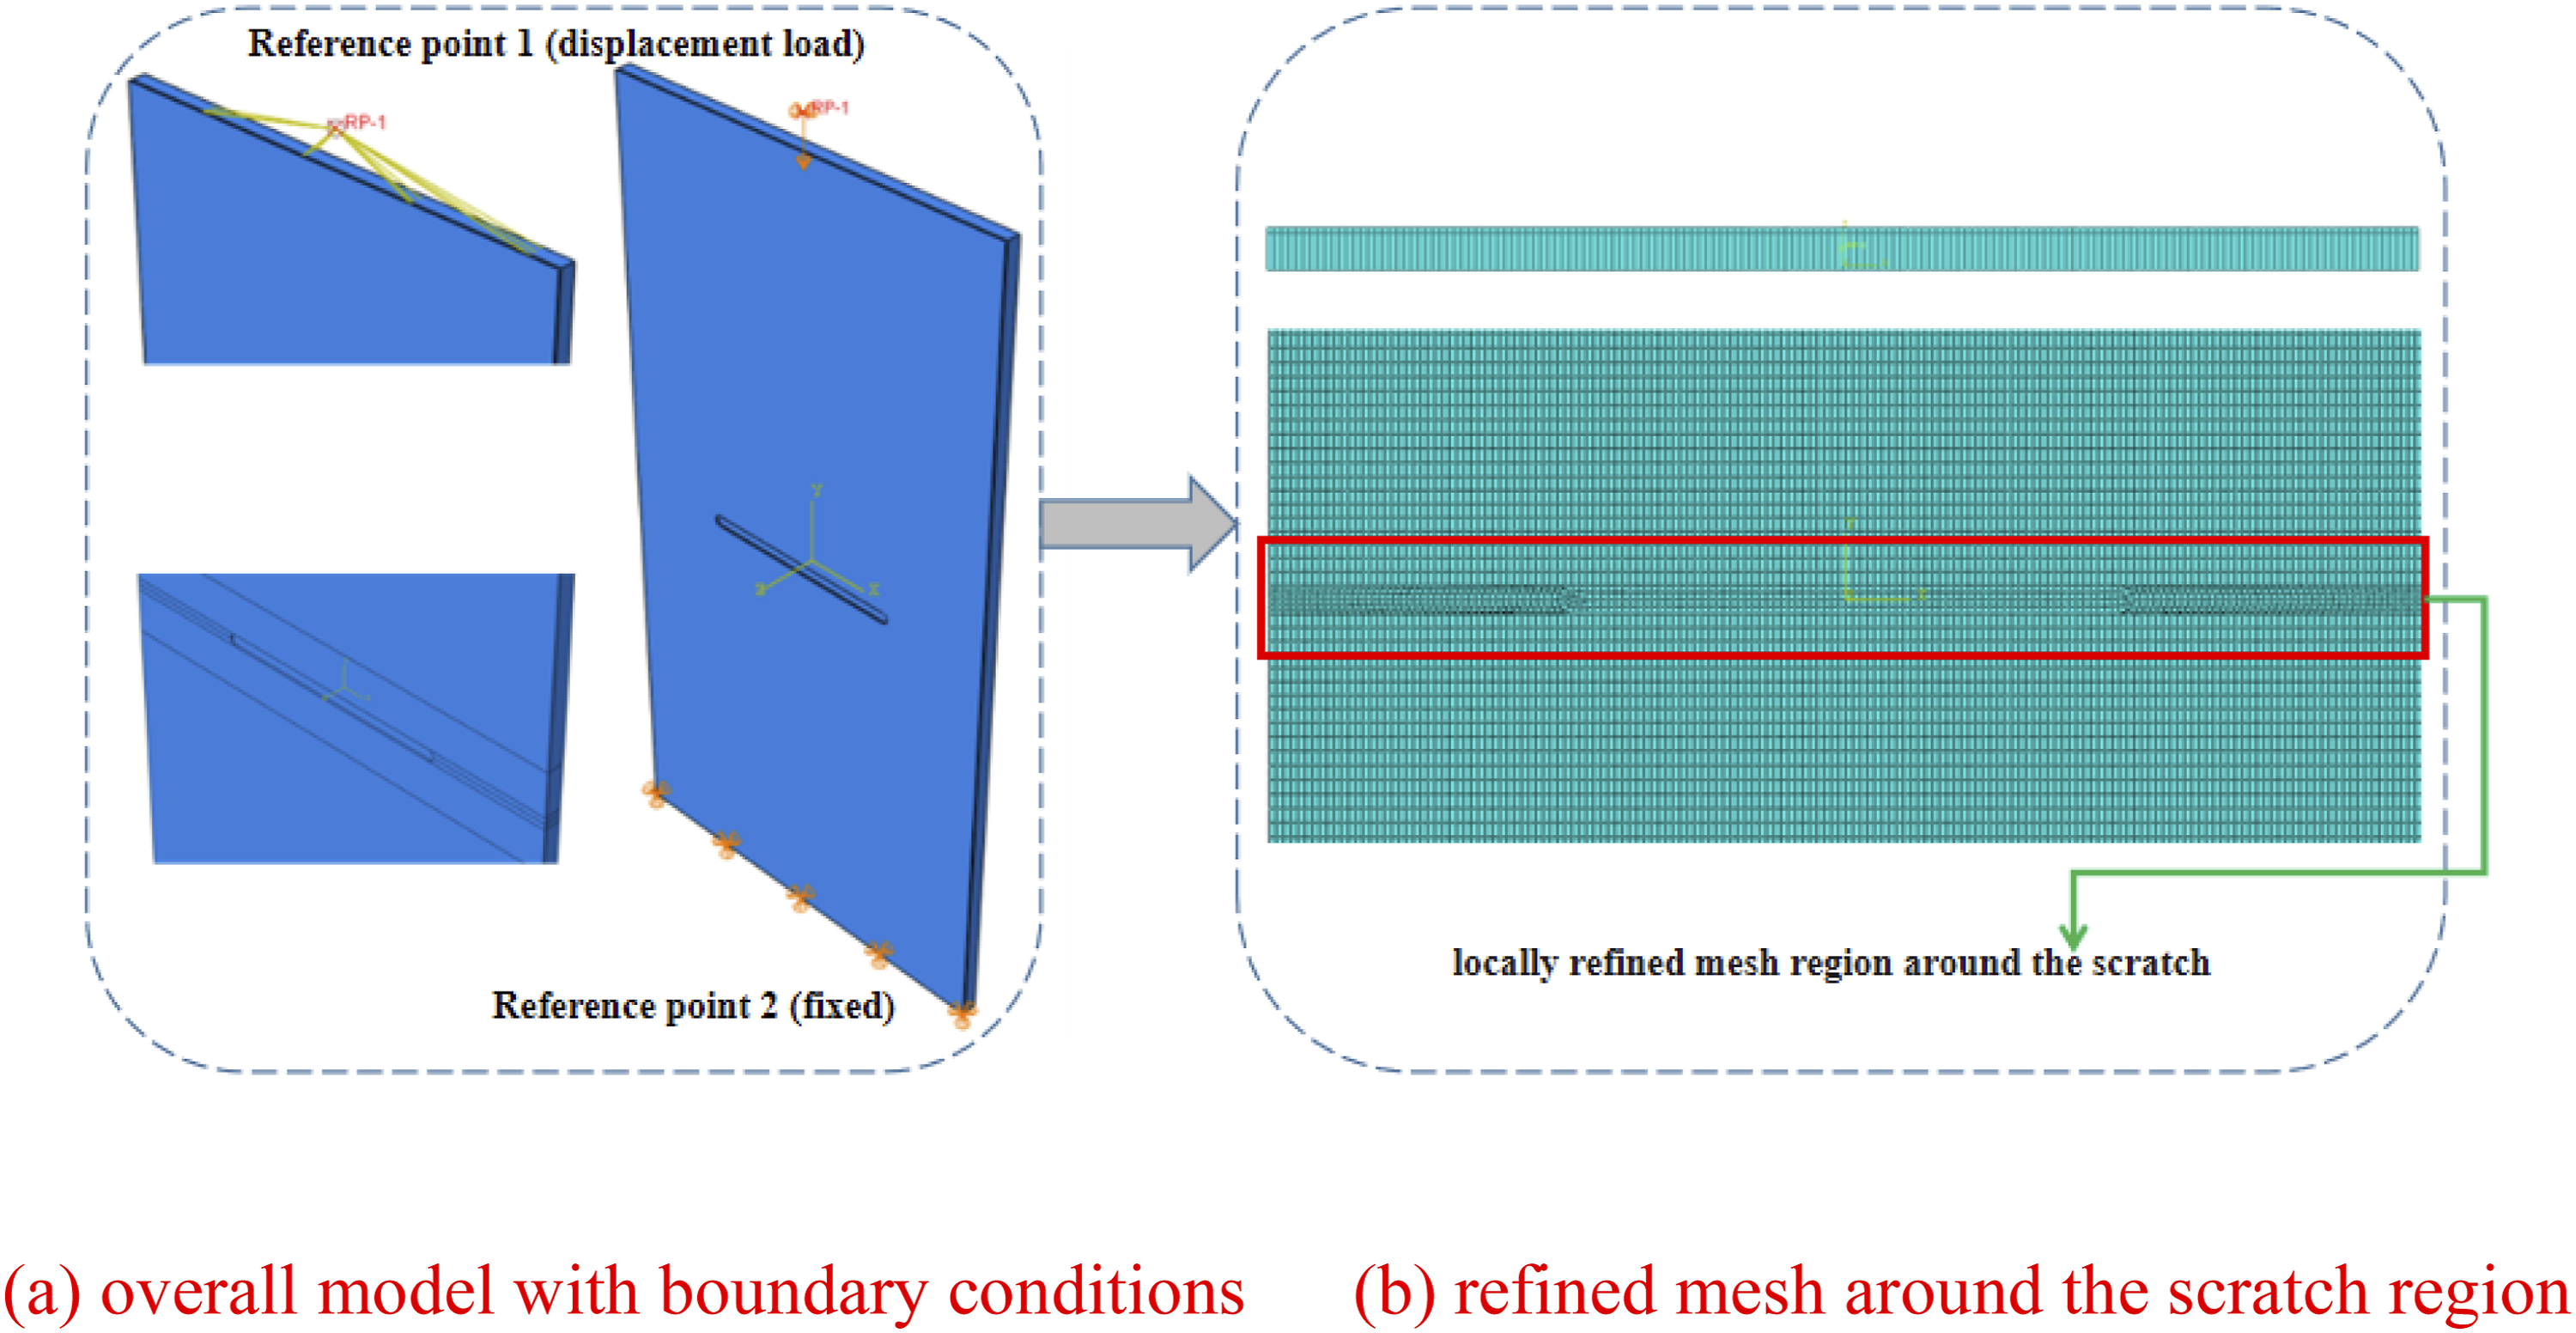
The Figure 14(b) illustrates the mesh division at the scratch region and through the thickness of the scratched composite laminate. Refined meshing was applied to the scratch region to ensure computational accuracy. The number of elements varied depending on the damage size. For the specimen with a 0.8 mm deep scratch at the middle position, a total of 49,335 elements were used. C3D8R hexahedral solid elements were employed, with enhanced hourglass control implemented.
Material properties of ZT7H3194U/QY9512.
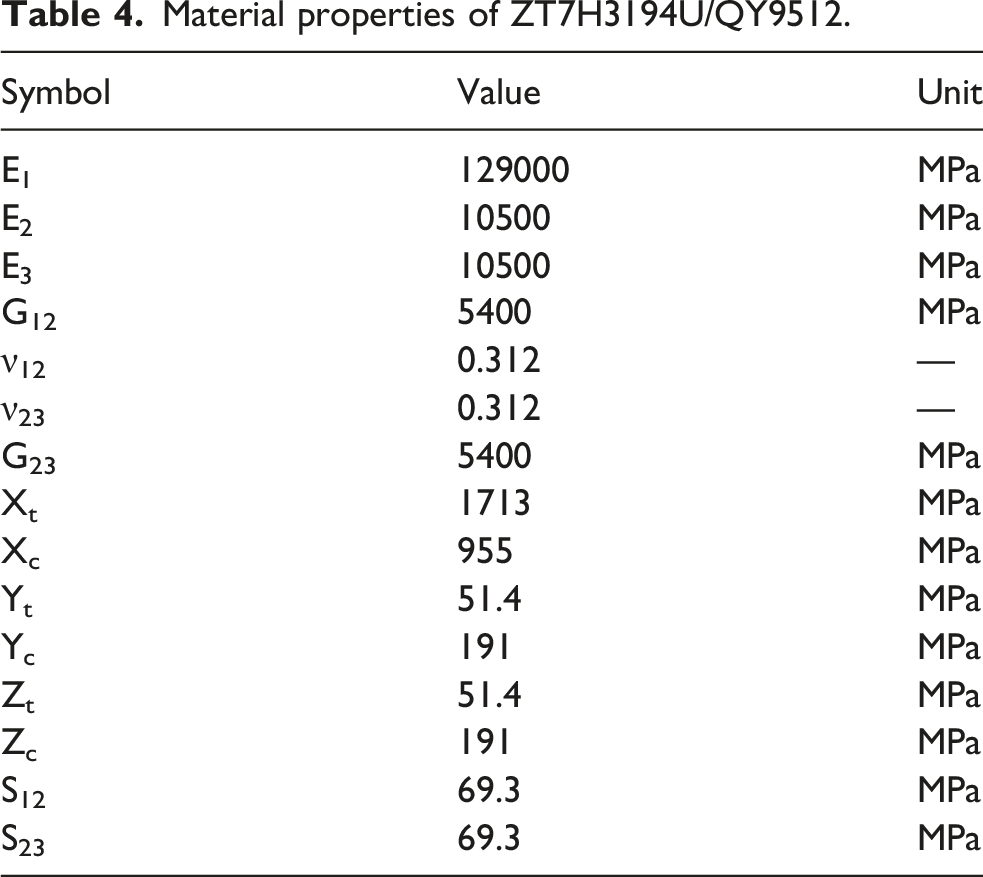
The constitutive relationship of the material was defined using the user-defined material subroutine UMAT in ABAQUS. The through-thickness strength parameters (Zt, Zc, S13, S23) are not independent; they are equivalently determined from the in-plane properties using the transversely isotropic assumption (Zt = Yt, Zc = Yc, S13 = S23 = S12). This is a common and physically reasonable simplification for unidirectional carbon/epoxy composites.34–36 Incremental step analysis was performed to apply loads and degrade material properties. Displacement loads were applied, and the data of nodal displacement and reaction forces over time were output. Load-displacement curves were plotted, and the peak value was extracted as the compressive ultimate load. Solution-dependent state variables (SDV) were used to define failure modes such as fiber tension, fiber compression, and matrix damage. Upon completion of the analysis, failure contours were generated to evaluate the failure modes of the laminate. The simulated compressive ultimate loads and failure modes obtained from this model are compared with experimental results in the Failure modes and analysis of simulation results for scratched laminates section.
Mesh convergence study for the center-scratched laminate with a scratch depth of 0.8 mm.

C3D8R elements with enhanced hourglass control were used for all analyses. The mesh was refined around the scratch region (refined size approximately 0.8 mm), with a global element size of approximately 3.0 mm. In the thickness direction, each ply was represented by one element (0.2 mm). A static analysis with automatic incrementation was used. The initial increment size was 0.05, with a minimum of 1 × 10⁻⁸ and a maximum of 0.1. The convergence criteria followed the default ABAQUS settings for static analysis. The upper and lower sections of the scratched laminate were merged into a single part, ensuring mesh continuity across the interface.
Simulation of compressive failure in laminates with holes
Failure modes and analysis of simulation results
A finite element model corresponding to the laminates with holes described in Chapter 2 was developed, as shown in Figure 15(a). The model includes two types of laminates, A and B, based on different ply configurations, and uses the ZT7H3194U/QY9512 material properties. One end of the laminate was fixed, while the other end applied displacement loading through a reference point to simulate compression. Finite element model and mesh of holed composite laminate.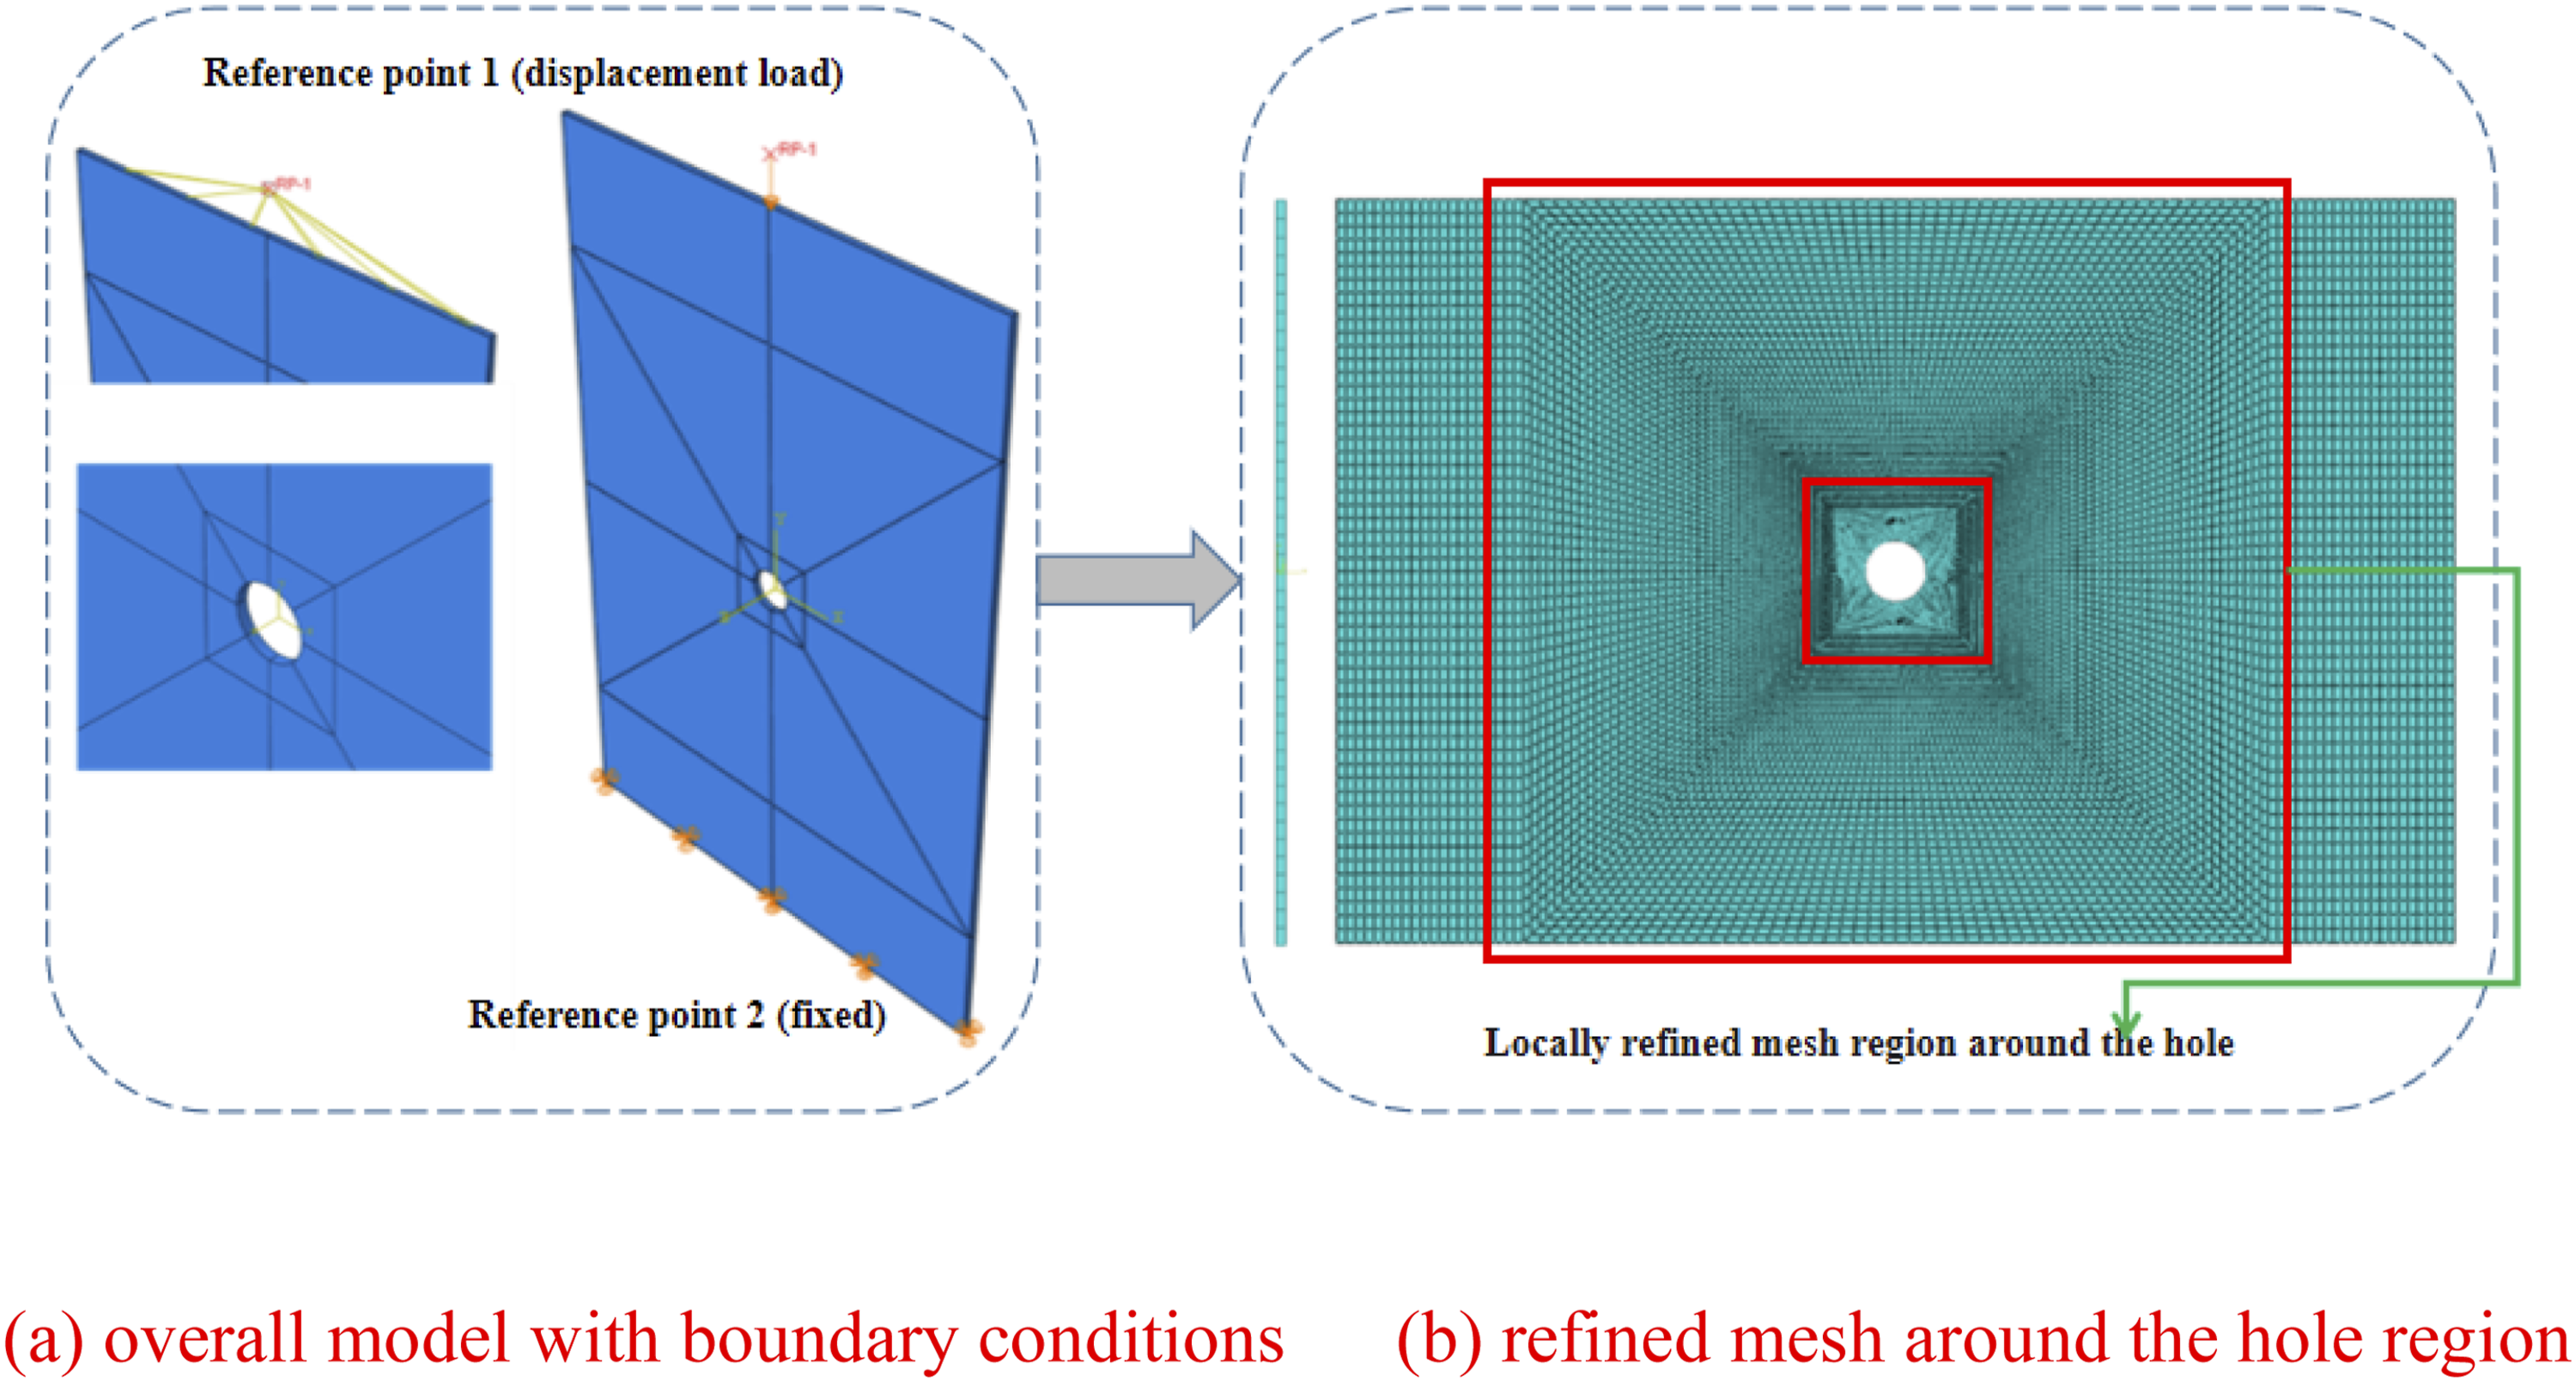
The reference point was connected to the loading surface, ensuring proper transfer of compressive loading. The mesh was created using C3D8R elements, with enhanced hourglass control properties. The mesh density around the hole edges was refined to improve damage prediction accuracy, as shown in Figure 15(b). Three hole diameters were considered: 20 mm, 50 mm, and 80 mm. Mesh refinement around the hole edges was performed to capture localized damage during compression. Displacement-controlled loading was applied, and load-displacement curves were extracted to determine the ultimate compressive loads for specimens with different hole diameters. The simulation results, including ultimate loads and damage contours, are validated against experimental data in the Failure modes and analysis of simulation results for holed laminates section.
Results and discussion
Compression test results of scratched composite laminates
As shown in Figure 16, composite laminate specimens with scratches at the middle position were subjected to compressive load. The failure mode for all specimens was large-scale delamination. Fiber protrusions and matrix damage appeared on both sides of the surface layers. The cracks were mostly linear. For the specimen with a 0.4 mm deep scratch (Figure 16(b)), failure occurred at the upper end of the specimen. Cracks expanded from the top-left corner to the other end of the laminate, leading to overall failure. Compared to the relatively intact specimen, the 0.4 mm deep pre-made scratch had little effect on the failure mode. No obvious damage was observed in the scratched area. In contrast, specimens with 0.8 mm (Figure 16(c)) and 1.2 mm (Figure 16(d)) deep scratches showed clear failure at the location of the pre-made scratch. When compressive load was applied, the side with the pre-made scratch experienced extrusion due to material defects. Tensile stress started to appear on the opposite side. The specimen thickness at the scratch location was thinner. Fiber breakage and delamination occurred first. With increasing bending stress, damage spread along the pre-made scratch line, leading to complete failure of the specimen. These results show that shallow pre-made scratches have a negligible effect on the overall performance of composite laminates. However, when the scratch depth exceeds a certain threshold, such damage becomes a critical factor affecting the compressive load-bearing capacity of the laminate. Compressive failure diagram of composite laminates with centered pre-existing scratches.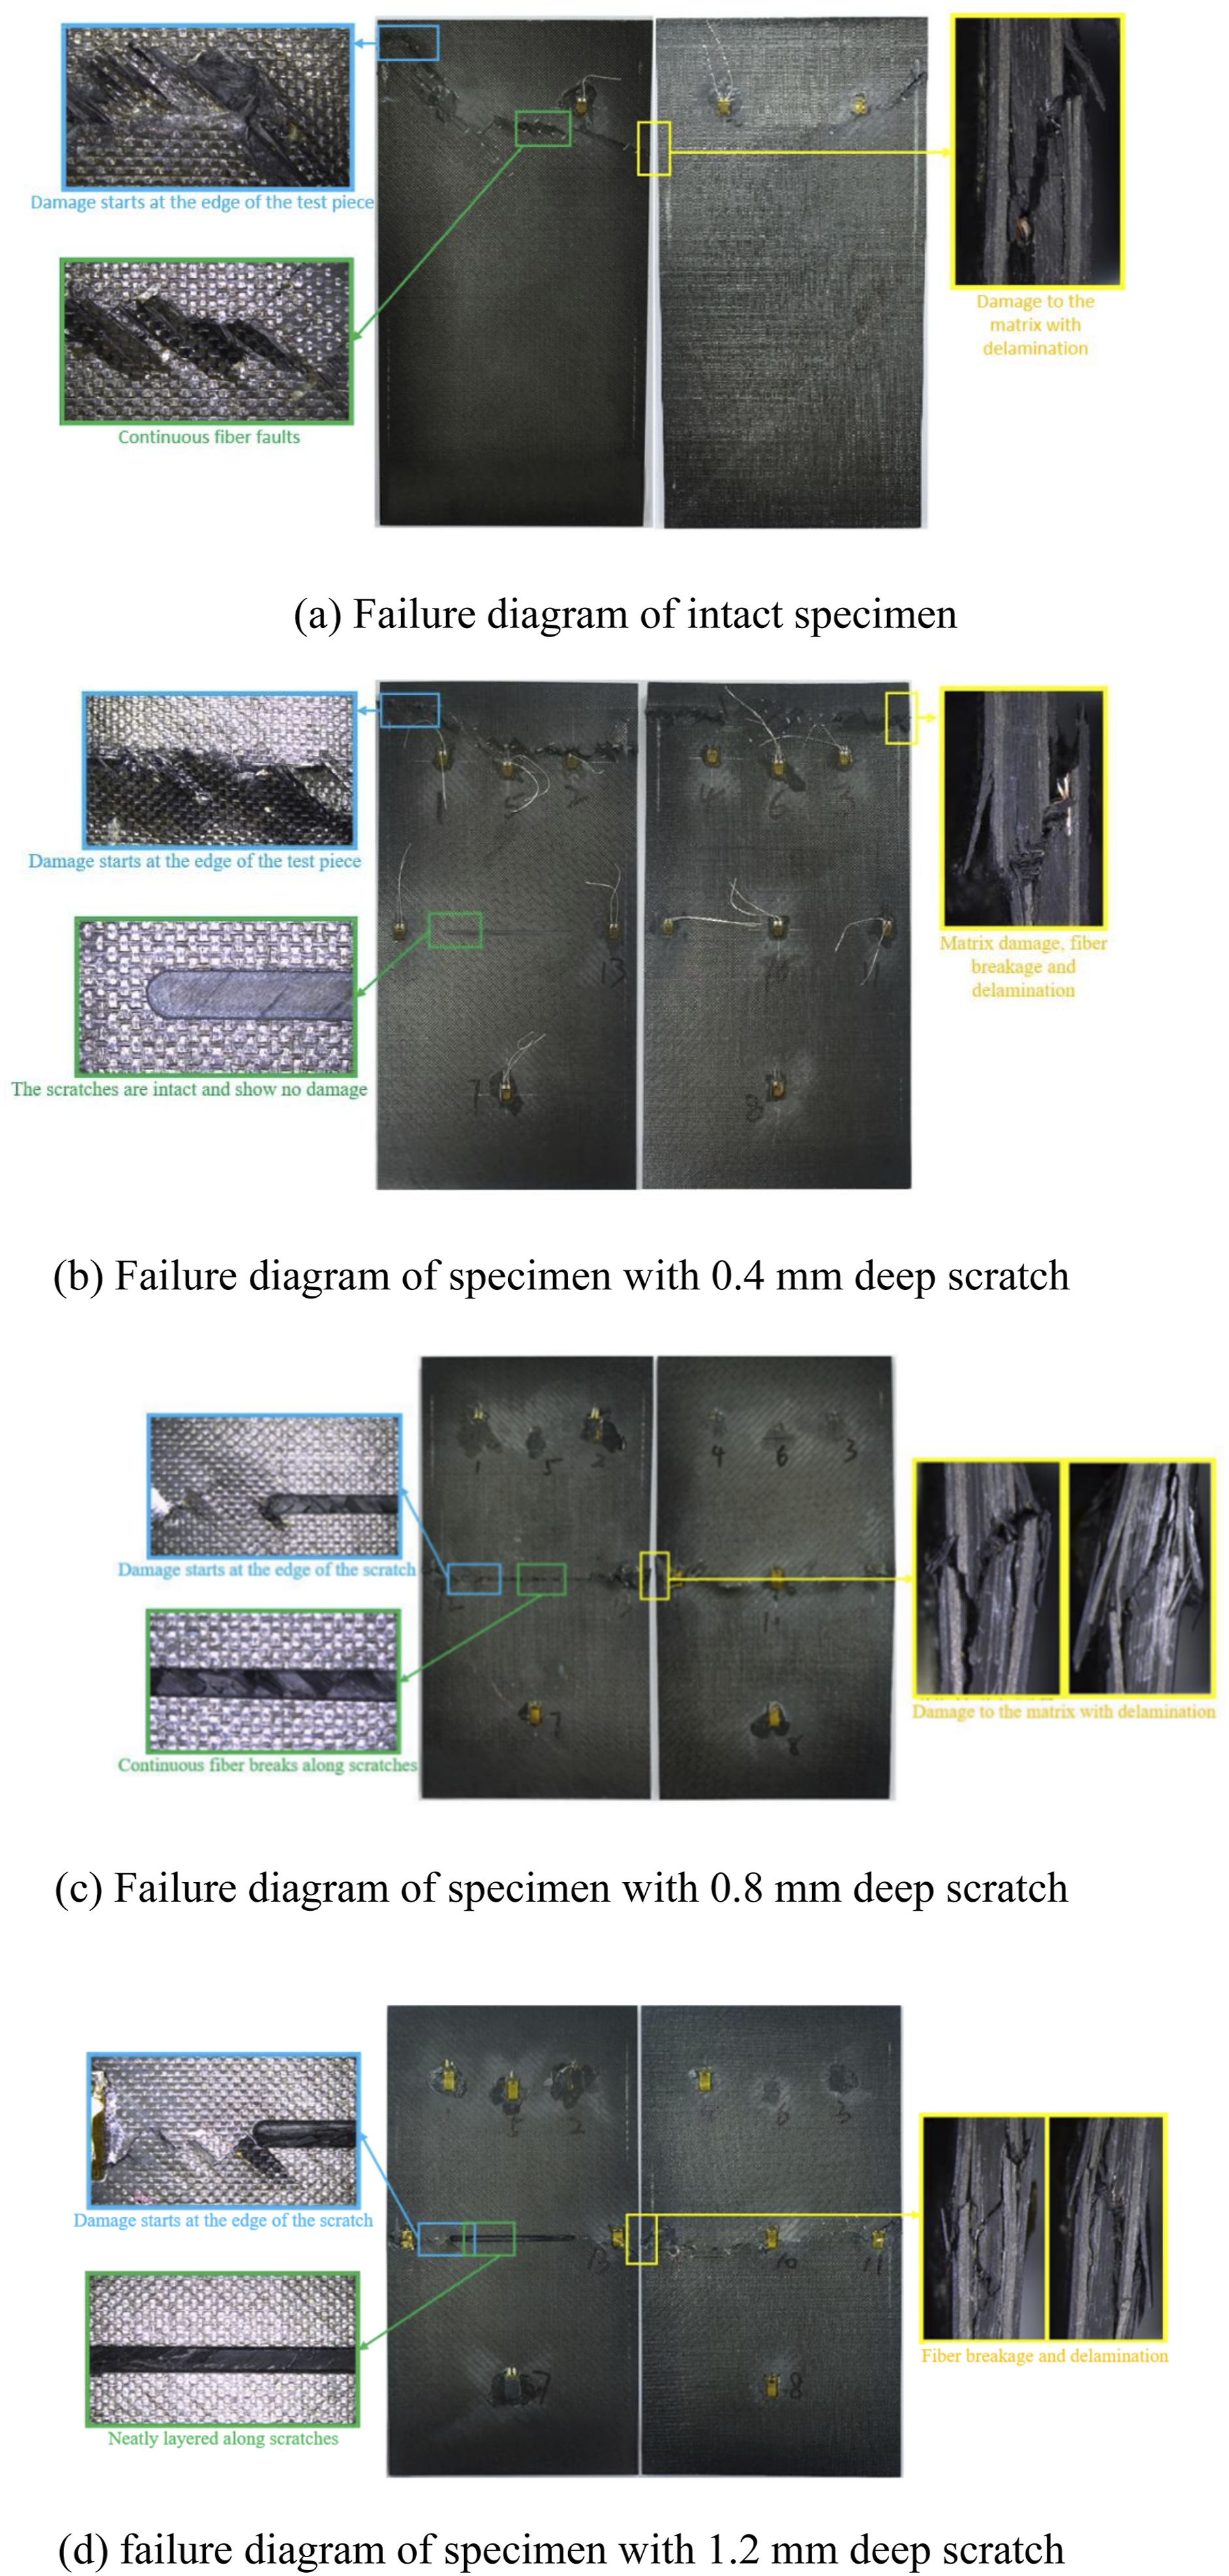
Ultimate compressive load of laminate specimens with centered pre-scratched damage.
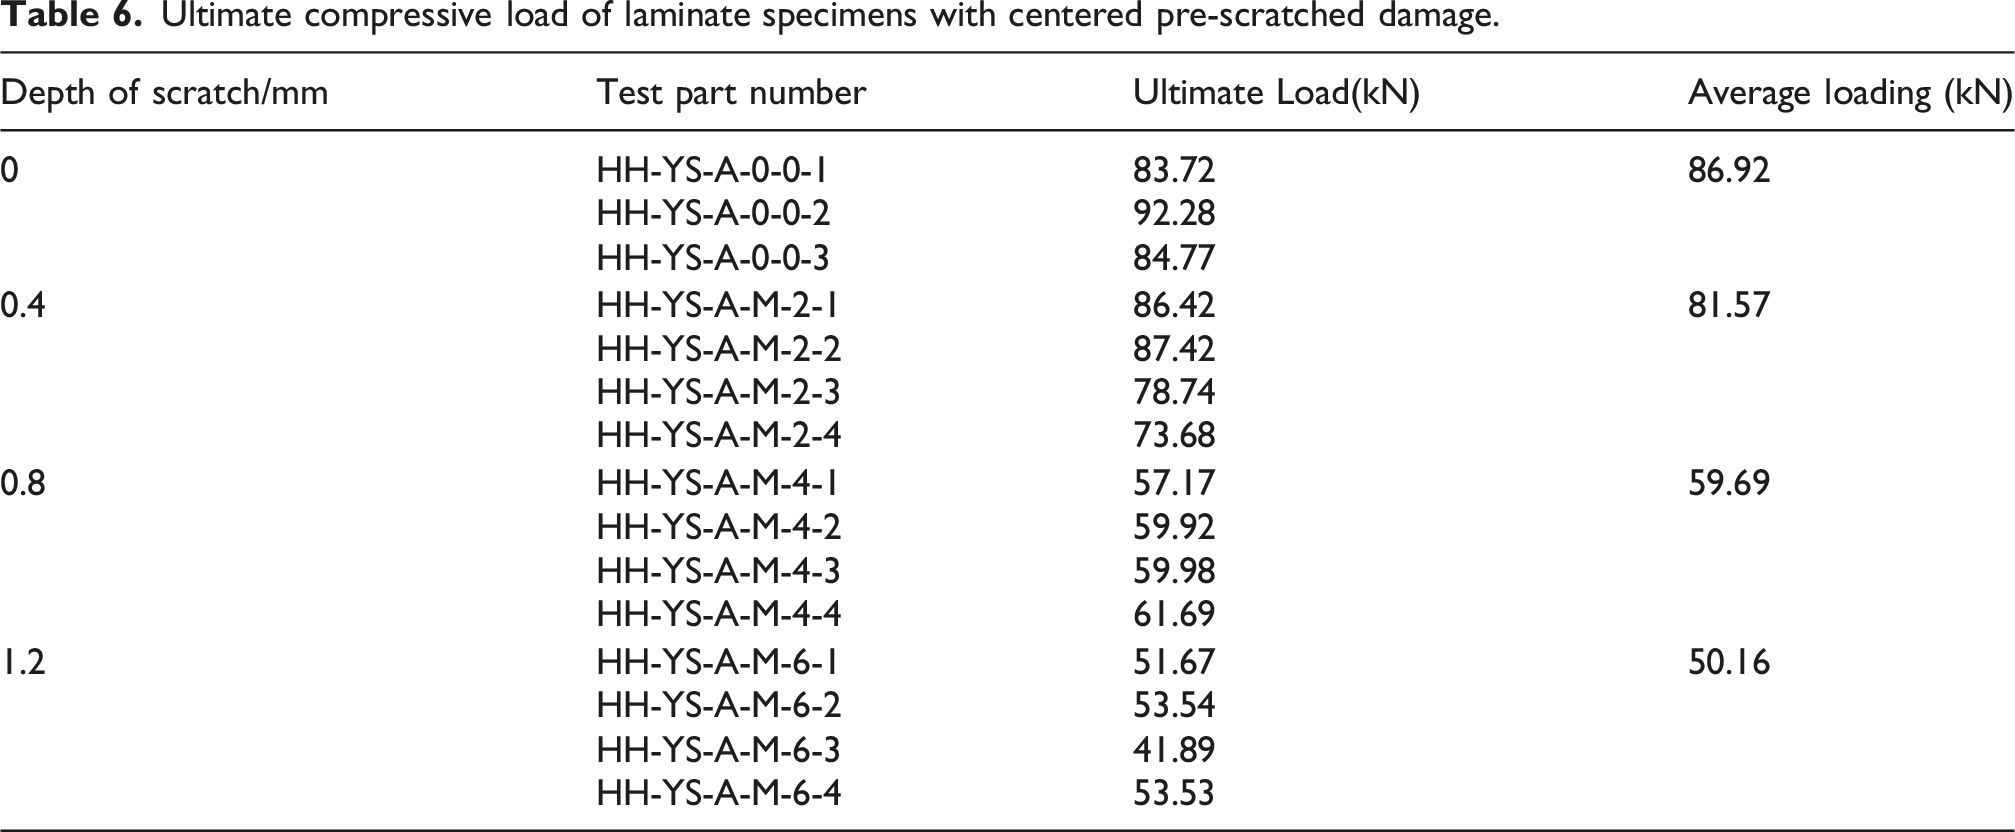
For specimens with a 0.8 mm deep scratch, the average compressive ultimate load was found to be 59.69 kN, which is a reduction of 31.33% compared to the intact specimens. When the scratch depth increased to 1.2 mm, the average compressive ultimate load was found to be 50.16 kN, representing a reduction of 42.29%. The specimens with 0.8 mm and 1.2 mm deep scratches showed a significant decrease in ultimate load compared to the intact specimens. It is believed that the scratches reduced the bearing cross-sectional area, leading to a substantial decrease in the compressive ultimate load capacity.
The failure modes of the laminate specimens with scratches located on the left side are shown in Figure 17. The failure images of the specimens with 0.4 mm and 1.2 mm deep scratches on the left side are presented in Figure 17(a) and 17(b), respectively. For the specimen with a 0.4 mm deep scratch, failure was observed at the upper end of the specimen. Damage was initiated from the top-right corner and gradually propagated toward the middle of the left side, leading to crack formation and ultimate failure. No noticeable damage was detected at the scratch or other areas of the specimen. This failure pattern was similar to that observed in the specimen with a 0.4 mm deep scratch at the center. For the specimen with a 1.2 mm deep scratch, failure occurred along the line of the scratch. On the scratched side, compression caused fiber breakage and delamination. On the opposite side, buckling induced fiber tensile fracture and widespread delamination. It has been concluded that, similar to the 0.4 mm central scratch specimen, the 0.4 mm scratch did not significantly affect the load-bearing capacity of the laminate. However, for the 1.2 mm deep scratch, significant changes in the failure location and damage propagation were observed. Unlike the specimen with a centrally located scratch, the failure crack initiated from the back side of the left-side scratch. Delamination, caused by buckling, propagated from the scratch toward the right, eventually resulting in failure across the entire specimen. Compressive failure diagram of composite laminates with left-side pre-existing scratches.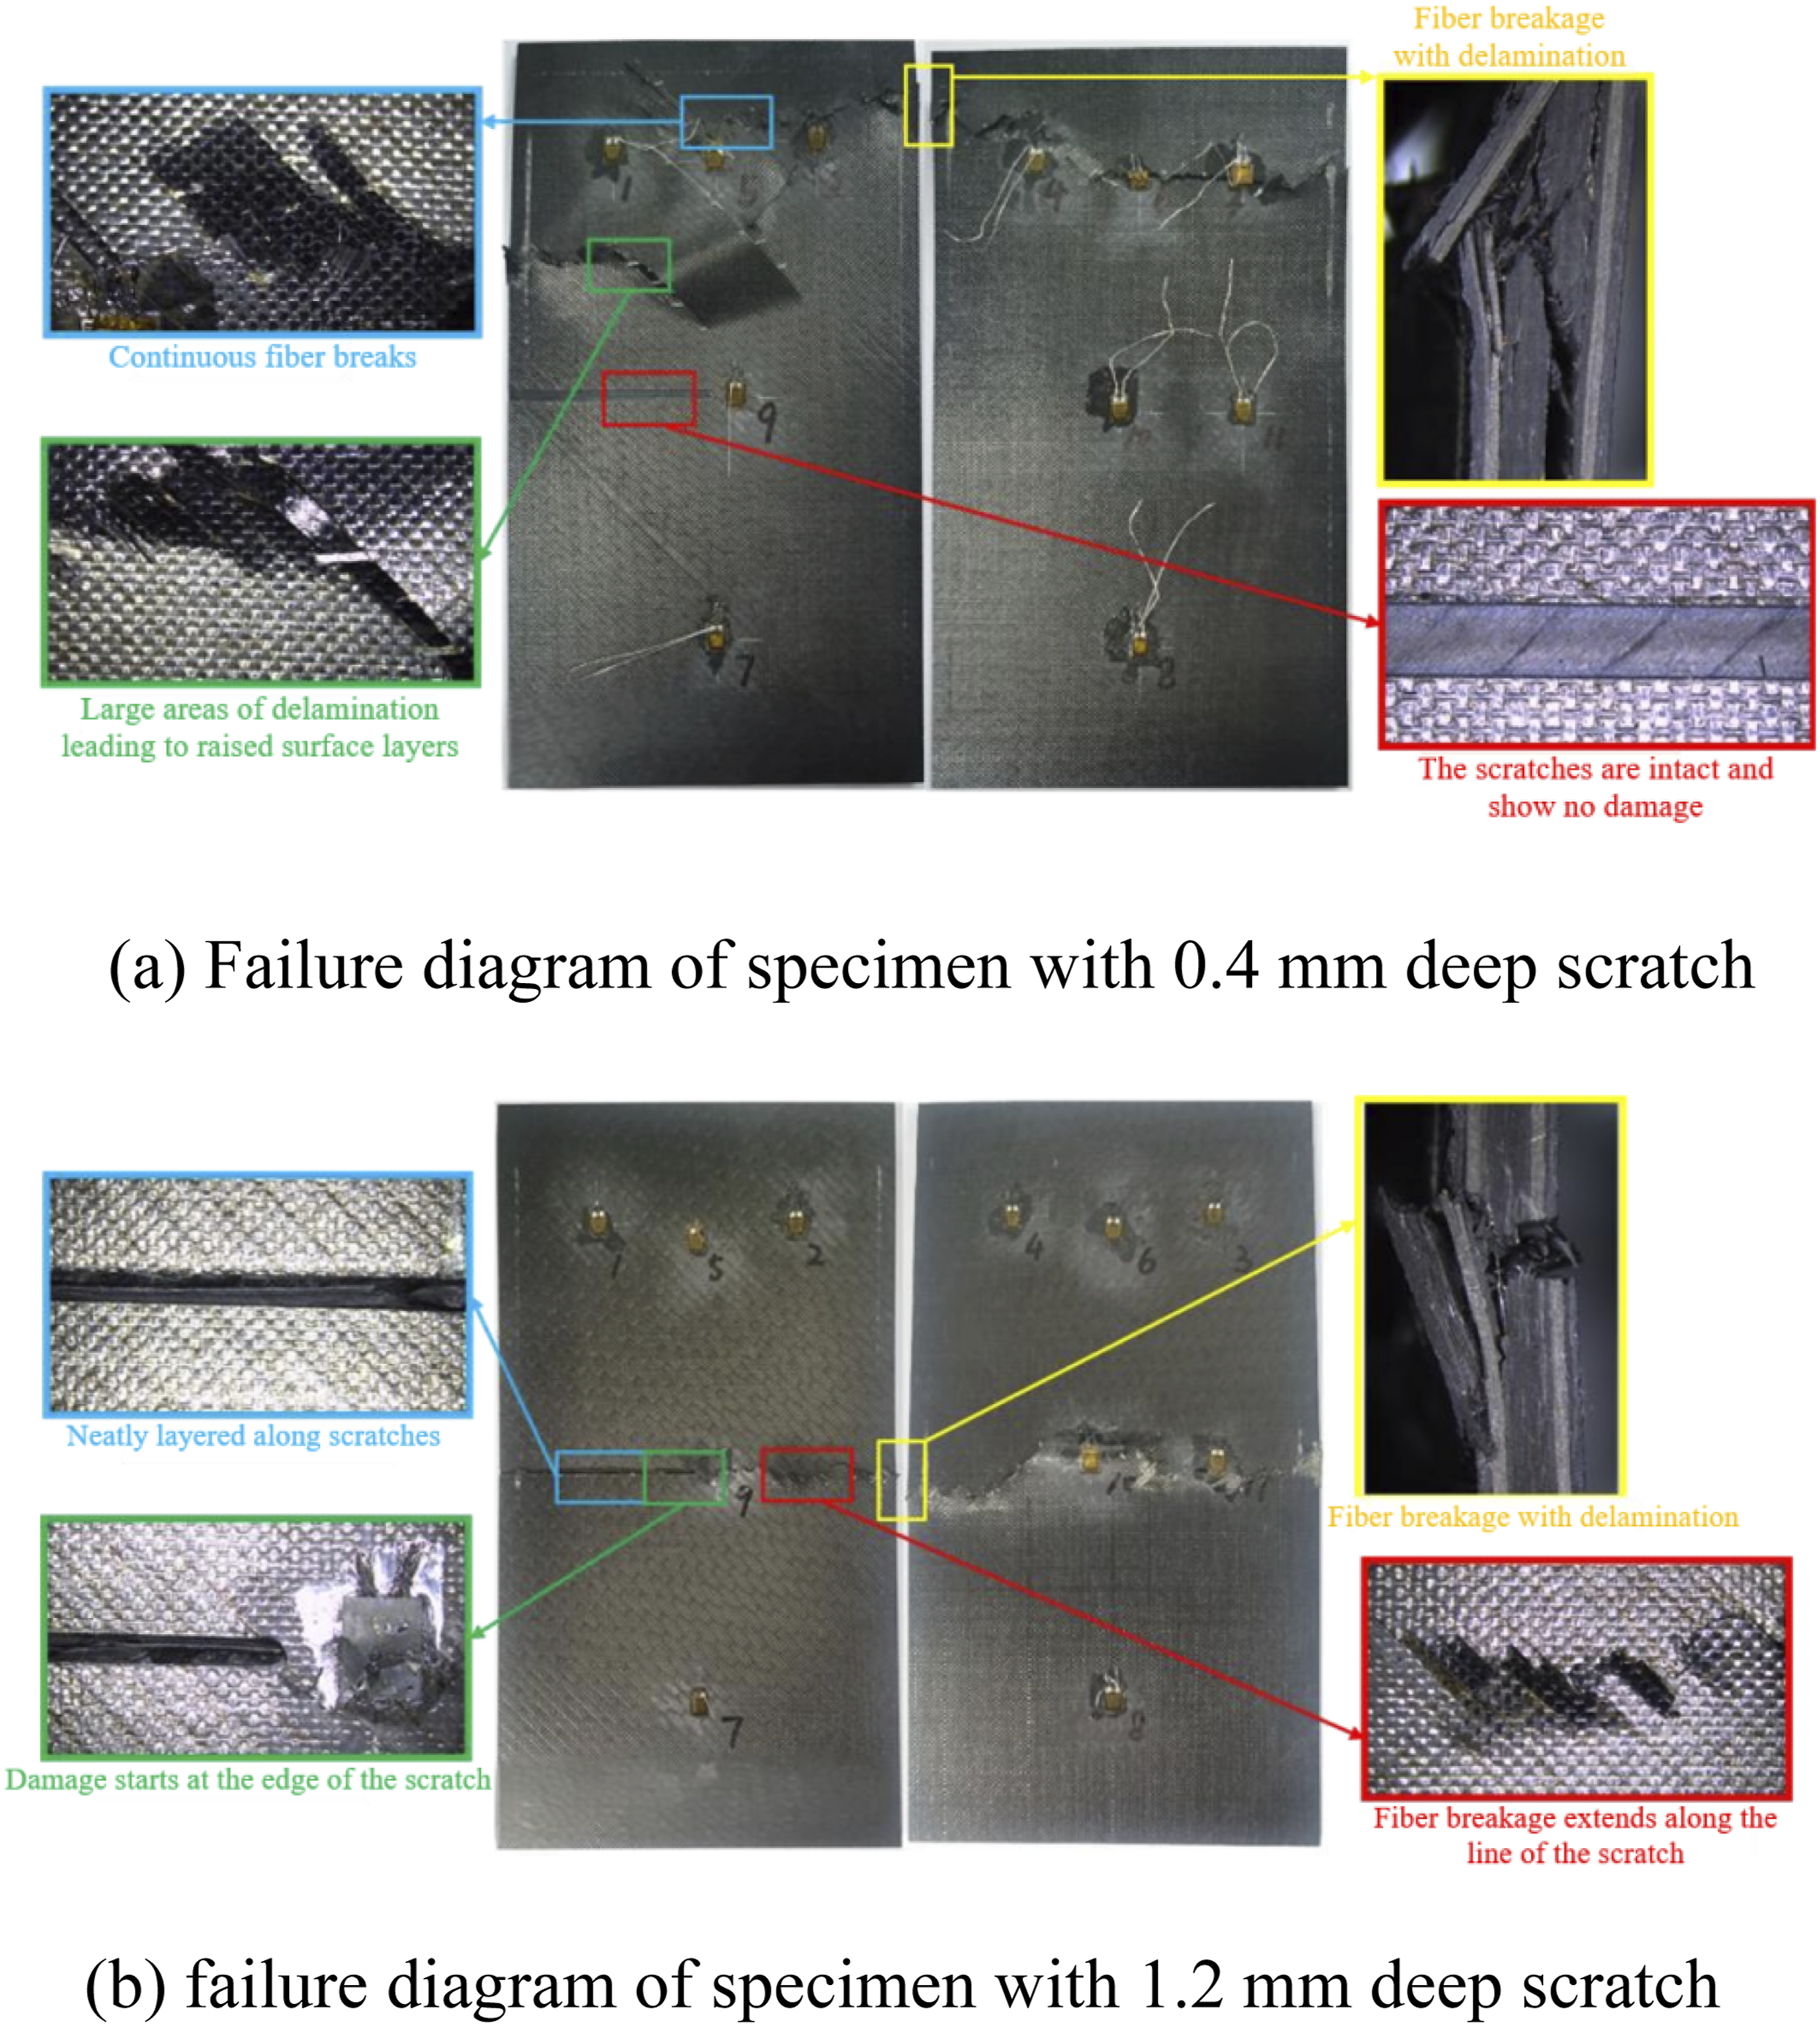
Ultimate compressive load of laminate specimens with left-side pre-scratched damage.
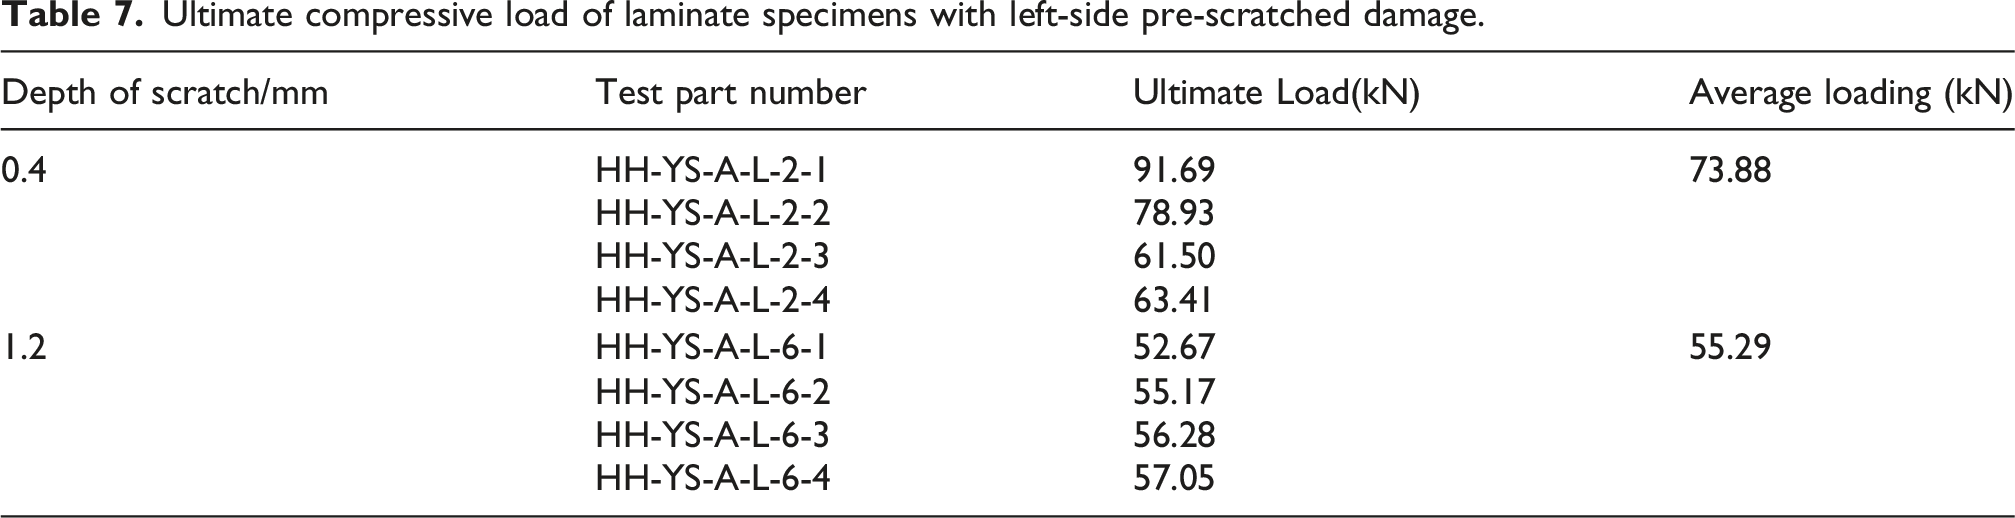
Some scatter is observed in the ultimate load data for scratched laminates, with coefficients of variation typically below 10%. This is within the expected range for composite compression testing and can be attributed to minor variations in scratch geometry and inherent material variability.
For shallow scratches (0.4 mm), damage initiates at the specimen end rather than at the scratch itself. For deeper scratches (0.8 mm and 1.2 mm), damage initiates at the scratch tip with local delamination, followed by matrix cracking, then fiber breakage, and finally crack propagation along the scratch line.
The compressive ultimate load of each specimen with a left-side scratch was found to be higher than that of the specimen with the same depth of scratch at the center. This is likely because the damage from deeper scratches initiates from the back of the scratch and extends in other directions, while the damage from center-positioned scratches extends symmetrically to both sides. Due to the longer damage propagation path for the left-side scratches, the specimens with left-side preformed scratches were provided with a longer load-bearing duration and greater load-bearing capacity. These results show that both the depth and location of scratches significantly affect the compressive performance of laminate specimens. When the scratch depth is shallow, the location has little effect on the ultimate load. However, with deeper scratches, the location becomes a key factor in determining the ultimate load.
Compression test results of composite laminates with holes
Figure 18 shows the compression failure images of laminate specimens with holes in Layer A. In the intact specimens, failure cracks were observed at the upper end. These cracks propagated transversely across the laminate, with fiber compression fracture as the primary failure mode, accompanied by minor matrix damage and localized delamination. In contrast, for the specimens with holes, the failure paths were significantly influenced by delamination around the hole. Cracks were initiated at the hole locations and propagated along the delaminated areas, with the crack paths generally perpendicular to the loading direction. For the specimen with a 20 mm hole, cracks on the front side were initiated from both sides of the lower half of the hole, propagating at a 45° angle to the loading direction. On the back side, cracks were initiated from both sides of the upper half of the hole, propagating at a 45° angle opposite to the loading direction. The compressive failure of laminated composites with through-holes is caused by delamination around the hole. This phenomenon is attributed to the discontinuous structure of the laminate, which contains a through-hole. Delamination is clearly observed on the cylindrical surface of the hole. The delamination extends in the thickness direction around the hole, resulting in matrix and fiber fracture. Once the failure propagates through the entire laminate thickness, cracks initiate from different points and extend toward both ends, leading to overall failure of the structure. The crack propagation process is similar to that observed in intact specimens. Fiber fractures propagate along the crack tip, eventually passing through the entire laminate, causing total failure of the structure. In the case of specimens with a 50 mm hole diameter, cracks begin from the lower half of the hole on the front face. The initial crack direction is approximately 45° to the loading direction. No significant fiber fracture is observed at the hole edge on the back face. Cracks appear about 3 cm from the edge. The right-side crack exhibits similar characteristics, with the crack direction at approximately 45° in the opposite direction to the loading. Under compressive loading, delamination failure first occurs around the hole. This leads to matrix damage on the front side and the formation of initial cracks. The cracks then propagate toward the tip, resulting in a series of fiber fractures. The back side of the initial delamination region is subjected to tensile loading, but no fiber or matrix fracture is observed. The cracks propagate to the back side, influenced by internal delamination and front-side damage. Surface fiber and matrix failure occur at a certain distance from the hole edge. Finally, the crack propagates laterally across the laminate, leading to complete failure. Compressive failure diagram of A-Ply composite laminate specimens with holes.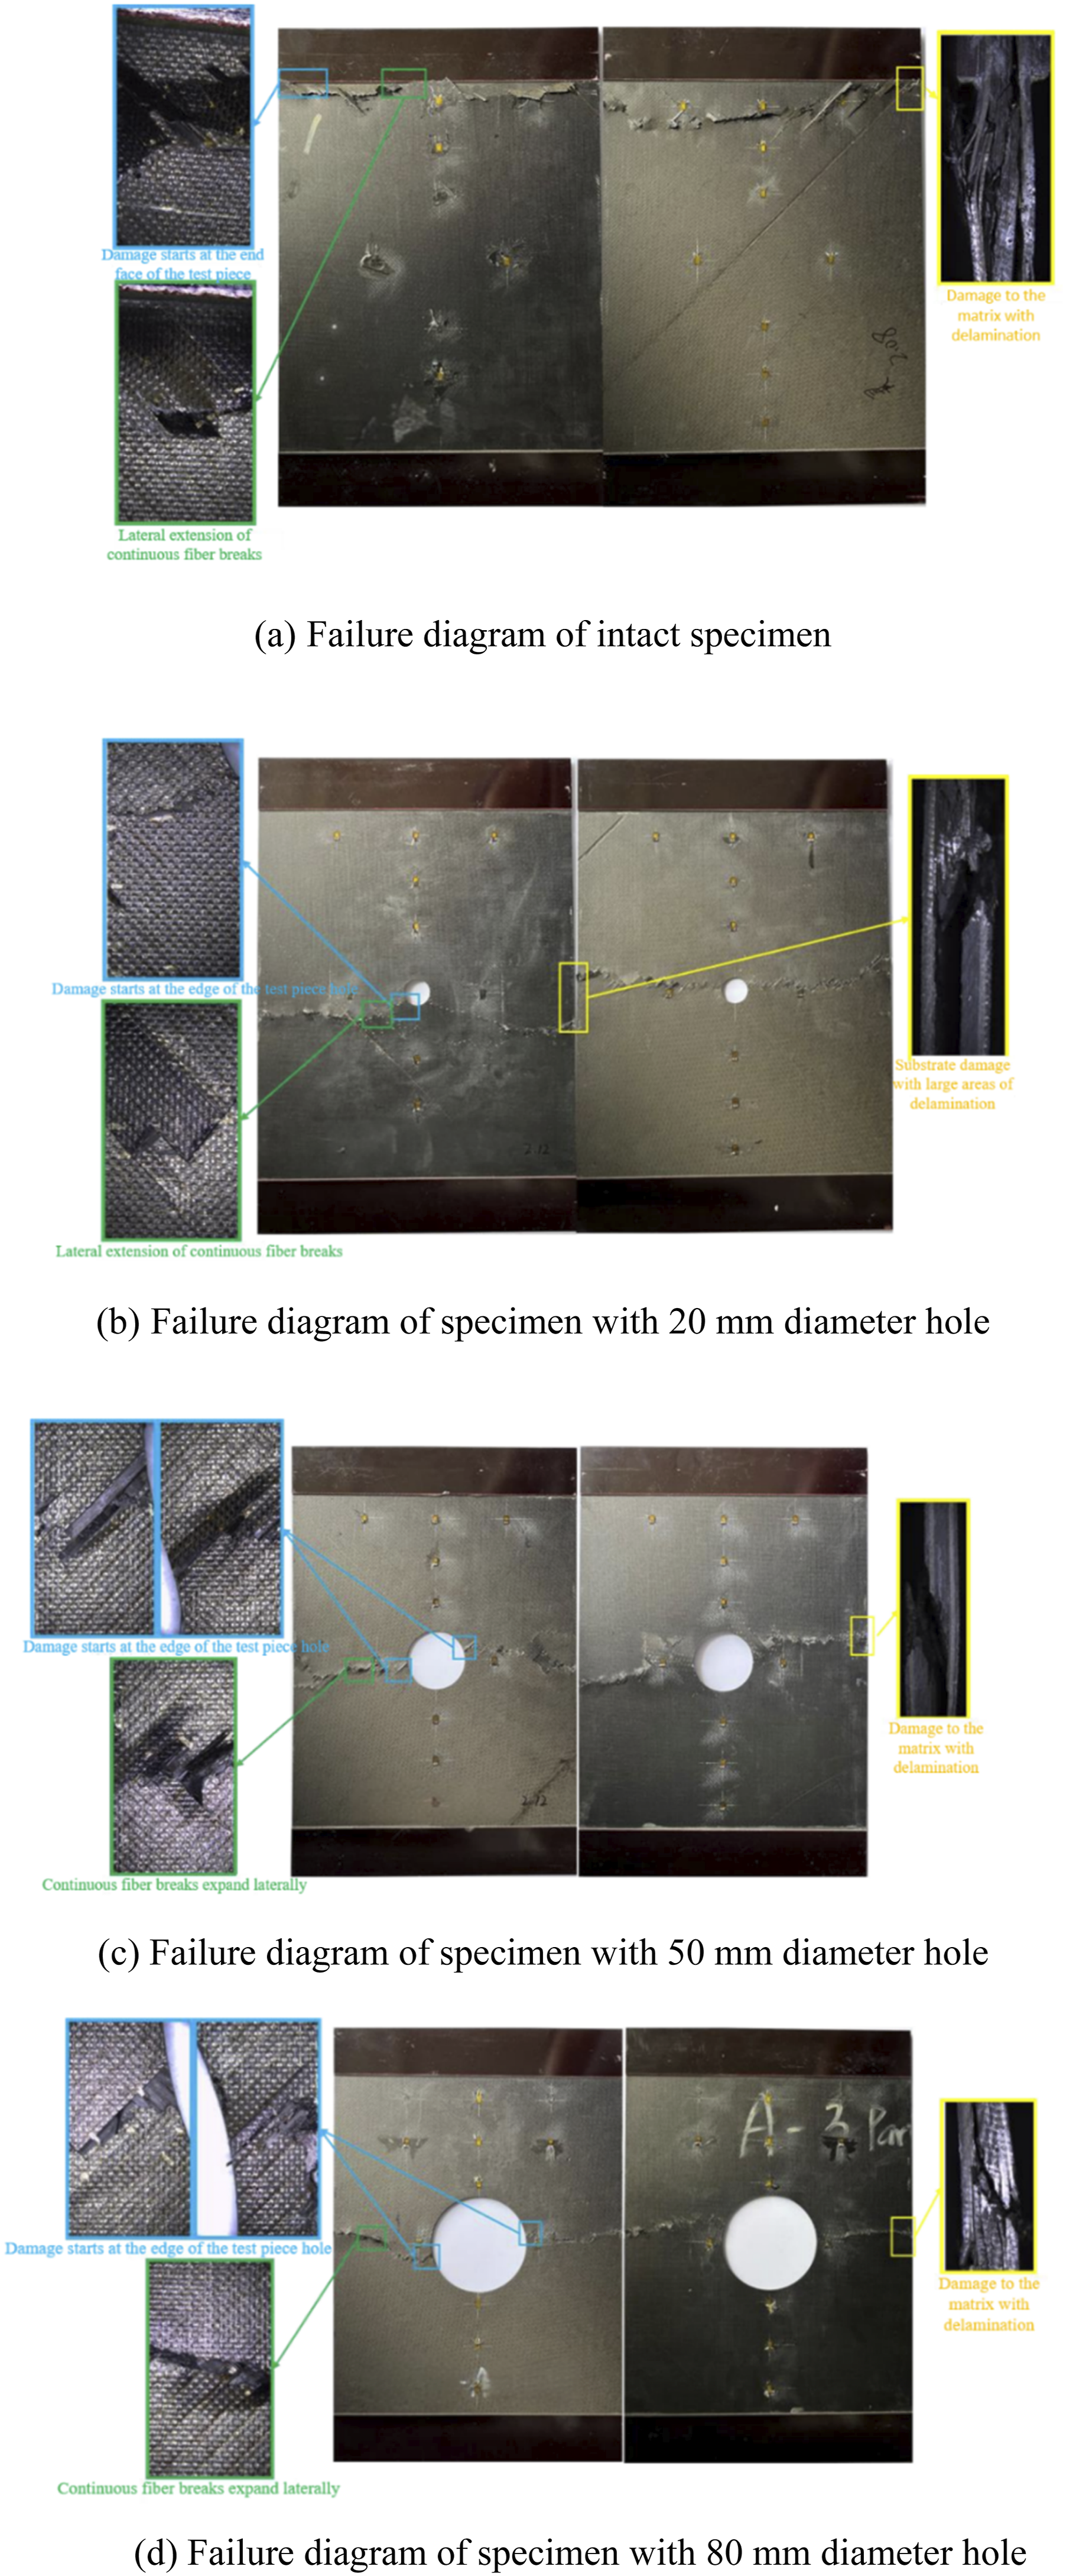
The failure mode of the laminate with an 80 mm hole diameter was found to be similar to those with 20 mm and 50 mm holes. It was observed that changes in hole diameter did not significantly affect the compressive failure mode of the laminate. Damage was initiated by internal delamination, followed by fiber fractures in each layer, ultimately leading to the overall failure of the laminate.
The compressive failure of laminated composites with through-holes is caused by delamination around the hole. This phenomenon is attributed to the discontinuous structure of the laminate. Delamination is clearly observed on the cylindrical surface of the hole and extends in the thickness direction around the hole. Once failure propagates through the entire laminate thickness, cracks initiate from different points and extend toward both ends, leading to overall failure of the structure. Additionally, the change in hole diameter did not significantly affect the failure mode, as damage was initiated by internal delamination and followed by fiber fractures. This suggests that the laminate’s overall behavior in compression is primarily influenced by the delamination process, which remains consistent regardless of hole size.
Figure 19 presents the compressive failure diagram of the B-layered laminated composite specimens with through-holes. The failure in the intact specimens is caused by the main crack, which transverses the entire laminate. This main crack consists of continuous fiber fractures, with small matrix cracks in a 45° direction surrounding it. In specimens with a 20 mm hole diameter, the crack distribution shows significant asymmetry. The main crack on the front face passes through the hole, while the crack on the back face starts about 5 cm from the hole edge and extends laterally. The large area of delamination within the specimen indicates that failure initiates in the region surrounding the hole, resulting in uneven stress distribution. Matrix damage and initial crack formation occur on the front side due to compression. As the load increases, the cracks propagate and fiber fractures extend along the crack tip. On the back face, no noticeable fiber or matrix fractures occur due to tensile loading. Cracks develop at a certain distance from the hole edge, influenced by the combined effects of internal delamination and crack propagation on the front side. The asymmetry in crack distribution reflects the random nature of the initial delamination location, propagation direction, and final extent of the damage. While the occurrence of the main crack not passing through the hole is relatively infrequent, it is consistent with the failure process observed in other specimens, thus making it a plausible outcome. Compressive failure diagram of B-ply composite laminate specimens with holes.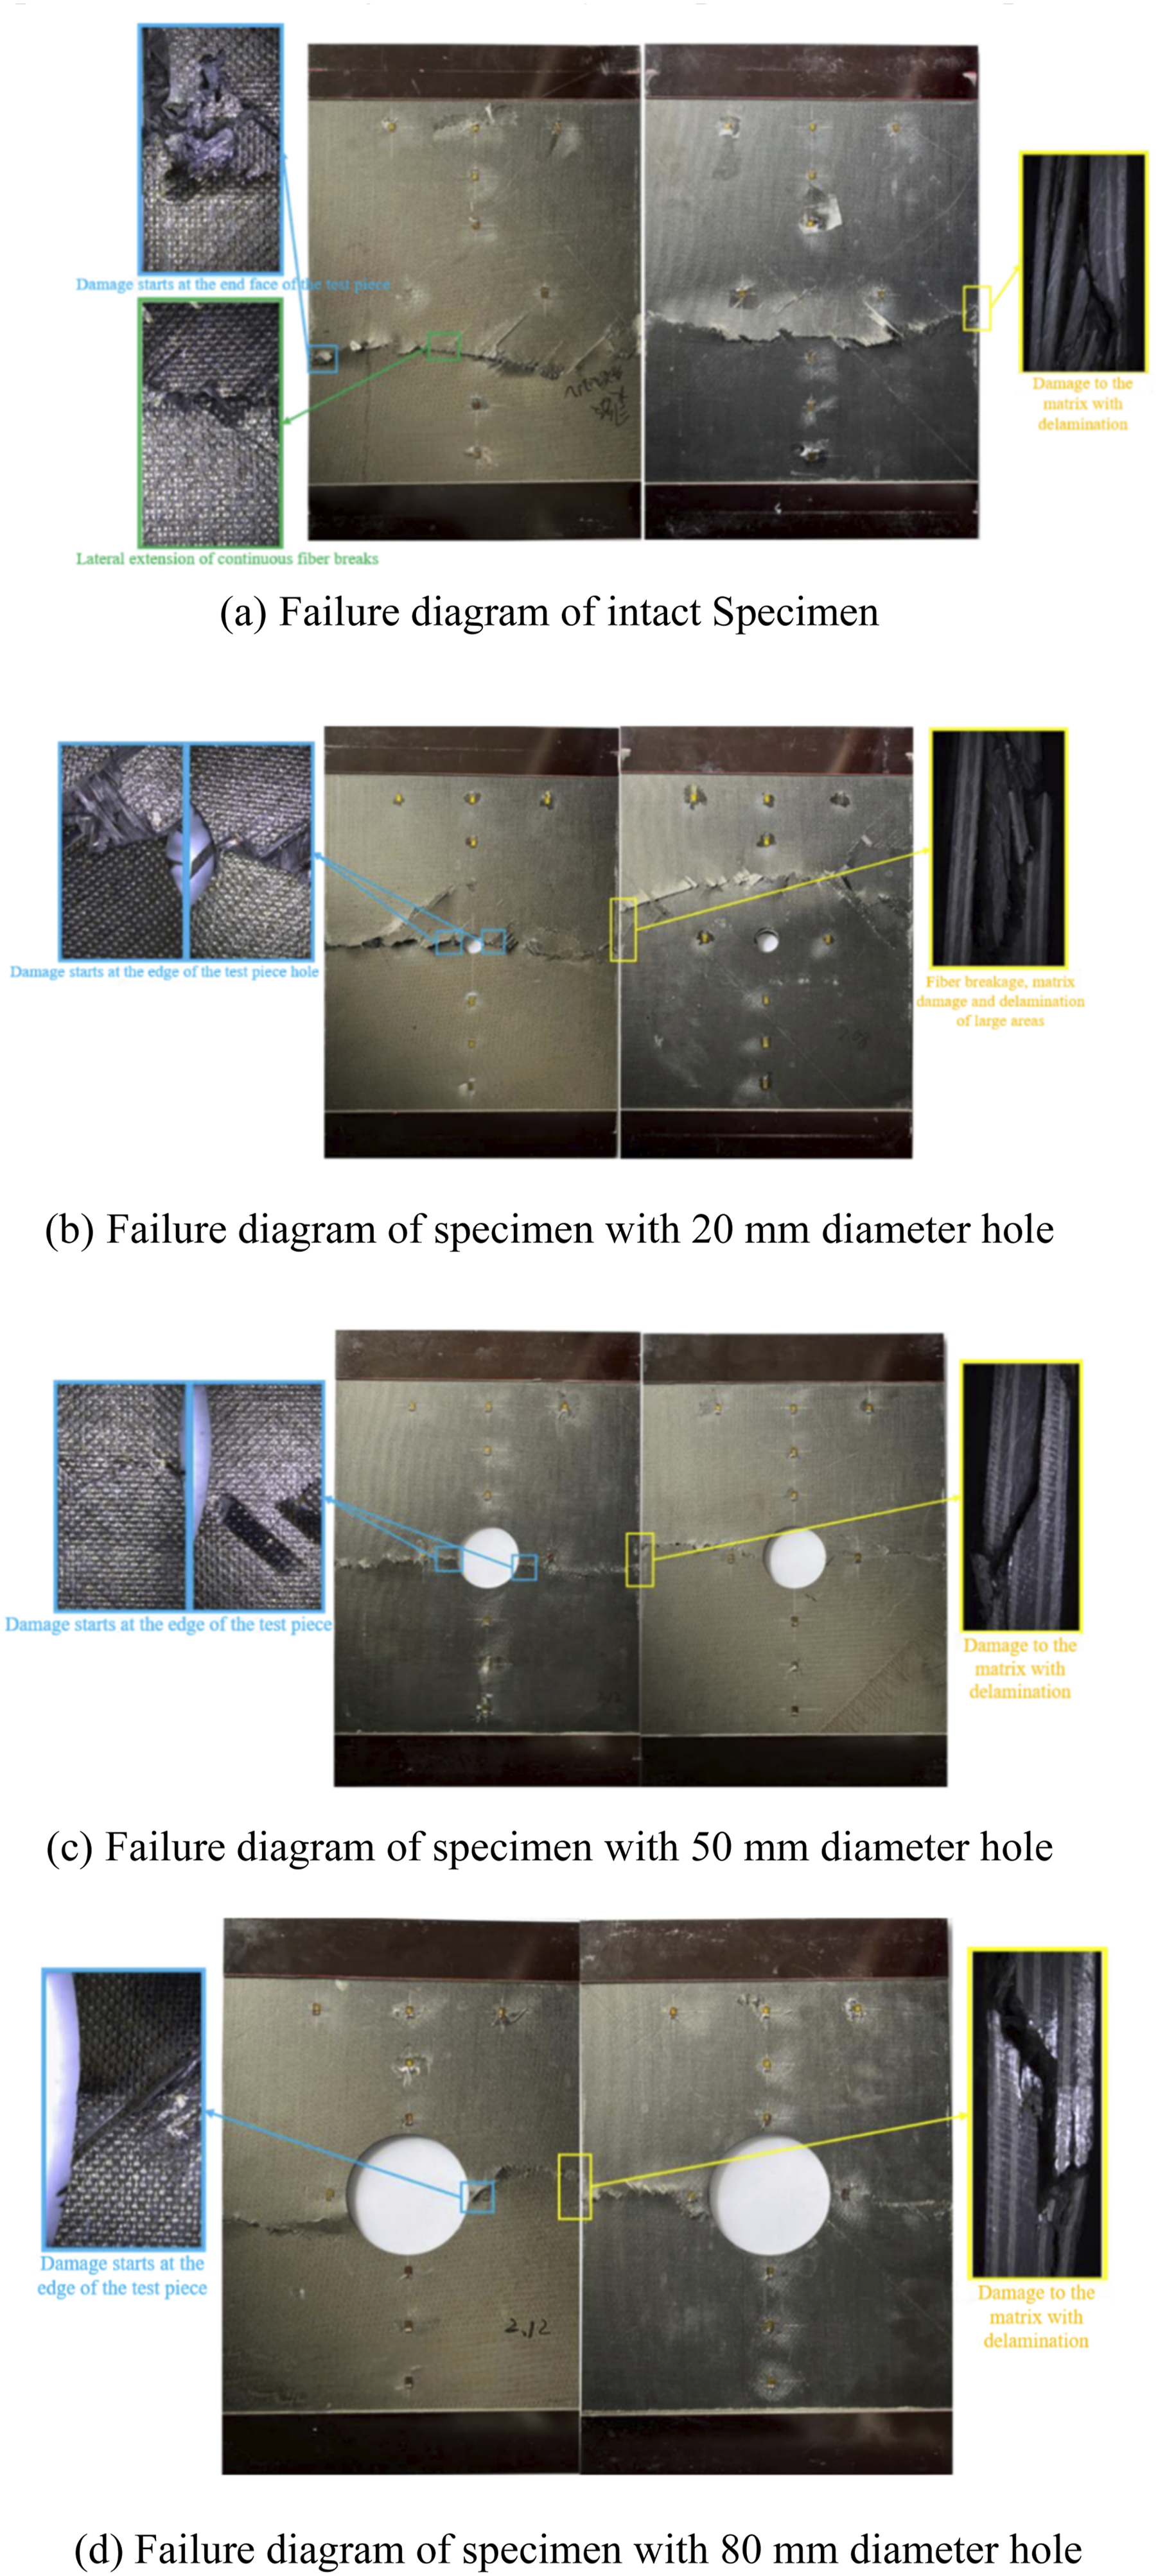
The damage initiates at the hole edge with small delamination that then extends through the thickness, and matrix cracking appears on the front side while damage on the back side appears later at a distance from the hole edge.
In specimens with a 20 mm hole diameter, the crack distribution showed significant asymmetry, with the crack on the front face passing through the hole, while the crack on the back face started about 5 cm from the hole edge and extended laterally. This asymmetry in crack distribution is attributed to the random nature of initial delamination and the combined effects of internal delamination and crack propagation on the front side. As the load increased, the cracks propagated and fiber fractures extended along the crack tip, which is consistent with the failure process observed in other specimens. This suggests that the delamination and fiber fracture processes are similar across specimens, but the direction and extent of crack propagation are influenced by the size and location of the hole. This asymmetry also indicates that stress distribution around the hole is not uniform, with the front side undergoing more compression and the back side subjected to tensile forces, leading to different crack patterns.
Ultimate compressive load of A-ply composite laminate specimens with holes.
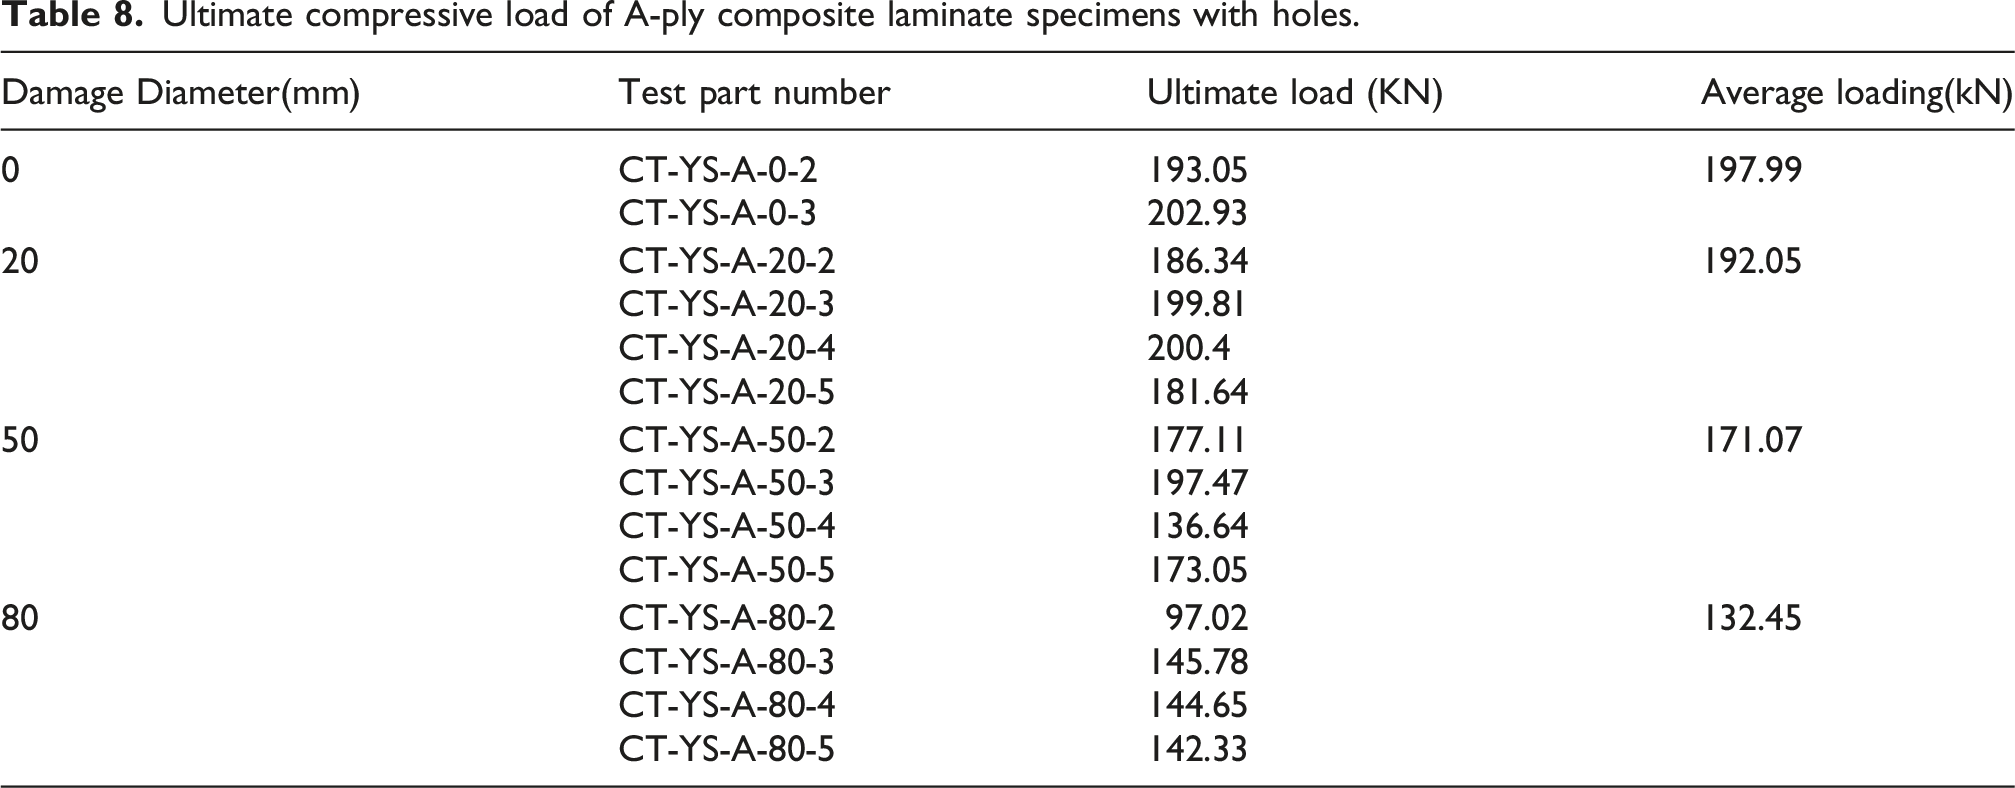
Ultimate compressive load of B-ply composite laminate specimens with holes.
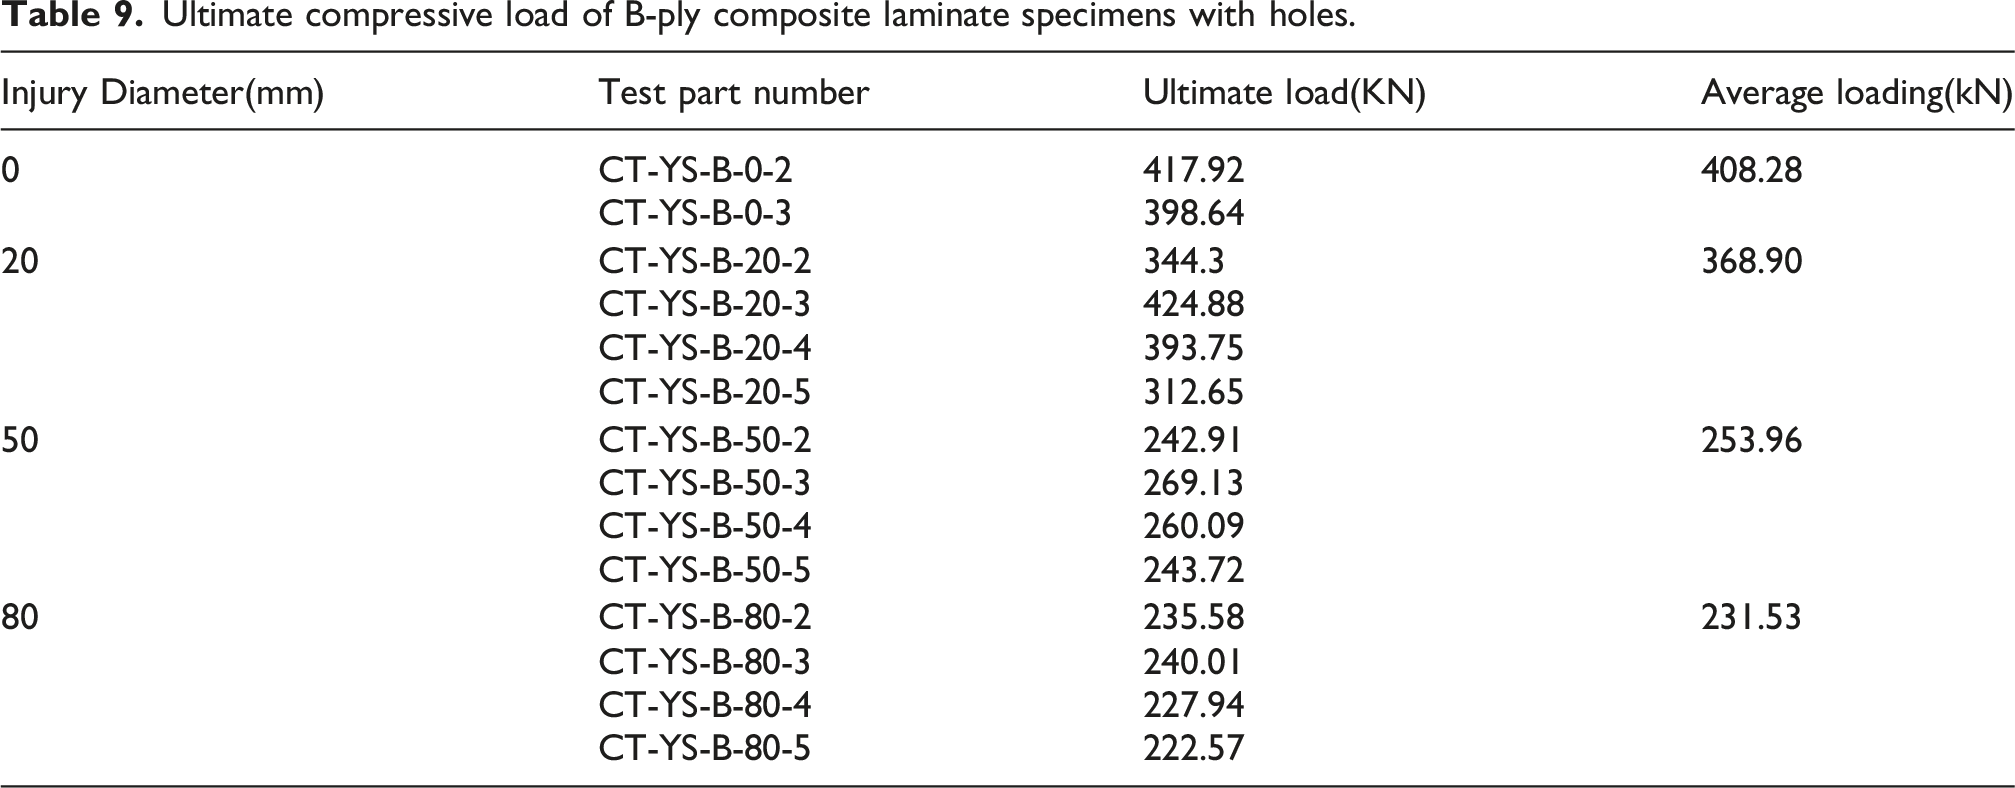
The compressive ultimate load of specimen CT-YS-B-20-3 with a 20 mm diameter hole from the B-layup was 424.88 kN, which is even higher than that of the intact specimen of the same layup. From the failure diagram of this specimen, it can be observed that a long crack in the thickness direction developed during damage propagation, with delamination being the primary failure mode. This led to the specimen’s unique damage morphology and load behavior. Further observation of other specimens reveals that, due to the greater thickness of the B-layup, the frequency of specimens exhibiting large delamination areas was higher, and such specimens generally displayed higher ultimate loads.
Failure modes and analysis of simulation results for scratched laminates
To validate the numerical model for scratched laminates, the experimental and numerical load–displacement curves are compared in Figure 20 for all scratched laminate configurations, including intact, center-scratched (0.4, 0.8 and 1.2 mm depths), and left-side scratched (0.4 and 1.2 mm depths) specimens. The experimental curves, presented in red, are selected from specimens whose ultimate loads are closest to the average value of each configuration, ensuring a representative comparison. The numerical predictions, shown in blue, are superimposed for direct visual assessment. Overall, the simulated curves are in good agreement with the experimental results across the entire loading process. The initial stiffness is well captured for all cases, and the peak loads are predicted with good accuracy, as quantitatively summarized in Table 10. Comparison of experimental and numerical load–displacement curves for scratched composite laminates. Comparison of simulated and experimental ultimate compressive loads for scratched composite laminates.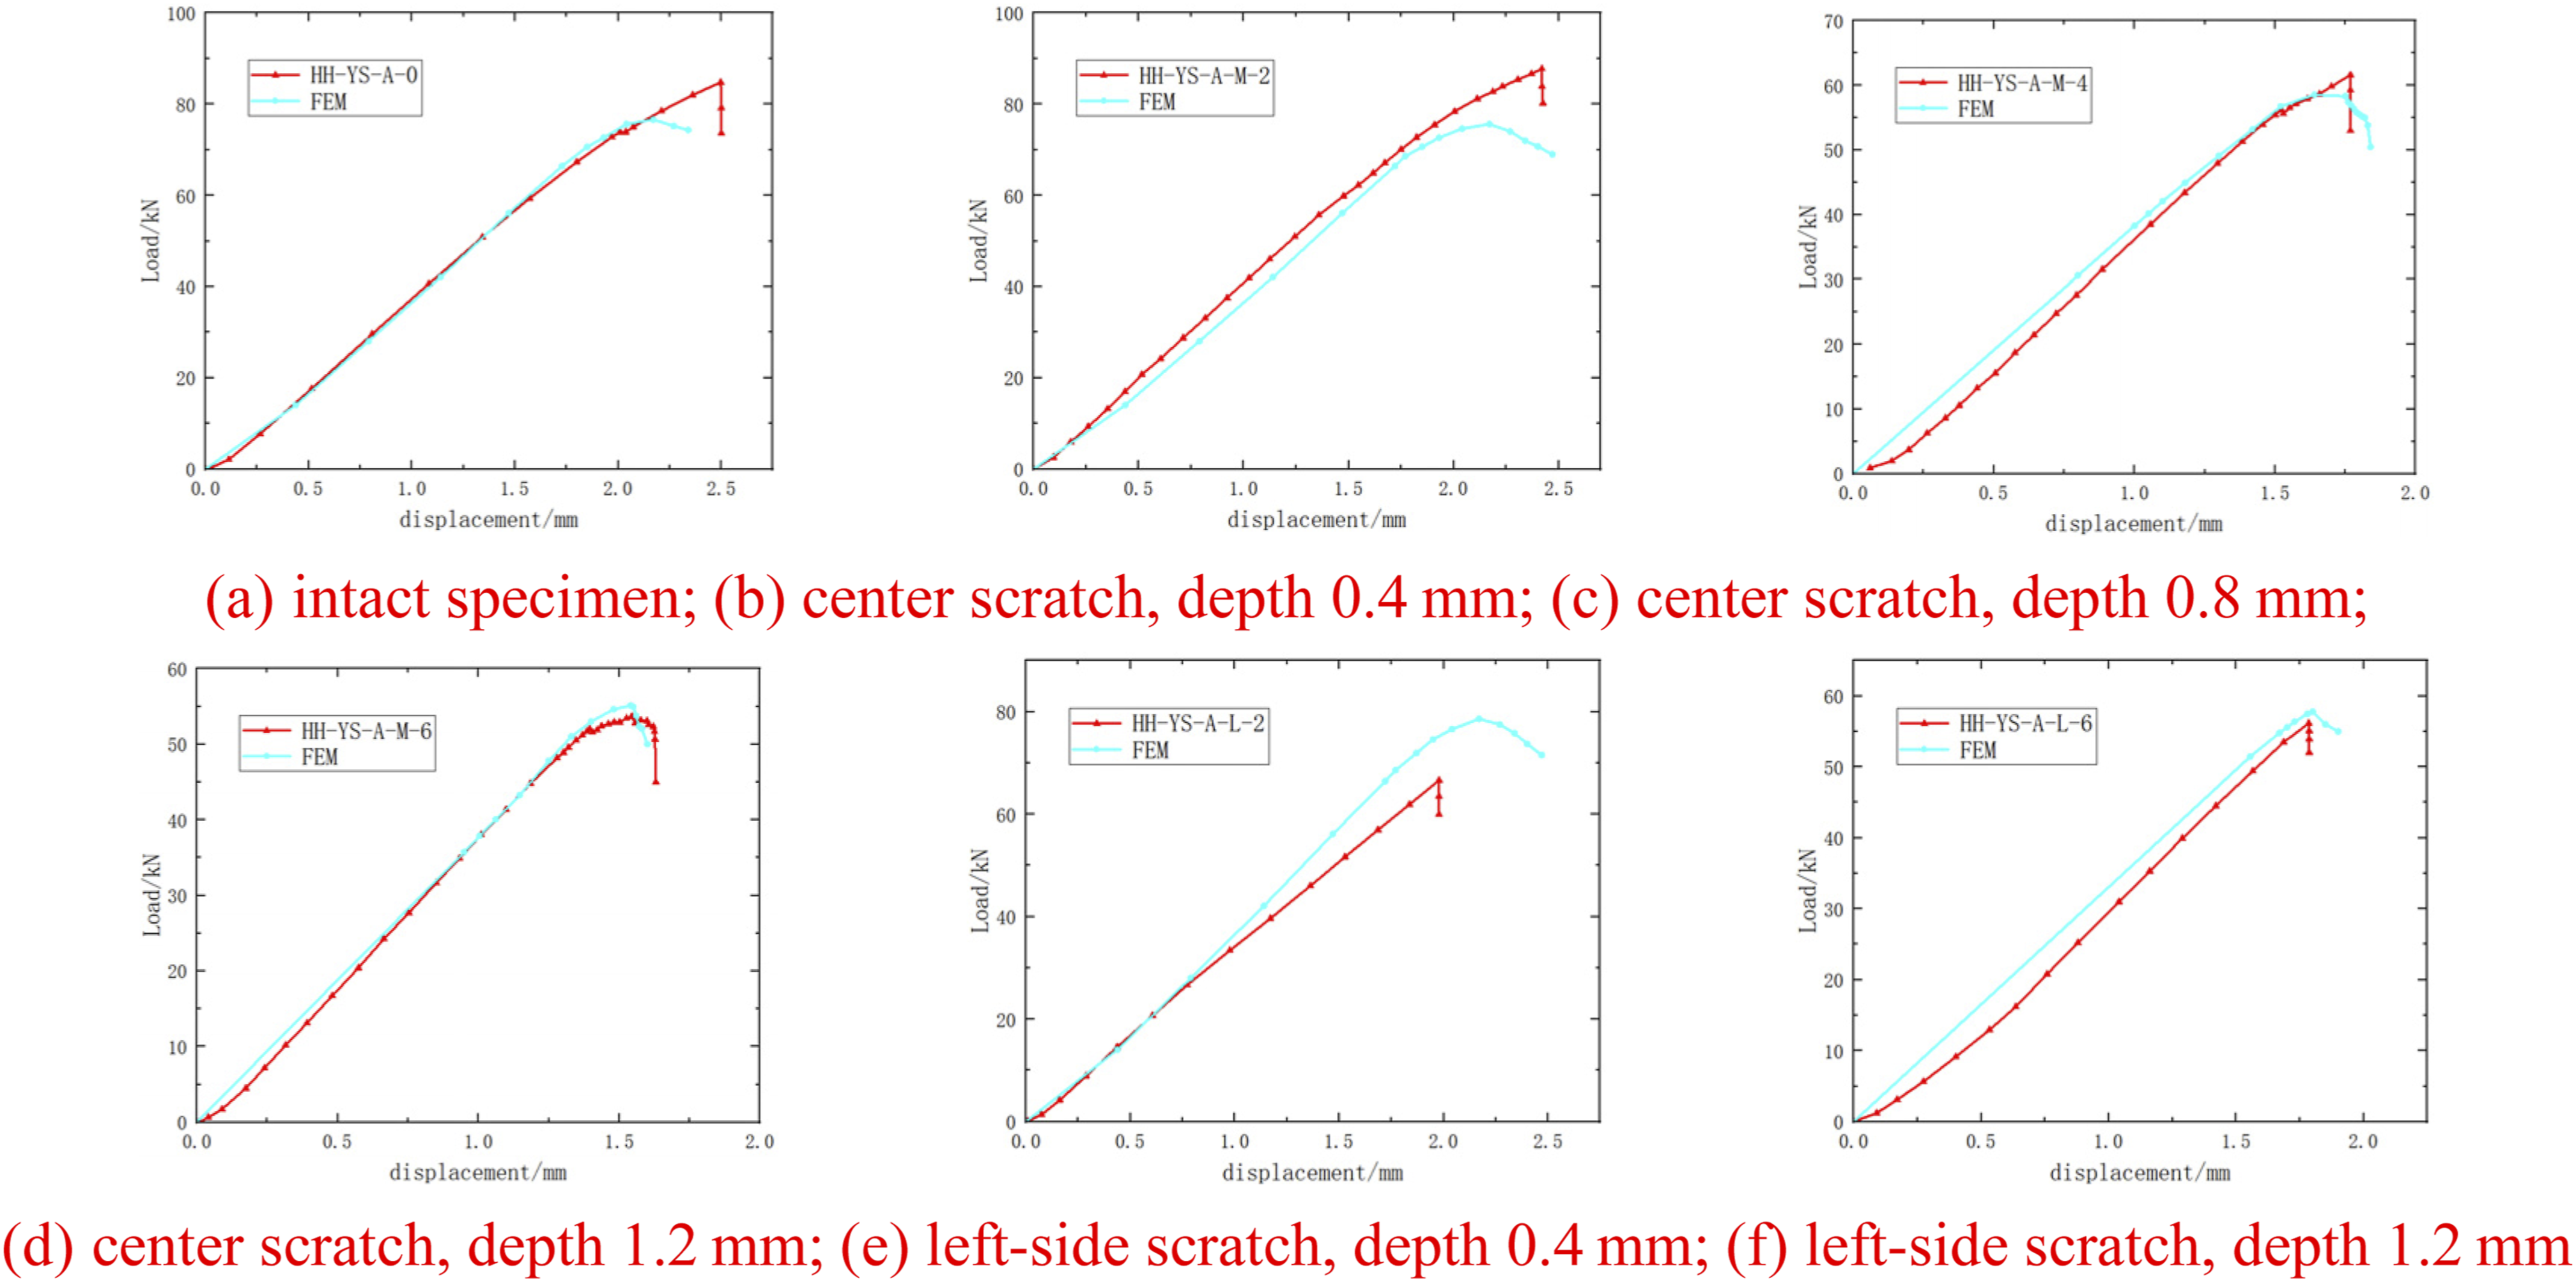
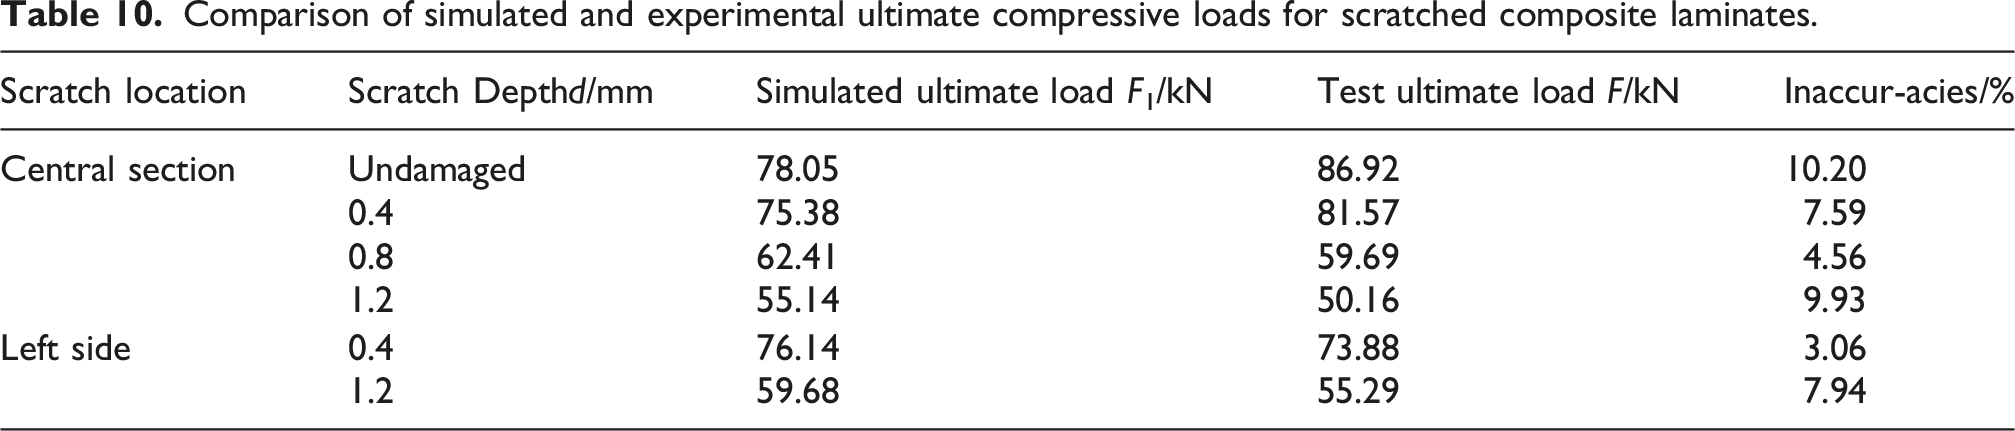
The compressive ultimate loads of laminates with pre-scratched defects obtained through simulations are listed in Table 10. The ultimate load of the intact laminate is calculated to be 78.05 kN. From Table 10, it is evident that the compressive load decreases as the scratch depth increases when the scratch location is fixed. When the scratch depth is fixed, the relationship between compressive load and scratch location is non-linear. For a scratch depth of 0.4 mm, laminates with left-side scratches have lower compressive loads. For a scratch depth of 1.2 mm, laminates with center scratches show lower compressive loads. These results align with experimental findings. The simulation results for ultimate compressive loads match experimental data with an error margin of less than 10.20%, validating the effectiveness of the finite element simulation method.
From the simulation results, we observe that the ultimate compressive load decreases as the scratch depth increases, confirming the detrimental impact of scratch defects on the laminate’s load-bearing capacity. The non-linear relationship between scratch location and compressive load for a fixed scratch depth suggests that different locations within the laminate react differently under compressive loading, with center scratches showing more significant reductions in compressive load at higher depths. The simulation results closely match experimental data, with an error margin of less than 10.20%, which confirms the reliability of the finite element simulation approach in predicting the behavior of scratched laminates under compressive load.
The failure process of intact laminates under compressive loading is shown in Figure 21. Failure begins at the edges and corners of the laminate. Matrix damage dominates, forming shear damage regions that expand diagonally toward the center, eventually connecting and causing complete failure. Minor fiber compression damage occurs at the edges. Simulated compressive failure diagram of intact laminate.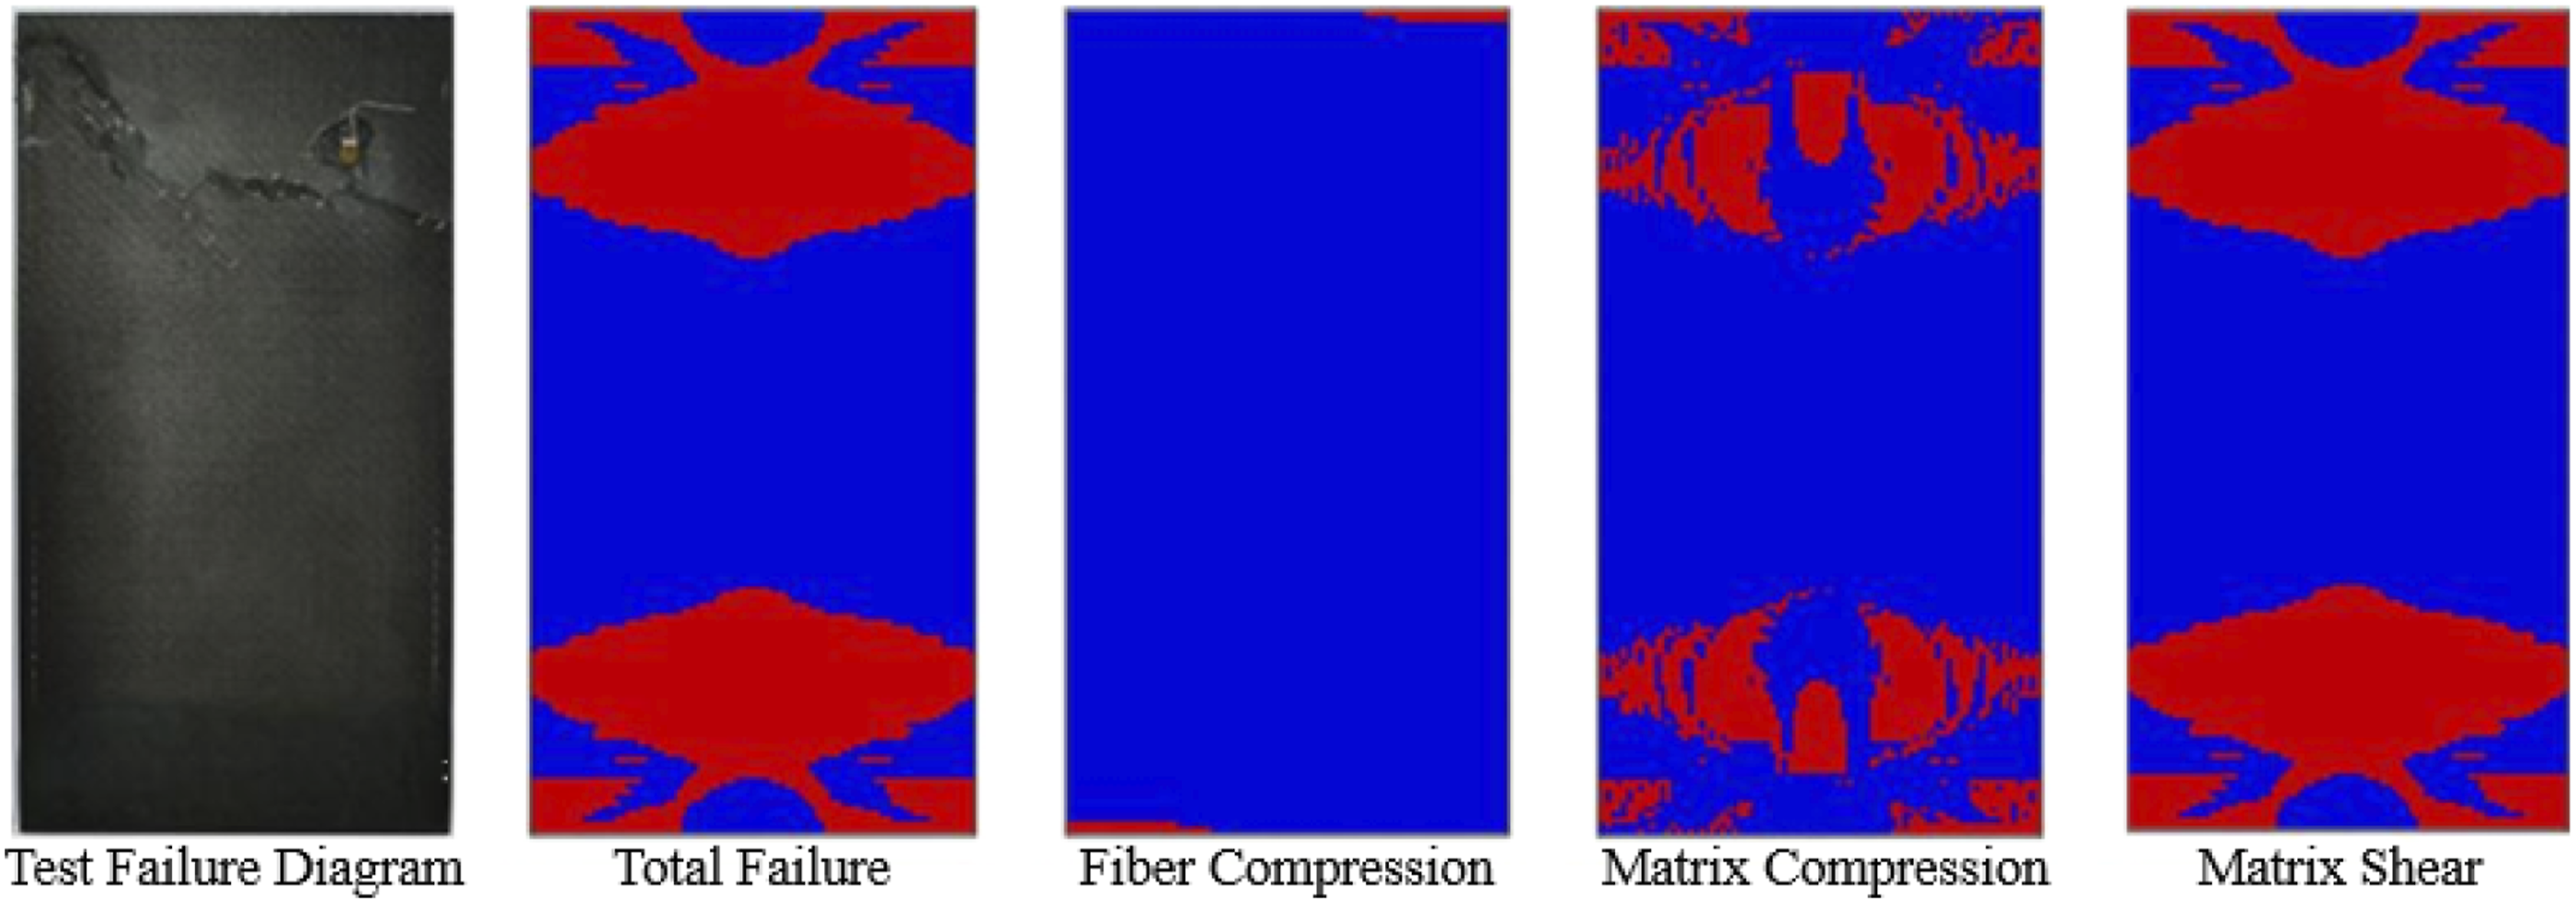
For intact laminates, the failure mode is characterized by the initiation of matrix damage at the laminate edges, progressing through shear damage. This aligns with common behavior observed in laminated composites under compressive loading. The observed failure mode—primarily shear damage expanding diagonally—reflects the typical deformation behavior of the matrix under stress. The minor fiber compression damage observed at the edges indicates that matrix failure plays a dominant role in the initial damage stages, whereas fiber failure occurs later as the shear damage extends.
As can be seen in Figure 22. For laminates with a 0.4 mm scratch, the failure mode is similar to that of intact laminates. Matrix shear damage starts from the corners and spreads toward the center. Small damage areas appear near the scratch due to stress concentration. However, this damage does not lead to overall failure. Instead, failure occurs when matrix shear damage connects across the laminate. Simulated compressive failure diagram of laminates with centered scratches.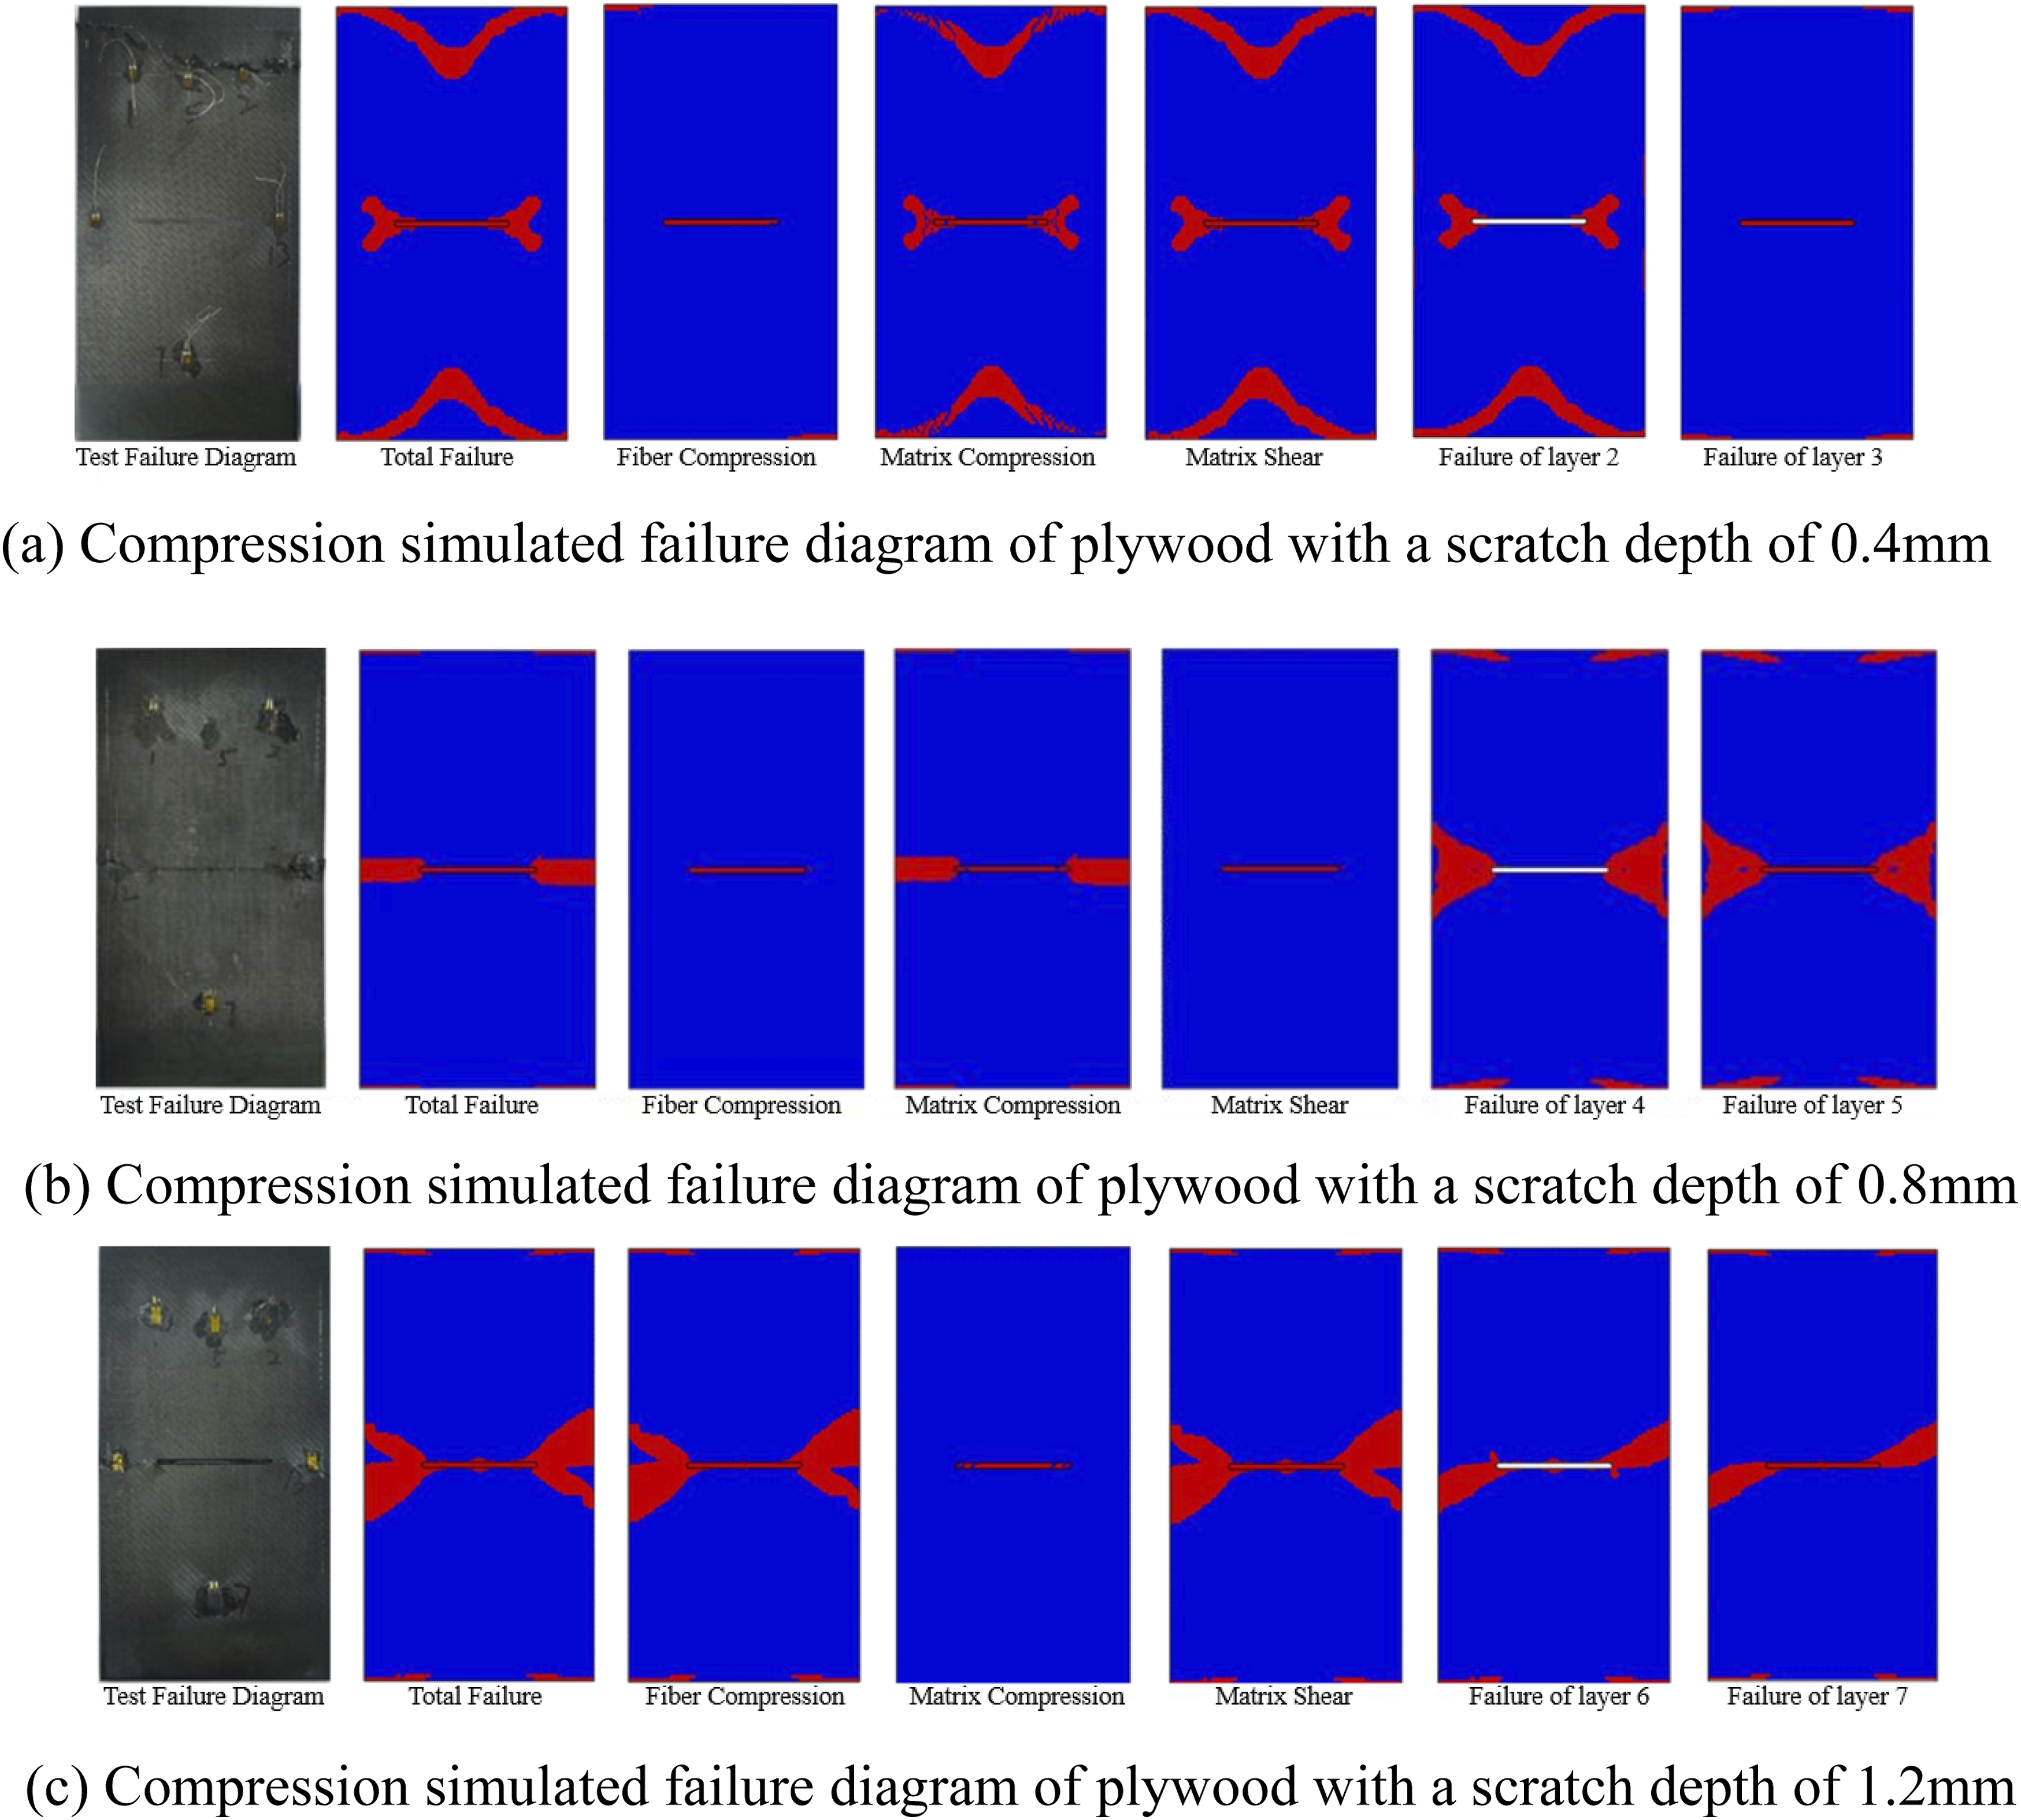
For laminates with a 0.8 mm scratch, failure primarily occurs at the scratch and its extended line. Visible surface damage includes fiber compression, matrix compression, and matrix shear failure near the scratch and along its extension. This is caused by stress concentration at the scratch root, leading to failure propagation under compressive load. The observed damage patterns align with experimental results.
For laminates with a 1.2 mm scratch, failure is concentrated near the scratch and its extended line. Minor compression failures are observed at the edges of the laminate. Surface damage is dominated by matrix shear and fiber compression. In layers 6 and 7, shear failure starts at the scratch tip and extends diagonally to the edges. Damage propagates laterally and through the thickness, causing complete failure. The observed failure modes and damage locations match experimental results.
As the scratch depth increases, the failure mode evolves, reflecting the growing influence of stress concentration near the scratch. For a 0.4 mm scratch, the failure mode remains similar to the intact laminate, with matrix shear damage spreading diagonally. However, as the scratch depth increases to 0.8 mm and 1.2 mm, the failure becomes more localized at the scratch, with fiber compression and matrix shear failure occurring near the scratch and extending along its line. These changes are caused by the increasing stress concentration at the scratch site, which propagates the damage more quickly under compressive loading. The progression from localized damage to complete failure observed in deeper scratches suggests that the scratch depth plays a critical role in the laminate’s ultimate load-bearing capacity.
Figure 23 shows the failure mode of laminates with a 0.4 mm left-side scratch. The failure mode is similar to that of intact laminates and laminates with center scratches. Shear damage starts at the corners and extends through the laminate. Small damage occurs at the scratch but does not cause overall failure. However, left-side scratches result in larger shear damage near the scratch tip. The instability caused by left-side scratches increases matrix shear, leading to earlier failure. These results are consistent with experimental observations. Simulated compressive failure diagram of laminates with left-side scratches.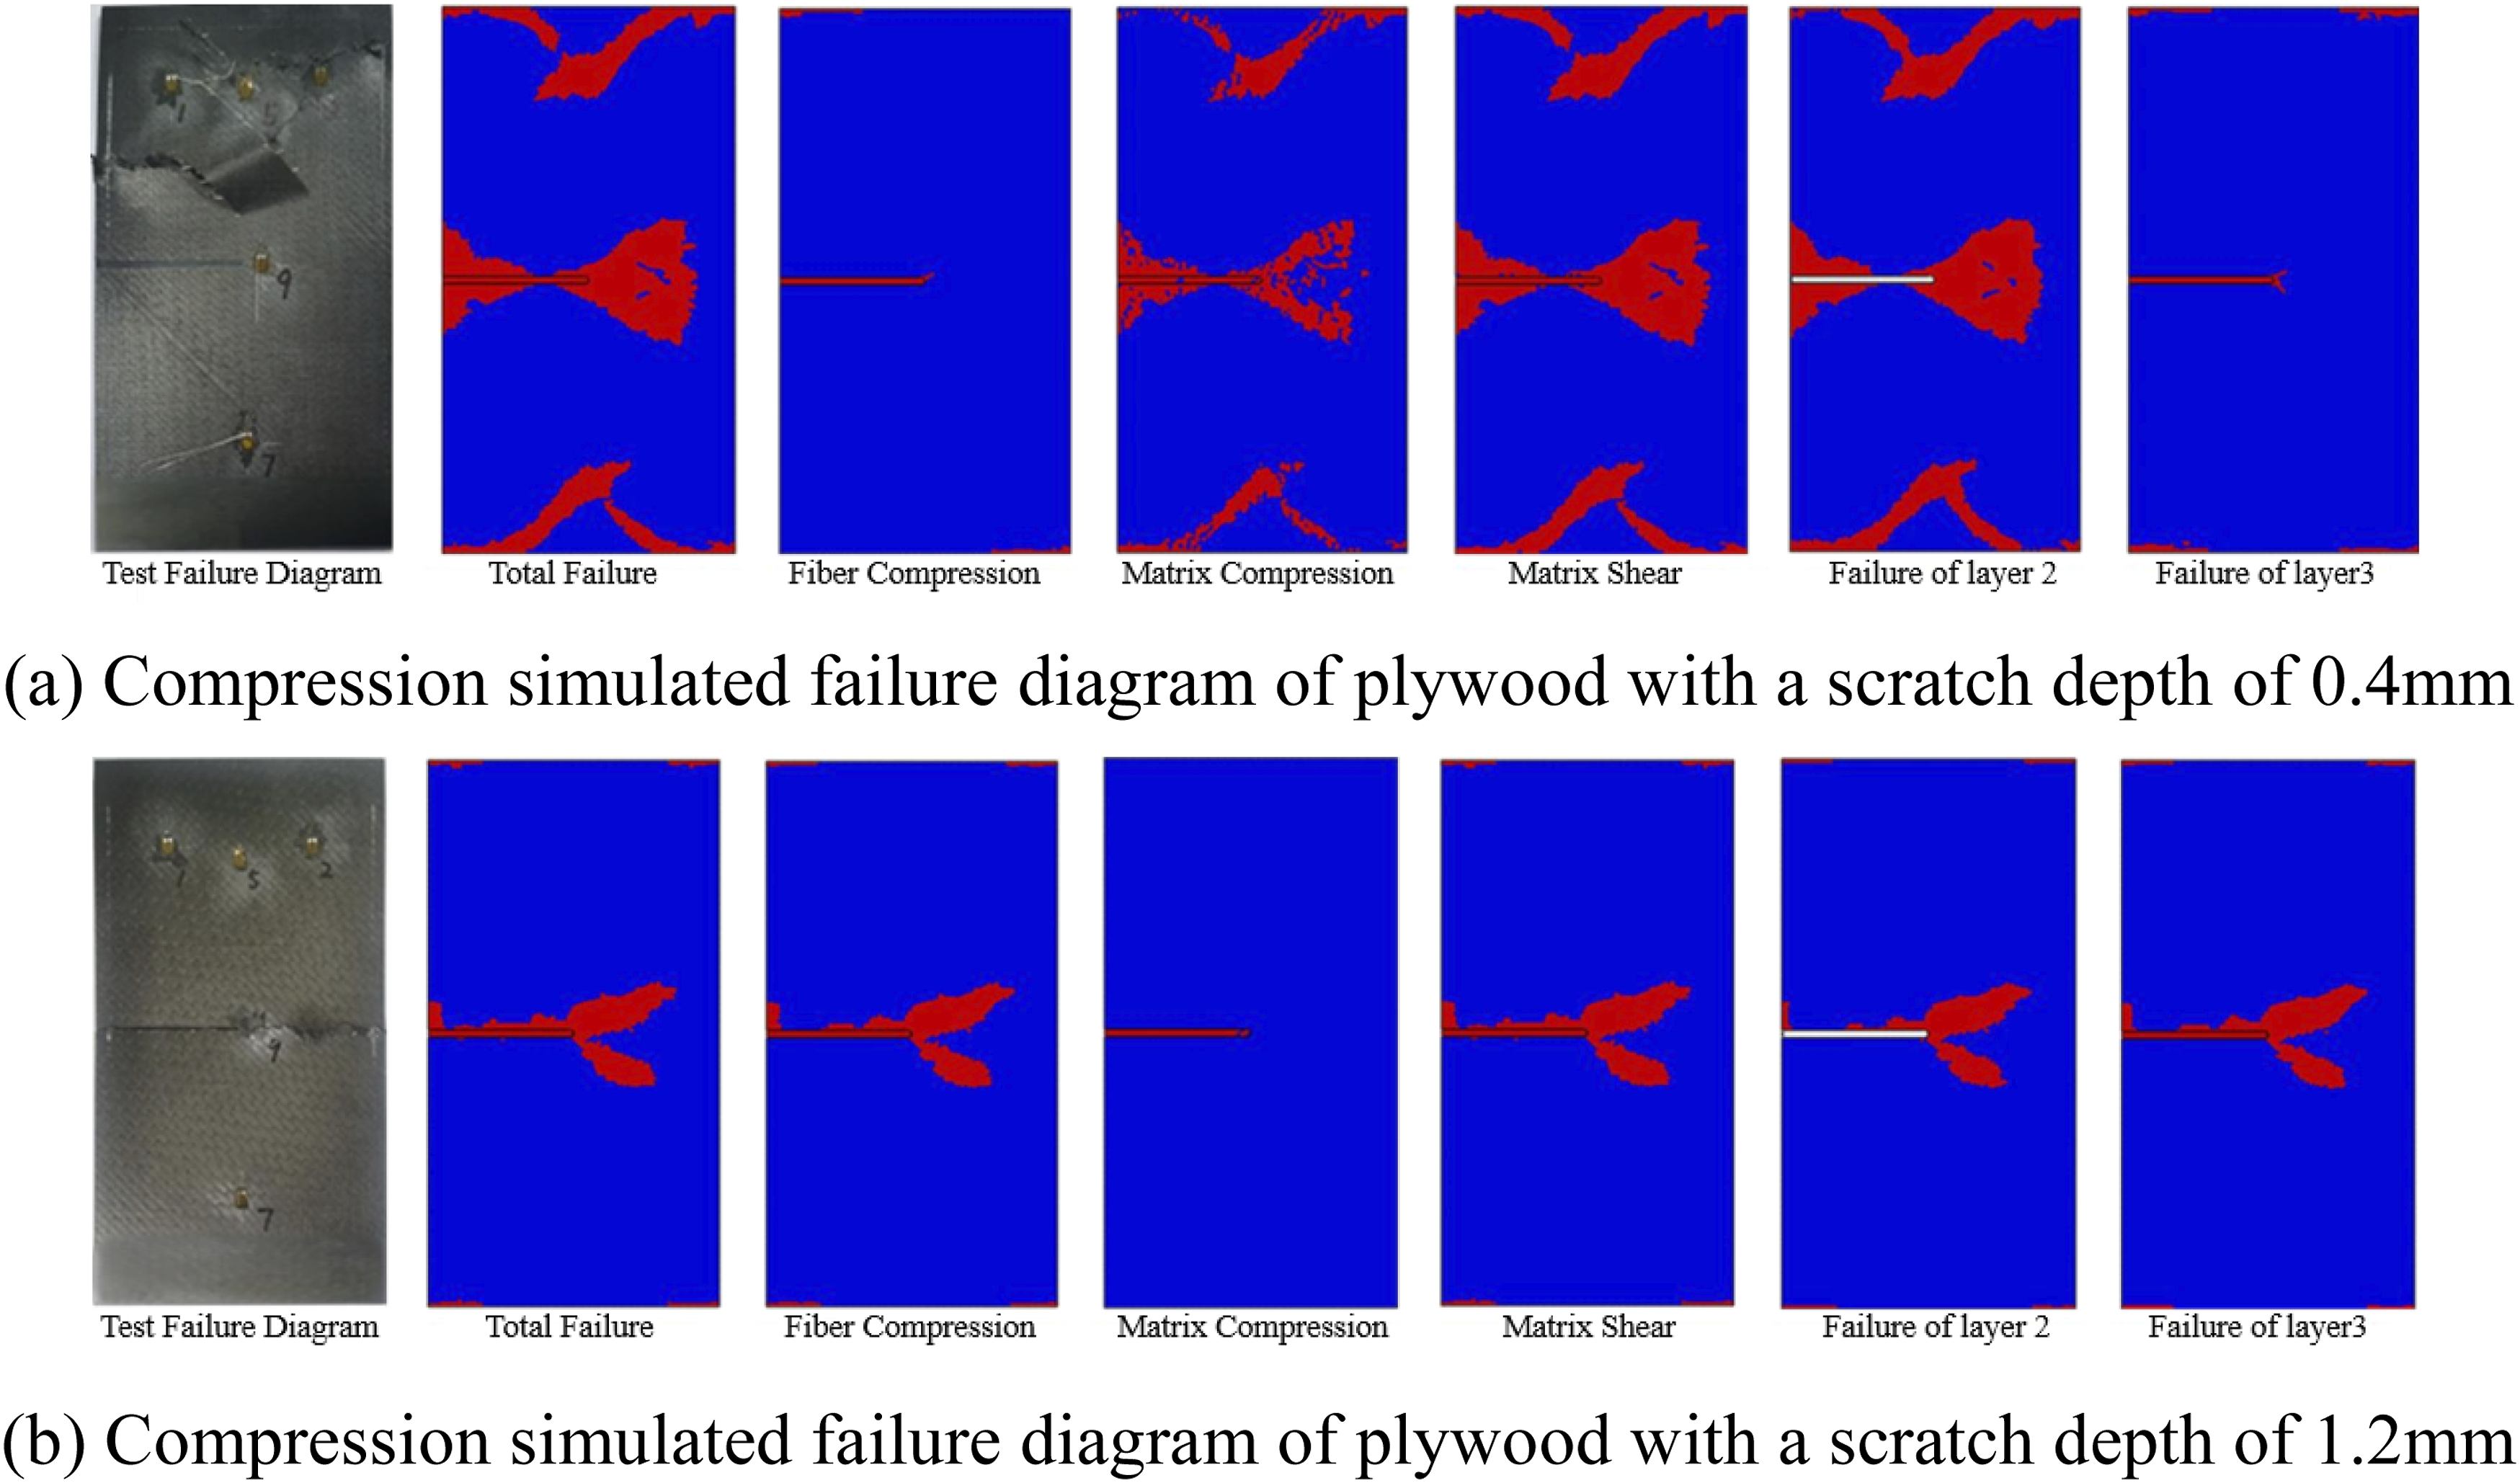
For laminates with a 1.2 mm left-side scratch, damage is concentrated along the scratch and its extended line. Minimal damage occurs at the edges. Failure is dominated by fiber compression and matrix shear. Damage propagates through the thickness and laterally, leading to complete structural failure. The failure mode and damage patterns match the experimental results.
Laminates with left-side scratches show a failure mode similar to those with center scratches, but with an important difference: the instability introduced by left-side scratches increases matrix shear damage, leading to earlier failure. This suggests that left-side scratches may cause more localized stress concentrations, which in turn enhance the shear damage near the scratch. For a 0.4 mm left-side scratch, the failure is still contained, with the shear damage expanding through the laminate but not resulting in total failure. However, as the scratch depth increases to 1.2 mm, the damage becomes more extensive, and the laminate undergoes complete failure.
The scratch tip acts as a stress concentrator. When the scratch depth reaches a critical threshold (0.8 mm in this study), the discontinuity penetrates into the load-bearing plies, triggering delamination that propagates preferentially along the scratch line. The scratch location further affects the propagation path length, thereby influencing the ultimate load capacity. A similar trend has been reported for surface defects, where the transition from a non-critical to a critical defect is determined by whether the damage extends into the primary load-bearing layers. 40 The observed asymmetry—left-side scratches exhibiting higher residual strength than center scratches under deep scratch conditions—confirms that the scratch location influences the delamination propagation path and the energy absorption capacity before failure.
These findings align with the experimental results, indicating that left-side scratches affect the laminate’s structural integrity differently, accelerating the failure process.
Failure modes and analysis of simulation results for holed laminates
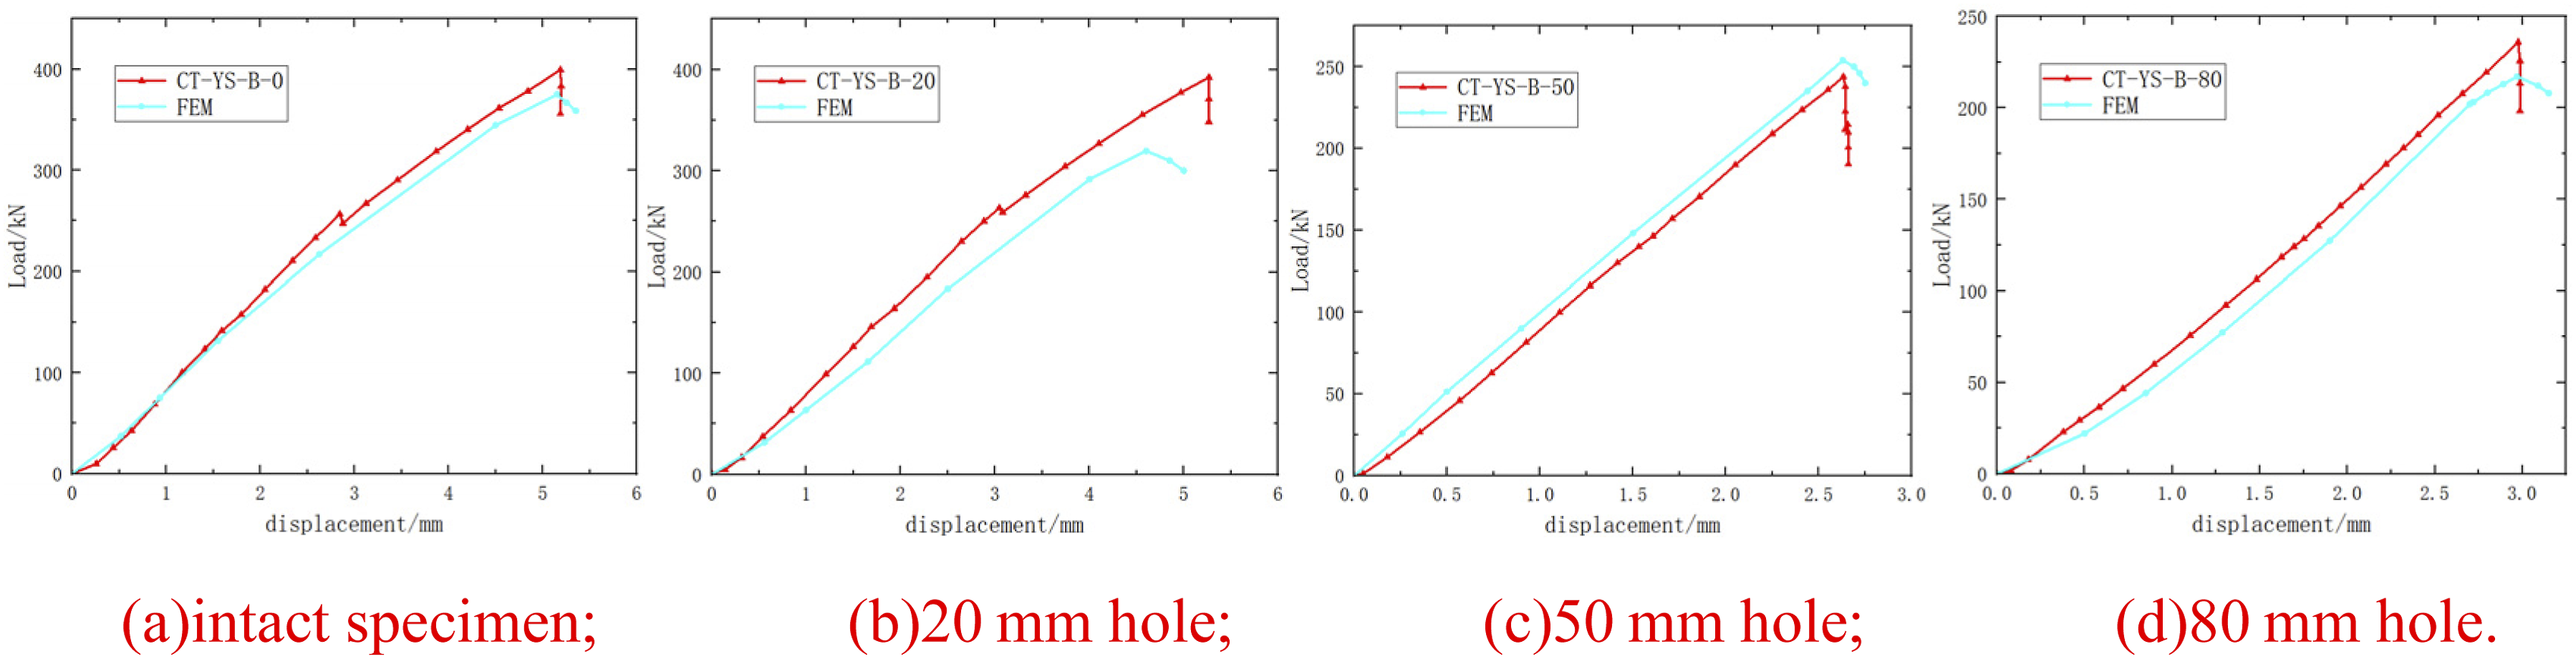
To validate the numerical model for holed laminates, the experimental and numerical load–displacement curves are compared in Figures 24 and 25. Figure 24 presents the comparison for A-ply laminates, including intact specimens and those with hole diameters of 20, 50 and 80 mm, while Figure 25 presents the corresponding comparison for B-ply laminates. The experimental curves, presented in red, are selected from specimens whose ultimate loads are closest to the average value of each configuration. The numerical predictions, shown in blue, show good agreement with the experimental results for both layups. The initial elastic stiffness is well reproduced, and the simulated peak loads are close to the experimental values for all hole sizes, with the quantitative comparison summarized in Table 11. Comparison of experimental and numerical load–displacement curves for A-ply holed laminates. Comparison of experimental and numerical load–displacement curves for B-ply holed laminates. Comparison of simulated and experimental ultimate compressive loads for composite laminates with holes.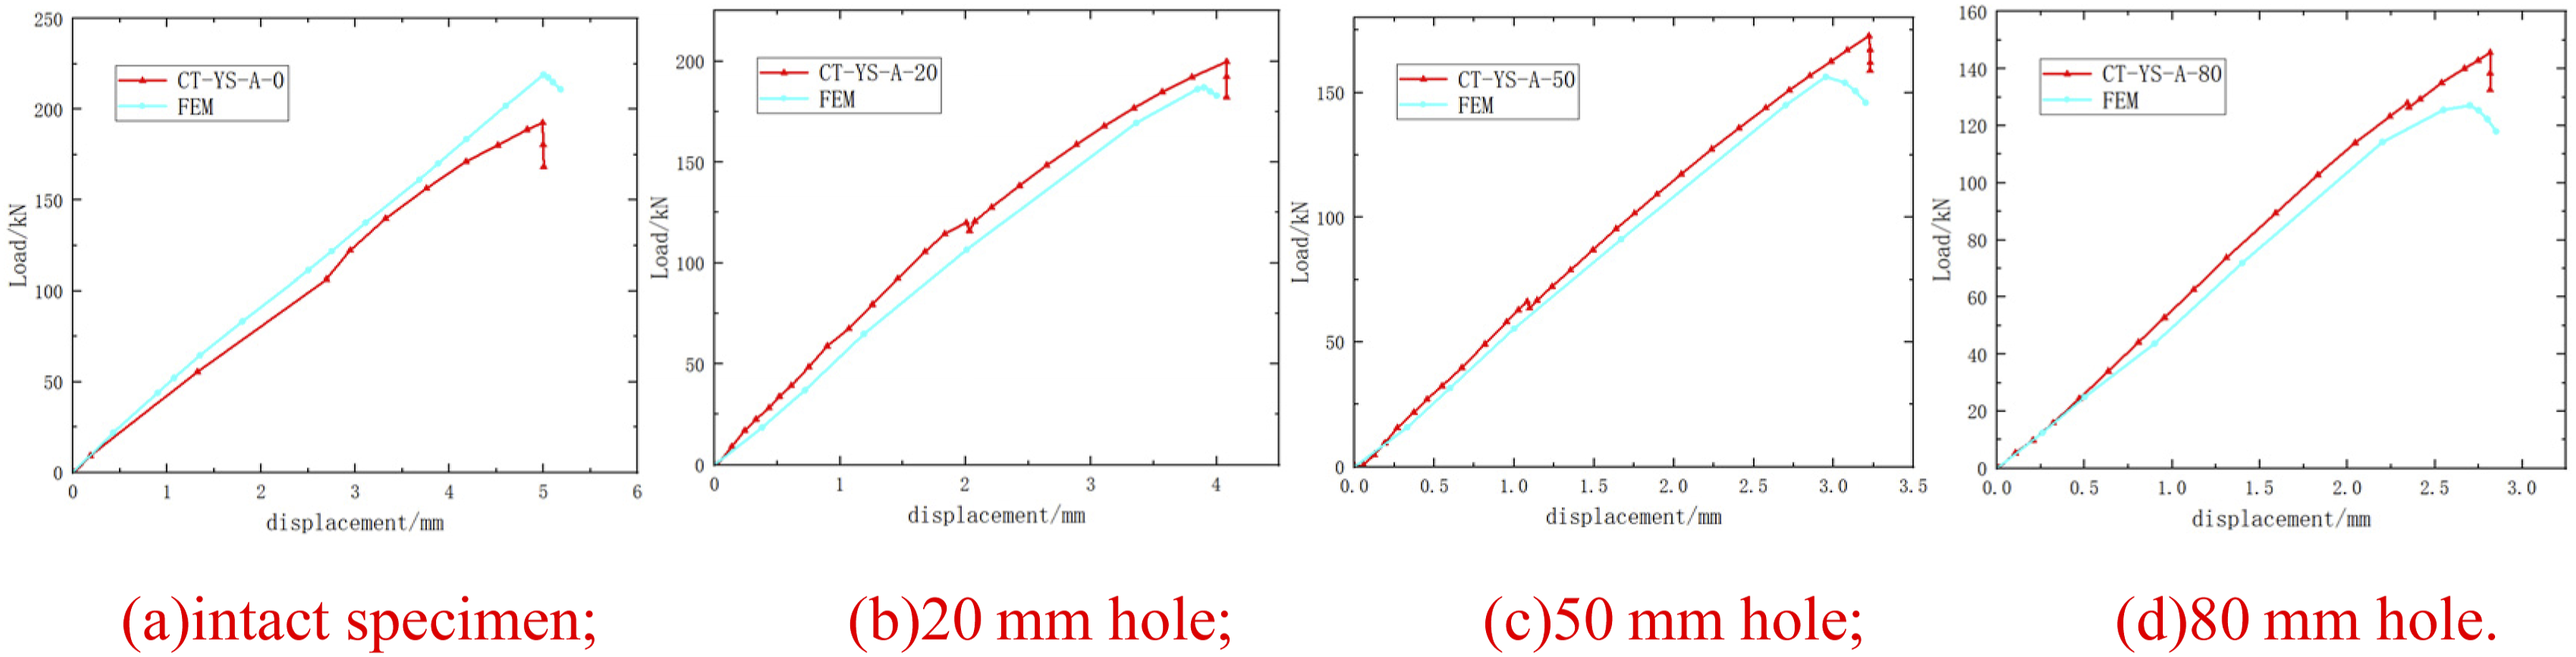
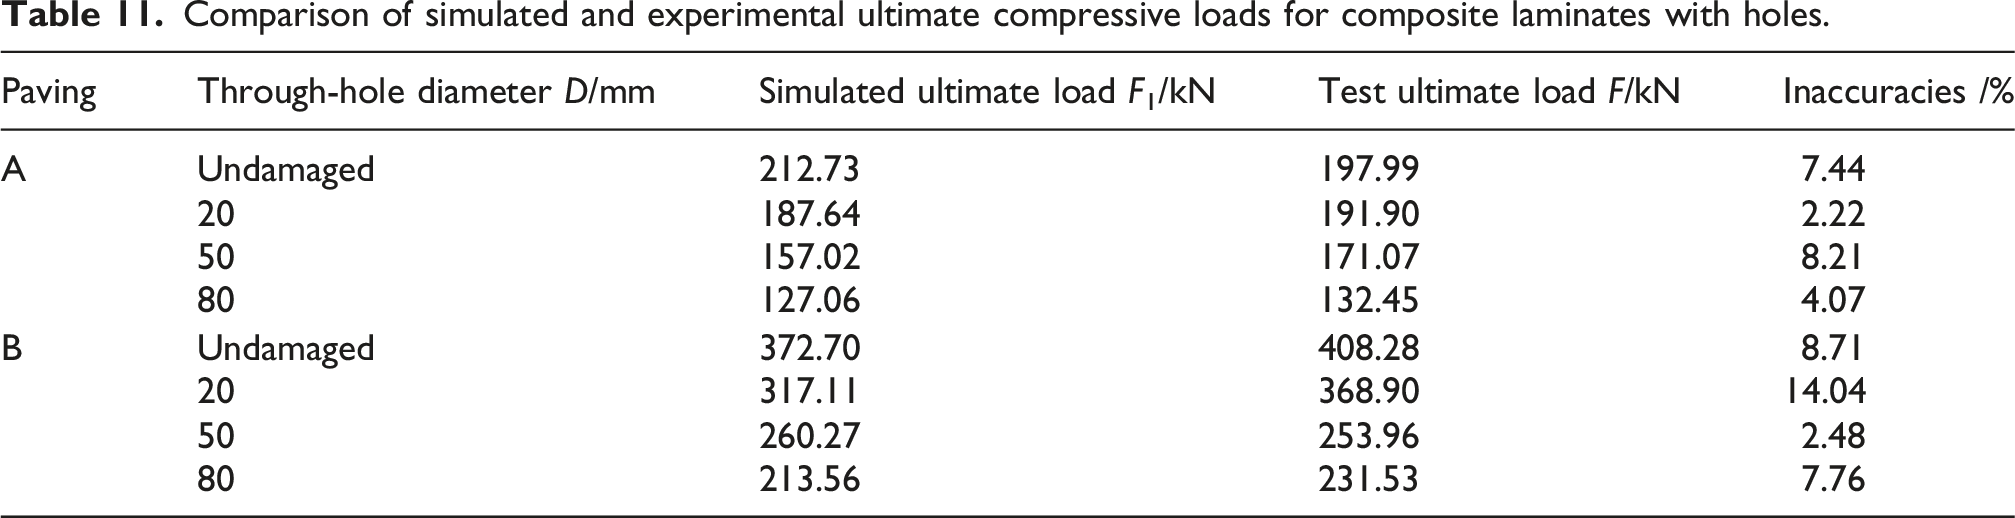
The results from the compressive tests of laminated composite plates with through-holes of varying diameters for both A and B layups are presented in Table 11. For the A-layup, with a laminate thickness of 3 mm, the ultimate compressive load of the intact specimen was 212.73 kN. For specimens with through-holes of 20 mm, 50 mm, and 80 mm diameters, the ultimate compressive loads were 187.64 kN, 157.02 kN, and 127.06 kN, respectively. For the B-layup, with a laminate thickness of 5 mm, the ultimate compressive load of the intact specimen was 372.70 kN. Specimens with 20 mm, 50 mm, and 80 mm diameter through-holes had ultimate compressive loads of 317.11 kN, 260.27 kN, and 213.56 kN, respectively.
As seen in Table 11, the simulated ultimate compressive loads for both A and B layups decrease as the hole diameter increases. This trend is consistent with the experimental results. For specimens with the same hole diameter, the ultimate compressive load of the B-layup is notably higher than that of the A-layup.
The decrease in ultimate compressive load with increasing hole diameter is consistent with the expected results for both A and B layups, demonstrating a clear trend where larger holes cause greater stress concentrations, thus reducing the load-bearing capacity of the laminates. For the same hole diameter, the B-layup laminates exhibit significantly higher ultimate loads compared to the A-layup laminates, which is likely due to the difference in laminate thickness and orientation. The deviation observed in the B-layup specimen with a 20 mm hole diameter, where the simulated compressive ultimate load shows a slightly larger error, is attributed to the compressive failure mode of specimen CT-YS-B-20-3 differing from other specimens of the same size. This reflects the fact that the simulation predicts a more typical crack-through-hole failure, whereas the experimental specimen CT-YS-B-20-3 exhibited an atypical delamination-dominated failure. This anomaly leads to greater variation in the compressive ultimate loads of this type of specimen, causing a larger discrepancy between the simulated and experimental mean values. However, except for this particular case, the errors for all other laminates remain below 8.71%, indicating that the simulation results are generally reliable.
Overall, the errors between the simulated and experimental ultimate loads are within 14.04%, which demonstrates that the simulation method used is generally valid for predicting the compressive behavior of laminated composites with through-holes of various sizes.
To investigate the failure mechanisms and damage evolution process of laminates with holes under compressive loading, seven failure modes were output as state variables in the UMAT subroutine. These modes included fiber tension, fiber compression, matrix tension, matrix compression, matrix shear, delamination tension, and delamination compression. Failure contours of the A-layup composite laminates were obtained, as shown in Figure 26. The results included intact specimens and those with through-holes of 20 mm, 50 mm, and 80 mm diameters after simulated compressive failure. Damage in the intact A-layup laminate was observed at the top and bottom edges. The failure modes were dominated by matrix and fiber damage. Fiber compression failure occurred at diagonal corners. This pattern was consistent with the characteristics of longitudinal fiber compression. The matrix shear failure regions nearly overlapped the overall failure area. This indicated that matrix shear was the primary failure mode for the laminate. Compression simulated failure of A-layered perforated plywood.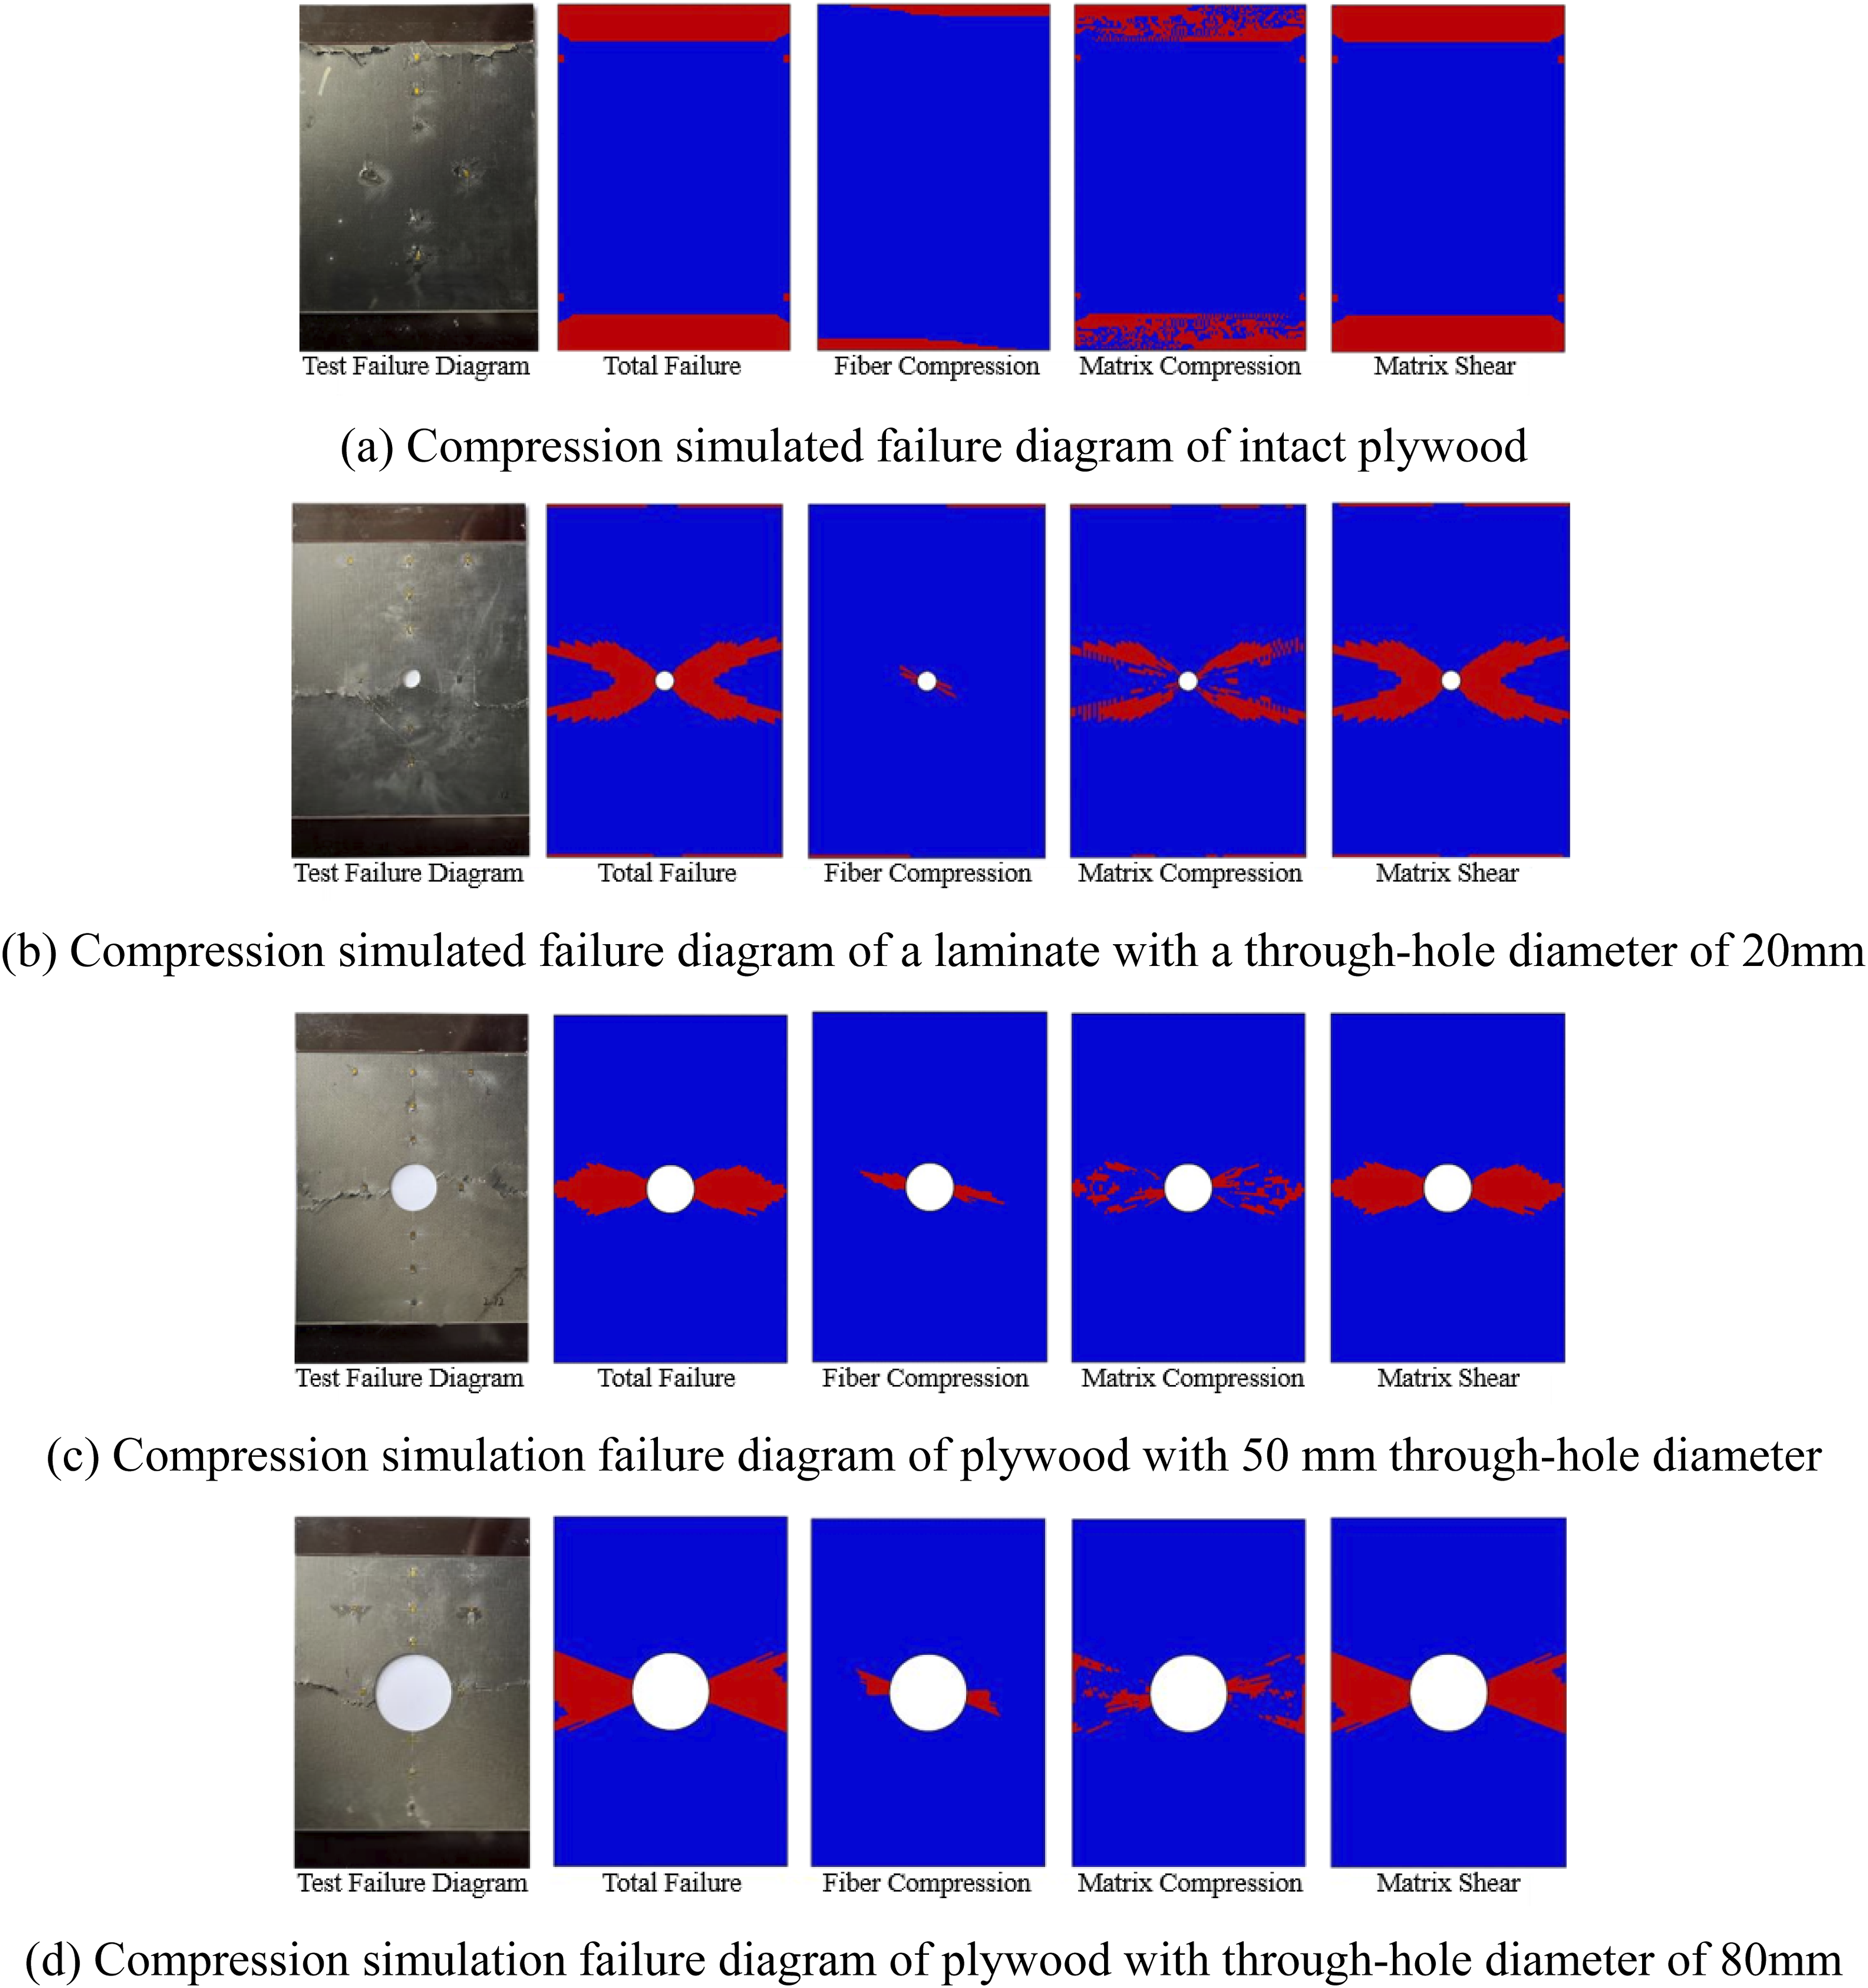
For laminates with holes of varying diameters, the overall failure regions were concentrated in the transverse zone spanning the laminate width through the hole. This observation was consistent with the failure images from experimental specimens. Cracks were observed to pass through the hole and extend across the entire laminate. It was inferred that the failure of laminates with holes initiated at the hole edge with matrix shear failure under compressive loading. This initial failure caused subsequent compressive failure of both the matrix and fibers.
Figure 27 shows the damage contours for B-layup composite laminates during simulated compressive failure. The results include intact specimens and those with through-holes of 20 mm, 50 mm, and 80 mm diameters. Similar to the A-layup specimens, the failure modes in the B-layup laminates with holes correspond to those observed in A-layup laminates. The primary failure mechanism involves transverse cracks passing through the circular holes. Matrix shear failure is the dominant failure mode observed in the B-layup as well. Simulated compressive failure diagram of B-ply laminates with holes.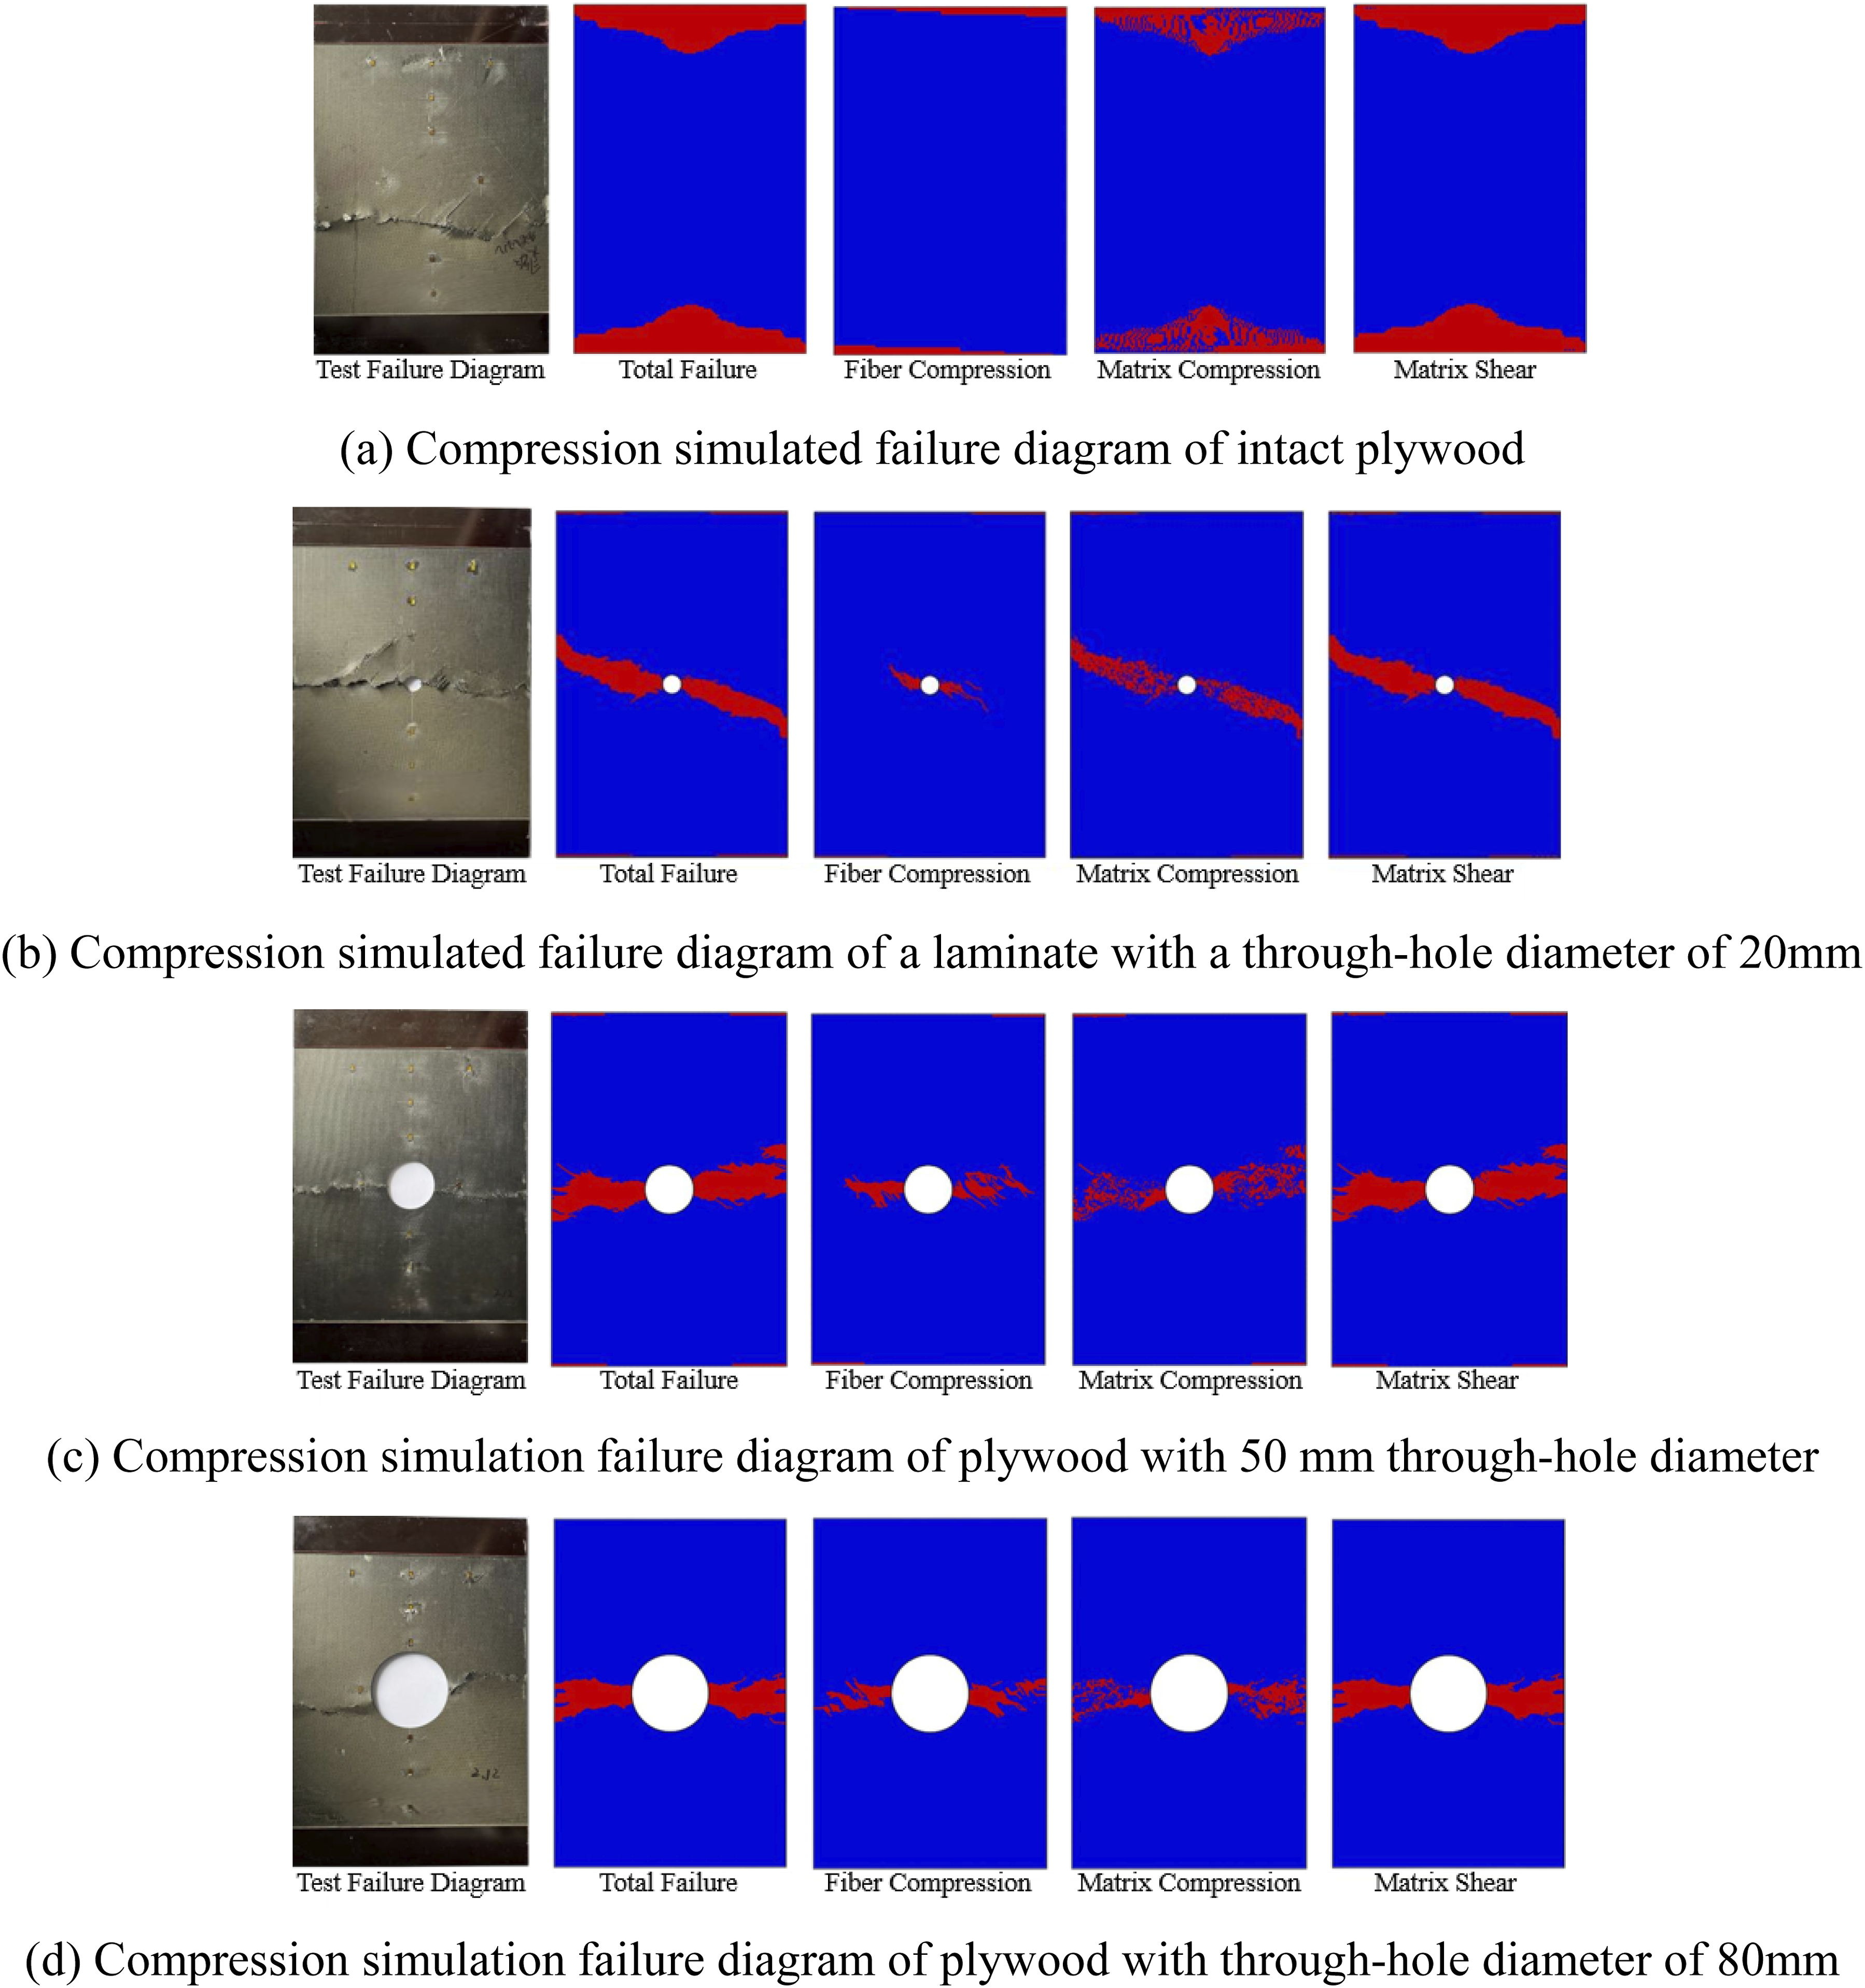
In the B-layup laminate, the failure patterns are similar to those observed in the A-layup, with transverse cracks propagating through the circular holes. The cracks are concentrated around the hole and extend across the entire laminate. This suggests that matrix shear failure is the dominant failure mechanism, which is consistent across both A and B layups. The failure locations and failure modes in the B-layup laminates are in agreement with the experimental observations, further validating the simulation results.
As the hole diameter increases from 20 mm to 80 mm, the reduction in ultimate compressive load is more pronounced for the thicker B-ply laminates (43.3%) than for the thinner A-ply laminates (33.1%), despite B-ply having higher absolute load-bearing capacity. This thickness-dependent sensitivity arises from the laminate configuration. The presence of different fiber orientations and laminate thicknesses in the B-layup likely contributes to its enhanced performance under compressive loading, creating more potential delamination interfaces. Once damage initiates at the hole edge, it can propagate along multiple interfaces simultaneously, leading to more extensive through-thickness delamination before complete failure. This is supported by the failure morphologies in Figures 18 and 19, where delamination around the hole is more extensive in B-ply laminates. Moreover, the larger absolute load carried by thicker laminates means more load is transferred through the hole region, amplifying the detrimental effect as hole diameter increases. This behaviour is consistent with the well-documented thickness effect in notched composites, where hole size and laminate thickness are key variables controlling notched compressive strength.41,42
Conclusion
This study systematically investigated the compressive failure behavior of damaged composite laminates through combined experimental and numerical approaches. The experimental program examined the effects of scratch depth, scratch location, and hole diameter on compressive performance, while the numerical simulations employed a progressive damage model to predict failure evolution. Based on the experimental and numerical results, the following conclusions are drawn: 1. Failure mode of intact laminates: Failure in intact laminates under compressive loading is characterized by matrix damage initiated at one end, which propagates as cracks toward the opposite end, causing continuous fiber fractures. The crack eventually extends transversely across the entire laminate, resulting in complete structural failure. 2. Effect of scratch depth: Shallow scratches (0.4 mm) have negligible influence on load-bearing capacity and failure modes, which remain consistent with those of intact laminates. Deeper scratches (0.8 mm and 1.2 mm) significantly reduce the ultimate load, with reductions of 31.33% and 42.29% respectively, and initiate failure by delamination at the scratch tip accompanied by fiber and matrix fractures. Cracks propagate along the scratch line and ultimately lead to structural collapse. 3. Coupling effect of scratch depth and location: The influence of scratch location on compressive performance depends on scratch depth. For shallow scratches (0.4 mm), left-side scratches cause greater performance degradation (15.00% reduction) than center scratches (6.15% reduction). For deeper scratches (1.2 mm), however, center scratches result in more severe reductions (42.29%) than left-side scratches (36.39%), indicating an interactive effect between location and depth. 4. Failure mechanism and thickness sensitivity of holed laminates: Failure in holed laminates initiates by delamination at the hole edge, followed by matrix cracking, fiber fracture, and through-thickness damage propagation. Complete failure occurs when cracks penetrate the entire laminate. Increasing hole diameter from 20 mm to 80 mm reduces the ultimate load by 33.1% for A-ply laminates and 43.3% for B-ply laminates, indicating that thicker laminates exhibit greater sensitivity to hole size due to increased stress concentration and more extensive delamination propagation. 5. Validation of the numerical model: The 3D Hashin-Tserpes-Camanho progressive damage model accurately simulates the compressive failure of damaged laminates. Simulated ultimate loads for scratched laminates show errors below 10.20%, while errors for holed laminates are within 14.04%, confirming the validity and accuracy of the numerical method. The predicted failure modes, locations, and propagation sequences also show good consistency with experimental observations, demonstrating the applicability of the simulation model for analyzing composite laminate damage.
Footnotes

Ethical considerations
This study does not involve human participants or animals. Therefore, ethics approval is not applicable. And all authors have read and approved the final manuscript.
Author contributions
Funding
The authors disclosed receipt of the following financial support for the research, authorship, and/or publication of this article: This work was supported by the Aeronautical Science Foundation of China (Grant No. 2024M074052003).
Declaration of conflicting interests
The authors declared no potential conflicts of interest with respect to the research, authorship, and/or publication of this article.
Declaration of Original Material
All materials presented in this manuscript, including text, illustrations, photographs, charts, figures, tables, and any other visual content, are original works of the authors. All experimental photographs were taken by our research group during the testing program, and all numerical simulation results were generated using the UMAT subroutine developed in this study. No third-party copyrighted materials have been reproduced or adapted in this article. Consequently, no permissions are required for the publication of any of the materials included.This addition clarifies the originality of all content in our article, confirming that no permissions are required for the reproduction of any materials.
Data Availability Statement
The data that support the findings of this study are available from the corresponding author upon reasonable request.