
Abstract
Income varies considerably within countries and the locations where conflicts emerge are rarely typical or representative for states at large. Yet, most research on conflict has only examined national income averages and neglected spatial variation. The authors argue that civil conflicts are more likely to erupt in areas with low absolute income, even if a country’s gross domestic product (GDP) per capita is not necessarily low, and in areas with large deviations from national averages. The authors test these hypotheses empirically using spatially disaggregated data on the location of conflict outbreaks and per capita income estimates. The authors find that areas with absolute poverty indeed see more outbreaks of conflict, and they find some evidence that inequality increases the risk of conflict. Subnational information can improve on conventional country-based measures and help our understanding of how local features and variation can give rise to mobilization and violence.
Civil war is by far the most common form of conflict in the contemporary global system. The existing literature on civil war has highlighted how poorer countries are more likely to experience conflict as one of its main empirical results. Prominent examples include Collier and Hoeffler (2004) and Fearon and Laitin (2003); we refer to Blattman and Miguel (2010) for a comprehensive review. However, although the negative relationship between income and conflict has been replicated by many studies, there is no consensus on the underlying mechanisms that may account for the observed relationship. Moreover, existing work relating civil war to social and economic conditions has looked almost exclusively at the characteristics of countries at large and neglected variation within countries, even though features such as poverty and income tend to vary considerably within countries (Kanbur and Venables 2005; Mahler 2002). Furthermore, conflicts usually do not engulf the entire territory of a state, and the specific areas that actually experience conflict are rarely typical or representative for countries at large (Buhaug and Lujala 2005).
We argue that geographical variation in income and wealth within countries is very influential in shaping the risk of violence through its impact on incentives and opportunities for mobilization. We look specifically at the location where violence first breaks out, and argue that conflict is more likely to emerge in areas with low income, even if a state in general may not be particularly poor, as well as in areas that see large divergences from country averages. We provide the first global study examining the specific location where conflicts break out and subnational income variation, based on Geographic Information Systems (GIS) data. Previous studies that have attempted to disaggregate the relationship between income and civil war look at events within conflicts rather than initial conflict onset, use indirect measures of development, or cover only a single or a restricted set of countries. 1 Our results strongly support that the location of conflict onsets is related to geographical variation in income. We find that conflicts are more likely to break out in locations with low income. We also find some evidence that regional inequality makes conflict more likely and that pockets of wealth in very poor states are especially likely to see civil conflict break out.
We proceed as follows: We first review how existing research on economic factors in civil war has tended to disregard geographical variation, despite the prominence of geographical inequality and spatial variation in earlier research on nationalism and formal models of state size and secession. We develop propositions linking spatial dispersion in income and inequality to where conflicts break out, focusing on the characteristics of specific geographic locales. We show how local income variation and the location of conflict outbreaks can be reflected in geographical grid cell data and discuss appropriate methods to evaluate our specific hypotheses using high-resolution disaggregated data. We discuss how local information can contribute to the study of conflict more generally.
Income, Inequality, and Conflict: Why Spatial Variation Matters
The association between low per capita gross domestic product (GDP) and conflict is one of the most prominent results in the empirical literature on civil war, although there is no consensus on the mechanisms underlying the finding. Collier and Hoeffler (2004) stress the role of opportunities in explaining resort to violence and highlight how wealth and economic factors shape these. From their perspective, civil wars become less likely in a more developed economy since potential insurgents face higher costs in terms of foregone income from regular economic activities. Conversely, the risk of civil war is high when there is little to be lost from taking up arms, and rebellion can be sustained by looting or appropriation. Fearon and Laitin (2003) see GDP per capita as a measure of state strength and argue that wealthier states see less conflict because they are better able to deter rebellion and enact countermeasures.
Another very different interpretation is that poverty and the distribution of income itself may motivate resort to violence. Dissatisfaction with current economic status and income distributions can lead to support for efforts to topple a government or to secede if people believe that they can do better under a new regime or as an independent state. Older contributions to the literature on revolutionary violence and secessionist conflict often highlight the role of social and economic grievances and relative deprivation (see, e.g., Gurr 1970; Hechter 1975). The motivational role of poverty is often dismissed outright in contemporary research on civil war on the basis that grievances are ubiquitous (e.g., Collier and Hoeffler 2004). However, the interpretation of poverty as a motivating factor is of course in principle equally consistent with the observed relationship as any other argument for which GDP per capita is suggested as a proxy. The fact that poverty and grievances figure so prominently in many case-specific analyses of motivations in conflict (see, e.g., Collier and Sambanis 2005) should make us hesitant to accept the dismissal of grievances without further evidence.
In addition to the premature dismissal of grievances, previous studies of income, wealth, and conflict suffer from a general concept-measure correspondence problem, since they disregard variation within countries and only consider aggregate or average measures for countries. Conflicts virtually never engulf entire countries, but normally take place in confined regions, often in the periphery and in areas that may be atypical and differ notably from the rest of the country (Buhaug and Lujala 2005). Averaging or aggregating features at the country-level in cross-national studies can obscure a great deal of relevant local variation. The conflict in Chechnya illustrates how national and local factors can differ sharply. Chechnya is a small area with less than 1 percent of the population of the Russian federation and will in essence have no influence on national income statistics. We lack reliable data on income for Chechnya prior to the conflict, but existing research suggests very large geographical differences in income within the Soviet Union (see Fuchs and Demko 1979; Schroeder 1973). National-level statistics for Russia in this case clearly cannot reflect the relevant economic conditions in Chechnya and the extent to which these may generate grievances that facilitate violent mobilization. 2
Similar aggregation problems from disregarding spatial variation arise in research on the relationship between inequality and conflict. While many earlier empirical studies found higher levels of general political violence—not necessarily restricted to organized violence against the state such as civil war—in more unequal countries (see Muller and Seligson 1987), recent studies of civil war have dismissed the role of inequality since countries with higher interpersonal income inequality do not appear to have any notably higher incidence of civil war (e.g., Collier and Hoeffler 2004; Fearon and Laitin 2003; but see also Boix 2008). However, these studies consider measures of “vertical” income inequality across individuals (either Gini coefficients or the income share of the upper/lower quintile). Such measures will not be sensitive to or reflect “horizontal” or concentrated inequalities across geographical areas or groups. Researchers that examine measures of horizontal inequalities have generally found stronger evidence for a positive relationship between inequality and conflict (see Stewart 2002, 2008; Østby 2008; Østby, Nordås, and Rød 2009; Cederman, Weidmann, and Gleditsch 2011).
The lack of attention to geographical variation in recent research on civil war is puzzling, as earlier work on nationalism and secession very much emphasized the importance of geographical differences in income and wealth. Hechter’s (1975) book on internal colonialism held that the economic peripheral status of the Celtic Fringe in Great Britain, rather than primordial nationalism, was the key force generating separatist mobilization. Industrialization led to assimilation in the English core but failed to overcome established regional inequalities separating the Celtic periphery and alter the “cultural division of labor” (see also Nairn 1977). Whereas traditional models of national development predict minority assimilation, peripheral economic status fueled further ethnic polarization and nationalism.
Economic and social inequalities can shape nationalism beyond cases of marginalization, and some researchers highlight tendencies toward separatism among aspiring or relatively affluent communities. Gourevitch (1979), for example, noted the rise of nationalism in economically dynamic areas that felt undermined in states where economically more backward areas were politically dominant, with Catalonia in Spain as the canonical case. Similarly, the rise of the Scottish National Party is often attributed to the discovery of oil in the North Sea, strengthening beliefs that Scotland could prosper outside the United Kingdom (Esman 1975). Although such theories of the rise of nationalism do not make specific claims about resort to violence, similar explanations have been offered for the violent breakup of the former Yugoslavia, where separatist movements prepared to use violence emerged in both relatively wealthier areas, such as Slovenia and Croatia, as well as poorer areas, such as Kosovo. Some researchers who highlight the role of inequality explicitly offer this as a critique of the conventional wisdom that ancient ethnic hatreds generate conflict (e.g., Woodward 1994, 1995).
Beyond nationalism in Europe and former Communist states, there is a large potential for violent conflict arising over regional inequalities in the developing world. Regional inequalities are often large in developing societies (Kanbur and Venables 2005; Williamson 1965), and the state often displays a strong tendency toward “urban bias” and systematic neglect of peripheral areas (Lipton 1977). Income disparities are likely to generate contention over local versus central control and redistribution. Individuals in disadvantaged areas may seek to secede, especially if a government is unwilling to provide transfers (Sambanis and Milanovic 2004, 24). Concentrated regional inequalities and lack of state involvement are more likely to give rise to willingness and opportunities for mobilization in existing networks than diffuse social inequalities and can be exploited by conflict entrepreneurs (see Stewart 2002, 2008).
Formal models of “optimal” and “equilibrium” state size suggest similar incentives for secession, although these do not model violence explicitly. Bolton and Roland (1997) develop a model where incentives for secession arise when individuals have different preferences over a country’s single tax rate based on differences in income. Comparatively rich regions have incentives to secede since they will pay more than the average region under a single tax regime. Since the median voter in a region with a highly unequal income distribution will prefer a higher tax rate than the median voter in a region with less income equality there is a potential for redistributive violent movements. Alesina and Spolaore (2005) develop a model of country size where optimal borders are determined by geographical distance to a public good and “ideological distance” or heterogeneity in individuals' preferences, assumed to grow with distance. Both models stress equilibrium country size as a trade-off between efficiency gains from scale and political costs from scale, either divergent views on tax rates or heterogeneous preferences, suggesting that secession or redistributive conflict should be more likely in areas that deviate from the center or country average. 3
Much of the previous research has focused on the effects of regional inequality on ethnic mobilization, but geographic inequalities can fuel conflict even in the absence of ethnic cleavages (see Stewart 2008; Tir 2005). Tadjoeddin (2003), for example, highlights how state efforts to seize assets have generated conflict in richer areas in Indonesia, including the largely ethnically homogenous Java province. Moreover, ethnic cleavages in developing countries are often ambiguous, and whether perceived distinctions become considered as “ethnic” may in part depend on past conflict and lack of integration (Barth 1969). In the Angolan exclave of Cabinda, demands for self-determination only gained prominence after the discovery of oil in 1966, and many question the ethnic distinctness of the Bakongo in Cabinda (Adelman 1975). The specific aims of rebel groups can be ambiguous and difficult to establish and may remain in flux (see Buhaug 2006; Collier 2007; Sobek and Payne 2010). It is often difficult to classify whether conflicts are “ethnic” or not (e.g., many rebel organizations without stated “ethnic” aims recruit disproportionately from separate groups, see Wimmer, Cederman, and Min 2009). Insurgents facing weaker states may increase their demands from autonomy to full control over the government (as in the case of Ethiopia). More generally, some researchers stress how the political rhetoric of insurgent groups often masks more personal economic incentives. Work on rent seeking and conflict, such as de Soysa (2002), highlights how valuable resources can be a “honey pot” and attract violent efforts to gain control over sources of wealth. The distorting effects of national resource wealth on the state and political institutions are likely to be especially large in developing countries and can further fuel dissatisfaction with the central government and promote violent rebellion (see Ross 2004).
Our focus here is on where a conflict breaks out and its relationship to geographic inequality rather than differences between ethnic or other social groups. We certainly do not want to deny the potential relevance of ethnic exclusion for civil war (see, e.g., Buhaug, Cederman, and Rød 2008; Toft 2003). However, looking only at ethnic groups will by construction make it impossible to consider how regional inequality may fuel conflict without ethnic referents, like Marxist insurgencies. Since ethnic group settlement areas can be large, a single group average can mask considerable internal geographic variation or areas with particular features. Finally, we note that since local economic marginalization and regional inequality has not been explicitly considered in previous studies of political ethnic exclusion, it is possible that some of the effects may stem from a relationship between political and economic exclusion (see Cederman, Weidmann, and Gleditsch 2011). We consider how spatial variation in income may influence the specific conflict outbreak locations, although we explicitly consider whether wealth differences overlap with ethnic cleavages.
We develop five hypotheses relating the specific spatial distributions of income and wealth to locations where conflict is more likely to emerge. We focus explicitly on the relationship between local conditions and the outbreak of conflict, as opposed to the scope or incidence of conflict. We believe that the characteristics of areas of initial violence better reflect the underlying motivation or opportunities for mobilization. The initial attack locations tend to be influenced by political motives and the intrinsic importance of targets (e.g., military barracks and government offices) and are almost always in the settlement area of the insurgents' stated constituencies. By contrast, subsequent conflict activities can reflect a wider set of strategic considerations, including operating in inaccessible terrain or unpopulated areas, and fighting can shift over time in response to the dynamics and changing fortunes on the battlefield, all of which may attenuate or obliterate any correspondence to initial motivation or opportunity. Moreover, if conflicts eventually spread across large territories, their full geographic scope may encompass a great deal of internal local variation and raise aggregation problems.
Our first hypothesis relates the risks that locations will see outbreaks of conflicts to the absolute income levels of a specific locale:
Hypothesis 1: The risk of conflict onset in a location increases with lower per capita income.
One important implication of this hypothesis is that we would have a higher risk of seeing resort to violence in poor areas, even among countries with a higher average per capita income. We note that although an income proxy per se cannot distinguish or adjudicate between the different mechanisms suggested in existing research, most arguments relating income to conflict clearly suggest that local income should be more important than average per capita income for a country, since national income statistics will be dominated by more populated areas and can mask considerable internal variation relevant for the risk of conflict. Indeed, at the country level, the prospects for violent conflict should depend on the weakest link, or the least affluent area of a country, rather than national average income or population weighted GDP per capita.
4
Arguments about state strength provide a possible exception; poorer areas may have less developed state infrastructure and deterrent capacity (see Fearon and Laitin 2003), but more capable states should at least in principle be able to reallocate resources from elsewhere to vulnerable areas. If local conditions are simply irrelevant, then local income should provide no additional information on conflict risks once we consider average country income.
Although Hypothesis 1 implies that a higher income should generally lower the risk of conflict, we also expect the risk of violent conflict to increase with larger inequalities. Stated differently, it is not just the absolute local conditions that can influence incentives for resort to violence, but the direction and magnitude of differences between a locale and other areas of the country. Although there are many possible reference points that can be chosen to evaluate spatial inequalities, we believe that the national average provides a reasonable point of reference when evaluating whether a particular area is relatively more deprived or affluent. In its most general form, the local inequality hypothesis can be stated as follows:
Hypothesis 2: The risk of conflict onset in a location increases with larger income deviations from the national average.
Hypothesis 2a: The risk of conflict onset in a location increases with greater negative income deviations from the national average.
Hypothesis 2b: The risk of conflict onset in a location increases with greater positive income deviations from the national average.
Hypothesis 2c: The risk of conflict onset increases with greater positive income deviations in poor countries.
The hypothesis stated above implies that both relatively wealthier and relatively poorer areas are more likely to rebel. However, it is of course possible that the effects of inequality on conflict may not be fully symmetric and that the effects may hold in one direction but not the other. Incentives to secede do not translate directly into violence. In particular, even if theories of nationalism stress the increased risk of secessionism in wealthier areas, it is possible that these may be more amenable to peaceful settlements if the relative importance of wealthier areas to the national economy make governments more focused on avoiding destructive violence and more willing to offer autonomy or concessions than in the case of a poor periphery with less capacity to resist. Hence, we disaggregate Hypothesis 2 into two directed versions:
Our final inequality hypothesis pertains to the potential income reversion effect in poor countries. Even if our expectations expressed in Hypothesis 2b concerning the risk-inducing effect of positive income deviations were not to hold in general, incentives to control sources of wealth may have different effects on poorer and wealthier states. More specifically, high local wealth may increase the conflict primarily in very poor countries, where the state is weak in the first place and the distorting effects of natural resource wealth are particularly large (see Auty 1993). This gives us a final inequality hypothesis:
Empirical Analysis: Scope, Data, and Research Design
In the following section we provide an empirical analysis of our hypotheses. Even though other studies have looked at spatial inequalities and conflict events for a select number of countries, our study is the first to look at subnational variation in income and wealth for a global sample and to focus specifically on conflict onset, as opposed to subsequent events or conflict scope/incidence. We test our hypotheses using spatially disaggregated GIS data that allow us to consider the specific location where conflict breaks out and capture income variation across geographic cells. Gridded data allow scaling information to a consistently defined common unit, and to examine whether cells with certain characteristics (or proximate to particular features) are more likely to see a response of interest, in this case outbreaks of violence (see Buhaug and Rød [2006]and Nordhaus and Chen [2009] for other gridded data applications), and allow us to consider a wider range of geographical locations than alternative units such as administrative entities. 5 We use a new data set entitled PRIO-GRID (see Tollefsen, Strand, and Buhaug, forthcoming) that provides a global grid with a resolution of 0.5 × 0.5 decimal degrees (roughly 50 × 50 km at the Equator), based on the WGS 1984 coordinate system, partitioning the earth’s landmass into approximately 62,000 cells in a cross section.6
Geographical Variation in Income and Wealth by Grid Cells
Before turning to the specific indicators to test our hypotheses, we briefly review our geocoded economic data and how these allow us to capture geographical variation in income and wealth within countries. The G-Econ data set developed by Nordhaus (2006) records economic output per 1 × 1 degree grid cell on a global basis for 1990, converted into common metrics including purchasing power parity (PPP) exchange rates. The project uses different methodologies for deriving estimates for individual countries, depending upon data availability. 7 The gross cell product (GCP) can be seen as the local equivalent of a country-wide GDP. The sum of the GCPs for all cells in a country gives the total GDP. Dividing the gross product for each cell with the estimated cell population 8 provides a local per capita income measure. Whereas GDP per capita income provides a population averaged per capita measure for the whole country, the GCP per capita values for individual local cells reflects spatial variation in income within a country.
Figure 1 demonstrates geographical variation in income distribution more systematically for Russia and India. A Lorenz curve plots the cumulative distribution of income over some units, in this case geographical cells. The cumulative distribution under perfect equality would follow a 45 degree line. However, the observed cumulative distribution will rise more slowly the greater the actual inequality. The Gini inequality coefficient is defined by the area between the 45 degree line and the observed cumulative distribution. Figure 1. indicates considerable geographical income inequality in both Russia and India. For example, the poorest 20 percent of the geographical cells in Russia hold only about 7.5 percent of the cumulative share of per capita income, and a very small number of cells in India contribute to a sharp increase in the cumulative distribution at the upper end. We provide measures of the range, variation, and average GCP per capita by country, along with the number of cells and GDP per capita in the Supplemental Appendix.
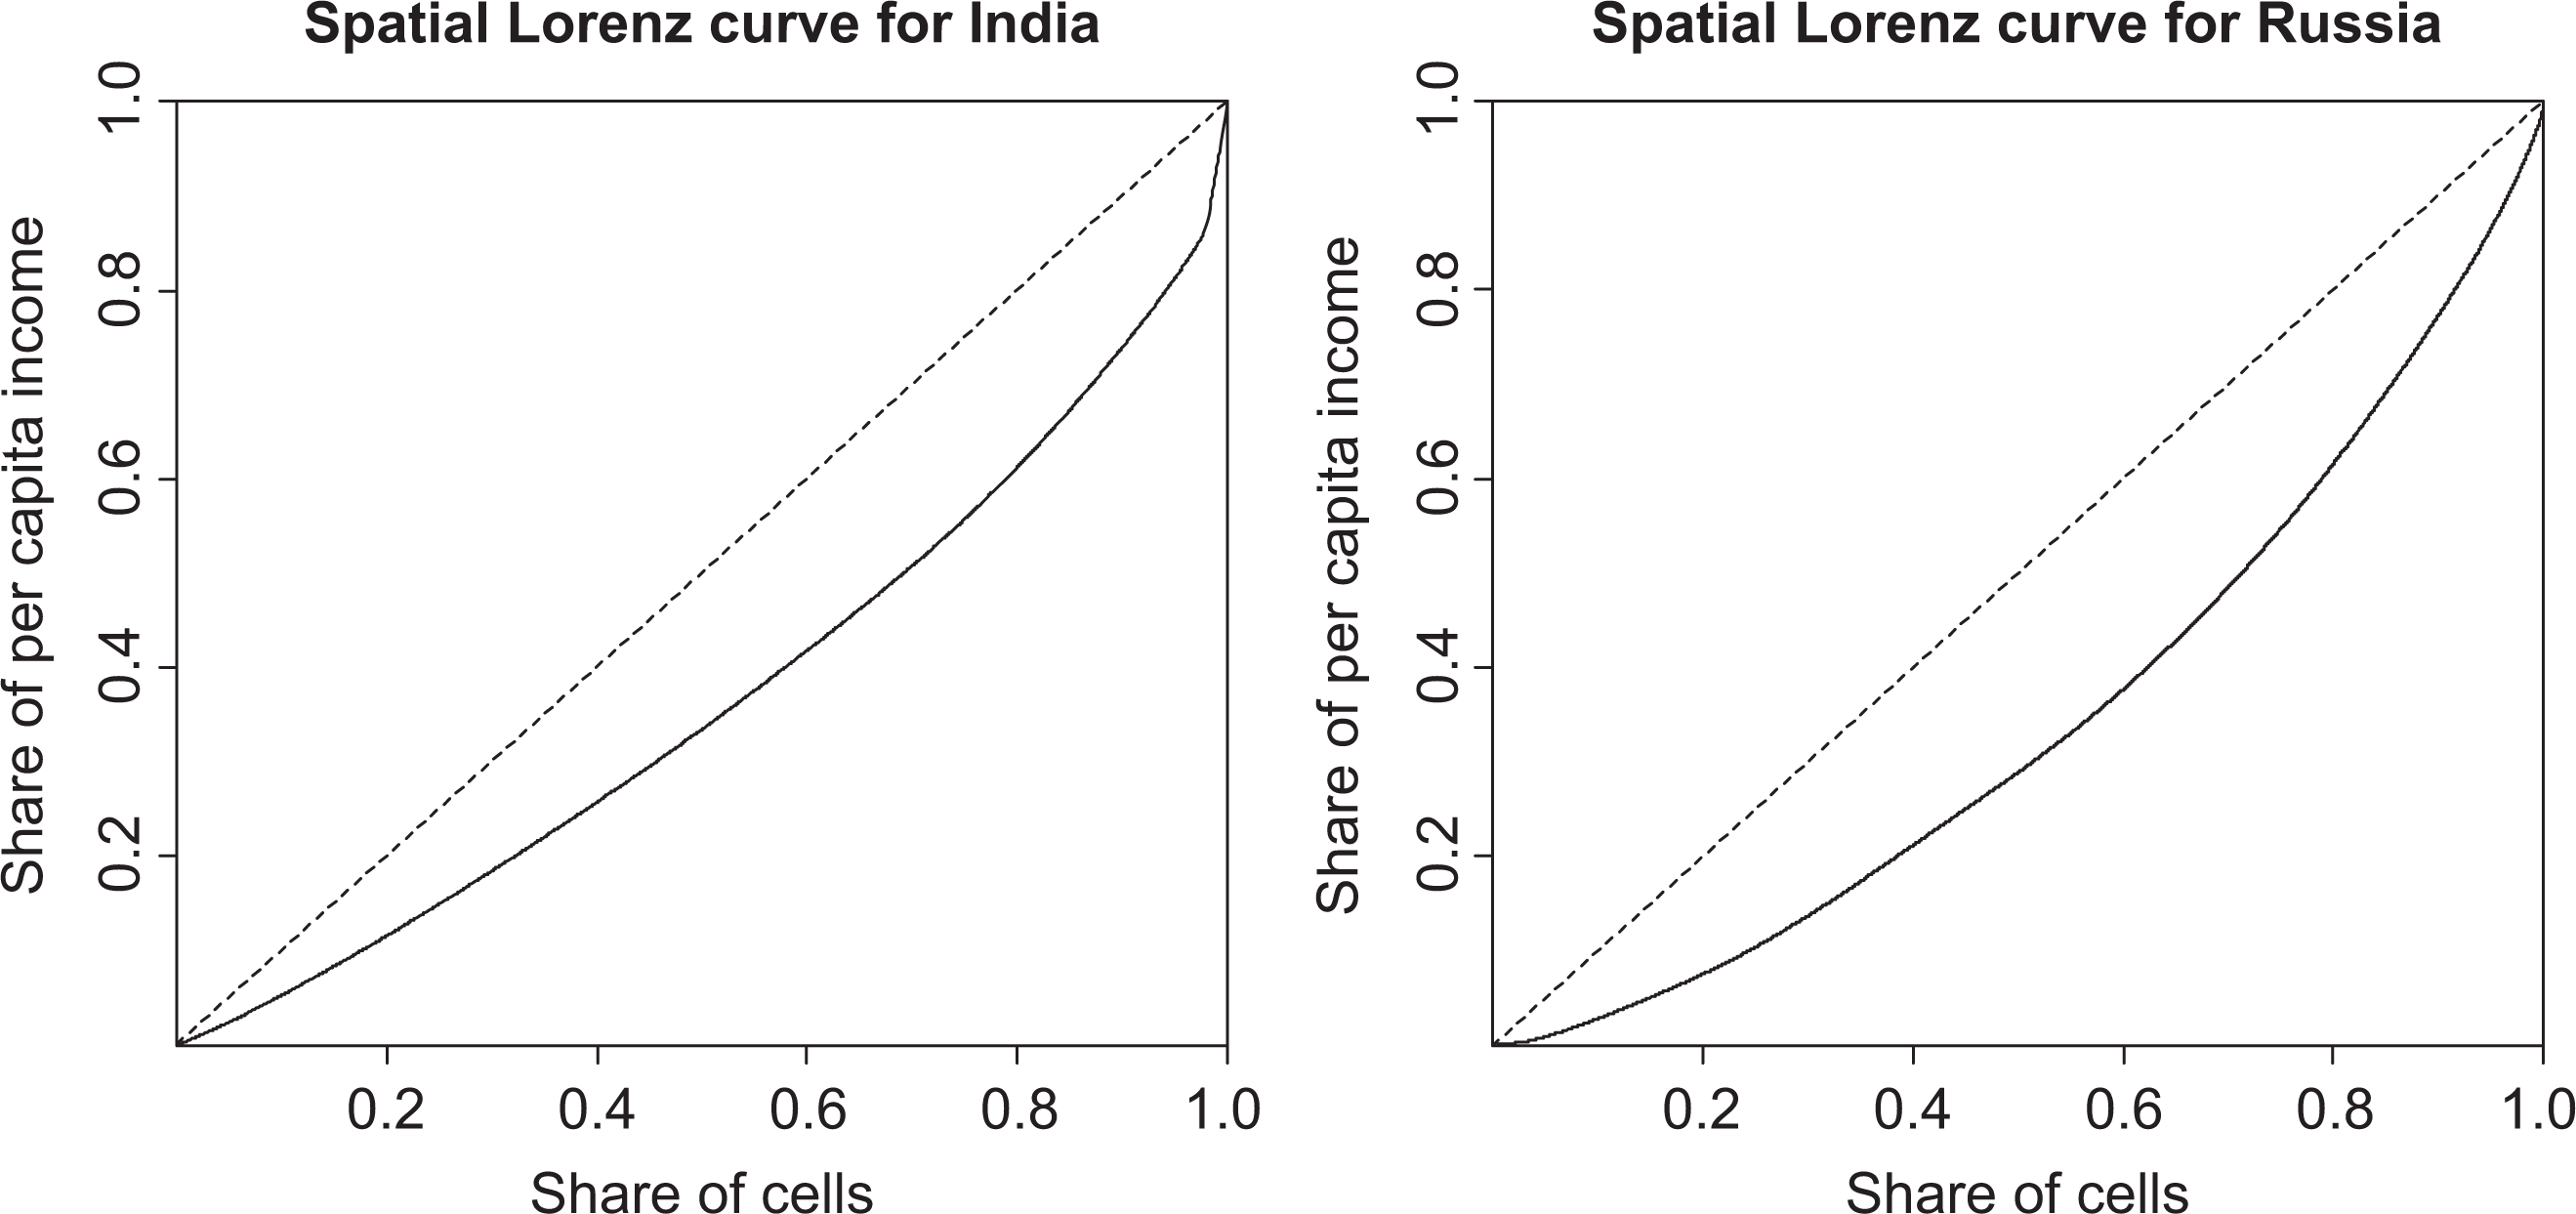
Spatial Lorenz curves of income per capita for India and Russia in 1990
The maps in Figure 2. display the geographic distribution of GCP per capita in India (left) and official 1990 net state product data from the Indian Federal Reserve Bank (right). The large majority of cells in the Indian Northeast, where most of the insurgencies take place, have GCP per capita values below the national median. Comparing the two maps suggests considerable overlap between the state income and grid cell income measures, but it is clear that the Indian states data refer to much larger geographical areas and can therefore mask internal variation and be susceptible to large unit aggregation biases.
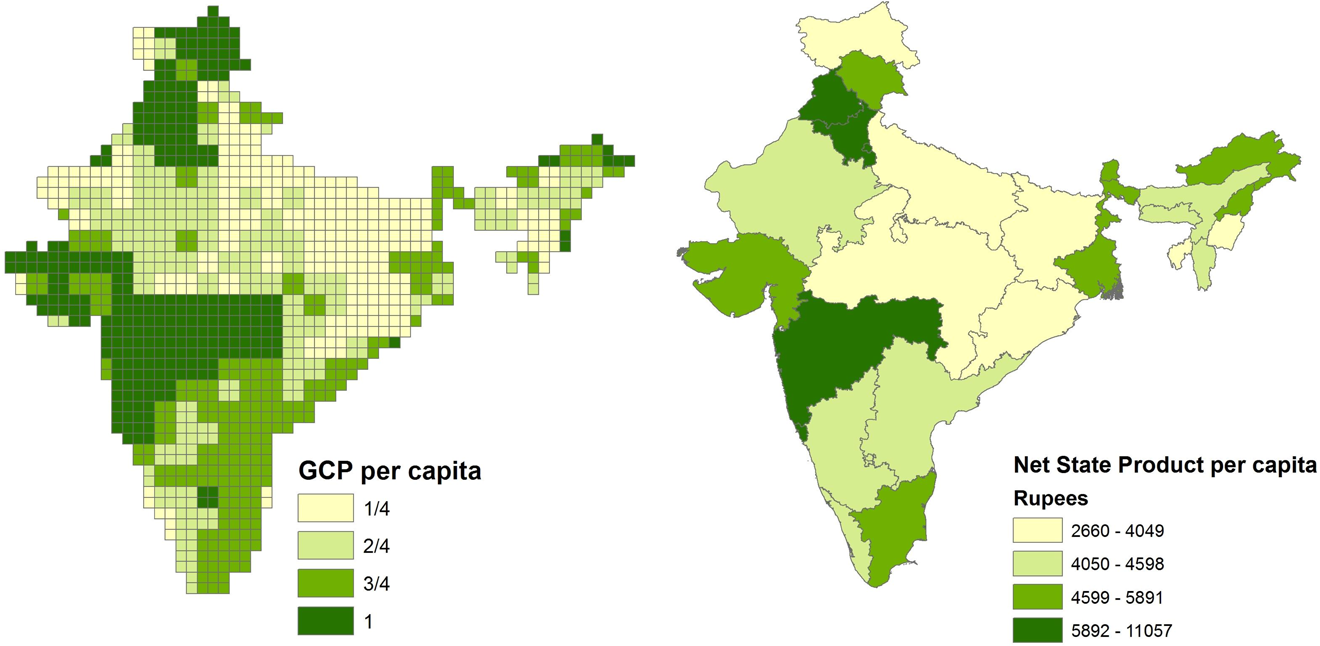
Maps displaying GCP per capita 1990 in India (left) and net state product per capita in 1990 (right) by the quartiles of the respective distributions
Geocoded Conflict Data
Our dependent variable is the outbreak of armed intrastate conflict, based on the UCDP/PRIO Armed Conflict Data set (see Gleditsch et al. 2002). Whereas most data sources contain little information on conflicts beyond stating that a civil war took place in country X in some time interval T, our data specify the location of the initial fighting on the first day of each UCDP/PRIO conflict, by latitude and longitude coordinates (see Holtermann n.d.). The conflict location data were imported into the grid, and each outbreak was assigned to the corresponding grid cell.
Empirical Scope and Details on Operationalization of the Hypotheses
The G-Econ data provide the best available measure for spatial variation in economic activity on a global basis. Unfortunately, the data are available only for a single year, that is, 1990. 9 In order to ensure that the GCP variable is measured prior to the conflict outbreaks, we restrict the analysis to the subsequent decade, 1991–2000. 10
To operationalize Hypothesis 1, relating onset to absolute income levels, we consider the natural log of the GCP per capita. We explicitly compare GCP per capita and GDP per capita in order to evaluate the added information in local measure and operationalize our inequality hypotheses. To evaluate Hypotheses 2a and 2b we consider the difference between GCP per capita and national GDP per capita. We generate separate measures for positive and negative deviations since we do not want to impose symmetry around 0. Both variables are scale normalized by GDP per capita since the absolute weight of a given difference is likely to differ by overall income. To operationalize Hypothesis 2c, we consider an interaction between positive relative income deviations (from Hypothesis 2b) and a dummy for least developed country (LDC), based on the suggested World Bank definition of country per capita income less than $750.
The G-Econ database is an impressive collection, but there is considerable variation in the underlying data quality. Many European countries provide highly disaggregated economic data (up to the third-level administrative divisions), but other countries may have data only for first-level administrative entities, or data with little variance or questionable quality. We exclude all observations (i.e., grid cells) coded as having “low quality” (i.e., quality <2), although we note that there are no armed conflict onsets in such cells. We also exclude cells with no or very low population (i.e., fewer than ten people in the grid cell), and cells with a very low proportion of land mass (threshold for inclusion set at 150 sq km, equivalent to about 6 percent of the grid cell area), as these are unlikely to see conflict outbreak and hence are not relevant comparisons.
The analysis period sees a number of changes in the composition of states in the system and their boundaries, which often take place in the context of violent conflict, in particular the dissolution of the former Soviet Union and the Socialist Federal Republic of Yugoslavia. Whereas some conflicts break out prior to new states achieving independence (e.g., Slovenia and Croatia), others erupt or reignite following independence (e.g., Bosnia and Herzegovina and the Nagorno-Karabakh region in Azerbaijan). Many conflicts in new states are clearly “old” disputes over the dissolution of former states, but conflicts that occur longer after the dissolution of the former states are perhaps better seen as independent conflicts, where comparisons to 1990 capitals may be inappropriate. We emphasize the states in existence in 1990 and their boundaries in our analysis but also consider various robustness tests with respect to regards to how to handle countries with changing borders.
Control Variables
We consider a series of local control variables that may plausibly be associated with variation in both local development and conflict. In order to ensure that our inferences regarding spatial variation in income and wealth do not simply reflect the importance of ethnic cleavages, we include a dummy variable for whether a cell includes at least one politically excluded ethnic group, based on the gecoded version of the Ethnic Power Relations data (i.e., GeoEPR, see Cederman, Min, and Wimmer 2010; Wucherpfennig et al. 2010). Conflict is more common in the periphery (see Buhaug and Gates 2002), and areas farther away from the core of countries are likely to be less developed and have lower state penetration. Moreover, conflicts are more common in border locations, which often span groups from neighboring countries and provide specific opportunities for conflicts, and constitute peripheral areas systematically discriminated by the center (see Salehyan 2009). Previous studies have highlighted the role of rough terrain, such as mountains and dense forests, for the opportunities for conflicts (see, e.g., Fearon and Laitin 2003), but these features may also undermine state penetration and economic development (Cederman 2008; Hechter 1975; Rokkan 1999). We include a number of control variables for peripheral cell position, including the (logged) distance from the capital city and nearest international border, as well as the share of a cell area covered by mountains and forests (data from United Nations Environment Programme [UNEP] and Food and Agriculture Organization [FAO], respectively). We control for total cell population since more populated areas have a higher number of individuals that can mobilize and are more likely to contain targets of initial attacks (radio stations, police stations, etc.). Larger countries have been found to have a greater risk of conflict, and country size may be systematically associated with intercountry variation in income. We thus control for the number of cells in a country. Finally, since capital cities may have a special political significance and hence be more likely targets for violence than would be expected from their (usually higher) income, we consider a dummy variable indicating whether cells comprise national capitals.
Population and Case-Control Analysis
High resolution data are likely to display spatial correlation for many features, and it is clearly unreasonable to treat individual cells in our data as independent of one another. Spatial correlation will typically lead to underestimated standard errors and inefficient coefficient estimates (see Cressie 1991; Ward and Gleditsch 2008). Since nearby observations contribute less “independent” information, the effective number of observations can be much smaller than the apparent N. Given the high resolution of our grid cell data, our observations are more similar to point data common in geostatistics than areal data. It may perhaps sometimes be reasonable to assume that only immediately adjacent neighboring observations are relevant for large areal units such as countries (see, e.g., Ward and Gleditsch 2008), but this is highly unlikely to be adequate for high-resolution cells. It is common practice in geostatics to use a semivariogram to assess the spatial correlation of a variable Z at locations
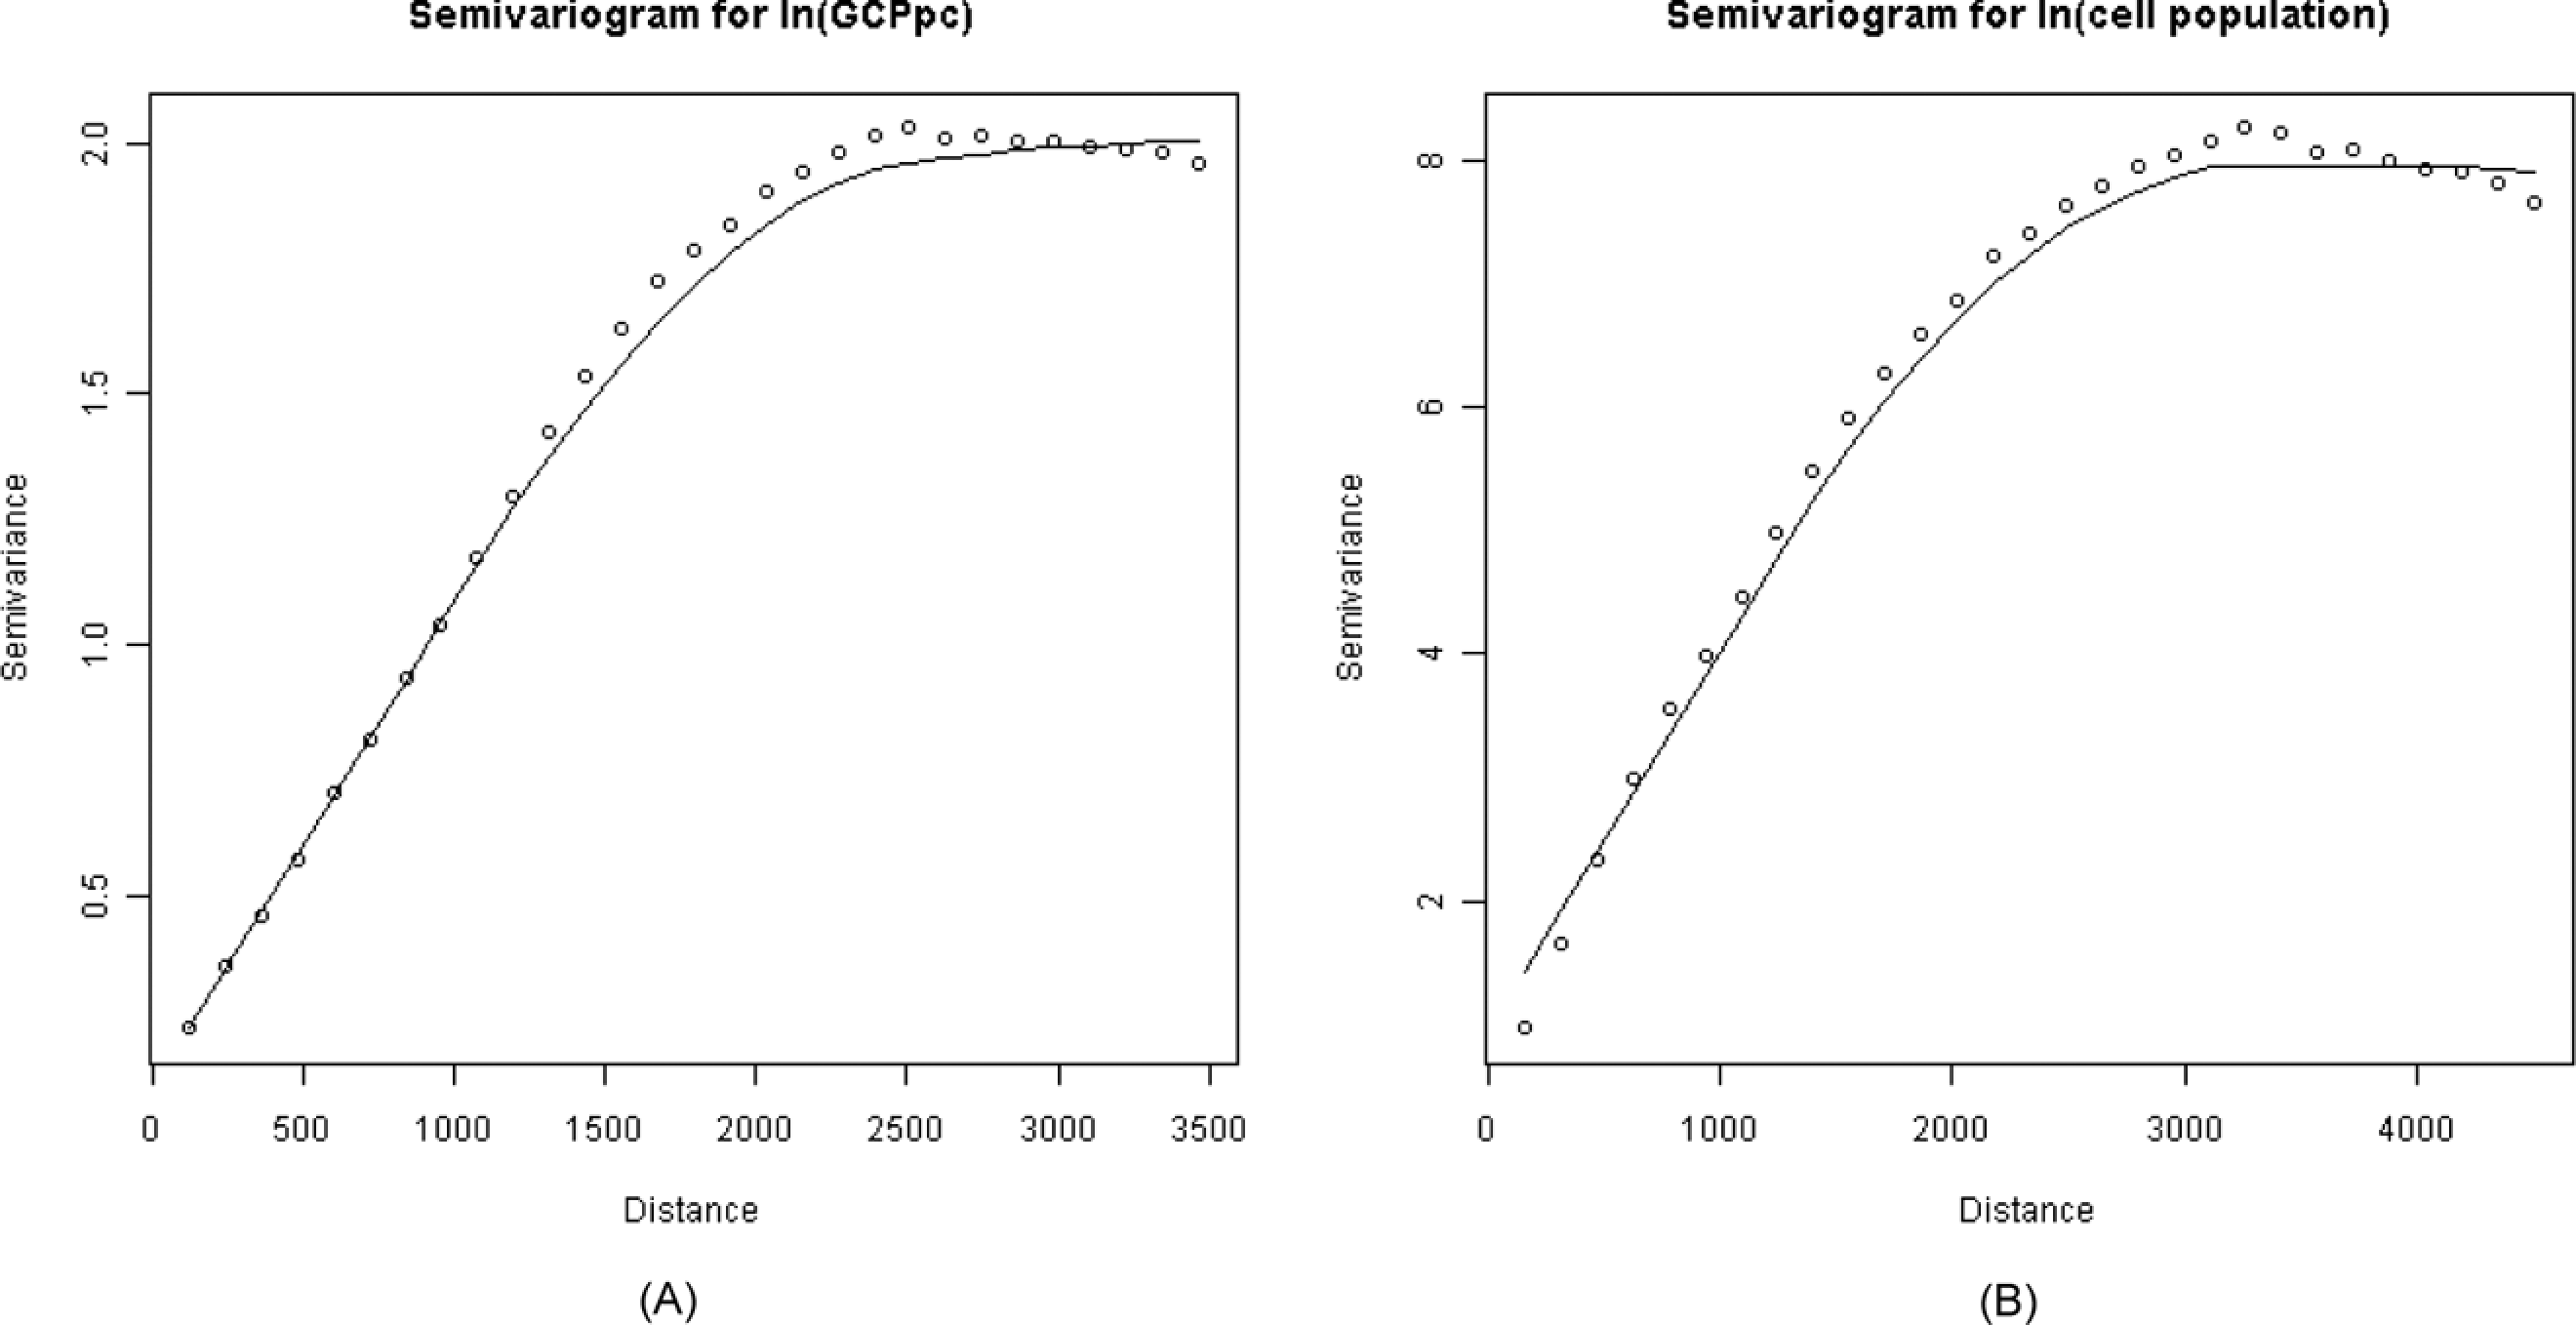
Variograms for (A) ln GCP per capita and (B) ln cell population
Since the conflict data are binary we cannot estimate a conventional sample variogram. However, we can extend the geostatistical threshold “range” idea to categorical data by considering how the proportion of cells with conflict onsets varies with distances to onset points. Strong spatial correlation would yield a high rate for cells close to an onset point, but the proportion should fall as we extend the distance buffer. The left panel (A) in Figure 4 shows the average spatial decay for conflict onset locations, that is, the average proportion of neighboring cells with conflict onset as we extend the distance buffer. Although there clearly are more onsets in nearby cells, the proportion of cells with onset quickly falls as the cell buffer extends up to 500 km. The proportion essentially converges on the sample average (i.e., 0.001) beyond 1,000 km. For conflict incidence—and we stress again that we do not consider this here—Figure 4.B shows a slower decay with distance, although the shape of the spatial pattern is similar.
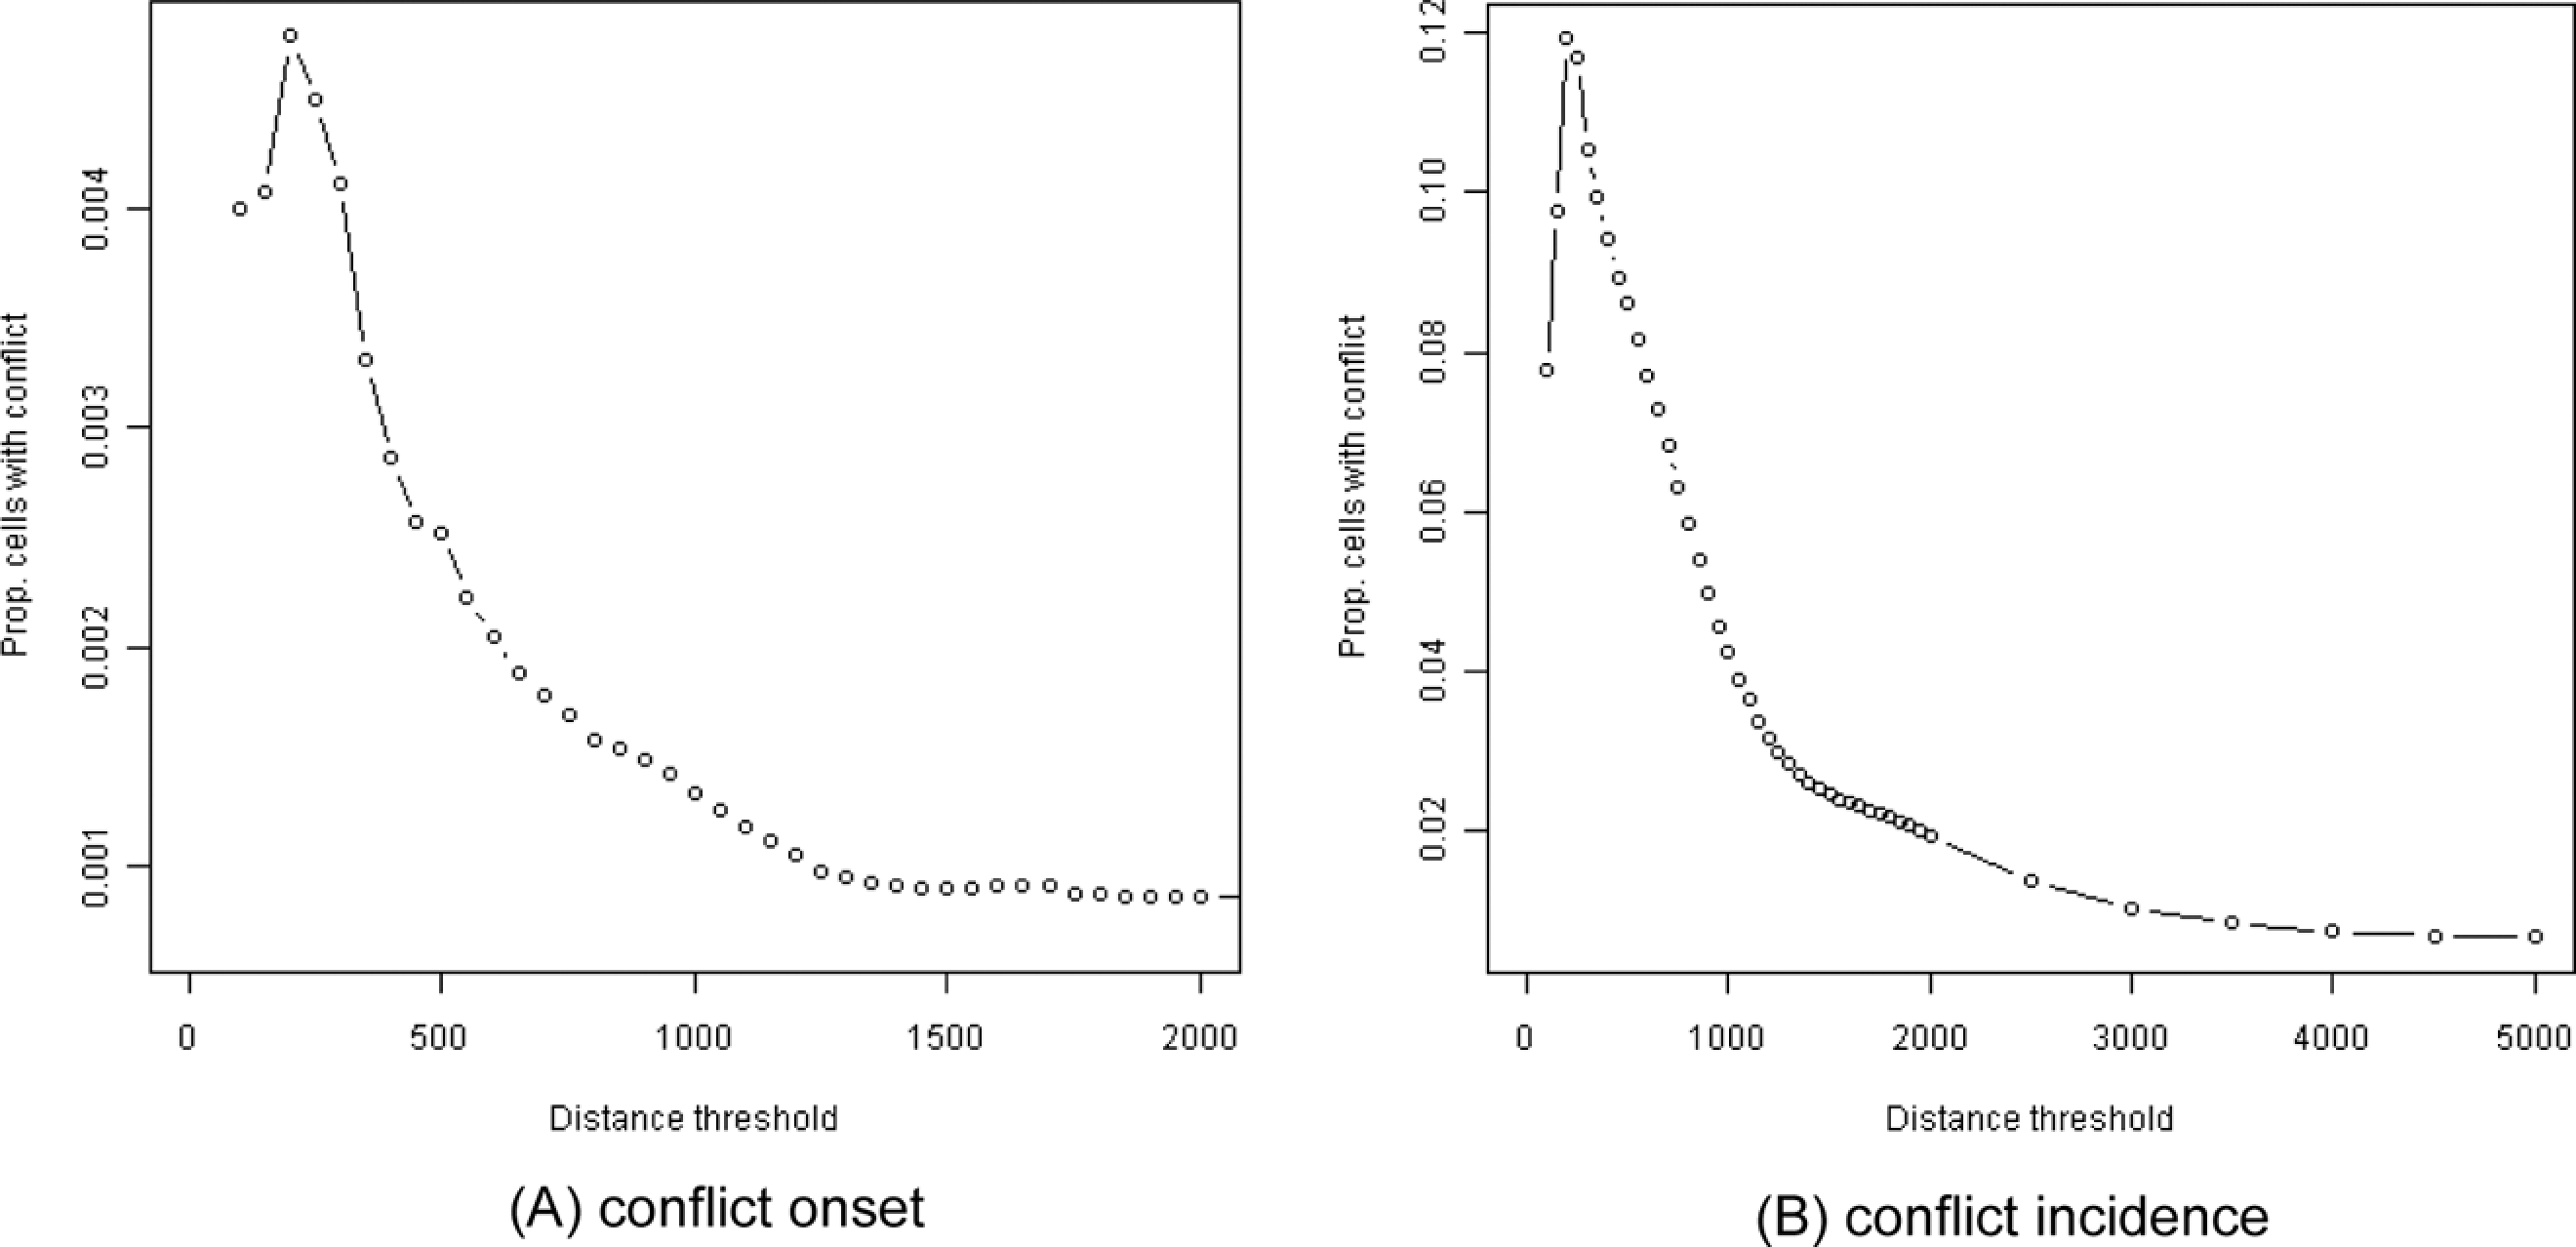
Average spatial decay for proportion of cells with conflict onset (A) and conflict incidence (B) by distance from conflict onset cells
Our focus on conflict onset locations in high-resolution data yields both a rare events problem and spatial correlation problem (see King and Zeng 2001). A simple way to address these challenges here is to use a case-control logit design, where we compare onset cells to a random sample of non-onset observations. 11 Since odds and odds ratios are invariant to changes in the marginal totals, the estimated logit coefficients for the covariates will not be influenced by the relative share of 1s and 0s in the sample. 12 Using a case-control design here also helps address the problem of spatial correlation across nearby cells, since a smaller random comparison sample is unlikely to include many nearby cells with less additional information (as opposed to the full sample, where the number of close cells will be very high). 13 Recall that Figure 3A suggested that spatial correlation of conflict onsets dissipates once cells are more than 1,000 km apart. For the results reported below, the average number of observations within 1,000 km is exceedingly small, on average only eight observations. Since the majority of the observations are pairs with distances far beyond where the spatial correlation dissipates, our results cannot be dismissed as possible artifacts of spatial autocorrelation among the cells in the comparison sample. 14
Empirical Analysis
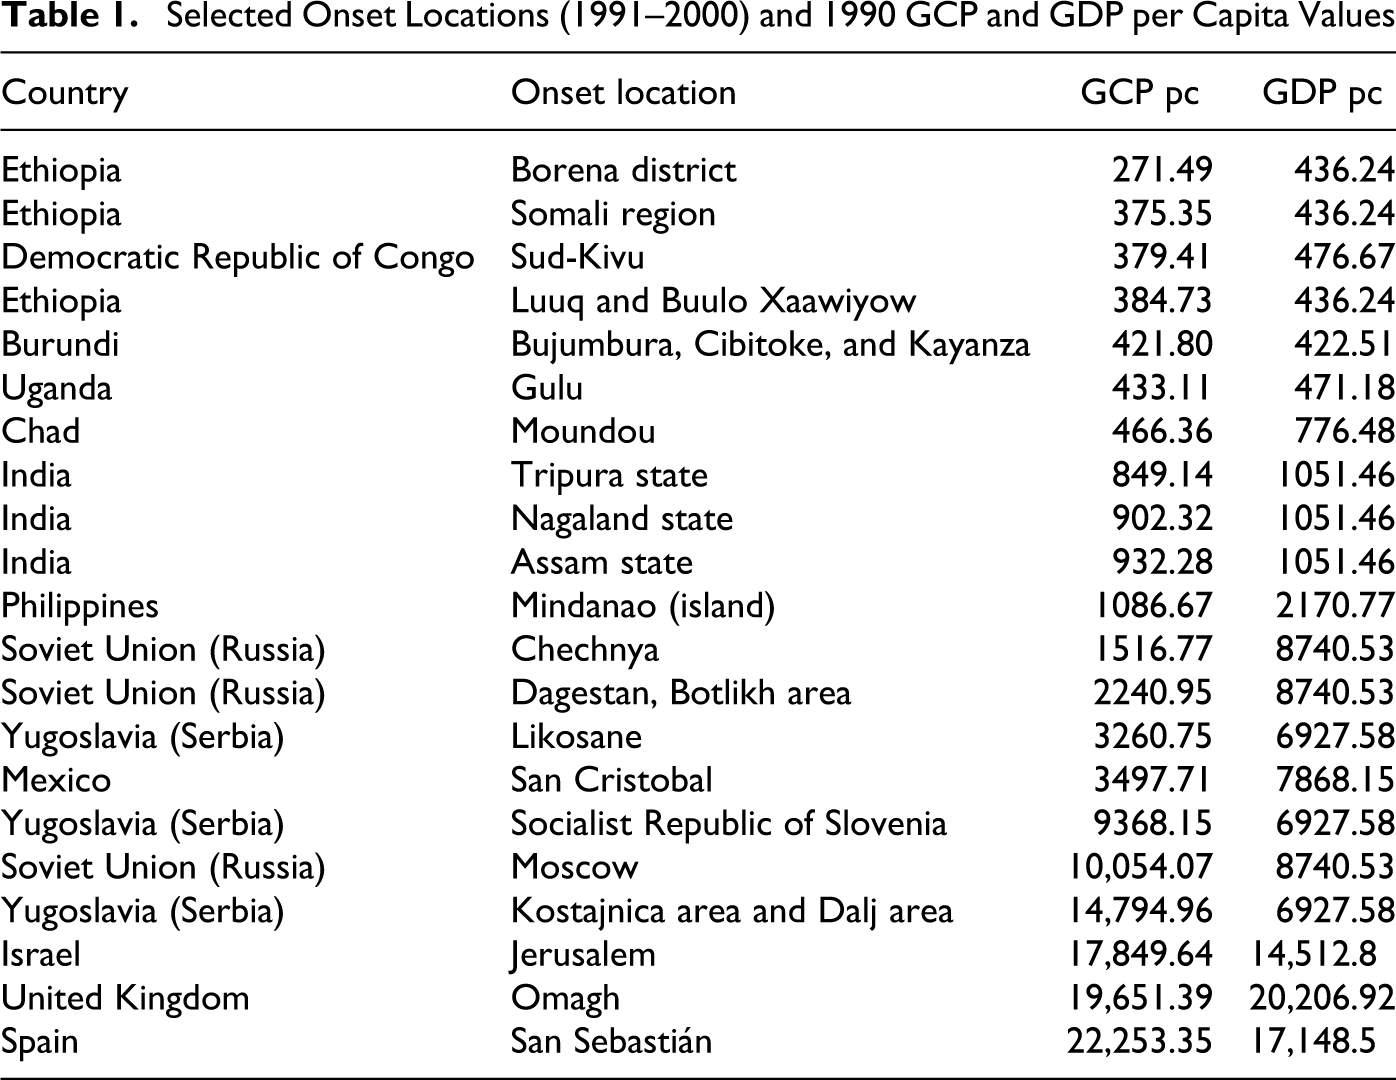
We first provide some simple descriptive statistics on income and conflict onsets. Table 1 lists the GCP per capita for select onset cells and corresponding national GDP per capita values, as well as the name of conflict onset location/region. Table 1 suggests three clusters consistent with our hypotheses about spatial wealth distributions prone to conflict. The upper group encompasses cases of conflict onsets in low-income locations in very low-income countries (LDCs). The middle displays conflict outbreak locations with low GCP per capita where national income is not necessarily low by absolute standards. For example, Likosane (Kosovo) has a local per capita income less than half of the Yugoslav national average. The third group illustrates conflicts in comparatively wealthy areas. For example, the onsets locations in Slovenia and Croatia have per capita income substantially above the Yugoslav average. The cases in Table 1 are highly suggestive in terms of how initial conflict locations may have local income that deviates from national averages. However, looking only at conflict cases entails the usual problems of selecting on the dependent variable. To evaluate whether inequality goes together with conflict more broadly, we must also assess more systematically the income distribution across cells where we do not see conflict onsets.
Selected Onset Locations (1991–2000) and 1990 GCP and GDP per Capita Values
Case-Control Logit Results
Table 2 provides a series of case-control logit regression results. Model 1 in Table 2 considers only the absolute GCP per capita value. Consistent with Hypothesis 1, we find a clear and statistically significant negative effect on the log odds of conflict for logged GCP per capita, indicating that areas with low absolute income have a higher risk of conflict onset. Model 2 compares the results for per capita logged GCP and national-level GDP. We find that although the local income measure behaves largely as in Model 1, the estimated coefficient for GDP per capita is insignificant and has the wrong (positive) sign. The coefficient for GDP per capita is negative and statistically significant when regressed without cell-specific income, but the overall fit measures clearly supports Model 1 over a model with only national level GDP per capita. Furthermore, scaling up to the country level we find that the minimum cell gross product per capita for a country provides a better predictor for whether states will see conflict than GDP per capita. 15 Hence, the results in Model 2 cannot merely be dismissed as a result of a change in focus from countries to the specific outbreak locations. Local variation clearly seems relevant for the prospects for violent conflict, and predictions of conflict risk based on national averages and local conditions can reach very different conclusions. These results provide strong support for our claim that measures that reflect within country variation can reveal important features not apparent in national aggregates or averages and help improve our ability to identify country profiles at greater risk of conflict.
Logit Regressions of Conflict Onset Locations, Case Control Sample
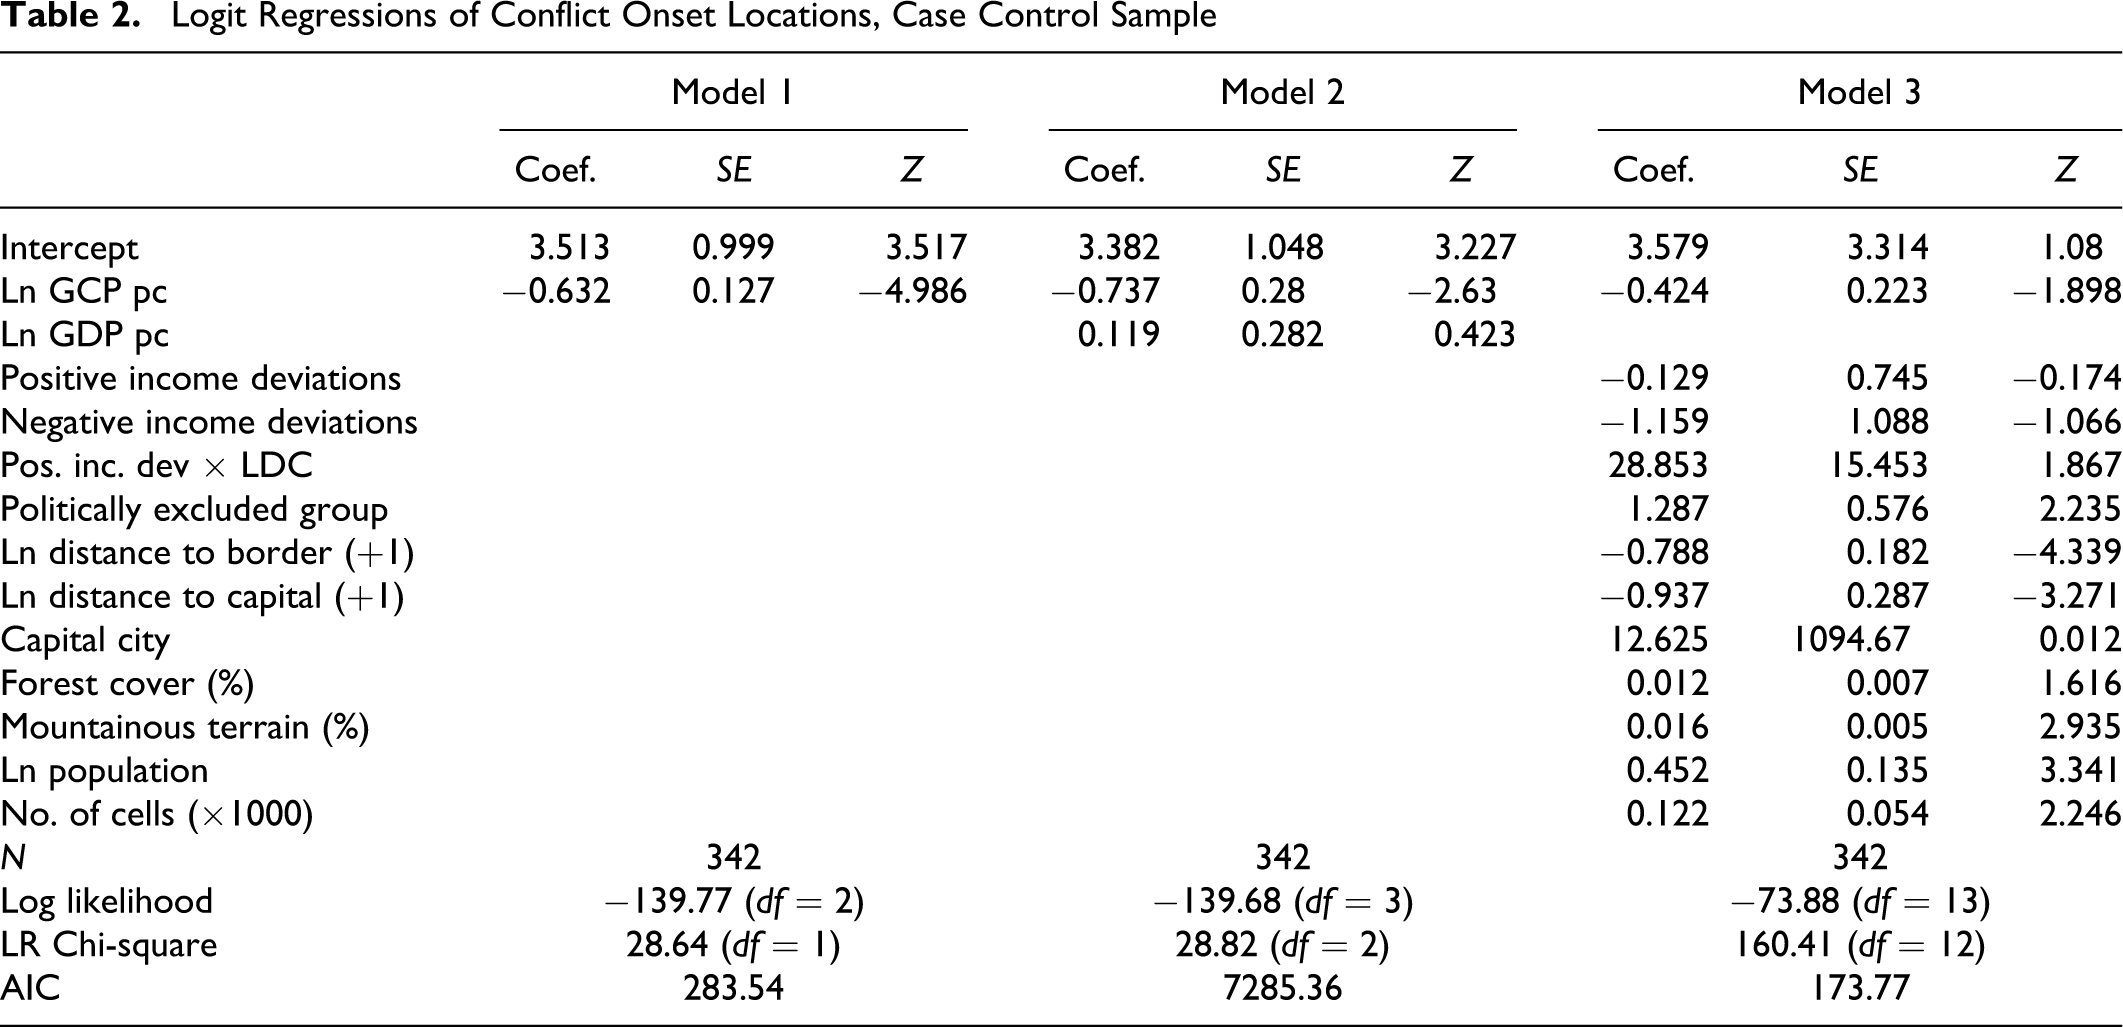
Model 3 introduces measures for positive and negative deviation between cell-specific and national average income, along with control variables plausibly related to both income and conflict. We drop the insignificant GDP per capita when introducing the deviation terms since retaining this would make the coefficients more difficult to interpret. The absolute level of income continues to have a significant effect once we introduce the relative deviation terms. However, our results provide much weaker support for the claim that the relative magnitude of spatial variation matters (i.e., Hypotheses 2, 2a, and 2b). The negative deviation coefficient indicates some tendency for a higher risk of conflict outbreak in areas poorer than the national average (since the deviations have a negative sign), but the coefficient is not significant at conventional levels. The coefficient for positive deviations does not have the expected positive sign, and is close to 0 and small relative to its standard error. However, the significant interaction term between relative affluence and LDC supports the income reversion effects on conflict onset (Hypothesis 2c). 16 Although higher income generally means a lower risk that a location will see a conflict outbreak, an area with a substantially higher GCP per capita thus seems at higher risk to see conflict outbreaks in very poor countries. This is not an empty or very small set; we have eight onsets in such cells and 1,292 cells in our full sample, over six times the rate of onset for the sample at large. 17
Adding the control variables suggests that other cell characteristics indeed may have independent effects on the risk of conflict. However, even if these may be related to geographical variation in income, including these characteristics directly in the regression does not alter our basic findings with respect to the impact of local income. Cells encompassing politically excluded groups are more likely to see conflict outbreak, but the income effect does not seem to mask ethnic cleavages. Entering a multiplicative interactive term income and political exclusion did not yield a significant coefficient or improve upon the model. As such, there is not evidence that the effect of differences in income on the log odds of conflict depend on whether a location has an excluded ethnic group or not. Cells in larger countries appear more likely to see conflict onsets, as the estimated coefficients for higher cell population as well as the total number of cells in the country both are positive and significant. More peripheral areas closer to international borders and cells that have a higher share of mountainous terrain are more likely to see conflict outbreaks. The coefficient for share of forest cover also has a positive sign, but the significance is marginal. Distance to the capital actually has a negative sign, suggesting that many initial attack locations are close to capitals. 18 The coefficient for capital city locations is very high although not significant, and we note that a capital city point is unlikely to be included in the case-control sample (four conflicts started in capital cities).
The case-control results presented in Table 2 will to some extent be sample dependent. We consider to what extent our inferences may be sensitive to sampling by replicating the estimates for Model 3 over 1,000 unique case-control samples. Figure 5.A displays the density of the estimates for GCP per capita, where the mean is −0.474. Only two samples return a positive coefficient. The coefficient for relatively wealthier locations in low-income countries exhibits much larger numeric variation across samples (given the limited number of observations we get some very large estimated coefficients). However, none of the samples return a negative coefficient, and the coefficient estimates have an interquartile range from 3.40 to 15.76. By contrast, the distribution of coefficients for the negative income deviations term displayed in Figure 5.B has a mean below -1 and the bulk of the observations are below 0 but we find a considerable number of samples where the coefficient is positive, suggesting a much less robust relationship. Finally, the distribution for the term for positive income deviations has a mean barely above 0. We conclude that our core results in Table 2 do not seem particularly sample dependent.
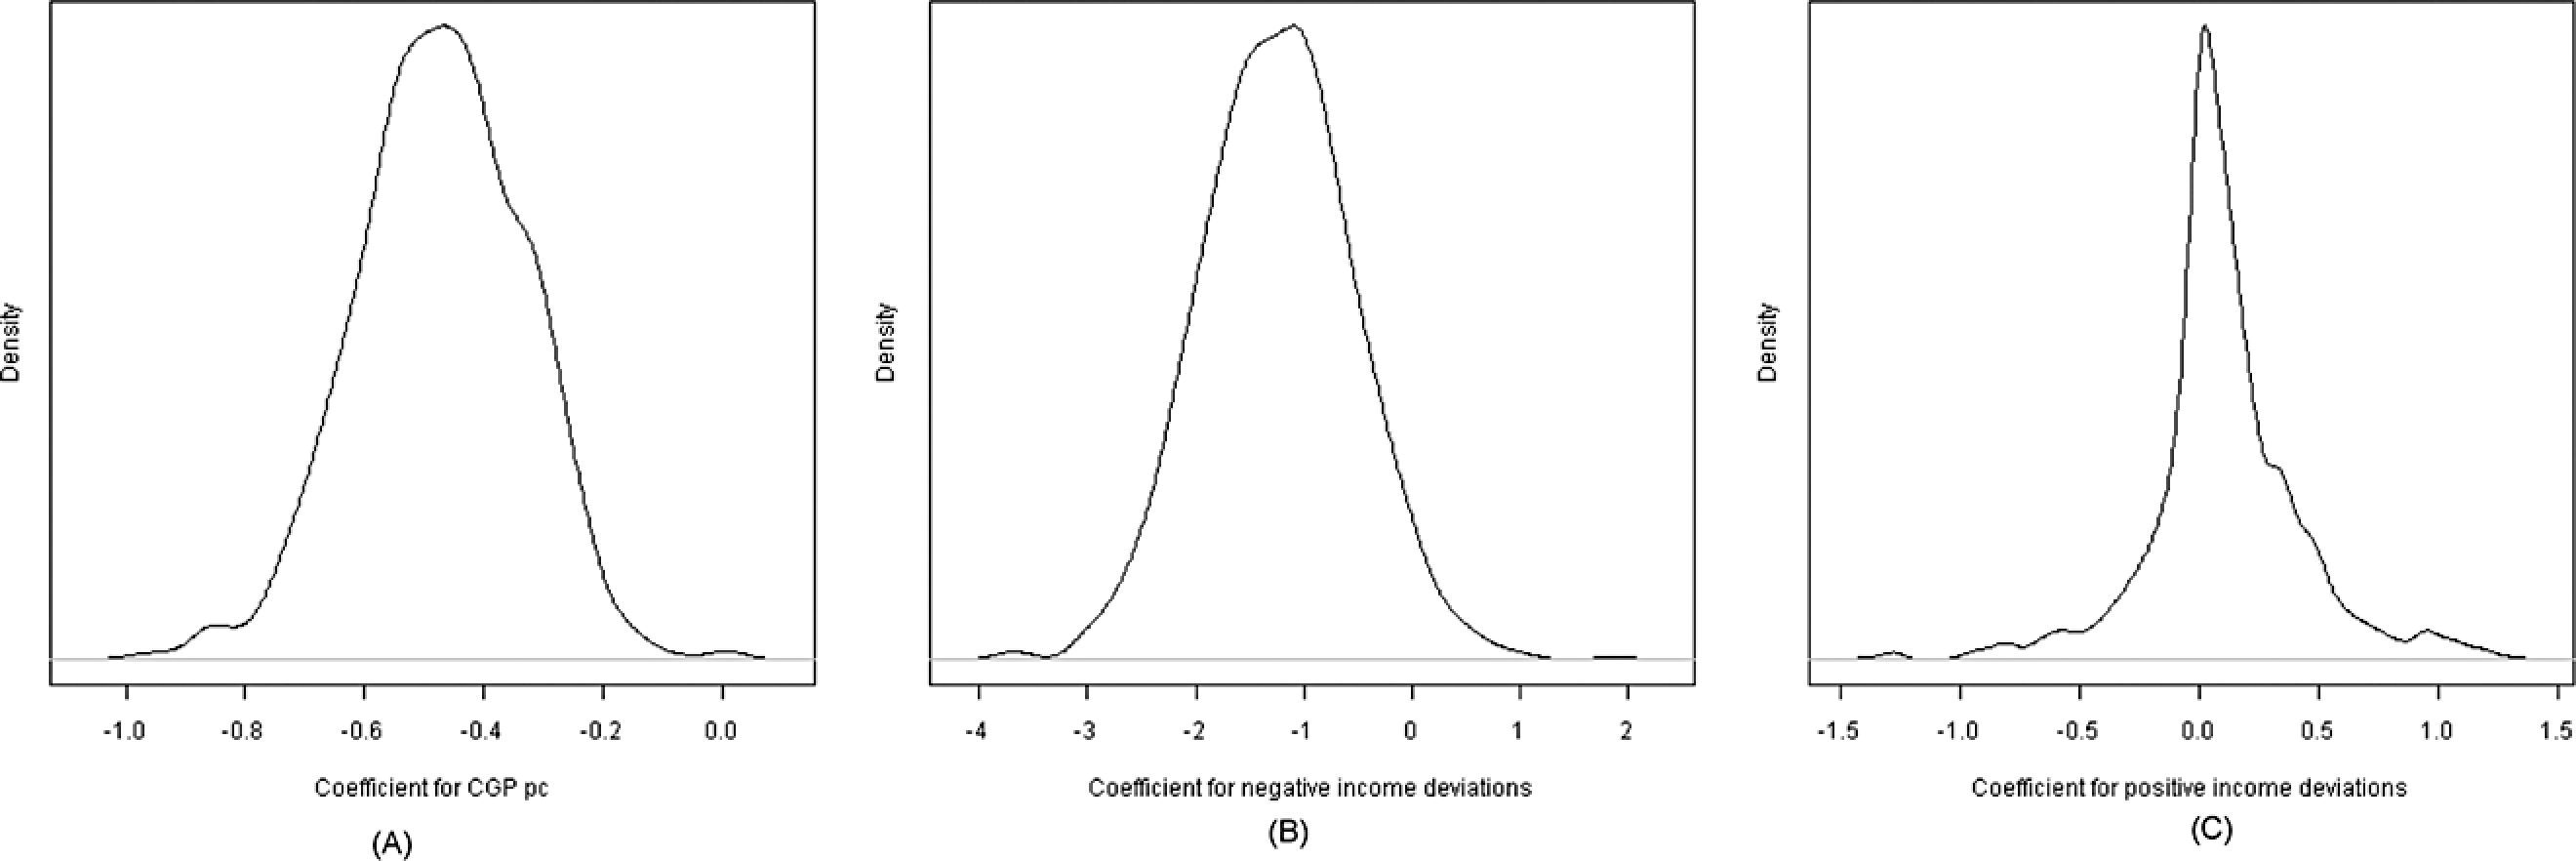
Density plots for coefficient estimates for Model 3 over 1,000 case-control samples
We also consider various robustness tests to ensure that our results do not reflect reverse causality or arise as artifacts due to specific measures or potentially influential observations. Conflict has a tendency to recur, and it is possible that present income may be low due to previous conflict. In this case, our results could reflect the impact of previous conflict on income rather than the direct effect of income on conflict. Although we lack economic data for earlier periods, we can explore whether prior conflict seems to drive the results. In Model 4 in Table 3 we introduce a term for whether cells experience conflict or fall within the polygons for conflicts in the previous decade (i.e., 1980–1989). These results clearly suggest that areas with a recent conflict are more likely to see new outbreaks of conflict. However, accounting for earlier conflict does not change our conclusions regarding the effects on conflict arising from local poverty and pockets of wealth in poor countries. Hence, it seems unlikely that our results reflect reverse causality in the short run. Many observers note the persistence of social and economic inequalities, including geographical inequalities (see Ahluwalia 1976; Williamson 1965), but we recognize that there may well be “deeper” forms of endogeneity in the very long run, where violent state formation and subjugation of areas shaped initial income distributions or marginalization. For the other terms, the changes are relatively minor, although the term for whether cells include excluded ethnic groups is reduced and no longer statistically significant, suggesting that locations with excluded groups may be most likely to see conflict onset when groups have previously participated in conflict.
Logit Regressions of Conflict Onset Locations, Case-Control Sample; Robustness Tests
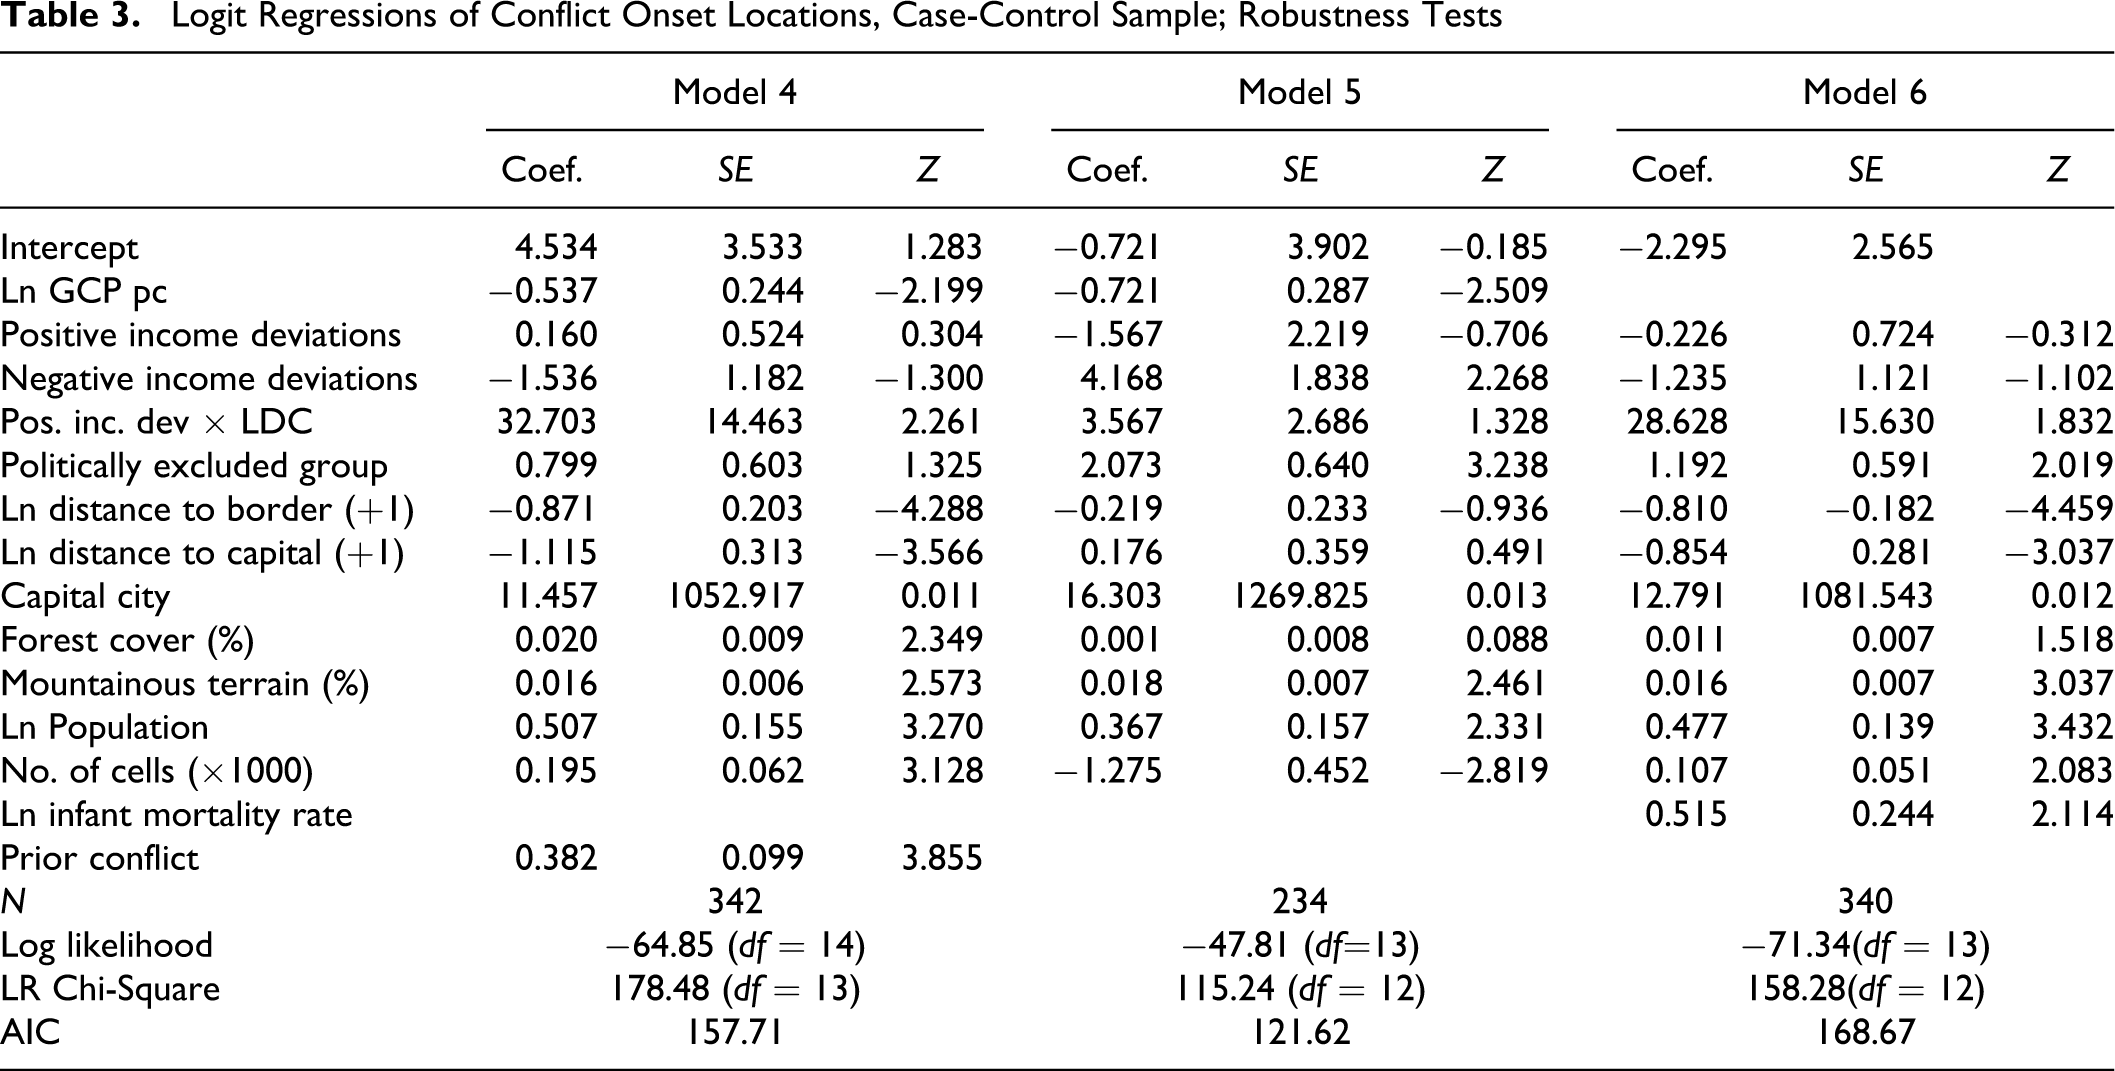
We recognize that the G-Econ data reflect economic activity rather than measures of household income or welfare per se, and many areas may have high apparent income from activities where revenue subsequently is transferred elsewhere in the country. In Model 5 we reestimate the previous Model 4 with disaggregated infant mortality rates data from the Center for International Earth Science Information Network (CIESIN). 19 These data are available for 2000 only and are hence more prone to potential reverse causality problems, but allow us to consider the robustness of our results using data constructed from very different sources. As expected, we find a significant positive coefficient, or that areas with higher infant mortality have a higher risk of conflict onset. Moreover, our findings with regard to the impact of relative pockets of wealth in developing countries still hold with infant mortality rates as a proxy for absolute local development. 20 The results for the other control variables do not change notably compared to the original Model 3 based on the G-Econ data.
To ensure that our results are not determined exclusively by observations from the former Soviet Union and Yugoslavia, Model 7 in Table 3 omits all states that see border changes over the period under analysis. Although we have a notably smaller number of conflicts when these countries are excluded, the results for Model 7 show that our findings do not depend on observations from these countries alone. The estimated coefficient for local income per capita is actually larger when dropping these states, and the interactive term for positive relative income deviations and LDC remains significant. 21 The results for other variables generally remain consistent when excluding states with major changes, with the exception of the effect of country size (by cells), which actually switches sign, perhaps reflecting the lack of conflict in many other large states apart from the USSR such as Canada.
Conclusion
We conclude by summarizing the main contributions and findings of our article and discuss important extensions for future research. We have clarified theoretically how variation in income within countries can influence conflict. We have shown that the lack of attention to spatial variation in existing work on income and civil war is unfortunate; it is clear that there is considerable geographical variation in social and economic characteristics within many countries, in ways that theories of conflict and mobilization suggest should be very influential, and actual conflict locations are rarely typical or representative for nations at large. It is helpful to look at the specific locations where conflicts initially erupt as local characteristics can provide important information on the possible motivations and opportunities for violence. Our results suggest that local income matters more than national income, and we find evidence that pockets of relative wealth within very poor countries are more likely to see conflict outbreaks.
Since the existing disaggregated income data that we have used here are limited to a single year it is difficult to assess changes over time. However, future developments in disaggregated economic and social data will allow expanding the domain of this study. It may also be possible to get longer disaggregated time series for individual countries, and possibly local-varying features that can help instrument for both persistent inequalities and more short-term influences on economic growth. Longitudinal data would allow examining in more detail how ethnic and social cleavages can interact with geographic inequalities in mobilization, conflict, as well as whether state redistributive efforts or accommodative policies to address inequalities may serve as alternatives to violence. Finally, it may be possible to investigate further how state infrastructure or initial economic resource endowment can influence the relationship between spatial income variation and conflict.
Our article has also provided more general examples on how subnational data can contribute to the study of conflict and how high-resolution spatial data may be analyzed. The analysis of point pattern data in geostatistics provides helpful ideas and tools for dealing with high resolution data reflecting local characteristics and variation. Moreover, this approach also shows how it is not necessary to have exhaustive data on areal units in order to make meaningful comparisons with conflict sites, and the efficiency of disaggregated data collection projects can be enhanced by strategies focusing on selecting an adequate set of control points that allow informative comparisons. Subnational and disaggregated data are helpful also for scaling information to different levels of analysis, such as ethnic groups or regions, or calculate more theoretically appropriate measures of variation and the relevant moments at the country level. Deriving country profiles for the risk of conflict can be improved by focusing on worst-case scenarios reflected in geographical variation rather than the conventional country-level measures based on averages or total aggregates. In sum, greater attention to disaggregated information and concept-measure correspondence is likely to be more helpful than additional cross country comparison regressions on the same data.
Footnotes
Notes
Acknowledgment
The authors acknowledge support from the Economic and Social Research Council and the Research Council of Norway. The authors are listed in alphabetical order, equal authorship implied. We thank Lars-Erik Cederman, Glenn Firebaugh, Scott Gates, Jacek Kugler, Indra de Soysa, as well as two anonymous reviewers for helpful comments. A previous version was presented at the International Studies Association annual convention in New York, USA, 15-18 February 2009.
The authors declared no potential conflicts of interest with respect to the research, authorship, and/or publication of this article.
The authors acknowledge support from the Economic and Social Research Council (RES-062-23-0259) and the Research Council of Norway (180441/V10).
References
Supplementary Material
Please find the following supplemental material available below.
For Open Access articles published under a Creative Commons License, all supplemental material carries the same license as the article it is associated with.
For non-Open Access articles published, all supplemental material carries a non-exclusive license, and permission requests for re-use of supplemental material or any part of supplemental material shall be sent directly to the copyright owner as specified in the copyright notice associated with the article.